[email protected] Dependability analysis of the Java Virtual Machine Salvatore Orlando Ph.D....
33
[email protected] www.mobilab.unin a.it Dependability analysis of the Java Virtual Machine Salvatore Orlando Ph.D. student University of Naples Federico II [email protected] Mobilab
-
date post
19-Dec-2015 -
Category
Documents
-
view
225 -
download
0
Transcript of [email protected] Dependability analysis of the Java Virtual Machine Salvatore Orlando Ph.D....
Dependability analysis of the Java Virtual Machine
Salvatore OrlandoPh.D. student
University of Naples Federico [email protected]
Mobilab

JVM Dependability Analysis 1
Salvatore OrlandoPh.D. Student at the University of Naples “Federico II”
MobiLab Research Group memberAdvisor: Prof. Stefano Russo
Ph.D. Research Programme:Dependability attributes of Virtual Execution Environments
Current work:Java Virtual Machine monitoring for dependability assessment
::. Presentation

::. Outline
• Rationale• Research work about the Java Virtual Machine• Research work about dependability issues of the JVM• Why focus on Sun Hotspot JVM
• Internal architecture of the Sun Hotspot® 5.0 JVM• JVM Monitoring for dependability assessment
• Failures and sources of errors in the JVM• Our Approach• Monitoring and management technologies (JSR-174 & JSR-163)
• JMX (Java Management Extensions) and the platform MBeans• JVMTI (JVM Tool Interface)
• The distributed monitoring system • Architecture of the monitoring system• Details of the JVM monitoring subsystem
• Data Analysis methodology• Future work
• Assessing JVM dependability• Augmenting the JVM with Fault Tolerance• Moving to the «mobile side»
JVM Dependability Analysis 2

JVM Dependability Analysis 3
Advices,
Hints,
Questions and
Criticisms
are welcome!

JVM Dependability Analysis 4
::. Just a bit of history… (of the evolution of the Java Platform)
The dawning of Java HistoryYesterday’s HistoryNowadays history
19911995
1999
2005
Java is still at an embryonal state. Only after 4 years Java is unveiled to the community
Java is born, but it is only used for web applets and small digitally controlled consumer devices.
The Java Platform begins to be widely used, especially in embedded devices
Java is now widely employed also in web applications
Always more enterprises behave on the Java Platform for their corporate applications
Java becomes one of the most important platforms for cellular phones
Java is starting to be used in mission-critical and dependable applications
19931997
20012003

JVM Dependability Analysis 5
::. Just a bit of history… (Last Milestones and near future)
October 1, 2004: J2SE 5.0 Released
Waiting for J2SE 6.0 release and the MVM (Multitasking Virtual Machine)

JVM Heap
Management Services JVMTI
VM Runtime
Cla
ss L
oa
de
r
JNI
Shared Runtime
Thread-specificdata
(handleArea,ResourceArea)
Methodstackframe
Nativemethodstack
MemoryManagementUnit
Compilation Policy Manager
Compilation Unit
De
op
timiz
er
ServerCompilerRuntime
Server(Opto)
Compiler
ClientCompilerRuntime
Interpreterruntime
Client(C1)
CompilerInterpreter
Assembler
VMcore
Syn
chro
niz
er
Tim
er
OS Interface
OS MMU OS Thread I/O Time
SharedHeap
Garbage Collectors
PCRegisters
Young GenerationTenured
Generation
Permanent Generation
Method Area
ThroughputConcurrentLow-Pause Serial
::. Internal architecture of the Sun Hotspot® 5.0 JVM
JVM Dependability Analysis 6
•The VM Runtime includes the core components of the JVM. It is in charge of: •Dispatching and executing Bytecode instructions•Managing threads and objects’ locks•…•Collecting data for debugging and profiling•Handling the following components
•The Memory Management Unit is in charge of:•Allocating oops (i.e.: a Class, a method, an object…) •Managing objects finalization•Managing objects generations•Performing Garbage Collection•…
•The Compilation unit is in charge of: •Discovering «Hotspots» in Java Applications•Compiling or interpreting a Java method•Transforming intermediate bytecode representation into native assembly code•…

::. Rationale
• Why focus on the Sun Hotspot® JVM Many implementations of the Java Virtual Machine
specification available:
Jikes RVM
Kaffe
MacOS RT for Java
Blackdown
JRockit
…
But…
The Sun’s JVM represents the most widespread implementation
The Sun’s JVM is the most complete (and complex) JVM implementation
JVM Dependability Analysis 7
JVM Dependability Analysis 8
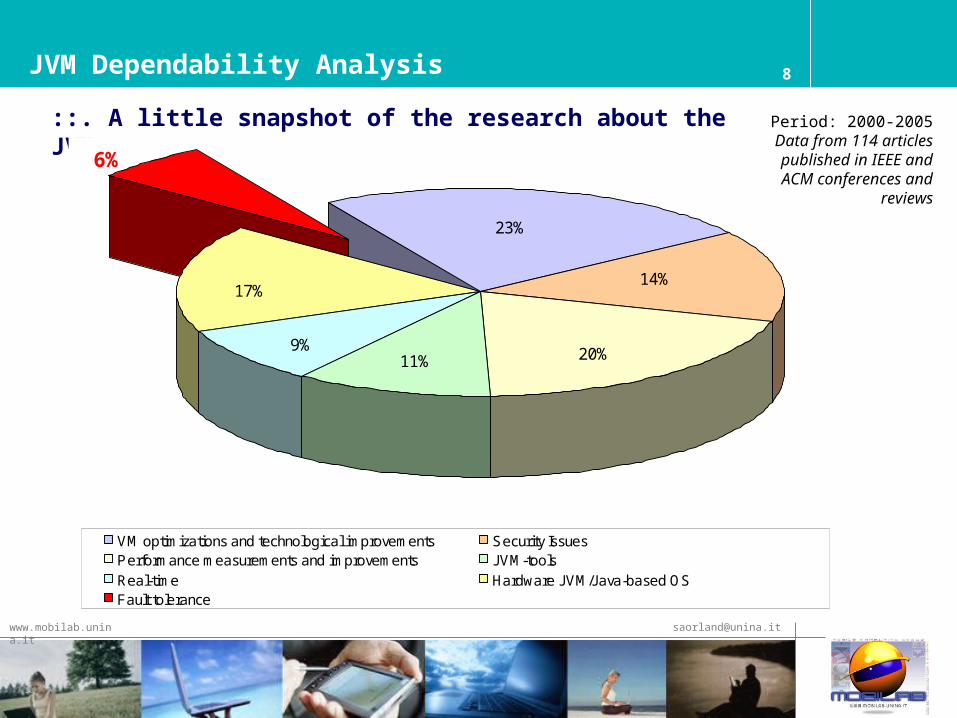
::. A little snapshot of the research about the JVM
23%
14%
20%9%11%
6%
17%
VM optimizations and technological improvements Security IssuesPerformance measurements and improvements JVM-toolsReal-time Hardware JVM/Java-based OSFault tolerance
Period: 2000-2005Data from 114 articles published in IEEE and ACM conferences and
reviews

JVM Dependability Analysis 9
::. Research about fault tolerance features of the JVM
Only a little part of the research work on the Java Virtual Machine addresses dependability issues
The greater part of these works are focused on specific components of the JVM:
… techniques for protecting unsafe operations in the garbage collector
… techniques for protecting objects against memory errors
The only works that address fault tolerance in the entire virtual machine make use of state machine replication (Hypervisor-based Fault tolerance) to build a fault-tolerant JVM and it has been carried out at University of Texas in Austin and Technion Israel Institute of Technology

52,7%22,3%
25,0%
Runtime Unit Memory Management Unit Compilation Unit
JVM Dependability Analysis 10
::. Some clues about sources of errors in the JVM
Data taken from Sun and Jikes Bug
Databases. 99 VM-related
segnalations selected
• Among over 500 bug reports related to the virtual machine, we selected only the ones addressing non always-reproducibile failures or failures reproducible only with specific workloads.
• Then we furtherly refined the selection deleting reports with few details or clearly related to bugs in source code.

JVM Dependability Analysis 11
::. At the present date…
It is recognized that hardware faults are no longer a major source of faults. The greater part of faults in modern systems are concerned with software.
The JVM is becoming more and more complex, being nowadays almost comparable to a real operating system
Java is nowadays widely used in enterprise software systems
Java is starting to be employed in mission-critical systems. For instance, Java has been used to develop the ROver Sequence Editor (ROSE), a component of the Rover Sequencing on Visualization Program (RSVP), used to control the Spirit robot in the exploration of Mars
yet…
Most of the research work related to fault tolerance into the JVM focused only on singular components of the Virtual Machine, especially the memory management unit
By analyzing failure reports in Bug Databases it is possible to argue that the memory management unit is not the only (and not the major) source of errors in the JVM
Dependability issues of the Java Virtual Machine have never been completely fleshed out, since a thorough study of its dependability has never been done
Summarizing, we argue that it’s necessary to focus on the virtual machine as a whole, taking into account the role played by each of its components

JVM Dependability Analysis 12
::. Failures,sources of errors and error propagation in the JVM (1/5)Errors in JVM Components
VM-related errors
Class Loader
JNI
Compilers
Garbage Collector
Memory Subsystem
VM Core
Synchronizer
JVM layer Application Layer
Errors in Virtual Machine
components
Errors in Virtual Machine
components
Op
erating
System
Service In
terface
Virtu
al Mach
ine S
ervice Interface
Accumulated ErrorsA
pp
lication
Service In
terface
Java Application
Objects
Java Exception Handler
Accumulatederrors
Application-related errors
ApplicationFailures
Error manifestation
Sources of errors
When an error occurs in an Internal Component of the Java Virtual Machine:
• If it is intercepted by the Java Exception Handler, The error is thrown as a Java Exception. We can observe Java exception messages such as OutOfMemory or IllegalMonitorState
• If the Java Exception handler could not intercept it, the Error leads directly to an Application failure, so we get OS-level error messages (or Internal VM error messages) such as SIGSEGV or SIGBUS

31,7%
39,0%
11,0%
18,3%
J AVA_EXCEPTION OS_MESSAGE VM_ERROR HANG_SI LENT_CRASH
JVM Dependability Analysis 13
::. Failures,sources of errors and error propagation in the JVM (2/5)
Data taken from Sun and Jikes Bug Databases. 99 VM-related segnalations selected
A Java exception is thrown
The JVM dies with no messages or hangs
The JVM dies with an internal error messagei.e.: InternalError, AssertionFailure
The JVM dies with an Operating System error messagei.e.: SIGSEGV, SIGBUS, Access Violation

::. Failures,sources of errors and error propagation in the JVM (3/5)
14
Exceptions are raised due to:• Developer’s mistakes (we assume that programs are written by skilled developers…)• Unexpected conditions in the Application
Some of these exceptions are clearly application-related, others are VM (or OS) related and others ambiguous: it is not clear if the exception is due to errors generated at the application or at the VM layer.
Application related
ArrayIndexOutOfBoundException
FileNotFoundException
VM
related
InternalError
OutOfMemoryError
Am
biguous
IllegalMonitorStateException
ConcurrentModificationException
JVM Dependability Analysis
VM-related errors
Class Loader
JNI
Compilers
Garbage Collector
Memory Subsystem
VM Core
Synchronizer
JVM layer Application Layer
Errors in Virtual Machine
components
Errors in Virtual Machine
components
Op
era
ting
Sy
ste
m S
erv
ice
Inte
rfac
e
Virtu
al M
ac
hin
e S
erv
ice
Inte
rfac
e
Accumulated ErrorsA
pp
lica
tion
Se
rvic
e In
terfa
ce
Java Application
Objects
Java Exception Handler
Accumulatederrors
Application-related errors
ApplicationFailures
Error manifestation
Sources of errors

::. Failures, sources of errors and error propagation in the JVM (4/5)
15
• When an ambiguous exception is raised, discriminating whether it is due to a VM-related error or an application-related one it is an hard task. Indeed, an ambiguous exception could be related to:
• An unexpected condition in the application (i.e.: a date has a format different from the expected one) • Errors in file system (i.e.: a required file does not exist) • Errors in hardware resources (i.e: a device cannot be opened)• Errors in the Virtual Machine (i.e.: a ConcurrentModificationException is thrown on an object even if no thread is operating on that object)
•We are going to work with “trusted'' applications, i.e. applications that are known to be bug-free and tested to work fine under stress condition.
• In this way we remove ambiguous and application-related exceptions. Such exceptions are always due to an error in the VM or in the underlying OS. By analyzing OS logs we should be able to distinguish VM-related exceptions from OS-related ones.
JVM Dependability Analysis
• Moreover, error propagation phenomena could be observed in the Virtual Machine, since errors in JVM could lead to error in other components and/or application failures (as shown in previous example)
•The data analysis methodology will have to deal with this phenomenon, so error coalescing algorithms have to be implemented

VM-related errors
Class Loader
JNI
Compilers
Garbage Collector
Memory Subsystem
VM Core
Synchronizer
JVM layer Application Layer
Errors in Virtual Machine
components
Errors in Virtual Machine
components
Op
era
ting
Sy
ste
m S
erv
ice
Inte
rfac
e
Virtu
al M
ac
hin
e S
erv
ice
Inte
rfac
e
Accumulated ErrorsA
pp
lica
tion
Se
rvic
e In
terfa
ce
Java Application
Objects
Java Exception Handler
Accumulatederrors
Application-related errors
ApplicationFailures
Error manifestation
Sources of errors
::. Failures,sources of errors and error propagation in the JVM (5/5)
16JVM Dependability Analysis
1
1. A fault in the compiler cauase the wrong version of a compiled method to be loaded
22. An application thread calls this method. An exception is raised since it contains bytecode for objects belonging to another class
3. The error propagates to the VM core components since the wrong VM operations are scheduled
3
4
4. Other exceptions (i.e.: InternalError) are raised
5. The user observes an application failure (the VM has crashed)
5
A sufficiently realistic example
JVM Dependability Analysis
::. Approach (1/2)
17
Monitoring the behavior of JVM components in order to gather field-based data to be able to
….performing dependability analisys
….identifying dependability bottlenecks
….analyzing pathological behaviors

JVM Dependability Analysis
::. Approach (2/2)
18
Our first goal:Monitor Internal JVM Behavior
Use built-in reporting and logging features
(e.g.: -verboseGC, failure reports)
• Not enough information available
• Data format strictly dependent from the particular implementation
Manually instrument JVM source code
• Very hard task (21.336.425 bytes in 1.455 files)
• High risk of bug injection
• The work has to be entirely repeated to monitor another implementation of the JVM
Use standardized monitoring
technologies
(JSR-3, JSR-163)

::. Monitoring and management technologies (2/4)
19
JMX (Java Management Extensions)
MBeans (Management Beans)Provide instrumentation for Managed resources
Agent servicesControl the resources and make them available to remote management applications. (i.e: sending notification when the value of the managed resource changes)
MBean server It is a registry for MBeans. It provides the services for manipulating MBeans
ConnectorsListeners for requests from remote Management applications. They use RMI technology
Management applicationsThey connect to the managed JVM through its connectors.In this way these application can use Agent Services MBeans and resource MBeans to retrieve information or manage Applications and the JVM itself
JVM Dependability Analysis

::. Monitoring and management technologies (3/4)
20
JPPA (Java Platform Profiling Architecture)
JVMTI (Java Virtual Machine Tool Interface)
• A JVMTI agent is a shared library that starts along with the JVM• In the JVMTI agent there are defined Callback functions for internal JVM Events• Events can be dinamycally enabled/disabled• The greater part or callbacks can use JVMTI functions for:
•examining internal JVM state•Managing the JVM
Platform MBeans (MXBeans)
• MBeans registered in the MBean Server at bootstrap time• They provide data relative to internal VM state (aggregate and detailed values)• They provide Functions for managing the virtual machine• They are accessible through a JMX-compliant management application (i.e.:Jconsole)
Monitored JPPA-compliant
JVM
JVM
TI
Age
nt
JVMTIevents
JVMTI Functions
Cal
lbac
ks
JVM Dependability Analysis
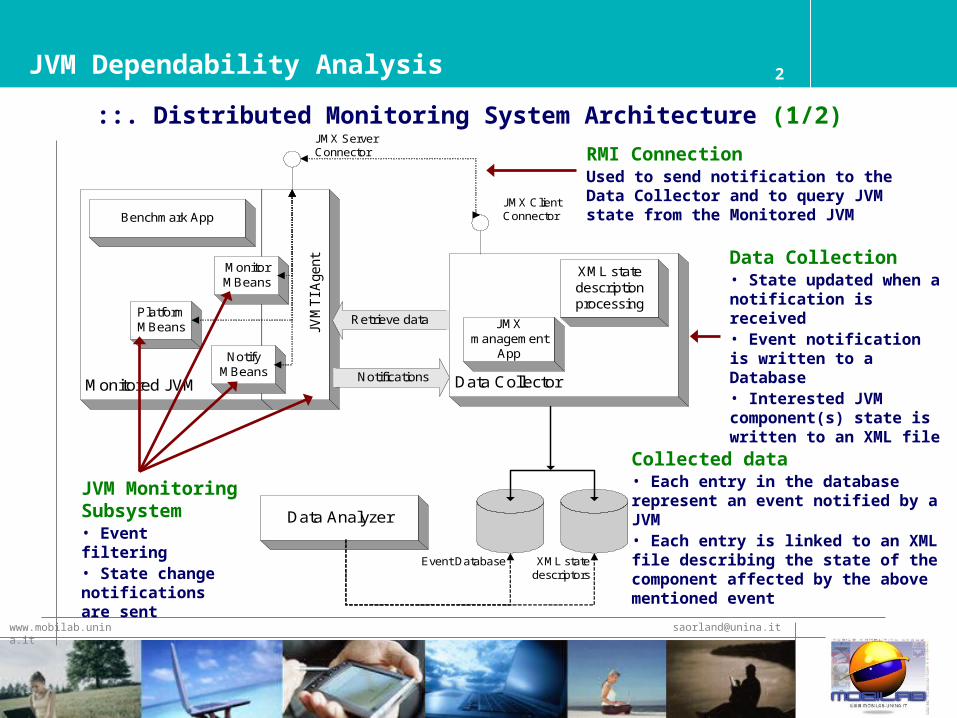
::. Distributed Monitoring System Architecture (1/2)
21
Event Database XML statedescriptors
Monitored JVM
JVM
TI A
gent
Data Collector
Benchmark App
MonitorMBeans
PlatformMBeans
JMX ServerConnector
Data Analyzer
JMXmanagement
AppNotifyMBeans
XML statedescriptionprocessing
JMX ClientConnector
Notifications
Retrieve data
JVM MonitoringSubsystem• Event filtering• State change notifications are sent
Data Collection• State updated when a notification is received• Event notification is written to a Database• Interested JVM component(s) state is written to an XML file
RMI ConnectionUsed to send notification to the Data Collector and to query JVM state from the Monitored JVM
Collected data• Each entry in the database represent an event notified by a JVM • Each entry is linked to an XML file describing the state of the component affected by the above mentioned event
JVM Dependability Analysis

::. Distributed Monitoring System Architecture (2/2)
22
Monitored JVM & Data Collector: Interaction diagram
1. Event raised
JVMTI Agent Monitor MBean
2. Component state updatedlocally
Notify MBean3. Periodically checks for changes in component state
(performs event filtering)
Data Collector4. Send notification to
the data collector
5. Query Component
state
6. Update DataBase
JVM Dependability Analysis

JVM Dependability 23
::. JVM monitoring subsystem details
JNI Environment
Monitored JPPA-compliant JVM
MonitorAgentJVMTIevents
JVMTI Functions
Cal
lbac
k F
unct
ions
Monitor MBeans
NotifyMBeans
Running Application(s)
Queries from
Collector
Notifications to Collector
Global references to
MonitorMBeans
The JVMTI agent MonitorAgent starts along with the JVM and handles events raised by the JVMTI back-end in the virtual machine
1) Events handled by Callbacks in Monitor Agent
Callback functions use JVMTI Function to gather informations about the state of the virtual machineMonitorMBeans (JMX – resource instrumentation level) are updated by MonitorAgent through global references in JNI environment. A Monitor MBean is defined for each component of the JVM.
2) State data gathered by Callbacks in Monitor Agent
3) MonitorMBeans updated
NotifyMBeans (JMX – agent services level) observe MonitorMBeans and send notification to the Collector when there are relevant changes in the state of the MonitorMBeans, which in turns reflect the state of the various components of the JVM
4) NotifyMBeans send notifications to the Collector
The Collector queries the Monitor MBeans to update the descriptors of the state of the virtual Machine
5) Collector Queries MonitorMBeans
1
2
3
4
5
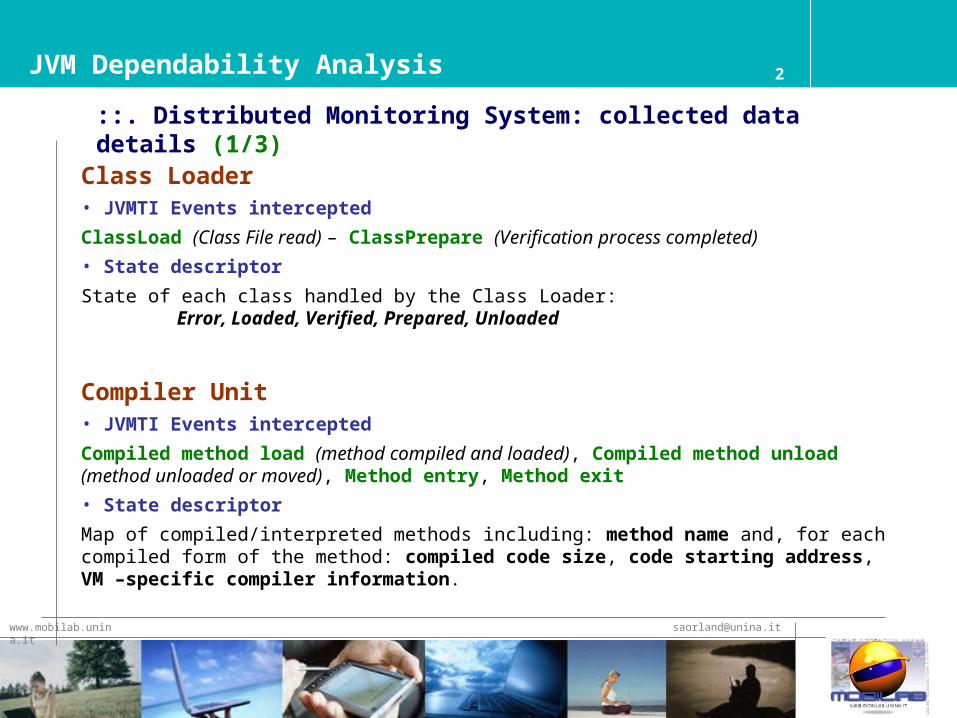
::. Distributed Monitoring System: collected data details (1/3)
24
Class Loader• JVMTI Events intercepted
ClassLoad (Class File read) – ClassPrepare (Verification process completed)
• State descriptor
State of each class handled by the Class Loader: Error, Loaded, Verified, Prepared, Unloaded
Compiler Unit• JVMTI Events intercepted
Compiled method load (method compiled and loaded), Compiled method unload (method unloaded or moved), Method entry, Method exit
• State descriptor
Map of compiled/interpreted methods including: method name and, for each compiled form of the method: compiled code size, code starting address, VM –specific compiler information.
JVM Dependability Analysis

::. Distributed Monitoring System: collected data details (2/3)
25
Runtime core• JVMTI Events intercepted
Thread start - Thread end - Monitor enter (attempt to acquire a lock owned by another thread) - Monitor entered (lock acquired)- Monitor wait (waiting for an object) - Monitor waited (finished waiting) – Exception (Exception thrown) – Exception catch (Previously thrown exception has been catched) – Method Entry (Java or native method entered) – Method Exit (generated upon exit from a Java or native method)
• State descriptor
State of each Java thread including:• its stack trace • Its current lock status (locks acquired, locks which the thread is waiting for)• Its possible pending exception• Its method invocation graph (reports also the timestamp of each method entry and method exit event)• Its timeline (a timestamp is applied each time the thread changes state)
JVM Dependability Analysis

::. Distributed Monitoring System: collected data details (3/3)
26
Memory Management Unit• JVMTI Events intercepted
Garbage collection start (a serial garbage collection starts) – Garbage collection finish (a serial garbage collection finishes) – VM Object Allocation (new object allocation) – Object Free (the Garbage collector frees an object)
Huge-sized heap – It is possibile to take a dump of the entire shared heap, but it will take too long (especially if the dump has to be transferred over the network)
Data about oops in heap area are gathered iterating over reachable objects and sweeping the entire heap (like the GC does), obtaining in this way syntethic information about objects (location, size and checksum)
Stop-the-world collector – when this collector works Java thread and JNI are blocked.
Defer notification of events related to garbage collection until the garbage collection finishes
Memory Management Unit
• State Descriptor
• Garbage collector timeline
• Object allocation and deallocation schedule
• Heap evolution history (for both the young and the tenured generation)
• Reachable objects graph
• location and size of each reachable object
• Access/Modification flags for each reachable object
• Hash value describing the content of each reachable object
JVM Dependability Analysis

::. Benchmark applications and Workload definition
27
Web applications: the JVM is executed on the server side to dispatch requests to a back-end architecture
• Jakarta Tomcat web server with J2SE 5.0 (Tiger)• JSP+Servlets applications• Web-stress tools to impose very high workloads to the VM
Client and server applications, such control or scientific ones. The JVM is deeply used for GUI design or mathematical computations
• Javolution library benchmarks• Other benchmarks…
In order to make the field data measurement campaign more effective, JVM is employed with two families of workloads:
• Workloads designed to stress VM components separately • Workloads designed to stress the entire virtual machine as much as possible following the behavior of the above mentioned categories of applications
JVM Dependability Analysis

::. Data Analisys (1/2)
28
1. Detect failures at the application layer
2. Distinguish failures that are due to failures in the underlying layers from failure that are due to the JVM
3. Given the instant tn where the failure has been detected,
analyze the evolution of the state of the JVM in the interval [tn-;tn], in order to identify the component where the
source of the failure was located. is a thresold that we assume to be the longest time that a fault in the JVM takes to manifest as a failure at the application layer.
4. By analyzing data related to several failures identify patterns of pathological behavior in the JVM.
JVM Dependability Analysis

::. Future Work: Assessing JVM dependability
29
We aim to give an answer to the following question: «Is Java ready to support dependable applications?»
• The field-measurement campaign started aims to identify the most critical components in the virtual machine and evaluate their dependability attributes and bottlenecks
• Our monitoring system will be applied to Sun Hotspot® and IBM JRockit® on different platforms (Solaris, Linux, win32)
At the present date only Sun and IBM implementations arecompliant to JSR-163 specification
JVM Dependability Analysis

::. Future Work: Augmenting the JVM with fault-tolerance
30
JRE provides no direct support for fault tolerance.Hence Java applications:
Completely ignore failures or…
Provide application-dependent fault detection and recovery strategies or…
Delegate fault tolerance to external systems such as transactional databases
In previous works (Alvisi,Friedman) fault tolerant JVMs were developed using state replication
We aim at building a fault-tolerant JVM applying fault tolerance techinques to internal JVM components
JVM Dependability Analysis

::. Future Work: Moving to the «mobile side»
31
• Java is nowadays widely used in embedded devices such as PDAs and cellular phones.
• Such devices are often shipped with «embedded JVMs»
• Such JVMs are a «compact» edition of the JVMs for desktop and server systems, they include only a limited subset of the features included in those JVMs.
• At present time we don’t know any JVM for embedded devices compliant to JSR-3 or JSR-163
• Our goal is to perform a dependability analysis of these JVMsTo this aim we have to address the following issues: • Investigate about the architeture of these JVMs• Develop methodologies for their monitoring
JVM Dependability Analysis
32JVM Dependability Analysis
And now it’s time for
questions !
Contact info:
Mobilab Research Grouphttp://www.mobilab.unina.it/
Contact info:
Mobilab Research Grouphttp://www.mobilab.unina.it/