All Santa Clarita Valley cities real estate report 1 year of history

Santa Clarita Valley Water Agency
Annual Financial Report
For the Six Month Period Ended June 30, 2018
Santa Clarita Valley Water Agency
Santa Clarita, California
Annual Financial Report
For The Six Month Period Ended
June 30, 2018
Prepared by: Rochelle Patterson, MPA, Director of Finance and Administration
Amy Aguer, CPA, Controller Elizabeth Ooms-Graziano, Retail Administrative Officer
Kim Grass, Accounting Manager

-i-
Santa Clarita Valley Water Agency Annual Financial Report
For The Six Month Period Ended June 30, 2018
Table of Contents
Page No. Table of Contents i
Financial Section
Independent Auditor’s Report 1-2
Management’s Discussion and Analysis 3-7
Basic Financial Statements: Statement of Net Position 8-9 Statement of Revenues, Expenses and Changes in Net Position 10 Statement of Cash Flows 11-12 Notes to the Basic Financial Statements 13-56
Required Supplementary Information Schedule of Agency’s Proportionate Share of the Net Pension Liability 57 Schedule of Pension Plan Contributions 58 Schedule of Changes in Net OPEB Liability and Related Ratios 59 Schedule of OPEB Contributions 60
Supplemental Information Combining Schedule – Statement of Net Position as of June 30, 2018 61-63 Combining Schedule – Statement of Revenues, Expenses and Changes in Net Position For the Six Months Period Ended June 30, 2018 64-65 Combining Schedule - Net Position as of June 30, 2018 66
Report on Compliance and Internal Controls
Independent Auditor’s Report on Compliance on Internal Control Over Financial Reporting and on Compliance and Other Matters Based on an Audit of Financial Statements Performed in Accordance with Government Auditing Standards 67-68

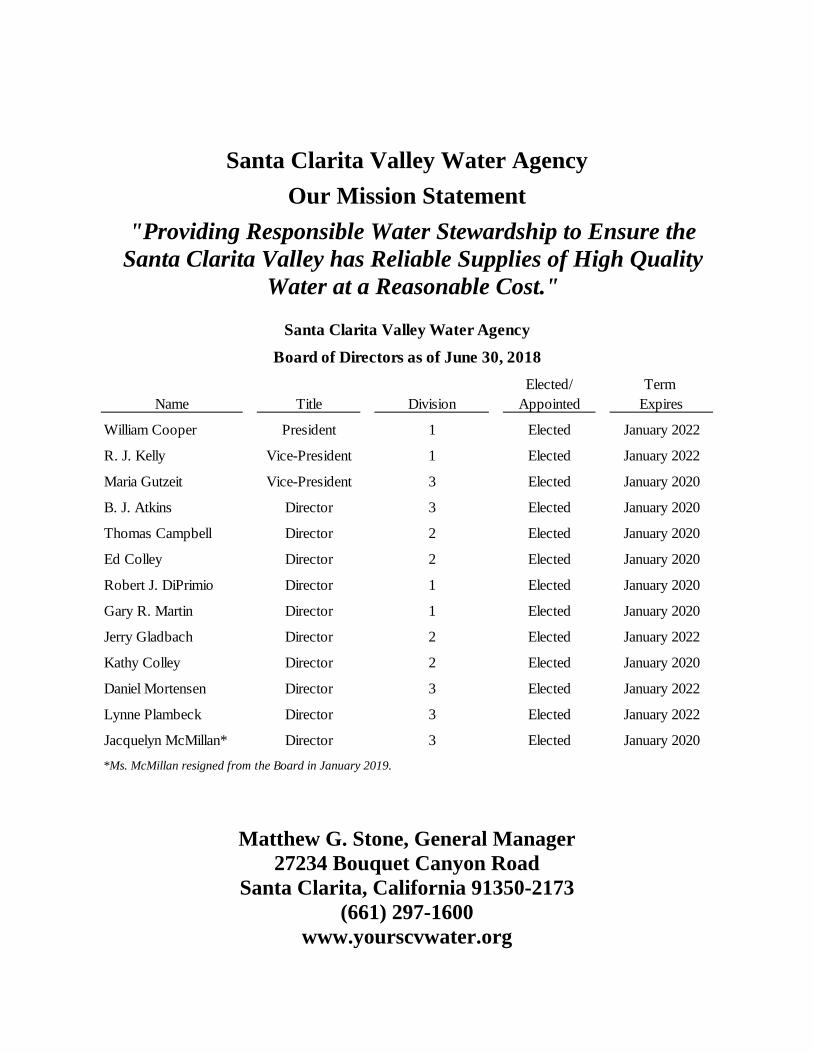
Santa Clarita Valley Water Agency
Our Mission Statement
"Providing Responsible Water Stewardship to Ensure the Santa Clarita Valley has Reliable Supplies of High Quality
Water at a Reasonable Cost."
Elected/ Term Name Title Division Appointed Expires
William Cooper President 1 Elected January 2022
R. J. Kelly Vice-President 1 Elected January 2022
Maria Gutzeit Vice-President 3 Elected January 2020
B. J. Atkins Director 3 Elected January 2020
Thomas Campbell Director 2 Elected January 2020
Ed Colley Director 2 Elected January 2020
Robert J. DiPrimio Director 1 Elected January 2020
Gary R. Martin Director 1 Elected January 2020
Jerry Gladbach Director 2 Elected January 2022
Kathy Colley Director 2 Elected January 2020
Daniel Mortensen Director 3 Elected January 2022
Lynne Plambeck Director 3 Elected January 2022
Jacquelyn McMillan* Director 3 Elected January 2020
*Ms. McMillan resigned from the Board in January 2019.
Board of Directors as of June 30, 2018
Santa Clarita Valley Water Agency
Matthew G. Stone, General Manager 27234 Bouquet Canyon Road
Santa Clarita, California 91350-2173 (661) 297-1600
www.yourscvwater.org


Financial Section

1
Independent Auditor’s Report
Board of Directors Santa Clarita Valley Water Agency Santa Clarita, California
Report on the Financial Statements
We have audited the accompanying financial statements of the Santa Clarita Valley Water Agency (Agency) as of and for the six month period ended June 30, 2018, and the related notes to the financial statements, which collectively comprise the Agency’s basic financial statements as listed in the table of contents.
Management’s Responsibility for the Financial Statements
Management is responsible for the preparation and fair presentation of these financial statements in accordance with accounting principles generally accepted in the United States of America; this includes the design, implementation, and maintenance of internal control relevant to the preparation and fair presentation of financial statements that are free from material misstatement, whether due to fraud or error.
Auditor’s Responsibility
Our responsibility is to express an opinion on these financial statements based on our audit. We conducted our audit in accordance with auditing standards generally accepted in the United States of America and the standards applicable to financial audits contained in Government Auditing Standards, issued by the Comptroller General of the United States; and the State Controller’s Minimum Audit Requirements for California Special Districts. Those standards require that we plan and perform the audit to obtain reasonable assurance about whether the financial statements are free from material misstatement.
An audit involves performing procedures to obtain audit evidence about the amounts and disclosures in the financial statements. The procedures selected depend on the auditor’s judgment, including the assessment of the risks of material misstatement of the financial statements, whether due to fraud or error. In making those risk assessments, the auditor considers internal control relevant to the entity’s preparation and fair presentation of the financial statements in order to design audit procedures that are appropriate in the circumstances, but not for the purpose of expressing an opinion on the effectiveness of the entity’s internal control. Accordingly, we express no such opinion. An audit also includes evaluating the appropriateness of accounting policies used and the reasonableness of significant accounting estimates made by management, as well as evaluating the overall presentation of the financial statements.
We believe that the audit evidence we have obtained is sufficient and appropriate to provide a basis for our audit opinion.
Opinion
In our opinion, the financial statements referred to above present fairly, in all material respects, the respective financial position of the Santa Clarita Valley Water Agency, as of June 30, 2018, and the respective changes in financial position, and, where applicable, cash flows thereof for the six month period then ended in accordance with accounting principles generally accepted in the United States of America.
2
Independent Auditor’s Report, continued
Required Supplementary Information
Accounting principles generally accepted in the United States of America require that the management’s discussion and analysis on pages 3 through 7 and the required supplementary information on pages 57 through 60 be presented to supplement the basic financial statements. Such information, although not a part of the basic financial statements, is required by the Governmental Accounting Standards Board, who considers it to be an essential part of financial reporting for placing the basic financial statements in an appropriate operational, economic, or historical context. We have applied certain limited procedures to the required supplementary information in accordance with auditing standards generally accepted in the United States of America, which consisted of inquiries of management about the methods of preparing the information and comparing the information for consistency with management’s responses to our inquiries, the basic financial statements, and other knowledge we obtained during our audit of the basic financial statements. We do not express an opinion or provide any assurance on the information because the limited procedures do not provide us with sufficient evidence to express an opinion or provide any assurance.
Other Information
Our audit was conducted for the purpose of forming an opinion on the financial statements that collectively comprise the Agency’s basic financial statements. The supplemental information on pages 61 through 66 are presented for purposes of additional analysis and are not a required part of the basic financial statements.
The supplemental information schedules are the responsibility of management and were derived from and relate directly to the underlying accounting and other records used to prepare the basic financial statements. Such information has been subjected to the auditing procedures applied in the audit of the basic financial statements and certain additional procedures, including comparing and reconciling such information directly to the underlying accounting and other records used to prepare the basic financial statements or to the basic financial statements themselves, and other additional procedures in accordance with auditing standards generally accepted in the United States of America. In our opinion, the supplemental information schedules are fairly stated, in all material respects, in relation to the basic financial statements as a whole.
Other Reporting Required by Government Auditing Standards
In accordance with Government Auditing Standards, we have also issued our report dated March 18, 2019, on our consideration of the Agency’s internal control over financial reporting and on our tests of its compliance with certain provisions of laws, regulations, contracts, and grant agreements and other matters. The purpose of that report is solely to describe the scope of our testing of internal control over financial reporting and compliance and the results of that testing, and not to provide an opinion on the effectiveness of the Agency’s internal control over financial reporting or on compliance. That report is an integral part of an audit performed in accordance with Government Auditing Standards in considering the Agency’s internal control over financial reporting and compliance. That report can be found on pages 67 and 68.
Fedak & Brown LLP Cypress, California March 18, 2019
Santa Clarita Valley Water Agency Management’s Discussion and Analysis
For the Six Month Period Ended June 30, 2018
3
The following Management’s Discussion and Analysis (MD&A) of activities and financial performance of the Santa Clarita Valley Water Agency (Agency) provides an introduction to the financial statements of the Agency for the six month period ended June 30, 2018. We encourage readers to consider the information presented here in conjunction with the basic financial statements and related notes, which follow this section.
Financial Highlights
As of June 30, 2018, the Agency's assets and deferred outflows of resources exceeded its liabilities and deferred inflows of resources by $581.42 million (net position). Of this balance, unrestricted net position amounted to $91.36 million.
The Agency’s total revenues amounted to $74.24 million during the six month period from January 1, 2018 to June 30, 2018.
The Agency’s total expenses amounted to $81.69 million during the six month period from January 1, 2018 to June 30, 2018.
Required Financial Statements
This annual report consists of a series of financial statements. The Statement of Net Position, Statement of Revenues, Expenses, and Changes in Net Position, and Statement of Cash Flows provide information about the activities and performance of the Agency using accounting methods similar to those used by private sector companies.
The Santa Clarita Valley Water Agency (Agency) was formed to modernize and enhance water service in the region. It was crafted during a two-year public process led by Castaic Lake Water Agency (CLWA) and Newhall County Water District (NCWD). It will provide water service to customers within the service boundary previously serviced by CLWA, NCWD and Valencia Water Company (VWC).
The Agency’s financial statements comprised of four divisions as follows: (1) Wholesale Water Division (formerly CLWA); (2) Santa Clarita Water Division; (3) Newhall Water Division (formerly NCWD); and (4) Valencia Water Division (formerly VWC). The Agency’s records are maintained on an enterprise basis, as it is the intent of the Board of Directors that the costs of providing water service to the customers of the Agency are financed primarily through user charges. See the detailed historical information of the Agency on Note 1 to the basic financial statements.
The Statement of Net Position includes all of the Agency’s investments in resources (assets), deferred outflows of resources, the obligations to creditors (liabilities), and deferred inflows of resources. It also provides the basis for computing a rate of return, evaluating the capital structure of the Agency and assessing the liquidity and financial flexibility of the Agency. All of the current year’s revenue and expenses are accounted for in the Statement of Revenues, Expenses, and Changes in Net Position. This statement measures the success of the Agency’s operations over the past year and can be used to determine if the Agency has successfully recovered all of its costs through its rates and other charges. This statement can also be used to evaluate profitability and credit worthiness. The final required financial statement is the Statement of Cash Flows, which provide information about the Agency’s cash receipts and cash payments during the reporting period. The Statement of Cash Flows report cash receipts, cash payments, and net changes in cash resulting from operations, investing, non-capital financing, and capital and related financing activities, as well as providing answers to such questions as where did cash come from, what was cash used for, and what was the change in cash balance during the reporting period.

Santa Clarita Valley Water Agency Management’s Discussion and Analysis, continued
For the Six Month Period Ended June 30, 2018
4
Financial Analysis of the Agency
One of the most important questions asked about the Agency’s finances is, “Is the Agency better off or worse off as a result of this year’s activities?” The Statement of Net Position and the Statement of Revenues, Expenses, and Changes in Net Position report information about the Agency in a way that helps answer this question. These statements include all assets, deferred outflows, liabilities, and deferred inflows using the accrual basis of accounting, which is similar to the accounting used by most private sector companies. All of the current year’s revenues and expenses are taken into account regardless of when the cash is received or paid.
These two statements report the Agency’s net position and changes in them. Think of the Agency’s net position – the difference between assets, and deferred outflows of resources, and liabilities and deferred inflows of resources – as one way to measure the Agency’s financial health, or financial position. Over time, increases or decreases in the Agency’s net position are one indicator of whether its financial health is improving or deteriorating. One will need to consider other non-financial factors however, such as changes in the Agency’s property tax base and the types of grants the Agency applies for to assess the overall financial health of the Agency.
Notes to the Basic Financial Statements
The notes provide additional information that is essential to a full understanding of the data provided in the basic financial statements. The notes to the basic financial statements can be found on pages 13 through 56.
Statement of Net Position
June 30, 2018
Assets:Current assets $ 158.09 Capital assets 736.65 Non-current assets 103.17
Total assets 997.91
Deferred outflows of resources 7.46
Liabilities:Current liabilities 50.37 Non-current liabilities 370.09
Total liabilities 420.46
Deferred inflows of resources 3.49
Net position:Net investment in capital assets 411.58 Restricted 78.48 Unrestricted 91.36
Total net position $ 581.42
Condensed Statement of Net Position (in millions)
Santa Clarita Valley Water Agency Management’s Discussion and Analysis, continued
For the Six Month Period Ended June 30, 2018
5
Statement of Net Position, continued
As noted earlier, net position may serve over time as a useful indicator of a government’s financial position. For the six month period ended June 30, 2018, the Agency’s, assets and deferred outflows of resources exceeded liabilities and deferred inflows of resources by $581.42 million. The Agency's net position is made-up of three components: (1) net investment in capital assets, (2) restricted, and (3) unrestricted.
By far the largest portion of the Agency’s net position (70.79% as of June 30, 2018) reflects the Agency’s investment in capital assets (net of accumulated depreciation) less any related debt used to acquire those assets that is still outstanding. The Agency uses these capital assets to provide services to customers within the Agency’s service area; consequently, these assets are not available for future spending. See Note 11 for further information.
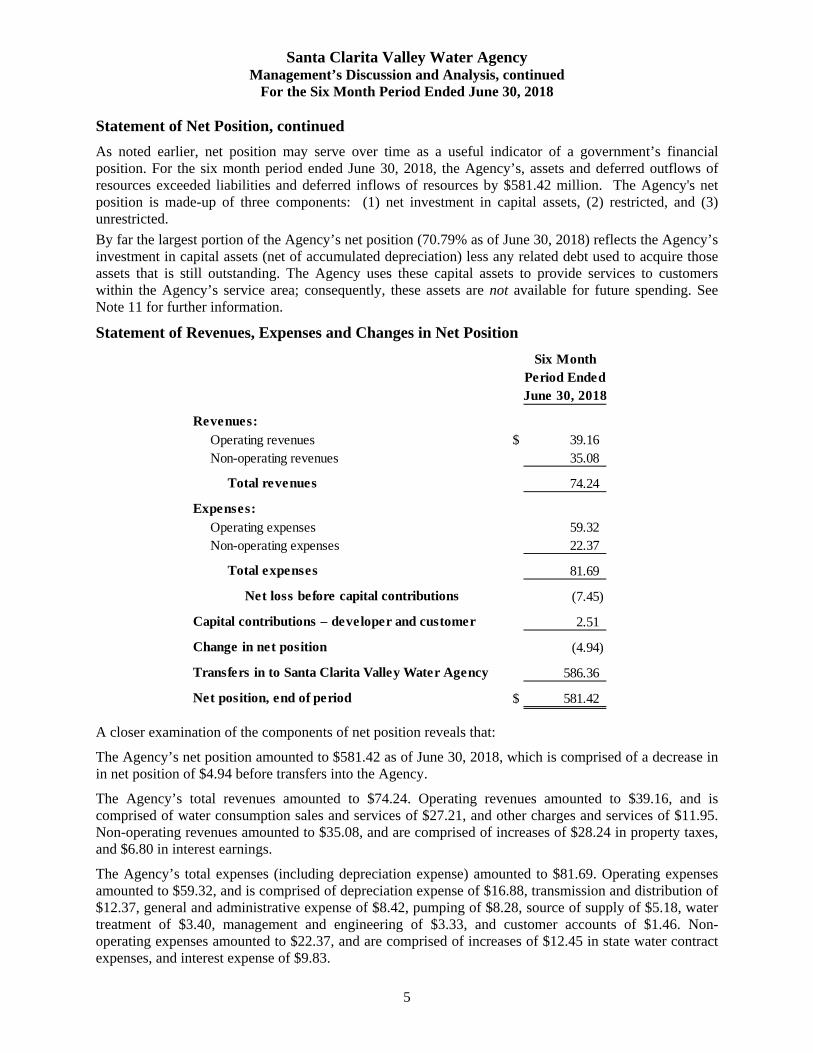
Statement of Revenues, Expenses and Changes in Net Position
Six MonthPeriod EndedJune 30, 2018
Revenues:Operating revenues $ 39.16 Non-operating revenues 35.08
Total revenues 74.24
Expenses:Operating expenses 59.32 Non-operating expenses 22.37
Total expenses 81.69
Net loss before capital contributions (7.45)
Capital contributions – developer and customer 2.51
Change in net position (4.94)
Transfers in to Santa Clarita Valley Water Agency 586.36
Net position, end of period $ 581.42
A closer examination of the components of net position reveals that:
The Agency’s net position amounted to $581.42 as of June 30, 2018, which is comprised of a decrease in in net position of $4.94 before transfers into the Agency.
The Agency’s total revenues amounted to $74.24. Operating revenues amounted to $39.16, and is comprised of water consumption sales and services of $27.21, and other charges and services of $11.95. Non-operating revenues amounted to $35.08, and are comprised of increases of $28.24 in property taxes, and $6.80 in interest earnings.
The Agency’s total expenses (including depreciation expense) amounted to $81.69. Operating expenses amounted to $59.32, and is comprised of depreciation expense of $16.88, transmission and distribution of $12.37, general and administrative expense of $8.42, pumping of $8.28, source of supply of $5.18, water treatment of $3.40, management and engineering of $3.33, and customer accounts of $1.46. Non-operating expenses amounted to $22.37, and are comprised of increases of $12.45 in state water contract expenses, and interest expense of $9.83.

Santa Clarita Valley Water Agency Management’s Discussion and Analysis, continued
For the Six Month Period Ended June 30, 2018
6
Statement of Revenues, Expenses and Changes in Net Position, continued
The Agency’s capital contributions amounted to $2.51.
Capital Asset Administration
June 30, 2018
Capital assets:Non-depreciable assets $ 101.01 Depreciable assets 1,072.81 Accumulated depreciation (437.17)
Total capital assets, net $ 736.65
Capital Assets (in millions)
As of June 30, 2018, the Agency’s investment in capital assets amounted to $736.65 million (net of accumulated depreciation). This investment in capital assets includes land, transmission and distribution systems, pumping plants and rights, buildings and structures, equipment, vehicles, and construction-in-process.
Major capital asset additions included upgrades to state water project rights, upgrades to water tanks and mains, meter installations, and developer contributions to the water retail enterprise’s transmission and distribution system. A significant portion of these additions were constructed by the Agency and/or sub-contractors and transferred out of construction-in-process upon completion of these various projects. The capital assets of the Agency are more fully analyzed in Note 7 to the basic financial statements.
Long-Term Debt Administration
June 30, 2018
Long-term debt:Certificates of participation $ 137.22 Revenue bonds 228.42 Notes payable 3.09
Total long-term debt $ 368.73
Long-term Debt (in millions)
At June 30, 2018, the Agency had $368.73 million in long-term debt of which $18.74 million is considered a current liability. The long-term debt position of the Agency is more fully analyzed in Note 10 to the basic financial statements.
Conditions Affecting Current Financial Position
Expanding in Infrastructure – Management has identified a need to invest in the Agency’s infrastructure and Capital Improvement Program (CIP). As the Agency’s infrastructure continues to expand, the Agency understands the importance of monitoring the impacts of CIP projects on operating expenditures. Each major CIP project that becomes operational adds new complexity and costs to the Agency’s overall system. As this additional infrastructure is implemented, the Agency will require additional staff resources and will incur additional costs to operate and maintain the infrastructure. The current CIP includes a number of water quality and pipeline projects that will not have significant operating costs. However, the future development of the recycled water program will have significant operating costs that should be identified as part of the planning process.
Santa Clarita Valley Water Agency Management’s Discussion and Analysis, continued
For the Six Month Period Ended June 30, 2018
7
Requests for Information
This financial report is designed to provide the Agency’s funding sources, customers, stakeholders, and other interested parties with an overview of the Agency’s financial operations and financial condition. Should the reader have questions regarding the information included in this report or wish to request additional financial information, please contact the Agency’s Director of Finance and Administration at 27234 Bouquet Canyon Road, Santa Clarita, California 91350-2173 or (661) 297-1600.


Basic Financial Statements

Santa Clarita Valley Water Agency Statement of Net Position
June 30, 2018
8
2018
Current assets:Cash and cash equivalents (note 2) $ 17,469,938 Cash and cash equivalents - restricted (note 2) 948,405 Cash and cash equivalents with fiscal agent (note 2) 5,512,074 Investments (note 2) 87,892,733 Investments - restricted (note 2) 18,840,811 Accounts receivable - water sales and services 13,342,489 Property tax receivable 1,661,378 Property tax receivable - restricted 1,475,093 Accrued interest receivable 505,730 Accrued interest receivable - restricted 293,142 Accounts receivable - other 1,697,909 Accounts receivable - other (restricted) 764,839 Materials and supplies inventory 1,972,078 Prepaid expenses and other deposits 5,710,728
Total current assets 158,087,347
Non-current assets:Investments (note 2) 103,172,206 Capital assets - not being depreciated (note 7) 101,010,916 Capital assets, net - being depreciated (note 7) 635,637,884
Total non-current assets 839,821,006
Total assets 997,908,353
Deferred outflows of resources:Deferred pension outflows (note 8) 5,389,988 Deferred OPEB outflows (note 9) 605,630 Loss on defeasance of debt (note 10) 1,464,720
Total deferred outflows of resources $ 7,460,338
Continued on next page
See accompanying notes to the basic financial statements.
Santa Clarita Valley Water Agency Statement of Net Position, continued
June 30, 2018
9
2018
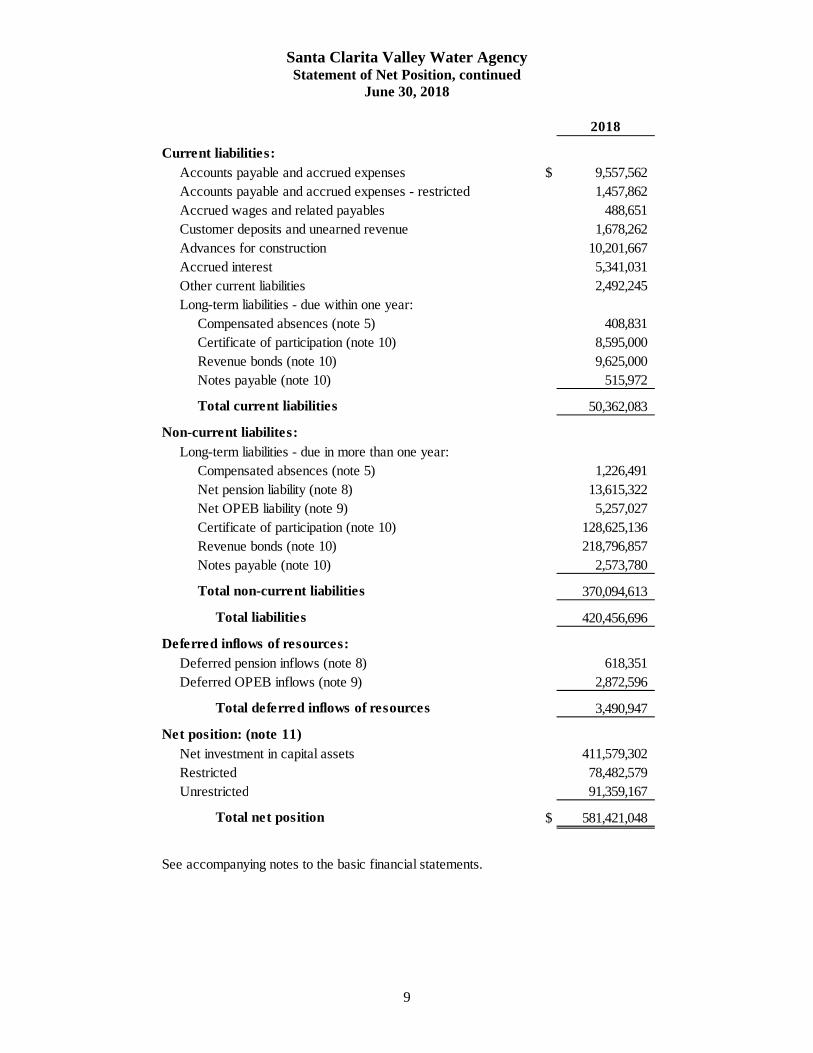
Current liabilities:Accounts payable and accrued expenses $ 9,557,562 Accounts payable and accrued expenses - restricted 1,457,862 Accrued wages and related payables 488,651 Customer deposits and unearned revenue 1,678,262 Advances for construction 10,201,667 Accrued interest 5,341,031 Other current liabilities 2,492,245 Long-term liabilities - due within one year:
Compensated absences (note 5) 408,831 Certificate of participation (note 10) 8,595,000 Revenue bonds (note 10) 9,625,000 Notes payable (note 10) 515,972
Total current liabilities 50,362,083
Non-current liabilites:Long-term liabilities - due in more than one year:
Compensated absences (note 5) 1,226,491 Net pension liability (note 8) 13,615,322 Net OPEB liability (note 9) 5,257,027 Certificate of participation (note 10) 128,625,136 Revenue bonds (note 10) 218,796,857 Notes payable (note 10) 2,573,780
Total non-current liabilities 370,094,613
Total liabilities 420,456,696
Deferred pension inflows (note 8) 618,351 Deferred OPEB inflows (note 9) 2,872,596
Total deferred inflows of resources 3,490,947
Net position: (note 11)Net investment in capital assets 411,579,302 Restricted 78,482,579 Unrestricted 91,359,167
Total net position $ 581,421,048
See accompanying notes to the basic financial statements.
Deferred inflows of resources:
Santa Clarita Valley Water Agency Statement of Revenues, Expenses and Changes in Net Position
For the Six Month Period Ended June 30, 2018
10
2018
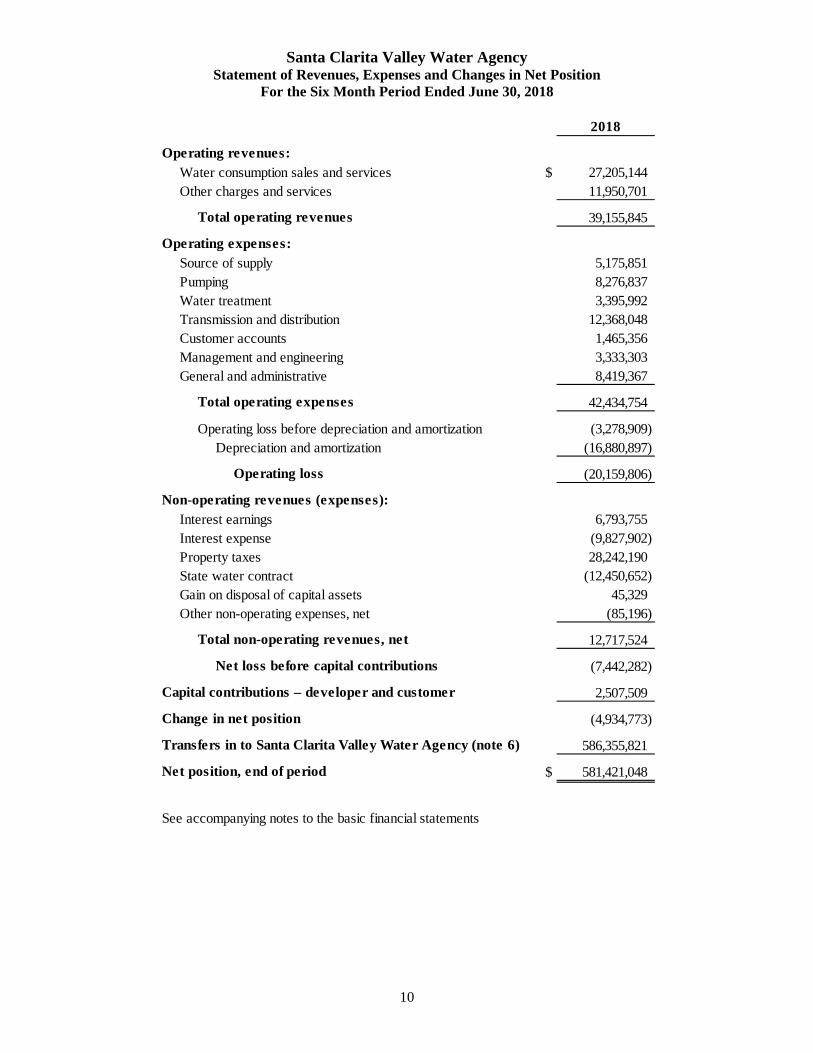
Operating revenues:Water consumption sales and services $ 27,205,144Other charges and services 11,950,701
Total operating revenues 39,155,845
Operating expenses:Source of supply 5,175,851Pumping 8,276,837Water treatment 3,395,992Transmission and distribution 12,368,048Customer accounts 1,465,356Management and engineering 3,333,303General and administrative 8,419,367
Total operating expenses 42,434,754
Operating loss before depreciation and amortization (3,278,909) Depreciation and amortization (16,880,897)
Operating loss (20,159,806)
Non-operating revenues (expenses):Interest earnings 6,793,755Interest expense (9,827,902)Property taxes 28,242,190State water contract (12,450,652)Gain on disposal of capital assets 45,329Other non-operating expenses, net (85,196)
Total non-operating revenues, net 12,717,524
Net loss before capital contributions (7,442,282)
Capital contributions – developer and customer 2,507,509
Change in net position (4,934,773)
Transfers in to Santa Clarita Valley Water Agency (note 6) 586,355,821
Net position, end of period $ 581,421,048
See accompanying notes to the basic financial statements

Santa Clarita Valley Water Agency Statement of Cash Flows
For the Six Month Period Ended June 30, 2018
11
2018
Cash flows from operating activities:Receipts from customers for water sales and services $ 42,238,940 Payments to employees for salaries and wages (9,033,442) Payments to vendors and suppliers for materials and services (37,147,883)
Net cash used in operating activities (3,942,385)
Cash flows from non-capital financing activities:Proceeds from property taxes 30,586,610 Payments for state water contract (12,450,652) Proceeds from non-operating revenues, net (85,196)
Net cash provided by non-capital financing activities 18,050,762
Cash flows from capital and related financing activities:Acquisition and construction of capital assets (19,974,103) Capital contributions 2,507,509 Principal paid on long-term debt (24,883,648) Proceeds from issuance of revenue bonds 26,735,000 Interest paid (3,708,148)
Net cash used in capital and related financing activities (19,323,390)
Cash flows from investing activities:Purchase of investments (14,452,507) Investment earnings 6,331,800
Net cash used in investing activities (8,120,707)
Net decrease in cash and cash equivalents (13,335,720)
Cash and cash equivalents, beginning of period 37,266,137
Cash and cash equivalents, end of period $ 23,930,417
Reconciliation of cash and cash equivalents to statement of net position:
Cash and cash equivalents $ 17,469,938 Cash and cash equivalents - restricted 948,405 Cash and cash equivalents with fiscal agent 5,512,074
Total cash and cash equivalents $ 23,930,417
Continued on next page
See accompanying notes to the basic financial statements.

Santa Clarita Valley Water Agency Statement of Cash Flows, continued
For the Six Month Period Ended June 30, 2018
12
2018Reconciliation of operating loss to net cash used in
operating activities:
Operating loss $ (20,159,806)
Adjustments to reconcile operating loss to net cashused in operating activities:
Depreciation and amortization 16,880,897
Changes in assets, deferred outflows of resources, liabilitiesand deferred inflows of resources:(Increase) decrease in assets and deferred outflows of resources:
Accounts receivable - water sales and services, net (617,264) Accounts receivable - other 687,967 Materials and supplies inventory (62,249) Prepaid expenses and other deposits 952,818
Deferred outflows of resources 420,130
Increase (decrease) in liabilities and deferred inflows of resources:Accounts payable and accrued expenses (3,011,511) Accrued salaries and wages 58,777 Customer deposits and unearned revenue (303,608) Advances for construction (1,107,971) Other current liabilities 2,492,245 Compensated absences 178,325 Net OPEB liability (3,223,731)
Deferred inflows of resources 2,872,596
Total adjustments 16,217,421
Net cash used in operating activities $ (3,942,385)
See accompanying notes to the basic financial statements
Santa Clarita Valley Water Agency Notes to the Basic Financial Statements
June 30, 2018
13
(1) Reporting Entity and Summary of Significant Accounting Policies
A. Organization and Operations of the Reporting Entity
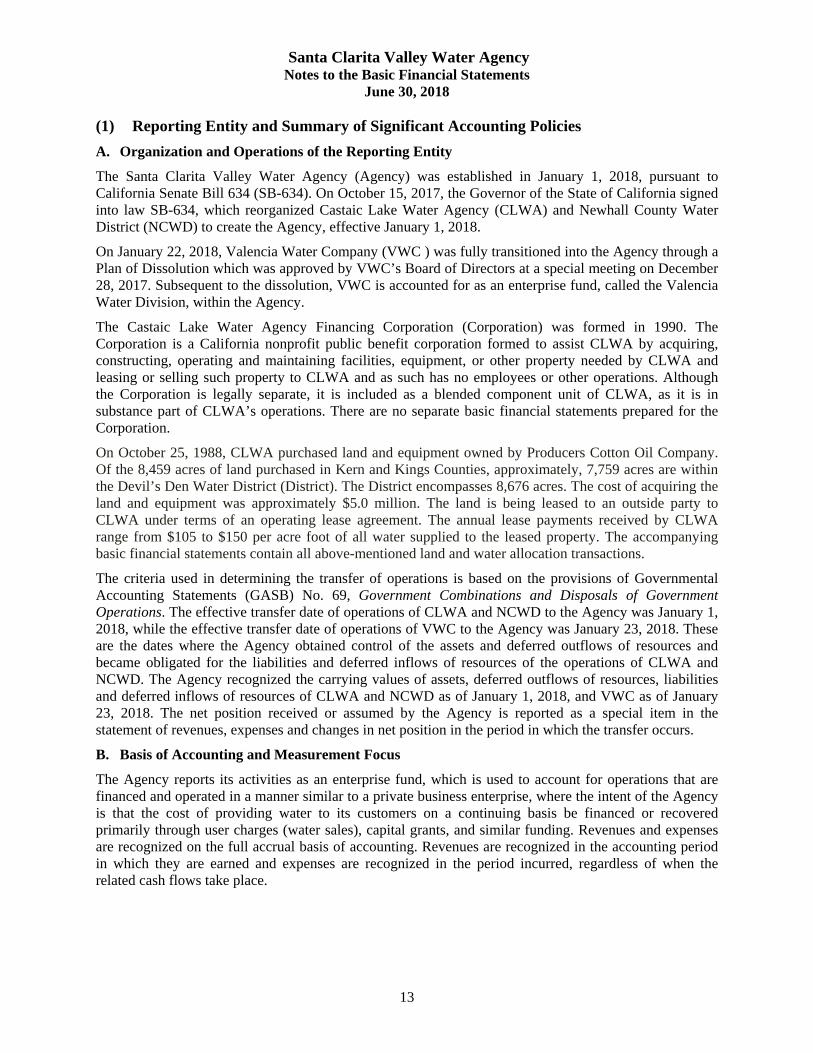
The Santa Clarita Valley Water Agency (Agency) was established in January 1, 2018, pursuant to California Senate Bill 634 (SB-634). On October 15, 2017, the Governor of the State of California signed into law SB-634, which reorganized Castaic Lake Water Agency (CLWA) and Newhall County Water District (NCWD) to create the Agency, effective January 1, 2018.
On January 22, 2018, Valencia Water Company (VWC ) was fully transitioned into the Agency through a Plan of Dissolution which was approved by VWC’s Board of Directors at a special meeting on December 28, 2017. Subsequent to the dissolution, VWC is accounted for as an enterprise fund, called the Valencia Water Division, within the Agency.
The Castaic Lake Water Agency Financing Corporation (Corporation) was formed in 1990. The Corporation is a California nonprofit public benefit corporation formed to assist CLWA by acquiring, constructing, operating and maintaining facilities, equipment, or other property needed by CLWA and leasing or selling such property to CLWA and as such has no employees or other operations. Although the Corporation is legally separate, it is included as a blended component unit of CLWA, as it is in substance part of CLWA’s operations. There are no separate basic financial statements prepared for the Corporation.
On October 25, 1988, CLWA purchased land and equipment owned by Producers Cotton Oil Company. Of the 8,459 acres of land purchased in Kern and Kings Counties, approximately, 7,759 acres are within the Devil’s Den Water District (District). The District encompasses 8,676 acres. The cost of acquiring the land and equipment was approximately $5.0 million. The land is being leased to an outside party to CLWA under terms of an operating lease agreement. The annual lease payments received by CLWA range from $105 to $150 per acre foot of all water supplied to the leased property. The accompanying basic financial statements contain all above-mentioned land and water allocation transactions.
The criteria used in determining the transfer of operations is based on the provisions of Governmental Accounting Statements (GASB) No. 69, Government Combinations and Disposals of Government Operations. The effective transfer date of operations of CLWA and NCWD to the Agency was January 1, 2018, while the effective transfer date of operations of VWC to the Agency was January 23, 2018. These are the dates where the Agency obtained control of the assets and deferred outflows of resources and became obligated for the liabilities and deferred inflows of resources of the operations of CLWA and NCWD. The Agency recognized the carrying values of assets, deferred outflows of resources, liabilities and deferred inflows of resources of CLWA and NCWD as of January 1, 2018, and VWC as of January 23, 2018. The net position received or assumed by the Agency is reported as a special item in the statement of revenues, expenses and changes in net position in the period in which the transfer occurs.
B. Basis of Accounting and Measurement Focus
The Agency reports its activities as an enterprise fund, which is used to account for operations that are financed and operated in a manner similar to a private business enterprise, where the intent of the Agency is that the cost of providing water to its customers on a continuing basis be financed or recovered primarily through user charges (water sales), capital grants, and similar funding. Revenues and expenses are recognized on the full accrual basis of accounting. Revenues are recognized in the accounting period in which they are earned and expenses are recognized in the period incurred, regardless of when the related cash flows take place.

Santa Clarita Valley Water Agency Notes to the Basic Financial Statements, continued
June 30, 2018
14
(1) Reporting Entity and Summary of Significant Accounting Policies, continued
B. Basis of Accounting and Measurement Focus, continued
Operating revenues and expenses, such as water sales and water purchases, result from exchange transactions associated with the principal activity of the District. Exchange transactions are those in which each party receives and gives up essentially equal values. Management, administration and depreciation expenses are also considered operating expenses.
Operating expenses are those that are clearly identifiable with a specific function. The types of transactions reported as operating revenues for the Agency are charges for services directly related to the operations of the Agency. Charges for services include revenues from customers or applicants who purchase, use, or directly benefit from goods, services, or privileges provided by the Agency. Taxes, operating grants, and other items not properly included among operating revenues are reported instead as non-operating revenues. Contributed capital and capital grants are included as capital contributions.
C. Financial Reporting
The Agency’s basic financial statements have been prepared in conformity with accounting principles generally accepted in the United States of America (GAAP), as applied to enterprise funds. The Governmental Accounting Standards Board (GASB) is the accepted standard-setting body for establishing governmental accounting and financial accounting principles.
The Agency has adopted the following GASB pronouncements in the current year:
Government Accounting Standards Board Statement No. 75
In June 2015, the GASB issued Statement No. 75 – Accounting and Financial Reporting for Postemployment Benefits Other Than Pensions. The objective of this Statement is to improve accounting and financial reporting by state and local governments for postemployment benefits other than pensions (OPEB). It also improves information provided by state and local governmental employers about financial support for OPEB that is provided by other entities.
This Statement replaces the requirements of Statement No. 45 – Accounting and Financial Reporting by Employers for Postemployment Benefits Other Than Pensions, as amended, and No. 57 – OPEB Measurements by Agent Employers and Agent Multiple-Employer Plans, for OPEB.
Government Accounting Standards Board Statement No. 81
In March 2016, the GASB issued Statement No. 81 – Irrevocable Split-Interest Agreements. The objective of this Statement is to improve accounting and financial reporting for irrevocable split-interest agreements by providing recognition and measurement guidance for situations in which a government is a beneficiary of the agreement.
This Statement requires that a government that receives resources pursuant to an irrevocable split-interest agreement recognize assets, liabilities, and deferred inflows of resources at the inception of the agreement. Furthermore, this Statement requires that a government recognize assets representing its beneficial interests in irrevocable split-interest agreements that are administered by a third party, if the government controls the present service capacity of the beneficial interests. This Statement requires that a government recognize revenue when the resources become applicable to the reporting period.
Government Accounting Standards Board Statement No. 85
In March 2017, the GASB issued Statement No. 85 – Omnibus 2017. The objective of this Statement is to address practice issues that have been identified during implementation and application of certain GASB Statements. This Statement addresses a variety of topics including issues related to blending component units, goodwill, fair value measurement and application, and postemployment benefits (pensions and other postemployment benefits [OPEB]).

Santa Clarita Valley Water Agency Notes to the Basic Financial Statements, continued
June 30, 2018
15
(1) Reporting Entity and Summary of Significant Accounting Policies, continued
C. Financial Reporting, continued
Government Accounting Standards Board Statement No. 86
In May 2017, the GASB issued Statement No. 86 – Certain Debt Extinguishment Issues. The primary objective of this Statement is to improve consistency in accounting and financial reporting for in-substance defeasance of debt by providing guidance for transactions in which cash and other monetary assets acquired with only existing resources—resources other than the proceeds of refunding debt—are placed in an irrevocable trust for the sole purpose of extinguishing debt. This Statement also improves accounting and financial reporting for prepaid insurance on debt that is extinguished and notes to financial statements for debt that is defeased in substance.
D. Assets, Deferred Outflows, Liabilities, Deferred Inflows, and Net Position
1. Cash and Cash Equivalents
Substantially all of the Agency’s cash is invested in interest bearing accounts. The Agency considers all highly liquid investments with a maturity of three months or less to be cash equivalents.
2. Use of Estimates
The preparation of the basic financial statements, in conformity with generally accepted accounting principles, requires management to make estimates and assumptions that affect the reported amounts of assets, deferred outflows of resources, and liabilities, and deferred inflows of resources, and disclosures of contingent assets and liabilities at the date of the financial statements and the reported changes in net position during the reporting period. Actual results could differ from those estimates.
3. Investments and Investment Policy
The Agency has adopted an investment policy in accordance with the provisions of California Government Code Section 53601 and directing the Treasurer to deposit funds in financial institutions.
Changes in fair value that occur during a fiscal year are recognized as investment income reported for that fiscal year. Investment income includes interest earnings, changes in fair value, and any gains or losses realized upon the liquidation or sale of investments. The Agency’s policy is to hold its investments until maturity or until market values equal or exceed cost.
4. Fair Value Measurements
The Agency categorizes its fair value measurements within the fair value hierarchy established by generally accepted accounting principles.
The hierarchy is based on valuation inputs used to measure the fair value of the assets, as follows:
Level 1 – Valuation is based on quoted prices in active markets for identical assets. Level 2 – Valuation is based on directly observable and indirectly observable inputs. These
inputs are derived principally from or corroborated by observable market data through correlation or market-corroborated inputs. The concept of market-corroborated inputs incorporates observable market data such as interest rates and yield curves that are observable at commonly quoted intervals.
Level 3 – Valuation is based on unobservable inputs where assumptions are made based on factors such as prepayment rates, probability of defaults, loss severity and other assumptions that are internally generated and cannot be observed in the market.
Santa Clarita Valley Water Agency Notes to the Basic Financial Statements, continued
June 30, 2018
16
(1) Reporting Entity and Summary of Significant Accounting Policies, continued
D. Assets, Deferred Outflows, Liabilities, Deferred Inflows, and Net Position, continued
5. Property Taxes and Assessments
The Counties of Los Angeles and Ventura Assessor’s Offices assesses all real and personal property within each respective County each year. The Counties of Los Angeles and Ventura Tax Collector’s Offices bills and collects the Agency’s share of property taxes and/or tax assessments. The Counties of Los Angeles and Ventura Treasurer’s Office remits current and delinquent property tax collections to the Agency throughout the year. Property tax in California is levied in accordance with Article 13A of the State Constitution at one percent (1%) of countywide assessed valuations.
Property taxes receivable at year-end are related to property taxes and tax assessments collected by the Counties of Los Angeles and Ventura, which have not been credited to the Agency's cash balance as of June 30. The property tax calendar is as follows:
Lien date March 1 Levy date July 1 Due dates November 1 and March 1 Collection dates December 10 and April 10
6. Accounts Receivable
The Agency extends credit to customers in the normal course of operations. An allowance for doubtful accounts has been recorded based on an estimate of uncollectible accounts.
7. Materials and Supplies Inventory
Materials and supplies inventory consists primarily of water meters, pipe and pipe fittings for construction and repair to the Agency’s retail water transmission and distribution system. Inventory is valued at cost using a weighted average method. Inventory items are charged to expense at the time that individual items are withdrawn from inventory or consumed.
8. Prepaid Expenses
Certain payments to vendors reflect cost or deposits applicable to future accounting periods and are recorded as prepaid items in the basic financial statements. The cost of prepaid items is recorded as an expense when consumed rather than when purchased.
9. Capital Assets
Capital assets acquired and/or constructed are capitalized at historical cost. Agency policy has set the capitalization threshold for reporting capital assets at $5,000. Improvement to existing capital assets will be presumed to extend the useful life or increase the capacity of performance of the related capital asset and, therefore, will be subject to capitalization if the cost of the improvement meets the $5,000 threshold. Donated assets are recorded at estimated fair market value at the date of donation.
Upon retirement or other disposition of capital assets, the cost and related accumulated depreciation are removed from the respective balances and any gains or losses are recognized.

Santa Clarita Valley Water Agency Notes to the Basic Financial Statements, continued
June 30, 2018
17
(1) Reporting Entity and Summary of Significant Accounting Policies, continued
D. Assets, Deferred Outflows, Liabilities, Deferred Inflows, and Net Position, continued
9. Capital Assets, continued
Depreciation will be calculated based on the assets in service at the beginning of the fiscal year and is recorded on a straight-line basis over the estimated useful lives of the assets as follows:
Franchise and consents – 20 years Other Intangible plan – 20 years Organizational costs – 33 years Structures and Improvements – 30 years Wells – 30 years Pumping Equipment – 20 years Castaic Turnout – 50 years Other Pumping Equipment – 30 years Water Treatment Equipment – 30 years Treatment Structures – 35 years Treatment Plant – 50 years Reservoirs and Tanks – 50 years Transmission and Distribution mains – 50 years Fire mains – 50 years Services – 30 years Meters and Meter installation – 20 years Hydrants – 30 years Computer Hardware and Software – 5 years Office Furniture and Equipment – 10 years Vehicles – 10 years Stores Equipment – 10 years Lab Equipment – 5 years Communications Equipment – 7 years Power Operating Equipment – 10 years Tools, Shop and Garage – 10 years Other General Plant Equipment – 8 years Sewer Plant – 51 years Sewer Lift Stations – 50 years Maintenance Facility – 30 years Lighting and Roads – 25 years Fencing – 15 years
10. Pensions
For the purposes of measuring the net pension liability and deferred outflows and inflows of resources related to pensions, and pension expense, information about the fiduciary net position and additions to/deductions from the Plan’s fiduciary net position have been determined on the same basis as they are reported by the CalPERS Financial Office. For this purpose, benefit payments (including refunds of employee contributions) are recognized when currently due and payable in accordance with the benefit terms. Investments are reported at fair value. CalPERS audited financial statements are publicly available reports that can be obtained at CalPERS website.

Santa Clarita Valley Water Agency Notes to the Basic Financial Statements, continued
June 30, 2018
18
(1) Reporting Entity and Summary of Significant Accounting Policies, continued
D. Assets, Deferred Outflows, Liabilities, Deferred Inflows, and Net Position, continued
10. Pensions, continued
GASB 68 requires that the reported results must pertain to liability and asset information within certain defined timeframes. For this report, the following timeframes are used:
Valuation Date: June 30, 2016 Measurement Date: June 30, 2017 Measurement Period: July 1, 2016 to June 30, 2017
11. Compensated Absences
The Agency's policy is to permit employees to accumulate earned vacation with maximum hours ranging between 200 and 400 hours, based on years of service, and 480 hours of sick leave. Accumulated vacation and sick time is accrued at year-end to account for the Agency's obligation to the employees for the amount owed.
Vacation accrual increases to 120 hours for each full year of continuous service after 5 years until completion of 10 years of continuous service. After completion of 10 full years, vacation leave shall accrue at the rate of 160 hours per year.
Sick leave shall accrue year after year above the 96 hours accrued in that year. Sick leave shall accrue at the rate of eight hours per month for full time employees commencing on January 1 of each year. Sick leave shall accrue on a pro-rata basis. In the event that an employee has a sick leave accrual of more than 480 hours in any calendar year, the Agency will pay the employee 50% of the value of any unused sick leave in excess of 480 hours as a cash bonus. This bonus shall be based on leave balance on December 31 and is typically paid within 3 months of that date.
12. Postemployment Benefits Other than Pensions (OPEB)
For purposes of measuring the net OPEB Liability, deferred outflows of resources and deferred inflows of resources related to OPEB, and OPEB expense, information about the fiduciary net position of the Agency’s Retiree Health Plan and additions to/deductions from the Agency’s fiduciary net position have been determined on the same basis as they are reported by the Agency. For this purpose, the Agency recognizes benefit payments when due and payable in accordance with benefit terms. Investments are reported at fair value, except for money market investments and participating interest-earning investment contracts that have a maturity at the time of purchase of one year or less, which are reported at cost.
13. Water Sales
Water sales, retail and wholesale, are billed on a monthly cyclical basis. Estimated unbilled water revenue through June 30, has been accrued at year-end.
14. Capital Contributions
Capital contributions represent cash and capital asset additions contributed to the Agency by property owners, granting agencies, or real estate developers desiring services that require capital expenditures or capacity commitment.
Santa Clarita Valley Water Agency Notes to the Basic Financial Statements, continued
June 30, 2018
19
(1) Reporting Entity and Summary of Significant Accounting Policies, continued
D. Assets, Deferred Outflows, Liabilities, Deferred Inflows, and Net Position, continued
15. Net Position
The financial statements utilize a net position presentation. Net position is categorized as follows:
Net Investment in Capital Assets Component of Net Position – This component of net position consists of capital assets, net of accumulated depreciation and amortization, and reduced by outstanding balances of any debt, or other long-term borrowings that are attributable to the acquisition, construction, or improvement of those assets. Deferred outflows of resources and deferred inflows of resources that are attributable to the acquisition, construction, or improvement of those assets or related debt is included in this component of net position.
Restricted Component of Net Position – This component of net position consists of assets that have restrictions placed upon their use by external constraints imposed either by creditors (debt covenants), grantors, contributors, or laws and regulations of other governments or constraints imposed by law through enabling legislation.
Unrestricted Component of Net Position – This component of net position is the net amount of the assets, deferred outflows of resources, liabilities, and deferred inflows of resources that are not included in the determination of the net investment in capital assets or restricted component of net position.
16. Budgetary Policies
The Agency follows specific procedures in establishing the budgetary data reflected in the financial statements. Each April, the Agency’s General Manager and Assistant General Manager prepare and submit a capital and operating budget to the Board of Directors and adopted no later than June of each year. Annual budgets are adopted on a basis consistent with generally accepted accounting principles for all enterprise funds. Annual budgets are adopted on the accrual basis for the proprietary fund. The adopted budget becomes operative on July 1.
(2) Cash and Investments
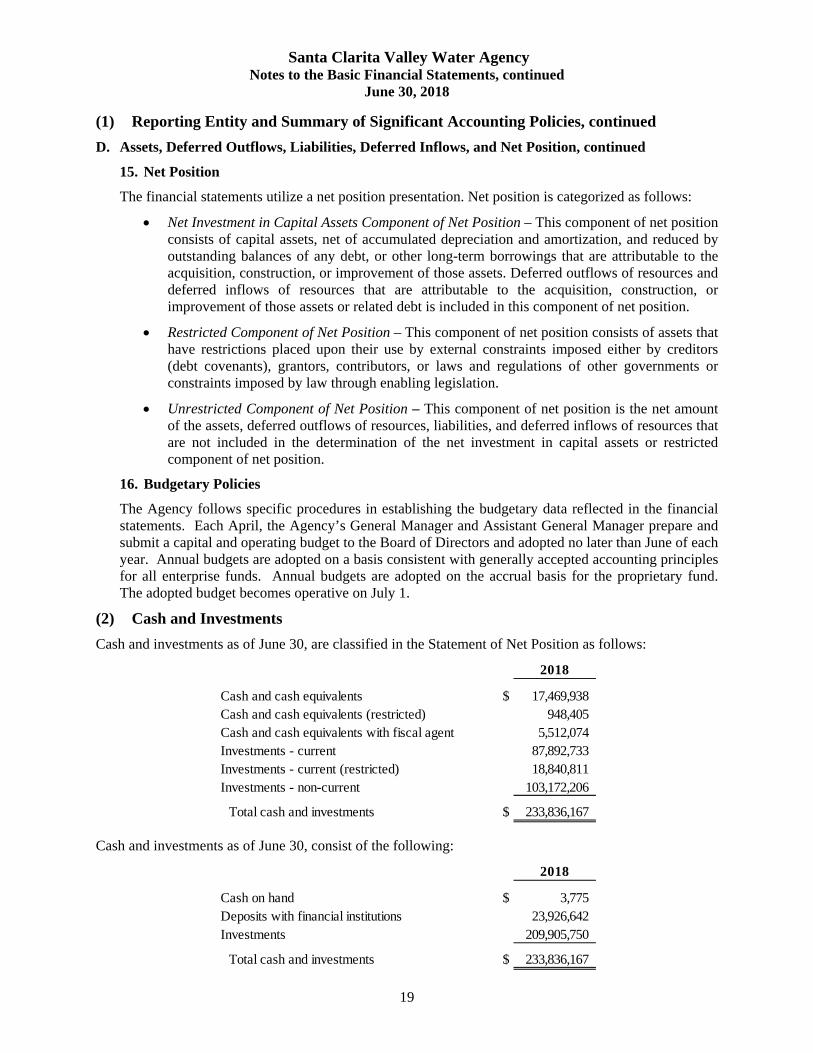
Cash and investments as of June 30, are classified in the Statement of Net Position as follows:
2018
Cash and cash equivalents $ 17,469,938 Cash and cash equivalents (restricted) 948,405 Cash and cash equivalents with fiscal agent 5,512,074 Investments - current 87,892,733 Investments - current (restricted) 18,840,811 Investments - non-current 103,172,206
Total cash and investments $ 233,836,167
Cash and investments as of June 30, consist of the following:
2018
Cash on hand $ 3,775 Deposits with financial institutions 23,926,642 Investments 209,905,750
Total cash and investments $ 233,836,167

Santa Clarita Valley Water Agency Notes to the Basic Financial Statements, continued
June 30, 2018
20
(2) Cash and Investments, continued
As of June 30, the Agency’s authorized deposits had the following average maturities:
2018
Deposits held with California Local Agency Investment Fund 193 DaysDeposits held with Los Angeles County Pooled Investment Fund 609 Days
Investments Authorized by the California Government Code and the Agency’s Investment Policy
The table below identifies the investment types that are authorized by the Agency in accordance with the California Government Code (or the Agency’s investment policy, where more restrictive). The table also identifies certain provisions of the California Government Code (or the Agency’s investment policy, where more restrictive) that address interest rate risk, credit risk, and concentration of credit risk.
This table does not address investments of debt proceeds held by bond trustees that are governed by the provisions of debt agreements of the Agency, rather than the general provisions of the California Government Code or the Agency’s investment policy.
Maximum MaximumMaximum Percentage InvestmentMaturity Of Portfolio in One Issuer 5 years None None5 years None None
180 days 30% 5%5 years 30% 5%
270 days 10% 5%5 years 30% 10%
Municipal Obligations 5 years 30% 5%Repurchase agreements 30 days 10% None
N/A None NoneN/A 30% None
Investment Trust of California (CalTRUST) N/A 20% NoneN/A 20% 10%
Investment Contracts 30 years None None
* Excluding amounts held by bond trustee that are not subject to California Government Code restrictions.
Medium-Term Notes
AuthorizedInvestment Type
Money Market Mutual Funds
Los Angeles County Pooled Investment Fund (LACPIF)
Commercial PaperCertificates of Deposit and Time Deposits
U.S. Treasury ObligationsU.S. Government Agency and Sponsored Enterprise SecuritiesBanker's Acceptances
California Local Agency Investment Fund (LAIF)
Investments Authorized by Debt Agreements
Investment of debt proceeds held by bond trustees are governed by provisions of the debt agreements, rather than the general provisions of the California Government Code or the Agency’s investment policy.
Los Angeles County Pooled Investment Fund
The Los Angeles County Pooled Investment Fund (LACPIF) is a pooled investment fund program governed by the County of Los Angeles Board of Supervisors, and administered by the County of Los Angeles Treasurer and Tax Collector. Investments in LACPIF are highly liquid as deposits, and withdrawals can be made at any time without penalty. LACPIF does not impose a maximum investment limit. The fair value of the Agency’s investment in this pool is reported in the accompanying financial statements at amounts based upon the fair value provided by LACPIF for the Agency’s LACPIF portfolio.

Santa Clarita Valley Water Agency Notes to the Basic Financial Statements, continued
June 30, 2018
21
(2) Cash and Investments, continued
Los Angeles County Pooled Investment Fund, continued
The Agency’s deposit and withdrawal restrictions and limitations are as follows:
Same day transaction processing occurs for orders received before 10:00 a.m. Next day transactions processing occurs for orders received after 10:00 a.m. No limit of transactions (combination of deposits and withdrawals) per month. Minimum transaction amount requirement rounded to the next highest dollar. Prior to funds transfer, an authorized person must complete a deposit or withdrawal form and fax
to LACPIF.
The County of Los Angeles’ bank deposits are either Federally insured or collateralized in accordance with the California Government Code. Pool detail is included in the County of Los Angeles’s Comprehensive Annual Financial Report (CAFR). Copies of the CAFR may be obtained from the County of Los Angeles Auditor-Controller’s Office – 500 West Temple Street – Los Angeles, CA 90012.
Investment in State Investment Pool
The Agency is a voluntary participant in the Local Agency Investment Fund (LAIF) that is regulated by the California Government Code under the oversight of the Treasurer of the State of California. The fair value of the Agency’s investment in this pool is reported in the accompanying financial statements at amounts based upon the Agency’s pro-rata share of the fair value provided by LAIF for the entire LAIF portfolio (in relation to the amortized cost of that portfolio). The balance available for withdrawal is based on the accounting records maintained by LAIF, which are recorded on an amortized cost basis.
The Agency’s deposit and withdrawal restrictions and limitations are as follows:
Same day transaction processing occurs for orders received before 10:00 a.m. Next day transactions processing occurs for orders received after 10:00 a.m. Maximum limit of 15 transactions (combination of deposits and withdrawals) per month. Minimum transaction amount requirement of $5,000, in increments of $1,000 dollars. Withdrawals of $10,000,000 or more require 24 hours advance notice. Prior to funds transfer, an authorized person must call LAIF to do a verbal transaction.
Custodial Credit Risk
Custodial credit risk for deposits is the risk that, in the event of the failure of a depository financial institution, a government will not be able to recover its deposits, or will not be able to recover collateral securities that are in the possession of an outside party.
The custodial credit risk for investments is the risk that, in the event of the failure of the counterparty (e.g., broker-dealer) to a transaction, a government will not be able to recover the value of its investment or collateral securities that are in the possession of another party. With respect to investments, custodial credit risk generally applies only to direct investments in marketable securities. Custodial credit risk does not apply to a local government’s indirect investment in securities through the use of mutual funds or government investment pools (such as LAIF).
The California Government Code and the Agency’s investment policy do not contain legal or policy requirements that would limit the exposure to custodial credit risk for deposits or investments, other than the following provision for deposits: The California Government Code requires that a financial institution secure deposits made by state or local governmental units by pledging securities in an undivided collateral pool held by a depository regulated under state law (unless so waived by the governmental unit).

Santa Clarita Valley Water Agency Notes to the Basic Financial Statements, continued
June 30, 2018
22
(2) Cash and Investments, continued
Custodial Credit Risk, continued
The market value of the pledged securities in the collateral pool must equal at least 110% of the total amount deposited by the public agencies. California law also allows financial institutions to secure Agency deposits by pledging first trust deed mortgage notes having a value of 150% of the secured public deposits. Of the bank balances, up to $250,000 is federally insured, and the remaining balance is collateralized in accordance with the California Government Code; however, the collateralized securities are not held in the Agency’s name.
Interest Rate Risk
Interest rate risk is the risk that changes in market interest rates will adversely affect the fair value of an investment. Generally, the longer the maturity of an investment, the greater the sensitivity of its fair value to changes in market interest rates.
Information about the sensitivity of the fair values of the Agency’s investments to market interest rate fluctuations is provided by the following table that shows the distribution of the Agency’s investments by maturity date at June 30, 2018:
12 Months 13 to 24 25-60Total Or Less Months Months
Federal Farm Credit Bank $ 41,489,337 6,940,752 13,241,037 21,307,548 Federal National Mortgage Association 18,547,310 - - 18,547,310 Federal Home Loan Bank 17,194,214 - 9,818,550 7,375,664 Federal Home Loan Mortgage Corp. 21,555,370 1,998,720 4,887,950 14,668,700 Local Agency Investment Fund (LAIF) 52,345,676 52,345,676 - - Los Angeles County Pooled Investment Fund (LACPIF) 36,600,129 36,600,129 - - Certificates of Deposit 18,660,782 5,775,335 2,957,399 9,928,048 Commercial Paper 2,954,367 2,954,367 - - Money Market Funds 558,565 558,565 - -
Total $ 209,905,750 107,173,544 30,904,936 71,827,270
Remaining Maturity (in Months)
Investment Type
Concentration of Credit Risk
The investment policy of the Agency contains no limitations on the amount that can be invested in any one issuer beyond that stipulated by the California Government Code. Investments in any one issuer (other than for U.S. Treasury securities, mutual funds, and external investment pools) that represent 5% or more of total Agency investments are as follows:
Issuer Amount
Federal Farm Credit Bank Federal agency securities $ 41,489,337 Federal National Mortgage Association Federal agency securities 18,547,310 Federal Home Loan Bank Federal agency securities 17,194,214 Federal Home Loan Mortgage Corp. Federal agency securities 21,555,370
$ 98,786,231
Investment type
Santa Clarita Valley Water Agency Notes to the Basic Financial Statements, continued
June 30, 2018
23
(2) Cash and Investments, continued
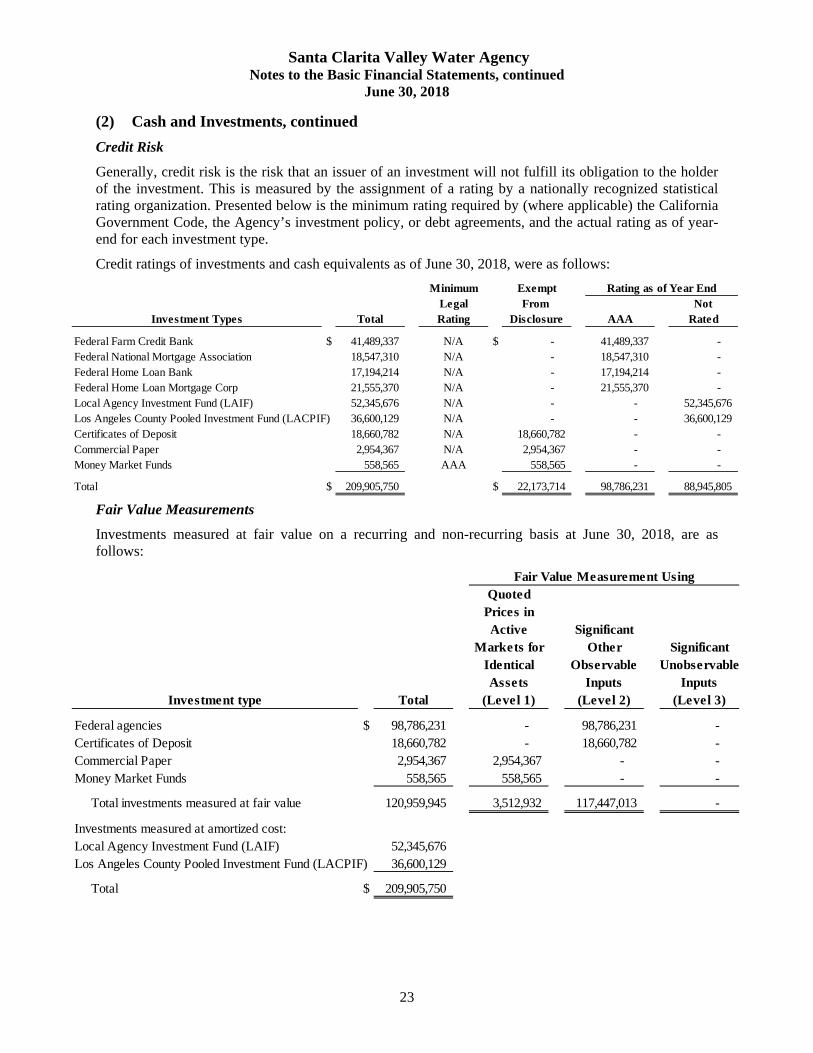
Credit Risk
Generally, credit risk is the risk that an issuer of an investment will not fulfill its obligation to the holder of the investment. This is measured by the assignment of a rating by a nationally recognized statistical rating organization. Presented below is the minimum rating required by (where applicable) the California Government Code, the Agency’s investment policy, or debt agreements, and the actual rating as of year- end for each investment type.
Credit ratings of investments and cash equivalents as of June 30, 2018, were as follows:
Minimum ExemptLegal From Not
Total Rating Disclosure AAA Rated
Federal Farm Credit Bank $ 41,489,337 N/A $ - 41,489,337 - Federal National Mortgage Association 18,547,310 N/A - 18,547,310 - Federal Home Loan Bank 17,194,214 N/A - 17,194,214 - Federal Home Loan Mortgage Corp 21,555,370 N/A - 21,555,370 - Local Agency Investment Fund (LAIF) 52,345,676 N/A - - 52,345,676 Los Angeles County Pooled Investment Fund (LACPIF) 36,600,129 N/A - - 36,600,129 Certificates of Deposit 18,660,782 N/A 18,660,782 - - Commercial Paper 2,954,367 N/A 2,954,367 - - Money Market Funds 558,565 AAA 558,565 - -
Total $ 209,905,750 $ 22,173,714 98,786,231 88,945,805
Rating as of Year End
Investment Types
Fair Value Measurements
Investments measured at fair value on a recurring and non-recurring basis at June 30, 2018, are as follows:
QuotedPrices inActive Significant
Markets for Other SignificantIdentical Observable UnobservableAssets Inputs Inputs
Investment type Total (Level 1) (Level 2) (Level 3)
Federal agencies $ 98,786,231 - 98,786,231 - Certificates of Deposit 18,660,782 - 18,660,782 - Commercial Paper 2,954,367 2,954,367 - - Money Market Funds 558,565 558,565 - -
Total investments measured at fair value 120,959,945 3,512,932 117,447,013 -
Investments measured at amortized cost:Local Agency Investment Fund (LAIF) 52,345,676 Los Angeles County Pooled Investment Fund (LACPIF) 36,600,129
Total $ 209,905,750
Fair Value Measurement Using
Santa Clarita Valley Water Agency Notes to the Basic Financial Statements, continued
June 30, 2018
24
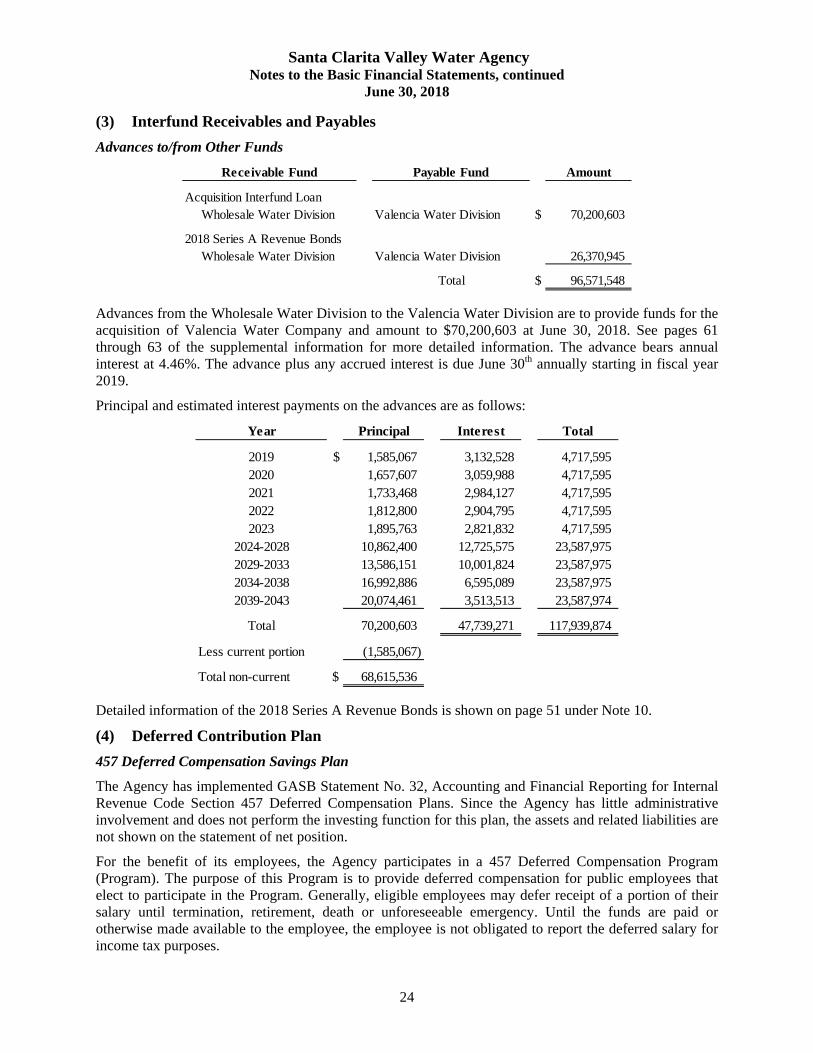
(3) Interfund Receivables and Payables
Advances to/from Other Funds
Payable Fund Amount
Acquisition Interfund LoanWholesale Water Division Valencia Water Division $ 70,200,603
2018 Series A Revenue BondsWholesale Water Division Valencia Water Division 26,370,945
Total $ 96,571,548
Receivable Fund
Advances from the Wholesale Water Division to the Valencia Water Division are to provide funds for the acquisition of Valencia Water Company and amount to $70,200,603 at June 30, 2018. See pages 61 through 63 of the supplemental information for more detailed information. The advance bears annual interest at 4.46%. The advance plus any accrued interest is due June 30th annually starting in fiscal year 2019.
Principal and estimated interest payments on the advances are as follows:
Year Principal Interest Total
2019 $ 1,585,067 3,132,528 4,717,595 2020 1,657,607 3,059,988 4,717,595 2021 1,733,468 2,984,127 4,717,595 2022 1,812,800 2,904,795 4,717,595 2023 1,895,763 2,821,832 4,717,595
2024-2028 10,862,400 12,725,575 23,587,975 2029-2033 13,586,151 10,001,824 23,587,975 2034-2038 16,992,886 6,595,089 23,587,975 2039-2043 20,074,461 3,513,513 23,587,974
Total 70,200,603 47,739,271 117,939,874
Less current portion (1,585,067)
Total non-current $ 68,615,536
Detailed information of the 2018 Series A Revenue Bonds is shown on page 51 under Note 10.
(4) Deferred Contribution Plan
457 Deferred Compensation Savings Plan
The Agency has implemented GASB Statement No. 32, Accounting and Financial Reporting for Internal Revenue Code Section 457 Deferred Compensation Plans. Since the Agency has little administrative involvement and does not perform the investing function for this plan, the assets and related liabilities are not shown on the statement of net position.
For the benefit of its employees, the Agency participates in a 457 Deferred Compensation Program (Program). The purpose of this Program is to provide deferred compensation for public employees that elect to participate in the Program. Generally, eligible employees may defer receipt of a portion of their salary until termination, retirement, death or unforeseeable emergency. Until the funds are paid or otherwise made available to the employee, the employee is not obligated to report the deferred salary for income tax purposes.
Santa Clarita Valley Water Agency Notes to the Basic Financial Statements, continued
June 30, 2018
25
(4) Deferred Contribution Plan, continued
457 Deferred Compensation Savings Plan, continued
Federal law requires deferred compensation assets to be held in trust for the exclusive benefit of the participants. Accordingly, the Agency is in compliance with this legislation. Therefore, these assets are not the legal property of the Agency, and are not subject to claims of the Agency’s general creditors. Market value of all plan assets held in trust by Lincoln Financial Services at June 30, 2018, was $17,025,514.
401(a) Defined Benefit Plan
For the benefit of its employees, the Agency participates in a 401(a) Retirement Plan Program. The purpose of this 401(a) Plan is to provide a retirement benefit for public employees who fully contribute to their 457 Program. Generally, the Agency will match up to a certain amount for employees who fully contribute to their 457 Plan for the year. Until the funds are paid or otherwise made available to the employee, the employee is not obligated to report the retirement benefit for income tax purposes.
Federal law requires defined benefit assets to be held in trust for the exclusive benefit of the participants. Accordingly, the Agency is in compliance with this legislation. Therefore, these assets are not the legal property of the Agency, and are not subject to claims of the Agency’s general creditors. Market value of all plan assets held in trust by Lincoln Financial Services at June 30, 2018, was $848,628.
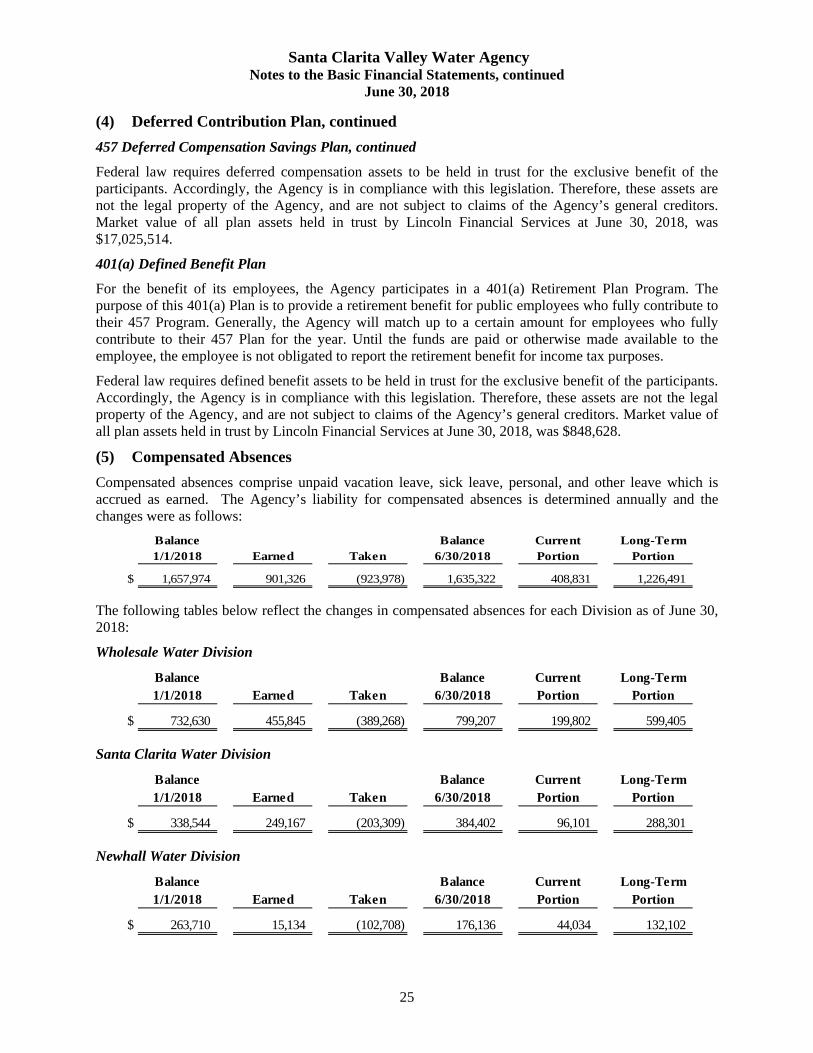
(5) Compensated Absences
Compensated absences comprise unpaid vacation leave, sick leave, personal, and other leave which is accrued as earned. The Agency’s liability for compensated absences is determined annually and the changes were as follows:
Balance Balance Current Long-Term1/1/2018 Earned Taken 6/30/2018 Portion Portion
$ 1,657,974 901,326 (923,978) 1,635,322 408,831 1,226,491
The following tables below reflect the changes in compensated absences for each Division as of June 30, 2018:
Wholesale Water Division
Balance Balance Current Long-Term1/1/2018 Earned Taken 6/30/2018 Portion Portion
$ 732,630 455,845 (389,268) 799,207 199,802 599,405
Santa Clarita Water Division
Balance Balance Current Long-Term1/1/2018 Earned Taken 6/30/2018 Portion Portion
$ 338,544 249,167 (203,309) 384,402 96,101 288,301
Newhall Water Division
Balance Balance Current Long-Term1/1/2018 Earned Taken 6/30/2018 Portion Portion
$ 263,710 15,134 (102,708) 176,136 44,034 132,102

Santa Clarita Valley Water Agency Notes to the Basic Financial Statements, continued
June 30, 2018
26
(5) Compensated Absences, continued
Valencia Water Division
Balance Balance Current Long-Term1/23/2018 Earned Taken 6/30/2018 Portion Portion
$ 323,090 181,180 (228,693) 275,577 68,894 206,683
(6) Transfer of Operations
The Agency has recognized the following assets, deferred outflows of resources, liabilities, and deferred inflows of resources, and net position:
NewhallCastaic Lake CountyWater Agency Water District Total
Assets:Current assets $ 218,295,683 10,699,964 228,995,647 Capital assets 651,798,770 80,899,896 732,698,666 Non-current assets 105,322,744 208,220 105,530,964
Total assets 975,417,197 91,808,080 1,067,225,277
Deferred outflows of resources 6,906,332 1,001,853 7,908,185
Liabilities:Current liabilities 47,062,153 3,303,951 50,366,104 Non-current liabilities 427,942,717 9,850,469 437,793,186
Total liabilities 475,004,870 13,154,420 488,159,290
Deferred inflows of resources 347,744 270,607 618,351
Net position:Net investment in capital assets 292,189,911 76,724,489 368,914,400 Restricted 86,900,027 - 86,900,027 Unrestricted 127,880,977 2,660,417 130,541,394
Total net position $ 506,970,915 79,384,906 586,355,821
Carrying Values
(7) Capital Assets
Changes in capital assets for the six month period June 30, 2018 were as follows:
Balance Additions/ Deletions/ Balance1/1/2018 Transfers Transfers 6/30/2018
Santa Clarita Valley Water AgencyCapital assets, not being depreciated
Non-depreciable assets $ 94,804,849 15,332,604 (9,126,537) 101,010,916
Capital assets, net - being depreciatedDepreciable assets 1,058,720,406 14,833,183 (746,078) 1,072,807,511 Accumulated depreciation and amortization (421,034,808) (16,880,897) 746,078 (437,169,627)
Subtotal 637,685,598 (2,047,714) - 635,637,884
Total capital assets, net $ 732,490,447 13,284,890 (9,126,537) 736,648,800
Santa Clarita Valley Water Agency Notes to the Basic Financial Statements, continued
June 30, 2018
27
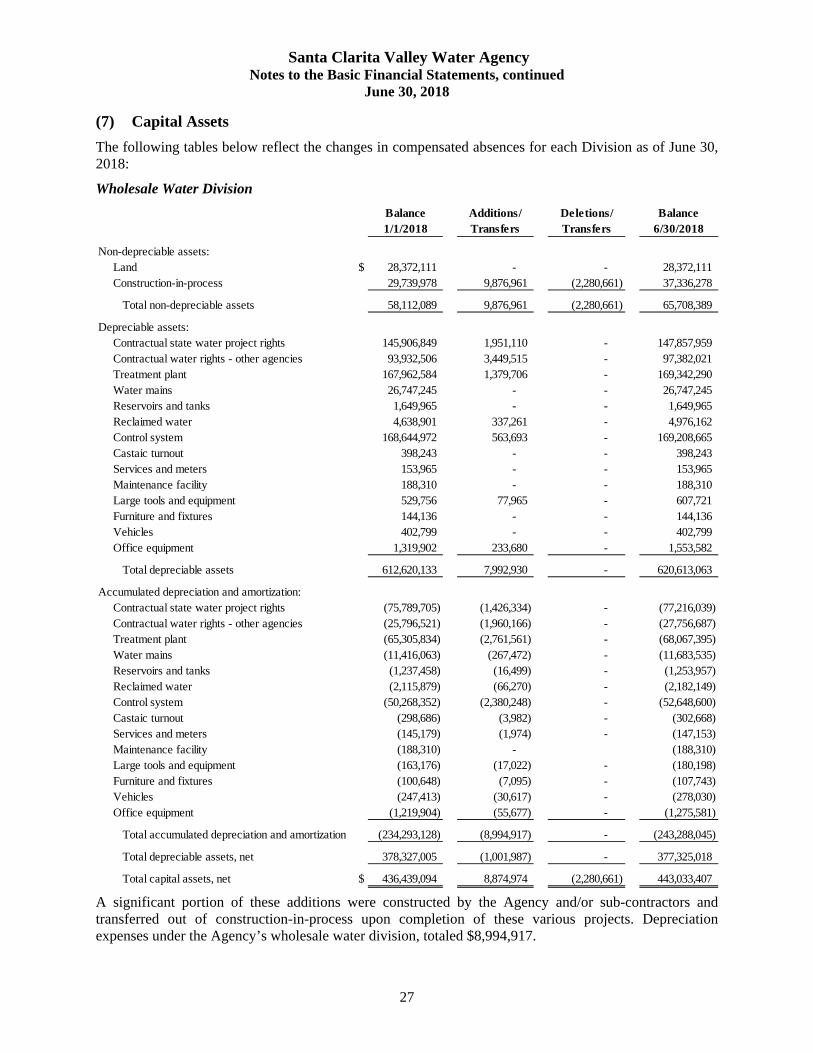
(7) Capital Assets
The following tables below reflect the changes in compensated absences for each Division as of June 30, 2018:
Wholesale Water Division
Balance Additions/ Deletions/ Balance1/1/2018 Transfers Transfers 6/30/2018
Non-depreciable assets:Land $ 28,372,111 - - 28,372,111 Construction-in-process 29,739,978 9,876,961 (2,280,661) 37,336,278
Total non-depreciable assets 58,112,089 9,876,961 (2,280,661) 65,708,389
Depreciable assets:Contractual state water project rights 145,906,849 1,951,110 - 147,857,959 Contractual water rights - other agencies 93,932,506 3,449,515 - 97,382,021 Treatment plant 167,962,584 1,379,706 - 169,342,290 Water mains 26,747,245 - - 26,747,245 Reservoirs and tanks 1,649,965 - - 1,649,965 Reclaimed water 4,638,901 337,261 - 4,976,162 Control system 168,644,972 563,693 - 169,208,665 Castaic turnout 398,243 - - 398,243 Services and meters 153,965 - - 153,965 Maintenance facility 188,310 - - 188,310 Large tools and equipment 529,756 77,965 - 607,721 Furniture and fixtures 144,136 - - 144,136 Vehicles 402,799 - - 402,799 Office equipment 1,319,902 233,680 - 1,553,582
Total depreciable assets 612,620,133 7,992,930 - 620,613,063
Accumulated depreciation and amortization:Contractual state water project rights (75,789,705) (1,426,334) - (77,216,039) Contractual water rights - other agencies (25,796,521) (1,960,166) - (27,756,687) Treatment plant (65,305,834) (2,761,561) - (68,067,395) Water mains (11,416,063) (267,472) - (11,683,535) Reservoirs and tanks (1,237,458) (16,499) - (1,253,957) Reclaimed water (2,115,879) (66,270) - (2,182,149) Control system (50,268,352) (2,380,248) - (52,648,600) Castaic turnout (298,686) (3,982) - (302,668) Services and meters (145,179) (1,974) - (147,153) Maintenance facility (188,310) - (188,310) Large tools and equipment (163,176) (17,022) - (180,198) Furniture and fixtures (100,648) (7,095) - (107,743) Vehicles (247,413) (30,617) - (278,030) Office equipment (1,219,904) (55,677) - (1,275,581)
Total accumulated depreciation and amortization (234,293,128) (8,994,917) - (243,288,045)
Total depreciable assets, net 378,327,005 (1,001,987) - 377,325,018
Total capital assets, net $ 436,439,094 8,874,974 (2,280,661) 443,033,407
A significant portion of these additions were constructed by the Agency and/or sub-contractors and transferred out of construction-in-process upon completion of these various projects. Depreciation expenses under the Agency’s wholesale water division, totaled $8,994,917.
Santa Clarita Valley Water Agency Notes to the Basic Financial Statements, continued
June 30, 2018
28
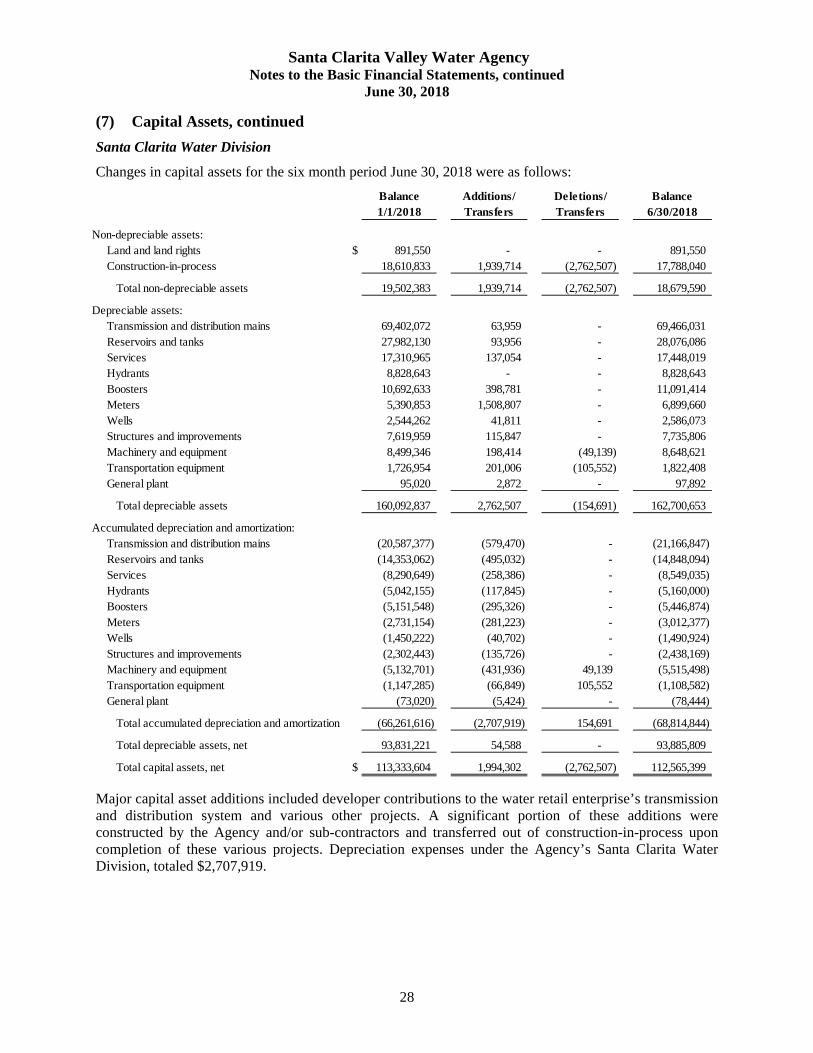
(7) Capital Assets, continued
Santa Clarita Water Division
Changes in capital assets for the six month period June 30, 2018 were as follows:
Balance Additions/ Deletions/ Balance1/1/2018 Transfers Transfers 6/30/2018
Non-depreciable assets:Land and land rights $ 891,550 - - 891,550 Construction-in-process 18,610,833 1,939,714 (2,762,507) 17,788,040
Total non-depreciable assets 19,502,383 1,939,714 (2,762,507) 18,679,590
Depreciable assets:Transmission and distribution mains 69,402,072 63,959 - 69,466,031 Reservoirs and tanks 27,982,130 93,956 - 28,076,086 Services 17,310,965 137,054 - 17,448,019 Hydrants 8,828,643 - - 8,828,643 Boosters 10,692,633 398,781 - 11,091,414 Meters 5,390,853 1,508,807 - 6,899,660 Wells 2,544,262 41,811 - 2,586,073 Structures and improvements 7,619,959 115,847 - 7,735,806 Machinery and equipment 8,499,346 198,414 (49,139) 8,648,621 Transportation equipment 1,726,954 201,006 (105,552) 1,822,408 General plant 95,020 2,872 - 97,892
Total depreciable assets 160,092,837 2,762,507 (154,691) 162,700,653
Accumulated depreciation and amortization:Transmission and distribution mains (20,587,377) (579,470) - (21,166,847) Reservoirs and tanks (14,353,062) (495,032) - (14,848,094) Services (8,290,649) (258,386) - (8,549,035) Hydrants (5,042,155) (117,845) - (5,160,000) Boosters (5,151,548) (295,326) - (5,446,874) Meters (2,731,154) (281,223) - (3,012,377) Wells (1,450,222) (40,702) - (1,490,924) Structures and improvements (2,302,443) (135,726) - (2,438,169) Machinery and equipment (5,132,701) (431,936) 49,139 (5,515,498) Transportation equipment (1,147,285) (66,849) 105,552 (1,108,582) General plant (73,020) (5,424) - (78,444)
Total accumulated depreciation and amortization (66,261,616) (2,707,919) 154,691 (68,814,844)
Total depreciable assets, net 93,831,221 54,588 - 93,885,809
Total capital assets, net $ 113,333,604 1,994,302 (2,762,507) 112,565,399
Major capital asset additions included developer contributions to the water retail enterprise’s transmission and distribution system and various other projects. A significant portion of these additions were constructed by the Agency and/or sub-contractors and transferred out of construction-in-process upon completion of these various projects. Depreciation expenses under the Agency’s Santa Clarita Water Division, totaled $2,707,919.
Santa Clarita Valley Water Agency Notes to the Basic Financial Statements, continued
June 30, 2018
29
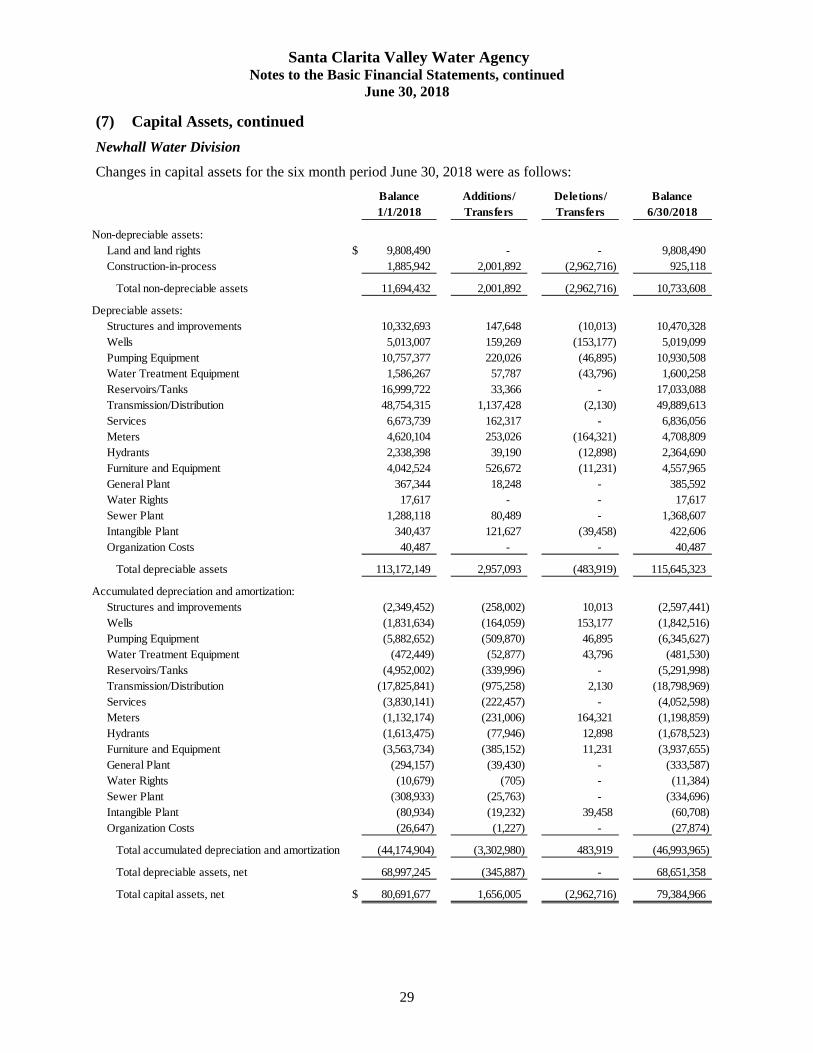
(7) Capital Assets, continued
Newhall Water Division
Changes in capital assets for the six month period June 30, 2018 were as follows:
Balance Additions/ Deletions/ Balance1/1/2018 Transfers Transfers 6/30/2018
Non-depreciable assets:Land and land rights $ 9,808,490 - - 9,808,490 Construction-in-process 1,885,942 2,001,892 (2,962,716) 925,118
Total non-depreciable assets 11,694,432 2,001,892 (2,962,716) 10,733,608
Depreciable assets:Structures and improvements 10,332,693 147,648 (10,013) 10,470,328 Wells 5,013,007 159,269 (153,177) 5,019,099 Pumping Equipment 10,757,377 220,026 (46,895) 10,930,508 Water Treatment Equipment 1,586,267 57,787 (43,796) 1,600,258 Reservoirs/Tanks 16,999,722 33,366 - 17,033,088 Transmission/Distribution 48,754,315 1,137,428 (2,130) 49,889,613 Services 6,673,739 162,317 - 6,836,056 Meters 4,620,104 253,026 (164,321) 4,708,809 Hydrants 2,338,398 39,190 (12,898) 2,364,690 Furniture and Equipment 4,042,524 526,672 (11,231) 4,557,965 General Plant 367,344 18,248 - 385,592 Water Rights 17,617 - - 17,617 Sewer Plant 1,288,118 80,489 - 1,368,607 Intangible Plant 340,437 121,627 (39,458) 422,606 Organization Costs 40,487 - - 40,487
Total depreciable assets 113,172,149 2,957,093 (483,919) 115,645,323
Accumulated depreciation and amortization:Structures and improvements (2,349,452) (258,002) 10,013 (2,597,441) Wells (1,831,634) (164,059) 153,177 (1,842,516) Pumping Equipment (5,882,652) (509,870) 46,895 (6,345,627) Water Treatment Equipment (472,449) (52,877) 43,796 (481,530) Reservoirs/Tanks (4,952,002) (339,996) - (5,291,998) Transmission/Distribution (17,825,841) (975,258) 2,130 (18,798,969) Services (3,830,141) (222,457) - (4,052,598) Meters (1,132,174) (231,006) 164,321 (1,198,859) Hydrants (1,613,475) (77,946) 12,898 (1,678,523) Furniture and Equipment (3,563,734) (385,152) 11,231 (3,937,655) General Plant (294,157) (39,430) - (333,587) Water Rights (10,679) (705) - (11,384) Sewer Plant (308,933) (25,763) - (334,696) Intangible Plant (80,934) (19,232) 39,458 (60,708) Organization Costs (26,647) (1,227) - (27,874)
Total accumulated depreciation and amortization (44,174,904) (3,302,980) 483,919 (46,993,965)
Total depreciable assets, net 68,997,245 (345,887) - 68,651,358
Total capital assets, net $ 80,691,677 1,656,005 (2,962,716) 79,384,966

Santa Clarita Valley Water Agency Notes to the Basic Financial Statements, continued
June 30, 2018
30
(7) Capital Assets, continued
Newhall Water Division, continued
Major capital asset additions included developer contributions to the division’s transmission and distribution system and various other projects. A significant portion of these additions were constructed by the Agency and/or sub-contractors and transferred out of construction-in-process upon completion of these various projects. Depreciation expenses under the Newhall Water Division, totaled $3,302,980.
Valencia Water Division
Changes in capital assets for the six month period June 30, 2018 were as follows:
Balance Additions/ Deletions/ Balance1/23/2018 Transfers Transfers 6/30/2018
Non-depreciable assets:Land $ 1,366,286 - - 1,366,286 Construction-in-process 4,129,659 1,514,037 (1,120,653) 4,523,043
Total non-depreciable assets 5,495,945 1,514,037 (1,120,653) 5,889,329
Depreciable assets:Plant 115,351 - - 115,351 Building 2,442,894 70,356 - 2,513,250 Wells 11,091,277 174,514 - 11,265,791 Pumping plant 9,232,170 44,921 - 9,277,091 Reservoirs & tanks 27,460,772 15,616 - 27,476,388 T & D mains 81,859,348 156,287 - 82,015,635 Services 14,203,824 153,419 - 14,357,243 Meters 8,944,761 425,229 (107,468) 9,262,522 Hydrants 10,984,788 - - 10,984,788 Other T & D plant 18,505 - - 18,505 Office furniture & equipment 2,617,997 80,311 - 2,698,308 Transportation equipment 44,550 - - 44,550 Other equipment 3,819,050 - - 3,819,050
Total depreciable assets 172,835,287 1,120,653 (107,468) 173,848,472
Accumulated depreciation and amortization:Accumulated depreciation (76,305,160) (1,875,081) 107,468 (78,072,773)
Total accumulated depreciation and amortization (76,305,160) (1,875,081) 107,468 (78,072,773)
Total depreciable assets, net 96,530,127 (754,428) - 95,775,699
Total capital assets, net $ 102,026,072 759,609 (1,120,653) 101,665,028
Major capital asset additions in the business-type activities area included developer contributions to the water retail enterprise’s transmission and distribution system and various other projects. A significant portion of these additions were constructed by the Agency and/or sub-contractors and transferred out of construction-in-process upon completion of these various projects. Depreciation expenses under the Valencia Water Division, totaled $1,875,081.
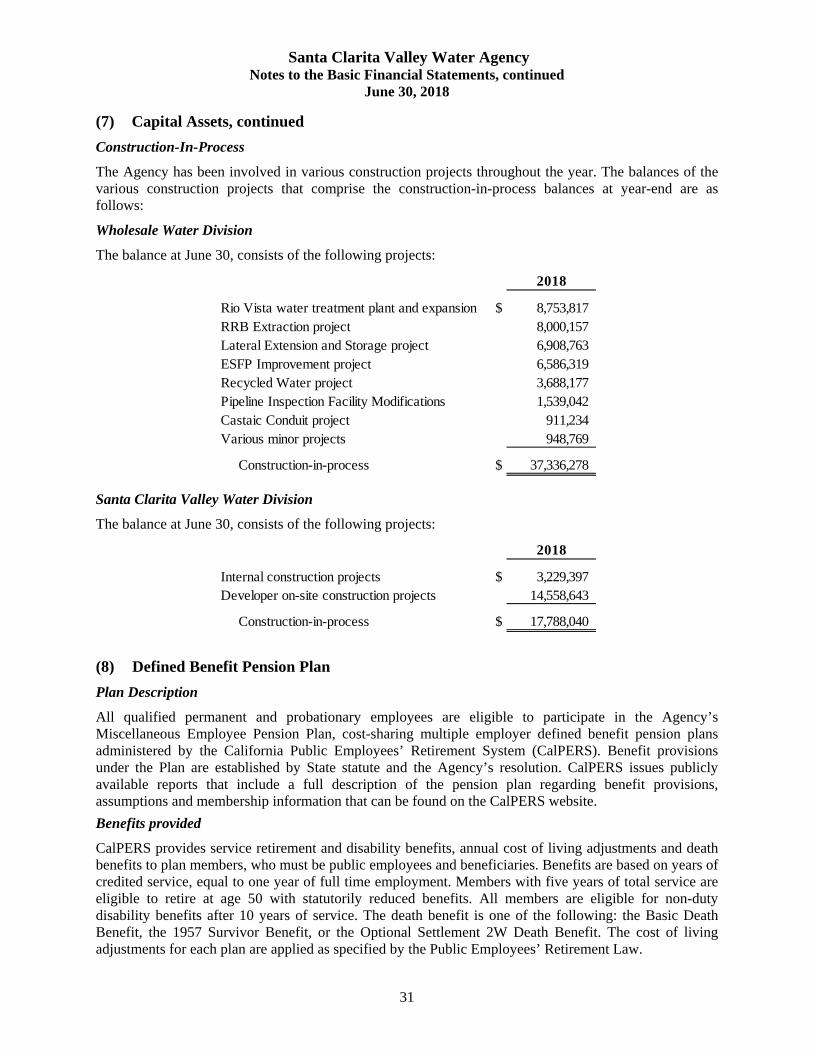
Santa Clarita Valley Water Agency Notes to the Basic Financial Statements, continued
June 30, 2018
31
(7) Capital Assets, continued
Construction-In-Process
The Agency has been involved in various construction projects throughout the year. The balances of the various construction projects that comprise the construction-in-process balances at year-end are as follows:
Wholesale Water Division
The balance at June 30, consists of the following projects:
2018
Rio Vista water treatment plant and expansion $ 8,753,817 RRB Extraction project 8,000,157 Lateral Extension and Storage project 6,908,763 ESFP Improvement project 6,586,319 Recycled Water project 3,688,177 Pipeline Inspection Facility Modifications 1,539,042 Castaic Conduit project 911,234 Various minor projects 948,769
Construction-in-process $ 37,336,278
Santa Clarita Valley Water Division
The balance at June 30, consists of the following projects:
2018
Internal construction projects $ 3,229,397 Developer on-site construction projects 14,558,643
Construction-in-process $ 17,788,040
(8) Defined Benefit Pension Plan
Plan Description
All qualified permanent and probationary employees are eligible to participate in the Agency’s Miscellaneous Employee Pension Plan, cost-sharing multiple employer defined benefit pension plans administered by the California Public Employees’ Retirement System (CalPERS). Benefit provisions under the Plan are established by State statute and the Agency’s resolution. CalPERS issues publicly available reports that include a full description of the pension plan regarding benefit provisions, assumptions and membership information that can be found on the CalPERS website.
Benefits provided
CalPERS provides service retirement and disability benefits, annual cost of living adjustments and death benefits to plan members, who must be public employees and beneficiaries. Benefits are based on years of credited service, equal to one year of full time employment. Members with five years of total service are eligible to retire at age 50 with statutorily reduced benefits. All members are eligible for non-duty disability benefits after 10 years of service. The death benefit is one of the following: the Basic Death Benefit, the 1957 Survivor Benefit, or the Optional Settlement 2W Death Benefit. The cost of living adjustments for each plan are applied as specified by the Public Employees’ Retirement Law.

Santa Clarita Valley Water Agency Notes to the Basic Financial Statements, continued
June 30, 2018
32
(8) Defined Benefit Pension Plan, continued
Benefits Provided, continued
On September 12, 2012, the California Governor signed the California Public Employees' Pension Reform Act of 2013 (PEPRA) into law. PEPRA took effect January 1, 2013. The new legislation closed the Agency’s CalPERS 2.5% at 55 Risk Pool Retirement Plan to new employee entrants effective December 31, 2013. All employees hired after January 1, 2013 are eligible for the Agency’s CalPERS 2.0% at 62 Retirement Plan under PEPRA.
The following plan groups are as follows:
Classic Members - employees hired before January 1, 2013, are enrolled in the CalPERS Local Miscellaneous 2% at 55 Plan.
New Members - in accordance with the PEPRA, employees hired on or after January 1, 2013, are enrolled in the CalPERS Local Miscellaneous 2% at 62 Plan.
The Plan’s provisions and benefits in effect at June 30, 2018, are summarized as follows:
Classic PEPRA
Benefit formula 2% @ 55 2.0% @ 62Benefit vesting scheduleBenefit paymentsRetirement age 50 - 55 52 - 62Monthly benefits, as a % of eligible compensation 1.426% to 2.418% 1.0% to 2.5%Required employee contribution rates 7.00% 6.50%Required employer contribution rates 9.599% 6.908%
Monthly for life
Miscellaneous Pool
Hire date
Prior to January 1,
2011
On or after January 1,
2013
5 years of service
Contributions
Section 20814(c) of the California Public Employees’ Retirement Law requires that the employer contribution rates for all public employers be determined on an annual basis by the actuary and shall be effective on the July 1 following notice of change in the rate. Funding contributions for both Plans are determined annually on actuarial basis as of June 30 by CalPERS. The actuarially determined rate is the estimated amount necessary to finance the costs of benefits earned by employees during the year, with an additional amount to finance any unfunded accrued liability. The Agency is required to contribute the difference between the actuarially determined rate and the contribution rate of employees.
For the six month period ended June 30, 2018, the contributions recognized as part of pension expense for the Plan were as follows:
2018
Contributions – employer $ 821,817
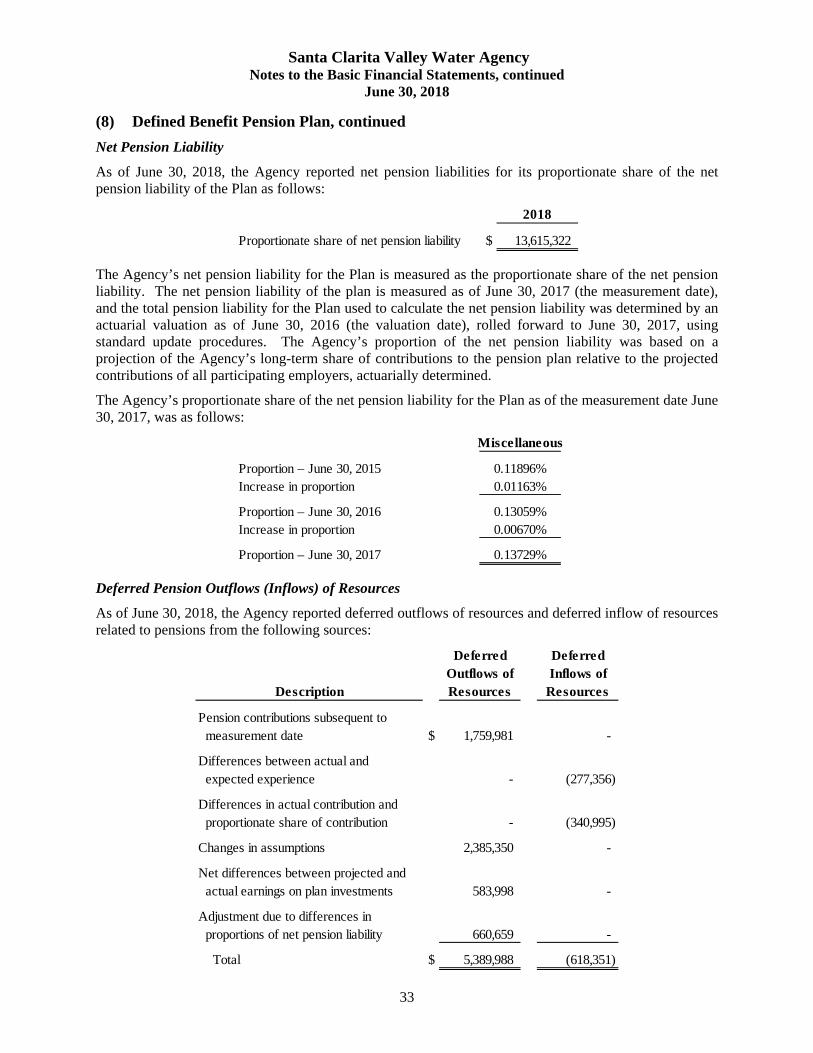
Santa Clarita Valley Water Agency Notes to the Basic Financial Statements, continued
June 30, 2018
33
(8) Defined Benefit Pension Plan, continued
Net Pension Liability
As of June 30, 2018, the Agency reported net pension liabilities for its proportionate share of the net pension liability of the Plan as follows:
2018
Proportionate share of net pension liability $ 13,615,322
The Agency’s net pension liability for the Plan is measured as the proportionate share of the net pension liability. The net pension liability of the plan is measured as of June 30, 2017 (the measurement date), and the total pension liability for the Plan used to calculate the net pension liability was determined by an actuarial valuation as of June 30, 2016 (the valuation date), rolled forward to June 30, 2017, using standard update procedures. The Agency’s proportion of the net pension liability was based on a projection of the Agency’s long-term share of contributions to the pension plan relative to the projected contributions of all participating employers, actuarially determined.
The Agency’s proportionate share of the net pension liability for the Plan as of the measurement date June 30, 2017, was as follows:
Miscellaneous
Proportion – June 30, 2015 0.11896%Increase in proportion 0.01163%
Proportion – June 30, 2016 0.13059%Increase in proportion 0.00670%
Proportion – June 30, 2017 0.13729%
Deferred Pension Outflows (Inflows) of Resources
As of June 30, 2018, the Agency reported deferred outflows of resources and deferred inflow of resources related to pensions from the following sources:
Deferred DeferredOutflows of Inflows of
Description Resources Resources
Pension contributions subsequent to measurement date $ 1,759,981 -
Differences between actual and expected experience - (277,356)
Differences in actual contribution and proportionate share of contribution - (340,995)
Changes in assumptions 2,385,350 -
Net differences between projected and actual earnings on plan investments 583,998 -
Adjustment due to differences in proportions of net pension liability 660,659 -
Total $ 5,389,988 (618,351)

Santa Clarita Valley Water Agency Notes to the Basic Financial Statements, continued
June 30, 2018
34
(8) Defined Benefit Pension Plan, continued
Deferred Pension Outflows (Inflows) of Resources, continued
As of June 30, 2018, employer pension contributions reported as deferred outflows of resources related to contributions subsequent to the measurement date of $1,759,981, and will be recognized as a reduction of the net pension liability in the fiscal year ended June 30, 2019.
At June 30, 2018, other amounts reported as deferred outflows of resources and deferred inflows of resources related to pensions will be recognized as pension expense as follows.
Fiscal Year Ending June
30:
Deferred Outflows/
(Inflows) of Resources
2019 $ 724,734 2020 1,633,181 2021 1,018,140 2022 (364,739)
Actuarial Assumptions
The total pension liabilities were determined by actuarial valuation reports as of June 30, 2016, which were rolled forward to June 30, 2017, using the following actuarial assumptions:
Valuation Date June 30, 2016Measurement Date June 30, 2017Actuarial cost method Entry Age Normal in accordance with the requirements
of GASB Statement No. 68
Actuarial assumptions: Discount rate Inflation Salary increases Varies by Entry Age and Service Investment Rate of Return 7.50 % Net of Pension Plan Investment and
Administrative Expenses; includes inflation Mortality Rate Table* Derived using CalPERS' Membership Data for all Funds Post Retirement Benefit Contract COLA up to 2.75% until Purchasing Power
Protection Allowance Floor on Purchasing Power applies, 2.75% thereafter
7.15%2.75%
* The mortality rate used was developed based on CalPERS' specific data. The mortality rate includes 20 years of mortality improvements using Society of Actuaries Scale BB. For more details on mortality rate, please refer to the 2014 Experience Study report. Further details of the Experience Study can be found on the CalPERS website.
Discount rate
The discount rates used in the actuarial valuations to measure the total pension liability as of June 30, 2017, reflect the long-term expected rates of return. The discount rates used to measure the total pension liability as of June 30, 2017, was 7.15%. These differ from the discount rates used as of June 30, 2016, which was 7.65%, due to a decrease in the long-term expected rate of return.
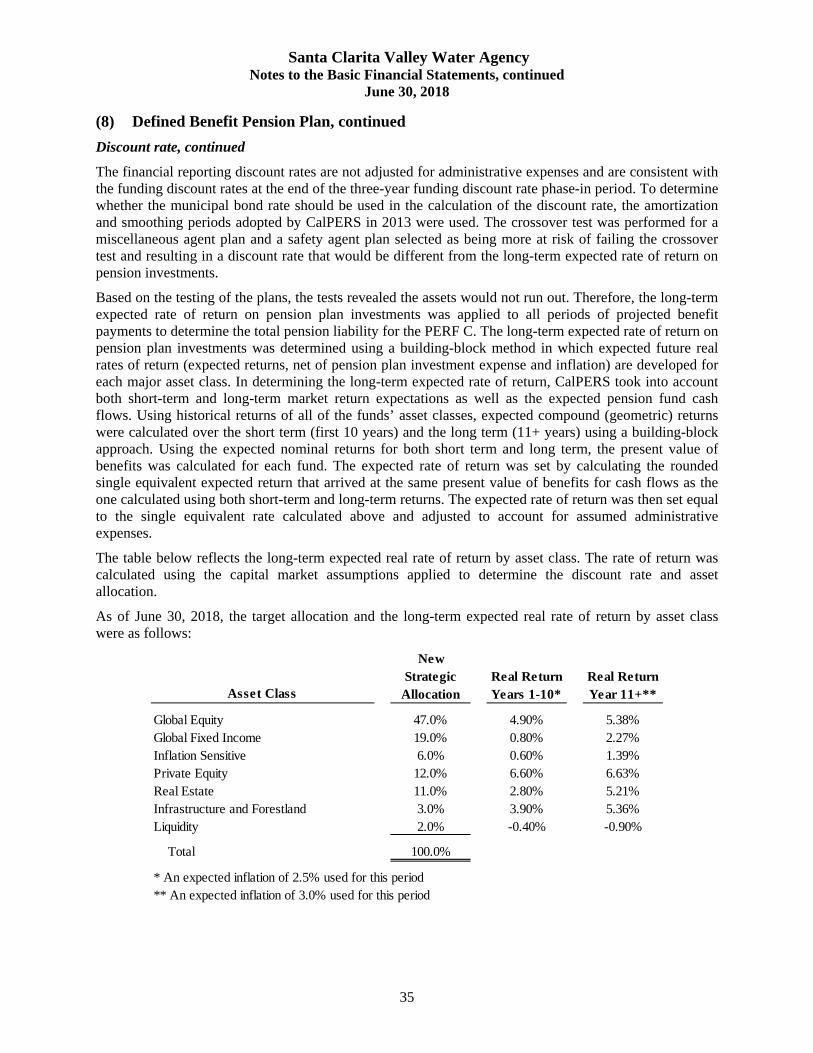
Santa Clarita Valley Water Agency Notes to the Basic Financial Statements, continued
June 30, 2018
35
(8) Defined Benefit Pension Plan, continued
Discount rate, continued
The financial reporting discount rates are not adjusted for administrative expenses and are consistent with the funding discount rates at the end of the three-year funding discount rate phase-in period. To determine whether the municipal bond rate should be used in the calculation of the discount rate, the amortization and smoothing periods adopted by CalPERS in 2013 were used. The crossover test was performed for a miscellaneous agent plan and a safety agent plan selected as being more at risk of failing the crossover test and resulting in a discount rate that would be different from the long-term expected rate of return on pension investments.
Based on the testing of the plans, the tests revealed the assets would not run out. Therefore, the long-term expected rate of return on pension plan investments was applied to all periods of projected benefit payments to determine the total pension liability for the PERF C. The long-term expected rate of return on pension plan investments was determined using a building-block method in which expected future real rates of return (expected returns, net of pension plan investment expense and inflation) are developed for each major asset class. In determining the long-term expected rate of return, CalPERS took into account both short-term and long-term market return expectations as well as the expected pension fund cash flows. Using historical returns of all of the funds’ asset classes, expected compound (geometric) returns were calculated over the short term (first 10 years) and the long term (11+ years) using a building-block approach. Using the expected nominal returns for both short term and long term, the present value of benefits was calculated for each fund. The expected rate of return was set by calculating the rounded single equivalent expected return that arrived at the same present value of benefits for cash flows as the one calculated using both short-term and long-term returns. The expected rate of return was then set equal to the single equivalent rate calculated above and adjusted to account for assumed administrative expenses.
The table below reflects the long-term expected real rate of return by asset class. The rate of return was calculated using the capital market assumptions applied to determine the discount rate and asset allocation.
As of June 30, 2018, the target allocation and the long-term expected real rate of return by asset class were as follows:
NewStrategic Real Return Real Return
Asset Class Allocation Years 1-10* Year 11+**
Global Equity 47.0% 4.90% 5.38%Global Fixed Income 19.0% 0.80% 2.27%Inflation Sensitive 6.0% 0.60% 1.39%Private Equity 12.0% 6.60% 6.63%Real Estate 11.0% 2.80% 5.21%Infrastructure and Forestland 3.0% 3.90% 5.36%Liquidity 2.0% -0.40% -0.90%
Total 100.0%
* An expected inflation of 2.5% used for this period** An expected inflation of 3.0% used for this period
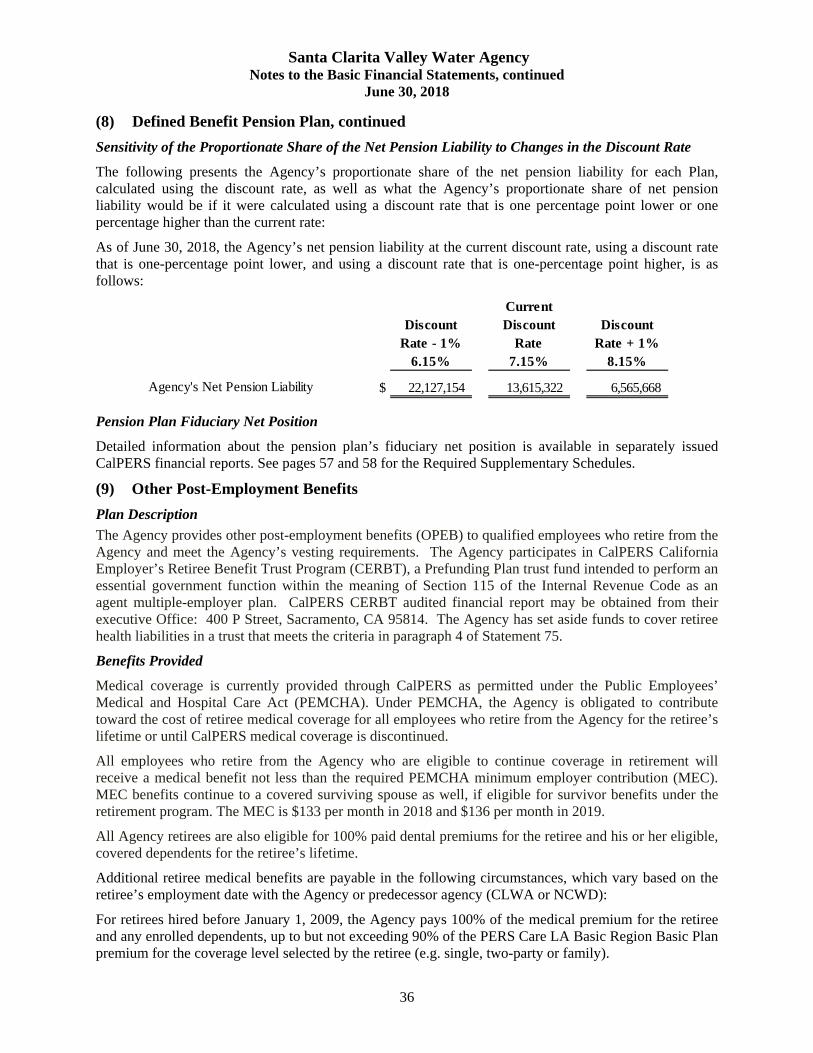
Santa Clarita Valley Water Agency Notes to the Basic Financial Statements, continued
June 30, 2018
36
(8) Defined Benefit Pension Plan, continued
Sensitivity of the Proportionate Share of the Net Pension Liability to Changes in the Discount Rate
The following presents the Agency’s proportionate share of the net pension liability for each Plan, calculated using the discount rate, as well as what the Agency’s proportionate share of net pension liability would be if it were calculated using a discount rate that is one percentage point lower or one percentage higher than the current rate:
As of June 30, 2018, the Agency’s net pension liability at the current discount rate, using a discount rate that is one-percentage point lower, and using a discount rate that is one-percentage point higher, is as follows:
CurrentDiscount Discount Discount
Rate - 1% Rate Rate + 1%6.15% 7.15% 8.15%
Agency's Net Pension Liability $ 22,127,154 13,615,322 6,565,668
Pension Plan Fiduciary Net Position
Detailed information about the pension plan’s fiduciary net position is available in separately issued CalPERS financial reports. See pages 57 and 58 for the Required Supplementary Schedules.
(9) Other Post-Employment Benefits
Plan Description
The Agency provides other post-employment benefits (OPEB) to qualified employees who retire from the Agency and meet the Agency’s vesting requirements. The Agency participates in CalPERS California Employer’s Retiree Benefit Trust Program (CERBT), a Prefunding Plan trust fund intended to perform an essential government function within the meaning of Section 115 of the Internal Revenue Code as an agent multiple-employer plan. CalPERS CERBT audited financial report may be obtained from their executive Office: 400 P Street, Sacramento, CA 95814. The Agency has set aside funds to cover retiree health liabilities in a trust that meets the criteria in paragraph 4 of Statement 75.
Benefits Provided
Medical coverage is currently provided through CalPERS as permitted under the Public Employees’ Medical and Hospital Care Act (PEMCHA). Under PEMCHA, the Agency is obligated to contribute toward the cost of retiree medical coverage for all employees who retire from the Agency for the retiree’s lifetime or until CalPERS medical coverage is discontinued.
All employees who retire from the Agency who are eligible to continue coverage in retirement will receive a medical benefit not less than the required PEMCHA minimum employer contribution (MEC). MEC benefits continue to a covered surviving spouse as well, if eligible for survivor benefits under the retirement program. The MEC is $133 per month in 2018 and $136 per month in 2019.
All Agency retirees are also eligible for 100% paid dental premiums for the retiree and his or her eligible, covered dependents for the retiree’s lifetime.
Additional retiree medical benefits are payable in the following circumstances, which vary based on the retiree’s employment date with the Agency or predecessor agency (CLWA or NCWD):
For retirees hired before January 1, 2009, the Agency pays 100% of the medical premium for the retiree and any enrolled dependents, up to but not exceeding 90% of the PERS Care LA Basic Region Basic Plan premium for the coverage level selected by the retiree (e.g. single, two-party or family).

Santa Clarita Valley Water Agency Notes to the Basic Financial Statements, continued
June 30, 2018
37
(9) Other Post-Employment Benefits, continued
Benefits Provided, continued
For retirees hired on or January 1, 2009, the Agency pays 100% of the medical premium for the retiree and any enrolled dependents, up to but not exceeding a vested percentage of 90% of the PERS Care LA Region Basic Plan premium for the coverage level selected by the retiree (e.g. single, two-party or family). The vested percent is based on all years of CalPERS membership, but requires at least 5 years of service with the Agency.
Employee Covered By Benefit Terms
At June 30, 2018, the following employees were covered by the benefit terms:
2018
Participating active employees 151 Retiree employees 51
Total plan membership 202
Discount Rate
The discount rate to measure the total OPEB liability was 7.28%, which is based on the long-term return on plan assets assuming 100% funding through CERBT. The projection of cash flows used to determine the discount rate assumed that liabilities and cash flow will vary based on the number and demographic characteristics of employees and retirees.
Deferred OPEB Outflows (Inflows) of Resources
For the six month period ended June 30, 2018, the Agency recognized OPEB expense of $1,041,716.
At June 30, 2018, the Agency reported deferred outflows and inflows of resources related to OPEB from the following sources:
Deferred Outflows of Resources
Deferred Inflows of
Resources
OPEB contributions subsequent to measurement date $ 601,683 -
Difference between expected and actual experience 3,947 -
Changes of assumptions - (2,517,375)
Net difference between projected and - actual earnings on investments - (355,221)
Total $ 605,630 (2,872,596)
Description
As of December 31, 2017, the Agency reported deferred outflows of resources related to employer OPEB contributions subsequent to measurement date in the amount of $1,787,444. The employer OPEB contributions in the amount of $1,787,444, will be recognized as a reduction of the net OPEB liability in the fiscal year ended June 30, 2018.
At June 30, 2018, other amounts reported as deferred outflows of resources and deferred inflows of resources related to OPEB will be recognized as OPEB expense as follows.

Santa Clarita Valley Water Agency Notes to the Basic Financial Statements, continued
June 30, 2018
38
(9) Other Post-Employment Benefits, continued
Deferred OPEB Outflows (Inflows) of Resources, continued
Net DeferredOutflows/
Period Ending Inflows ofJune 30, 2018 Resources
2019 $ (416,622) 2020 (416,622) 2021 (416,622) 2022 (416,623) 2023 (389,290)
Thereafter (812,868)
Actuarial Assumptions
The Agency’s total OPEB liability in the January 1, 2017 actuarial valuation, which was measured at June 30, 2017, was determined using the following actuarial assumptions, applied to all periods included in the measurement, unless otherwise specified:
Valuation Date June 30, 2018
Measurement Date June 30, 2017
Measurement Period January 1, 2017 to June 30, 2017
Actuarial cost method Entry Age Normal cost method in accordance with the requirementsof GASB Statement No. 75
Long Term Return on Assets 7.28% as of January 1, 2017 and June 30, 2017 net of plan investmentexpenses and including inflation.
Discount Rates 7.28% as of January 1, 2017 and June 30, 2017.
Participant Valued Only current active employees and retired participants and covereddependents are valued. No future entrants are considered in thisvaluation.
Salary Increase 3.25% per year; since benefits do not depend on salary, this is usedonly to allocate the cost of benefits between service years.
Assumed Wage Inflation 3.0% per year; used to determine amortization payments if developedon a level percent of pay basis.
General Inflation Rate 2.75% per year.
Demographic actuarial assumptions used in this valuation are based on the 2014 experience study of the CalPERS using data from 1997 to 2011.
Sensitivity of the Net OPEB Liability to Changes in the Discount Rate
As of June 30, 2018, the following presents the net OPEB liability of the Agency, as well as what the Agency’s net OPEB liability would be if it were calculated using a discount rate that is 1-percentage-point lower or 1-percentage-point higher than the current discount rate:

Santa Clarita Valley Water Agency Notes to the Basic Financial Statements, continued
June 30, 2018
39
(9) Other Post-Employment Benefits, continued
Sensitivity of the Net OPEB Liability to Changes in the Discount Rate, continued
CurrentDiscount Discount Discount
Rate - 1% Rate Rate + 1%6.28% 7.28% 8.28%
Net OPEB Liability $ 8,285,334 5,257,027 2,808,240
Sensitivity of the Net OPEB Liability to Changes in the Healthcare Cost Trend Rates
As of June 30, 2018, the following presents the net OPEB liability of the Agency, as well as what the Agency’s net OPEB liability would be if it were calculated using healthcare cost trend rates that are 1-percentage-point lower or 1-percentage-point higher than the current healthcare cost trend rates:
CurrentHealthcare Healthcare HealthcareCost Trend Cost Trend Cost TrendRates -1% Rate Rates +1%
Net OPEB Liability $ 2,592,666 5,257,027 8,869,391
Changes in the Net OPEB Liability
Changes in the net OPEB liability for the year were as follows:
PlanTotal OPEB Fiduciary Net OPEB
Liability Net Position Liability/(Asset)(a) (b) (c) = (a) - (b)
Balance at January 1, 2018 $ 20,235,141 11,754,382 8,480,759
Changes during the year:Service cost 312,585 - 312,585 Interest 742,964 - 742,964 Changes in benefit terms 637,826 - 637,826 Differences between expected and -
actual experience 4,214 - 4,214 Changes of assumptions (2,687,699) - (2,687,699) Contributions - employer - 1,298,476 (1,298,476) Net investment income - 938,262 (938,262) Benefit payments (273,181) (273,181) - Administrative fee - (3,116) 3,116
Net changes (1,263,291) 1,960,441 (3,223,732)
Balance at June 30, 2018 $ 18,971,850 13,714,823 5,257,027
Increase (Decrease)
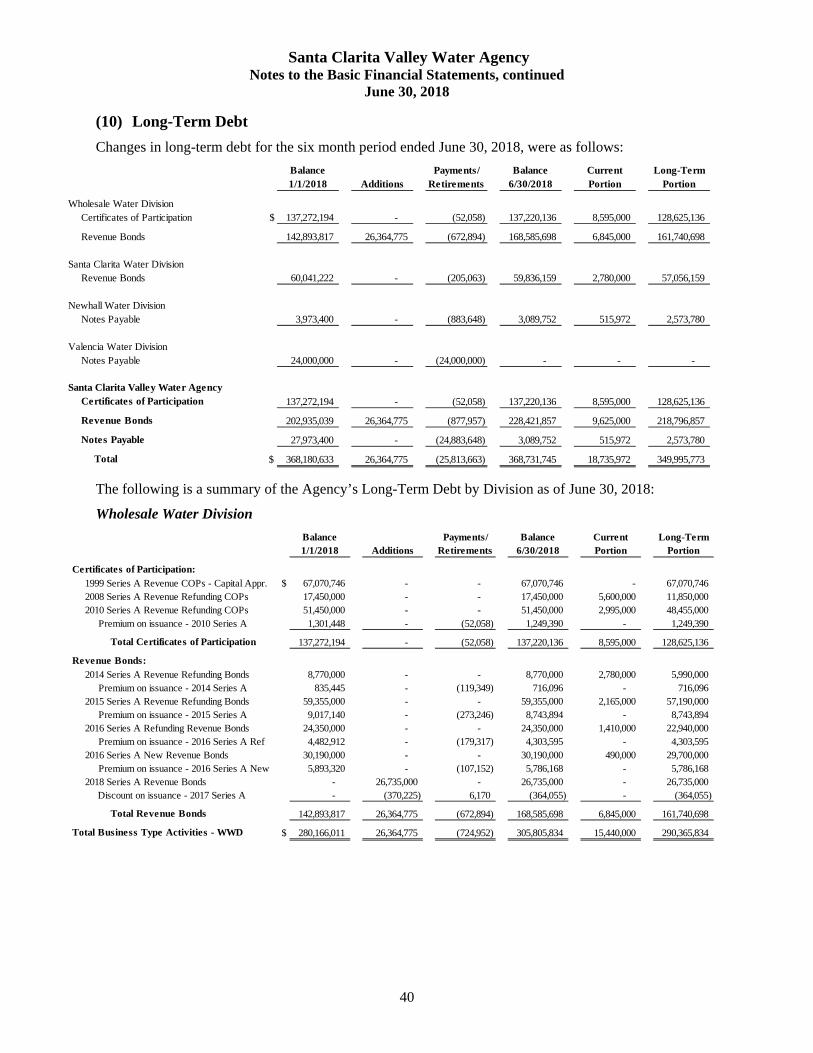
Santa Clarita Valley Water Agency Notes to the Basic Financial Statements, continued
June 30, 2018
40
(10) Long-Term Debt
Changes in long-term debt for the six month period ended June 30, 2018, were as follows:
Balance Payments/ Balance Current Long-Term1/1/2018 Additions Retirements 6/30/2018 Portion Portion
Wholesale Water DivisionCertificates of Participation $ 137,272,194 - (52,058) 137,220,136 8,595,000 128,625,136
Revenue Bonds 142,893,817 26,364,775 (672,894) 168,585,698 6,845,000 161,740,698
Santa Clarita Water DivisionRevenue Bonds 60,041,222 - (205,063) 59,836,159 2,780,000 57,056,159
Newhall Water DivisionNotes Payable 3,973,400 - (883,648) 3,089,752 515,972 2,573,780
Valencia Water DivisionNotes Payable 24,000,000 - (24,000,000) - - -
Santa Clarita Valley Water AgencyCertificates of Participation 137,272,194 - (52,058) 137,220,136 8,595,000 128,625,136
Revenue Bonds 202,935,039 26,364,775 (877,957) 228,421,857 9,625,000 218,796,857
Notes Payable 27,973,400 - (24,883,648) 3,089,752 515,972 2,573,780
Total $ 368,180,633 26,364,775 (25,813,663) 368,731,745 18,735,972 349,995,773
The following is a summary of the Agency’s Long-Term Debt by Division as of June 30, 2018:
Wholesale Water Division
Balance Payments/ Balance Current Long-Term1/1/2018 Additions Retirements 6/30/2018 Portion Portion
Certificates of Participation:
1999 Series A Revenue COPs - Capital Appr. $ 67,070,746 - - 67,070,746 - 67,070,746 2008 Series A Revenue Refunding COPs 17,450,000 - - 17,450,000 5,600,000 11,850,000 2010 Series A Revenue Refunding COPs 51,450,000 - - 51,450,000 2,995,000 48,455,000 Premium on issuance - 2010 Series A 1,301,448 - (52,058) 1,249,390 - 1,249,390
Total Certificates of Participation 137,272,194 - (52,058) 137,220,136 8,595,000 128,625,136
Revenue Bonds:
2014 Series A Revenue Refunding Bonds 8,770,000 - - 8,770,000 2,780,000 5,990,000 Premium on issuance - 2014 Series A 835,445 - (119,349) 716,096 - 716,096 2015 Series A Revenue Refunding Bonds 59,355,000 - - 59,355,000 2,165,000 57,190,000 Premium on issuance - 2015 Series A 9,017,140 - (273,246) 8,743,894 - 8,743,894 2016 Series A Refunding Revenue Bonds 24,350,000 - - 24,350,000 1,410,000 22,940,000 Premium on issuance - 2016 Series A Ref 4,482,912 - (179,317) 4,303,595 - 4,303,595 2016 Series A New Revenue Bonds 30,190,000 - - 30,190,000 490,000 29,700,000 Premium on issuance - 2016 Series A New 5,893,320 - (107,152) 5,786,168 - 5,786,168 2018 Series A Revenue Bonds - 26,735,000 - 26,735,000 - 26,735,000
Discount on issuance - 2017 Series A - (370,225) 6,170 (364,055) - (364,055)
Total Revenue Bonds 142,893,817 26,364,775 (672,894) 168,585,698 6,845,000 161,740,698
Total Business Type Activities - WWD $ 280,166,011 26,364,775 (724,952) 305,805,834 15,440,000 290,365,834

Santa Clarita Valley Water Agency Notes to the Basic Financial Statements, continued
June 30, 2018
41
(10) Long-Term Debt, continued
Santa Clarita Water Division
Business Type Activities - SCWD:
Balance Payments/ Balance Current Long-Term1/1/2018 Additions Retirements 6/30/2018 Portion Portion
Revenue Bonds:2017 Series A Revenue Bonds $ 50,745,000 - - 50,745,000 2,780,000 47,965,000
Premium on issuance - 2017 Series A 9,296,222 - (205,063) 9,091,159 - 9,091,159
Total Revenue Bonds 60,041,222 - (205,063) 59,836,159 2,780,000 57,056,159
Newhall Water Division
Business Type Activities - NWD:
Balance Payments/ Balance Current Long-Term1/1/2018 Additions Retirements 6/30/2018 Portion Portion
Notes Payable:Municipal Leasing Associates 2007 $ 2,846,150 - (184,211) 2,661,939 376,756 2,285,183 Municipal Leasing Associates 2009 496,186 - (68,373) 427,813 139,216 288,597 Municipal Finance Corporation 2012 631,064 - (631,064) - - -
Total Notes Payable 3,973,400 - (883,648) 3,089,752 515,972 2,573,780
Valencia Water Division
Balance Payments/ Balance Current Long-Term1/23/2018 Additions Retirements 6/30/2018 Portion Portion
Note Payable
Senior Secured Note Payable $ 24,000,000 - (24,000,000) - - -
Total Note Payable 24,000,000 - (24,000,000) - - -
Total Business-Type Activities - VWD $ 24,000,000 - (24,000,000) - - -
1999 Series A Revenue Certificates of Participation
In August 1999, the Corporation issued $75,813,498 of certificates of participation to finance certain capital improvements to Castaic Lake Water Agency’s (CLWA) (currently part of the Agency as Wholesale Water Division) wholesale water system and reimbursement of the Agency’s cost of acquisition of certain state water project entitlements. The certificates are payable solely from installment payments to be made by the Agency. The Agency has pledged all revenues derived from the ownership of its water system (which expressly exclude revenues derived from the retail sales of water).
On December 7, 2006, CLWA refunded $45,520,000 of the 1999 certificates (2006 Series A). A total of $45,520,000 from the 2006 Series A COPs was used to pay off the outstanding principal of the 1999 Series A Revenue Certificates of Participation. As a result, the 1999 Series A Revenue Certificates of Participation are considered retired and the liability for those obligations has been removed from the financial statements. CLWA completed the advance refunding to reduce CLWA’s total debt service payments over the next 24 years by achieving a 5.6% net present value savings. In May 2016, CLWA refunded all of the 2006 Series A certificates of participation (2016 Series A Refunding). (See 2016 Series A Refunding for their respective debt service requirements.)
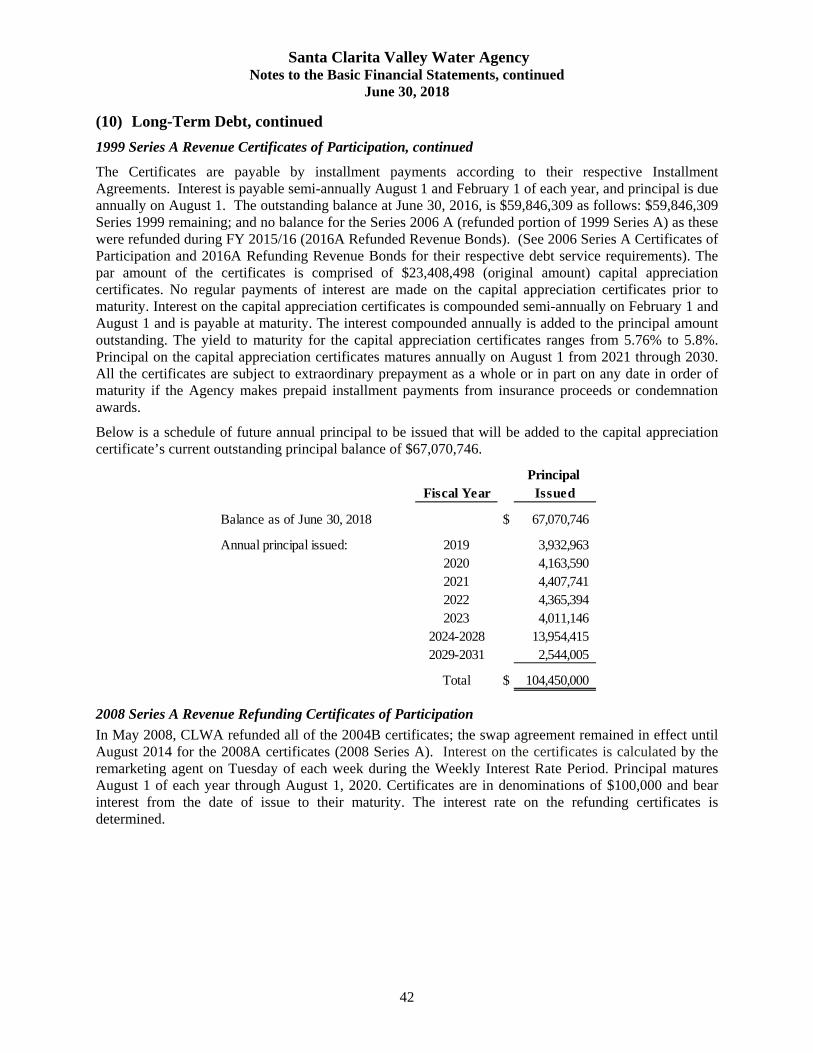
Santa Clarita Valley Water Agency Notes to the Basic Financial Statements, continued
June 30, 2018
42
(10) Long-Term Debt, continued
1999 Series A Revenue Certificates of Participation, continued
The Certificates are payable by installment payments according to their respective Installment Agreements. Interest is payable semi-annually August 1 and February 1 of each year, and principal is due annually on August 1. The outstanding balance at June 30, 2016, is $59,846,309 as follows: $59,846,309 Series 1999 remaining; and no balance for the Series 2006 A (refunded portion of 1999 Series A) as these were refunded during FY 2015/16 (2016A Refunded Revenue Bonds). (See 2006 Series A Certificates of Participation and 2016A Refunding Revenue Bonds for their respective debt service requirements). The par amount of the certificates is comprised of $23,408,498 (original amount) capital appreciation certificates. No regular payments of interest are made on the capital appreciation certificates prior to maturity. Interest on the capital appreciation certificates is compounded semi-annually on February 1 and August 1 and is payable at maturity. The interest compounded annually is added to the principal amount outstanding. The yield to maturity for the capital appreciation certificates ranges from 5.76% to 5.8%. Principal on the capital appreciation certificates matures annually on August 1 from 2021 through 2030. All the certificates are subject to extraordinary prepayment as a whole or in part on any date in order of maturity if the Agency makes prepaid installment payments from insurance proceeds or condemnation awards.
Below is a schedule of future annual principal to be issued that will be added to the capital appreciation certificate’s current outstanding principal balance of $67,070,746.
Principal Fiscal Year Issued
Balance as of June 30, 2018 $ 67,070,746
Annual principal issued: 2019 3,932,963 2020 4,163,590 2021 4,407,741 2022 4,365,394 2023 4,011,146
2024-2028 13,954,415 2029-2031 2,544,005
Total $ 104,450,000
2008 Series A Revenue Refunding Certificates of Participation
In May 2008, CLWA refunded all of the 2004B certificates; the swap agreement remained in effect until August 2014 for the 2008A certificates (2008 Series A). Interest on the certificates is calculated by the remarketing agent on Tuesday of each week during the Weekly Interest Rate Period. Principal matures August 1 of each year through August 1, 2020. Certificates are in denominations of $100,000 and bear interest from the date of issue to their maturity. The interest rate on the refunding certificates is determined.
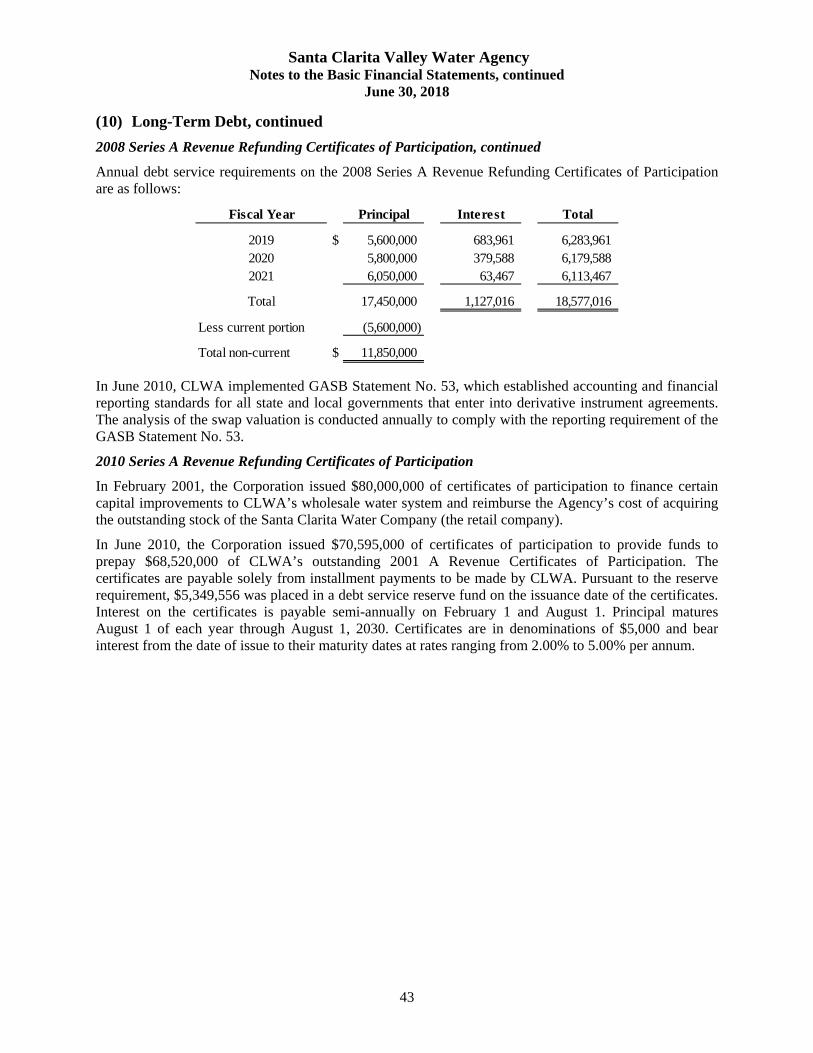
Santa Clarita Valley Water Agency Notes to the Basic Financial Statements, continued
June 30, 2018
43
(10) Long-Term Debt, continued
2008 Series A Revenue Refunding Certificates of Participation, continued
Annual debt service requirements on the 2008 Series A Revenue Refunding Certificates of Participation are as follows:
Fiscal Year Principal Interest Total
2019 $ 5,600,000 683,961 6,283,961 2020 5,800,000 379,588 6,179,588 2021 6,050,000 63,467 6,113,467
Total 17,450,000 1,127,016 18,577,016
Less current portion (5,600,000)
Total non-current $ 11,850,000
In June 2010, CLWA implemented GASB Statement No. 53, which established accounting and financial reporting standards for all state and local governments that enter into derivative instrument agreements. The analysis of the swap valuation is conducted annually to comply with the reporting requirement of the GASB Statement No. 53.
2010 Series A Revenue Refunding Certificates of Participation
In February 2001, the Corporation issued $80,000,000 of certificates of participation to finance certain capital improvements to CLWA’s wholesale water system and reimburse the Agency’s cost of acquiring the outstanding stock of the Santa Clarita Water Company (the retail company).
In June 2010, the Corporation issued $70,595,000 of certificates of participation to provide funds to prepay $68,520,000 of CLWA’s outstanding 2001 A Revenue Certificates of Participation. The certificates are payable solely from installment payments to be made by CLWA. Pursuant to the reserve requirement, $5,349,556 was placed in a debt service reserve fund on the issuance date of the certificates. Interest on the certificates is payable semi-annually on February 1 and August 1. Principal matures August 1 of each year through August 1, 2030. Certificates are in denominations of $5,000 and bear interest from the date of issue to their maturity dates at rates ranging from 2.00% to 5.00% per annum.
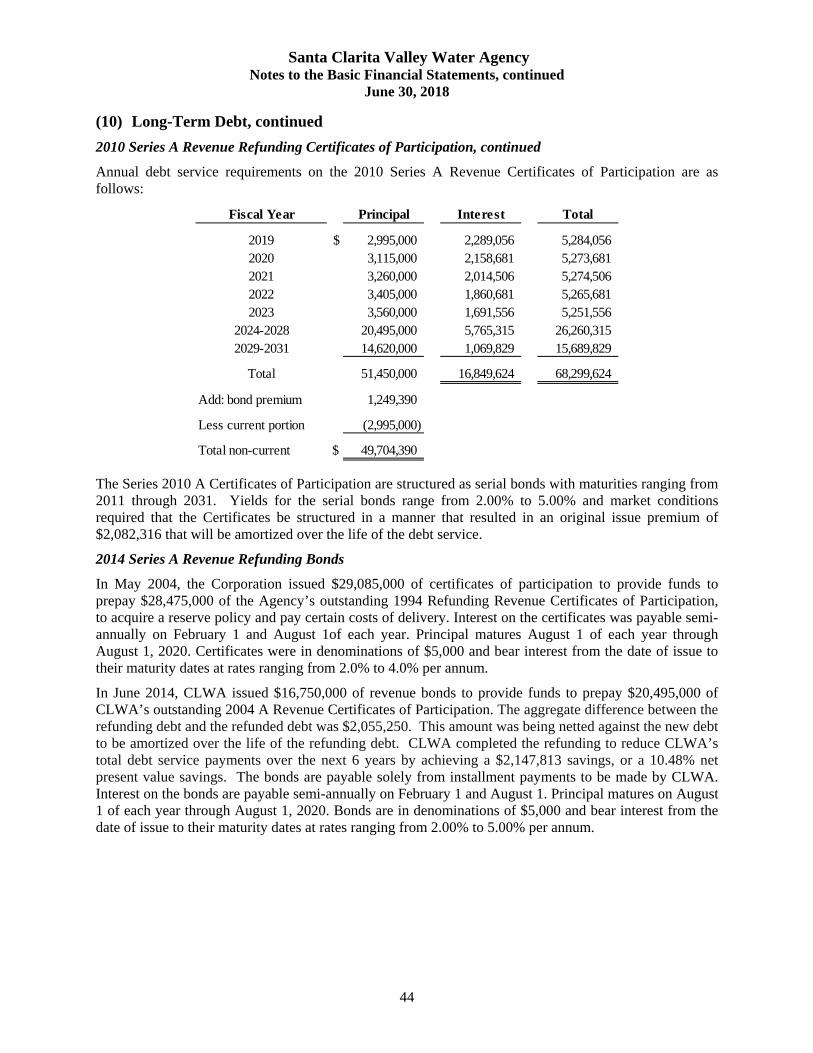
Santa Clarita Valley Water Agency Notes to the Basic Financial Statements, continued
June 30, 2018
44
(10) Long-Term Debt, continued
2010 Series A Revenue Refunding Certificates of Participation, continued
Annual debt service requirements on the 2010 Series A Revenue Certificates of Participation are as follows:
Fiscal Year Principal Interest Total
2019 $ 2,995,000 2,289,056 5,284,056 2020 3,115,000 2,158,681 5,273,681 2021 3,260,000 2,014,506 5,274,506 2022 3,405,000 1,860,681 5,265,681 2023 3,560,000 1,691,556 5,251,556
2024-2028 20,495,000 5,765,315 26,260,315 2029-2031 14,620,000 1,069,829 15,689,829
Total 51,450,000 16,849,624 68,299,624
Add: bond premium 1,249,390
Less current portion (2,995,000)
Total non-current $ 49,704,390
The Series 2010 A Certificates of Participation are structured as serial bonds with maturities ranging from 2011 through 2031. Yields for the serial bonds range from 2.00% to 5.00% and market conditions required that the Certificates be structured in a manner that resulted in an original issue premium of $2,082,316 that will be amortized over the life of the debt service.
2014 Series A Revenue Refunding Bonds
In May 2004, the Corporation issued $29,085,000 of certificates of participation to provide funds to prepay $28,475,000 of the Agency’s outstanding 1994 Refunding Revenue Certificates of Participation, to acquire a reserve policy and pay certain costs of delivery. Interest on the certificates was payable semi-annually on February 1 and August 1of each year. Principal matures August 1 of each year through August 1, 2020. Certificates were in denominations of $5,000 and bear interest from the date of issue to their maturity dates at rates ranging from 2.0% to 4.0% per annum.
In June 2014, CLWA issued $16,750,000 of revenue bonds to provide funds to prepay $20,495,000 of CLWA’s outstanding 2004 A Revenue Certificates of Participation. The aggregate difference between the refunding debt and the refunded debt was $2,055,250. This amount was being netted against the new debt to be amortized over the life of the refunding debt. CLWA completed the refunding to reduce CLWA’s total debt service payments over the next 6 years by achieving a $2,147,813 savings, or a 10.48% net present value savings. The bonds are payable solely from installment payments to be made by CLWA. Interest on the bonds are payable semi-annually on February 1 and August 1. Principal matures on August 1 of each year through August 1, 2020. Bonds are in denominations of $5,000 and bear interest from the date of issue to their maturity dates at rates ranging from 2.00% to 5.00% per annum.
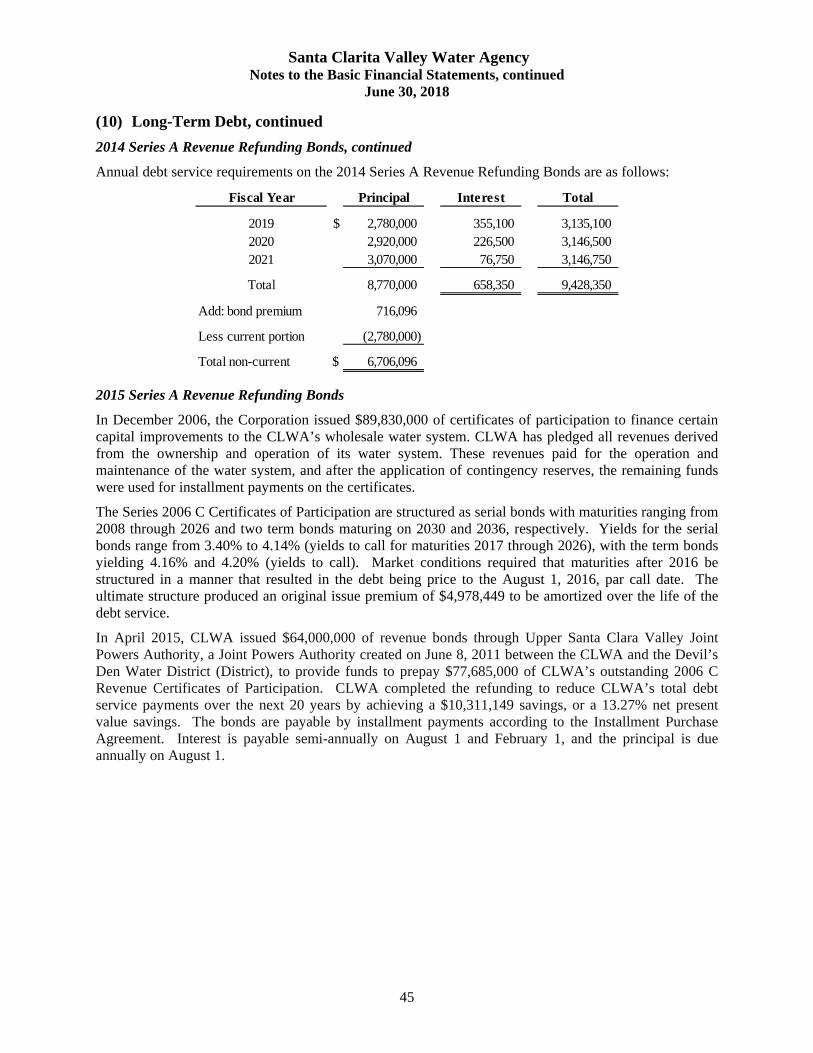
Santa Clarita Valley Water Agency Notes to the Basic Financial Statements, continued
June 30, 2018
45
(10) Long-Term Debt, continued
2014 Series A Revenue Refunding Bonds, continued
Annual debt service requirements on the 2014 Series A Revenue Refunding Bonds are as follows:
Fiscal Year Principal Interest Total
2019 $ 2,780,000 355,100 3,135,100 2020 2,920,000 226,500 3,146,500 2021 3,070,000 76,750 3,146,750
Total 8,770,000 658,350 9,428,350
Add: bond premium 716,096
Less current portion (2,780,000)
Total non-current $ 6,706,096
2015 Series A Revenue Refunding Bonds
In December 2006, the Corporation issued $89,830,000 of certificates of participation to finance certain capital improvements to the CLWA’s wholesale water system. CLWA has pledged all revenues derived from the ownership and operation of its water system. These revenues paid for the operation and maintenance of the water system, and after the application of contingency reserves, the remaining funds were used for installment payments on the certificates.
The Series 2006 C Certificates of Participation are structured as serial bonds with maturities ranging from 2008 through 2026 and two term bonds maturing on 2030 and 2036, respectively. Yields for the serial bonds range from 3.40% to 4.14% (yields to call for maturities 2017 through 2026), with the term bonds yielding 4.16% and 4.20% (yields to call). Market conditions required that maturities after 2016 be structured in a manner that resulted in the debt being price to the August 1, 2016, par call date. The ultimate structure produced an original issue premium of $4,978,449 to be amortized over the life of the debt service.
In April 2015, CLWA issued $64,000,000 of revenue bonds through Upper Santa Clara Valley Joint Powers Authority, a Joint Powers Authority created on June 8, 2011 between the CLWA and the Devil’s Den Water District (District), to provide funds to prepay $77,685,000 of CLWA’s outstanding 2006 C Revenue Certificates of Participation. CLWA completed the refunding to reduce CLWA’s total debt service payments over the next 20 years by achieving a $10,311,149 savings, or a 13.27% net present value savings. The bonds are payable by installment payments according to the Installment Purchase Agreement. Interest is payable semi-annually on August 1 and February 1, and the principal is due annually on August 1.
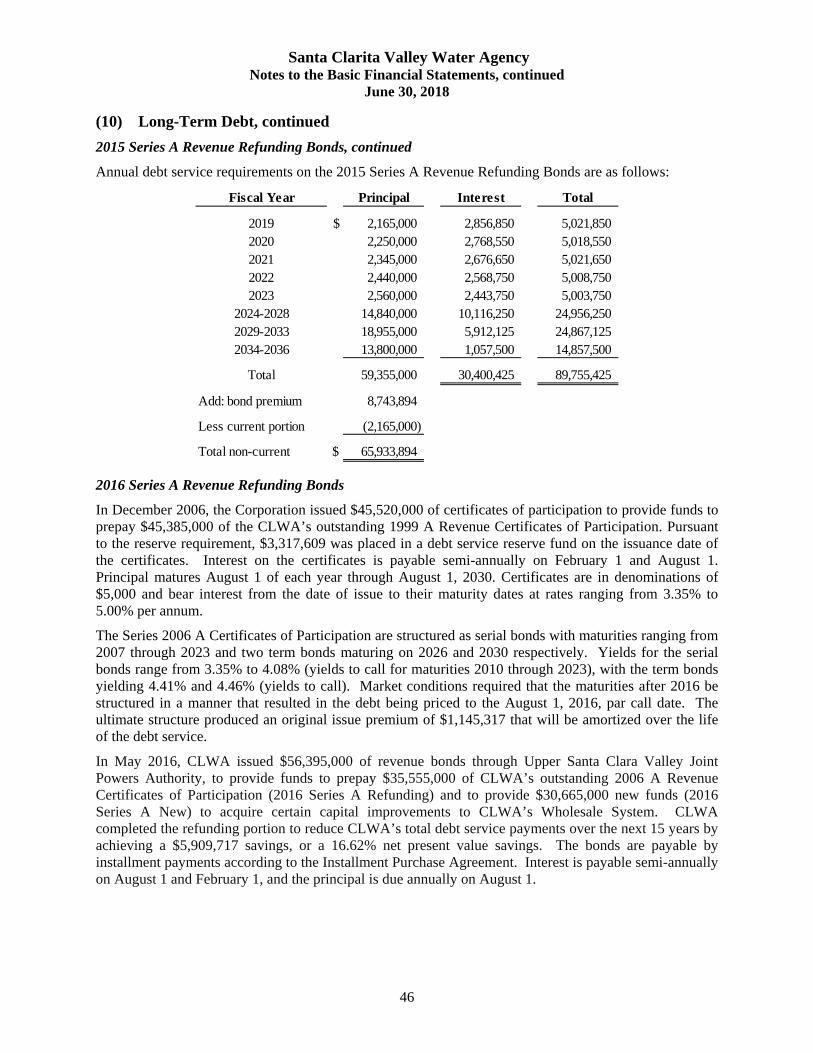
Santa Clarita Valley Water Agency Notes to the Basic Financial Statements, continued
June 30, 2018
46
(10) Long-Term Debt, continued
2015 Series A Revenue Refunding Bonds, continued
Annual debt service requirements on the 2015 Series A Revenue Refunding Bonds are as follows:
Fiscal Year Principal Interest Total
2019 $ 2,165,000 2,856,850 5,021,850 2020 2,250,000 2,768,550 5,018,550 2021 2,345,000 2,676,650 5,021,650 2022 2,440,000 2,568,750 5,008,750 2023 2,560,000 2,443,750 5,003,750
2024-2028 14,840,000 10,116,250 24,956,250 2029-2033 18,955,000 5,912,125 24,867,125 2034-2036 13,800,000 1,057,500 14,857,500
Total 59,355,000 30,400,425 89,755,425
Add: bond premium 8,743,894
Less current portion (2,165,000)
Total non-current $ 65,933,894
2016 Series A Revenue Refunding Bonds
In December 2006, the Corporation issued $45,520,000 of certificates of participation to provide funds to prepay $45,385,000 of the CLWA’s outstanding 1999 A Revenue Certificates of Participation. Pursuant to the reserve requirement, $3,317,609 was placed in a debt service reserve fund on the issuance date of the certificates. Interest on the certificates is payable semi-annually on February 1 and August 1. Principal matures August 1 of each year through August 1, 2030. Certificates are in denominations of $5,000 and bear interest from the date of issue to their maturity dates at rates ranging from 3.35% to 5.00% per annum.
The Series 2006 A Certificates of Participation are structured as serial bonds with maturities ranging from 2007 through 2023 and two term bonds maturing on 2026 and 2030 respectively. Yields for the serial bonds range from 3.35% to 4.08% (yields to call for maturities 2010 through 2023), with the term bonds yielding 4.41% and 4.46% (yields to call). Market conditions required that the maturities after 2016 be structured in a manner that resulted in the debt being priced to the August 1, 2016, par call date. The ultimate structure produced an original issue premium of $1,145,317 that will be amortized over the life of the debt service.
In May 2016, CLWA issued $56,395,000 of revenue bonds through Upper Santa Clara Valley Joint Powers Authority, to provide funds to prepay $35,555,000 of CLWA’s outstanding 2006 A Revenue Certificates of Participation (2016 Series A Refunding) and to provide $30,665,000 new funds (2016 Series A New) to acquire certain capital improvements to CLWA’s Wholesale System. CLWA completed the refunding portion to reduce CLWA’s total debt service payments over the next 15 years by achieving a $5,909,717 savings, or a 16.62% net present value savings. The bonds are payable by installment payments according to the Installment Purchase Agreement. Interest is payable semi-annually on August 1 and February 1, and the principal is due annually on August 1.
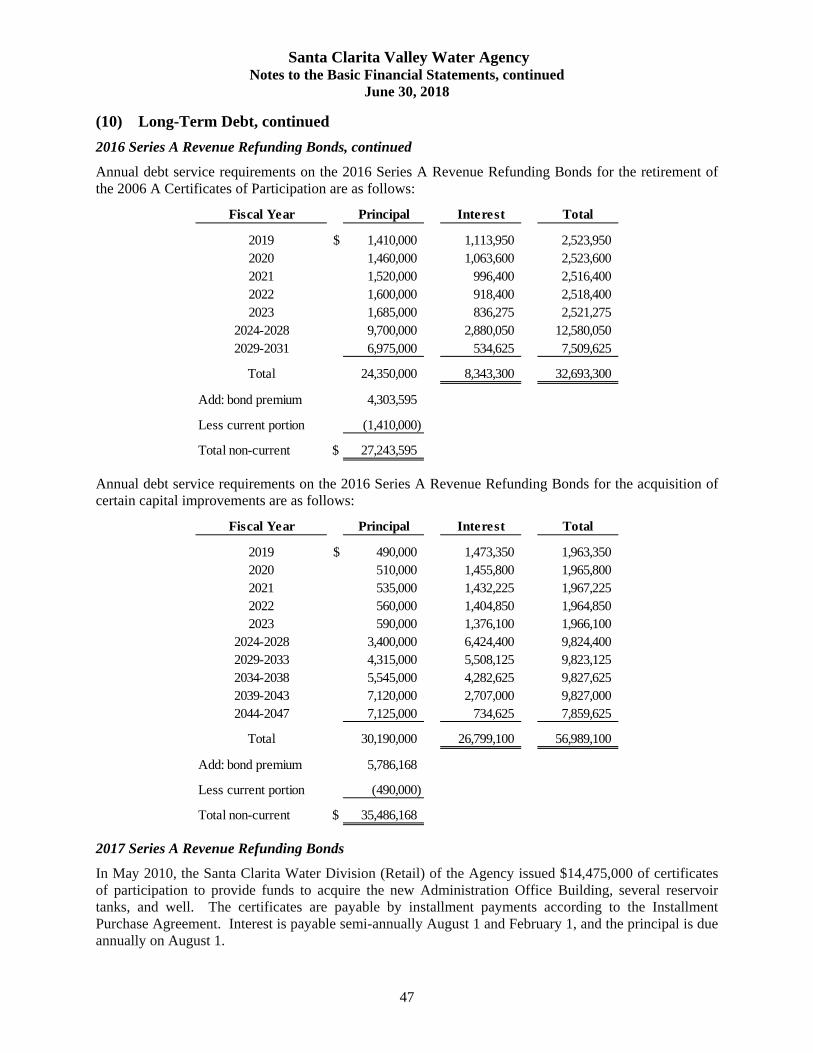
Santa Clarita Valley Water Agency Notes to the Basic Financial Statements, continued
June 30, 2018
47
(10) Long-Term Debt, continued
2016 Series A Revenue Refunding Bonds, continued
Annual debt service requirements on the 2016 Series A Revenue Refunding Bonds for the retirement of the 2006 A Certificates of Participation are as follows:
Fiscal Year Principal Interest Total
2019 $ 1,410,000 1,113,950 2,523,950 2020 1,460,000 1,063,600 2,523,600 2021 1,520,000 996,400 2,516,400 2022 1,600,000 918,400 2,518,400 2023 1,685,000 836,275 2,521,275
2024-2028 9,700,000 2,880,050 12,580,050 2029-2031 6,975,000 534,625 7,509,625
Total 24,350,000 8,343,300 32,693,300
Add: bond premium 4,303,595
Less current portion (1,410,000)
Total non-current $ 27,243,595
Annual debt service requirements on the 2016 Series A Revenue Refunding Bonds for the acquisition of certain capital improvements are as follows:
Fiscal Year Principal Interest Total
2019 $ 490,000 1,473,350 1,963,350 2020 510,000 1,455,800 1,965,800 2021 535,000 1,432,225 1,967,225 2022 560,000 1,404,850 1,964,850 2023 590,000 1,376,100 1,966,100
2024-2028 3,400,000 6,424,400 9,824,400 2029-2033 4,315,000 5,508,125 9,823,125 2034-2038 5,545,000 4,282,625 9,827,625 2039-2043 7,120,000 2,707,000 9,827,000 2044-2047 7,125,000 734,625 7,859,625
Total 30,190,000 26,799,100 56,989,100
Add: bond premium 5,786,168
Less current portion (490,000)
Total non-current $ 35,486,168
2017 Series A Revenue Refunding Bonds
In May 2010, the Santa Clarita Water Division (Retail) of the Agency issued $14,475,000 of certificates of participation to provide funds to acquire the new Administration Office Building, several reservoir tanks, and well. The certificates are payable by installment payments according to the Installment Purchase Agreement. Interest is payable semi-annually August 1 and February 1, and the principal is due annually on August 1.
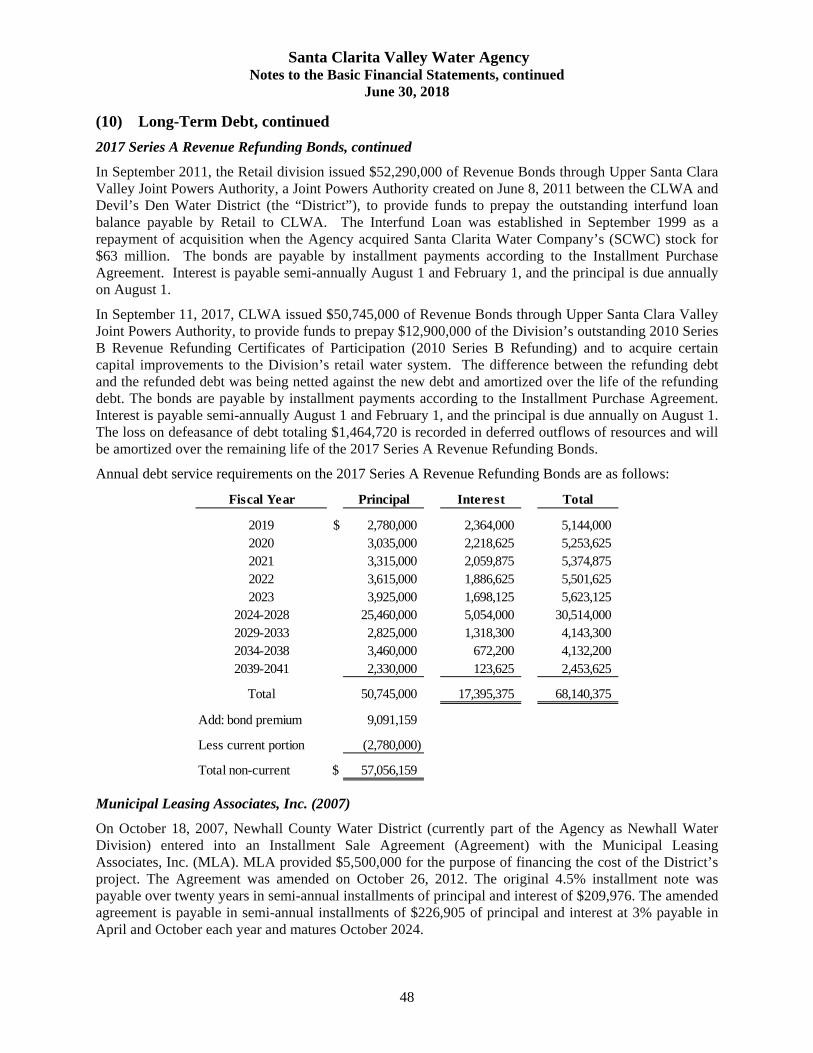
Santa Clarita Valley Water Agency Notes to the Basic Financial Statements, continued
June 30, 2018
48
(10) Long-Term Debt, continued
2017 Series A Revenue Refunding Bonds, continued
In September 2011, the Retail division issued $52,290,000 of Revenue Bonds through Upper Santa Clara Valley Joint Powers Authority, a Joint Powers Authority created on June 8, 2011 between the CLWA and Devil’s Den Water District (the “District”), to provide funds to prepay the outstanding interfund loan balance payable by Retail to CLWA. The Interfund Loan was established in September 1999 as a repayment of acquisition when the Agency acquired Santa Clarita Water Company’s (SCWC) stock for $63 million. The bonds are payable by installment payments according to the Installment Purchase Agreement. Interest is payable semi-annually August 1 and February 1, and the principal is due annually on August 1.
In September 11, 2017, CLWA issued $50,745,000 of Revenue Bonds through Upper Santa Clara Valley Joint Powers Authority, to provide funds to prepay $12,900,000 of the Division’s outstanding 2010 Series B Revenue Refunding Certificates of Participation (2010 Series B Refunding) and to acquire certain capital improvements to the Division’s retail water system. The difference between the refunding debt and the refunded debt was being netted against the new debt and amortized over the life of the refunding debt. The bonds are payable by installment payments according to the Installment Purchase Agreement. Interest is payable semi-annually August 1 and February 1, and the principal is due annually on August 1. The loss on defeasance of debt totaling $1,464,720 is recorded in deferred outflows of resources and will be amortized over the remaining life of the 2017 Series A Revenue Refunding Bonds.
Annual debt service requirements on the 2017 Series A Revenue Refunding Bonds are as follows:
Fiscal Year Principal Interest Total
2019 $ 2,780,000 2,364,000 5,144,000 2020 3,035,000 2,218,625 5,253,625 2021 3,315,000 2,059,875 5,374,875 2022 3,615,000 1,886,625 5,501,625 2023 3,925,000 1,698,125 5,623,125
2024-2028 25,460,000 5,054,000 30,514,000 2029-2033 2,825,000 1,318,300 4,143,300 2034-2038 3,460,000 672,200 4,132,200 2039-2041 2,330,000 123,625 2,453,625
Total 50,745,000 17,395,375 68,140,375
Add: bond premium 9,091,159
Less current portion (2,780,000)
Total non-current $ 57,056,159
Municipal Leasing Associates, Inc. (2007)
On October 18, 2007, Newhall County Water District (currently part of the Agency as Newhall Water Division) entered into an Installment Sale Agreement (Agreement) with the Municipal Leasing Associates, Inc. (MLA). MLA provided $5,500,000 for the purpose of financing the cost of the District’s project. The Agreement was amended on October 26, 2012. The original 4.5% installment note was payable over twenty years in semi-annual installments of principal and interest of $209,976. The amended agreement is payable in semi-annual installments of $226,905 of principal and interest at 3% payable in April and October each year and matures October 2024.
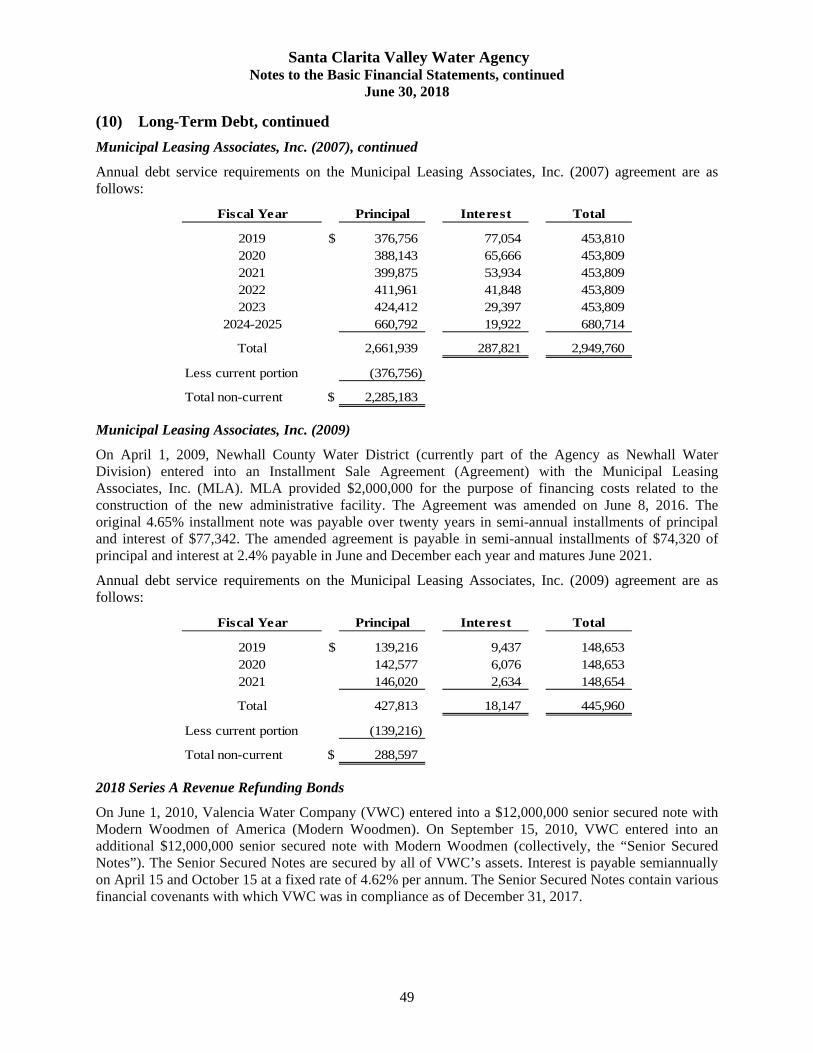
Santa Clarita Valley Water Agency Notes to the Basic Financial Statements, continued
June 30, 2018
49
(10) Long-Term Debt, continued
Municipal Leasing Associates, Inc. (2007), continued
Annual debt service requirements on the Municipal Leasing Associates, Inc. (2007) agreement are as follows:
Fiscal Year Principal Interest Total
2019 $ 376,756 77,054 453,810 2020 388,143 65,666 453,809 2021 399,875 53,934 453,809 2022 411,961 41,848 453,809 2023 424,412 29,397 453,809
2024-2025 660,792 19,922 680,714
Total 2,661,939 287,821 2,949,760
Less current portion (376,756)
Total non-current $ 2,285,183
Municipal Leasing Associates, Inc. (2009)
On April 1, 2009, Newhall County Water District (currently part of the Agency as Newhall Water Division) entered into an Installment Sale Agreement (Agreement) with the Municipal Leasing Associates, Inc. (MLA). MLA provided $2,000,000 for the purpose of financing costs related to the construction of the new administrative facility. The Agreement was amended on June 8, 2016. The original 4.65% installment note was payable over twenty years in semi-annual installments of principal and interest of $77,342. The amended agreement is payable in semi-annual installments of $74,320 of principal and interest at 2.4% payable in June and December each year and matures June 2021.
Annual debt service requirements on the Municipal Leasing Associates, Inc. (2009) agreement are as follows:
Fiscal Year Principal Interest Total
2019 $ 139,216 9,437 148,653 2020 142,577 6,076 148,653 2021 146,020 2,634 148,654
Total 427,813 18,147 445,960
Less current portion (139,216)
Total non-current $ 288,597
2018 Series A Revenue Refunding Bonds
On June 1, 2010, Valencia Water Company (VWC) entered into a $12,000,000 senior secured note with Modern Woodmen of America (Modern Woodmen). On September 15, 2010, VWC entered into an additional $12,000,000 senior secured note with Modern Woodmen (collectively, the “Senior Secured Notes”). The Senior Secured Notes are secured by all of VWC’s assets. Interest is payable semiannually on April 15 and October 15 at a fixed rate of 4.62% per annum. The Senior Secured Notes contain various financial covenants with which VWC was in compliance as of December 31, 2017.
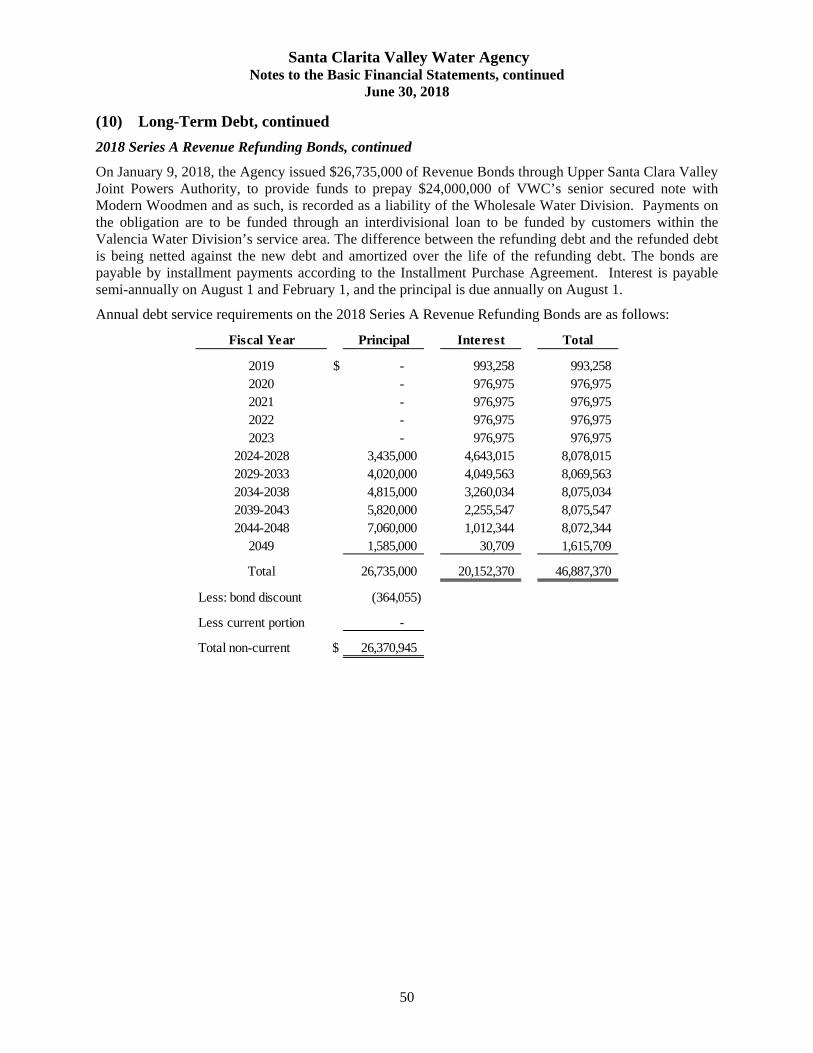
Santa Clarita Valley Water Agency Notes to the Basic Financial Statements, continued
June 30, 2018
50
(10) Long-Term Debt, continued
2018 Series A Revenue Refunding Bonds, continued
On January 9, 2018, the Agency issued $26,735,000 of Revenue Bonds through Upper Santa Clara Valley Joint Powers Authority, to provide funds to prepay $24,000,000 of VWC’s senior secured note with Modern Woodmen and as such, is recorded as a liability of the Wholesale Water Division. Payments on the obligation are to be funded through an interdivisional loan to be funded by customers within the Valencia Water Division’s service area. The difference between the refunding debt and the refunded debt is being netted against the new debt and amortized over the life of the refunding debt. The bonds are payable by installment payments according to the Installment Purchase Agreement. Interest is payable semi-annually on August 1 and February 1, and the principal is due annually on August 1.
Annual debt service requirements on the 2018 Series A Revenue Refunding Bonds are as follows:
Fiscal Year Principal Interest Total
2019 $ - 993,258 993,258 2020 - 976,975 976,975 2021 - 976,975 976,975 2022 - 976,975 976,975 2023 - 976,975 976,975
2024-2028 3,435,000 4,643,015 8,078,015 2029-2033 4,020,000 4,049,563 8,069,563 2034-2038 4,815,000 3,260,034 8,075,034 2039-2043 5,820,000 2,255,547 8,075,547 2044-2048 7,060,000 1,012,344 8,072,344
2049 1,585,000 30,709 1,615,709
Total 26,735,000 20,152,370 46,887,370
Less: bond discount (364,055)
Less current portion -
Total non-current $ 26,370,945

Santa Clarita Valley Water Agency Notes to the Basic Financial Statements, continued
June 30, 2018
51
(11) Net Position
Calculation of net position as of June 30 was as follows:
2018
Net investment in capital assets:
Capital assets, net $ 736,648,800 Certificate of participation, current (8,595,000) Certificate of participation, non-current (128,625,136) Revenue bonds, current (9,625,000) Revenue bonds, non-current (218,796,857) 1999 Series A cap appreciation bonds
accretion since issuance 43,662,247 Notes payable, current (515,972) Notes payable, non-current (2,573,780)
Total net investment in capital assets 411,579,302
Restricted net position:Restricted for capital projects:
Restricted – cash and cash equivalents 948,405Restricted – investments 18,840,811Restricted – accrued interest receivable 98,561Restricted – accounts receivable, other 764,839Restricted – accounts payable (2,156,954)
Total restricted for capital projects 18,495,662
Restricted for state water contractRestricted – investments 54,263,031Restricted – property tax receivable 1,475,093Restricted – accrued interest receivable 194,492Restricted – accounts payable (1,457,862)
Total restricted for state water contract 54,474,754
Restricted for debt service:Restricted – cash and cash equivalents with fiscal agent 5,512,074Restricted – accrued interest receivable 89
Total restricted for debt service 5,512,163
Total restricted net position 78,482,579
Unrestricted net position:Non-spendable net position:
Materials and supplies inventory 1,972,078 Prepaid expenses and other assets 5,710,728
Total non-spendable net position 7,682,806
Spendable net position is designated as follows:Unrestricted 83,676,361
Total spendable net position 83,676,361
Total unrestricted net position 91,359,167
Total net position $ 581,421,048

Santa Clarita Valley Water Agency Notes to the Basic Financial Statements, continued
June 30, 2018
52
(12) Risk Management
The Agency is exposed to various risks of loss related to torts, theft of, damage to, and destruction of assets; errors and omissions; injuries to employees; and natural disasters. The Agency is a member of the Association of California Water Agencies/Joint Powers Insurance Authority (ACWA/JPIA), an intergovernmental risk sharing joint powers authority created to provide self-insurance programs for California water agencies. The purpose of the ACWA/JPIA is to arrange and administer programs of self-insured losses and to purchase excess insurance coverage. As of June 30, 2018, the Agency limits and deductibles for liability, property, and workers compensation programs of the ACWA/JPIA are as follows:
General and auto liability, public officials and employees’ errors and omissions: Total risk financing self-insurance limits of $1,000,000, combined single limit per occurrence. The ACWA/JPIA purchased additional excess coverage layers: $59 million for general, auto and public officials liability, which increases the limits on the insurance coverage noted above.
Property loss is paid at the replacement cost for buildings, fixed equipment, and personal property on file, if replaced within two years after the loss, otherwise paid on actual cash value basis, subject to a $5,000 deductible per loss; and actual cash value for mobile equipment, subject to a $1,000 deductible per loss, and licensed vehicles, subject to a $500 deductible per loss. ACWA/JPIA purchased excess coverage for a combined total of $100 million per occurrence.
Boiler and machinery coverage for the replacement cost up to $100 million per occurrence, subject to various deductibles depending on the type of equipment.
Workers compensation insurance up to California statutory limits for all work related injuries/illnesses covered by California law, and Employer’s Liability Coverage up to $4 million. The Agency is self-insured up to $2 million and excess loss insurance has been purchased.
In addition to the above, the Agency also has the following insurance coverage:
Crime coverage up to $1,000,000 per loss includes public employee dishonesty, including Public Officials who are required by law to give bonds for the faithful performance of their service, forgery or alteration and computer fraud, subject to a $1,000 deductible.
Cyber liability coverage up to $2,000,000 per occurrence with an aggregate of $5,000,000 includes defense costs and damages for security, privacy, and media liability; fees and expenses incurred from cyber extortion; as well as costs to restore network business interruption and digital asset protection, subject to a $50,000 deductible.
There were no reductions in insurance coverage in the six month period ended June 30, 2018. Liabilities are recorded when it is probable that a loss has been incurred and the amount of the loss can be reasonably estimated net of the respective insurance coverage. Liabilities include an amount for claims that have been incurred but not reported (IBNR). There was no IBNR claims payable as of June 30, 2018.

Santa Clarita Valley Water Agency Notes to the Basic Financial Statements, continued
June 30, 2018
53
(13) Governmental Accounting Standards Board Statements Issued, Not Yet Effective
The Governmental Accounting Standards Board (GASB) has issued several pronouncements prior to June 30, 2018, that have effective dates that may impact future financial presentations.
Governmental Accounting Standards Board Statement No. 83
In November 2016, the GASB issued Statement No. 83 – Certain Asset Retirement Obligations. This Statement (1) addresses accounting and financial reporting for certain asset retirement obligations (AROs), (2) establishes criteria for determining the timing and pattern of recognition of a liability and a corresponding deferred outflow of resources for AROs, (3) requires that recognition occur when the liability is both incurred and reasonably estimable, (4) requires the measurement of an ARO to be based on the best estimate of the current value of outlays expected to be incurred, (5) requires the current value of a government’s AROs to be adjusted for the effects of general inflation or deflation at least annually, and (6) requires disclosure of information about the nature of a government’s AROs, the methods and assumptions used for the estimates of the liabilities, and the estimated remaining useful life of the associated tangible capital assets.
The requirements of this Statement are effective for reporting periods beginning after June 15, 2018. Earlier application is encouraged. The impact of the implementation of this Statement to the Agency’s financial statements has not been assessed at this time.
Governmental Accounting Standards Board Statement No. 87
In June 2017, the GASB issued Statement No. 87 – Leases. The objective of this Statement is to better meet the information needs of financial statement users by improving accounting and financial reporting for leases by governments. This Statement increases the usefulness of governments’ financial statements by requiring recognition of certain lease assets and liabilities for leases that previously were classified as operating leases and recognized as inflows of resources or outflows of resources based on the payment provisions of the contract. It establishes a single model for lease accounting based on the foundational principle that leases are financings of the right to use an underlying asset.
Under this Statement, a lessee is required to recognize a lease liability and an intangible right-to-use lease asset, and a lessor is required to recognize a lease receivable and a deferred inflow of resources, thereby enhancing the relevance and consistency of information about governments’ leasing activities.
The requirements of this Statement are effective for reporting periods beginning after December 15, 2019. Earlier application is encouraged. The impact of the implementation of this Statement to the Agency’s financial statements has not been assessed at this time.
Governmental Accounting Standards Board Statement No. 88
In April 2018, the GASB issued Statement No. 88 – Certain Disclosures Related to Debt, Including Direct Borrowings and Direct Placements. The primary objective of this Statement is to improve the information that is disclosed in notes to government financial statements related to debt, including direct borrowings and direct placements. It also clarifies which liabilities governments should include when disclosing information related to debt.
This Statement defines debt for purposes of disclosure in notes to financial statements as a liability that arises from a contractual obligation to pay cash (or other assets that may be used in lieu of cash) in one or more payments to settle an amount that is fixed at the date the contractual obligation is established.
This Statement requires that additional essential information related to debt be disclosed in notes to financial statements, including unused lines of credit; assets pledged as collateral for the debt; and terms specified in debt agreements related to significant events of default with finance-related consequences, significant termination events with finance-related consequences, and significant subjective acceleration clauses.

Santa Clarita Valley Water Agency Notes to the Basic Financial Statements, continued
June 30, 2018
54
(13) Governmental Accounting Standards Board Statements Issued, Not Yet Effective, continued
Governmental Accounting Standards Board Statement No. 88, continued
For notes to financial statements related to debt, this Statement also requires that existing and additional information be provided for direct borrowings and direct placements of debt separately from other debt.
The requirements of this Statement are effective for reporting periods beginning after June 15, 2018. Earlier application is encouraged. The impact of the implementation of this Statement to the Agency’s financial statements has not been assessed at this time.
Governmental Accounting Standards Board Statement No. 89
In June 2018, the GASB issued Statement No. 89 – Accounting for Interest Cost Incurred Before the End of a Construction Period. The objectives of this Statement are (1) to enhance the relevance and comparability of information about capital assets and the cost of borrowing for a reporting period and (2) to simplify accounting for interest cost incurred before the end of a construction period.
This Statement establishes accounting requirements for interest cost incurred before the end of a construction period. Such interest cost includes all interest that previously was accounted for in accordance with the requirements of paragraphs 5–22 of Statement No. 62, Codification of Accounting and Financial Reporting Guidance Contained in Pre-November 30, 1989 FASB and AICPA Pronouncements, which are superseded by this Statement.
This Statement requires that interest cost incurred before the end of a construction period be recognized as an expense in the period in which the cost is incurred for financial statements prepared using the economic resources measurement focus. As a result, interest cost incurred before the end of a construction period will not be included in the historical cost of a capital asset reported in a business-type activity or enterprise fund.
This Statement also reiterates that in financial statements prepared using the current financial resources measurement focus, interest cost incurred before the end of a construction period should be recognized as an expenditure on a basis consistent with governmental fund accounting principles.
The requirements of this Statement are effective for reporting periods beginning after December 15, 2019. Earlier application is encouraged. The requirements of this Statement should be applied prospectively. The impact of the implementation of this Statement to the Agency’s financial statements has not been assessed at this time.
(14) Commitments and Contingencies
Department of Water Resources (DWR) Water Contract Commitment
On April 30, 1963, a contract was entered into between the State of California acting by and through the Department of Water Resources and CLWA (the Contract), pursuant to the provisions of the California Water Resources Development Bond Act, the State Central Valley Project Act, and other applicable laws of the State of California.
The contract provides for a maximum annual water entitlement to the Agency of up to 41,500 acre feet. As amended, on January 1, 1991, the Agency began receiving the Devil’s Den agricultural entitlement of 12,700 acre feet. In March 1999, the Agency purchased an additional 41,000 acre feet from Wheeler Ridge-Maricopa Water Storage District, bringing the total maximum entitlement to 95,200 acre feet. The agreement contemplated water delivery of 20,100 acre feet beginning in 1981, with increasing deliveries through the years until the maximum entitlement was reached in 1991.

Santa Clarita Valley Water Agency Notes to the Basic Financial Statements, continued
June 30, 2018
55
(14) Commitments and Contingencies, continued
Department of Water Resources (DWR) Water Contract Commitment, continued
However, as of June 30, 2003, the water delivery objectives of the Contract cannot be achieved unless additional conservation features are constructed. The term of the Contract is for the project re-payment period or 75 year, whichever is longer, and provides for a pledge of certain CLWA revenues to the bondholders of the State under the Bond Act.
Provision is made in the Contract for two general charges: (1) a Delta water charge and (2) a transportation charge, which are divided into components. The Delta water charge is intended to return to the State all costs of project conservation facilities including capital, maintenance, operation, and replacement components, and is charged to CLWA on the basis of water entitlement and/or delivery. The transportation charge is for facilities necessary to deliver water to the contractors and also includes a capital, maintenance, operation, and replacement component.
At June 30, 2018, the Agency’s remaining estimated commitment for these charges is as follows:
Calendar year ending December 31 Amount
2018 $ 28,917,776 2019 29,043,631 2020 29,162,168 2021 28,887,671 2022 28,956,181
2023-2027 144,241,288 2028-2032 142,514,378 2033-2035 87,398,830
Total $ 519,121,923
On May 22, 2007, CLWA entered into a 30-year agreement with the Buena Vista Water Storage District and Rosedale-Rio Bravo Water Storage District for the acquisition of 11,000 acre-feet (AF) of water supply per year for a 30-year period. The purchase price was established in FY 2006/07 at $486.85 per AF, or $5,335,350. The purchase price will be adjusted each calendar year by Consumer Price Index (All Urban Consumers – All Items – Southern California Area) and every 10 years based on historical changes to the cost of the State Water Project. The current purchase price is $803.54 per AF.
Payments due under the DWR and BVRRB agreements are similar in nature to a long-term operating lease, since the Agency does not take title to any assets of the DWR and BVRRB at the end of the water delivery period. Accordingly, no liability under this contract is recorded in the Statement of Net Position.
Litigation
In the ordinary course of operations, the Agency is subject to claims and litigation from outside parties. After consultation with legal counsel, the Agency believes the ultimate outcome of such matters, if any, will not materially affect its financial condition.
Grant Awards
Grant funds received by the Agency are subject to audit by the grantor agencies. Such an audit could lead to requests for reimbursements to the grantor agencies for expenditures disallowed under terms of the grant. Management of the Agency believes that such disallowances, if any, would not be significant.
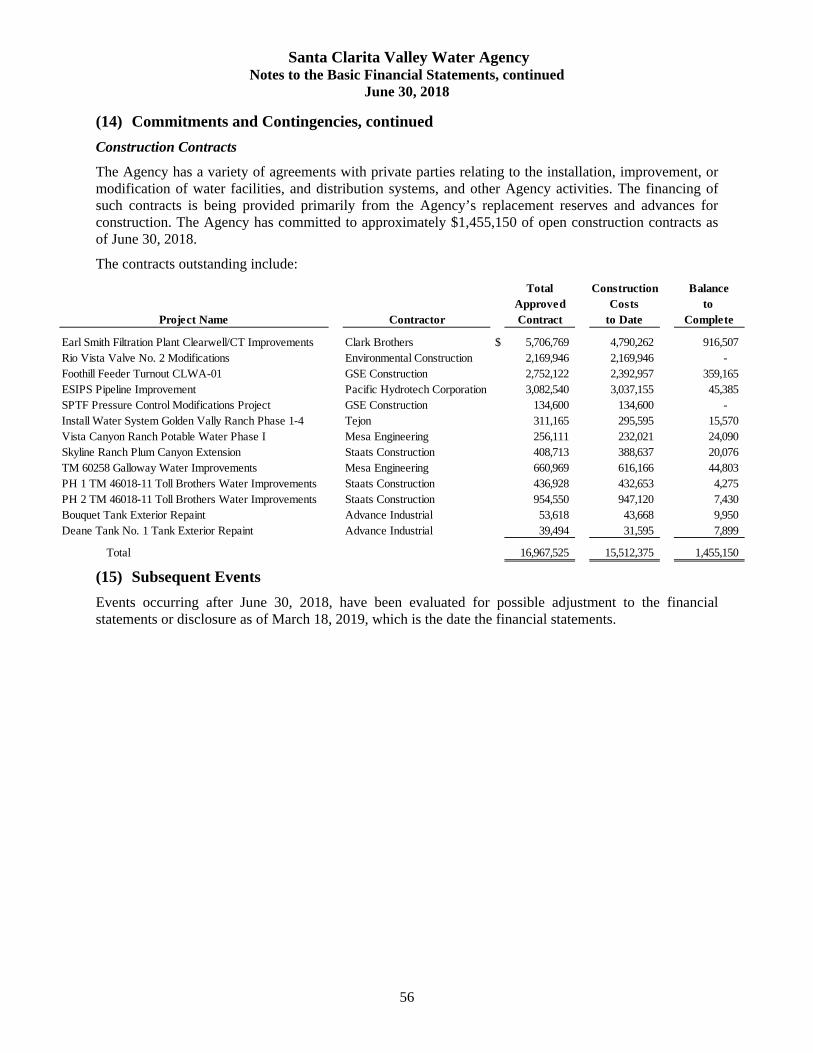
Santa Clarita Valley Water Agency Notes to the Basic Financial Statements, continued
June 30, 2018
56
(14) Commitments and Contingencies, continued
Construction Contracts
The Agency has a variety of agreements with private parties relating to the installation, improvement, or modification of water facilities, and distribution systems, and other Agency activities. The financing of such contracts is being provided primarily from the Agency’s replacement reserves and advances for construction. The Agency has committed to approximately $1,455,150 of open construction contracts as of June 30, 2018.
The contracts outstanding include:
Total Construction BalanceApproved Costs to
Contractor Contract to Date Complete
Earl Smith Filtration Plant Clearwell/CT Improvements Clark Brothers $ 5,706,769 4,790,262 916,507 Rio Vista Valve No. 2 Modifications Environmental Construction 2,169,946 2,169,946 - Foothill Feeder Turnout CLWA-01 GSE Construction 2,752,122 2,392,957 359,165 ESIPS Pipeline Improvement Pacific Hydrotech Corporation 3,082,540 3,037,155 45,385 SPTF Pressure Control Modifications Project GSE Construction 134,600 134,600 - Install Water System Golden Vally Ranch Phase 1-4 Tejon 311,165 295,595 15,570 Vista Canyon Ranch Potable Water Phase I Mesa Engineering 256,111 232,021 24,090 Skyline Ranch Plum Canyon Extension Staats Construction 408,713 388,637 20,076 TM 60258 Galloway Water Improvements Mesa Engineering 660,969 616,166 44,803 PH 1 TM 46018-11 Toll Brothers Water Improvements Staats Construction 436,928 432,653 4,275 PH 2 TM 46018-11 Toll Brothers Water Improvements Staats Construction 954,550 947,120 7,430 Bouquet Tank Exterior Repaint Advance Industrial 53,618 43,668 9,950 Deane Tank No. 1 Tank Exterior Repaint Advance Industrial 39,494 31,595 7,899
Total 16,967,525 15,512,375 1,455,150
Project Name
(15) Subsequent Events
Events occurring after June 30, 2018, have been evaluated for possible adjustment to the financial statements or disclosure as of March 18, 2019, which is the date the financial statements.

Required Supplementary Information

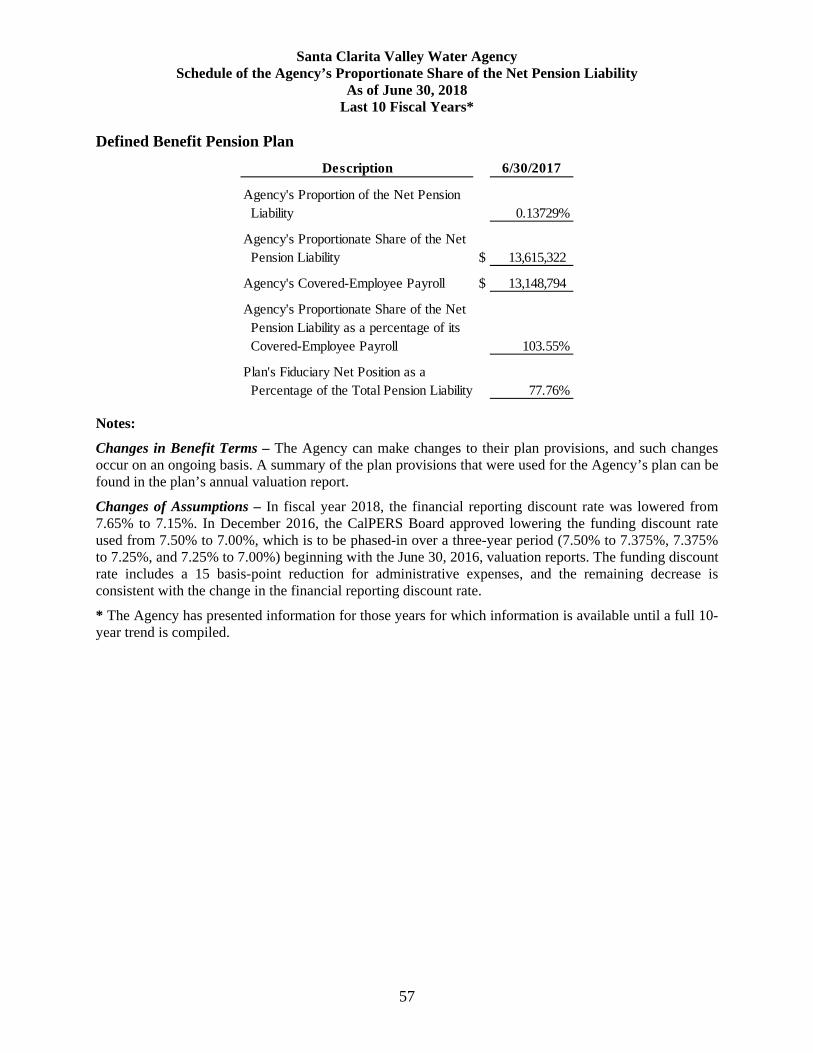
Santa Clarita Valley Water Agency Schedule of the Agency’s Proportionate Share of the Net Pension Liability
As of June 30, 2018 Last 10 Fiscal Years*
57
Defined Benefit Pension Plan
Description 6/30/2017
Agency's Proportion of the Net Pension Liability 0.13729%
Agency's Proportionate Share of the Net Pension Liability $ 13,615,322
Agency's Covered-Employee Payroll $ 13,148,794
Agency's Proportionate Share of the Net Pension Liability as a percentage of its Covered-Employee Payroll 103.55%
Plan's Fiduciary Net Position as a Percentage of the Total Pension Liability 77.76%
Notes:
Changes in Benefit Terms – The Agency can make changes to their plan provisions, and such changes occur on an ongoing basis. A summary of the plan provisions that were used for the Agency’s plan can be found in the plan’s annual valuation report.
Changes of Assumptions – In fiscal year 2018, the financial reporting discount rate was lowered from 7.65% to 7.15%. In December 2016, the CalPERS Board approved lowering the funding discount rate used from 7.50% to 7.00%, which is to be phased-in over a three-year period (7.50% to 7.375%, 7.375% to 7.25%, and 7.25% to 7.00%) beginning with the June 30, 2016, valuation reports. The funding discount rate includes a 15 basis-point reduction for administrative expenses, and the remaining decrease is consistent with the change in the financial reporting discount rate.
* The Agency has presented information for those years for which information is available until a full 10- year trend is compiled.

Santa Clarita Valley Water Agency Schedule of Pension Plan Contributions
For the Six Month Period Ended June 30, 2018 Last 10 Years*
58
Defined Benefit Pension Plan
Description 6/30/2018
Actuarially Determined Contribution $ 1,647,843 Contributions in Relation to the Actuarially Determined Contribution (673,464)
Contribution Deficiency (Excess) $ 974,379
Agency's Covered Payroll $ 13,319,776
Contribution's as a percentage of Covered-Employee Payroll 5.06%
Note:
* The Agency has presented information for those years for which information is available until a full 10-year trend is compiled.
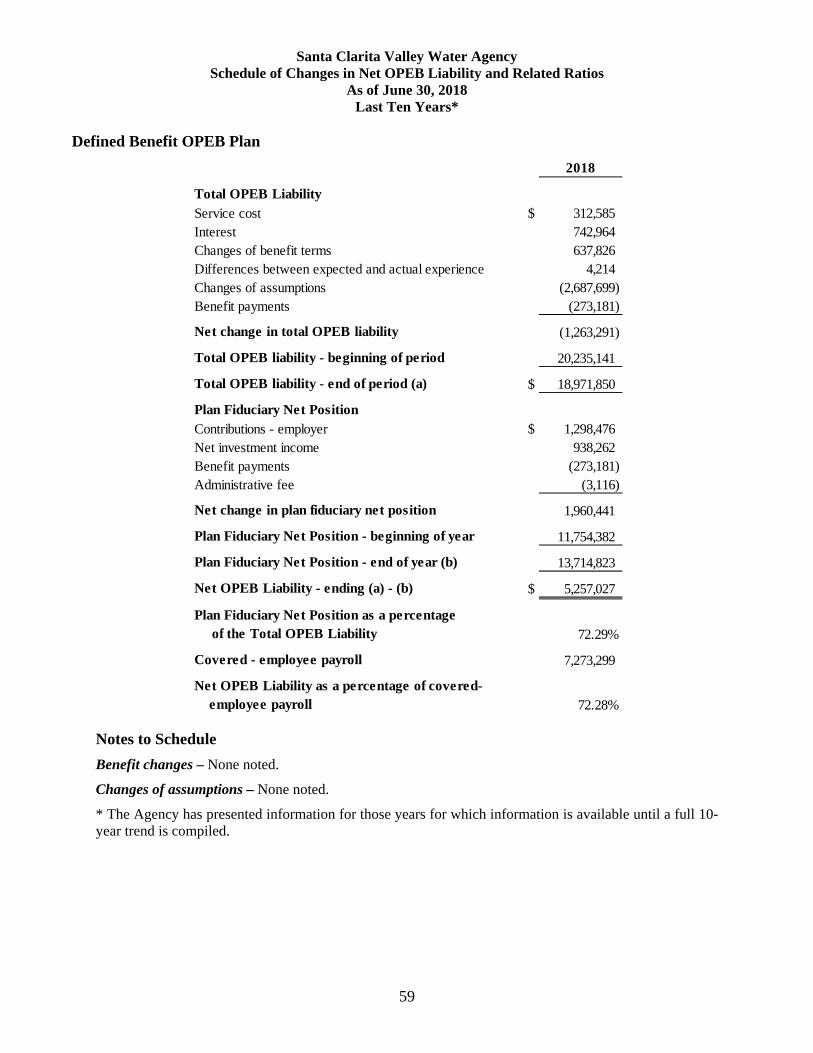
Santa Clarita Valley Water Agency Schedule of Changes in Net OPEB Liability and Related Ratios
As of June 30, 2018 Last Ten Years*
59
Defined Benefit OPEB Plan
2018
Total OPEB Liability
Service cost $ 312,585 Interest 742,964 Changes of benefit terms 637,826 Differences between expected and actual experience 4,214 Changes of assumptions (2,687,699) Benefit payments (273,181)
Net change in total OPEB liability (1,263,291)
Total OPEB liability - beginning of period 20,235,141
Total OPEB liability - end of period (a) $ 18,971,850
Plan Fiduciary Net Position
Contributions - employer $ 1,298,476 Net investment income 938,262 Benefit payments (273,181) Administrative fee (3,116)
Net change in plan fiduciary net position 1,960,441
Plan Fiduciary Net Position - beginning of year 11,754,382
Plan Fiduciary Net Position - end of year (b) 13,714,823
Net OPEB Liability - ending (a) - (b) $ 5,257,027
Plan Fiduciary Net Position as a percentageof the Total OPEB Liability 72.29%
Covered - employee payroll 7,273,299
Net OPEB Liability as a percentage of covered- employee payroll 72.28%
Notes to Schedule
Benefit changes – None noted.
Changes of assumptions – None noted.
* The Agency has presented information for those years for which information is available until a full 10- year trend is compiled.
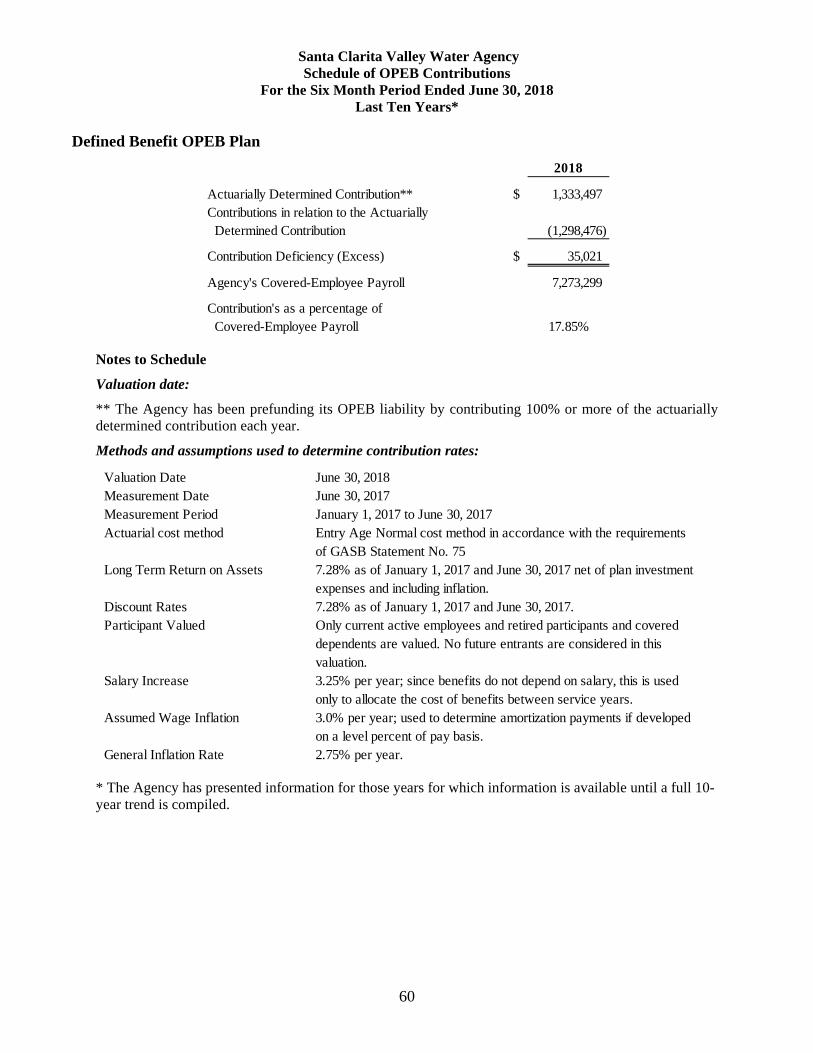
Santa Clarita Valley Water Agency Schedule of OPEB Contributions
For the Six Month Period Ended June 30, 2018 Last Ten Years*
60
Defined Benefit OPEB Plan
2018
Actuarially Determined Contribution** $ 1,333,497 Contributions in relation to the Actuarially Determined Contribution (1,298,476)
Contribution Deficiency (Excess) $ 35,021
Agency's Covered-Employee Payroll 7,273,299
Contribution's as a percentage of Covered-Employee Payroll 17.85%
Notes to Schedule
Valuation date:
** The Agency has been prefunding its OPEB liability by contributing 100% or more of the actuarially determined contribution each year.
Methods and assumptions used to determine contribution rates:
Valuation Date June 30, 2018Measurement Date June 30, 2017Measurement Period January 1, 2017 to June 30, 2017Actuarial cost method Entry Age Normal cost method in accordance with the requirements
of GASB Statement No. 75Long Term Return on Assets 7.28% as of January 1, 2017 and June 30, 2017 net of plan investment
expenses and including inflation.Discount Rates 7.28% as of January 1, 2017 and June 30, 2017.Participant Valued Only current active employees and retired participants and covered
dependents are valued. No future entrants are considered in thisvaluation.
Salary Increase 3.25% per year; since benefits do not depend on salary, this is usedonly to allocate the cost of benefits between service years.
Assumed Wage Inflation 3.0% per year; used to determine amortization payments if developedon a level percent of pay basis.
General Inflation Rate 2.75% per year.
* The Agency has presented information for those years for which information is available until a full 10- year trend is compiled.
Supplemental Information Section

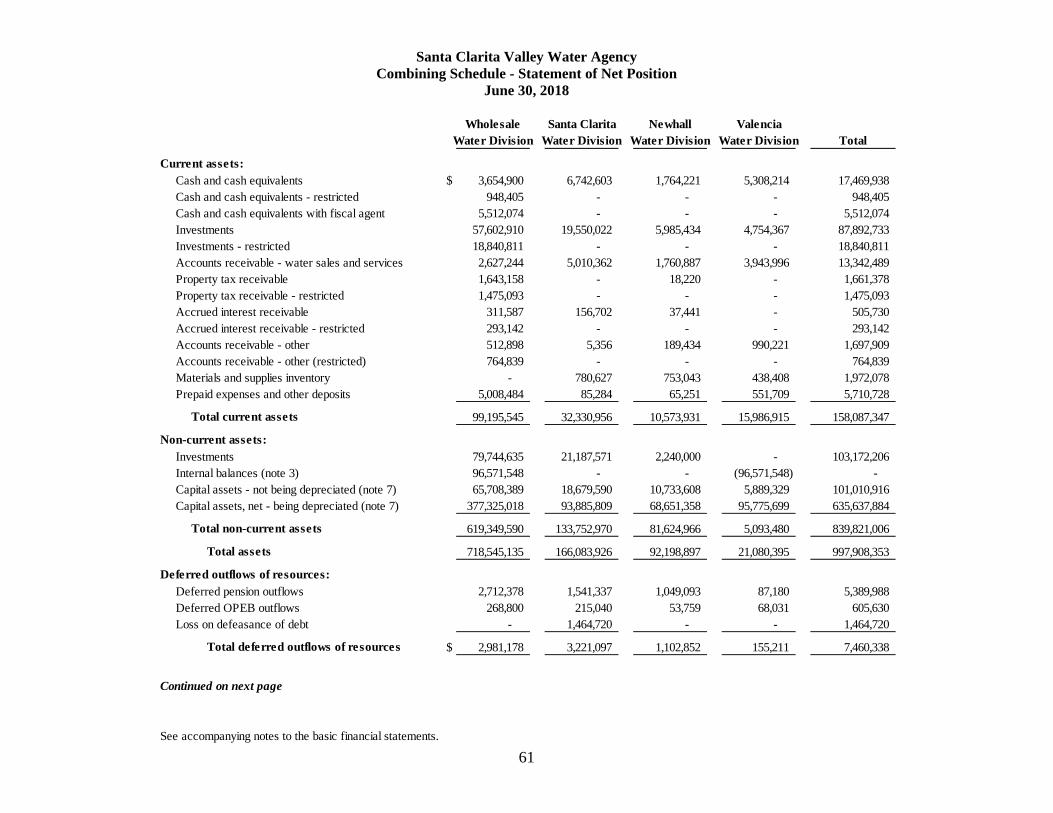
Santa Clarita Valley Water Agency Combining Schedule - Statement of Net Position
June 30, 2018
61
Wholesale Santa Clarita Newhall ValenciaWater Division Water Division Water Division Water Division Total
Current assets:Cash and cash equivalents $ 3,654,900 6,742,603 1,764,221 5,308,214 17,469,938 Cash and cash equivalents - restricted 948,405 - - - 948,405 Cash and cash equivalents with fiscal agent 5,512,074 - - - 5,512,074 Investments 57,602,910 19,550,022 5,985,434 4,754,367 87,892,733 Investments - restricted 18,840,811 - - - 18,840,811 Accounts receivable - water sales and services 2,627,244 5,010,362 1,760,887 3,943,996 13,342,489 Property tax receivable 1,643,158 - 18,220 - 1,661,378 Property tax receivable - restricted 1,475,093 - - - 1,475,093 Accrued interest receivable 311,587 156,702 37,441 - 505,730 Accrued interest receivable - restricted 293,142 - - - 293,142 Accounts receivable - other 512,898 5,356 189,434 990,221 1,697,909 Accounts receivable - other (restricted) 764,839 - - - 764,839 Materials and supplies inventory - 780,627 753,043 438,408 1,972,078 Prepaid expenses and other deposits 5,008,484 85,284 65,251 551,709 5,710,728
Total current assets 99,195,545 32,330,956 10,573,931 15,986,915 158,087,347
Non-current assets:Investments 79,744,635 21,187,571 2,240,000 - 103,172,206 Internal balances (note 3) 96,571,548 - - (96,571,548) - Capital assets - not being depreciated (note 7) 65,708,389 18,679,590 10,733,608 5,889,329 101,010,916 Capital assets, net - being depreciated (note 7) 377,325,018 93,885,809 68,651,358 95,775,699 635,637,884
Total non-current assets 619,349,590 133,752,970 81,624,966 5,093,480 839,821,006
Total assets 718,545,135 166,083,926 92,198,897 21,080,395 997,908,353
Deferred outflows of resources:Deferred pension outflows 2,712,378 1,541,337 1,049,093 87,180 5,389,988 Deferred OPEB outflows 268,800 215,040 53,759 68,031 605,630 Loss on defeasance of debt - 1,464,720 - - 1,464,720
Total deferred outflows of resources $ 2,981,178 3,221,097 1,102,852 155,211 7,460,338
Continued on next page
See accompanying notes to the basic financial statements.
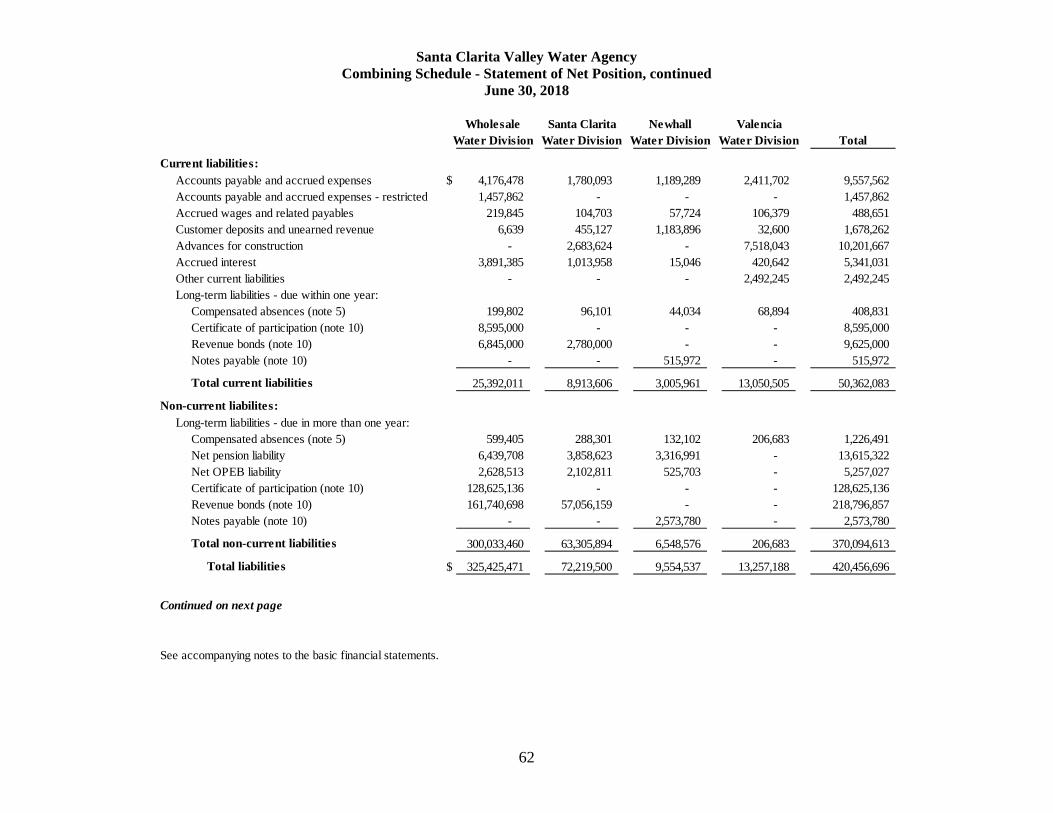
Santa Clarita Valley Water Agency Combining Schedule - Statement of Net Position, continued
June 30, 2018
62
Wholesale Santa Clarita Newhall ValenciaWater Division Water Division Water Division Water Division Total
Current liabilities:Accounts payable and accrued expenses $ 4,176,478 1,780,093 1,189,289 2,411,702 9,557,562 Accounts payable and accrued expenses - restricted 1,457,862 - - - 1,457,862 Accrued wages and related payables 219,845 104,703 57,724 106,379 488,651 Customer deposits and unearned revenue 6,639 455,127 1,183,896 32,600 1,678,262 Advances for construction - 2,683,624 - 7,518,043 10,201,667 Accrued interest 3,891,385 1,013,958 15,046 420,642 5,341,031 Other current liabilities - - - 2,492,245 2,492,245 Long-term liabilities - due within one year:
Compensated absences (note 5) 199,802 96,101 44,034 68,894 408,831 Certificate of participation (note 10) 8,595,000 - - - 8,595,000 Revenue bonds (note 10) 6,845,000 2,780,000 - - 9,625,000 Notes payable (note 10) - - 515,972 - 515,972
Total current liabilities 25,392,011 8,913,606 3,005,961 13,050,505 50,362,083
Non-current liabilites:Long-term liabilities - due in more than one year:
Compensated absences (note 5) 599,405 288,301 132,102 206,683 1,226,491 Net pension liability 6,439,708 3,858,623 3,316,991 - 13,615,322 Net OPEB liability 2,628,513 2,102,811 525,703 - 5,257,027 Certificate of participation (note 10) 128,625,136 - - - 128,625,136 Revenue bonds (note 10) 161,740,698 57,056,159 - - 218,796,857 Notes payable (note 10) - - 2,573,780 - 2,573,780
Total non-current liabilities 300,033,460 63,305,894 6,548,576 206,683 370,094,613
Total liabilities $ 325,425,471 72,219,500 9,554,537 13,257,188 420,456,696
Continued on next page
See accompanying notes to the basic financial statements.
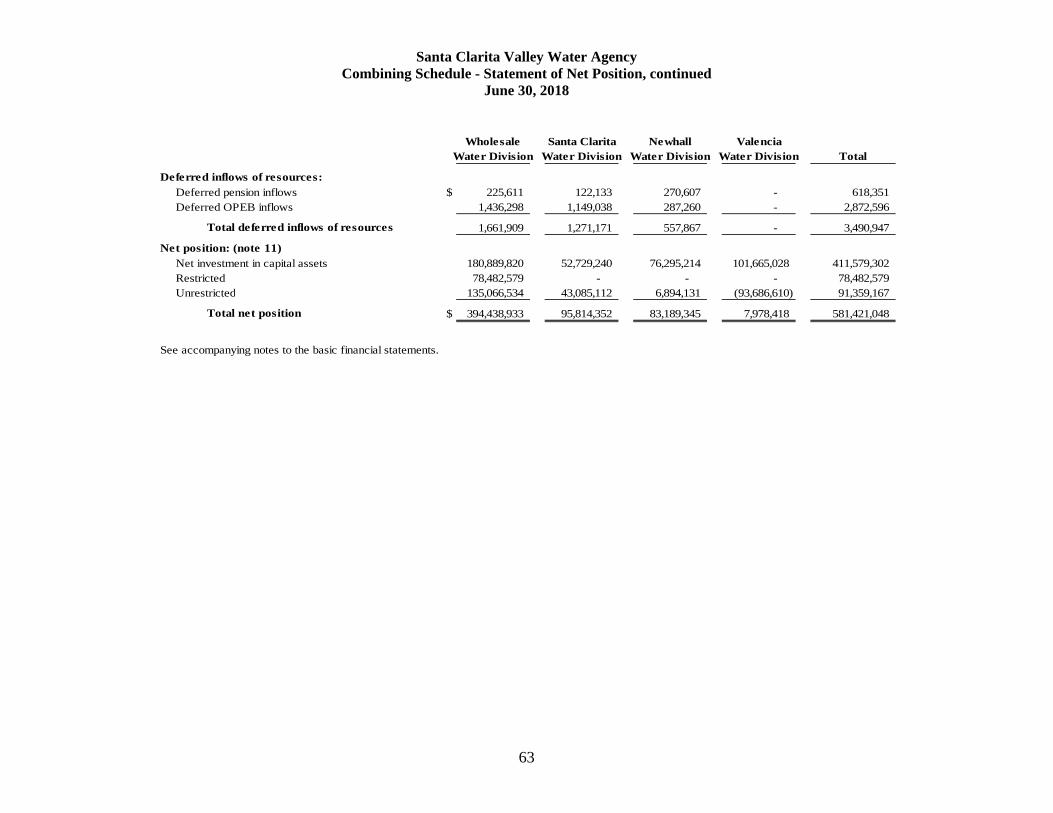
Santa Clarita Valley Water Agency Combining Schedule - Statement of Net Position, continued
June 30, 2018
63
Wholesale Santa Clarita Newhall Valencia
Water Division Water Division Water Division Water Division Total
Deferred inflows of resources:Deferred pension inflows $ 225,611 122,133 270,607 - 618,351 Deferred OPEB inflows 1,436,298 1,149,038 287,260 - 2,872,596
Total deferred inflows of resources 1,661,909 1,271,171 557,867 - 3,490,947
Net position: (note 11)Net investment in capital assets 180,889,820 52,729,240 76,295,214 101,665,028 411,579,302 Restricted 78,482,579 - - - 78,482,579 Unrestricted 135,066,534 43,085,112 6,894,131 (93,686,610) 91,359,167
Total net position $ 394,438,933 95,814,352 83,189,345 7,978,418 581,421,048
See accompanying notes to the basic financial statements.
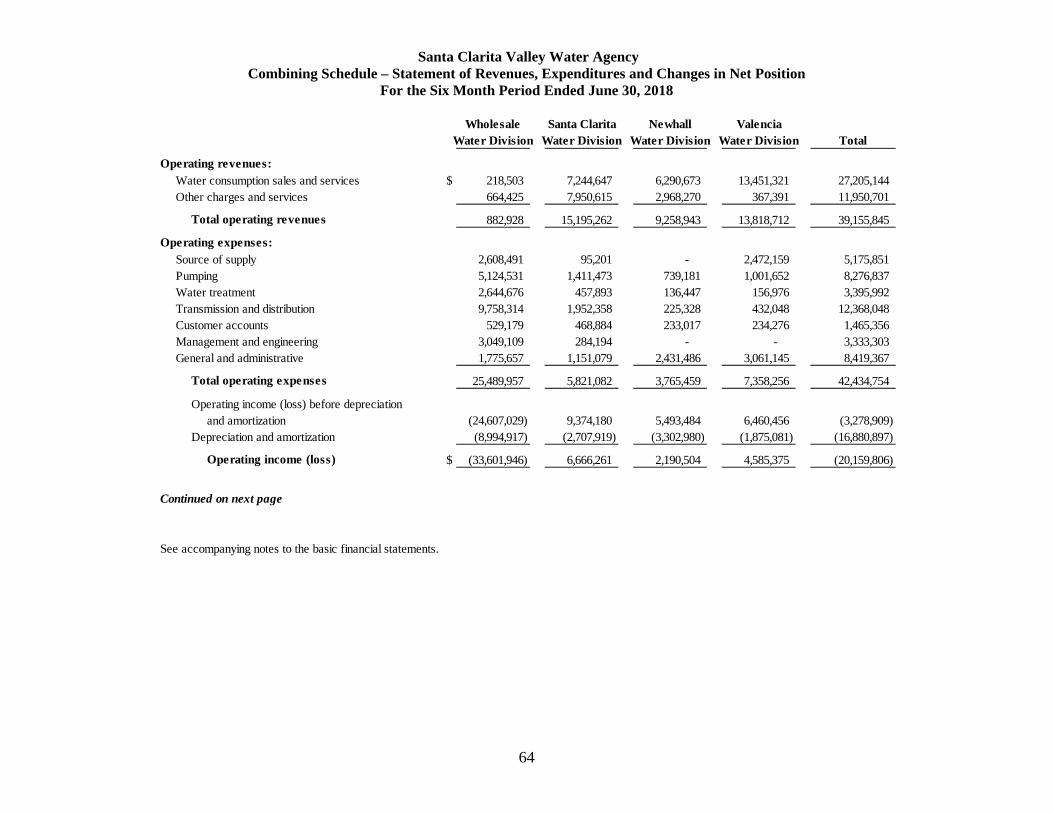
Santa Clarita Valley Water Agency Combining Schedule – Statement of Revenues, Expenditures and Changes in Net Position
For the Six Month Period Ended June 30, 2018
64
Wholesale Santa Clarita Newhall ValenciaWater Division Water Division Water Division Water Division Total
Operating revenues:Water consumption sales and services $ 218,503 7,244,647 6,290,673 13,451,321 27,205,144 Other charges and services 664,425 7,950,615 2,968,270 367,391 11,950,701
Total operating revenues 882,928 15,195,262 9,258,943 13,818,712 39,155,845
Operating expenses:Source of supply 2,608,491 95,201 - 2,472,159 5,175,851 Pumping 5,124,531 1,411,473 739,181 1,001,652 8,276,837 Water treatment 2,644,676 457,893 136,447 156,976 3,395,992 Transmission and distribution 9,758,314 1,952,358 225,328 432,048 12,368,048 Customer accounts 529,179 468,884 233,017 234,276 1,465,356 Management and engineering 3,049,109 284,194 - - 3,333,303 General and administrative 1,775,657 1,151,079 2,431,486 3,061,145 8,419,367
Total operating expenses 25,489,957 5,821,082 3,765,459 7,358,256 42,434,754
Operating income (loss) before depreciationand amortization (24,607,029) 9,374,180 5,493,484 6,460,456 (3,278,909)
Depreciation and amortization (8,994,917) (2,707,919) (3,302,980) (1,875,081) (16,880,897)
Operating income (loss) $ (33,601,946) 6,666,261 2,190,504 4,585,375 (20,159,806)
Continued on next page
See accompanying notes to the basic financial statements.

Santa Clarita Valley Water Agency Combining Schedule – Statement of Revenues, Expenditures and Changes in Net Position, continued
For the Six Month Period Ended June 30, 2018
65
Wholesale Santa Clarita Newhall ValenciaWater Division Water Division Water Division Water Division Total
Non-operating revenue (expense):Interest earnings $ 6,478,619 165,444 81,632 68,060 6,793,755 Interest expense (4,360,876) (1,463,687) (55,707) (3,947,632) (9,827,902) Property taxes 27,958,588 - 283,602 - 28,242,190 State water contract (12,450,652) - - - (12,450,652) Gain on disposal of capital assets - 37,133 - 8,196 45,329 Other non-operating revenues (expenses), net - 75,269 51,757 (212,222) (85,196)
Total non-operating income (expense), net 17,625,679 (1,185,841) 361,284 (4,083,598) 12,717,524
Net income (loss) before capital contributions (15,976,267) 5,480,420 2,551,788 501,777 (7,442,282)
Capital contributions – developer and customer - 1,254,858 1,252,651 - 2,507,509
Change in net position (15,976,267) 6,735,278 3,804,439 501,777 (4,934,773)
Transfers in to Santa Clarita Valley Water Agency 410,415,200 89,079,074 79,384,906 7,476,641 586,355,821
Net position, end of period $ 394,438,933 95,814,352 83,189,345 7,978,418 581,421,048
See accompanying notes to the basic financial statements

Santa Clarita Valley Water Agency Combining Schedule - Net Position, continued
June 30, 2018
66
Wholesale Santa Clarita Newhall Valencia
Water Division Water Division Water Division Water Division Total
Net investment in capital assets:Capital assets, net $ 443,033,407 112,565,399 79,384,966 101,665,028 736,648,800 Certificate of participation, current (8,595,000) - - - (8,595,000) Certificate of participation, non-current (128,625,136) - - - (128,625,136) Revenue bonds, current (6,845,000) (2,780,000) - - (9,625,000) Revenue bonds, non-current (161,740,698) (57,056,159) - - (218,796,857) 1999 Series A cap appreciation bonds
accretion since issuance 43,662,247 - - - 43,662,247 Notes payable, current - - (515,972) - (515,972) Notes payable, non-current - - (2,573,780) - (2,573,780)
Total net investment in capital assets 180,889,820 52,729,240 76,295,214 101,665,028 411,579,302
Restricted net position:Restricted for capital projects:
Restricted – cash and cash equivalents 948,405 - - - 948,405 Restricted – investments 18,840,811 - - - 18,840,811 Restricted – accrued interest receivable 98,561 - - - 98,561 Restricted – accounts receivable, other 764,839 - - - 764,839 Restricted – accounts payable (2,156,954) - - - (2,156,954)
Total restricted for capital projects 18,495,662 - - - 18,495,662
Restricted for state water contractRestricted – investments 54,263,031 - - - 54,263,031 Restricted – property tax receivable 1,475,093 - - - 1,475,093 Restricted – accrued interest receivable 194,492 - - - 194,492 Restricted – accounts payable and accrued expenses (1,457,862) - - - (1,457,862)
Total restricted for state water contract 54,474,754 - - - 54,474,754
Restricted for debt service:Restricted – cash and cash equivalents with fiscal agent 5,512,074 - - - 5,512,074 Restricted – accrued interest receivable 89 - - - 89
Total restricted for debt service 5,512,163 - - - 5,512,163
Total restricted net position 78,482,579 - - - 78,482,579
Unrestricted net position:Non-spendable net position:
Materials and supplies inventory - 780,627 753,043 438,408 1,972,078 Prepaid expenses and other deposits 5,008,484 85,284 65,251 551,709 5,710,728
Total non-spendable net position 5,008,484 865,911 818,294 990,117 7,682,806
Spendable net position is designated as follows:Unrestricted 130,058,050 42,219,201 6,075,837 (94,676,727) 83,676,361
Total spendable net position 130,058,050 42,219,201 6,075,837 (94,676,727) 83,676,361
Total unrestricted net position 135,066,534 43,085,112 6,894,131 (93,686,610) 91,359,167
Total net position $ 394,438,933 95,814,352 83,189,345 7,978,418 581,421,048

Report on Internal Controls and Compliance

67
Independent Auditor’s Report on Compliance on Internal Control over Financial Reporting and on Compliance and Other Matters Based on an Audit of Financial Statements
Performed in Accordance with Government Auditing Standards
Board of Directors Santa Clarita Valley Water Agency Santa Clarita, California
We have audited, in accordance with the auditing standards generally accepted in the United States of America and the standards applicable to financial audits contained in Government Auditing Standards issued by the Comptroller General of the United States, the financial statements of the Santa Clarita Valley Water Agency (Agency), as of and for the six month period ended June 30, 2018, and the related notes to the financial statements, which collectively comprise the Agency’s basic financial statements, and have issued our report thereon dated March 18, 2019.
Internal Control Over Financial Reporting
In planning and performing our audit of the financial statements, we considered the Agency’s internal control over financial reporting (internal control) to determine the audit procedures that are appropriate in the circumstances for the purpose of expressing our opinions on the financial statements, but not for the purpose of expressing an opinion on the effectiveness of the Agency’s internal control. Accordingly, we do not express an opinion on the effectiveness of the Agency’s internal control.
A deficiency in internal control exists when the design or operation of a control does not allow management or employees, in the normal course of performing their assigned functions, to prevent, or detect and correct, misstatements on a timely basis. A material weakness is a deficiency, or a combination of deficiencies, in internal control, such that there is a reasonable possibility that a material misstatement of the entity’s financial statements will not be prevented, or detected and corrected on a timely basis. A significant deficiency is a deficiency, or a combination of deficiencies, in internal control that is less severe than a material weakness, yet important enough to merit attention by those charged with governance.
Our consideration of internal control was for the limited purpose described in the first paragraph of this section and was not designed to identify all deficiencies in internal control that might be material weaknesses or, significant deficiencies and therefore, material weaknesses or significant deficiencies may exist that have not been identified. We did identify certain deficiencies in internal control, described in the separate management report that we consider to be material weaknesses.
Preparation of Fiscal Year End Trial Balance; and Communication between Divisions.
68
Independent Auditor’s Report on Compliance on Internal Control over Financial Reporting and on Compliance and Other Matters Based on an Audit of Financial Statements
Performed in Accordance with Government Auditing Standards, Continued
Compliance and Other Matters
As part of obtaining reasonable assurance about whether Agency’s financial statements are free from material misstatement, we performed tests of its compliance with certain provisions of laws, regulations, contracts, and grant agreements, noncompliance with which could have a direct and material effect on the determination of financial statement amounts. However, providing an opinion on compliance with those provisions was not an objective of our audit, and accordingly, we do not express such an opinion. The results of our tests disclosed no instances of noncompliance or other matters that are required to be reported under Government Auditing Standards.
Purpose of this Report
The purpose of this report is solely to describe the scope of our testing of internal control and compliance and the results of that testing, and not to provide an opinion on the effectiveness of the entity’s internal control or on compliance. This report is an integral part of an audit performed in accordance with Government Auditing Standards in considering the entity’s internal control and compliance. Accordingly, this communication is not suitable for any other purpose.
Fedak & Brown LLP Cypress, California March 18, 2019