Santa Barbara County Public Works Department User Fee ...
12
2251 Harvard Street, Suite 134 | Sacramento, CA 95815 |916.443.3411 | mgtconsulting.com Santa Barbara County Public Works Department User Fee Study Report: Surveyor March 18, 2021
Transcript of Santa Barbara County Public Works Department User Fee ...
2251 Harvard Street, Suite 134 | Sacramento, CA 95815 |916.443.3411 | mgtconsulting.com
Santa Barbara County Public Works Department
User Fee Study Report: Surveyor
March 18, 2021

Table of Contents
I Executive SummaryIntroduction 1Study Scope & Objectives 1Methodology 2Legal, Economic and Policy Considerations 3Study Findings 6Surveyor Summary Charts 7

EXECUTIVE SUMMARY
Introduction
MGT Consulting Group (MGT) is pleased to present the Santa Barbara County Public Works Department (County) with this summary of user fee findings for the County’s Surveyor fees.
The County is interested in knowing the current full cost of its various services and exploring options to modify fees to better reflect the Board of Supervisor’s priorities. The County contracted with MGT to perform this review using fiscal year 2018/19 actual personnel, indirect costs and operational information. MGT was also tasked with recommending fee adjustments based on the resulting fully burdened cost of services and industry best-practices.
This report is the culmination of the extensive work between MGT and County management and staff. MGT would like to take this opportunity to acknowledge all who participated on this project for their efforts and coordination. Their responsiveness and continued interest in the outcome of this study contributed greatly to the success of this study.
Study Scope and Objectives
This study included a review of fee-for-service activities within the following area:
Public Works: Surveyor
The study was performed under the general direction of the Public Works Administration division with the participation of representatives from the Surveyor division. The primary goals of the study were to:
Define what it costs the County to provide various fee-related services.
Recommend fee adjustments based on full cost analysis and industry best practices.
Develop revenue projections based on recommended increases (or decreases) to fees.
Provide user fee models and templates to County staff enabling staff to update the study results in future years and incorporate new fees as they occur.
1
The information summarized in this report addresses each of these issues and provides County management with the tools necessary to make informed decisions about possible fee adjustments and the resulting impact on revenues.
MGT’s scope was limited to analysis of user fees only. User fees are charges to recover staff and materials costs related to the processing of applications and permits.
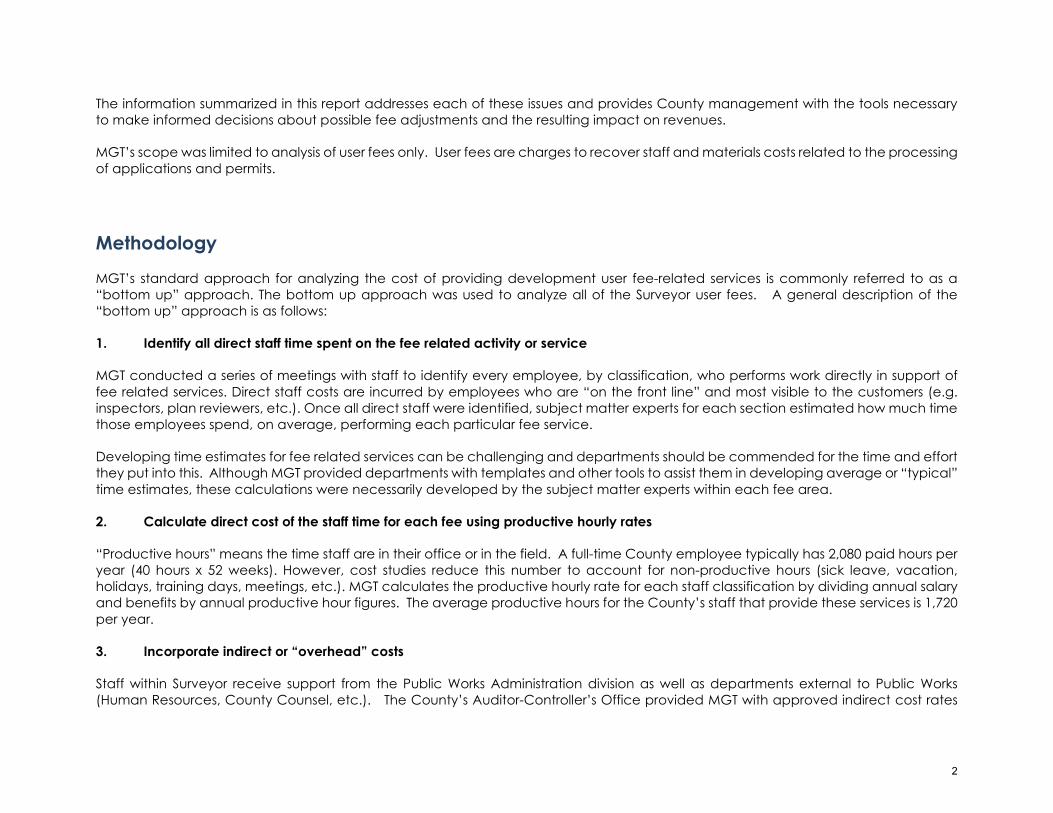
Methodology
MGT’s standard approach for analyzing the cost of providing development user fee-related services is commonly referred to as a “bottom up” approach. The bottom up approach was used to analyze all of the Surveyor user fees. A general description of the “bottom up” approach is as follows:
1. Identify all direct staff time spent on the fee related activity or service
MGT conducted a series of meetings with staff to identify every employee, by classification, who performs work directly in support of fee related services. Direct staff costs are incurred by employees who are “on the front line” and most visible to the customers (e.g. inspectors, plan reviewers, etc.). Once all direct staff were identified, subject matter experts for each section estimated how much time those employees spend, on average, performing each particular fee service.
Developing time estimates for fee related services can be challenging and departments should be commended for the time and effort they put into this. Although MGT provided departments with templates and other tools to assist them in developing average or “typical” time estimates, these calculations were necessarily developed by the subject matter experts within each fee area.
2. Calculate direct cost of the staff time for each fee using productive hourly rates
“Productive hours” means the time staff are in their office or in the field. A full-time County employee typically has 2,080 paid hours per year (40 hours x 52 weeks). However, cost studies reduce this number to account for non-productive hours (sick leave, vacation, holidays, training days, meetings, etc.). MGT calculates the productive hourly rate for each staff classification by dividing annual salary and benefits by annual productive hour figures. The average productive hours for the County’s staff that provide these services is 1,720 per year.
3. Incorporate indirect or “overhead” costs
Staff within Surveyor receive support from the Public Works Administration division as well as departments external to Public Works (Human Resources, County Counsel, etc.). The County’s Auditor-Controller’s Office provided MGT with approved indirect cost rates
2
that, once applied against program staff costs, reflect the fully burdened cost of providing services. Indirect rates applied for each program include:
Surveyor: indirect cost rate: 128.71%
4. Compare total costs to the current fee schedule
Once all direct and indirect costs are calculated, MGT compared the total cost for each fee-related service to the fee currently charged to the public. In most cases, we found the total cost of providing a service exceeded the fee charged. In these instances, the fee can be increased to recover these subsidies. However, there was one service for which the total calculated cost was less than the fee charged. In this case, the fee must be lowered to comply with State law.
5. Annual volume figures are incorporated
Up to this point we have calculated fee costs and revenues on a per-unit basis. By incorporating annual volume figures into the analysis, we extrapolate the per-unit results into annual cost and annual revenue information. This annualization of results gives management an estimate of the fiscal impact of proposed fee adjustments.
Because annual volume will vary from one year to the next, these figures are estimates only. Actual revenue will depend on future demand level and collection rates. Also, some of the proposed fees include a restructuring of existing fee categories. In these cases, management should be conservative with fiscal impact projections.
6. Maximum allowed fee levels
MGT identifies the maximum fee that may be charged for each fee service based on full cost information and any State or Federal limitations. County staff may present alternative fee recommendations based on their knowledge of the community and historical practices. Ultimately the County’s Board of Supervisors must decide what fee levels are appropriate.
Legal, Economic & Policy Considerations
Calculating the true cost of providing County’s services is a critical step in the process of establishing user fees and corresponding cost recovery levels. Although it is an important factor, other factors must also be given consideration. County decision-makers must also consider the effects that establishing fees for services will have on the individuals purchasing those services, as well as the community as a whole.
The following legal, economic and policy issues help illustrate these considerations.
3

State Law - In California, user fees are limited to the estimated reasonable cost of providing a service by State law. None of the fee adjustments recommended by MGT contravene this State law.
Economic barriers - It may be a desired policy to establish fees at a level that permits lower income groups to use services that they might not otherwise be able to afford.
Community benefit - If a user fee service also benefits the community as a whole (at least to some extent), it may be appropriate to subsidize a portion of the fee.
Private benefit - If a user fee primarily benefits the fee payer, the fee is typically set at, or close to 100% full cost recovery. Development related fees generally fall into this category; however, exceptions are sometimes made for services such as appeal fees or fees charged exclusively to small residential applicants.
Managing demand - Elasticity of demand is a factor in pricing certain County services; increasing the price of some services may result in a reduction of demand for those services, and vice versa.
Competition - Certain services may be provided by neighboring communities or the private sector, and therefore demand for these services can be somewhat dependent on what else may be available at lower prices.
Incentives - Fees can be set low to encourage participation in a service, such as water heater permits.
Disincentives - Penalties can be instituted to discourage undesirable behavior. Examples include fines for construction without a building permit and code enforcement penalties.
The flow chart below helps illustrate the economic and policy considerations listed above.
4

5

Study Findings
The study's primary objective is to provide the County's decision-makers with the basic data needed to make informed pricing decisions. This report details the full cost of services within the Surveyor programs of Public Works and presents potential fee adjustments and their fiscal impact.
The results of the study identified that overall, most fee areas generate less revenue than the actual cost of providing services. It is not unusual to find that costs have outpaced revenues over a period of years.
The exhibit on the following page displays the costs and revenues of each service into the following categories:
Column A, Costs of Fee Services – The full cost of providing surveyor services to the public in FY 2018/19 was $514,420. These figures were derived by multiplying 2018/19 annual volume against per-unit costs for each fee schedule category. Deposit charges were incorporated as well, but at fully burdened rates.
Column B, Current Revenue – Based on current individual fee schedules, the County generates user fee related revenue of $189,839 for this program and is experiencing a 37% cost recovery level. This recovery rate means this division offset only some of its costs via fees charged to the public.
Column C, Subsidy – Current fee levels recover 37% of full cost, leaving 63% or $326,912 to be funded by other funding sources. The County may eliminate this gap by either increasing fees, reducing costs, or subsidizing cost through the general fund.
Column D, Recommend Recovery – Since the financial data utilized in the analysis is from FY 2018-2019, a 3% CPI factor was added to the recommended fixed fees that are not limited by State statute. It is estimated that adoption of the recommended cost recovery policy with the added CPI factor would generate fee revenues of $403,796. This would bring the overall cost recovery level up to 78%.
Costs, User Potential IncreasedDepartment/Division Fee Services (A) Subsidy (C) Revenue (E)
Surveyor $514,420 $189,839 37% $326,912 $403,796 78% $206,905Revenue (B) Revenue (D)
County of Santa BarbaraUser Fee Revenue Analysis
Current ForecastedCurrent Recommended
6

Column E, Increased Revenue – Increasing fees (including deposits) to the recommended levels would generate approximately $206,905 in additional revenue.
Surveyor Summary Charts
The subsequent pages display the results of our individual fee analysis. For each section the current charge, total cost and recommended fee are listed for each fee-related service.
7

User Fee Study Summary Sheet
Santa Barbara CountySurveyorFY18/19
Ord Service Name Fee DescriptionAnnual Volume
Current Fee Full CostCurrent
Recovery %Annual Cost
Annual Revenue
Annual Subsidy
Recovery Level Fee @ Policy
Level
3% CPI Added to flat fees. No
change to deposit based fees or fees set
by state.
Annual Revenue2
Increased Revenue
Recommended Subsidy
1 Agricultural Preserve (Cancellation) Fee 1.0 474$ 333$ 142% 333$ 474$ (141)$ 100% 333$ 343$ 343$ (131)$ (10)$
2 Agricultural Preserve (New) Fee 3.0 -$ 333$ 0% 999$ -$ 999$ 100% 333$ 343$ 1,029$ 1,029$ (30)$
3 Agricultural Preserve (Non-Renewal) Delete - 474$ -$ 0% -$ -$ -$ 100% -$ -$ -$ -$ -$
4 Agricultural Preserve (Replacement) Fee 7.0 -$ 333$ 0% 2,332$ -$ 2,332$ 100% 333$ 343$ 2,402$ 2,402$ (70)$
5 Boundary Line Agreement (Ch. 21A only)Change to Deposit 1.0 1,315$ 4,497$ 29% 4,497$ 1,315$ 3,182$ 100% 3,000$ 3,000$ 4,497$ 2,995$ -$
6 Certificate of Compliance Deposit 35.0 2,002$ 2,132$ 94% 74,624$ 70,070$ 4,554$ 100% 2,000$ 2,000$ 74,624$ 4,554$ -$
7 Certificate of CorrectionFee set by Clerk Recorder Office 3.0 14$ 800$ 2% 2,399$ 42$ 2,357$ 2% 14$ 14$ 42$ -$ 2,357$
8 Conditional Certificate of Compliance Deposit 1.0 559$ 616$ 91% 616$ 559$ 57$ 100% 616$ 616$ 616$ 57$ -$
9 Corner RecordFee set by Clerk Recorder Office 46.0 17$ 833$ 2% 38,311$ 782$ 37,529$ 2% 17$ 17$ 782$ -$ 37,529$
10 Final Map 5-50 lots Deposit 1.5 5,793$ 15,891$ 36% 23,836$ 8,690$ 15,147$ 100% 8,500$ 8,500$ 23,836$ 14,205$ -$
11 Final Map 50+ lots Deposit 1.0 6,766$ 20,671$ 33% 20,671$ 6,766$ 13,905$ 100% 14,000$ 14,000$ 20,671$ 13,066$ -$
12 Final Map 75 and Up Delete 1.0 11,180$ -$ 0% -$ 11,180$ (11,180)$ 100% -$ -$ -$ (11,180)$ -$
13 Lot Line AdjustmentChange to Deposit 5.5 1,667$ 4,497$ 37% 24,736$ 9,169$ 15,567$ 100% 3,000$ 3,000$ 24,736$ 14,597$ -$
14 Monument Inspection (Final Maps) Change to Depos 1.0 427$ 1,749$ 24% 1,749$ 427$ 1,322$ 100% 1,000$ 1,000$ 1,749$ 1,322$ -$
15 Parcel MapChange to Deposit 5.0 3,232$ 11,510$ 28% 57,550$ 16,160$ 41,390$ 100% 5,000$ 5,000$ 57,550$ 38,975$ -$
15.1 Parcel Validity Determination Fee 17.5 67$ 133$ 50% 2,332$ 1,173$ 1,159$ 100% 133$ 137$ 2,402$ 1,229$ (70)$
16 Record of Survey (reflective of County subsidy)Subsidized Deposit 22.0 530$ 3,931$ 13% 86,483$ 11,660$ 74,823$ 13% 530$ 546$ 12,010$ 350$ 74,474$
Per Unit Annual Per Unit AnnualCurrent Recommendations
8

User Fee Study Summary Sheet
Santa Barbara CountySurveyorFY18/19
Ord Service Name Fee DescriptionAnnual Volume
Current Fee Full CostCurrent
Recovery %Annual Cost
Annual Revenue
Annual Subsidy
Recovery Level Fee @ Policy
Level
3% CPI Added to flat fees. No
change to deposit based fees or fees set
by state.
Annual Revenue2
Increased Revenue
Recommended Subsidy
Per Unit Annual Per Unit AnnualCurrent Recommendations
16.1 Record of Survey - Subsequent Review*Subsidized Deposit 10.0 233$ * * * 2,330$ * * * 240$ 2,400$ 70$ *
16.2 Record of Survey New Deposit 23.0 530$ 3,931$ 13% 90,415$ 12,190$ 78,225$ 100% 3,400$ 3,400$ 90,415$ 78,225$ -$
17 Recorded Map Modification Fee 1.0 1,057$ 1,283$ 82% 1,283$ 1,057$ 226$ 100% 1,283$ 1,321$ 1,321$ 264$ (38)$
18 Reversion to Acreage Map (Final Map)Change to Deposit 1.0 1,663$ 11,510$ 14% 11,510$ 1,663$ 9,847$ 100% 5,000$ 5,000$ 11,510$ 9,318$ -$
19 Reversion to Acreage Map (Parcel Map)Change to Deposit 1.0 1,663$ 11,510$ 14% 11,510$ 1,663$ 9,847$ 100% 5,000$ 5,000$ 11,510$ 9,318$ -$
20 Road name (per road) Fee 4.0 130$ 316$ 41% 1,266$ 520$ 746$ 100% 316$ 326$ 1,304$ 784$ (38)$
20.1 Right of Way Determination Deposit 1.0 883$ 833$ 106% 833$ 883$ (50)$ 100% 800$ 800$ 833$ (50)$ -$
21 Tentative Final Map 5-49 lots Fee 3.5 1,166$ 3,331$ 35% 11,660$ 4,081$ 7,579$ 100% 3,331$ 3,431$ 12,010$ 7,929$ (350)$
22 Tentative Final Map 50 + lots Fee 1.0 1,304$ 4,547$ 29% 4,547$ 1,304$ 3,243$ 100% 4,547$ 4,684$ 4,684$ 3,380$ (136)$
23 Tentative Final Map - 76+ Delete 1.0 1,498$ -$ 0% -$ 1,498$ (1,498)$ 100% -$ -$ -$ (1,498)$ -$
24 Tentative Lot Line Adjust (PC/ZA) Fee 4.0 1,446$ 2,382$ 61% 9,528$ 5,784$ 3,744$ 100% 2,382$ 2,453$ 9,814$ 4,030$ (286)$
25 Tentative Parcel Map Fee 5.0 1,150$ 2,049$ 56% 10,244$ 5,750$ 4,494$ 100% 2,049$ 2,110$ 10,551$ 4,801$ (307)$
26 Voluntary MergerChange to Deposit 10.0 1,265$ 2,016$ 63% 20,155$ 12,650$ 7,505$ 100% 1,500$ 1,500$ 20,155$ 6,865$ -$
29 Condominium Map Delete - 3,232$ -$ 0% -$ -$ -$ 100% -$ -$ -$ -$ -$
30 Survey Specialist Per Hour - 157$ 167$ 94% -$ -$ -$ 100% 167$ 172$ -$ -$ -$
9
User Fee Study Summary Sheet
Santa Barbara CountySurveyorFY18/19
Ord Service Name Fee DescriptionAnnual Volume
Current Fee Full CostCurrent
Recovery %Annual Cost
Annual Revenue
Annual Subsidy Recovery Level Fee @ Policy
Level
3% CPI Added to flat fees. No
change to deposit based fees or fees set
by state.
Annual Revenue2
Increased Revenue
Recommended Subsidy
Per Unit Annual Per Unit AnnualCurrent Recommendations
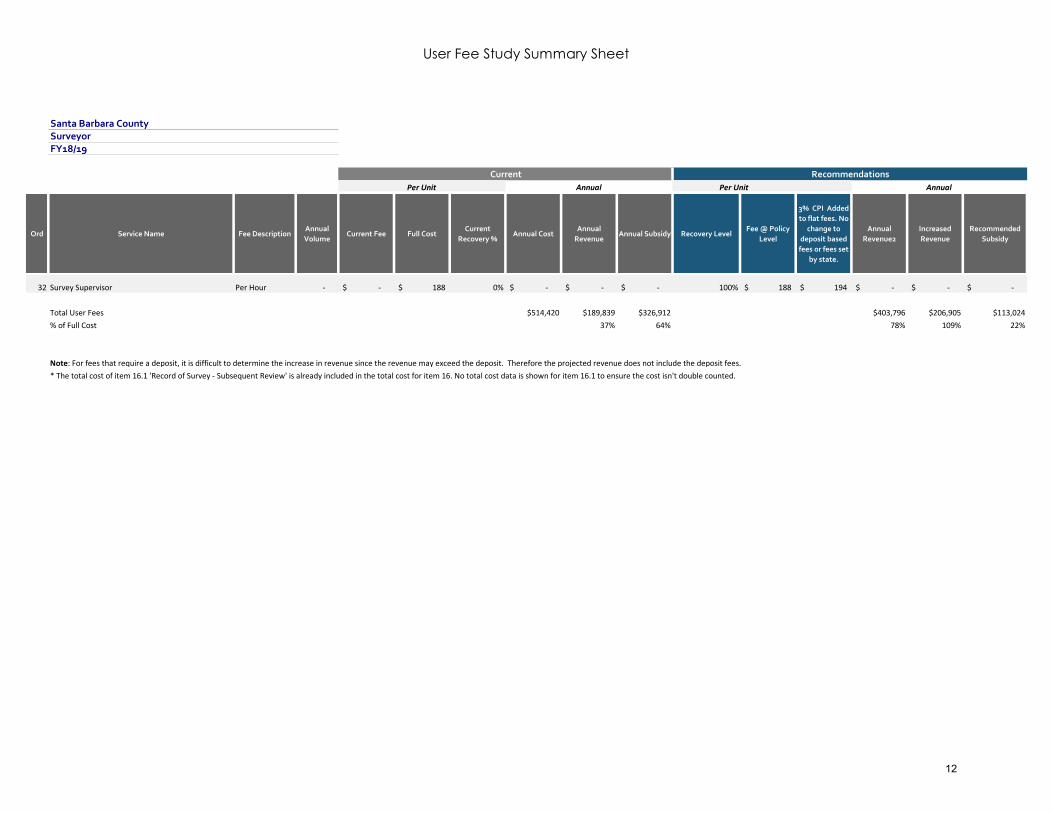
32 Survey Supervisor Per Hour - -$ 188$ 0% -$ -$ -$ 100% 188$ 194$ -$ -$ -$
Total User Fees $514,420 $189,839 $326,912 $403,796 $206,905 $113,024% of Full Cost 37% 64% 78% 109% 22%
Note: For fees that require a deposit, it is difficult to determine the increase in revenue since the revenue may exceed the deposit. Therefore the projected revenue does not include the deposit fees.* The total cost of item 16.1 'Record of Survey - Subsequent Review' is already included in the total cost for item 16. No total cost data is shown for item 16.1 to ensure the cost isn't double counted.
12