Sanitary Survey Report - Government of Jersey
106
Sanitary Survey Report States of Jersey Grouville Bay and St. Clements Bay Final Report September 2012
Transcript of Sanitary Survey Report - Government of Jersey

Sanitary Survey Report States of Jersey Grouville Bay and St. Clements Bay
Final Report September 2012

2
Final Report Distribution
Date Name
W. Peggie
T. du Feu
A. Pinel
H. Gueno
M. Smith
J. Robert
A. Scally (aka Gregory)
G. Morel

3
Table of Contents
I. Statement of Purpose ............................................................................................................................. 5
II. Executive Summary and Sampling Plan ...................................................................................................... 7
III. Report ................................................................................................................................................... 12
1. General Description .................................................................................................................................. 12
2. Fishery ...................................................................................................................................................... 13
3. Human Population .................................................................................................................................... 16
4. Sewage discharges/surface water drainage ............................................................................................. 19
5. Land Cover ................................................................................................................................................ 36
6. Agriculture ................................................................................................................................................ 38
7. Wildlife ...................................................................................................................................................... 42
8. Meteorological data ................................................................................................................................. 47
9. Current and historical classification status ............................................................................................... 51
10. Historical E. coli data - Oysters ............................................................................................................. 53
11. Historical E. coli data – Mussels ............................................................................................................ 68
12. Designated Waters ............................................................................................................................... 79
13. Bathymetry and Hydrodynamics .......................................................................................................... 82
14. Shoreline Survey Overview ................................................................................................................... 91
15. Overall Assessment .............................................................................................................................. 93
16. Recommendations ................................................................................................................................ 98
17. References .......................................................................................................................................... 103
18. List of Figures and Tables ................................................................................................................... 105
Appendices 1. Geology and Soils Information 2. General Information on Wildlife Impacts 3. Tables of Typical Faecal Bacteria Concentrations 4. Statistical Data 5. Hydrographic Methods 6. Shoreline Survey Report © States of Jersey and Crown Copyright 2012. All rights reserved.

4
Acknowledgements
We gratefully acknowledge the following for their assistance and information:
Ms Hayley Guéno, States of Jersey Mr Duncan Berry, States of Jersey Transport & Technical Services Mr Colin Cheney, States of Jersey Mrs Linda Lowseck, States of Jersey Mr Ashley Pinel, States of Jersey Dr Jonathan Shrives, States of Jersey Mr Chris La Masurier, Jersey Oyster Company Mr Tony Legg, Jersey Sea Farms Mr Chris Isaacs, Jersey Spearfishing Club

5
I. Statement of Purpose Filter feeding, bivalve molluscan shellfish (e.g. cockles, mussels) retain and accumulate a variety of microorganisms from their natural environments. Since filter feeding promotes retention and accumulation of these microorganisms, the microbiological safety of bivalves for human consumption depends heavily on the quality of the waters from which they are taken. When consumed raw or lightly cooked, bivalves contaminated with pathogenic microorganisms may cause infectious diseases (e.g. norovirus-associated gastroenteritis, hepatitis A and salmonellosis) in humans. Infectious disease outbreaks are more likely to occur in coastal areas, where bivalve mollusc production areas are impacted by sources of microbiological contamination of human and /or animal origin. The risk of contamination of bivalve molluscs with pathogens is assessed through the microbiological monitoring of bivalves. This assessment results in the classification of production areas, which determines the level of treatment (e.g. purification, relaying, cooking) required before human consumption of bivalves. Under EC Regulation 854/2004 laying down specific rules for the organisation of official controls on products of animal origin intended for human consumption, sanitary surveys of production areas and their associated hydrological catchments and coastal waters are required in order to establish the appropriate representative monitoring points (RMPs) for the monitoring programme. The Centre for Environment, Fisheries & Aquaculture Science (Cefas) undertook a sanitary survey for the intertidal production areas on the south-east coast of Jersey on behalf of the States of Jersey. The purposes of the sanitary surveys are to demonstrate compliance with the requirements stated in Annex II (Chapter II Paragraph 6) of Regulation (EC) 854/2004, whereby ‘if the competent authority decides in principle to classify a production or relay area it must:
· make an inventory of the sources of pollution of human or animal origin likely to be a source of contamination for the production areas;
· examine the quantities of organic pollutants which are released during the
different periods of the year, according to the seasonal variations of both human and animal populations in the catchment area, rainfall readings, waste-water treatment, etc.;
· determine the characteristics of the circulation of pollutants by virtue of current
patterns, bathymetry and the tidal regime in the production area; and
· establish a sampling programme of bivalve molluscs in the production area which is based on the examination of established data, and with a number of samples, a geographical distribution of the sampling points and a sampling frequency which must ensure that the results of the analysis are as representative as possible for the area considered.’

6
The sanitary survey results in recommendations on the location of RMPs, the frequency of sampling for microbiological monitoring, and the boundaries of production areas deemed to be represented by the RMPs. The sanitary survey presented in this report has been undertaken on the basis recommended in the European Union Reference Laboratory publication: “Microbiological Monitoring of Bivalve Mollusc Harvesting Areas Guide to Good Practice: Technical Application” (http://www.crlcefas.org/gpg.asp).
7
II. Executive Summary and Sampling Plan Executive Summary The island of Jersey lies in the English Channel west of the Cotentin Peninsula in Normandy, France. St Clement’s Bay and Grouville Bay are located on the south eastern coastline of the island. St Clement’s Bay is a south-facing bay approximately 2 km east of Jersey’s capital, St Helier. Grouville Bay is east facing and stretches from Gorey harbour in the north to La Rocque point in the south. The bivalve mollusc fishery at Grouville Bay and St. Clement’s Bay consists of mixed aquaculture production of Pacific oysters (Crassostrea gigas) and mussels (Mytilis edulis). The previous Pacific oyster production at Green Island is being largely replaced with flat oysters (Ostrea edulis). It is intended that the O. edulis will be harvested from September to April inclusive. The currently classified beds are distributed amongst 13 areas. Other shellfishery operations, such as harvesting of ormers and scallops, were not included in the scope of this sanitary survey. Pacific oyster production in Jersey in 2009 was approximately 903 tonnes and mussel production was 101 tonnes (Aquafish Solutions Ltd, 2010). The two species are monitored separately and classification monitoring to date has tended to be undertaken separately for each bed (“Area”). Southeastern Jersey is densely populated, with the town of St. Helier the main centre of population. Settlement along the shores of St. Clement’s Bay and Grouville Bay is mainly concentrated in a narrow strip adjacent to the shore. Tourism is important and large numbers of visitors arrive at Jersey via air and sea from the UK and France. St. Helier is an active commercial port and is also a popular yachting destination. The majority of dwellings (85%) are connected via mains sewerage to Bellozanne Sewage Treatment Works west of St. Helier. Those not connected to mains generally have septic tanks with soakaway systems. The STW comprises both secondary and tertiary (UV) treatment processes with capacity to store up to 25,000 m3 of storm water flow. After heavy rainfall, effluent from the works will be a composite of fully and partially treated sewage, though the entire volume will have received UV treatment. Spills can, and do occasionally occur in heavy rainfall conditions at some of the 111 pumping stations around the island, some of which are located near the fishery. Much of the interior of the island is used for agricultural production, mainly of potatoes and other fruit and vegetable crops, dairy and beef cattle, poultry and crops used for fodder. Slurry and farm yard manure wastes produced by the livestock industry are recycled back onto the land as fertiliser. Fields are classed according to their risk of contaminating water, and application of slurry is not permitted on high risk fields, as well as during winter months (except by prior consultation). One large poultry farm is located within 500 metres of the shore at Grouville Bay. Three permanent streams were identified: one discharging at Gorey slip to the north of the shellfisheries in Grouville Bay and two discharging at Le Dicq to the west of the shellfisheries in St Clement’s Bay. All of these may by contaminated with land run-off after rainfall and thus constitute significant potential sources of contamination. Low flows and some E. coli content have been seen at many of the observed outfalls/outlets during dry weather. This will increase during wet weather at those

8
containing stream water, land run-off or road run-off even in the absence of sewerage overflow operation. Southeast Jersey hosts significant populations of wildlife, mainly geese, gulls and wading birds and the largest numbers of these are present between October and March. Seals are also present around the southeast coast. The main potential sources of faecal contamination to the bivalve fishery come from three broad categories:
1. Those arising in the immediate vicinity of the trestles which include wildlife sources and possible discharges from boats.
2. Those arising from the near shore, which include fresh water sources, surface water overflows and intermittent outfalls. These may contain a mix of point and diffuse source contamination of both human and animal origin.
3. Those arising from further afield, which would include discharges at Bellozanne as well as intermittent rainfall-related discharges from the Cavern stormwater storage facility and at Le Dicq outfall.
The mix of sources affecting the St. Clements Bay fishery differ from those likely to impact the Grouville Bay fishery. From a geographical perspective, these can be further described as:
i. To the west of St Clement’s Bay, there is the continuous discharge at Bellozanne and the intermittent rainfall-related discharges from the Cavern and the Le Dicq outfall, and the stream outlets further up the shore at Le Dicq. There may also be contributions from boat activity in the vicinity of the harbour and marina at St Helier.
ii. To the north of the shellfish sites in Grouville Bay there is the stream with intermittent discharge at Gorey slip and other intermittent outfalls between there and Fauvic. The main impacts from wildlife will be seen at the more northerly classified areas within Grouville Bay.
Dilution of contamination and mixing of seawater is generally high but this may be modified at the local level by the seawater running through the system of gutters and channels in the sand. Currents tend to flow southward in Grouville Bay much of the time. However, over the last half of the flood tide and the first half of the ebb tide the flow will be principally in a northerly direction. In St Clement’s Bay the currents tend to flow eastward over the ebb tide and westward over the flood tide. From the historical shellfish E. coli data obtained up to September 2011, the western side of St Clement’s Bay and the southern end of Grouville Bay showed the highest levels of contamination and the two oyster areas at Seymour Tower the lowest. Since September 2011, a number of high results have been obtained for the Pacific oyster sampling points in Grouville Bay and a very high result was seen in Area 26 at Seymour Tower. Given the large population and its associated activities, on the south-east side of the island of Jersey, it is presently unlikely that shellfisheries located relatively close to shore will consistently attain the quality required for an A classification. The

9
associated water quality of an average (geometric mean) of <10 E. coli/100 ml is very stringent compared to bathing water standards (e.g. a 90%ile of 250 E. coli/100 ml for the Excellent category under the 2006 Directive).
Frequency of sampling The stability assessment, based on geometric mean values, suggested the possibility of consideration of bimonthly sampling for some of the production areas. However, given that the current proposals include some reorganisation of the production areas together with a rationalisation of monitoring points and relocation of some of the remaining ones, it is recommended that this is considered after any new monitoring programme has been in place for at least one year. Given that many of the potentially impacting sources are rainfall-dependent, a bimonthly sampling frequency could be too infrequent to detect the impact of such sources on the microbiological quality of the shellfisheries. This aspect should also be taken into account in any future review of sampling frequency. Seasonality of sampling Given that there are different practices between the companies with regard to the seasonality of harvest of Pacific oysters and mussels, it is recommended that the sampling for these species be undertaken throughout the year. In contrast, the flat oysters will only be harvested by one company and the season is intended to reflect the traditional approach of September to April inclusive. Once Green Island is classified for this species, ongoing sampling could start in August, prior to the season and then continue monthly through to April. However, if parallel monitoring indicates that the Pacific oysters adequately reflect the quality of the flat oysters as well at that location, year- round sampling of just the Pacific oysters may be considered.

10
States of Jersey Sampling Plan – Pacific oyster (Crassostrea gigas) PRODUCTION AREA
Green Island
Le Hocq Le Hurel
Holding Bed Le Hurel Main
Bed North Le Hurel Main
Bed South Seymour Tower
A Seymour
Tower B
SPECIES C. gigas & O. edulis
C. gigas
C. gigas
C. gigas
C. gigas
C. gigas
C. gigas
TYPE OF FISHERY trestle trestle trestle trestle trestle trestle trestl
RMP Location (WGS84) 49° 9’.48 N 2° 3’.84 W
49° 9’.54 N 2° 3’.20 W
49° 10’.21 N 2° 1’.44 W
49° 10’.50 N 2° 1’.07 W
49° 10’.02 N 2° 0.’83 W
49° 9’.28 N 2° 0.’10 W
49° 9’.49 N 1° 59’.79 W
TOLERANCE (M) 20 20 20 20 20 20 20 DEPTH (M) not applicable not applicable not applicable not applicable not applicable not applicable not applicable
METHOD OF SAMPLING Hand Hand Hand Hand Hand Hand Hand FREQUENCY
OF SAMPLING Monthly (both
species)
Monthly
Monthly
Monthly
Monthly
Monthly
Monthly
PRODUCTION AREA BOUNDARY (WGS84)
The area bounded
by a line drawn from
49° 9’.55 N 2° 4’.04 W to 49° 9’.55 N 2° 3’.42 W to 49° 9’.24 N 2° 3’.42 W to 49° 9’.24 N 2° 4’.04 W
and back to 49° 9’.55 N 2° 4’.04 W
The area bounded
by a line drawn from 49° 9’.70 N 2° 3’.33 W to 49° 9’.70 N 2° 2’.39 W to 49° 9’.23 N 2° 2’.39 W to 49° 9’.23 N 2° 3’.33 W and back to 49° 9’.70 N 2°
3’.33 W
The area bounded by a line drawn
from 49° 10’.44 N 2° 1’.58 W to 49°
10’.44 N 2° 1’.27 W to 49° 10’.01 N 2°
1’.27 W to 49° 10’.01 N 2° 1’.58 W
and back to 49° 10’.44 N 2° 1’.58 W
The area bounded by a line drawn
from 49° 10’.75 N 2° 1’.42 W to 49°
10’.92 N 2° 0’.89W to 49° 10’.46 N 2°
0’.59 W to 49° 10’.31 N 2° 1’.12 W
and back to 49° 10’.75 N 2° 1’.42
W
The area bounded
by a line drawn from 49° 10’.31 N 2° 1’.12 W to 49°
10’.46 N 2° 0’.59 W to 49° 10’.02 N 2°
0’.30 W to 49° 9’.87 N 2° 0’.83 W and back to 49° 10’.31
N 2° 1’.12 W
The area bounded by a line drawn from
49° 9’.75 N 2° 0’.30 W to 49° 9’.75 N 1°
59’.49 W to 49° 9’.21 N 1° 59’.49 W to
49° 9’.21 N 2° 0’.30 W and back to 49°9’.75 N 2° 0’.30 W
11
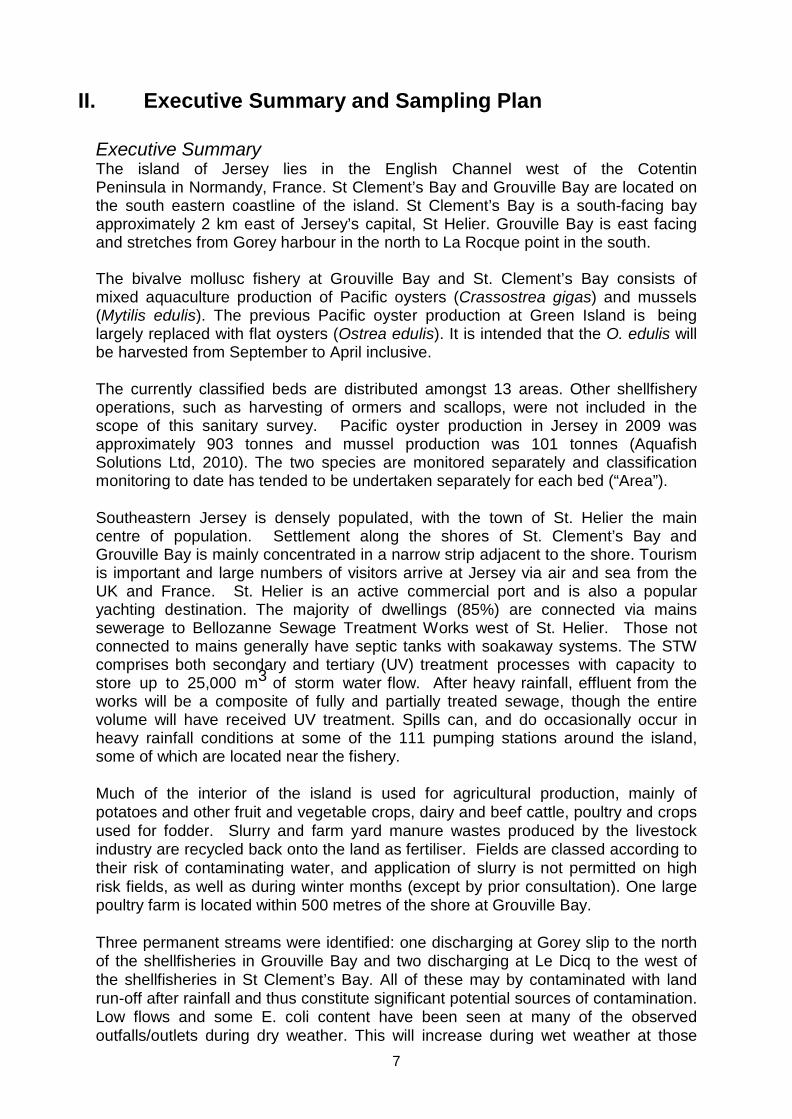
PRODUCTION AREA
Le Hocq
Le Hurel Holding Bed Le Hurel Main Bed
North SPECIES M. edulis M. edulis M. edulis TYPE OF FISHERY trestle trestle trestle and pole RMP LOCATION (WGS84) 49° 9’.40 N 2° 2’.77 W1 49° 10’.35 N 2° 1’.49W2 49° 10’.50 N 2° 1’.07 W3
TOLERANCE (M) 20 20 20 DEPTH (M) not applicable not applicable not applicable METHOD OF SAMPLING Hand Hand Hand FREQUENCY OF SAMPLING
Monthly
Monthly
Monthly
PRODUCTION AREA BOUNDARY (WGS84)
The area bounded by a line drawn from 49° 9’.70 N 2°
3’.33 W to 49° 9’.70 N 2° 2’.39 W to 49° 9’.23 N 2’.39 W to 49° 9’.23 N 2° 3’.33 W and back to 49°
9’.70 N 2° 3’.33 W
The area bounded by a line drawn from 49° 10’.44 N 2° 1’.58 W to 49° 10’.44 N 2° 1’.27 W to 49° 10’.01 N 2° 1’.27 W to 49° 10’.01 N 2° 1’.58 W and back to 49°
10’.44 N 2° 1’.58 W
The area bounded by a line drawn from 49° 10’.75 N 2° 1’.42 W to 49° 10’.92 N 2° 0’.89W to 49° 10’.46 N 2° 0’.59 W to 49° 10’.31 N 2° 1’.12 W and back to 49° 10’.75 N 2° 1’.42 W
States of Jersey Sampling Plan – Common mussel (Mytilus edulis)
Notes: 1A location on Area 25 has been proposed as there are currently no mussels at Area 8. If this situation changes, the RMP should be moved to coincide with that of oysters at Area 8. 2A location on Area 27 has been proposed as there are currently no mussels at Area 6. If this situation changes, the RMP should be moved to coincide with that of oysters at Area 6. 3Located on the trestles

12
III. Report 1. General Description Jersey lies in the English Channel approximately 30km west of the Cotentin Peninsula in Normandy, France. The shortest distance between the north east of the island and France is 22km. St Clement’s Bay and Grouville Bay are located on the south eastern coastline of the island. St Clement’s Bay is a south-facing bay approximately 2 km east of Jersey’s capital, St Helier. It is shallow, with depths of up to 10 m and is scattered with patches of reef. The bay stretches 3 km from Green Island in the west to La Rocque point in the east. Grouville Bay is east facing and stretches from Gorey harbour in the north to La Rocque point in the south. The bay is shallow with depths of up to 8 m and mainly sandy apart from the most southerly extent, which is scattered with patches of reef.
Produced by Cefas Weymouth Laboratory. © Crown Copyright 2012. All rights reserved. Base map ©States of Jersey 2012
Figure 1.1 Location of St Clement’s Bay and Grouville Bay

13
2. Fishery The bivalve mollusc fishery at Grouville Bay and St. Clement’s Bay consists of mixed aquaculture production of Pacific oysters (Crassostrea gigas) and mussels (Mytilis edulis). The currently classified beds are distributed amongst 13 areas, as listed in Table 2.1 and identified in the map in Figure 2.1. The concession containment area shown on the map is a boundary encompassing all of the existing concessions. The extents of the individual concessions were provided by the States of Jersey. Other shellfishery operations, such as harvesting of ormers and scallops, were not included in the scope of this sanitary survey. GPS locations for the corners of the current farm areas (areas of trestles or poles) were recorded by staff from the States of Jersey Department of the Environment.
Table 2.1 St Clement’s Bay and Grouville Bay shellfish farms
Location
Production Area
Bed Name
Species Monitoring point location
(WGS84) Latitude Longitude
Grouville Bay
La Hurel Main Bed
(La Rocque)
Area 1 C. gigas 49° 10.293' 002° 00.875' Area 21 C. gigas 49° 10.021' 002° 00.838' Area 22 C. gigas As Area 21
Area 24 C. gigas
M. edulis
49° 10.508' 002° 01.101'*
Area 28 C. gigas
M. edulis
49° 10.737'
002° 01.318'
La Hurel Holding
Bed (La Rocque)
Area 6 C. gigas 49° 10.225' 002° 01.435'
Area 27 C. gigas M. edulis
49° 10.392'
002° 01.499'
Area 29 C. gigas 49° 10.148' 002° 01.399'
Seymour Tower
Seymour Tower (La Rocque)
Area 26 C. gigas 49° 09.277' 002° 00.101' Area 20 C. gigas 49° 09.487' 001° 59.793'
St
Clement’s Bay
Le Hocq Main
Bed
Area 8 C. gigas 49° 09.613' 002° 03.200'
Area 25 C. gigas M. edulis
49° 09.418'
002° 02.768'
Green Island Area 12 C. gigas Variable Note: *location of C. gigas monitoring point. M. edulis monitoring point location is variable. Most of the bivalve mollusc production is undertaken in poches on trestles in the intertidal area. Mussels are also grown on poles in the outer part of Area 24. Harvesting is undertaken all year round. Most of the areas are only accessible at low spring tides. The Le Hocq Main Bed is primarily used for the growth of seed oysters for 4-6 months after which they are moved to the La Hurel Main Bed. The La Hurel holding area is used for hardening off oysters prior to sale: the stock there can also be accessed under a greater range of tidal states. Mussels in poches on the La Hurel main bed are imports which are kept on the beds for 3 – 6 months before sale.

14
Mussels on the poles brought in as seed on ropes from Ireland, then wound round the poles and grown on for approximately 2 years before harvesting in July and August. Oysters at Green Island are grown in Ortac suspended baskets. Production at this site is shifting from C. gigas to Ostrea edulis and monitoring towards classification of the latter is due to start early 2012. It is intended that the O. edulis will be harvested from September to April inclusive. Area 1 is currently largely dormant but there is the intention to resume usage and therefore classification of the area will continue. The harvesting seasons for the Pacific oysters vary significantly between the companies, ranging from just the Christmas period to essentially year round. Pacific oyster production in Jersey in 2009 was approximately 903 tonnes and mussel production was 101 tonnes (Aquafish Solutions Ltd, 2010). Classification monitoring to date has tended to be undertaken separately for each bed (“Area”) listed in Table 2.1 although some adjacent beds have been combined for monitoring purposes where insufficient samples had been available from one of the beds. The two species are monitored separately. Apart from the mussel poles, specific bags contain stock for sampling at an identified location on the beds. The current monitoring points are given in Table 2.1.

15
Produced by Cefas Weymouth Laboratory. © Crown Copyright 2012. All rights reserved.
Base map ©States of Jersey 2012 Figure 2.1 St Clement’s Bay and Grouville Bay Fishery

16
3. Human Population Figure 3.1 shows information obtained from the States of Jersey on the population density of parishes within the vicinity of St Clement’s Bay and Grouville Bay. The last census was undertaken in 2011. It also shows the location of settlements, the ferry terminal and marinas in relation to the fisheries. Human population/parishes: The island of Jersey had an estimated total population of 97857 in 2011 with a population density of 843 people per km2. The island of Jersey is divided into twelve administrative districts or parishes. Of these, two parishes; St Clement and Grouville, lie immediately adjacent to the fisheries and a further three parishes (St Helier, St Martin and St Saviour) are in the close vicinity. St Helier is the largest town in Jersey with parts of its urban area situated in the adjacent parish of St Saviour and suburbs sprawling into the parishes of St Lawrence and St Clement. Table 3.1 shows the total populations, area and population density for each parish. Table 3.1 Parishes close to St Clement’s Bay and Grouville Bay
Parish Area (km2)
Total Population (2011)
Population density (Number of people per
km2) St Clement 4.2 9221 2195 Grouville 7.8 4866 624 St Helier 10.6 33522 3162 St Martin 10.3 3763 365
St Saviour 9.3 13580 1460 Three settlements are located in close vicinity to the fisheries: St Helier as previously mentioned, St Clement, which runs the length of St Clement’s Bay and Gorey located at the northern end of Grouville Bay. Although not recognised as a specific settlement there is also a group of dwellings associated with the parish of Grouville, located on the central shoreline of Grouville Bay. Hospitals/schools: The main hospital for Jersey is located in St Helier, west of the marina, and has full facilities including an A&E department. A second hospital, St Saviour’s, is located in St Saviour, to the east of St Helier. There are eleven primary, secondary and special needs schools in St Saviour, ten primary, secondary and special needs schools in St Helier, two primary, one secondary school in St Clement and one primary school in Grouville (http://www.islandlife.org/schools_jsy.htm). Seasonal population: Jersey’s excellent infrastructure and close proximity to France, Guernsey & the UK makes it a popular destination for tourists. The island of Jersey welcomed 689,700 visitors in 2011 (an average of just over 13000 per week), for whom there

17
were 11,106 registered tourism bed spaces at 136 establishments, with a reported average occupancy of 62% (States of Jersey Department of Environment, personal communication). The peak tourist season is from May to September inclusive (Jersey Tourism, 2011). Therefore, a significant seasonal increase in population is expected particularly during the peak tourist months. Boats and shipping: There is a significant amount of boating activity in the area surrounding St Clement’s Bay and Grouville Bay. The Port of Jersey is located at St Helier, 2 km west of St Clement’s Bay. Within the port is St Helier Marina, which has pontoon mooring facilities for over 1150 craft across 3 separate marinas and numerous facilities including a cafe, parking, showers and public toilets. In addition, there are over 500 drying moorings within the St Helier old Commercial Quay (Port of Jersey, 2011). Information on tourism numbers provided by the Department of the Environment identified that 23,400 yachtsmen visited the island in 2011. Two ferry terminals offering daily services to Guernsey, Portsmouth, Poole, St Malo, Granville and Carteret. The route of St Helier to Carteret ferry passes approximately 2 km from the area 20 and 26 oyster sites. The ferry terminals have facilities including two cafes/bar and public toilets. St. Helier is also a commercial port and has four commercial working berths. The port accommodates a large fishing fleet. The Port of Jersey website states that it is regularly visited by cruise ships, however the States of Jersey Department of Environment report that the port is visited a maximum of once per year by cruise ships, and that most of these dock in the north of the island. Gorey harbour, located at the northern end of Grouville Bay, is a tidal harbour providing mooring and shelter for over 240 local vessels. La Rocque harbour, located at the eastern end of St Clement’s Bay, is a tidal harbour: a relatively small number of boats and unoccupied buoys were observed there during the shoreline survey. A large number of unoccupied buoys were observed in Grouville Bay during the shoreline survey, which was undertaken in late November.

18
Produced by Cefas Weymouth Laboratory. © Crown Copyright 2012. All rights reserved. Base map ©States of Jersey 2012
Figure 3.1 Population map of St Clement’s Bay and Grouville Bay

19
4. Sewage discharges/surface water drainage A large number of outfalls and culverted outlets are present around both St Clement’s Bay and Grouville Bay. These may carry one or a combination of the following: input from streams, rainfall-related septic content, land runoff and street drainage. Due to the complex interrelationships between the various sources, the intermittent rainfall-related combined sewer overflows (CSOs) and other water outlets have been considered together in one section rather than trying to distinguish between them. Data regarding the locations and types of intermittent discharges around the coast adjacent to the fisheries of southeast Jersey were requested from the States of Jersey Department of the Environment. The information provided included public sewerage discharges and associated overflows, and other types of industrial and domestic discharges with a faecal component. Bellozanne Sewage Treatment Works The only continuous sewage discharge for the area is from the large Bellozanne Sewage Treatment Works (STW), which is located west of St Helier and discharges into St Aubin’s Bay. Bellozanne STW is designed to serve the entire population of the island, with approximately 85% of dwellings currently connected to the works. Sewage is transported to the sewage treatment works via a system of 111 pumping stations and arrives at the works through the First Tower pumping station. The diagram in Figure 4.1 gives an overview of the treatment processes used at the works.
Figure 4.1 Treatment flow through Bellozanne STW (from States of Jersey)

20
The plant provides tertiary treatment via low-pressure ultraviolet lamps (UV) for flows up to 600 litres/second. During storm conditions the plant can receive up to 1000 l/s of which 600 l/s will be fully treated and 400 l/s will go through primary treatment (screening and settling) prior to UV treatment. UV treatment of this combined effluent would be expected to be less effective than it would be for effluent coming solely from the secondary treatment works. According to the States of Jersey Transport and Technical Services Department (TTS), a measured applied dosing regime is used. During storm flow conditions:
· More lanes of lamps come online to cope with the increased flow · More lamps are turned on in each lane in accordance with the
measured turbidity Storm overflows occurred on 130 days out of 365 reported in 2010 and 81 out of 362 reported in 2011. Of these, the majority were relatively small. Although fewer records were available for 2011, the proportion of larger spills was very similar to that observed in 2010. A summary table of storm overflow data can be found in Appendix 1. Analysis of Bellozanne storm overflows against rainfall indicate that the response is very swift, with overflows coinciding most closely with daily rainfall as opposed to rainfall over the previous 2 days. Summary data is shown in Figure 4.2. Storm water is collected at the Cavern, which has the capacity to store up to 25000 m3. Stored water is fed into the Bellozanne works as capacity allows, however, when multiple storm events occur in succession the Cavern may overflow into the surface water drainage outfall at West of Albert/Weighbridge. According to TTS, this occurs about twice a year. The Cavern overflow is not screened or treated.
Figure 4.2 Spills at Bellozanne compared with rainfall recorded at Maison St. Louis
Limited sampling was undertaken in 2009 to assess the bacteriological quality of storm overflows from the works. Samples were during storm events on 5/10/2009, 7/10/2009 and 4/11/2009 and results from samples taken from the outflow of the UV treatment plant and from Bellozanne Stream are shown in Table 4.1.
0
5
10
15
20
25
30
0
1000
2000
3000
4000
5000
6000
7000
8000
01-Jan-11 01-Feb-11 01-Mar-11 01-Apr-11 01-May-11 01-Jun-11 01-Jul-11 01-Aug-11 01-Sep-11
Rai
nfal
l (m
m)
Spill
Vol
ume
(m3)
2011 Bellozane spill volume
2011 rain MSL

21
Table 4.1 Bellozanne overflow sampling results, 2009 Faecal Coliforms (FC)/100 ml
Date BellozanneStream
UV inflow
UV outflow First Tower outfall
Rainfall * (mm)
01/07/2009 6909 22.7 15/07/2009 19640 0.35 22/07/2009 11250 6.3 29/07/2009 100 0.1 19/08/2009 270000 109 6091 0 03/09/2009 4091 15.0 16/09/2009 410000 636 5000 2.55 30/09/2009 781818 14000 10455 0 05/10/2009 180909 1272727 450 13.55 07/10/2009 147273 4100000 15091 11.0 04/11/2009 13000 1218182 5727 2818 38.3
Text in blue refers to dates identified by TTS as having storm flows * Cumulative rainfall recorded at Airport for the 2 days prior to sampling date
Effluent arriving at the UV treatment works had FC concentrations an order of magnitude higher during storm days than during the other days measured. This is consistent with the expected FC concentrations for storm sewage overflows. The effectiveness of the UV treatment of the effluent flows varied markedly over the period, with some outflows after dry weather containing FC concentrations 2 orders of magnitude higher than expected for UV treated wastewater. The results can be compared to the typical concentrations for UV-treated effluent given in Table 4.2. In 2009, TTS identified that the secondary treatment works at Bellozanne was not performing satisfactorily and this affected compliance of the total nitrogen limit specified by the discharge permit. Bellozanne stream is a freshwater flow that runs adjacent to the works (but not through it) and is channelled into the First Tower outfall. Bellozanne stream is sampled separately above the STW. Road and catchment runoff also join the outflow below the UV treatment and therefore the outflow at First Tower is a composite of a) Bellozanne stream input, b) treatment works outflow post UV treatment, and c) surface water outfall of runoff from land and roads downstream from the treatment works. A cattle farm directly above the treatment works is likely to contribute to faecal bacterial loadings in Bellozanne stream. First Tower has two outfall locations that are phased with the state of tide. When storm flows occur in the system, flow from the east side of the island backs up from First Tower to The Cavern, and then further up the system as necessary. The Cavern provides storage for up to 25,000 m3 of storm water flow. Once capacity is reached, the cavern overflows via the West of Albert surface water pumping station to the outfall at Elizabeth Marina (Weighbridge). According to the bathing water profile for Victoria Pool (States of Jersey, 2011) spills at this outfall occurred during 27 storm events during the period 1 January 2006 to 31 December 2010. The majority of these (23) occurred outside the bathing season. During and immediately after storm events, the Bellozanne works can be expected to discharge effluent that, while considerably cleaner than the wastewater entering the works and Bellozanne stream, may still contain a significant microbial loading.

22
Performance data for the secondary treatment process were not available, however a 2 log reduction in FC concentrations over crude influent is expected to occur with activated sludge plants under base flow conditions, based on an average of values observed at UK sewage treatment works (Kay et al, 2008). The FC concentration in the treated effluent would be higher under high flow conditions. Performance data was supplied for the UV treatment system for 2011 from May onwards From May to December inclusive, the UV treatment achieved at least a 2 log reduction in faecal coliform concentrations over the influent to the UV plant for 83% of the time. Effluent quality did not appear to vary directly with influent quality and higher faecal coliform concentration counts in the effluent did not always correspond with identified spill days. Typical faecal coliform concentrations in UK sewage subjected to different levels of treatment were investigated by Kay, et al. (2008) and a summary of geometric mean values is presented in Table 4.2.
Table 4.2 Typical Faecal Coliform concentrations in sewage
Treatment levels Geometric mean faecal coliform concentrations (cfu/100ml)
Base-flow conditions
High-flow conditions
Crude sewage discharges 1.7 x 10⁷ 2.8 x 10⁶ Storm sewage overflows - 2.5 x 10⁶ Stored settled sewage 5.6 x 10⁶ 8.0 x 10⁵ Secondary treatment 3.3 x 10⁵ 5.0 x 10⁵ Tertiary 1.3 x 10³ 9.1 x 10² Ultraviolet disinfection 2.8 x 10² 3.6 x 10²
The following data on average flows for 2011 was provided by States of Jersey Transport & Technical Services:
Table 4.3 Typical Faecal Coliform concentrations in sewage Parameter Flow (m3/day)
Dry weather flow (DWF) 20,855
Mean flow to Bellozanne 25,328
90th percentile flow 35,163
The geometric mean faecal coliform concentration for the Bellozanne effluent for the sampling data provided (from 5 May to 22 December, 2011) was 330 faecal coliforms cfu/100ml, which falls between the base flow and high flow figures given for typical UV treated effluent in Table 4.2. The calculated daily loading, using the geometric mean faecal coliform concentration of 330 cfu/100ml and the mean flow to Bellozanne given above, is 8.37x10¹² faecal coliforms/day. Using the same E. coli concentration and the 90th percentile flow gives an estimated loading of 1.16x10¹³ faecal coliforms/day. These loadings are relatively high and thus the main discharge constitutes a significant potential source of faecal indicator bacteria in the immediate vicinity of the discharge but the impact at the shellfisheries will depend on currents and the potential for dilution and dispersion as

23
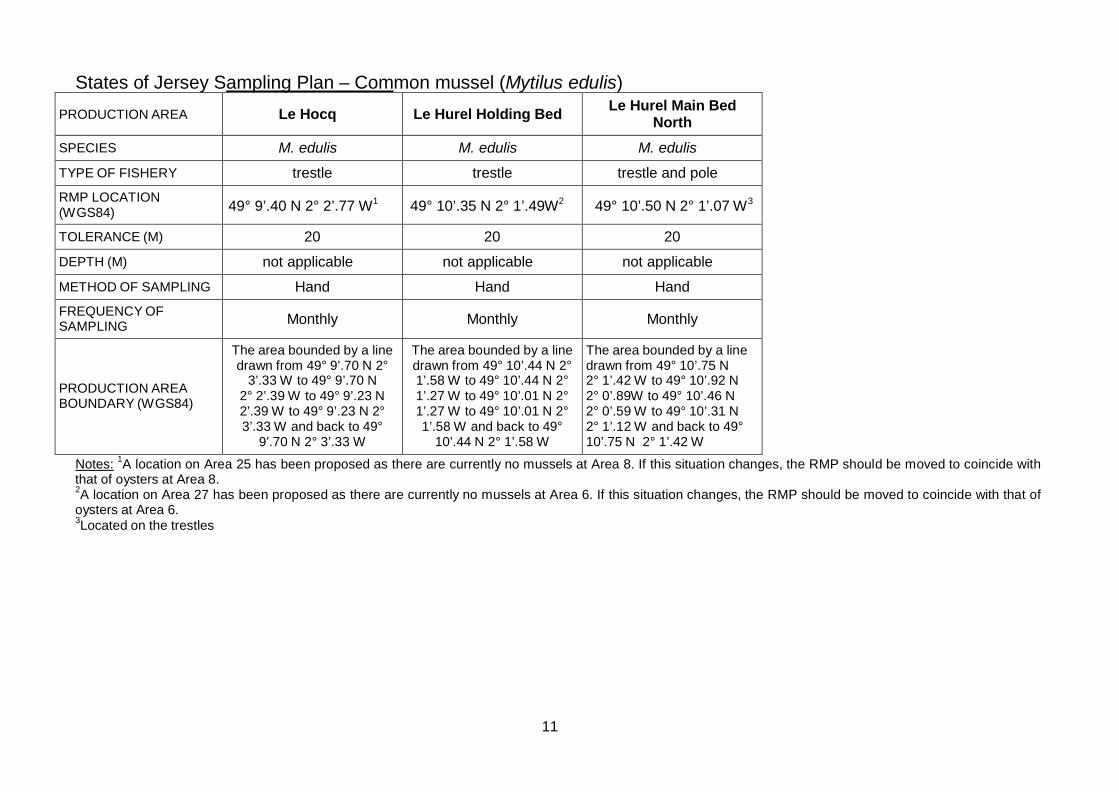
well as factors affecting microbial survival such as UV irradiation and predation. However, turbidity of coastal waters decreases the intensity of light penetrating the water column and T90 for waters in the English channel has been estimated at around 50 hours, compared to 1-5 hours in the Mediterranean where waters are less turbid (Pommepuy et al. 1992). The turbidity, and hence T90, for the receiving waters of the Bellozanne effluent would depend very much on local conditions at the time of discharge and may vary substantially over short time scales depending on weather and sea conditions. Pumping Stations Sewage is transported to the sewage treatment works via a system of 111 pumping stations throughout the island, some of which spill to the sea in storm conditions. Spills from the pumping stations are crude, as there is no screening in place. Information on notified spills from the pumping stations was provided by the States of Jersey Transport and Technical Services department for 2001-2010. Spill durations were only regularly recorded from 2006 onward although volumes were not recorded. Any volumes would have to be an estimate based on duration of the spill and pipe capacity. Most recorded spills were storm overflows heavy rainfall and tended to occur at multiple island stations. However, West of Albert/Weighbridge spilled in all years and Le Hocq in three of the last five years, though the 2008 Le Hocq spill was only 4 minutes in duration. Many more spills were recorded in 2010 than in the previous 9 years. This was attributed to the coincidence of high rainfall and higher than normal groundwater levels. This resulted in considerable groundwater and surface water ingress into the sewerage system via pipes and covers and as a consequence the duration of storm flow events was more prolonged than usual. Following this year’s storm events, States of Jersey reported that work was undertaken to reduce this ingress in the future. Spill durations for 2010 are summarised by Station in Table 4.4. More detailed information on spill durations and dates can be found in Appendix 1, Table 2. The total spill durations recorded in 2010 for 16 pumping stations in the south-east of the island were 506.3 hours. Many of the spills will have been concurrent at more than one station and so the total amount of time in the year that spills will have occurred will have been less than this. T&TS manage the location of the spills and as such, most of these occurred at inland stations rather than along the east coast. All spills to stations on the south-east of the island have been included as those to inland sites have the potential to indirectly affect water quality at the coast particularly if they may affect surface waters that drain to the sea. For example, Becquet Vincent spills near a watercourse which flows toward St. Helier harbour. The remainder spill to nearby manholes or covers and either rejoin the foul drainage system or soak away to adjacent land. Spills of longer than 24 hours duration occurred at Becquet Vincent and Paul Mill. The highest number of spill hours occurred at Petit Ponterrin, Paul Mill, and Archirondel. Of these, spills at Archirondel are more likely to affect water quality at the shellfish beds. States of Jersey have identified that this may be due to limited overflow storage capacity at Archirondel, which also receives a large freshwater component during periods of prolonged heavy rainfall.
24
Table 4.4 Spill hours by pumping station – 2010
Area
Station Spill hours
Overflow capacity
Spills to St Catherines
Bay Archirondel 86.5 Yes manhole 57A, in road outside station, close to sea
St Catherines Bay St. Martin 23.9 Yes manhole PS1, adjacent to station
Grouville Bay Fauvic 0.7 Yes high level overflow at manhole C116A in coast road, close to
Grouville Bay La Rivage 1.8 Yes
high level overflow at manhole CR1A Gory Old Road (near
Pumping Station) close to the
Grouville Bay Maufant 8.1 Yes manhole 29B, Rue des Potirons (near Pumping Station)
Grouville Bay Paul Mill 100.1 Yes spills at manhole PM1 in road outside station near Grands
Vaux Reservoir Grouville Bay Petit Ponterrin 131 Yes sump covers at station St Clements Bashfords 13.7 No covers at station
St Clements Le Dicq 8.6 No high level overflow at station to sea
St Clements Le Hocq 1.5 Yes high level overflow at manhole 55
in coast road (near Pumping Station) close to the sea
St Clements Le Hocq Lane 12 Yes covers at station
St Clements Maupertuis 6.1
Yes high level overflow at manhole 24
to Samares Marsh Pumping Station and then to sea via Greve
d'Azette outfall
St Clements Pontac 6.7
Yes high level overflow at manhole 71
in coast road (near Pumping Station) close to the sea
St Aubins Bay Becquet Vincent
45.7 Yes manhole 21 in road near station, close to stream
St Aubins Bay WAW 40.7 No To sea if Cavern is full
St Aubins Bay
Beaumont 19.2 No high level overflow to foul water sewer at manhole 25A at slipway
Highlighted rows signify inland pumping stations Some sewage overflows discharge to surface water outfalls. Table 4.4 contains a list of combined surface water/foul outfalls that could potentially impact at the shellfisheries. These receive surface water runoff after rainfall and also may receive foul overflow from the pumping stations identified in the table. During the shoreline survey, a number of observations related to infrastructure and flows were recorded. These are identified in Table 4.5. Fuller information on date, time and location of these observations can be found in Appendix 1.

25
Table 4.5 Combined drainage outfalls near St Clement’s Bay and Grouville Bay
Outfall Description Drained area PumpingStation storm
overflow Catchment
St. Catherine’s
Culvert to foreshore
Rural area and potential foul storm overflow
St. Martin St. Catherines Wood,St. Martins Village
Wayside slip- Gorey Village
Culvert under slipway
Urban and road run-off and potential foul storm overflow
Le Rivage Gorey Village, Queens Valley
Fauvic north Outfall on foreshore
Fauvic marsh, road run-off and potential foul storm overflow
Fauvic Northern Fauvic marsh area
Le Hurel Slipway
Pipe through slipway
Rural, urban and road run-off and potential foul storm overflow
Le Hurel Fields run-off to west
Le Bourg Outfall on foreshore
Rural, urban and road run- off and potential foul storm overflow
Le Bourg East St Clement
Pontac Culvert through seawall
Rural, urban and road run-off and potential foul storm overflow
Pontac Clos du Roncier
Le Hocq Slipway
Outfall on foreshore
Rural, urban and road run-off and potential foul storm overflow
Le Hocq Le Rocquier area
La Mare – Greve d’Azette
Outfall on foreshore
Rural, urban and road run- off and potential foul storm overflow
Maupertuis Le Squez, Les Marais, Les Hinguettes,Le Benefice
Le Dicq Outfall on foreshore*
Potential foul storm overflow Le Dicq Surface water goes to Baudrette Brook
Elizabeth Marina
Culvert through seawall
Rural, urban and road run-off and potential foul storm overflow
Cavern overflow CSO
Grands Vaux, Vallee d.Vaux, C., E.St. Helier
Gloucester Street
Outfall on foreshore
Rural, urban and road run-off and potential foul storm overflow
GloucesterStreet CSO
Queens Road & W.St. Helier
Beaumont Outfall on foreshore
Rural, urban and road run-off and potential foul storm overflow
Beaumont Goose Green Marsh west
St. Aubins Harbour
Culvert through seawall
Rural, urban and road run-off and potential foul storm overflow
St. Aubin CSO
St. Peters Village, Airport-east, E. Les Guennevais, St. Aubins Valley
*There are two outfalls associated with Le Dicq: surface water discharges at Baudrette Brook on the foreshore while foul discharge flows to an offshore outfall (see Figure 4.3)
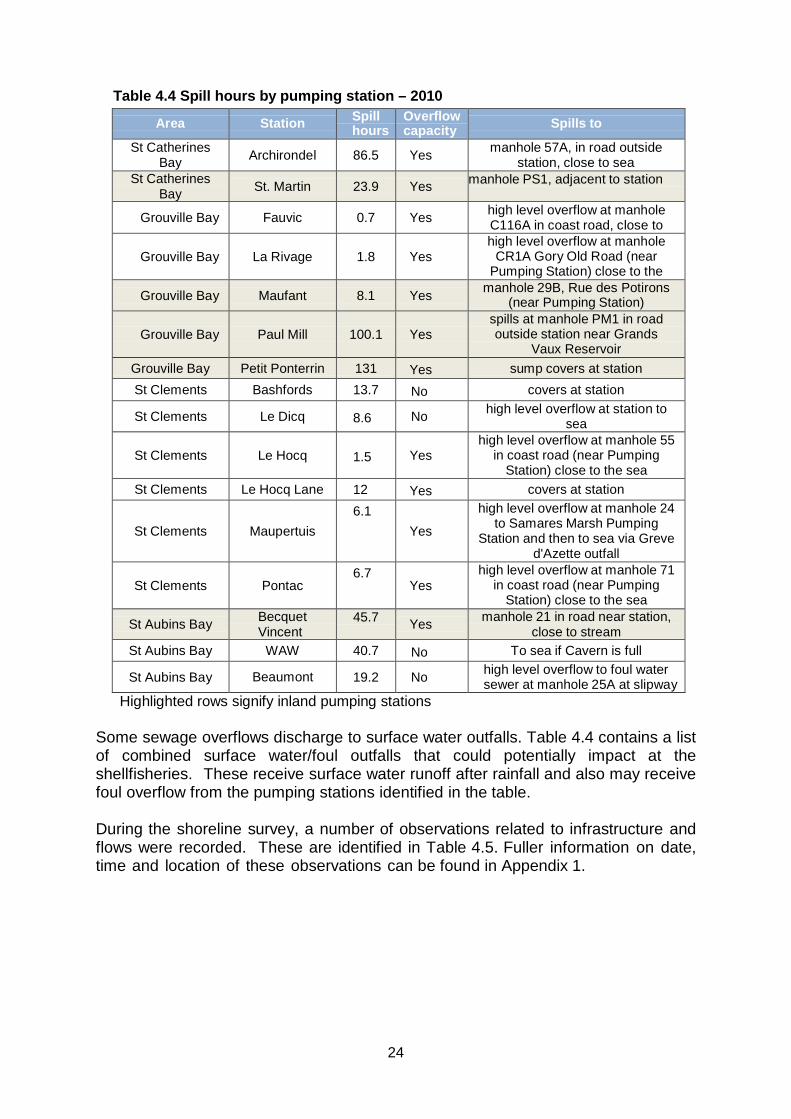
The locations of reported combined overflows, consented discharges and shoreline survey observations are shown in Figure 4.3. For the purposes of presentation, consents have been grouped into the following categories.
· Dairy effluent: Discharges of dairy parlour washings or other dairy effluent. These may contain high concentrations of faecal coliform bacteria.
· Veg runoff: Discharges of effluent from vegetable crops grown in glasshouses
and/or hydroponically. Contain high levels of nutrients, but not known to contains significant concentrations of faecal indicator bacteria.
· Septic to land: Discharges from private septic tanks to soakaway systems.

26
No. Description 1 P.S. Outlet; slight flow 2 Pumping station (signage not observed) 3 La Rocque toilets pumping station 4 Flap valve and two open pipe ends below P.S. And flow thru wall 5 2 pipes projecting from property above shore 6 End of P.S. Outfall, no flow, some green algae 7 Outfall;some flow 8 Flap valve, some flow 9 Pontac P.S.
10 Flap valve; no flow 11 Public toilets above shore 12 End of main Bellozanne outfall 13 Stream by Gorey slip; approx 90 boats on moorings in harbour and 8 on harbour wall 14 Outfall with double flap valve; algae on concrete below; two flows 15 Outfall with flap valve, no flow; some seepage next to outfall 16 Fauvic outlet, outfall with flap valve 17 Flap valve in sea wall, no flow; lots of green algae below; open-ended pipe nearby 18 Outfall with flap valve, some flow 19 Flap valve in sea wall, no flow; Some algal staining 20 2 pipes in sea wall, no flow 21 2 manholes in middle of road 22 Rue du Pont pumping station
These generally contain high concentrations of faecal bacteria, however when the systems are properly sited and maintained are unlikely to lead to contamination of waters.
· Filter backwash: Effluent from backwashing of swimming pool or drinking
water treatment filters. May contain faecal indicator bacteria.
· Vivier/depuration: Water used to circulate through either a vivier or a depuration system. May contain faecal indicator bacteria purged by shellfish.
· PS overflow: Includes Combined Sewer Overflows and Emergency Overflows:
Overflows from the sewerage system either to allow storm water to overflow to prevent it overwhelming the capacity at a given section of the network or due to equipment failure at a pumping station.
Table 4.6 Infrastructure and flow-related observations noted during the shoreline survey
27
Produced by Cefas Weymouth Laboratory. © Crown Copyright 2012. All rights reserved. Base map ©States of Jersey 2012
Figure 4.3 Map of consented discharges and shoreline survey observations for southeast Jersey

28
Surface water outfalls There are few permanent streams in the southeast of Jersey, and a number of the surface water outfalls may receive septic input. Therefore, consideration of surface water discharges is important in understanding the potential supply of faecal contaminants to the waters around the fishery.
Three watercourses had been identified by the States of Jersey Department of the Environment prior to the shoreline survey. These were a stream by Gorey slip which ran in all weathers and two at Le Hurel and Fauvic which ran after heavy rain. It was later identified that the latter two streams run for most of the year.
The catchment map and associated watercourses shown in Figure 4.4 is taken from Langley, et al. (1997). With reference to the area of interest in the present sanitary survey, the Waterworks Valley and St Peter’s Valley catchments discharge into St Aubin’s Bay, the combined Vallée des Vaux and Grand Vaux catchment discharge at West of Albert whilst the Longueville catchment discharges at Le Dicq, and the Queen’s Valley catchment discharges at Gorey slip. The map does not show some minor watercourses to the north-east and west of the island or land drains.
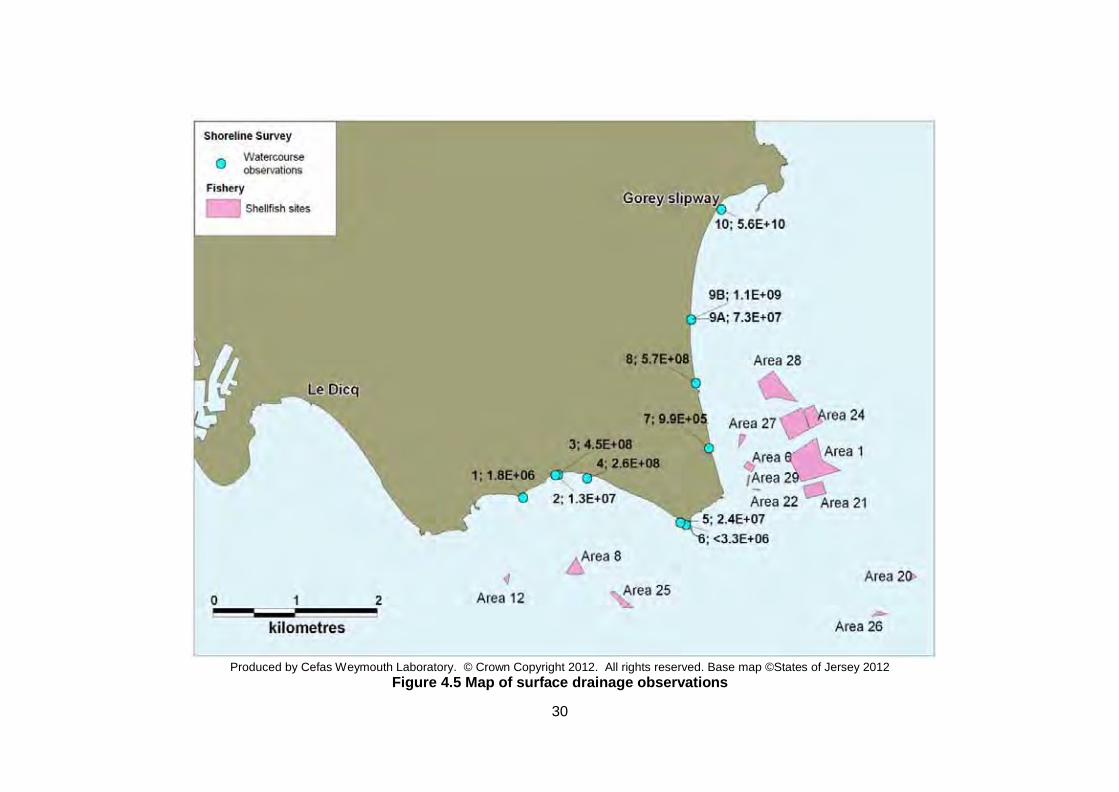
The flows listed in Table 4.5 were observed during the shoreline survey and were measured and sampled. Measurements and samples were only taken during the survey and thus will not be representative of all conditions. Rainfall over the two days preceding the shoreline survey was 0.8 mm. On the first day of the survey it was 0.2 mm and on the second day 3.2 mm (all recorded at the Maison St Louis observatory). The sampling locations, together with the calculated loadings, which are based on the results of a spot sample, are shown in Figure 4.5. Most of these related to outfalls or other pipes/flap valves and it was not clear as to whether the observed flows were due to piped or culverted watercourses to septic sources, or a combination of the two: the locations of some coincided with those of pumping station intermittent discharges. Small amounts of rain had fallen immediately prior to and during the shoreline survey and this amount would not have been expected to trigger discharges from the pumping stations. TTS confirmed that no overflows were recorded during the period of the shoreline survey. As noted previously, the outfalls are known to carry one or more of the following: input from streams, rainfall-related septic content, land runoff and street drainage. Sewage fungus (often a multi-species growth but typically involving Sphaerotilus natans) was observed at some of the flow locations, indicating a high organic content to recent flows: despite the common name, the high organic content does not necessarily derive from sewage.
Where the bacterial loading is labelled on the map, the scientific notation is written in digital format, as this is the only format recognised by the mapping software. So, where normal scientific notation for 1000 is 1 x 10³, in digital format it is written as 1E+3.

29
From Langley, et al., 1997. The labelled sampling points relate to data given in that report.
Figure 4.4 Jersey catchments
30
Produced by Cefas Weymouth Laboratory. © Crown Copyright 2012. All rights reserved. Base map ©States of Jersey 2012 Figure 4.5 Map of surface drainage observations

31
Table 4.7 Estimated loadings relating to shoreline survey measurements of outflows
No Location Description Width (m)
Depth (m)
Flow (m/s)
Flow in m3/day
E.coli (cfu/
100ml)
Loading (E.coli per
day)
1 N 49°.16684 W 02°.06125
P.S. Outlet; slight flow 100 ml in 30 secs1 0.3 624 1.8 x 10⁶
2 N 49°.16922 W 02°.05580
Flap valve, some flow 600 ml in 10 secs1 5.2 254 1.3 x 10⁷
3 N 49°.16924 W 02°.05536
Culverted outflow 0.41 0.045 0.322 513 87 4.5 x 10⁸
4 N 49°.16888 W 2°.05048
Outfall; some flow 0.47 0.075 0.076 232 111 2.6 x 10⁸
5 N 49°.16425 W 02°.03489
Small stream appearing from sand 0.22 0.07 0.059 79 31 2.4 x 10⁷
6 N 49°.16399 W 02°.03396
Flow below P.S. 0.13 0.01 0.290 33 <10 <3.3 x 10⁶
7 N 49°.17203 W 02°.03012
Outfall with flap valve, some flow 0.14 0.02 0.041 9.9 <10 <9.9 x 10⁵
8 N 49°.17892 W 02°.03233
Fauvic outlet, outfall with flap valve 200 ml in 5 secs1 3.5 16520 5.7 x 10⁸
9A N 49°.18562 W 02°.03310
Outfall with double flap valve 0.24 0.005 0.047 4.9 1500 7.3 x 10⁷
9B N 49°.18562 W 02°.03310
Outfall with double flap valve 0.25 0.01 0.325 70 1500 1.1 x 10⁹
10 N 49°.19721 W 02°.02802
Stream by Gorey slip 0.50 0.06 0.794 2060 2710 5.6 x 10¹⁰
1Approximate measurement by graduated jug The loadings presented in Table 4.6 are generally low and may represent base freshwater flows at most of the locations. Loadings at locations 9B and 10 were higher than the others and would represent potential for contamination of the northern end of the fisheries in Grouville Bay. Even with freshwater flows, the loadings would be expected to increase significantly after rainfall. Given that many of the locations also represent the sites of pumping station overflows, the increase during very wet weather may be greater still. Many of the outfalls and culverted outlets seen during the shoreline survey are connected to surface water drains that run along the roads in the populated culverted strip. Some are also connected to land drains around the field systems further inland. In general, these drainage systems run about 500 metres inland although in one case this extends to about 800 metres. A report undertaken in the mid-1990’s for the States of Jersey presented summary statistics for 11 outfalls along the south-east coast of Jersey (Langley, et al., 1997). The data on which the summary statistics were based came from samples collected by the States of Jersey. Grid references for the outfalls were not presented in the report but the locations were shown on an outline map of the island. It is therefore difficult to conclusively determine which of the outfalls related to the pumping station outlets and streams included in Table 4.6. Geometric mean concentrations of faecal coliforms in the samples at the outfalls (based on 1 to 12 samples) ranged from 2.86 x 10³ to 1.10 x 10⁵ cfu/100 ml. Two of the three highest geometric mean concentrations were seen at outfalls located towards the middle of

32
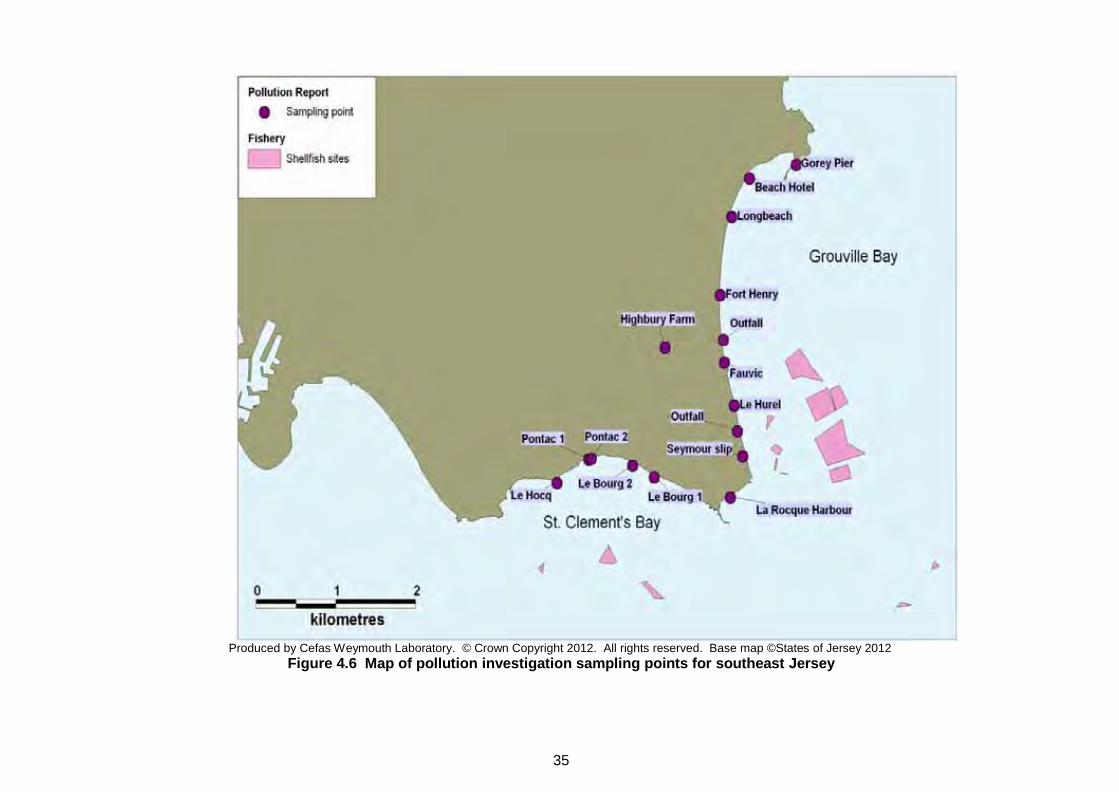
the shoreline of St Clement’s Bay. Other high geometric mean values were seen at outfalls located towards the middle of Grouville Bay, in the vicinity of the locations of outfalls 7 and 8 on the map in Figure 4.5. The highest result of 1.9 x 10⁷ faecal coliforms/100 ml came from the vicinity of outfall 7 on the map. The results obtained during the present shoreline survey were much lower than those summarised in the 1997 report. This would be partly due to the difference in concentration between faecal coliforms and E. coli. However, this would not explain the magnitude of the differences and there are two other factors that could also apply. The first is that the shoreline survey was undertaken after a long period of dry weather – the weather conditions that applied during the earlier sampling are not known. The second is that there may have been changes to contaminating sources entering the outfalls and the frequency of spills of the pumping stations along the shoreline. Information from the States of Jersey identifies that spills from the sewerage network are risk managed to protect more sensitive areas, including the shellfisheries. States of Jersey have also identified that they have undertaken a significant amount of work to improve environmental best practices on the island, particularly with regard to management of agricultural waste and sewerage systems and made significant structural improvements to the east coast infrastructure. Pollution Investigation Results Investigative sampling was undertaken in 2008 by the States of Jersey in response to concerns that the seaweed scraped and moved along the shoreline by TTS may have been a cause of elevated contamination levels at the fishery. Results from this sampling are summarised in Table 4.7 and sampling locations with respect to the fishery are shown in Figure 4.5. Samples for which a clear location was not identified were not included in Table 4.7. Highest results, greater than 1.0 x 10⁵ E.coli/100 ml, were seen at the outfall between Fort Henry and Fauvic on two occasions and at Pontac 1 on one occasion. The outfall between Fort Henry and Fauvic does not have any overflow connection to the foul sewer. The States of Jersey Environment Department identified the overflow at Pontac did not spill during the course of the invesigtation. Water samples collected the day after heavy rainfall on 4 August, 2008 from outfalls flowing along the east shore returned E. coli results of at least 20000 cfu/100 ml. The exception was that taken from Seymour slip, which returned a result of 2400 E. coli cfu/100 ml. Results from outfalls sampled along the south shore (Le Bourg 1 and 2, and Pontac 2) had E. coli concentrations ranging from 3200 to 8900 cfu/100 ml. All results suggested significant faecal contamination from diffuse runoff. Cross referencing against the reported spills for pumping stations for the same period shows only the station at Le Hocq was reported to have spilled for 4 minute duration on 3rd August. On 14th August, these outfalls were resampled with results ranging from 2000 to >200000 cfu/100 ml, indicating significant faecal contamination. Heavy rainfall had also fallen prior to the sampling undertaken on 3/06/08, although only one sample was taken on that occasion (at Le Hurel) and that yielded a moderate E. coli result of 1100 per 100 ml. For the most part, these were likely to have contained predominantly diffuse source faecal contamination. The State’s investigation determined that the most probable source of contamination to the shellfishery was deposition of bird faeces in seaweed that was subsequently piled on the shore

33
adjacent to the shellfishery. The high results obtained at the outfall between Fort Henry and Fauvic were attributed to an overflowing septic tank. The private owner corrected the problem. Comments from harvesters Comments on potential sources and practical observations were sought from some of the concession holders. These identified that there were concerns with potential impacts from the main Bellozanne discharge and spills from the Cavern and Le Dicq outfall on the shellfisheries in St Clements’s Bay and at the southern end of Grouville Bay. Faecal solids have been observed discharging from the Le Dicq outfall in the past – this was last seen several years ago and no information was available as to whether the event occurred after rainfall. In Grouville Bay, the two outfalls that were considered to be most of a problem were the ones at Welcome Slip at Gorey and a flap valve approximately 200-300 yards north of La Hurel Slip. The latter was noted to flow freely after heavy rain. A flow with presumed faecal content has also been seen from under Seymour slip on a number of occasions, not only after rainfall. Conclusions The main sewage discharge for the island lies over 7 km northwest of Area 12, the western most shellfish site in St. Clement’s Bay. The discharge from this works receives UV treatment and the geometric mean reported effluent quality falls within the expected range for this level of treatment. However, given the size of the discharge, the overall daily loading of the outfall would be significant in the immediate vicinity of the discharge and the contribution to the bacteriological quality at the shellfisheries will depend on local currents and the dilution and dispersion that may take place between the discharge point and the shellfisheries. The southeast Jersey coast is susceptible to sporadic contamination from intermittent sewage discharges during storm events along the shore of both Grouville Bay and St. Clement’s Bay, which may have a significant impact on water quality. The Grouville Bay shellfish farms lie closer to the shore than those in St. Clement’s Bay, all recorded shellfish farm areas are at least 300 metres from the nearest outfall, and the majority are over 500 metres from an outfall. This means that there is no direct impact on the shellfisheries but the effect on microbiological quality will be a function of the E. coli loading, the timing of the discharges with respect to tidal conditions and the hydrodynamics in the area. The interactions of these factors are considered further in Section 15. Surface water drainage is also a significant source of faecal contaminants to the near-shore waters and in some cases these carry very high concentrations of faecal indicator bacteria.

34
Table 4.8 Results from pollution investigations – States of Jersey 2008
Water sample results (E. coli/cfu 100 ml) / Collection date
Sample Point Grid
Reference X
Grid Reference Y
03/06/2008 18/06/2008 04/08/2008 14/08/2008 21/08/2008 28/08/2008 16/09/2008
Gorey Pier 48375 67074
No flow
Beach Hotel 47789 66920
>20000 6000
4000
Longbeach 47568 66496
>20000 No flow
1300
Fort Henry 47423 65625
>20000 11000
Outfall between Fort Henry & Fauvic
47467 65125
20000 >200000 2000 >200000
Fauvic 47476 64877
>20000 3000 2000 2000
Le Hurel 47602 64398 1,100 89,000 >20000 3000
1000 140
Outfall between Le Hurel and Seymour
47641 64110
20,000 No flow
Seymour slip 47711 63831
2,400 No flow
Le Bourg 2 46325 63727
8,900 3000
3000
Le Bourg 1 46598 63596
3,200 3000
Pontac 1 45774 63797
>20000 130000 1000 4000
Pontac 2 45806 63803
5,900 2000
<1000
Le Hocq 45378 63531
>20000 12000
1000
La Rocque Harbour 47556 63376
No flow
Highbury Farm 46732 65041
Rainfall (mm) over previous 2 days
Maison St Louis 22.3 0.0 43.7 4.0 2.5 0.1 0.0
35
Produced by Cefas Weymouth Laboratory. © Crown Copyright 2012. All rights reserved. Base map ©States of Jersey 2012
Figure 4.6 Map of pollution investigation sampling points for southeast Jersey

36
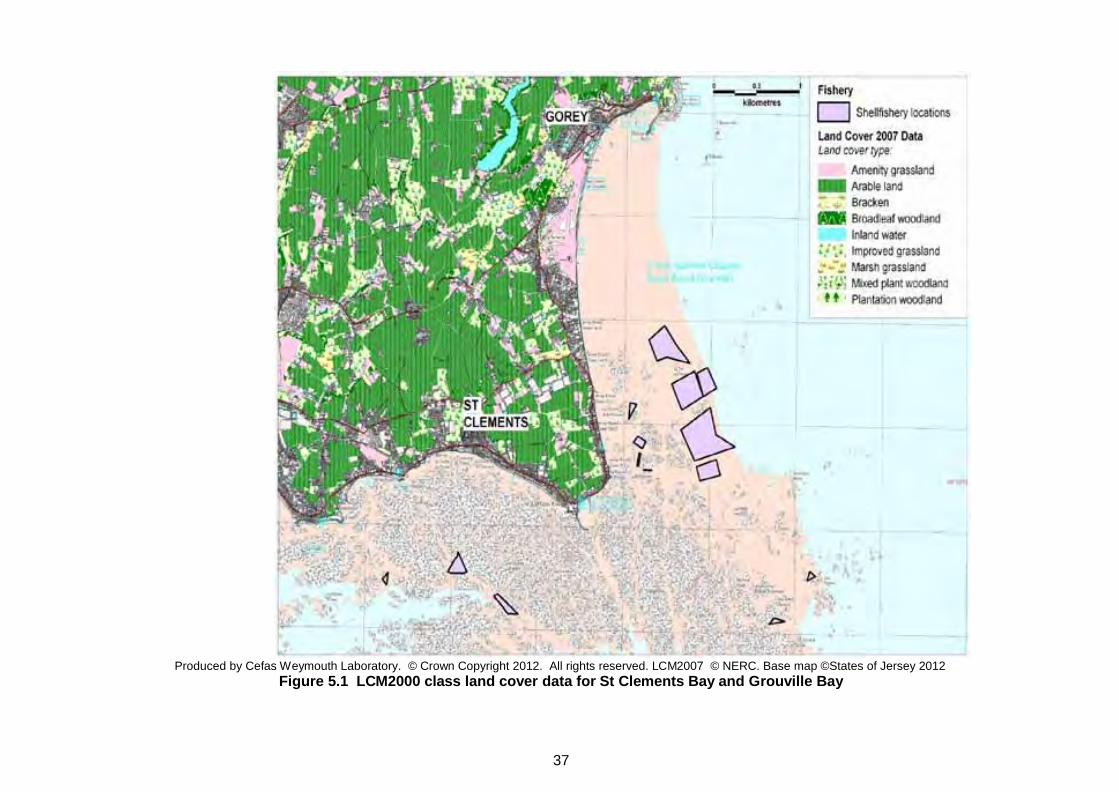
5. Land Cover The Land Cover Map 2007 data for the area is shown in Figure 5.1. A variety of land cover types are found in the St Clements Bay and Grouville Bay area. The most common land cover type on the shoreline adjacent to St Clements Bay and Grouville Bay is arable land. In amongst the areas of arable land there are smaller patches of other land cover types including amenity grassland, bracken, broadleaf woodland, improved grassland, marsh grassland, mixed plant woodland and plantation woodland. The category of amenity grassland includes golf courses, parks, gardens, recreational fields, cemeteries and cultivated land. The large area of amenity grassland on the shoreline of Grouville Bay is a golf course. The second most common land cover type is improved grassland and this can be found in patches both inland and on parts of the shoreline of both bays. Urban and built up areas are represented by the grey shading and these lie along much of the coastline of both bays apart from the section of Grouville Bay that is adjacent to the golf course. Studies undertaken by Kay et al (2008) found that faecal indicator organism export coefficients for faecal coliform bacteria were highest for urban catchment areas (approx 1.2 – 2.8x10⁹ cfu km-2 hr-1) and lower for areas of improved grassland (approximately 8.3x10⁸ cfu km-2 hr-1) and rough grazing (approximately 2.5x10⁸ cfu km-2 hr-1) areas. Lowest contributions would be expected from areas of woodland (approximately 2.0x10⁷ cfu km-2 hr-1) (Kay et al. 2008). The contributions from all land cover types would be expected to increase significantly after rainfall events, however this effect would be particularly marked from improved grassland areas (roughly 1000-fold) (Kay et al. 2008). Therefore, the overall predicted contribution of contaminated runoff from the area around both St Clements Bay and Grouville Bay would be high and would be expected to increase significantly following rainfall events.
37
Produced by Cefas Weymouth Laboratory. © Crown Copyright 2012. All rights reserved. LCM2007 © NERC. Base map ©States of Jersey 2012
Figure 5.1 LCM2000 class land cover data for St Clements Bay and Grouville Bay

38
6. Agriculture Information on the distribution of farm animals and other agricultural activities, such as slurry storage and application to land, was sought from the States of Jersey. Spatial data on the distribution of farmed animals was provided, as well as information on slurry management. Agricultural exports are an important source of income for the island, with vegetables and flowers exports for 2010 valued at £34.5 million. Potatoes are the main crop exported from Jersey. The planting season extends from January to the end of March, during which large areas are ploughed. Slurry may be applied prior to ploughing. Harvesting occurs from April to the end of June. Heavy rainfall following harvesting can result in runoff from the fields into the sea. Vegetable and flower crops are grown either outdoors or under cover in glass houses or polytunnels. Discharge effluent from hydroponic vegetable growing and glasshouses is (deemed) permitted from 11 establishments in the southeastern side of the island. These have interim permits that are subject to review, and only one of the premises is permitted to discharge to the land surface. The licensing details identified nutrients as the pollutant of concern. There was no evidence to suggest that these effluents would have a significant bacteriological content. Grassland areas may be used for livestock grazing as well as for production of hay, silage, and other grains. This type of agricultural land may receive application of slurry. In Jersey, the total grassland area (including silage, hay, haylage, forage maize and other stock feed crops) was 29.1 km², or approximately 25% of the total island land area. Livestock production is predominantly dairy cattle, with some beef cattle, poultry and pig production. The total numbers of livestock recorded for the entire island in 2010 are shown in Table 6.1.
Table 6.1 Livestock kept on Jersey in 2006-2010 Species Numbers -
2006 Numbers -
2010 Cattle – dairy 5349 5025 Cattle - beef 452 179 Sheep 561 949 Pigs 662 434 Poultry 22662 22032 Horses/donkeys 857 879 Goats and other 23 81 Source – Agricultural Statistics, States of Jersey Economic Development department
Dairy cattle represented the large majority of the total cattle herd. The general trend for dairy operations was toward fewer herds with larger numbers of animals. Dairy operations generally produce significant amounts of both solid waste and slurry, which must be stored and then disposed of, usually by application to agricultural land. The distribution of livestock farmed in the southeast of the island is shown in Figure 6.1.

39
At Grouville Bay, poultry keepings within 500 metres of the shore include one large farm with 7400 chickens, as well as a number of smaller chicken holdings totalling a further 305 animals. Only 1 sheep and 2 cattle were reported within 500m of the shore. Other livestock holdings are located within the catchment of the stream that discharges at Gorey slip. Fewer livestock animals were kept near shore along St. Clement’s Bay, with total poultry at 190 birds and no other livestock kept within 500 meters of shore. Several livestock holdings, including cattle and sheep farms, are located in the catchments of the two watercourses that discharge to the west of St Clement’s Bay at Le Dicq. The larger cattle farms are located further away from shore. However as the majority of cattle are dairy, slurry production from indoor housing and milking parlours is expected to be significant. The location of slurry stores is shown in Figure 6.2. The majority of stores lie well inland and away from the fishery. Only one storage site is located within 1 km of the southeast shore of the island.
Figure 6.1 Slurry storage facilities

40
Jersey has a comprehensive management plan for the application of farm manure and slurry to land, with detailed assessment by field of the inherent risk of pollution to surface and ground water based on slope and proximity to streams, boreholes and wells. Fields in the southeast of Jersey are largely classed as either moderate risk, which can be used conditionally, or low risk, which can be used at any time outside the closure period. Application of slurry to grassland or arable soils is prohibited from October to December, inclusive under the Water Pollution (Code of Good Agricultural Practice) (Jersey) Order 2009, except by prior consultation with the Planning and Environment Department and derogation will only be granted to low risk areas. Information received from the States of Jersey (Department of the Environment, pers comm) identified that all farm holdings had at least 4 months storage capacity for slurry. Solid wastes can be applied throughout the year, depending on the risk assessment of each farm, as these pose a lower risk of contamination to water unless applied immediately prior to heavy rain. Pelleted, enhanced treated sewage sludge from the Bellozanne sewage treatment works is recycled into agricultural fertilizer. However, if no land is available for disposal, either due to restrictions on application or timing in the agricultural cycle, the pellets are incinerated (States of Jersey, 2011). The States of Jersey have produced a farm manure waste management map, to assist farm managers in production of waste management plans. This has not as yet gone out to consultation, and therefore has not been reproduced in this report. Agricultural fields most closely adjacent to Grouville Bay and St. Clement’s Bay lie inland of a narrow strip of coastal development. Many of these fields are classed as low risk. However, this assessment does not take account of ‘managed risk’ based on the operational status of the each field. For example, the risk of contamination from a single field would be higher when compacted and bare, as after harvest of maize, and lower when used as grassland. Depending on manure management practices at the large chicken farm on Grouville Bay, there is the potential for runoff from chicken runs and any collected manure from housing areas if this manure is not carefully managed. The likely effect of this would depend upon the amount of runoff and predicted particle movement within the sea area, however it would be expected that those shellfish farms nearest shore would be most affected.

41
Produced by Cefas Weymouth Laboratory. © Crown Copyright 2012. All rights reserved. Base map ©States of Jersey 2012
Figure 6.2 Livestock observations at Grouville Bay and St Clements Bay

42
7. Wildlife Wildlife may also contribute to faecal contamination observed at fisheries. General information on the impacts of wildlife species can be found in Appendix 2. The fishery falls within the South East Coast of Jersey Ramsar site which was designated under the Ramsar Convention as a wetland of international importance. Birds Birds most likely to contribute to faecal contamination of the waters around the bivalve fishery are those that routinely roost, feed or swim around the adjacent coast. These are predominantly sea birds, wildfowl such as geese, and wading birds. Seabirds
Information on breeding seabirds was obtained from Seabird 2000 records (Mitchell et al 2004). Only a few species of seabirds were observed in southeast Jersey and these were only present in small numbers. Other information indicates that two species of gull breed in moderate numbers on the island (Jersey Bird Report, 2010), though the majority of nests are located in the north and east of the island. Breeding pairs were observed on the south side of the island at Elizabeth Castle (42) and Icho Tower (19). The majority of gulls are only present seasonally, with peak numbers generally in winter. The most significant of this with respect to the fisheries are Black-Headed Gulls which are present in the thousands from roughly October to March and favour the east side of the island around Grouville Bay. Little Gulls are also present in significant numbers (up to 500) in this area during the same time. Other birds commonly found near shore
According to a draft report on the Ramsar area prepared by La Société Jersiaise marine biology section (La Société Jersiaise, 2011) few shore birds breed in Jersey due to human disturbance. Some species are present year round in smaller numbers, and one only during the summer months. Most of the identified shore bird species were present in highest numbers in winter. Table 7.1 below identifies the most significant species found in the Ramsar area.

43
Table 7.1 Significant bird populations in Southeast Jersey Ramsar area. Species
(common name) Location Approximate Numbers Season
Dark-bellied Brent goose Throughout 600 winter Common scoter Throughout 20 winter Red-breasted merganser Around
La Rocque 100 winter
Great crested grebe Grouville Bay 100 winter Slavonian grebe Grouville Bay and La
Rocque 50 winter
Grey heron Throughout 50+ winter Little egret Throughout 40 resident
100+ winter Bar-tailed godwit Throughout 150 winter Eurasian Curlew Throughout present all year
50+ winter Sanderling Throughout 400 winter Turnstone Throughout 300 winter Sandwich tern Throughout present all year
100+ winter Common tern Throughout not stated summer visitor
Table 7.2 Wader counts – 2010
Area Zone 17 Jan 28 Feb St Aubin West St Aubins Bay 87 104 St Aubin East St Aubins Bay 41 0 Elizabeth Castle St Aubins Bay 420 122 Havre des Pas Havre des Pas 200 137 Green Island St Clements 374 234 Le Hocq St Clements 148 0 Pontac St Clements 1330 1358 La Rocque St Clements 239 62 Grouville South Grouville Bay 754 1546 Grouville North Grouville Bay 15 230 Gorey to St Catherine
St Catherines Bay
16
18 The largest numbers of birds were present from Pontac, on the south shore at St. Clements to Grouville Bay, along the southeast corner of the island. Brent geese are counted in four months each year: January, February, November, and December. Table 7.3 shows the count reported in 2010

44
Table 7.3 Brent goose counts – 2010 Area Zone 16 Jan 20 Feb 21 Nov 26 Dec Elizabeth Castle St Aubins Bay - - 10 - Bel Royal slip to Belcroute Bay St Aubins Bay 260 183 152 260
Reclamation site to Bel Royal slip St Aubins Bay 14 - 261 -
Green Island to La Collette tower Havre des Pas 46 19 10 20
Le Hocq slip to Green Island St Clements 37 52 21 57 La Rocque Point to Le Hocq slip St Clements 184 46 63 200
Le Hurel slip to La Rocque harbour Grouville Bay 332 382 504 451
Gorey harbour to Le Hurel slip Grouville Bay 509 56 300 147
St Catherines Bay to Gorey Castle St Catherines Bay 47 9 127 53
- No count/none Geese are reported in relatively large numbers throughout the area, however similar to wading birds, a larger number are present around the southeast corner of the island. Unlike some species of geese which feed on grassland areas, the Brent geese at Jersey feed on sea grass and may roost on the water at high tide. Wildlife observed during the shoreline survey are listed in Table 7.2, and shown mapped in Figure 7.1. No specific information was obtained on the numbers of gulls likely to be present throughout the year. In total, 812 geese and 159 gulls were observed, as well as a smaller number of other birds. As birds were counted over two days, there may have been some duplicate counting as the animals moved over the course of the survey. Some gulls may be present in the area throughout the year. The surveyor identified that the geese were observed following the dropping tide offshore and feeding.

45
Table 7.4 Wildlife observed during shoreline survey
No. Date/Time Position Description 1 29-NOV-11 N49.19721 W2.02802 Approx 100 gulls, 30 small birds and 4 crows on
shore 2 29-NOV-11 N49.18562 W2.03310 Approx 214 Brent geese
3 29-NOV-11 N49.18460 W2.03283 Approx 30 Brent geese
4 29-NOV-11 N49.18305 W2.03264 44 Brent geese
5 29-NOV-11 N49.18112 W2.03251 95 Brent geese, 4 crows, 3 gulls
6 29-NOV-11 N49.18007 W2.03208 90 Brent geese
7 29-NOV-11 N49.17892 W2.03233 150 Brent geese; 2 gulls
8 29-NOV-11 N49.17814 W2.03168 Approx 100 Brent geese; sparse bird droppings at top of beach
9 29-NOV-11 N49.17672 W2.03103 1 crow
10 29-NOV-11 N49.17891 W2.02187 16 Brent geese offshore of racks
11 29-NOV-11 N49.17300 W2.02834 Some bird droppings on shore
12 29-NOV-11 N49.17016 W2.02933 2 gulls
13 28-NOV-11 N49.16475 W2.03334 Approx 60 Brent geese
14 28-NOV-11 N49.16388 W2.03494 Egret on shore; 13 Brent geese; 2 gulls
15 28-NOV-11 N49.16469 W2.03653 10 gulls on shore
16 28-NOV-11 N49.16737 W2.04453 12 gulls offshore
17 28-NOV-11 N49.16017 W2.05329 2 egrets; 10 gulls; 1 crow
18 28-NOV-11 N49.16888 W2.05048 Bird droppings on shore; 9 crows; 3 gulls
19 28-NOV-11 N49.16889 W2.05317 8 crows
20 28-NOV-11 N49.16924 W2.05536 Moderate amount of bird droppings on shore
21 28-NOV-11 N49.16922 W2.05580 1 crow; 1 gull
22 28-NOV-11 N49.16864 W2.05646 10 gulls
23 28-NOV-11 N49.16711 W2.06118 1 gull
24 28-NOV-11 N49.16654 W2.06188 1 crow; 3 gulls
Seals The Ramsar site is reported to host grey seals in some numbers, however count data was not available. There was anecdotal evidence of sightings of white pups, indicating that these animals are hauling out and using the area to give birth. However, adult animals are reportedly more likely to be heard than seen. Therefore, seals are likely to contribute to background levels of faecal contamination within the bays and may contribute to locally high levels of faecal contamination where they have hauled out. However, no evidence was found to suggest whether one part of the fishery may be more affected than another. Dolphins A resident population of approximately 100 bottlenose dolphins is reported around the east coast of Jersey, including the Ramsar area. (http://jersey.com/English/aboutjersey/environment/wildlife/marinelife/Pages/ default.aspx). A study on this species in Ireland showed that they avoided water depths of 10m or less, and preferred steeply sloping areas (Ingram and Rogan,

46
2002). Therefore, they are considered unlikely to use the areas immediately over the shellfishery though they may pass through waters of suitable depth to the east and south. Any impact to the fisheries is likely to be diffuse and there is no evidence to suggest one part of the shellfishery would be more likely to be impacted than another.
Produced by Cefas Weymouth Laboratory. © Crown Copyright 2012. All rights reserved.
Base map ©States of Jersey 2012 Figure 7.1 Wildlife in relation to SE Jersey fishery.
Overall, the most significant potential impact to the fishery from wildlife source faecal contamination comes from the geese and other shore birds present in the area either during winter or during the spring and/or autumn migrations. In winter, geese and shorebirds are likely to be present on the sands around the shellfish areas, where they feed on sea grass. A large number of geese and other birds were observed around the fishery during the shoreline survey, the majority of which were seen along Grouville Bay, toward the north end of the existing fishery. Therefore, impact from this source may be higher on the shellfish sites nearer to shore and further north in Grouville Bay and lower on the farms off St. Clement’s Bay.

47
8. Meteorological data The nearest weather station for which rainfall data was available was located at Maison St. Louis which is approximately 5 km west of Grouville Bay and approximately 4 km north-west of St. Clements Bay. Rainfall data was available from 2005 to September, 2011 inclusive. The nearest station for which wind data was available was Jersey airport, approximately 11-12 km west of both bays. Unless otherwise identified, the content of this section (e.g. graphs) is based on further analysis by Cefas. This section aims to describe the local rain and wind patterns in the context of bacteriological water quality at Grouville Bay and St. Clements Bay, Jersey.
8.1 Rainfall High rainfall and storm events are commonly associated with increased faecal contamination of coastal waters through surface water run-off from land where livestock or other animals are present, and through sewer and waste water treatment plant overflows (e.g. Mallin et al, 2001; Lee & Morgan, 2003). Figures 8.1 and 8.2 depict box and whisker plots that show the distribution of daily rainfall values by year and by month. The grey box represents the middle 50% of the observations, with the median at the midline. The whiskers extend to the largest or smallest observations up to 1.5 times the box height above or below the box. Individual observations falling outside the box and whiskers are represented by the symbol *. In the plot by year, the position of the median is emphasized by a circle as the lines all plotted at or near the bottom of the boxes.
Figure 8.1 Box plots of daily rainfall values by year at Maison St. Louis from
2005 – until September 2011. Rainfall patterns varied from year to year. Total rainfall in 2007 (988 mm), 2008 (993 mm) and 2010 (960 mm) was markedly higher than in 2005 (770 mm), 2006 (773 mm), 2009 (831 mm). A higher number of extreme rainfall events exceeding 30mm/day occurred during 2010, whilst 2009 and 2011 (up to September) were

48
relatively dry.
Figure 8.2 Box plots of daily rainfall values by month at Maison St. Louis from
2005 – September 2011. Figure 8.2 shows that daily rainfall was highest during November and December, though it began to increase over summer levels during October and tailed off slowly through March. Rainfall was lowest in April, and September. Rainfall events >20mm in a day occurred in all months. However there did appear to be a seasonal increase in peak events from May to August. Over the whole period from 2005 to (September) 2011, the highest single rainfall events occurred in February and August. For that period, 64% of days experienced less than 1mm of rainfall and 7% of days experienced rainfall of 10mm or more. Longer time climate trends have shown that winter precipitation has increased in Jersey since 1880, and summer precipitation levels have decreased over the same period (States of Jersey, 2011). Groundwater level hydrographs indicated that the island aquifer is recharged from rainfall during the winter, with peak water table levels attained in January-March and minimum levels reached in autumn. An overall decline in the water table for the east of the island was recorded from 1997 to 2009 (States of Jersey, 2011), suggesting that either winter rainfall has declined over that period or water use has increased, or possibly both. It is generally expected that run off will be greater during the autumn and winter, when rainfall levels are higher. However, extreme rainfall events over the summer and early autumn may contribute significantly to the contamination contained within the runoff due to the build up of wastes in drainage systems during dry weather.
DecNovOctSepAugJulJunMayAprMarFebJan
50
40
30
20
10
0
Month
Rai
nfal
l (m
m)

49
8.2 Wind
Wind data collected at Jersey Airport has been characterised by the seasonal wind roses and annual summary presented in figure 8.3.
Figure 8.3 Wind roses for Jersey Airport
September to November December to February
March to May June to August

50
Overall, the prevailing winds at Jersey airport are from the west. In general, winds tend to be stronger in the winter than in the summer. However, there is seasonal variation in prevailing wind patterns, with winds blowing from the east for a significant proportion of the time from December to May, but with stronger winds from the west in winter and stronger winds from the east in spring. Winds typically drive surface water at about (3%) of the wind speed (Brown, 1991) so a gale force wind (34 knots or 17.2 m/s) would drive a surface water current of about 1 knot or 0.5 m/s. Strong winds may affect tide height depending on wind direction and local hydrodynamics of the site. A strong easterly wind combined with a spring tide may result in higher than usual tides allowing any faecal contamination arising from higher up the shoreline to be washed into the sea. Strong easterly winds may also affect the movement of contaminants from the adjacent shore toward the fishery.

51
9. Current and historical classification status The historical and current classifications for Jersey are shown below in Table 9.1 for Pacific oysters and Table 9.2 for mussels.
Table 9.1 Classifications for Pacific oysters (C. gigas)
Production Area
Bed Name
Class 2009
Class 2010
Class 2011
Class 2012
La Hurel Main bed (La Rocque)
Area 1 B B B Seasonal A/B
Area 21¹ B B B B
Area 23 B Area 23 amalgamated intoArea 28 from 1 April 2010
Area 24 B B B B
Area 28 B B B B
La Hurel Holding bed (La Rocque)
Area 6 B B B B
Area 27 B B B B
Area 29 New area in 2012 B2
Seymour Tower (La Rocque)
Area 20 New area in 2011 A2 A2
Area 26 A A A A
Le Hocq Main bed Area 8 B B B Seasonal
A/B
Area 25 B2 B B Seasonal A/B
Green Island Area 12 C2 B B B
1Areas 21 and 22 combined for the purposes of E. coli testing 2Provisional classification
Most of the areas had therefore held a B classification for Pacific oysters over the period from 2009 to 2011. Area 12 was newly classified in 2009 for Pacific oysters and was given a provisional class C. Since then it has been class B. Area 26 (at Seymour Tower) held an A classification for Pacific oysters over the three years. Area 20, also at Seymour Tower, was newly classified in 2011 and was given a provisional A.

52
Table 9.2 Classifications for mussels (M. edulis)
Production Area
Bed Name Class 2009
Class 2010
Class 2011
Class 2012
La Hurel Main bed (La Rocque)
Area 23 B Area 23 amalgamated into Area 28 from 1 April 2010
Area 24 B B B Seasonal A/B
Area 28 B B B B
La Hurel Holding bed (La Rocque)
Area 27 B B B B
Le Hocq Main bed
Area 8 B Not classified
Not classified
Not classified
Area 25 B1 B B B
1Provisional classification All of the areas listed in Table 9.2 held a B classification for mussels over the period 2009 to 2011.

53
10. Historical E. coli data - Oysters 10.1 Validation of historical data The Department of the Environment, States of Jersey, provided the results of shellfish E. coli testing for samples taken from 11/01/05 to 26/09/11 inclusive. These were validated according to the criteria described in the standard protocol for validation of historical E. coli data. The test was commenced by the laboratory within 24 hours of sampling on most occasions (85%): the maximum delay was 27 hours. Temperatures at time of receipt at the laboratory ranged between 2009 and 2012 ranged from 0.1°C to 12.6°C, with a median of 7.6°C. Results were assigned to concession and species and were not identified to geographical co-ordinates at time of sampling. Co-ordinates for the nominal sampling points were supplied by the Department of the Environment for the purpose of this analysis. All E. coli results were reported in most probable number per 100g of shellfish flesh and intravalvular fluid. Results reported as 0 or as <20 E. coli MPN/100 g were assigned a nominal value of 10 for statistical assessment and graphical presentation. No results were reported as being “>18000 E. coli MPN/100 g”. 10.2 Summary of microbiological results A summary of all sampling and results for oysters is presented in Table 10.1.
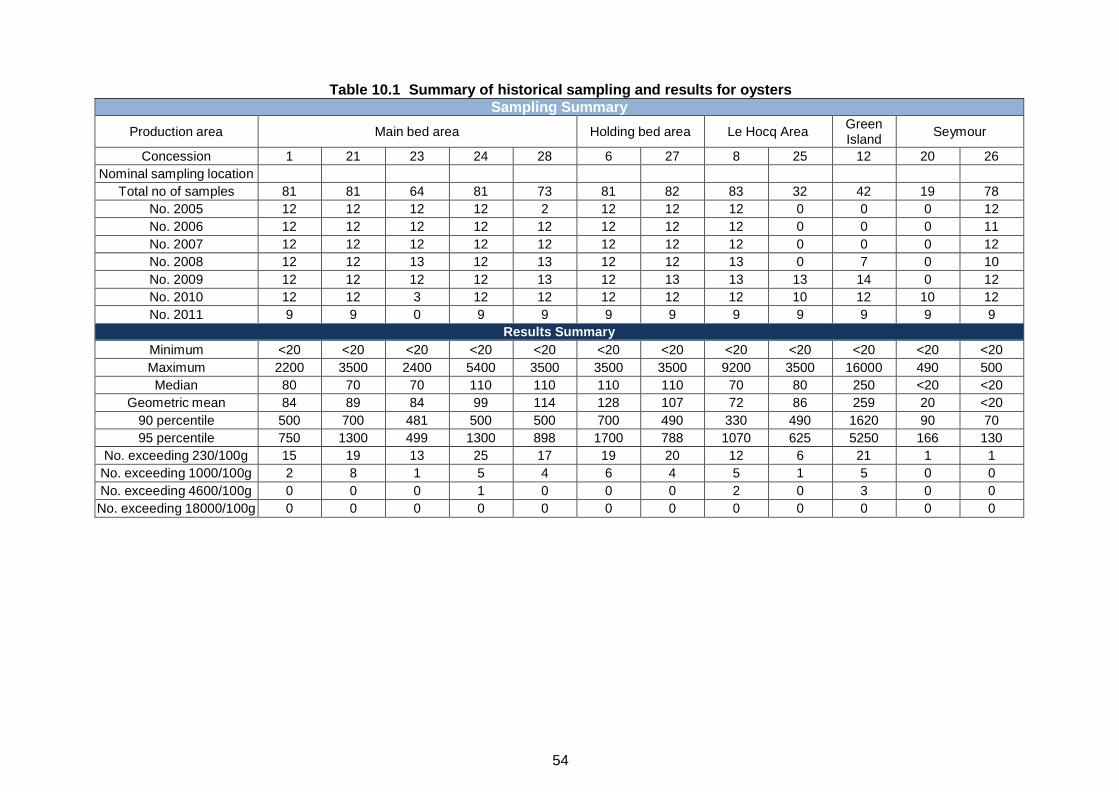
54
Table 10.1 Summary of historical sampling and results for oysters
Sampling Summary
Production area
Main bed area
Holding bed area
Le Hocq Area Green Island
Seymour Concession 1 21 23 24 28 6 27 8 25 12 20 26
Nominal sampling location Total no of samples 81 81 64 81 73 81 82 83 32 42 19 78
No. 2005 12 12 12 12 2 12 12 12 0 0 0 12 No. 2006 12 12 12 12 12 12 12 12 0 0 0 11 No. 2007 12 12 12 12 12 12 12 12 0 0 0 12 No. 2008 12 12 13 12 13 12 12 13 0 7 0 10 No. 2009 12 12 12 12 13 12 13 13 13 14 0 12 No. 2010 12 12 3 12 12 12 12 12 10 12 10 12 No. 2011 9 9 0 9 9 9 9 9 9 9 9 9
Results Summary Minimum <20 <20 <20 <20 <20 <20 <20 <20 <20 <20 <20 <20 Maximum 2200 3500 2400 5400 3500 3500 3500 9200 3500 16000 490 500 Median 80 70 70 110 110 110 110 70 80 250 <20 <20
Geometric mean 84 89 84 99 114 128 107 72 86 259 20 <20 90 percentile 500 700 481 500 500 700 490 330 490 1620 90 70 95 percentile 750 1300 499 1300 898 1700 788 1070 625 5250 166 130
No. exceeding 230/100g 15 19 13 25 17 19 20 12 6 21 1 1 No. exceeding 1000/100g 2 8 1 5 4 6 4 5 1 5 0 0 No. exceeding 4600/100g 0 0 0 1 0 0 0 2 0 3 0 0 No. exceeding 18000/100g 0 0 0 0 0 0 0 0 0 0 0 0

55
10.3 Overall geographic pattern of results Figure 10.1 shows the location of the nominal oyster sampling points reported by States of Jersey for each area with the size of symbol graduated by the geometric mean E. coli value as given in Table 10.1. The value for Area 23 is not shown as this has now been merged with Area 28. The location of sampling for Area 12 varies and the point was plotted at the centroid of the area. A one-way Analysis of Variance (ANOVA) was undertaken by sampling location on the log10-transformed E. coli data. The output showed a highly significant effect of sampling location (p<0.001; see Appendix 3). Post- ANOVA assessment using Tukey’s method showed that the mean log10 E. coli concentrations from Areas 20 and 26 were significantly lower than those of the other areas. Areas 6, 8, 21, 24, 26, 27 and 28 had all been sampled on the same date on 63 occasions since November 2005. A two-way ANOVA showed a significant difference between areas (p<0.001; see Appendix 6). Post-ANOVA assessment using Tukey’s method showed that the mean log10 E. coli from Area 26 was significantly lower those of the other areas.
Produced by Cefas Weymouth Laboratory. © Crown Copyright 2012. All rights reserved.
Base map ©States of Jersey 2012 Figure 10.1 Map of geometric mean E. coli value by sampling location
56
10.4 Overall temporal pattern of results Figures 10.2 and 10.3 presents scatter plots of individual oyster results against date for each concession, fitted with a loess trend line. Loess stands for ‘locally weighted regression scatter plot smoothing’. At each point in the data set an estimated value is fit to a subset of the data, using weighted least squares. The approach gives more weight to points near to the x-value where the estimate is being made and less weight to points further away. In terms of the monitoring data, this means that any point on the loess line is influenced more by the data close to it (in time) and less by the data further away. The trend line helps to highlight any apparent underlying trends or cycles. The plots show that:
i. not all of the areas have been subject to monitoring over the entire period. In particular, monitoring for Areas 12, 20 and 25 only began part way through the period shown, and monitoring for Area 23 stopped at the beginning of 2010;
ii. the results for Areas 20 and 26 tend to be lower than those for the other areas;
iii. several of the areas show a general increase in E. coli results around the 2008/9 winter period.
Although laboratory testing transferred from the Jersey Hospital Laboratory to a Health Protection Agency Laboratory in May 2008, the time series plots do not show a sustained difference between the results of samples taken either side of that date. Further analyses against factors such as season and rainfall were not carried out for those areas for which sampling has ceased (Area 23) or for which there was less than 3 year’s worth of results (Area 20). The analyses for the other areas are presented in the following sections.

57
Figure 10.2 Scatterplots of E. coli results by date with loess line for Areas 1, 6, 8, 12, 20 and 21

58
Figure 10.3 Scatterplots of E. coli results by date with loess line for Areas 23, 24, 25, 26, 27 and 28

59
10.5 Seasonal pattern of results Season dictates not only weather patterns and water temperature, but livestock numbers and movements, presence of wild animals and patterns of human occupation. All of these can affect levels of microbial contamination, and cause seasonal patterns in results. Figure 10.4 presents scatterplots of E. coli results by month, overlaid with a loess line to highlight any trends.
For statistical evaluation, seasons were split into spring (March - May), summer (June - August), autumn (September - November) and winter (December - February). Boxplots of results by season are shown in Figure 10.5.
For the Pacific oysters from Areas 1, 8, 12, 21, 24, 26 and 28, no significant difference was found between results by season (One-way ANOVA, p>0.05, Appendix 6).
For the Pacific oysters from Area 27, a significant difference was found between results by season (One-way ANOVA, p=0.039, Appendix 6). Post- ANOVA analysis by Tukey’s method showed that the results for winter were significantly lower than for the other three seasons. In Figure 10.4 it can be seen that no results above 230 E. coli MPN/100 g were seen in this area in January or February whereas they occurred during all other months of the year.
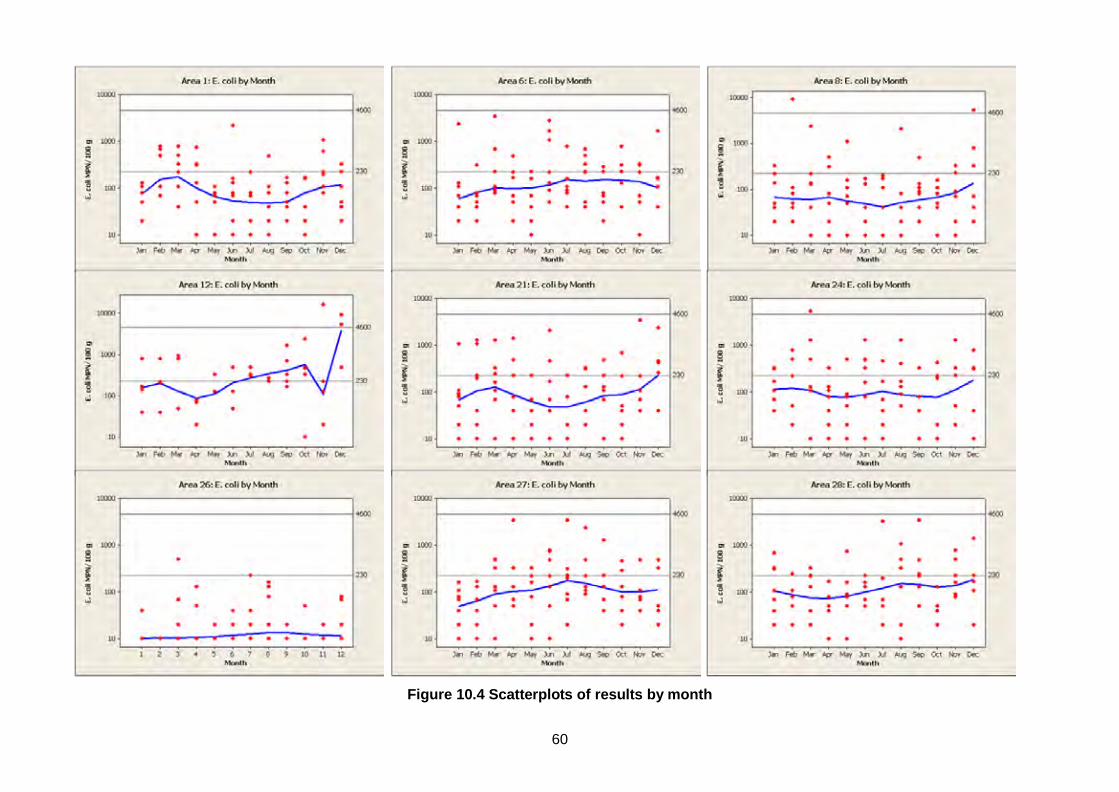
60
Figure 10.4 Scatterplots of results by month
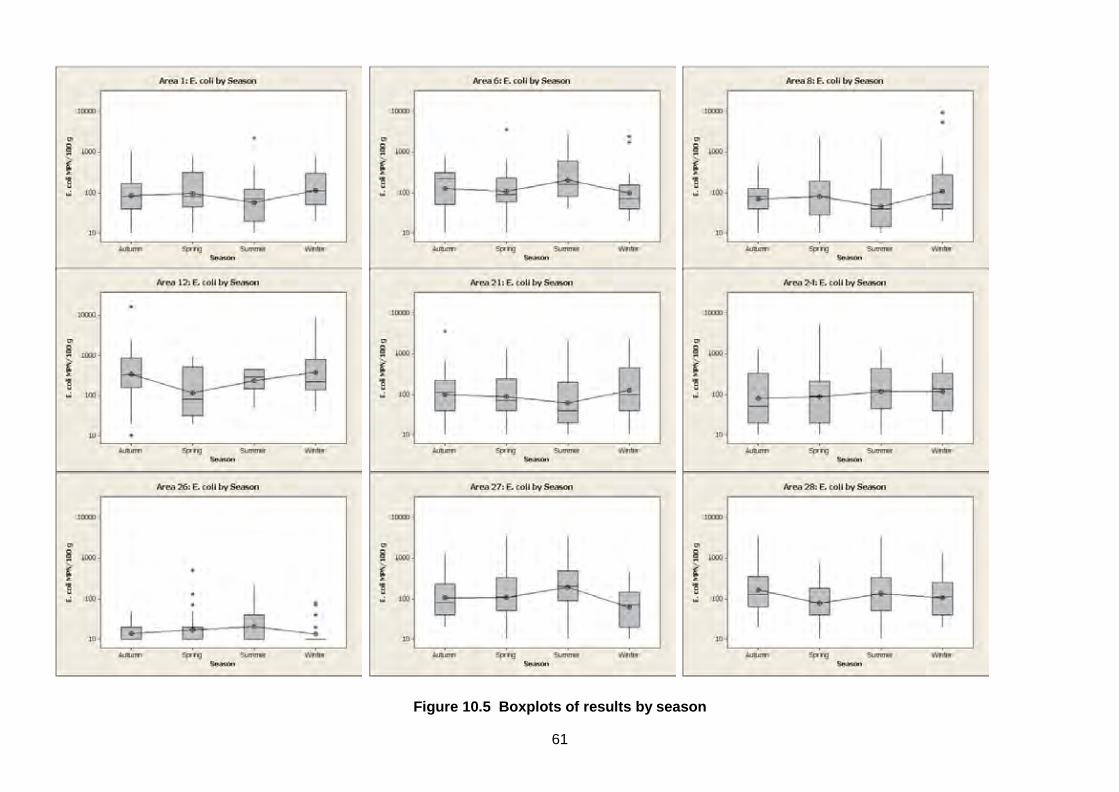
61
Figure 10.5 Boxplots of results by season

62
10.6 Analysis of results against environmental factors Environmental factors such as rainfall, tides, winds, sunshine and temperatures can all influence the flux of faecal contamination into growing waters (e.g. Mallin et al, 2001; Lee & Morgan, 2003). The effects of these influences can be complex and difficult to interpret. This section aims to investigate and describe the influence of these factors individually (where appropriate environmental data is available) on the sample results using basic statistical techniques. 10.6.1 Analysis of results by recent rainfall Rainfall data was supplied by the States of Jersey Meteorological Department for Jersey Airport, the Maison St. Louis Observatory and Howard Davis Farm, Trinity. The data for the Maison St. Louis Observatory was used as it is the closest weather station to the shellfisheries that are the subject of the present sanitary survey. This data covered the period from 1/1/2005 to 30/09/2011 (total daily rainfall in mm). The E. coli data for Areas 1, 6, 8, 21, 24 and 26 were used in these analyses as those areas had been sampled over the whole period. One-day antecedent rainfall Figure 10.6 presents scatterplots of E. coli results for the six areas against total rainfall recorded on the day prior to sampling. A Spearman’s Rank correlation was carried out between the results and the one day rainfall.
Figure 10.6 Scatterplots of result against rainfall on the day prior to sampling A significant correlation was found between E. coli result and rainfall on the previous day for Area 8 (Spearman’s rank correlation=0.241, p=0.028) and Area 21 (Spearman’s rank correlation=0.296, p=0.007). No significant correlation was found for the same analyses for the other four areas (p<0.05; see Appendix 6 for details).

63
Seven-day antecedent rainfall As the effects of heavy rain may take differing amounts of time to be reflected in shellfish sample results in different systems, the relationship between rainfall in the previous 2 and 7 days and the E. coli results was investigated in an identical manner to the above. Figure 10.7 presents scatterplots of E. coli results against total rainfall recorded on the two days prior to sampling.
Figure 10.7 Scatterplots of result against rainfall in previous 2 days
Again, a significant correlation was found between E. coli result and rainfall over the previous 2 days day for Area 8 (Spearman’s rank correlation=0.241, p=0.006) and Area 21 (Spearman’s rank correlation=0.296, p=0.007). No significant correlation was found for the same analyses for the other four areas (p<0.05; see Appendix 6 for details). Figure 10.8 presents scatterplots of E. coli results against total rainfall recorded on the seven days prior to sampling. A significant correlation was found between E. coli result and rainfall over the previous 7 days for Area 8 (Spearman’s rank correlation=0.310, p=0.004), Area 21 (Spearman’s rank correlation=0.326, p=0.003) and Area 24 (Spearman’s rank correlation=0.244, p=0.028). No significant correlation was found for the same analyses for the other three areas (p<0.05; see Appendix 6 for details).

64
Figure 10.8 Scatterplot of result against rainfall in previous 7 days
10.6.2 Analysis of results by tidal height and state When the larger (spring) tides occur every two weeks, circulation of water and particle transport distances will increase, and more of the shoreline will be covered at high water, potentially washing more faecal contamination from livestock into the area. Direction and strength of flow around the production areas will change according to tidal state on the (twice daily) high/low cycle, and, depending on the location of sources of contamination, this may result in marked changes in water quality in the vicinity of the farms during this cycle. However, sampling of the oyster sites always occurs at low water springs, to enable access, and so it was not possible to investigate the effect of either spring/neap or high/low tidal state on the E. coli results. It is possible that sampling at low water springs does not represent the worst case situation, from the perspective of faecal contamination. However, sampling at other tidal states would present severe logistical difficulties. 10.6.3 Analysis of results by water temperature Water temperature is likely to affect the survival time of bacteria in seawater (Burkhardt et al, 2000) and the feeding and elimination rates of shellfish and therefore may be an important predictor of E. coli levels in shellfish flesh. It is of course closely related to season, and so any correlation between temperatures and E. coli levels in shellfish flesh may not be directly attributable to temperature, but to other factors such as seasonal differences in livestock grazing patterns. Seawater temperature was not recorded at the time of sampling, due to the state of tide, and so these analyses could not be undertaken. 10.6.4 Analysis of results by salinity
Salinity will give a direct measure of freshwater influence, and hence freshwater borne contamination at the site. Salinity was not recorded at the time of sampling, due to the state of the tide, and so these analyses could not be undertaken.

65
10.7 Evaluation of results over 4600 E. coli MPN/100g Six of the oyster samples gave results of over 4600 E. coli MPN/100g. Details of these samples are presented in Table 10.2.
Table 10.2 Historic E. coli sampling results over 4600 E. coli MPN/100g
Collection date E. coli (MPN/100g)
Area 1 day
rainfall (mm)
2 day rainfall (mm)
7 day rainfall (mm)
12/11/08 16000 Area 12 4.1 28.5 50.3 15/12/08 5400 Area 8 4.1 13.7 32.9 15/12/08 5400 Area 12 4.1 13.7 32.9 10/02/09 9200 Area 8 18.5 22.2 41.8 01/03/10 5400 Area 24 1.4 53.5 87.6 06/12/10 9200 Area 12 1.6 39.8 58.8
Samples were collected over the period November to March. Two samples had been taken from separate areas on the same date. All of the samples had been taken after moderate to heavy rainfall in the 2 days prior to sampling. Five of the six samples had been taken from Areas 8 and 12, which lie in the centre and towards the western side of St Cement’s Bay respectively. The other sample was from Area 24, which lies in Grouville Bay approximately 1 km from the high water mark. 10.8 E. coli results for the period October 2011 to May 2012 inclusive Following submission of the initial draft sanitary survey report, the States of Jersey supplied E. coli monitoring data for the period from October 2011 to May 2012 inclusive. Figure 10.9 shows scatterplots of the Pacific oyster results for that period. A number of high results were seen during that period, most notably a results of 16,000 E. coli MPN/100 g at Area 26 in May. Apart from this, the highest results were seen amongst the Grouville Bay areas rather than those in St Clement’s Bay. However, the pattern of high results between areas differed between sampling occasions. For example, on the date when the extremely high result was seen at Area 26 (at Seymour Tower) , a much lower result was seen at the adjacent Area 20 and moderately high results were seen at Areas 1, 21 and 6, further north within Grouville Bay.

66
Figure 10.9 E. coli results in Pacific oysters for the period October 2011 to May 2012 inclusive
10.9 Summary and conclusions The highest average level of results was seen at Area 12 (Green Island) on the western side of St Cement’s Bay. This area also showed the highest maximum result. Areas 8 and 12 yielded five of the six results greater than 4,600 E. coli MPN/100 g. The results from Areas 20 and 26, furthest offshore near Seymour Tower, were significantly lower than those of the other areas. There appeared to be no overall change in the results with time over the period analysed here, except for a temporary increase from mid-2008 to mid-2009. This period was not significantly wetter. However, there were significant correlations with rainfall in Areas 8, 21 and 24. Nearby areas did not show a correlation with rainfall. All of the results greater than 4,600 E. coli/ 100 g occurred after wet periods. A significant effect of season was seen in only one area, Area 27, where the results for winter were significantly lower than for other seasons. Information from the States of Jersey Area Environment Department identified that Area 8 lies in the Le Hocq gutter and on a falling tide the sampling point is situated in the surface water stream draining from the coast. Also, Area 21 is also located partly in a surface water stream that drains from the La Rocque harbour area north of the rescue tower as the tide falls. The concession (21) has expanded recently into this draining surface stream. The pattern of more recent high results implies that these have been produced by a source within Grouville Bay, with the exact pattern of results at each sampling location being influenced by the current pattern over the falling tide.

67
10.10 Sampling frequency When a production area holds a non-seasonal classification and the geometric mean of the results falls within a certain range, the EURL Good Practice Guide (GPG) recommends that consideration be given to the sampling frequency being decreased from monthly to bimonthly. The criteria are shown below:
· Class A: if the geometric mean is above 13 the sampling frequency is at least monthly;
· Class B: if the geometric mean is less than 40 or above 210 the sampling frequency is at least monthly;
· Class C: if the geometric mean is less than 750 or above 2250 the sampling frequency is at least monthly;
These are based on the presumption of at least 24 results over a 3 year period. The geometric mean E. coli results for the last three years up to September 2011 are given in Table 10.3 for those areas that are currently sampled and for which at least 24 results were available.
Table 10.3 Three year geometric mean E. coli results Geometric
mean E. coli/100 g
Area 1 95 Area 6 174 Area 8 110
Area 12 253 Area 21 123 Area 24 132 Area 25 86 Area 26 19 Area 27 142 Area 28 138
One of the Pacific oyster areas (Area 26) was given a full A classification in 2011: this had a geometric mean of 19 and so does not qualify for consideration for bimonthly sampling. Nine of the other Pacific oyster production areas were given full B classifications in 2011. The geometric means for all but one of these areas (Area 12) were between 40 and 210 E. coli MPN/100 g and so these areas could be considered for bimonthly sampling: monthly sampling should be maintained for Area 12.

68
11. Historical E. coli data – Mussels 11.1 Validation of historical data The Department of the Environment, States of Jersey, provided the results of shellfish E. coli testing for samples taken from 11/01/05 to 26/09/11 inclusive. Mussel sampling had commenced in June 2008. Data were validated according to the criteria described in the standard protocol for validation of historical E. coli data. The test was commenced by the laboratory within 24 hours of sampling on most occasions (85%): the maximum delay was 27 hours. Temperatures at time of receipt at the laboratory ranged between 2009 and 2012 ranged from 0.1°C to 12.6°C, with a median of 7.6°C. Results were assigned to lease area and species and were not identified to geographical co-ordinates at time of sampling. Co- ordinates for the nominal sampling points were supplied by the Department of the Environment for the purpose of this analysis. Results reported as 0 or as <20 E. coli MPN/100 g were assigned a nominal value of 10 for statistical assessment and graphical presentation. No results were reported as being “>18000 E. coli MPN/100 g”. The only result above this MPN limit had been tested so as to report an endpoint. All E. coli results were reported in most probable number per 100g of shellfish flesh and intravalvular fluid. 11.2 Summary of microbiological results A summary of all sampling and results for mussels is presented in Table 11.1.

69
Table 11.1 Summary of historical sampling and results Sampling Summary
Production area
Main bed area Holding bed area
Le Hocq Area
Lease 23 24 28 27 8 25 Nominal sampling location
Total no of samples 31 49 48 49 29 34 No. 2005 0 0 0 0 0 0 No. 2006 0 0 0 0 0 0 No. 2007 0 0 0 0 0 0 No. 2008 13 13 13 13 11 0 No. 2009 15 15 15 15 15 12 No. 2010 3 12 12 12 3 13 No. 2011 0 9 8 9 0 9
Results Summary Minimum <20 <20 <20 <20 <20 <20 Maximum 13000 5400 16000 24000 3500 1300 Median 230 130 170 330 130 80
Geometric mean 240 115 200 291 137 95 90 percentile 790 330 883 852 1840 330 95 percentile 1900 606 1950 3760 2400 386
No. exceeding 230/100g 14 10 19 29 9 7 No. exceeding 1000/100g 3 2 5 5 4 1 No. exceeding 4600/100g 1 1 1 3 0 0 No. exceeding 18000/100g 0 0 0 1 0 0 11.3 Overall geographic pattern of results Figure 11.1 shows the location of the nominal mussel sampling points reported by States of Jersey for each area with the size of symbol graduated by the geometric mean E. coli value as given in Table 11.1. The value for Area 23 is not shown as this has now been merged with Area 28. The location of sampling for Area 24 varies and the point was plotted at the centroid of the area. A one-way Analysis of Variance (ANOVA) was undertaken by sampling location on the log10-transformed E. coli data. The output showed a highly significant effect of sampling location (p<0.001; see Appendix 6). Post- ANOVA assessment using Tukey’s method showed that the mean log10 E. coli from Areas 24 and 25 were significantly lower from that of Area 27 but not from each other or the other areas. Areas 24, 27 and 28 had been sampled on the same date on 47 occasions between June 2008 and August 2011. A two-way ANOVA showed a significant difference between areas (p<0.001; see Appendix 6). Post-ANOVA assessment using Tukey’s method showed that the mean log10 E. coli from Area 24 was significantly lower than those from Areas 27 and 28. A proportion of the mussel samples from Area 24 had been taken from the poches and a proportion from the offshore poles. The location had been noted for 47 of the samples. An unpaired t-test showed no significant difference in results due to sampling location (t=0.34, p=0.737, df=44).

70
Produced by Cefas Weymouth Laboratory. © Crown Copyright 2012. All rights reserved.
Base map ©States of Jersey 2012 Figure 11.1 Map of geometric mean E. coli value by sampling location
11.4 Overall temporal pattern of results Figure 11.2 presents scatter plots of individual mussel results against date for each concession, fitted with a loess trend line. Loess stands for ‘locally weighted regression scatter plot smoothing’. At each point in the data set an estimated value is fit to a subset of the data, using weighted least squares. The approach gives more weight to points near to the x-value where the estimate is being made and less weight to points further away. In terms of the monitoring data, this means that any point on the loess line is influenced more by the data close to it (in time) and less by the data further away. The trend line helps to highlight any apparent underlying trends or cycles. Only mussels from areas 24, 27 and 28 were monitored throughout the period from June 2008 to September 2011. Monitoring for areas 8 and 23 stopped after March 2010. Monitoring for Area 25 started in March 2009. Apart from Area 8, the loess lines are relatively flat for each set of data with small deviations that do not relate in time from one area to another. In Area 8, there appears to have been a sequence of lower results than normal around the mid-part of 2009. The results from Areas 24, 25, 27 and 28 were subjected to analyses with respect to season and other environmental factors and the outcomes are presented in the following sections.

71
Figure 11.2Scatterplots of E. coli results by date with loess line for Areas 8, 23, 24, 25, 27 and 28

72
11.5 Seasonal pattern of results Season dictates not only weather patterns and water temperature, but livestock numbers and movements, presence of wild animals and patterns of human occupation. All of these can affect levels of microbial contamination, and cause seasonal patterns in results. Figure 11.3 presents scatterplots of E. coli results by month, overlaid with a loess line to highlight any trends. In areas 24, 27 and 28, there appears to be a peak in results centred on July. In Area 25, there is a rise in the trend line towards the end of the year. This effect is present, but less marked, in the other areas and partly relates to fewer low results seen in this period. In Area 25, the effect is more marked because the highest E. coli results have also been seen in December.
Figure 11.3 Scatterplots of results by month
For statistical evaluation, seasons were split into spring (March - May), summer (June - August), autumn (September - November) and winter (December - February). Boxplots of results by season are shown in Figure11.4.

73
Figure 11.4 Boxplots of result by season
No significant difference was found between results by season for any of the four areas (One-way ANOVA, p>0.05, Appendix 6). 11.6 Analysis of results against environmental factors Environmental factors such as rainfall, tides, winds, sunshine and temperatures can all influence the flux of faecal contamination into growing waters (e.g. Mallin et al, 2001; Lee & Morgan, 2003). The effects of these influences can be complex and difficult to interpret. This section aims to investigate and describe the influence of these factors individually (where appropriate environmental data is available) on the sample results using basic statistical techniques. 11.6.1 Analysis of results by recent rainfall Rainfall data was supplied by the States of Jersey Meteorological Department for Jersey Airport, the Maison St. Louis Observatory and Howard Davis Farm, Trinity. The data for the Maison St. Louis Observatory was used as it is the closest weather station to the shellfisheries that are the subject of the present sanitary survey. This data covered the period from 1/1/2005 to 30/09/2011 (total daily rainfall in mm). Three areas had been sampled for mussels from June 2008 to September 2011: Area 24, Area 27 and Area 28. Figure 11.5 presents scatterplots of E. coli results for the three areas against total rainfall recorded on the day prior to sampling. A Spearman’s Rank correlation was carried out between the results and the one day rainfall.

74
Figure 11.5 Scatterplots of result against rainfall on the day prior to sampling
A significant correlation was found between E. coli result and rainfall on the previous day for Area 24 (Spearman’s rank correlation=0.358, p=0.012) and Area 28 (Spearman’s rank correlation=0.381, p=0.007). No significant correlation was found for Area 27 (Spearman’s rank correlation=0.241, p=0.096). As the effects of heavy rain may take differing amounts of time to be reflected in shellfish sample results in different systems, the relationship between rainfall in the previous 2 and 7 days and sample results was investigated in an identical manner to the above. Figure 11.6 presents a scatterplot of E. coli results against total rainfall recorded on the two days prior to sampling. A significant correlation was found between E. coli result and rainfall over the previous 2 days for Area 24 (Spearman’s rank correlation=0.467, p=0.001) and Area 28 (Spearman’s rank correlation=0.445, p=0.002). No significant correlation was found for Area 27 (Spearman’s rank correlation=0.195, p=0.180).
10000
1000
100
10
403020100
10000
1000
100
10
403020100
10000
1000
100
10
Area 24 mussels
Rainfall on the day prior to sampling (mm)
E. c
oli M
PN/1
00 g
Area 27 mussels
Area 28 mussels

75
Figure 11.6 Scatterplots of result against rainfall in previous 2 days
Figure 11.7 presents a scatterplot of E. coli results against total rainfall recorded on the seven days prior to sampling.
Figure 11.7 Scatterplots of result against rainfall in previous 7 days
A significant correlation was found between E. coli result and rainfall over the previous 7 days for Area 24 (Spearman’s rank correlation=0.447, p=0.001), Area 28 (Spearman’s rank correlation=0.473, p=0.001). No significant correlation was found for Area 27 (Spearman’s rank correlation=0.238, p=0.100).
10000
1000
100
10
604530150
10000
1000
100
10
604530150
10000
1000
100
10
Area 24 mussels
Rainfall over the 2 days prior to sampling
E. c
oli M
PN/1
00 g
Area 27 mussels
Area 28 mussels
10000
1000
100
10
806040200
10000
1000
100
10
806040200
10000
1000
100
10
Area 24 mussels
Rainfall over the 7 days prior to sampling (mm)
E. c
oli M
PN/1
00 g
Area 27 mussels
Area 28 mussels

76
11.6.2 Analysis of results by tidal height and state
When the larger (spring) tides occur every two weeks, circulation of water and particle transport distances will increase, and more of the shoreline will be covered at high water, potentially washing more faecal contamination from livestock into the area. Direction and strength of flow around the production areas will change according to tidal state on the (twice daily) high/low cycle, and, depending on the location of sources of contamination, this may result in marked changes in water quality in the vicinity of the farms during this cycle. However, sampling of the mussel sites always occurs at low water springs and so it was not possible to investigate the effect of either spring/neap or high/low tidal state on the E. coli results. 11.6.3 Analysis of results by water temperature
Water temperature is likely to affect the survival time of bacteria in seawater (Burkhardt et al, 2000) and the feeding and elimination rates of shellfish and therefore may be an important predictor of E. coli levels in shellfish flesh. It is of course closely related to season, and so any correlation between temperatures and E. coli levels in shellfish flesh may not be directly attributable to temperature, but to other factors such as seasonal differences in livestock grazing patterns. Seawater temperature was not recorded at the time of sampling and so these analyses could not be undertaken. 11.6.4 Analysis of results by salinity Salinity will give a direct measure of freshwater influence, and hence freshwater borne contamination at the site. Salinity was not recorded at the time of sampling and so these analyses could not be undertaken. 11.7 Evaluation of results over 4600 E. coli MPN/100g Six of the mussel samples gave results over 4600 E. coli MPN/100g. Details of these samples are presented in Table 11.2. Table 11.2 Historic E. coli sampling results over 4600 E. coli MPN/100g
Collection date
E. coli (MPN/100g) Area
1 day rainfall (mm)
2 day rainfall (mm)
7 day rainfall (mm)
21/07/08 5400 Area 24 0 0.2 1.4 21/07/08 5400 Area 27 0 0.2 1.4 28/10/08 16000 Area 28 10.7 23.0 36.8 22/07/09 13000 Area 23 4.5 6.6 19.85 22/07/09 24000 Area 27 4.5 6.6 19.85 26/09/11 5400 Area 27 0.05 0.1 1.1
Samples were collected over the period July to October. On two dates, high results occurred in two separate areas: the pairs of areas were not the same on the two occasions. Three of the samples had been taken after light rainfall in the 2 days prior to sampling, two after moderate rainfall, and one after heavy rainfall. Three of the six samples had been taken from Area 27, which lies relatively close to the shore in Grouville Bay. One sample each came from Area 23, Area 24 and Area 28: these lie further from the shore in Grouville Bay.

77
11.8 E. coli results for the period October 2011 to May 2012 inclusive Following submission of the initial draft sanitary survey report, the States of Jersey supplied E. coli monitoring data for the period from October 2011 to May 2012 inclusive. Figure 11.8 shows scatterplots of the mussel results for that period. The highest results, of 2,400 and 2,200 E. coli MPN/100g were seen at the poles and bags respectively in Area 24. The Pacific oysters at Area 24 and 21 also showed elevated results on that date.
Figure 11.8 E. coli results in mussels for the period October 2011 to May 2012 inclusive
11.9 Summary and conclusions
The highest average level of results was seen at Area 27, one of the areas closest to the shore at the southern end of Grouville Bay. This area also showed the highest maximum result and the highest number of results greater than 4600 E. coli MPN/100 g. The results from Areas 24 and 25 tended to be lower than those for the other areas. In area 24, no significant difference was found between the results for mussels sampled from the poles and those samples from the poches. There appeared to be no overall change in the results with time over the period analysed here and no annual or seasonal effects were apparent. Analysis with respect to rainfall was undertaken for Areas 24, 27 and 28, all located in Grouville Bay. Significant effects were seen with Area 24 and Area 28 but not with Area 27 (which had shown the greatest levels of contamination; see above). Although all results greater than 4600 E. coli /100 g occurred after some rainfall, only 3 of the 6 results occurred after moderate to heavy amounts. Recent results have not shown as high peak results in mussels as has been seen in the Pacific oysters.

78
11.10 Sampling frequency
When a production area holds a non-seasonal classification and the geometric mean of the results falls within a certain range, the EURL Good Practice Guide (GPG) recommends that consideration be given to the sampling frequency being decreased from monthly to bimonthly. The criteria are shown below:
Class A: if the geometric mean is above 13 the sampling frequency is at least monthly;
Class B: if the geometric mean is less than 40 or above 210 the sampling frequency is at least monthly;
Class C: if the geometric mean is less than 750 or above 2250 the sampling frequency is at least monthly;
These are based on the presumption of at least 24 results over a 3 year period. The geometric mean E. coli results for the last three years up to September 2011 are given in Table 11.3 for the four areas for which monitoring is currently being undertaken and for which at least 24 results were available.
Table 11.3 Three year geometric mean E. coli results
Area Geometric mean
E. coli/100 g Area 24 103 Area 25 95 Area 27 247 Area 28 185
All of these mussel sites were given a full B classification in 2011. The geometric means for Area 24, Area 25 and Area 28 all fell in the range between 40 and 210 E. coli MPN/100 g and so consideration could be given to reducing the sampling frequency to bimonthly. The geometric mean for Area 27 was greater than 210 E. coli MPN/100 g and so this area should not be considered for a reduction in sampling frequency.

79
12. Designated Waters 12.1 Shellfish Growing Waters As Jersey sits outside the European Union, it has not specifically designated any waters under the European Community Shellfish Waters Directive (2006/113/EC) and therefore does not undertake monitoring specifically for this directive. However, the monitoring that it undertakes in support of other directives is considered to be largely compliant with the requirements of the Shellfish Waters Directive in terms of bacteriological quality (WCA Environment Ltd, 2011). However, the bacteriological data summarized elsewhere in this report would indicate that most of the shellfish areas would not meet the guideline faecal coliform value given in the Directive. 12.2 Bathing Waters Although not required to comply with the EC Bathing Water Directive (2006/7/EC), Jersey has designated bathing waters around its shores and monitors these weekly during the summer bathing season for faecal coliforms in water, amongst other parameters. Bathing Water Profiles are published online for each of the 16 designated bathing beach areas http://www.gov.je/ENVIRONMENT/PROTECTINGENVIRONMENT/SEACOA ST/Pages/SeawaterMonitoring.aspx ). At St. Clement’s Bay and Grouville Bay, bathing water quality is monitored at the following beaches: Green Island, Grouville and Havre des Pas. The coastal extents of these areas and monitoring points are identified in Figure 12.1. All three locations pass European guideline standards for bathing water quality. Basic descriptive statistics for the 2011 results are presented in Table 12.1. The values can be compared to a study undertaken by an EU working group which indicated that a geometric mean of < 10 E. coli cfu/100 ml in seawater was needed to consistently result in class A in shellfish (European Commission 1996). The comparable figures for class B were:
All species 112 E. coli/100 ml Mussels 50 E.coli/100 ml Pacific oysters 590 E. coli/100 ml
Table 12.1 Bathing waters results for St. Clement’s and Grouville areas – 2011
Bathing Water Faecal coliforms cfu/100 ml
Min Max Geometric mean
Havre des Pas <10 1300 14 Green Island <10 130 9 Grouville <10 255 24
Bathing water results for 2011 were examined against rainfall at the Maison St Louis (MSL) meteorological station for the seven days prior to sampling and plotted in Figure 12.2.

80
Produced by Cefas Weymouth Laboratory. © Crown Copyright 2012. All rights reserved. Base map ©States of Jersey 2012
Figure 12.1 Bathing waters and monitoring points – SE Jersey
Figure 12.2 Comparison of bathing water results against rainfall - 2011
Results suggest that the faecal coliform concentrations observed in water at the three sampling locations responds to different inputs, and these don’t always correlate directly with rainfall observed at MSL. Results at Green Island were generally lower than those at Havre des Pas and Grouville Bay.
0
5
10
15
20
25
30
35
40
45
0
0.5
1
1.5
2
2.5
3
3.57-
day
Rain
fall
mm
Log1
0 FC
/100
ml
Grouville Bay
Havre de Pas
Green Island
Rain MSL 7
Bathing Water Results v. 7-day Rainfall 2011

81
High rainfall did not always correspond with increased results at the three sites and response varied between site. The highest bathing water result overall coincided with a week of very low rainfall. The weather station lies between 4 and 5 km from the sample points and therefore actual rainfall experienced within the bathing water catchments may have differed (although daily rainfall data at the two rainfall stations for the period 1/01/2005 to 30/09/2011 inclusive gave a correlation coefficient of 0.94 with an associated probability of <0.001). However, it also may suggest that sources that are not rainfall dependent contribute significantly to faecal indicator bacteria concentrations at the bathing waters. Other potential sources may include leaking or malfunctioning sewage infrastructure, dogs walked on or near the beach, discharges from yachts, wildlife, and bathers themselves.

82
13. Bathymetry and Hydrodynamics
© Crown Copyright and/or database rights. Reproduced by permission of the Controller of Her Majesty’s Stationery Office and the UK Hydrographic Office (www.ukho.gov.uk).
Figure 13.1 Bathymetry at Grouville and St Clement’s Bays The main bivalve mollusc fisheries are located on extensive drying areas of sand and rocky outcrops in Grouville and St Clement’s Bays (see Figure 13.1): rock predominates in St Clement’s Bay while there is a greater extent of sandy area in Grouville Bay. The sea bed continues to shelve relatively slowly beyond Mean Low Water and depths at chart datum do not exceed 20 m within 5 km of shore. However, the tidal range in the Channel Islands is large and depths at high water springs will be significantly greater than this. 13.1 Tidal Curve and Description The two tidal curves shown in Figure 13.2 are for St Helier, located approximately 4 km to the west of St Clement’s Bay. The tidal curves have been output from UKHO TotalTide. The first is for seven days beginning 00.00 GMT on 28/11/11 and the second is for seven days beginning 00.00 GMT on 05/12/11. Together they show the predicted tidal heights over high/low water for a full neap/spring tidal cycle and cover the period during which the shoreline survey was undertaken.
NOT TO BE USED FOR NAVIGATION

83
© Crown Copyright and/or database rights. Reproduced by permission of the Controller of Her Majesty’s Stationery Office and the UK Hydrographic Office (www.ukho.gov.uk)
Figure 13.2 Tidal curves for St Helier The following is the summary description for St Helier from TotalTide: 1605 ST. HELIER is a Standard Harmonic port. The tide type is Semi-Diurnal.
HAT 12.2 m MHWS 11.0 m MHWN 8.1 m MSL 6.02 m MLWN 4.0 m MLWS 1.4 m LAT 0.1 m
Predicted heights are in metres above chart datum. The average tidal range at spring tide is 9.6 m and at neap tide 4.1 m and so tidal ranges at this location are large (macrotidal). 13.2 Currents Tidal stream information was available for three stations off the south-east coast of Jersey. These stations were located offshore and provide information on the tidal streams around the island but not in the area of the shellfish farms themselves. The locations of the stations are shown in Figure 13.3. Circular plots of speed in m/s versus direction at the three stations are shown in Figure 13.4. The plots are based on values taken from TotalTide and the values themselves are given in Tables 13.1, 13.2 and 13.3.

84
Produced by Cefas Weymouth Laboratory. © Crown Copyright 2012. All rights reserved.
Base map ©States of Jersey 2012 Figure 13.3 Location of tidal stream stations
The tidal streams are much stronger at SN161BB than at either of the other two locations. The tidal stream direction is also more variable at that point: at the other two locations the streams are approximately bidirectional.
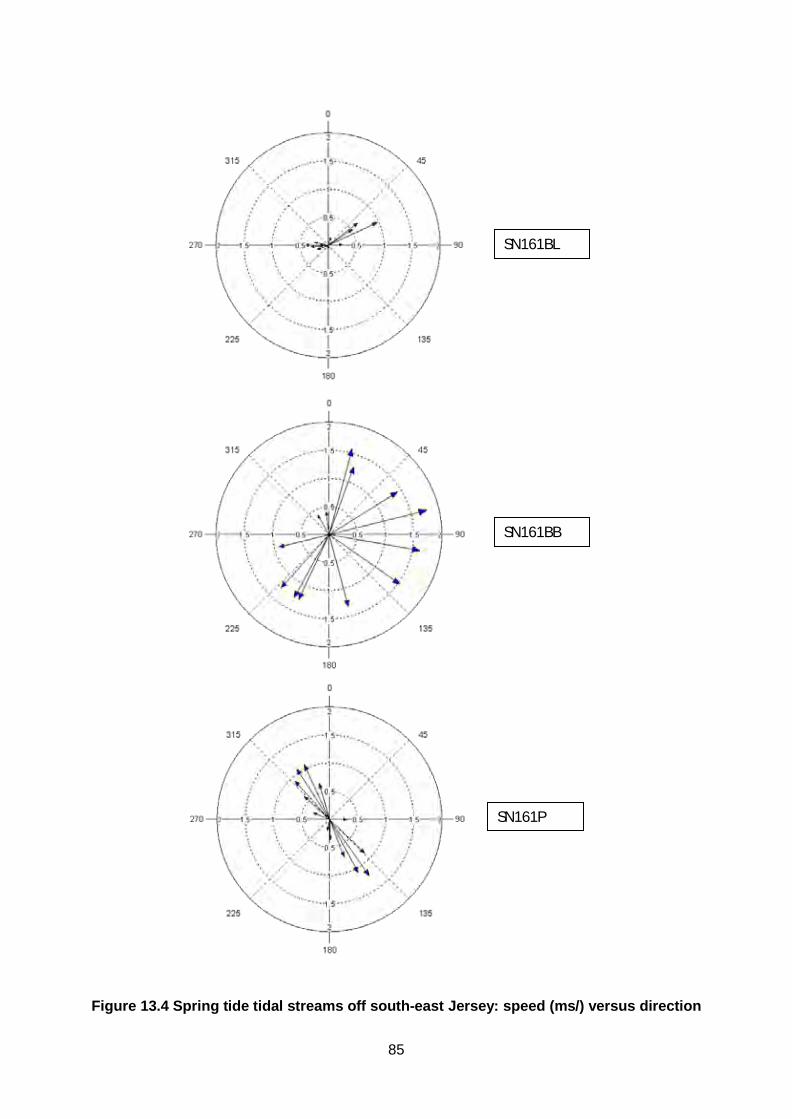
85
Figure 13.4 Spring tide tidal streams off south-east Jersey: speed (ms/) versus direction
SN161BL
SN161BB
SN161P

86
Table 13.1 Tidal streams for station SN161BL (49°10.08'N 2°08.70'W) (taken from TotalTide)
Time Direction (Deg)
Spring rate (m/s)
Neap rate (m/s)
-06h 0 0 -05h 88 0.26 0.10 -04h 53 0.67 0.26 -03h 65 0.98 0.41 -02h 57 0.51 0.21 -01h 16 0.15 0.05 HW 283 0.26 0.10
+01h 266 0.31 0.15 +02h 271 0.41 0.15 +03h 250 0.21 0.1 +04h 265 0.15 0.05 +05h 273 0.15 0.05 +06h 0 0
Table 13.2 Tidal streams for station SN161BB (49°07.94'N 1°57.28'W) (taken from TotalTide)
Time Direction (Deg)
Spring rate (m/s)
Neap rate (m/s)
-06h 205 1.3 0.51 -05h 165 1.3 0.57 -04h 125 1.5 0.62 -03h 100 1.6 0.67 -02h 76 1.8 0.72 -01h 58 1.4 0.62 HW 20 1.3 0.51
+01h 15 1.6 0.67 +02h 353 0.41 0.15 +03h 330 0.41 0.15 +04h 256 0.93 0.36 +05h 222 1.3 0.51 +06h 209 1.3 0.51
Table 13.3 Tidal streams for station SN161P (49°11.94'N 1°56.08'W) (taken from TotalTide)
Time Direction (Deg)
Spring rate (m/s)
Neap rate (m/s)
-06h 178 0.36 0.15 -05h 159 0.72 0.36 -04h 152 1.1 0.51 -03h 145 1.2 0.57 -02h 134 0.87 0.41 -01h 90 0.31 0.1 HW 344 0.67 0.31
+01h 335 1.1 0.51 +02h 327 1.1 0.51 +03h 318 0.93 0.46 +04h 312 0.62 0.31 +05h 292 0.31 0.1 +06h 191 0.21 0.1

87
Although references were found to a number of hydrodynamic and sediment transport studies which were reported between 1980 and 1995, efforts to obtain copies of these were not fruitful. Pingree, et al. (1985) identified that the water column in the area around the Channel Islands is well-mixed throughout the year due to tidal effects. However, they noted that a frontal zone develops between Jersey and Guernsey and that this is most pronounced in summer and late winter. They also identified that there are tidal fringes south-west of Jersey. These zones and fringes will not affect the transport of contaminants around the south-east corner of Jersey. Tidal stream information was presented for the region of the Channel Islands and this was as expected: on the south coast of Jersey the streams tend to flow eastwards during the flood tide and westwards during the ebb tide and on the east coast the streams tend to flow southwards on the flood tide and northwards on the ebb tide. However, the closest tidal arrows presented for the east coast appeared to be some way offshore (it is not possible to determine the exact distance from the figures presented in the publication). Greenaway (2001) reviewed a number of both published and unpublished studies. Some of these related to current behaviour over the whole of the Gulf of St Malo, or around the whole of the coast of Jersey, and, for the present purpose, these do not add to the information obtained from the UKHO tidal diamonds. A study by HR Wallingford showed that, off St Clement on the south coast of Jersey, the currents flowed towards the south-east on a flood tide and towards the north-west on an ebb-tide. The peak spring tide flood current flows were 1.2 m/s and the peak spring tide ebb current flows were 1.0 m/s. Greenaway also reviewed the outputs from a number of hydrodynamic models of St Aubin’s Bay. These all agreed on a general anticlockwise circulation. With respect to Grouville Bay, float tracking studies and modelling showed that there was a clockwise circulation, with flows running in a general northerly direction from mid-flood to mid- ebb and in a general southerly direction from mid-ebb to mid-flood. Maximum recorded current speeds were in the region of 1 m/s on larger spring tides and 0.5 m/s on an average spring tide. Information was also acquired from the Jersey Spearfishing Club (Chris Isaacs, pers. commun.). This related directly to the areas where the shellfisheries are located. The information reflects the experience of the club and has not been obtained by direct measurement of current speed and direction. Figure 13.5 shows the likely currents over the last half of ebb tide and Figure 13.6 shows likely currents over the first half of flood tide (http://www.jerseyspearfishing.co.uk/).

88
Figure 13.5 Likely currents on the last half of ebb tide (provided by Jersey
Spearfishing Club)
Figure 13.6 Likely currents on the first half of flood tide (provided by Jersey
Spearfishing Club) Mr Isaacs also provided the following information relating to the area of beds in Grouville Bay:
“At high tide the eastbound current running along the south coast simply sweeps around the La Rocque corner and north into the bay. It continues to run in this direction through high tide but some areas briefly go slack around high. On the drop the expanse of reefs and sandbanks between La Rocque harbour and Seymour Tower start to expose and cut off the flow. Slack water in the middle of the bay is around half-tide on the drop.
As the tide is dropping partially enclosed areas such as the Seymour slip "basin" are

89
still flowing as they drain out eastward past Little Seymour. At this point water from the draining beach at Seymour slipway passes the southern oyster beds. After half tide on the drop the current in the bay switches and runs south, around the exposed reefs and then west. At this point the remaining water in the north of the bay drains out in a south to south east direction past the beds and water from further north also sweeps into the bay. This water has originated from St Catherine’s Bay area. This current direction continues until half tide on the rise. At this point the current in the bay goes slack but gutters and partly enclosed areas still have movement as they continue to fill. After half tide on the rise the reefs start to cover and the surface flow simplifies. At this point most of the water which passes the beds has first travelled along the entire south coast. The current passing most beds as they emerge and submerge is southerly as most are below the half-tide mark. The beds themselves have an impact on the flow when the water is shallow and tend to slow the current down and deflect it around them. Slack water at the east end of the south coast is around an hour and a half before low water. The exact time in the tide when the water mass from a particular origin passes the beds is subject to the size of the tide and strength of flow. Anecdotal information from one of the harvesters identified that material within St. Aubin’s Bay that moves south and then west around Noirmont on a falling tide can, on change of tide, be taken to the area south of Elizabeth Castle and the Demi des Pas. This area is the ‘neck’ of La Sambue Gutter. The harvester contended that this area receives potentially cleaner water moving from the Seymour Tower area to the east which is then replaced by water moving from the west by the time the water is 3m+ above the Green Island site. It has been identified that the prevailing wind directions in Jersey are south westerly, westerly or north westerly (States of Jersey, 2003). In general, therefore, Grouville Bay will be protected from such winds whereas easterly flood tide currents in St Clement’s Bay will be increased and westerly ebb tide currents decreased. Offshore winds from France will increase northerly currents in Grouville Bay and reduce southerly currents. 13.3 Salinity effects Greenaway (2001) reported that surface salinities in the vicinity of Jersey were generally 34 ppt or slightly greater. No salinity profiling was undertaken during the shoreline survey. Two spot subsurface seawater samples taken during the survey returned results of 36.0 and 36.3 ppt. This indicates essentially no freshwater impact at those locations. The large tidal exchange in the area would be expected to result in good mixing of the seawater. However, after heavy rainfall, reduced salinity may occur in the immediate vicinity of the identified streams and storm-related discharges. 13.4 Turbidity Greenaway (2001) identified that some aerial images had shown the presence of significant amounts of turbidity in the surface waters around Jersey. More recently,

90
an image on Google Earth, taken in 2005, showed significant turbidity in the Grouville Bay area. It is assumed that the turbidity is due to resuspended beach material. If such material contains faecal contamination, there is the potential for contamination of the water column and ingestion by the shellfish. Survival of E. coli in such sediments is thought to be potentiated if it has a high organic content (Gerba and McLeod, 1975). 13.5 Conclusions Due to the large tidal range, there will be a good exchange of seawater in the area. There will also be a marked change in the amount of dilution available between high water springs, when it will be significant, and other parts of the tidal cycle. Available information indicates that tidal flows in the vicinity of the mean low water mark in St Clement’s Bay will flow westerly on the falling tide and easterly on the rising tide. Nearer shore, there will be a general tendency of movement away from the shore during the ebb tide and towards shore during the flood tide. Superimposed on this, water will flow between the gutters in the rocks and this will create more complex pathways which will change with the height of the tide. The Green Island Gutter will direct any contamination arising from sources to the west towards the shellfisheries on the rising tide. In Grouville Bay, the flows in the vicinity of the low water mark are southerly over parts of both the ebb and flood tide, but change to northerly during the second half of flood tide. There will also be the components away from and towards the shore on the ebb and flood tides. Grouville Bay is less rocky than St Clement’s Bay, with the rocks becoming less frequent with increasing distance from La Rocque, thus there is less deflection of water movement through gutters in Grouville Bay. However, there are still height differences in the seabed in the sandy areas and this will have an effect on water flow.

91
14. Shoreline Survey Overview The shoreline survey was conducted on the 28th and 29th November 2011. The weather in Jersey had been dry for a significant period of time prior to the survey. On the day before the survey and during the survey period itself, a small amount of rain fell. The bivalve fisheries consist of aquaculture sites for Pacific oysters and mussels at the southern end of Grouville Bay and in St Clement’s Bay. Most of the shellfish are grown in poches on trestles. Mussels are grown on bouchots (poles) in one area. Native oysters are being grown in one area but these are not presently classified. The coastal strip along the two bays is populated with several villages merging into each other: the area surrounding Fort Henry (including the golf course) is the only significant break in the coastal habitation. The town of St Helier is located a short distance to the west of St Clement’s Bay. The main continuous sewage outfall is located in the intertidal area in St Aubin’s Bay. Several other outfalls associated with pumping stations were observed during the shoreline survey: these should only discharge during heavy rainfall or in emergency situations. Some of the outfalls had small flows at the time of the survey but it is known that some of the outfalls also serve small streams, road gulleys, gutters and groundwater inputs. Three known streams were identified by States of Jersey staff during the survey: one was a continuous stream at Gorey slip; the others were intermittent streams at Fauvic and Pontac. A large number of boats were moored in Gorey Harbour. Farming and horticulture takes place inland of the coastal strip and no farm animals were recorded in the vicinity of the shoreline. Large numbers of Brent Geese were seen during the survey, mainly in the mid-section of Grouville Bay. A number of seabirds and other birds were also seen but in lesser numbers than the geese. A total of seven seawater samples were taken in the vicinity of the fishery. The results ranged from 1 to 270 E. coli cfu/100 ml. The highest result (270 E. coli cfu/100 ml), was obtained on the falling tide in the vicinity of Gorey slip. Freshwater samples and discharge measurements were taken at 10 outfalls or culverted outlets. Freshwater samples taken at the observed outfalls/outlets all contained significant concentrations of E. coli except one. The results ranged from <10 to 16520 E. coli cfu/100 ml. The highest result was obtained from the Fauvic outlet. In addition, the main Bellozanne outfall (UV disinfected secondary effluent) was sampled but not measured. This returned a result of 6590 E. coli cfu/100 ml. Pacific oyster samples were collected from three locations in Grouville Bay and Three locations in St Clement’s Bay. The results ranged from <20 to 490 E. coli MPN/100 g with the highest result being given by a sample taken from Area 29. One mussel sample was taken during the survey: this was from taken from the north-west corner of the trestles in Area 24 and returned a result of 490 E. coli MPN/100 ml. Figure 14.1 shows a summary map of the most significant findings from the shoreline survey.

92
Produced by Cefas Weymouth Laboratory. © Crown Copyright 2012. All rights reserved. Base map ©States of Jersey 2012
Figure 14.1 Summary of shoreline survey findings

93
15. Overall Assessment Fishery The shellfisheries are located in the southern half of Grouville Bay and in St Clement’s Bay, both located on the south-east coast of Jersey. They consist of concession areas primarily containing areas of trestles where Pacific oysters are grown to commercial size from seed. Imported mussels are also laid down on the trestles for up to 6 months. There is one area of mussel poles in Grouville Bay, further out than the oyster trestles. Settled spat are imported on ropes for placement on the poles. In the concession furthest west in St Clement’s Bay, a flat oyster fishery is being developed. The different species have been monitored separately for classification purposes and, in general, each separate area of trestles or poles has been monitored separately. Impacts from sewage and surface water drainage The main continuous sewage discharge for the island lies over 7 km northwest of Area 12, the westernmost shellfish site in St. Clement’s Bay. The effluent from this works receives UV treatment and the geometric mean reported effluent quality falls within the expected range for this level of treatment. Monitoring data indicates that there is significant fluctuation in the faecal coliform content of the effluent. Given the size of the discharge, even at the geometric mean value the overall daily loading of the outfall would be significant in the immediate vicinity of the discharge and the contribution to the bacteriological quality at the shellfisheries will depend on local currents and the dilution and dispersion that may take place between the discharge point and the shellfisheries. There are several intermittent outfalls along the shores of both Grouville Bay and St. Clements Bay. These discharges are largely rainfall dependent. A large number of boats and/or yachts operate in the waters around Jersey and there is the potential for discharge of septic waste overboard both within marinas and mooring areas and during passage around the island. Any overboard discharges within the vicinity of the fishery would be expected to have a significant, localised impact on water quality. Three permanent streams were identified: one discharging at Gorey slip to the north of the shellfisheries in Grouville Bay and two discharging at Le Dicq to the west of the shellfisheries in St Clement’s Bay. All of these may by contaminated with land run-off after rainfall and thus constitute significant potential sources of contamination. The Gorey stream is also the overflow point for an intermittent rainfall-related sewage discharge and so any faecal content may be a combination of both land run-off and diluted sewage. However, only one overflow of less than 2 hours duration has been recorded since 2001. The streams at Le Dicq discharge at a different point to the nearby intermittent sewage overflow. Many of the other outfalls and outlets along the two bays will carry surface water drainage (from roads and/or land) following rainfall and these may also be a significant source of faecal contaminants to the near-shore waters.

94
Agricultural impacts Despite the high population density along the coast, Jersey has a significant amount of agricultural activity. Potatoes, soft fruit such as tomatoes and strawberries, flowers, dairy and poultry represent the largest part of agricultural production. Approximately 25% of the land area is given over to grassland production (including silage, hay, haylage, forage maize and other stock feed crops). Slurry, farm yard manures and pelleted sludge may all be applied to these lands, with restrictions. States of Jersey have a comprehensive agricultural waste management plan, with restricted seasons for application of slurry and an field-level assessment of areas at greatest risk for contamination ground and/or surface waters. Risks from all fields may be higher depending on the working status of the field (ie. bare, compacted, under grass, etc.) Depending on waste management practices at individual farms, there is potential for contamination from these sources to reach the coast in the vicinity of the shellfisheries via land drains discharging through the outfalls/outlets after rainfall events. A larger number of animals are located further inland in the catchments of the three identified permanent watercourses, one of which discharges to the coast at Gorey slip and the other two to the coast at Le Dicq. Any contamination entering these watercourses would be likely to increase significantly after rainfall events. A large poultry operation is located within 500 metres of the shore at the south end of Grouville Bay. Depending on manure management practices at this farm, there may be the potential of runoff from chicken runs and any collected manure from housing areas. Any impact from this would be greater nearer to shore in Grouville Bay. Wildlife impacts The most significant potential impact to the shellfisheries from wildlife source faecal contamination will be from geese, gulls and other shore birds present in the area during winter and during the spring and/or autumn migrations. The impact from this source may be higher on the shellfish sites off Le Hurel in Grouville Bay and lower at those in St. Clement’s Bay. Seasonal variation Jersey has a large tourist industry and the annual number of visitors to the island is several times the island’s population. The main tourist season is from May to September inclusive. The load on the sewerage and sewage treatment systems will therefore be greatest during the summer months. It is generally expected that run off will be greater during the autumn and winter, when rainfall levels are higher. The water table tends to be highest in the winter and therefore land run-off will tend to occur after lower levels of rainfall during that season. However, extreme rainfall events over the summer and early autumn may contribute significantly to the contamination contained within the runoff due to the build up of wastes in drainage systems during dry weather. No significant seasonal flux in farm animals is expected. With regard to wildlife, the impact from geese is expected to be higher in the winter. Other birds may pass through during the spring and autumn. Gulls may be present year-round.

95
In the seasonal analysis of E. coli results for oysters, a significant effect was seen in only one area, Area 27, where the results for winter were significantly lower than for other seasons. No seasonal effects were seen in the E. coli results for the mussels. Results by month indicated that some areas appeared to experience a slight increase in results during November or December. This appeared in areas 1, 8, 12, 21, 24 and 28 in oysters and areas 24, 25, and 28 mussels. However, it should be noted that relatively few samples were taken during these months and therefore this apparent trend should be viewed with caution. Meteorology Rainfall patterns varied markedly from year to year and were markedly higher in 2007, 2008 and 2010 than in other years from 2005 on. A higher number of extreme rainfall events occurred during 2010. Rainfall tended to be low during the summer and increase from October onwards, peaking during November and December and tailing off slowly through March. More extreme rainfall events occurred in all months although a greater number of such events were seen from May to August. There were significant correlations between the E. coli results in oysters and rainfall in Areas 8, 21 and 24. Nearby areas did not show a correlation with rainfall. All of the results greater than 4600 E. coli/100 g occurred after wet periods. Although generally higher E. coli results were seen in oysters from mid-2008 to mid-2009, this period was not significantly wetter than the periods before and after this. For mussels, analysis with respect to rainfall was undertaken for Areas 24, 27 and 28, all located in Grouville Bay. Significant effects were seen with Area 24 and Area 28 but not with Area 27. Although all results greater than 4600 E. coli/ 100 g occurred after some rainfall, only 3 of the 6 results occurred after moderate to heavy amounts. Analysis of bathing waters results against rainfall showed differing responses at the monitored sites, with the highest recorded sample results occurring during dry weather. This suggests that sources and/or transport of contamination in these areas are not all rainfall-dependent. Prevailing winds are from the west and, in general, winds tend to be stronger in the winter than in the summer. There is seasonal variation in the wind patterns, blowing from the east for a significant proportion of the time from December to May, but with stronger winds from the west in winter and stronger winds from the east in spring. Movement of contaminants In general, there will be a good exchange of seawater in the area due to the tidal range. Dilution of contaminants at high tide will be considerable. Tidal flows in the vicinity of St Clement’s Bay will generally flow westerly on the falling tide and easterly on the rising tide. The Green Island Gutter will direct any contamination arising from sources to the west towards the shellfisheries on the rising tide. In Grouville Bay, the flows in the vicinity of the low water mark are southerly over parts of both the ebb and flood tide, but change to northerly during the second half of flood tide.. The effect of gutters will be less in Grouville Bay but these, and channels in the sand, may have localised effects on directing water flows. Superimposed on the

96
general currents, there will be the normal flows away from the shore during the ebb tide and towards the shore during the flood tide. As the shellfish are sampled at low water springs due to practical constraints, consideration of flows with respect to sources of contamination principally relate to those over the ebb tide, although some contamination taken up during the flood tide may remain in the shellfish over the few hours prior to sampling. In St Clement’s Bay, flows are generally to the west during ebb tide and thus contamination impacting during the ebb itself will tend to arise to the north and east of the shellfisheries. In Grouville Bay, flows are generally to the north during the first half of ebb and to the south during the second half. Therefore, contamination arising at locations within the bay will be taken northward during the first half of the ebb tide and then southward. Contamination arising during the second half of the ebb tide will be taken to the east and south. Some of the classified areas, such as the holding bed and Seymour Tower, are located at significant drying heights and the bags will tend to be exposed over the last half of the ebb tide. The other areas will be subjected to more of the ebb tide. The pattern of high results seen across the classified areas within Grouville Bay tends to vary. This may be due to the influence of different sources, the different exposure times, the effect of different flows through the gulleys, or a combination of all three. Temporal and geographical patterns of sampling results Oysters The highest average level of results, and the highest maximum result, was seen at Area 12 (Green Island) on the western side of St Catherine’s Bay. Areas 8 and 12 yielded five of the six results greater than 4,600 E. coli MPN/100 g. The results from Areas 20 and 26, furthest offshore near Seymour Tower, were significantly lower than those of the other areas. There appeared to be no overall change in the results with time over the period from January 2005 to September 2011, except for a temporary increase from mid-2008 to mid-2009. Mussels The highest average level of results was seen at Area 27, one of the areas closest to the shore at the southern end of Grouville Bay. This area also showed the highest maximum result and the highest number of results greater than 4,600 E. coli MPN/100 g. The results from Areas 24 and 25 tended to be lower than those for the other areas. In area 24, no significant difference was found between the results for mussels sampled from the poles and those samples from the poches. There appeared to be no overall change in the results with time over the period from June 2008 to September 2011. A number of high results were seen in the E. coli results obtained since then, with the highest seen at some of the Grouville Bay areas and at Area 26 by Seymour Tower. Conclusions The main potential sources of faecal contamination come from three broad categories:

97
i. Those arising in the immediate vicinity of the trestles which include wildlife sources and possible discharges from boats.
ii. Those arising from the near shore, which include fresh water sources, surface water overflows and intermittent outfalls. These may contain a mix of point and diffuse source contamination of both human and animal origin.
iii. Those arising from further afield, which would include discharges at Bellozanne as well as intermittent discharges from the Cavern and at Le Dicq outfall.
The mix of sources affecting the St. Clements Bay fishery differ from those likely to impact the Grouville Bay fishery. From a geographical perspective, these can be further described as:
i. To the west of St Clement’s Bay, there is the continuous discharge at Bellozanne and the intermittent discharges from the Cavern and the Le Dicq outfall during heavy rainfall events and the stream outlets further up the shore at Le Dicq. There may also be contributions from boat activity in the vicinity of the harbour and marina at St Helier.
ii. To the north of the shellfish sites in Grouville Bay there is the stream with intermittent discharge at Gorey slip and other intermittent outfalls between there and Fauvic. The main impacts from wildlife will be seen at the more northerly classified areas within Grouville Bay.
Low flows and some E. coli content have been seen at many of the observed outfalls/outlets during dry weather. This will increase during wet weather at those containing stream water, land run-off or road run-off even in the absence of sewerage overflow operation. Dilution of contamination and mixing of seawater is generally high but this may be modified at the local level by the seawater running through the system of gutters and channels in the sand. Currents tend to flow southward in Grouville Bay much of the time. However, over the last half of the flood tide and the first half of the ebb tide the flow will be principally in a northerly direction. In St Clement’s Bay the currents tend to flow eastward over the ebb tide and westward over the flood tide. From the historical shellfish E. coli data obtained up to September 2011, the western side of St Clement’s Bay and the southern end of Grouville Bay showed the highest levels of contamination and the two oyster areas at Seymour Tower the lowest. Since September 2011, a number of high results have been obtained for the Pacific oyster sampling points in Grouville Bay and a very high result was seen in Area 26 at Seymour Tower. Given the large population on the south-east side of the island of Jersey, and other potential sources of faecal contamination, it is presently unlikely that shellfisheries located relatively close to shore will consistently attain the quality required for an A classification. The associated water quality of an average (geometric mean) of <10 E. coli/100 ml is very stringent compared to bathing water standards (e.g. a 90%ile of 250 E. coli/100 ml for the Excellent category under the 2006 Directive).

98
16. Recommendations
All latitude/longitude positions are given using the WGS84 reference system. A map summarizing the recommendations is given in Figure 16.1. Production areas (all co-ordinates as WGS84) Green Island and Le Hocq main bed currently differ in the extent of contamination and continued separation of the two areas is justified. Green Island The area bounded by a line drawn from 49° 9’.55 N 2° 4’.04 W to 49° 9’.55 N 2° 3’.42 W to 49° 9’.24 N 2° 3’.42 W to 49° 9’.24 N 2° 4’.04 W and back to 49° 9’.55 N 2° 4’.04 W. Le Hocq Main Bed The area bounded by a line drawn from 49° 9’.70 N 2° 3’.33 W to 49° 9’.70 N 2° 2’.39 W to 49° 9’.23 N 2° 2’.39 W to 49° 9’.23 N 2° 3’.33 W and back to 49° 9’.70 N 2° 3’.33 W. The La Hurel Holding Bed and La Hurel Main Bed differ in their responses to environmental factors and the former is closer to local potential sources of contamination. There is therefore justification for maintaining these as separate areas. The northern and southern parts of the main bed are potentially subject to different sources of contamination and, although they currently do not show significantly different levels of contamination, they merit separate monitoring and classification in case the extent of impact from one or more sources changes in the future. It is therefore recommended that the Main Bed is split into two. It is also the case that the northern half of the main bed is currently classified for mussels as well as Pacific oysters whereas this is not the case for the southern half. La Hurel Holding Bed The area bounded by a line drawn from 49° 10’.44 N 2° 1’.58 W to 49° 10’.44 N 2° 1’.27 W to 49° 10’.01 N 2° 1’.27 W to 49° 10’.01 N 2° 1’.58 W and back to 49° 10’.44 N 2° 1’.58 W. La Hurel Main Bed North The area bounded by a line drawn from 49° 10’.75 N 2° 1’.42 W to 49° 10’.92 N 2° 0’.89W to 49° 10’.46 N 2° 0’.59 W to 49° 10’.31 N 2° 1’.12 W and back to 49° 10’.75 N 2° 1’.42 W. La Hurel Main Bed South The area bounded by a line drawn from 49° 10’.31 N 2° 1’.12 W to 49° 10’.46 N 2° 0’.59 W to 49° 10’.02 N 2° 0’.30 W to 49° 9’.87 N 2° 0’.83 W and back to 49° 10’.31 N 2° 1’.12 W. Seymour Tower The area bounded by a line drawn from 49° 9’.75 N 2° 0’.30 W to 49° 9’.75 N 1° 59’.49 W to 49° 9’.21 N 1° 59’.49 W to 49° 9’.21 N 2° 0’.30 W and back to 49° 9’.75 N 2° 0’.30 W. Representative Monitoring Points (RMPs) Given the approach to grouping of the shellfish farms into the production areas, it is recommended that each production area/species combination is represented by a single monitoring point. The recommended location of each RMP with respect to a farm within each production area (where there is more than one farm) and the

99
location within that farm is intended to represent the most significant potential source(s) of faecal contamination for the production area (from the west at St Clement’s Bay; from the west and from local sources in at La Hurel Main bed South; from local sources at La Hurel Holding Bed and La Hurel Main Bed North; potentially from both the west and north-west at Seymour Tower). These sources may only be detectable under adverse conditions given that many of the sources are rainfall- dependent. Given that very recent results have been markedly different for Areas 26 and 20, it is recommended that those two areas continue to be monitored separately. The two areas have been placed in a single production area: if further monitoring shows a significant difference in the E. coli results between the two monitoring points, consideration should be given to splitting the production area. No significant difference was found between the results from the mussel poles in Area 24 and from the trestles. It is therefore recommended that future sampling for mussels from La Hurel Main Bed North is undertaken at the trestles. As it is intended that Green Island be classified for flat oysters as well as Pacific oysters, it is recommended that sampling be undertaken for both species.
Oysters
Production area Location (WGS84) Species Green Island 49° 9’.48 N 2° 3’.84 W C. gigas & O. edulis
Le Hocq 49° 9’.54 N 2° 3’.20 W C. gigas
La Hurel Holding Bed 49° 10’.21 N 2° 1’.44 W C. gigas
La Hurel Main Bed North
49° 10’.50 N 2° 1’.07 W C. gigas
La Hurel Main Bed South
49° 10’.02 N 2° 0.’83 W C. gigas
Seymour Tower A 49° 9’.28 N 2° 0.’10 W C. gigas
Seymour Tower B 49° 9’.49 N 1° 59’.79 W C. gigas
Mussels
Production area Location (WGS84) Le Hocq 49° 9’.40 N 2° 2’.77 W1
La Hurel Holding Bed 49° 10’.35 N 2° 1’.49 W2
La Hurel Main Bed North
49° 10’.50 N 2° 1’.07 W3
Notes: 1A location on Area 25 has been proposed as there are currently no mussels at Area 8. If this situation changes, the RMP should be moved to coincide with that of oysters at Area 8. 2A location on Area 27 has been proposed as there are currently no mussels at Area 6. If this situation changes, the RMP should be moved to coincide with that of oysters at Area 6. 3Located on the trestles

100
Tolerance Given that all of the sampling locations are located on trestles, it is proposed that a maximum tolerance of 20 m around the designated RMP location be applied. Depth of sampling Not applicable as all of the recommended RMPs are on the trestles. Frequency of sampling The stability assessment, based on geometric mean values, suggested the possibility of consideration of bimonthly sampling for some of the production areas. However, given that the current proposals include some reorganisation of the production areas together with a rationalisation of monitoring points and relocation of some of the remaining ones, it is recommended that this is considered after any new monitoring programme has been in place for at least one year. Given that many of the potentially impacting sources are rainfall-dependent, a bimonthly sampling frequency could be too infrequent to detect the impact of such sources on the microbiological quality of the shellfisheries. This aspect should also be taken into account in any future review of sampling frequency. Seasonality of sampling Given that there are different practices between the companies with regard to the seasonality of harvest of Pacific oysters and mussels, it is recommended that the sampling for these species be undertaken throughout the year. In contrast, the flat oysters will only be harvested by one company and the season is intended to reflect the traditional approach of September to April inclusive. Once Green Island is classified for this species, ongoing sampling could start in August, prior to the season and then continue monthly through to April. However, if parallel monitoring indicates that the Pacific oysters adequately reflect the quality of the flat oysters as well at that location, year-round sampling of just the Pacific oysters may be considered. Changes in shellfishery location and use It may be that the locations of the trestles gradually change with time within the boundaries of the recommended production areas and that commercially stocked trestles are no longer located within the tolerance of one or more RMPs. If this occurs, there are number of possible approaches that may be considered:
i. Place bagged shellfish at the RMP so that ongoing sampling takes place at the recommended location.
ii. Move the RMP to the closest location on the commercially active trestles to that which was initially recommended.
iii. Review the production area boundaries and RMP location(s) for the affected area(s) to produce an addendum to the sanitary survey report.
The approach taken will partly depend on the distance of the new trestle locations

101
from the position of the recommended RMP and partly on whether there are other practical considerations. If there is any doubt as to whether the second option will adequately reflect the potential sources of faecal contamination (e.g. if the distance is relatively large) then either the first or third option would be preferred. Obviously, if a whole production area goes out of commercial use for the foreseeable future, there will be no need to maintain sampling at the RMP. If there is an expected interruption for several months, it will be possible to either reduce the sampling frequency, or suspend sampling altogether, with sampling recommencing prior to the expected date of first harvest. The number of monthly samples taken prior to that first harvest will depend on the approach taken to sampling in the fallow period. It is recommended that the sanitary survey be reviewed in total on a periodic basis (the EURL Good Practice Guide recommends every 6 years) in order to accommodate a more thorough reassessment of changes to the shellfisheries and to the potential sources of faecal contamination. Known major changes in either could lead to initiation of such a review at an earlier date. Seawater temperature and salinity With respect to both seawater temperature and salinity, recording at the trestles at the time of sampling would be difficult due to the bias of this to low water spring tide. It would be possible to attach miniature conductivity, temperature and depth (CTD) recorders to specific trestles and download the data periodically. This approach would be especially useful to consider in conjunction with any pollution investigations that may be undertaken.
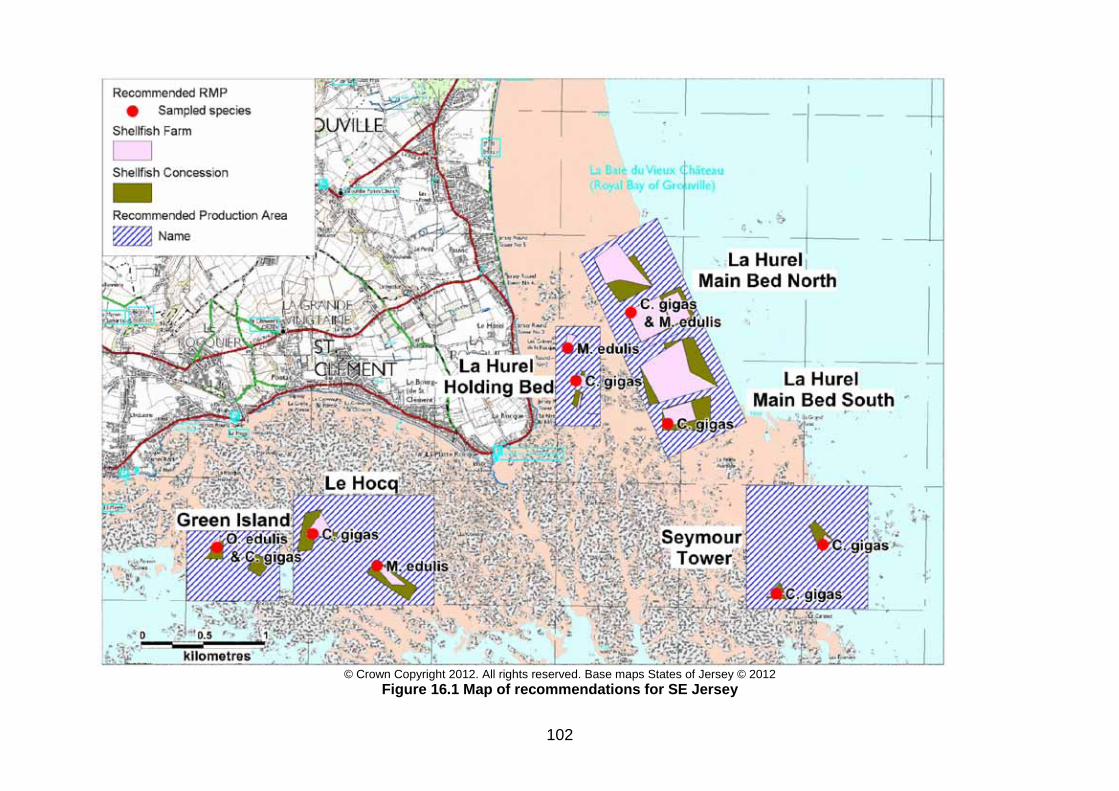
102
© Crown Copyright 2012. All rights reserved. Base maps States of Jersey © 2012
Figure 16.1 Map of recommendations for SE Jersey

103
17. References Aquafish Solutions Ltd, 2010. Development of an Aquaculture Strategy for Jersey. Report to the States of Jersey. 158 pp. Brown J. (1991). The final voyage of the Rapaiti. A measure of surface drift velocity in relation to the surface wind. Marine Pollution Bulletin, 22, 37-40. Burkhardt, W., Calci, K.R., Watkins, W.D., Rippey, S.R., Chirtel, S.J. (2000). Inactivation of indicator microorganisms in estuarine waters. Water Research, Volume 34(8), 2207-2214. European Commission (1996). Report on the equivalence of EU and US legislation for the sanitary production of live bivalve molluscs for human consumption. EU Scientific Veterinary Committee Working Group on Faecal Coliforms in Shellfish. Ingram, S.N. and Rogan, E. (2002). Identifiying critical areas and habitat preferences of bottlenose dolphins Tursiops truncatus. Mar Ecol Prog Ser, 244:247-255. Gerba, C.P. and McLeod, J.S. (1975). Effects of sediments on survival of Escherichia coli in marine waters. Applied and Environmental Microbiology 32, 114-120. Greenaway, B. 2001. Beach and Oceanographic Processes Surrounding Jersey, Channel Island. Thesis submitted for the Degree of Master of Philosophy, University of Southampton. Jersey Tourism (2011). Jersey Tourism: A Year in Review 2010. St Helier: Jersey Tourism Department, 56 pp. Kay, D, Crowther, J., Stapleton, C.M., Wyler, M.D., Fewtrell, L., Anthony, S.G., Bradford, M., Edwards, A., Francis, C.A., Hopkins, M. Kay, C., McDonald, A.T., Watkins, J., Wilkinson, J. (2008). Faecal indicator organism concentrations and catchment export coefficients in the UK. Water Research 42, 442-454. Kay, D, Crowther, J., Stapleton, C.M., Wyer, M.D., Fewtrell, L., Anthony, S.G., Bradford, M., Edwards, A., Francis, C.A., Hopkins, M. Kay, C., McDonald, A.T., Watkins, J., Wilkinson, J. (2008). Faecal indicator organism concentrations in sewage and treated effluents. Water Research 42, 442-454. La Société Jersiaise, Marine Biology Section. (2011) A special report on the ecological importance of Jersey’s south east coast Ramsar area (Draft). http://www.societe- jersiaise.org/marine-biology/draft-report-on-the-ecological-importance-of-jerseys-south- east-ramsar-area.html. Downloaded 13/01/2012. Langley J., Wyer M., Kay D., Shutes B., Kett S., Gwyn M. and Fanthome R. 1997. Stream water quality on the island of Jersey: A report to the States of Jersey Public

104
Services Department, June 1997. Lee, R.J., Morgan, O.C. (2003). Environmental factors influencing the microbial contamination of commercially harvested shellfish. Water Science and Technology 47, 65-70. Mallin, M.A., Ensign, S.H., McIver, M.R., Shank, G.C., Fowler, P.K. (2001). Demographic, landscape, and meteorological factors controlling the microbial pollution of coastal waters. Hydrobiologia 460, 185. Mitchell, P. Ian, S. F. Newton, N. Ratcliffe & T. E. Dunn. 2004. Seabird Populations of Britain and Ireland, Results of the Seabird 2000 Census (1998-2002). T&AD Poyser, London. Pingree R.D., Mardell G.T. and Maddock L. (1985). Tidal mixing in the Channel Isles Region derived from the results of remote sensing and measurements at sea. Estuarine, Coastal and Shelf Science, 20:1-18. Pommepuy, M., Guillaud, J.F., Dupray, E., Derrien, A., Le Guyader, F., and Cormier, M. (1992). Enteric bacteria survival factors. Water Science & Technology, 25: 93-103. Port of Jersey (2011). www.portofjersey.je Accessed 12/12/2011. States of Jersey (2003). An Air Quality Strategy for Jersey. April 2003. AEAT/ENV/R/0977 Issue 5.1. 76 pp. States of Jersey (2009). Transcript of Environment Scrutiny Panel meeting with Transport and Technical Services, Tuesday 7th July 2009. http://www.scrutiny.gov.je/SiteCollectionDocuments/Transcript%20-%20Environment%20Panel%20-%20Quarterly%20Hearing%20- %20Minister%20for%20Transport%20and%20Technical%20Services%20- %2007%20July%202009.pdf. Accessed 29 May 2012. States of Jersey (2010). Jersey’s Resident Population 2009. States of Jersey Statistics Department, 5 pp. States of Jersey (2011). States of Jersey Report 2005-2010. Department of the Environment. http://www.gov.je/SiteCollectionDocuments/Government%20and%20administration/R%20S tateOfJersey200521015%2020121001%20LM.pdf. Downloaded 23/01/2012. WCA Environment Ltd. 2011. Final report to States of Jersey environment scrutiny panel review from WCA Environment Limited. Faringdon. 75 pp. .http://www.statesassembly.gov.je/ScrutinyReports/2011/Report%20- %20Protecting%20our%20Marine%20Environment-Appendix%20- %2009%20November%202011.pdf

105
18. List of Figures and Tables Figure 1.1 Location of St Clement’s Bay and Grouville Bay ............................................................................. 12 Figure 2.1 St Clement’s Bay and Grouville Bay Fishery .................................................................................... 15 Figure 3.1 Population map of St Clement’s Bay and Grouville Bay .................................................................. 18 Figure 4.1 Treatment flow through Bellozanne STW (from States of Jersey) .................................................. 19 Figure 4.2 Spills at Bellozanne compared with rainfall recorded at Maison St. Louis .......................................... 20 Figure 4.3 Map of consented discharges and shoreline survey observations for southeast Jersey ............... 27 Figure 4.4 Jersey catchments ........................................................................................................................... 29 Figure 4.5 Map of surface drainage observations ............................................................................................ 30 Figure 4.6 Map of pollution investigation sampling points for southeast Jersey ............................................ 35 Figure 5.1 LCM2000 class land cover data for St Clements Bay and Grouville Bay ......................................... 37 Figure 6.1 Slurry storage facilities .................................................................................................................... 39 Figure 6.2 Livestock observations at Grouville Bay and St Clements Bay ....................................................... 41
Figure 7.1 Wildlife in relation to SE Jersey fishery............................................................................................ 46 Figure 8.1 Box plots of daily rainfall values by year at Maison St. Louis from ................................................ 47 Figure 8.2 Box plots of daily rainfall values by month at Maison St. Louis from ............................................ 48 Figure 8.3 Wind roses for Jersey Airport .......................................................................................................... 49 Figure 10.1 Map of geometric mean E. coli value by sampling location .......................................................... 55 Figure 10.2 Scatterplots of E. coli results by date with loess line for Areas 1, 6, 8, 12, 20 and 21 .................. 57 Figure 10.3 Scatterplots of E. coli results by date with loess line for Areas 23, 24, 25, 26, 27 and 28............ 58 Figure 10.4 Scatterplots of results by month ................................................................................................... 60 Figure 10.5 Boxplots of results by season ....................................................................................................... 61 Figure 10.6 Scatterplots of result against rainfall on the day prior to sampling ............................................. 62 Figure 10.7 Scatterplots of result against rainfall in previous 2 days .............................................................. 63 Figure 10.8 Scatterplot of result against rainfall in previous 7 days ................................................................ 64 Figure 10.9 E. coli results in Pacific oysters for the period October 2011 to May 2012 inclusive ................... 66 Figure 11.1 Map of geometric mean E. coli value by sampling location ......................................................... 70 Figure 11.2Scatterplots of E. coli results by date with loess line for Areas 8, 23, 24, 25, 27 and 28 ............... 71 Figure 11.3 Scatterplots of results by month ................................................................................................... 72 Figure 11.4 Boxplots of result by season .......................................................................................................... 73 Figure 11.5 Scatterplots of result against rainfall on the day prior to sampling .............................................. 74 Figure 11.6 Scatterplots of result against rainfall in previous 2 days ............................................................... 75 Figure 11.7 Scatterplots of result against rainfall in previous 7 days ............................................................... 75 Figure 11.8 E. coli results in mussels for the period October 2011 .................................................................. 77 Figure 12.1 Bathing waters and monitoring points – SE Jersey ........................................................................ 80
Figure 12.2 Comparison of bathing water results against rainfall - 2011 ........................................................ 80 Figure 13.1 Bathymetry at Grouville and St Clement’s Bays ........................................................................... 82 Figure 13.2 Tidal curves for St Helier ................................................................................................................ 83 Figure 13.3 Location of tidal stream stations .................................................................................................. 84 Figure 13.4 Spring tide tidal streams off south-east Jersey: speed (ms/) versus direction.............................. 85 Figure 13.5 Likely currents on the last half of ebb tide (provided by Jersey .................................................... 88 Figure 13.6 Likely currents on the first half of flood tide (provided by Jersey ................................................ 88 Figure 14.1 Summary of shoreline survey findings .......................................................................................... 92
Figure 16.1 Map of recommendations for SE Jersey ...................................................................................... 102
Table 2.1 St Clement’s Bay and Grouville Bay shellfish farms .......................................................................... 13
Table 3.1 Parishes close to St Clement’s Bay and Grouville Bay ...................................................................... 16

106
Table 4.1 Bellozanne overflow sampling results, 2009 .................................................................................... 21 Table 4.2 Typical Faecal Coliform concentrations in sewage ........................................................................... 22 Table 4.3 Typical Faecal Coliform concentrations in sewage ........................................................................... 22 Table 4.4 Spill hours by pumping station – 2010 .............................................................................................. 24 Table 4.5 Combined drainage outfalls near St Clement’s Bay and Grouville Bay ............................................ 25
Table 4.6 Infrastructure and flow-related observations noted during the shoreline survey .......................... 26
Table 4.7 Estimated loadings relating to shoreline survey measurements of outflows .............................................. 31 Table 4.8 Results from pollution investigations – States of Jersey 2008 ........................................................ 34 Table 6.1 Livestock kept on Jersey in 2006-2010 ............................................................................................. 38 Table 7.1 Significant bird populations in Southeast Jersey Ramsar area. ........................................................ 43 Table 7.2 Wader counts – 2010 ....................................................................................................................... 43 Table 7.3 Brent goose counts – 2010 .............................................................................................................. 44 Table 7.4 Wildlife observed during shoreline survey ....................................................................................... 45 Table 9.1 Classifications for Pacific oysters (C. gigas) ..................................................................................... 51 Table 9.2 Classifications for mussels (M. edulis) ............................................................................................. 52 Table 10.1 Summary of historical sampling and results for oysters ................................................................ 54 Table 10.2 Historic E. coli sampling results over 4600 E. coli MPN/100g ........................................................ 65 Table 10.3 Three year geometric mean E. coli results .................................................................................... 67 Table 11.1 Summary of historical sampling and results ................................................................................... 69
Table 11.2 Historic E. coli sampling results over 4600 E. coli MPN/100g ......................................................... 76 Table 11.3 Three year geometric mean E. coli results .................................................................................... 78 Table 12.1 Bathing waters results for St. Clement’s and Grouville areas – 2011 ........................................... 79 Table 13.1 Tidal streams for station SN161BL (49°10.08'N 2°08.70'W) (taken from ....................................... 86 Table 13.2 Tidal streams for station SN161BB (49°07.94'N 1°57.28'W) (taken from ...................................... 86 Table 13.3 Tidal streams for station SN161P (49°11.94'N 1°56.08'W) (taken from ......................................... 86