Sangeeth minor project about customer
73
A STUDY ON CUSTOMER PREFERENCE IN AMBADI REGENCY GURUVAYOOR KERALA PROJECT REPORT Submitted in partial fulfillment of the requirement for the award of degree of Master of Business Administration Submitted by SANGEETH.A.S Reg no: MBA FINANCE ST.ALOYSIUS COLLEGE ELTHURUTH, THRISSUR UNDER THE GUIDENCE OF MASHA SASI FACULTY OF MANAGEMENT ST.ALOYSIUS COLLEGE, THRISSUR Centre for participatory and online programmes.
-
Upload
sangeeth-nattika -
Category
Education
-
view
12 -
download
2
Transcript of Sangeeth minor project about customer

A STUDY ON CUSTOMER PREFERENCE IN AMBADI REGENCY GURUVAYOOR KERALA
PROJECT REPORT
Submitted in partial fulfillment of the requirement for the award of degree of Master of Business Administration
Submitted by
SANGEETH.A.S
Reg no:
MBA FINANCE
ST.ALOYSIUS COLLEGE ELTHURUTH, THRISSUR
UNDER THE GUIDENCE OF
MASHA SASI
FACULTY OF MANAGEMENT
ST.ALOYSIUS COLLEGE, THRISSUR
Centre for participatory and online programmes.
Bharathiyar university
Coimbatore -641046
2014-2016

DECLARATION
I, SANGEETH.A.S do here by declare that the project Report of ambadi regency at customer preference with special reference to marketing department of guruvayoor has been prepared by me.
I also declare that the report has not been submitted by me for the award of any degree, diploma or other similar title of any other university, earlier.
SANGEETH.A.S

ACKNOWLEDGEMENT
I am thankful to staff of AMBADI REGENCY GURUVAYOOR , for their co-operation and assistance that helped me to complete this project.
With great respect , I express my deep sense of gratitude to my guide Mrs. Masha Sasi whose meticulous guidance , wise council and technical criticisms enabled me to complete this work in its present form.
I would like to express my sincere gratitude to Mr. Biju Varghese, center coordinator, internal guide Mrs.Vinodini and other teachers for their inspiration and encouragement during the course of study.
Above all I thanks God all mightily who blessed me to deepest love and never ending gratitude to my family for their encouragement and motivation.
SANGEETH.A.S

LIST OF CONTENTS
CHPATERSTITLE
Page No.
CHAPTER 1 1.1 INTRODUCTION1.2 OBJECTIVES OF THE STUDY1.3 RESEARCH METHODOLOGY1.4 LIMITATIONS
CHAPTER 2 2.1 INDUSTRY PROFILE
2.2 COMPANY PROFILE
CHAPTER 3 3.1 REVIEW OF LITERATURE
CHAPTER 4 4.1 DATA ANALYSIS & INERPRETATION
CHAPTER 5 5.1 FINDINGS
5.2 SUGGESTIONS
5.3 CONCLUSION
BIBILIOGRAPHY
ANNEXURE

LIST OF TABLES
SL.NO PARTICULARS PAGE NO
1 AGE
2 LOADGING
3
TRAVELLING FACILITIES
4 VIP SERVICE
5 PACKAGES
6 RESTAURENT SERVICE
7 PICKUP & DROP
8 STAY WITH US
9 TEMPLE VISIT
10 INTERNET PREFERENCE

LIST OF CHARTS
SL.NO PARTICULARS PAGE NO
1 AGE
2 LOADGING
3
TRAVELLING PREFERNCE
4 VIP SERVICE
5 PACKAGES
6 RESTAURENT SERVICE
7 PICKUP & DROP
8 STAY WITH US
9 TEMPLE VISIT
10 INTERNET PREFERENCE

SYNOPSIS
The company I have selected for this project is AMBADI REGENCY
GURUVAYOOR. Ambadi Regency Was Inaugurated By Mr. K V Abdul Kader,
MLA Of Guruvayur On 16th AUGEST 2011 (The Holy Month Of “Vrishchika”)
And It Is Located Very Near To Guruvayur Temple.
.
The topic I have selected for the project is “customer
preference”. Customer preference is a term frequently used in marketing. It is a
measure of how products and services supplied by a company meet or surpass
customer expectations. Customer satisfaction is defined as “the number of
customers or percentage of total customers, whose reported experience with a firm,
its products, or its services exceeds specified preference goals”. It is essential for
business to effectively manage customer preference. To be able to this firms need
reliable and representative measure of preference. In researching preference, firms
generally ask customers whether their product or service has met or exceeded
expectations. The importance of customer preference diminishes when a firm has
increased bargaining power. There is a substantial body of empirical literature that
establishes the benefits of customers’ preference for firms. The main aims of the
study assess the level of customer preference with a particular product, service or
experience and to find out which sales promotion tools will increase the sales.
Management published in magazines, websites, etc. are used for review of
literature.

CHAPTER 1
INTRODUCTION

1.1 INTRODUCTION
CONSUMER PREFERENCE
In microeconomics, the theory of consumer choice relates preferences (for the consumption of both goods and services) to consumption expenditures; ultimately, this relationship between preferences and consumption expenditures is used to relate preferences to consumer demand curves. The link between personal preferences, consumption, and the demand curve is one of the most closely studied relations in economics. Consumer choice theory is a way of analyzing how consumers may achieve equilibrium between preferences and expenditures by maximizing utility as subject to consumer budget constraints.
Preferences are the desires by each individual for the consumption of goods and services that translate into choices based on income or wealth for purchases of goods and services to be combined with the consumer's time to define consumption activities. Consumption is separated from production, logically, because two different consumers are involved. In the first case consumption is by the primary individual; in the second case, a producer might make something that he would not consume himself. Therefore, different motivations and abilities are involved. The models that make up consumer theory are used to represent prospectively observable demand patterns for an individual buyer on the hypothesis of constrained optimization. Prominent variables used to explain the rate at which the good is purchased (demanded) are the price per unit of that good, prices of related goods, and wealth of the consumer.
The fundamental theorem of demand states that the rate of consumption falls as the price of the good rises; this is called the substitution effect. Clearly, if one does not have enough money to pay the price, then they cannot buy any of that item. As prices rise, consumers will substitute away from higher priced goods and services, choosing less costly alternatives. Subsequently, as the wealth of the individual rises, demand increases, shifting the demand curve higher at all rates of consumption; this is called the income effect. As wealth rises, consumers will substitute away from less costly inferior goods and services, choosing higher priced alternatives.

Contents
1 Model setup 2 Effect of a price change 3 Income effect 4 Price effect as sum of substitution and income effects 5 Assumptions ,5.1 Use Value 6 Labor-leisure tradeoff 7 See also 8 References
Model setup
Further information: Indifference curve and Budget constraint
1.2 OBJECTIVES OF THE STUDY

PRIMARY OBJECTIVES:
To study and analyze the customer preference of ambadi regency
SECONDARY OBJECTIVES
To analyze the customer preference level. To find the suggestions of the customers. To find the control measures in the firm.
1.3 RESEARCH METHODOLOGY
Research is an art of scientific information. Research methodology is a method of source the research problems systematically. It involves gathering data, use of statistical techniques, interpretation and drawing conclusions about the research data. This study covers the customer preference of ambadi regency guruvayoor. This research is a management research in the field of analysis. It asses the customer preference level of ambadi regency guruvayoor.
METHODS OF COLLECTION OF DATA
The task of data collection begins immediately after a research has been defined and a good research design is chalk out while deciding the method of data collection to be used for the study, the researcher should keep in mind the nature of data.
PRIMARY DATA
Primary data are those, which are collected for the first time and this happens to be original in character. The researcher can obtain primary data either

through observation or through communication with respondents in one from another or through personal interviews with customers. In this project primary data is collected from customers
SECONDARY DATA
Secondary data was collected from company record, internet and books the secondary which have already collected, tabulated, and presented in some from by someone other purpose.
1.4 LIMITATIONS
Times are a main limiting factor in the study and within the time allowed, it is not possible to study all the aspects in details.
Busy schedule of the firm. Some time data collection is very difficult. Reluctance of respondents.

CHAPTER 2
INDUSTRY PROFILE AND COMPANY PROFILE

2.1 INDUSTRY PROFILE
HOTEL & LOADGING INDUSTRY
The hospitality industry is a broad category of fields within the service industry
that includes lodging, event planning, theme parks, transportation, cruise line, and
additional fields within the tourism industry. The hospitality industry is a multi-
billion dollar industry that depends on the availability of leisure time and
disposable income. A hospitality unit such as a restaurant, hotel, or an amusement
park consists of multiple groups such as facility maintenance, direct operations
(servers, housekeepers, porters, kitchen workers, bartenders, management,
marketing, and human resources etc.).
Usage rate, or its inverse "vacancy rate", is an important variable for the hospitality
industry. Just as a factory owner would wish a productive asset to be in use as
much as possible (as opposed to having to pay fixed costs while the factory is not
producing), so do restaurants, hotels, and theme parks seek to maximize the
number of customers they "process" in all sectors. This led to formation of services
with the aim to increase usage rate provided by hotel consolidators. Information
about required or offered products are brokered on business networks used by
vendors as well as purchasers.
In looking at various industries, "barriers to entry" by newcomers and competitive
advantages between current players are very important. Among other things,
hospitality industry players find advantage in old classics (location), initial and

ongoing investment support (reflected in the material upkeep of facilities and the
luxuries located therein), and particular themes adopted by the marketing arm of
the organization in question (for example at theme restaurants). Also very
important are the characteristics of the personnel working in direct contact with the
customers. The authenticity, professionalism, and actual concern for the happiness
and well-being of the customers that is communicated by successful organizations
is a clear competitive advantage.
Lodging (or a holiday accommodation) is a type of residential accommodation.
People who travel and stay away from home for more than a day need lodging for
sleep, rest, safety, shelter from cold temperatures or rain, storage of luggage and
access to common household functions.[1]
Lodgings may be self-catering, in which case no food is provided, but cooking
facilities are available.
Lodging is done in a hotel, motel, hostel or hostel, a private home (commercial, i.e.
a bed and breakfast, a guest house, a vacation rental, or non-commercially, with
members of hospitality services or in the home of friends), in a tent,
caravan/camper (often on a campsite).
Tourism is travel for recreation, leisure, religious, family or business purposes,
usually for a limited duration. Tourism is commonly associated with international
travel, but may also refer to travel to another place within the same country. The
World Tourism Organization defines tourists as people "traveling to and staying in
places outside their usual environment for not more than one consecutive year for
leisure, business and other purposes".[1]

Tourism has become a popular global leisure activity. Tourism can be domestic or
international, and international tourism has both incoming and outgoing
implications on a country's balance of payments. Today, tourism is a major source
of income for many countries, and affects the economy of both the source and host
countries, in some cases being of vital importance.
Tourism suffered as a result of a strong economic slowdown of the late-2000s
recession, between the second half of 2008 and the end of 2009, and the outbreak
of the H1N1 influenza virus. It then slowly recovered, with international tourist
arrivals surpassing the milestone of 1 billion tourists globally for first time in
history in 2012.[4] International tourism receipts (the travel item in the balance of
payments) grew to US$1.03 trillion (€740 billion) in 2011, corresponding to an
increase in real terms of 3.8% from 2010.[5] In 2012, China became the largest
spender in international tourism globally with US$102 billion, surpassing Germany
and United States. China and emerging markets have significantly increased their
spending over the past decade, with Russia and Brazil as noteworthy examples.
Hotel consolidator (also called a hotel broker or discounter) is a travel company or
business that buys up blocks of hotel rooms in top destinations and then resells
them at discounted rates to the final customer. Hotel consolidators’ seemingly to
brokers buy in bulk and then resell at a predetermined discount thus creating a big
push search for discounted hotel deals online and passing the savings on to their
customers.[1]
Global hotel consolidators usually offer discounted rooms in almost every major
tourist destination, big city or popular resort while local consolidators focus only
on a particular geographic area trying to be most competitive on a key for the
company market. Hotel consolidator’s activity can be separated into two main
operations: 1) Buying blocks of rooms at volume discounts in certain major cities

2) Distributing “excess rooms” offered by hotels not anticipating full occupancy
for given dates.[2]
A hotel is an establishment that provides lodging paid on a short-term basis.
Facilities provided may range from a basic bed and storage for clothing, to luxury
features like en-suite bathrooms. Larger hotels may provide additional guest
facilities such as a swimming pool, business center, childcare, conference facilities
and social function services. Hotel rooms are usually numbered (or named in some
smaller hotels and to allow guests to identify their room. Some hotels offer meals
as part of a room and board arrangement. In the United Kingdom, a hotel is
required by law to serve food and drinks to all guests within certain stated hours. In
Japan, capsule hotels provide a minimized amount of room space and shared
facilities.
The precursor to the modern hotel was the inn of medieval Europe. For a period of
about 200 years from the mid-17th century, coaching inns served as a place for
lodging for coach travelers. Inns began to cater for richer clients in the mid-18th
century. One of the first hotels in a modern sense was opened in Exeter in 1768.
Hotels proliferated throughout Western Europe and North America in the 19th
century, and luxury hotels began to spring up in the later part of the century.
Hotel operations vary in size, function, and cost. Most hotels and major hospitality
companies have set industry standards to classify hotel types. An upscale full-
service hotel facility offers luxury amenities, full service accommodations, on-site
full service restaurant(s), and the highest level of personalized service. Full service
hotels often contain upscale full-service facilities with a large volume of full
service accommodations, on-site full service restaurant(s), and a variety of on-site
amenities. Boutique hotels are smaller independent non-branded hotels that often
contain upscale facilities. Small to medium-sized hotel establishments offer a

limited amount of on-site amenities. Economy hotels are small to medium-sized
hotel establishments that offer basic accommodations with little to no services.
Extended stay hotels are small to medium-sized hotels that offer longer term full
service accommodations compared to a traditional hotel.
Timeshare and Destination clubs are a form of property ownership involving
ownership of an individual unit of accommodation for seasonal usage. A motel is a
small-sized low-rise lodging with direct access to individual rooms from the car
park. Boutique hotels are typically hotels with a unique environment or intimate
setting. A number of hotels have entered the public consciousness through popular
culture, such as the Ritz Hotel in London. Some hotels are built specifically as a
destination in itself, for example at casinos and holiday resorts.
Most hotel establishments consist of a General Manager who serves as the head executive (often referred to as the "Hotel Manager"), department heads who oversee various departments within a hotel, middle managers, administrative staff, and line-level supervisors. The organizational chart and volume of job positions and hierarchy varies by hotel size, function, and is often determined by hotel ownership and managing companies...

2.2 COMPANY PROFILE
In this modern world we are coming forward with a world class styled and furnished hotel with all facilities to cater your needs and make your "Guruvayur Darshan" a remarkable one. Our Aim is to provide world class amenities and facilities in much cheaper and affordable way.
Ambadi Regency was inaugurated by Mr K V Abdul Kader, MLA of Guruvayur on 16th December 2011 (the holy month of "Vrishchika”) and it is located very near to Guruvayur Temple.
All the rooms were well furnished with high quality materials and amenities inorder to provide u a comfortable stay which would be remembered for years. Our slogan is "The god's Own Cradle" because we are only 3 minutes walkable distance away from bhagwan and you can stay with a divine touch
Ambadi Regency is a new generation hotel located in Guruvayur to provide you a quality accommodation with an affordable price to make your pilgrimage a remarkable one.

Contact Info
Address: North Inner Ring Road, Guruvayur Mobile: +91-9809-800-800 E-mail: [email protected] Address: www.ambadiregency.com
Standard PackageINR 900
Non A/c 2 Bed Extra Person: INR 150 *Govt Tax Applicable Checkout Time 2.00PM
Economy PackageINR 1100
Non A/c 3 Bed Extra person: INR 150 *Govt Tax Applicable Checkout Time 2.00PM

Excel PackageINR 1500
A/c 2 Bed Extra person: INR 250 *Govt Tax Applicable Checkout Time 2.00PM
Luxor PackageINR 1700
A/c 3 Bed Extra person: INR 250 *Govt Tax Applicable Checkout Time 2.00PM
Travel Desk
Guruvayoor today has become a major tourist spot. It has all the facilities for tourists to visit and stay and is well linked by road and rail. Other than these the place has much to offer.
CHAPTER 3
REVIEW OF LITERATURE

2.3 CUSTOMER PREFERENCE
In microeconomics, the theory of consumer choice relates preferences (for the consumption of both goods and services) to consumption expenditures; ultimately, this relationship between preferences and consumption expenditures is used to relate preferences to consumer demand curves. The link between personal preferences, consumption, and the demand curve is one of the most closely studied relations in economics. Consumer choice theory is a way of analyzing how consumers may achieve equilibrium between preferences and expenditures by maximizing utility as subject to consumer budget constraints.
Preferences are the desires by each individual for the consumption of goods and services that translate into choices based on income or wealth for purchases of goods and services to be combined with the consumer's time to define consumption activities. Consumption is separated from production, logically, because two different consumers are involved. In the first case consumption is by the primary individual; in the second case, a producer might make something that he would not consume himself. Therefore, different motivations and abilities are involved. The models that make up consumer theory are used to represent prospectively observable demand patterns for an individual buyer on the hypothesis of constrained optimization. Prominent variables used to explain the rate at which the good is purchased (demanded) are the price per unit of that good, prices of related goods, and wealth of the consumer.
The fundamental theorem of demand states that the rate of consumption falls as the price of the good rises; this is called the substitution effect. Clearly, if one does not have enough money to pay the price, then they cannot buy any of that item. As prices rise, consumers will substitute away from higher priced goods and services, choosing less costly alternatives. Subsequently, as the wealth of the individual rises, demand increases, shifting the demand curve higher at all rates of consumption; this is called the income effect. As wealth rises, consumers will substitute away from less costly inferior goods and services, choosing higher priced alternatives.
Contents
1 Model setup 2 Effect of a price change

3 Income effect 4 Price effect as sum of substitution and income effects 5 Assumptions ,5.1 Use Value 6 Labor-leisure tradeoff 7 See also 8 References
Model setup
Further information: Indifference curve and Budget constraint
Economists' modern solution to the problem of mapping consumer choices is analysis. For an individual, indifference curves and an assumption of constant prices and a fixed income in a two-good world will give the following diagram. The consumer can choose any point on or below the budget constraint line BC. This line is diagonal since it comes from the equation . In other words, the amount spent on both goods together is less than or equal to the income of the consumer. The consumer will choose the indifference curve with the highest utility that is within his budget constraint. Every point on I3 is outside his budget constraint so the best that he can do is the single point on I2 that is tangent to his budget constraint. He will purchase X* of good X and Y* of good Y.
Indifference curve analysis begins with the utility function. The utility function is treated as an index of utility.[1] All that is necessary is that the utility index change as more preferred bundles are consumed. Indifference curves are typically numbered with the number increasing as more preferred bundles are consumed.

However, it is not necessary that numbers be used - any indexing system would suffice - colors for example. The advantage of numbers is that their use makes the math simpler. Numbers used to index indifference curves have no cardinal significance. For example if three indifference curves are labeled 1, 4, and 16 respectively that means nothing more than the bundles "on" indifference curve 4 are more preferred than the bundles "on" indifference curve I. The fact that the index number is a multiple of another is of no significance. For example, the bundles of good on 4 does not mean that they are four times more satisfying than those on 1. As noted they merely mean they are more satisfying.
Income effect and price effect deal with how the change in price of a commodity changes the consumption of the good. The theory of consumer choice examines the trade-offs and decisions people make in their role as consumers as prices and their income changes.
Effect of a price change
These curves can be used to predict the effect of changes to the budget constraint. The graphic below shows the effect of a price increase for good Y. If the price of Y increases, the budget constraint will pivot from BC2 to BC1. Notice that because the price of X does not change, the consumer can still buy the same amount of X if he or she chooses to buy only good X. On the other hand, if the consumer chooses to buy only good Y, he or she will be able to buy less of good Y because its price has increased.
To maximize the utility with the reduced budget constraint, BC1, the consumer will re-allocate consumption to reach the highest available indifference curve which BC1 is tangent to. As shown on the diagram below, that curve is I1, and therefore the amount of good Y bought will shift from Y2 to Y1, and the amount of good X bought to shift from X2 to X1. The opposite effect will occur if the price of Y decreases causing the shift from BC2 to BC3, and I2 to I3.

If these curves are plotted for many different prices of good Y, a demand curve for good Y can be constructed. The diagram below shows the demand curve for good Y as its price varies. Alternatively, if the price for good Y is fixed and the price for good X is varied, a demand curve for good X can be constructed.

Income effect
Main article: Income effect
Another important item that can change is the money income of the consumer. The income effect is the phenomenon observed through changes in purchasing power. It reveals the change in quantity demanded brought by a change in real income. Graphically, as long as the prices remain constant, changing income will create a parallel shift of the budget constraint. Increasing the income will shift the budget constraint right since more of both can be bought, and decreasing income will shift it left.

Depending on the indifference curves, as income increases, the amount purchased of a good can either increase, decrease or stay the same. In the diagram below, good Y is a normal good since the amount purchased increased as the budget constraint shifted from BC1 to the higher income BC2. Good X is an inferior good since the amount bought decreased as the income increases.
is the change in the demand for good 1 when we change income from to ,
holding the price of good 1 fixed at :
Price effect as sum of substitution and income effects

Further information: Slutsky equation and Hicksian demand
Every price change can be decomposed into an income effect and a substitution effect; the price effect is the sum of substitution and income effects.
The substitution effect is a price change that alters the slope of the budget constraint but leaves the consumer on the same indifference curve. In other words, it illustrates the consumer's new consumption basket after the price change while being compensated as to allow the consumer to be as happy as he or she was previously. By this effect, the consumer is posited to substitute toward the good that becomes comparatively less expensive. In the illustration below this corresponds to an imaginary budget constraint denoted SC being tangent to the indifference curve I1. Then the income effect from the rise in purchasing power from a price fall reinforces the substitution effect. If the good is an inferior good, then the income effect will offset in some degree the substitution effect. If the income effect for an inferior good is sufficiently strong, the consumer will buy less of the good when it becomes less expensive, a Giffen good (commonly believed to be a rarity).
In the figure, the substitution effect, , is the change in the amount demanded
for when the price of good falls from to (increasing purchasing power for ) and, at the same time, the money income falls from to to keep the consumer at the same level of utility on :

The substitution effect increases the amount demanded of good from to . In the example, the income effect of the price fall in partly offsets the substitution effect as the amount demanded of goes from to . Thus, the price effect is the algebraic sum of the substitution effect and the income effect.
Assumptions
The behavioral assumption of the consumer theory proposed herein is that all consumers seek to maximize utility. In the mainstream economics tradition, this activity of maximizing utility has been deemed as the "rational" behavior of decision makers. More specifically, in the eyes of economists, all consumers seek to maximize a utility function subject to a budgetary constraint.[2] In other words, economists assume that consumers will always choose the "best" bundle of goods they can afford.[3] Consumer theory is therefore based around the problem of generate refutable hypotheses about the nature of consumer demand from this behavioral postulate.[2] In order to reason from the central postulate towards a useful model of consumer choice, it is necessary to make additional assumptions about the certain preferences that consumers employ when selecting their preferred "bundle" of goods. These are relatively strict, allowing for the model to generate more useful hypotheses with regard to consumer behavior than weaker assumptions, which would allow any empirical data to be explained in terms of stupidity, ignorance, or some other factor, and hence would not be able to generate any predictions about future demand at all.[2] For the most part, however, they represent statements which would only be contradicted if a consumer was acting in (what was widely regarded as) a strange manner.[4] In this vein, the modern form of consumer choice theory assumes:
Preferences are completeConsumer choice theory is based on the assumption that the consumer fully understands his or her own preferences, allowing for a simple but accurate comparison between any two bundles of good presented.[3] That is to say, it is assumed that if a consumer is presented with two consumption bundles A and B each containing different combinations of n goods, the consumer can unambiguously decide if (s)he prefers A to B, B to A, or is indifferent to both.[2][3] The few scenarios where it is possible to imagine that decision-making would be very difficult are thus placed "outside the domain of economic analysis".[3] However, discoveries in behavioral economics has found that decision making is affected by whether choices are presented together or separately through the distinction bias.
Preferences are reflexive

Means that if A and B are in all respect identical the consumer will consider a to be at least as good as (is weakly preferred) to B.[3] Alternatively, the axiom can be modified to read that the consumer is indifferent with regard to A and B.[5]
Preference are transitiveIf A is preferred to B and B is preferred to C then A must be preferred to C.This also means that if the consumer is indifferent between A and B and is indifferent between B and C she will be indifferent between A and C.This is the consistency assumption. This assumption eliminates the possibility of intersecting indifference curves.
Preferences exhibit non-satiationThis is the "more is always better" assumption; that in general if a consumer is offered two almost identical bundles A and B, but where B includes more of one particular good, the consumer will choose B.[6]
Among other things this assumption precludes circular indifference curves. Non-satiation in this sense is not a necessary but a convenient assumption. It avoids unnecessary complications in the mathematical models.
Indifference Curves exhibit diminishing marginal rates of substitutionThis assumption assures that indifference curves are smooth and convex to the origin.This assumption is implicit in the last assumption.This assumption also set the stage for using techniques of constrained optimization. Because the shape of the curve assures that the first derivative is negative and the second is positive.The MRS tells how much y a person is willing to sacrifice to get one more unit of x.This assumption incorporates the theory of diminishing marginal utility.The primary reason to have these technical preferences is to replicate the properties of the real number system so the math will work.
Goods are available in all quantitiesIt is assumed that a consumer may choose to purchase any quantity of a good (s)he desires, for example, 2.6 eggs and 4.23 loaves of bread. Whilst this makes the model less precise, it is generally acknowledged to provide a useful simplification to the calculations involved in consumer choice theory, especially since consumer demand is often examined over a considerable period of time. The more spending rounds are offered, the better approximation the continuous, differentiable function is for its discrete counterpart. (Whilst the purchase of 2.6 eggs sounds impossible, an average consumption of 2.6 eggs per day over a month does not.)[6]

Note the assumptions do not guarantee that the demand curve will be negatively sloped. A positively sloped curve is not inconsistent with the assumptions.[7]
Use Value
In Marx's critique of political economy, any labor-product has a value and a use value, and if it is traded as a commodity in markets, it additionally has an exchange value, most often expressed as a money-price.[8] Marx acknowledges that commodities being traded also have a general utility, implied by the fact that people want them, but he argues that this by itself tells us nothing about the specific character of the economy in which they are produced and sold.

CHAPTER 4
DATA ANALYSIS AND INTERPRETATION

3.1 DATA ANALYSIS AND INTERPRETATION
The purpose of the data analysis and interpretation phase is to transform the data collected into credible evidence about the development of the intervention and its performance. It may be helpful to use several of the following five evaluation of criteria as the basis for analyzing and organizing data.
1. Relevance2. Effectiveness3. Efficiency4. Result5. Sustainability
Analysis of the data is a process of inspecting cleaning transforming and modeling data with the goal of discovering useful information suggesting conclusions and supporting decision making. Data analysis has multiple facets and approaches encompassing diverse techniques under a variety of names in different business, science and social science domains.

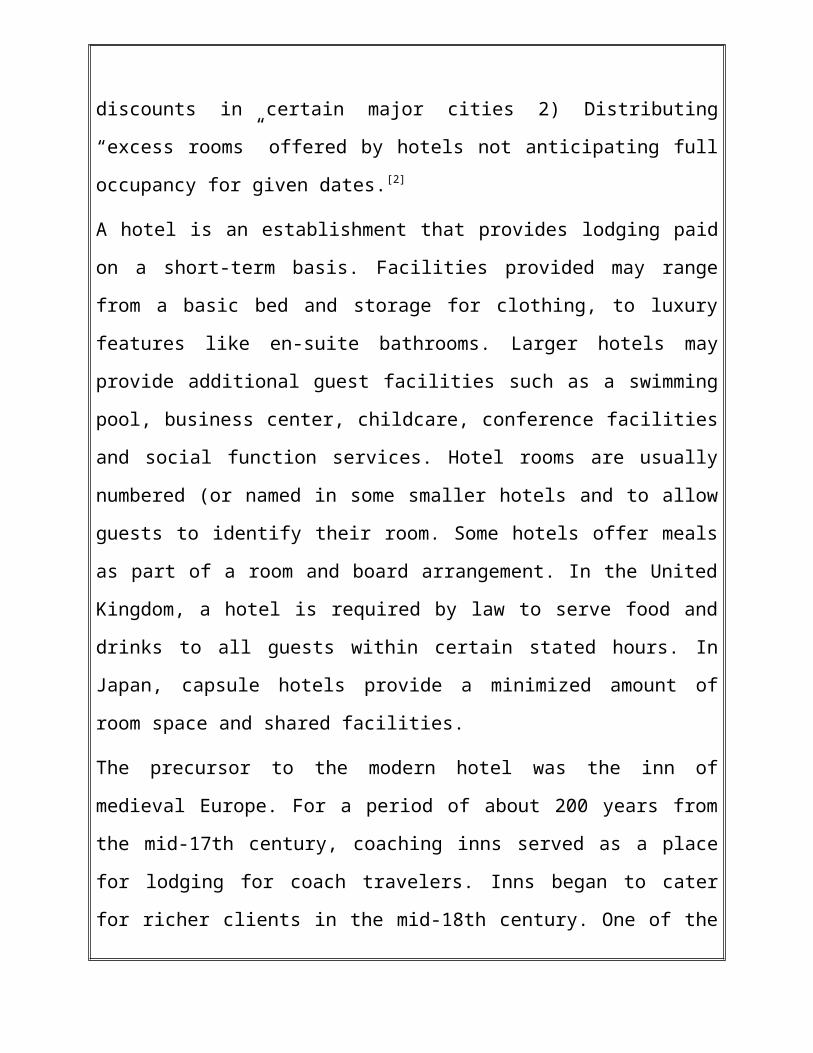
TABLE 1
AGE
PARTICULERS NO OF PARTICIPANTS PERCENTAGE
BELOW 20 14 4.66
20 >30 20 6.66
30 > 50 118 39.33
50 > 70 105 35
70 ABOVE 43 15
TOTAL 300 100
CHART-1
BELOW 20 20 >30 30 > 50 50 > 70 70 ABOVE
NO OF PARTICI-PANTS
14 20 118 105 43
PERCENTAGE 4.66 6.66 39.33 35 15
10
30
50
70
90
110
AGE

INTERPRETATIONAround 40% of the respondents are Age between 30 >50 are to take lodgings stay.

TABLE 2
ROOMS PREFERED
PARTICULERS NO OF PARTICIPANTS PERCENTAGE
A/C 100 33.33
NON A/C 70 23.33
DELUX 65 21.66
SUIT 65 21.66
TOTAL 300 100
CHART 2
33%
23%
22%
22%
ROOMS YOU PREFERD
A/CNON A/CDELUXSUIT

INTERPRETATIONThe analysis on the basis of rooms preferred show that the respondents who belongs to the a/c rooms taken by 33%, non a/c 23% ,deluxe 22% , and suit 22%.

TABLE.3 PREFER TRAVELING FACILITY
PARTICULERS NO OF PARTICIPANTS PERCENTAGE
YES 120 40
NO 180 60
TOTAL 300 100
CHART.3
40%
60%
TRAVELING FACILITYYES NO
INTERPRITATION
Mainly 60% respondents may chose travelling facility to lodge and to temple visit. And other 40% are not prefer travelling facility.

TABLE.4
VIP CUSTOMER SERVICE
PARTICULERS NO OF PARTICIPANTS PERCENTAGE
YES 180 60
NOT INTRESTED 120 40
TOTAL 300 100
CHART.4
60%
40%
VIP CUSTOMER SERVICE
YESNO
INTERPRITATION
60%% respondents are extremely take VIP customer service preferred , 40% respondents are not at all preferred of the VIP customer service

TABLE.5
PACKAGE YOU PREFERE
PARTICULERS NO OF PARTICIPANTS PERCENTAGE
ATHIRAPPILLI & VAZHACHAL ( `8000/FAMILY)
80 26.66
ANAKOTTA & CHETTUVA BOATING(`4000/FAMILY)
20 6.66
TEMPLE PACKAGE (`5000) 150 50
ALL (`15000) 50 16.66
TOTAL 300 100

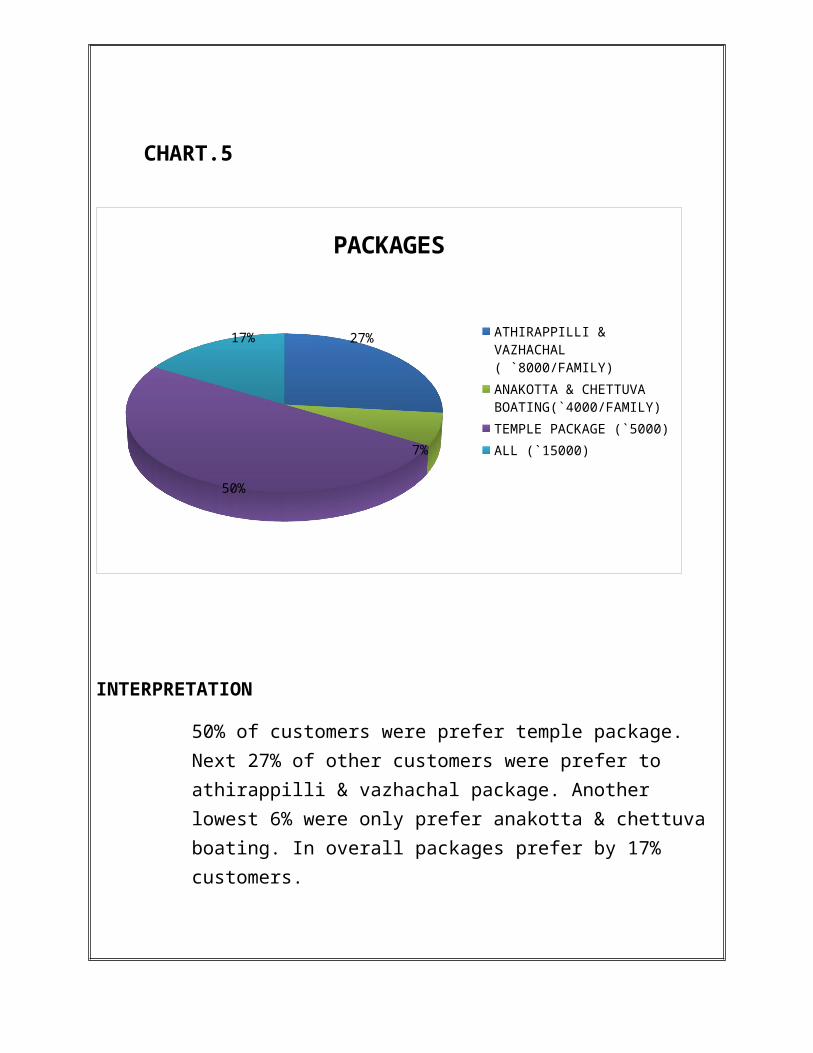
CHART.5
27%
7%
50%
17%
PACKAGES
ATHIRAPPILLI & VAZHACHAL ( `8000/FAMILY)ANAKOTTA & CHETTUVA BOAT-ING(`4000/FAMILY)TEMPLE PACKAGE (`5000)ALL (`15000)
INTERPRETATION
50% of customers were prefer temple package. Next 27% of other customers were prefer to athirappilli & vazhachal package. Another lowest 6% were only prefer anakotta & chettuva boating. In overall packages prefer by 17% customers.

TABLE.6
RESTUARENT SERVICE
PARTICULERS NO OF PARTICIPANTS PERCENTAGE
YES 200 66.66
NO 100 33.33
TOTAL 300 100
CHART.6
67%
33%
RESTUARENT SEVICE
YESNO

INTERPRITATION
Mostly of the 67% customers are need restaurant service. Other 33% are ignore this preference.

TABLE.7
PICKUP & DROP SERVICE
PARTICULERS NO OF PARTICIPANTS PERCENTAGE
YES 75 25
NO 225 75
TOTAL 300 100
CHART.7
25%
75%
PICK UP AND DROP
YESNO

INTERPRITATION
Out of the total 75% customers prefer pickup and drop service. Other 25% are no need of pickup & drop service.
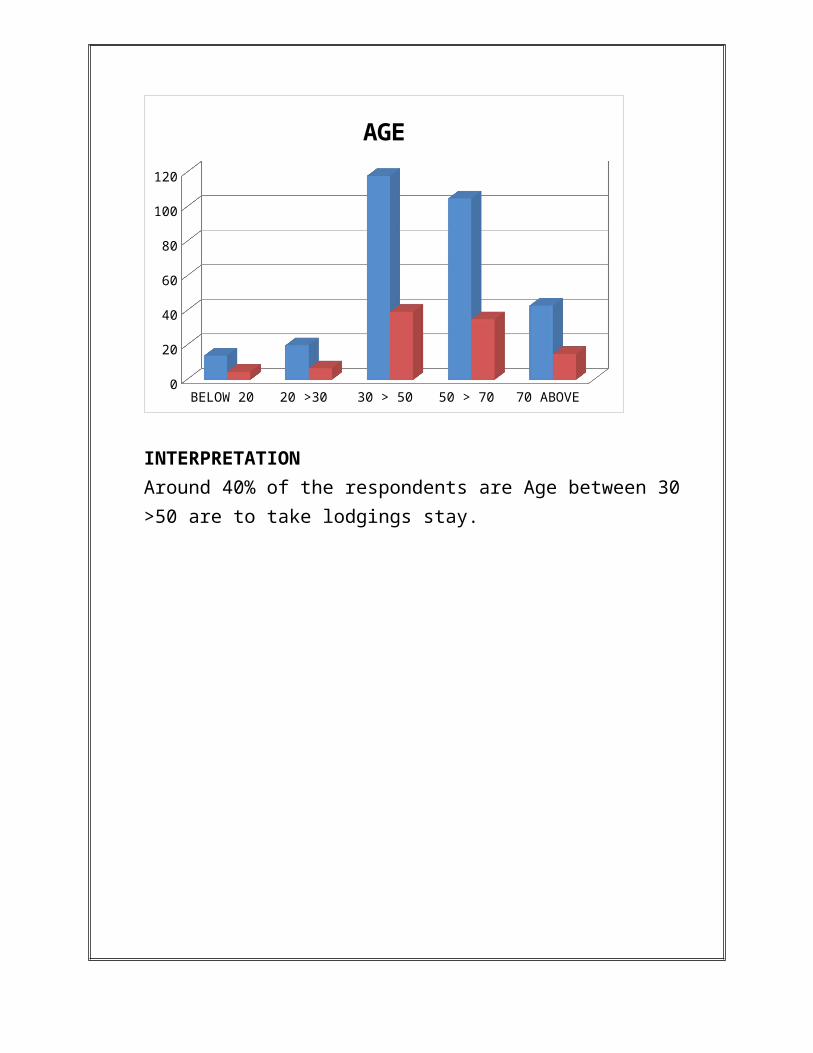
TABLE.8
STAY WITH US
PARTICULERS NO OF PARTICIPANTS PERCENTAGE
ONE DAY 150 50
TWO OR MORE DAYS 125 41.66
ONE WEAK 25 8.33
TOTAL 300 100
CHART.8
50%
42%
8%
STAY WITH US
ONE DAYTWO OR MORE DAYSONE WEAK

INTERPRITATION
Most of the 50% customers are prefer one day stay in ambadi regency. 42% of others are prefer 2 or more day stay. Next 8% are prefer 1 weak stay with ambadi regency.
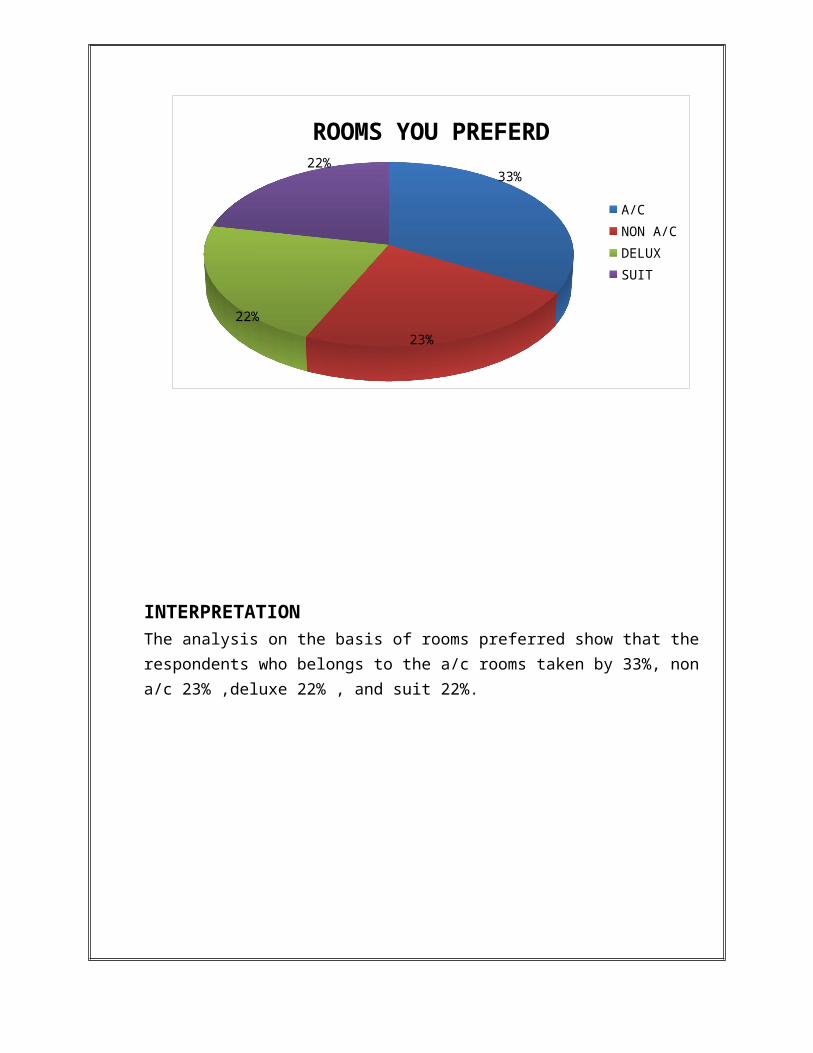
TABLE.9
OFTEN DO YOU VISIT TO THE TEMPLE
PARTICULERS NO OF PARTICIPANTS PERCENTAGE
WEEKLY 175 58.33
MONTHLY 120 40
YEARLY 5 1.66
TOTAL 300 100
-CHART.9
58%
40%
2%
VISITING TEMPLE
WEEKLYMONTHLYYEARLY
INTERPRETATION

Out of the total 58% customers were visit temple weekly. Another 40% were yearly. Next 2% were only visit temple yearly.
TABLE.10

WIFI AND INTERNET ACCESS
PARTICULERS NO OF PARTICIPANTS PERCENTAGE
YES 250 83.33
NO 50 16.66
TOTAL 300 100
CHART.10
83%
17%
WIFI AND INTERNET ACCESS
YESNO
INTERPRETATION
Out of the total 83% customers are prefer wifi and internet access.next 17% are say no.

CHAPTER 5
FINDGINS, SUGGESTIONS AND CONCLUSION
5.1 FINDINGS
1. Out of the respondents 40% is male and 60% is female.2. Most of respondents belongs the age of between 30 and 403. 45% understanding the customers need very much and 37% are
extremely understanding the customer’s needs.4. Out of the total 50%, the salesperson respectful to the customers.5. 53% of respondents are of opinion that the store is extremely clean.6. Customer service and more products are the main reason out of 70%
respondents.7. Out of the total 51% and 45% respondents are satisfied with the
Monday market.8. 40% of respondents are shop at the store almost everyday.9. Out of the total 95% of respondents are satisfied with their product.10.Out of the total 45% of respondents are of opinion that the product
rate is extremely reasonable.
5.2 SUGGESTIONS
Customers Need improvement In Services.
Parking Area Need More Space.
Rooms Width Is Small.
Give More Compliments In Rooms.
5.3 CONCLUSION
I have done the project in AMBADI REGENCY GURUVAYOOR. The topic on which the project done was “Customer preference in ambadi regency guruvayoor”
Through the project I could understand the customer preference in ambadi regency Customers are the building block of a firm. The customer preference must be considered in terms of the degree of fit between that firm and customers.
Ambadi regency the firm taken for study has a great percentage of customer preference among customers but can various measures in advance. So that they can maintain and improve the customer preference level of their customers.

5.1 BIBILIOGRAPHY
Reference
a. Marketing Management – Philip Kotler
b. Marketing Research – D.D.Sharma
Websites
c. Www.Ambadiregency.Com/.In
d. Www.Wikipedia.Com
e. Www.Customerpreferencedetail.Blog
5.2 ANNEXURE

QUESTIONNAIRE
1. Age?
Below 20
20 > 30
30 > 50
50 > 70
70 Above
2. What Type of Lodging Do You Normally preferred?
A/C
Non A/C
Deluxe
Suit
3. Do You Prefer Travelling Facilities?
Yes
No
4. Would You Preferred VIP Customer Service Also In Temple?
Yes
No

5. Which Type Package Do You Preferred?
Athirapilli & Vazhachal (Rs.8000 /Family)
Anakotta & Chettuva Boating (4000/ Family)
Temple Package (5000)
All.(15000)
6. Do You Prefer Restaurant Service And Facilities?
Yes
No
7. Do You Preferred Pick Up And Drop Service?
Yes
No
8. How Likely Would You Be To Stay With Us?
One Day
Two Or More Day
One Week
9. How Often Do You Visit To The Temple?
Weekly
Monthly
Yearly
10.Would You like Wifi _Internet Access for Your Room?
Yes
No