Orientation S AN D IEGO Y OUNG M ARINES Parent/Recruit Orientation February 9, 2013.
Upload
doannguyetCategory
view
214download
1
J U L Y 2 0 0 5
S A N D I E G O R E G I O N P U B L I C O P I N I O N S U R V E Y
FINAL REPORT
C O N D U C T E D F O R
741 GARDEN VIEW COURT SUITE 208ENCINITAS, CALIFORNIA 92024
PHONE 760.632.9900 FAX 760.632.9993WEB WWW.TN-RESEARCH.COM

THIS PAGE INTENTIONALLY LEFT BLANK

BOARD OF DIRECTORS
The 18 cities and county government are SANDAG serving as the forum for regional decision-making. SANDAG builds consensus, makes strategic plans, obtains and allocates resources,
plans, engineers and builds public transportation, and provides information on a broad range of topics pertinent to the region’s quality of life.
CHAIR: Hon. Mickey Cafagna FIRST VICE CHAIR: Hon. Mary Teresa Sessom
SECOND VICE CHAIR: Hon. Jack Dale EXECUTIVE DIRECTOR: Gary L. Gallegos
CITY OF CARLSBAD Hon. Matt Hall, Mayor Pro Tem (A) Hon. Bud Lewis, Mayor (A) Hon. Ann Kulchin, Councilmember CITY OF CHULA VISTA Hon. Steve Padilla, Mayor (A) Hon. Patty Davis, Deputy Mayor (A) Hon. Jerry Rindone, Councilmember CITY OF CORONADO Hon. Phil Monroe, Councilmember (A) Hon. Frank Tierney, Councilmember (A) Hon. Carrie Downey, Councilmember CITY OF DEL MAR Hon. Crystal Crawford, Deputy Mayor (A) Hon. David Druker, Councilmember (A) Hon. Henry Abarbanel, Councilmember CITY OF EL CAJON Hon. Mark Lewis, Mayor (A) Hon. Jillian Hanson-Cox, Councilmember CITY OF ENCINITAS Hon. Christy Guerin, Deputy Mayor (A) Hon. Jerome Stocks, Councilmember CITY OF ESCONDIDO Hon. Lori Holt Pfeiler, Mayor (A) Hon. Ed Gallo, Mayor Pro Tem (A) Hon. Ron Newman, Councilmember CITY OF IMPERIAL BEACH Hon. Patricia McCoy, Councilmember (A) Hon. Diane Rose, Mayor (A) Hon. Mayda Winter, Councilmember CITY OF LA MESA Hon. Art Madrid, Mayor (A) Hon. Barry Jantz, Vice Mayor (A) Hon. David Allan, Councilmember CITY OF LEMON GROVE Hon. Mary Teresa Sessom, Mayor (A) Vacant (A) Hon. Jerry Jones, Councilmember CITY OF NATIONAL CITY Hon. Ron Morrison, Vice Mayor (A) Hon. Frank Parra, Councilmember (A) Hon. Louie Natividad, Councilmember CITY OF OCEANSIDE Hon. Jim Wood, Mayor (A) Hon. Esther Sanchez, Deputy Mayor CITY OF POWAY Hon. Mickey Cafagna, Mayor (A) Hon. Don Higginson, Councilmember (A) Hon. Robert Emery, Deputy Mayor CITY OF SAN DIEGO Hon. Jim Madaffer, Councilmember Hon. Scott Peters, Councilmember (A) Vacant
CITY OF SAN MARCOS Hon. Pia Harris-Ebert, Vice Mayor (A) Hon. Hal Martin, Councilmember (A) Hon. Corky Smith, Mayor CITY OF SANTEE Hon. Jack Dale, Councilmember (A) Hon. Hal Ryan, Councilmember (A) Hon. Randy Voepel, Mayor CITY OF SOLANA BEACH Hon Joe Kellejian, Councilmember (A) Hon. David Powell, Deputy Mayor (A) Hon. Lesa Heebner, Councilmember CITY OF VISTA Hon. Morris Vance, Mayor (A) Hon. Judy Ritter, Councilmember (A) Hon. Bob Campbell, Mayor Pro Tem COUNTY OF SAN DIEGO Hon. Pam Slater-Price, Chairwoman (A) Hon. Dianne Jacob, Supervisor IMPERIAL COUNTY (Advisory Member) Hon. Victor Carrillo, Supervisor (A) Hon. David Ouzan, Mayor CALIFORNIA DEPARTMENT OF TRANSPORTATION (Advisory Member) Will Kempton, Director (A) Pedro Orso-Delgado, District 11 Director METROPOLITAN TRANSIT SYSTEM (Advisory Member) Leon Williams, Chairman (A) Hon. Jerry Rindone, Vice Chairman (A) Hon. Bob Emery, Board Member NORTH SAN DIEGO COUNTY TRANSIT DEVELOPMENT BOARD (Advisory Member) Hon. Jerome Stocks, Councilmember (A) Hon. Judy Ritter, Councilmember (A) Hon. Ed Gallo, Mayor Pro Tem U.S. DEPARTMENT OF DEFENSE (Advisory Member) CAPT Daniel King, USN, CEC Commander, Southwest Division Naval Facilities Engineering Command (A) CAPT Richard Gamble, USN, CEC SAN DIEGO UNIFIED PORT DISTRICT (Advisory Member) William Hall, Commissioner (A) Michael Bixler, Commissioner SAN DIEGO COUNTY WATER AUTHORITY (Advisory Member) Marilyn Dailey, Commissioner (A) Mark Muir, Commissioner MEXICO (Advisory Member) Hon. Luis Cabrera C. Consulate General of Mexico As of July 18, 2005

Table of Contents
iSANDAG True North Research, Inc. © 2005. . . . . . . . . . . . . . . .
T A B L E O F C O N T E N T S
Table of Contents. . . . . . . . . . . . . . . . . . . . . . . . . . . . . . . . . . . . . . . . . . . . . . . . . . . . . . . . . . . . . . . . . . iList of Tables . . . . . . . . . . . . . . . . . . . . . . . . . . . . . . . . . . . . . . . . . . . . . . . . . . . . . . . . . . . . . . . . . . . . iiiList of Figures . . . . . . . . . . . . . . . . . . . . . . . . . . . . . . . . . . . . . . . . . . . . . . . . . . . . . . . . . . . . . . . . . . . . ivIntroduction. . . . . . . . . . . . . . . . . . . . . . . . . . . . . . . . . . . . . . . . . . . . . . . . . . . . . . . . . . . . . . . . . . . . . . 1
Building on Prior Research . . . . . . . . . . . . . . . . . . . . . . . . . . . . . . . . . . . . . . . . . . . . . . . . . 1Methodology Overview . . . . . . . . . . . . . . . . . . . . . . . . . . . . . . . . . . . . . . . . . . . . . . . . . . . . 2Statistical Significance . . . . . . . . . . . . . . . . . . . . . . . . . . . . . . . . . . . . . . . . . . . . . . . . . . . . 3Organization of Report. . . . . . . . . . . . . . . . . . . . . . . . . . . . . . . . . . . . . . . . . . . . . . . . . . . . 3Acknowledgements . . . . . . . . . . . . . . . . . . . . . . . . . . . . . . . . . . . . . . . . . . . . . . . . . . . . . . 3Disclaimer . . . . . . . . . . . . . . . . . . . . . . . . . . . . . . . . . . . . . . . . . . . . . . . . . . . . . . . . . . . . . 3
Just the Facts . . . . . . . . . . . . . . . . . . . . . . . . . . . . . . . . . . . . . . . . . . . . . . . . . . . . . . . . . . . . . . . . . . . . 4Living in the San Diego Region . . . . . . . . . . . . . . . . . . . . . . . . . . . . . . . . . . . . . . . . . . . . . . 4Awareness . . . . . . . . . . . . . . . . . . . . . . . . . . . . . . . . . . . . . . . . . . . . . . . . . . . . . . . . . . . . . 4Regional Priorities . . . . . . . . . . . . . . . . . . . . . . . . . . . . . . . . . . . . . . . . . . . . . . . . . . . . . . . 5Policy Attitudes . . . . . . . . . . . . . . . . . . . . . . . . . . . . . . . . . . . . . . . . . . . . . . . . . . . . . . . . . 5Traffic Management Strategies . . . . . . . . . . . . . . . . . . . . . . . . . . . . . . . . . . . . . . . . . . . . . . 5Smart Growth vs. Sprawl. . . . . . . . . . . . . . . . . . . . . . . . . . . . . . . . . . . . . . . . . . . . . . . . . . . 6Commute Behavior . . . . . . . . . . . . . . . . . . . . . . . . . . . . . . . . . . . . . . . . . . . . . . . . . . . . . . . 6Carpooling & Bicycling . . . . . . . . . . . . . . . . . . . . . . . . . . . . . . . . . . . . . . . . . . . . . . . . . . . . 6Housing & Commute Choices . . . . . . . . . . . . . . . . . . . . . . . . . . . . . . . . . . . . . . . . . . . . . . . 7Regional Report Card . . . . . . . . . . . . . . . . . . . . . . . . . . . . . . . . . . . . . . . . . . . . . . . . . . . . . 7SIgnificant Changes from 2002 to 2005 . . . . . . . . . . . . . . . . . . . . . . . . . . . . . . . . . . . . . . . 8
Conclusions. . . . . . . . . . . . . . . . . . . . . . . . . . . . . . . . . . . . . . . . . . . . . . . . . . . . . . . . . . . . . . . . . . . . . . 9Living in the San Diego Region . . . . . . . . . . . . . . . . . . . . . . . . . . . . . . . . . . . . . . . . . . . . . . . . . . . . 13
Overall Satisfaction. . . . . . . . . . . . . . . . . . . . . . . . . . . . . . . . . . . . . . . . . . . . . . . . . . . . . . 13Question 1 . . . . . . . . . . . . . . . . . . . . . . . . . . . . . . . . . . . . . . . . . . . . . . . . . . . . . . . . . 13
San Diego’s Future . . . . . . . . . . . . . . . . . . . . . . . . . . . . . . . . . . . . . . . . . . . . . . . . . . . . . . 14Question 2 . . . . . . . . . . . . . . . . . . . . . . . . . . . . . . . . . . . . . . . . . . . . . . . . . . . . . . . . . 15
Aspects of Local Community . . . . . . . . . . . . . . . . . . . . . . . . . . . . . . . . . . . . . . . . . . . . . . 16Question 3 . . . . . . . . . . . . . . . . . . . . . . . . . . . . . . . . . . . . . . . . . . . . . . . . . . . . . . . . . 17
Awareness . . . . . . . . . . . . . . . . . . . . . . . . . . . . . . . . . . . . . . . . . . . . . . . . . . . . . . . . . . . . . . . . . . . . . . 18Awareness of SANDAG . . . . . . . . . . . . . . . . . . . . . . . . . . . . . . . . . . . . . . . . . . . . . . . . . . . 18
Question 4 . . . . . . . . . . . . . . . . . . . . . . . . . . . . . . . . . . . . . . . . . . . . . . . . . . . . . . . . . 18Question 5 . . . . . . . . . . . . . . . . . . . . . . . . . . . . . . . . . . . . . . . . . . . . . . . . . . . . . . . . . 18
Awareness of RideLink . . . . . . . . . . . . . . . . . . . . . . . . . . . . . . . . . . . . . . . . . . . . . . . . . . . 19Awareness of Managed Lanes. . . . . . . . . . . . . . . . . . . . . . . . . . . . . . . . . . . . . . . . . . . . . . 19Opinions of SANDAG, RideLink & Managed Lanes . . . . . . . . . . . . . . . . . . . . . . . . . . . . . . . 20
Question 6 . . . . . . . . . . . . . . . . . . . . . . . . . . . . . . . . . . . . . . . . . . . . . . . . . . . . . . . . . 20Regional Priorities . . . . . . . . . . . . . . . . . . . . . . . . . . . . . . . . . . . . . . . . . . . . . . . . . . . . . . . . . . . . . . . 21
Salient Problems. . . . . . . . . . . . . . . . . . . . . . . . . . . . . . . . . . . . . . . . . . . . . . . . . . . . . . . . 21Question 7 . . . . . . . . . . . . . . . . . . . . . . . . . . . . . . . . . . . . . . . . . . . . . . . . . . . . . . . . . 21Question 8 . . . . . . . . . . . . . . . . . . . . . . . . . . . . . . . . . . . . . . . . . . . . . . . . . . . . . . . . . 22
Satisfaction . . . . . . . . . . . . . . . . . . . . . . . . . . . . . . . . . . . . . . . . . . . . . . . . . . . . . . . . . . . 23Question 9 . . . . . . . . . . . . . . . . . . . . . . . . . . . . . . . . . . . . . . . . . . . . . . . . . . . . . . . . . 23
Priority Rankings . . . . . . . . . . . . . . . . . . . . . . . . . . . . . . . . . . . . . . . . . . . . . . . . . . . . . . . 24Tax Dollar Priorities . . . . . . . . . . . . . . . . . . . . . . . . . . . . . . . . . . . . . . . . . . . . . . . . . . . . . 25
Question 11 . . . . . . . . . . . . . . . . . . . . . . . . . . . . . . . . . . . . . . . . . . . . . . . . . . . . . . . . 26Policy Attitudes . . . . . . . . . . . . . . . . . . . . . . . . . . . . . . . . . . . . . . . . . . . . . . . . . . . . . . . . . . . . . . . . . 27
Question 10 . . . . . . . . . . . . . . . . . . . . . . . . . . . . . . . . . . . . . . . . . . . . . . . . . . . . . . . . 27Traffic Management Strategies . . . . . . . . . . . . . . . . . . . . . . . . . . . . . . . . . . . . . . . . . . . . . . . . . . . . 29
Question 12 . . . . . . . . . . . . . . . . . . . . . . . . . . . . . . . . . . . . . . . . . . . . . . . . . . . . . . . . 29Question 13 . . . . . . . . . . . . . . . . . . . . . . . . . . . . . . . . . . . . . . . . . . . . . . . . . . . . . . . . 29

Table of Contents
iiSANDAG True North Research, Inc. © 2005. . . . . . . . . . . . . . . .
Managed Lanes . . . . . . . . . . . . . . . . . . . . . . . . . . . . . . . . . . . . . . . . . . . . . . . . . . . . . . . . 30Question 14 . . . . . . . . . . . . . . . . . . . . . . . . . . . . . . . . . . . . . . . . . . . . . . . . . . . . . . . . 30Question 15 . . . . . . . . . . . . . . . . . . . . . . . . . . . . . . . . . . . . . . . . . . . . . . . . . . . . . . . . 32
Smart Growth vs. Sprawl. . . . . . . . . . . . . . . . . . . . . . . . . . . . . . . . . . . . . . . . . . . . . . . . . . . . . . . . . . 33Question 16 . . . . . . . . . . . . . . . . . . . . . . . . . . . . . . . . . . . . . . . . . . . . . . . . . . . . . . . . 33
Design Preference by Subgroups . . . . . . . . . . . . . . . . . . . . . . . . . . . . . . . . . . . . . . . . . . . 34Commute Behavior. . . . . . . . . . . . . . . . . . . . . . . . . . . . . . . . . . . . . . . . . . . . . . . . . . . . . . . . . . . . . . . 36
Use of Transit. . . . . . . . . . . . . . . . . . . . . . . . . . . . . . . . . . . . . . . . . . . . . . . . . . . . . . . . . . 36Question 17 . . . . . . . . . . . . . . . . . . . . . . . . . . . . . . . . . . . . . . . . . . . . . . . . . . . . . . . . 36
Commute Status & Mode . . . . . . . . . . . . . . . . . . . . . . . . . . . . . . . . . . . . . . . . . . . . . . . . . 38Question 18 . . . . . . . . . . . . . . . . . . . . . . . . . . . . . . . . . . . . . . . . . . . . . . . . . . . . . . . . 38Question 19 . . . . . . . . . . . . . . . . . . . . . . . . . . . . . . . . . . . . . . . . . . . . . . . . . . . . . . . . 39Question 20 . . . . . . . . . . . . . . . . . . . . . . . . . . . . . . . . . . . . . . . . . . . . . . . . . . . . . . . . 40Question 21 . . . . . . . . . . . . . . . . . . . . . . . . . . . . . . . . . . . . . . . . . . . . . . . . . . . . . . . . 40
Commute Time, Location & Distance . . . . . . . . . . . . . . . . . . . . . . . . . . . . . . . . . . . . . . . . 41Question 22 . . . . . . . . . . . . . . . . . . . . . . . . . . . . . . . . . . . . . . . . . . . . . . . . . . . . . . . . 41Question 23 . . . . . . . . . . . . . . . . . . . . . . . . . . . . . . . . . . . . . . . . . . . . . . . . . . . . . . . . 42Question 24 . . . . . . . . . . . . . . . . . . . . . . . . . . . . . . . . . . . . . . . . . . . . . . . . . . . . . . . . 42Question 25 . . . . . . . . . . . . . . . . . . . . . . . . . . . . . . . . . . . . . . . . . . . . . . . . . . . . . . . . 43
Carpooling & Bicycling . . . . . . . . . . . . . . . . . . . . . . . . . . . . . . . . . . . . . . . . . . . . . . . . . . . . . . . . . . . 46Question 26 . . . . . . . . . . . . . . . . . . . . . . . . . . . . . . . . . . . . . . . . . . . . . . . . . . . . . . . . 46Question 27 . . . . . . . . . . . . . . . . . . . . . . . . . . . . . . . . . . . . . . . . . . . . . . . . . . . . . . . . 47Question 28 . . . . . . . . . . . . . . . . . . . . . . . . . . . . . . . . . . . . . . . . . . . . . . . . . . . . . . . . 48
Housing & Commute Choices . . . . . . . . . . . . . . . . . . . . . . . . . . . . . . . . . . . . . . . . . . . . . . . . . . . . . 49Trade-offs . . . . . . . . . . . . . . . . . . . . . . . . . . . . . . . . . . . . . . . . . . . . . . . . . . . . . . . . . . . . 49
Question 29 . . . . . . . . . . . . . . . . . . . . . . . . . . . . . . . . . . . . . . . . . . . . . . . . . . . . . . . . 49Type of Home. . . . . . . . . . . . . . . . . . . . . . . . . . . . . . . . . . . . . . . . . . . . . . . . . . . . . . . . . . 50
Question 30 . . . . . . . . . . . . . . . . . . . . . . . . . . . . . . . . . . . . . . . . . . . . . . . . . . . . . . . . 50Question 31 . . . . . . . . . . . . . . . . . . . . . . . . . . . . . . . . . . . . . . . . . . . . . . . . . . . . . . . . 51
Factors in Home Selection . . . . . . . . . . . . . . . . . . . . . . . . . . . . . . . . . . . . . . . . . . . . . . . . 51Question 32 . . . . . . . . . . . . . . . . . . . . . . . . . . . . . . . . . . . . . . . . . . . . . . . . . . . . . . . . 52
Moving History . . . . . . . . . . . . . . . . . . . . . . . . . . . . . . . . . . . . . . . . . . . . . . . . . . . . . . . . . 53Question 33 . . . . . . . . . . . . . . . . . . . . . . . . . . . . . . . . . . . . . . . . . . . . . . . . . . . . . . . . 54Question 34 . . . . . . . . . . . . . . . . . . . . . . . . . . . . . . . . . . . . . . . . . . . . . . . . . . . . . . . . 54Question 35 . . . . . . . . . . . . . . . . . . . . . . . . . . . . . . . . . . . . . . . . . . . . . . . . . . . . . . . . 55Question 36 . . . . . . . . . . . . . . . . . . . . . . . . . . . . . . . . . . . . . . . . . . . . . . . . . . . . . . . . 56Question 37 . . . . . . . . . . . . . . . . . . . . . . . . . . . . . . . . . . . . . . . . . . . . . . . . . . . . . . . . 56
Regional Report Card . . . . . . . . . . . . . . . . . . . . . . . . . . . . . . . . . . . . . . . . . . . . . . . . . . . . . . . . . . . . 57Question 37 . . . . . . . . . . . . . . . . . . . . . . . . . . . . . . . . . . . . . . . . . . . . . . . . . . . . . . . . 57
Demographics. . . . . . . . . . . . . . . . . . . . . . . . . . . . . . . . . . . . . . . . . . . . . . . . . . . . . . . . . . . . . . . . . . . 59Methodology . . . . . . . . . . . . . . . . . . . . . . . . . . . . . . . . . . . . . . . . . . . . . . . . . . . . . . . . . . . . . . . . . . . . 60
Questionnaire Development . . . . . . . . . . . . . . . . . . . . . . . . . . . . . . . . . . . . . . . . . . . . . . . 60CATI & Pre-Test . . . . . . . . . . . . . . . . . . . . . . . . . . . . . . . . . . . . . . . . . . . . . . . . . . . . . . . . 60Languages . . . . . . . . . . . . . . . . . . . . . . . . . . . . . . . . . . . . . . . . . . . . . . . . . . . . . . . . . . . . 60Sample . . . . . . . . . . . . . . . . . . . . . . . . . . . . . . . . . . . . . . . . . . . . . . . . . . . . . . . . . . . . . . . 60Oversampling & Weighting . . . . . . . . . . . . . . . . . . . . . . . . . . . . . . . . . . . . . . . . . . . . . . . . 61Margin of Error due to Sampling. . . . . . . . . . . . . . . . . . . . . . . . . . . . . . . . . . . . . . . . . . . . 62Data Collection. . . . . . . . . . . . . . . . . . . . . . . . . . . . . . . . . . . . . . . . . . . . . . . . . . . . . . . . . 63Data Processing . . . . . . . . . . . . . . . . . . . . . . . . . . . . . . . . . . . . . . . . . . . . . . . . . . . . . . . . 63Rounding . . . . . . . . . . . . . . . . . . . . . . . . . . . . . . . . . . . . . . . . . . . . . . . . . . . . . . . . . . . . . 63
English Questionnaire. . . . . . . . . . . . . . . . . . . . . . . . . . . . . . . . . . . . . . . . . . . . . . . . . . . . . . . . . . . . 64Spanish Questionnaire . . . . . . . . . . . . . . . . . . . . . . . . . . . . . . . . . . . . . . . . . . . . . . . . . . . . . . . . . . . 81Crosstabulations . . . . . . . . . . . . . . . . . . . . . . . . . . . . . . . . . . . . . . Appendix A (bound separately)
List of Tables
iii. . . . . . . . . . . . . . . .
SANDAG True North Research, Inc. © 2005
L I S T O F T A B L E S
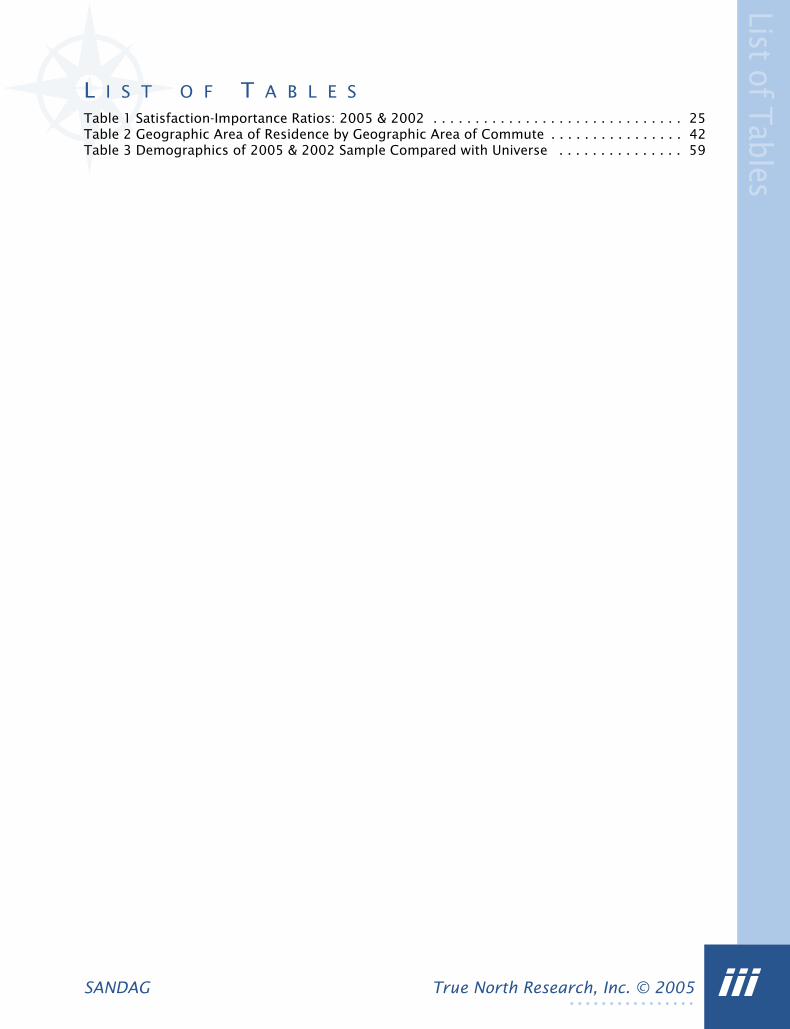
Table 1 Satisfaction-Importance Ratios: 2005 & 2002 . . . . . . . . . . . . . . . . . . . . . . . . . . . . . . 25Table 2 Geographic Area of Residence by Geographic Area of Commute . . . . . . . . . . . . . . . . 42Table 3 Demographics of 2005 & 2002 Sample Compared with Universe . . . . . . . . . . . . . . . 59

List of Figures
iv. . . . . . . . . . . . . . . .
SANDAG True North Research, Inc. © 2005
L I S T O F F I G U R E S
Figure 1 Survey Universe and Planning Areas . . . . . . . . . . . . . . . . . . . . . . . . . . . . . . . . . . . . . 2Figure 2 Overall Satisfaction with San Diego Region: 2005 & 2002 . . . . . . . . . . . . . . . . . . . . 13Figure 3 Overall Satisfaction with San Diego Region: Demographic Breakdown . . . . . . . . . . . 14Figure 4 Perception of San Diego in Future: 2005 & 2002 . . . . . . . . . . . . . . . . . . . . . . . . . . . 15Figure 5 Perception of San Diego in Future by Age . . . . . . . . . . . . . . . . . . . . . . . . . . . . . . . . 16Figure 6 Rating of Local Issues: 2005 & 2002 . . . . . . . . . . . . . . . . . . . . . . . . . . . . . . . . . . . . 17Figure 7 Awareness & Description of SANDAG. . . . . . . . . . . . . . . . . . . . . . . . . . . . . . . . . . . . 18Figure 8 Awareness & Description of RideLink. . . . . . . . . . . . . . . . . . . . . . . . . . . . . . . . . . . . 19Figure 9 Awareness & Description of Managed Lanes . . . . . . . . . . . . . . . . . . . . . . . . . . . . . . 20Figure 10 Opinion of SANDAG, RideLink, Managed Lanes . . . . . . . . . . . . . . . . . . . . . . . . . . . 20Figure 11 Number One Problem in San Diego Region: 2005 & 2002 . . . . . . . . . . . . . . . . . . . 21Figure 12 Importance of Issues: 2005 & 2002. . . . . . . . . . . . . . . . . . . . . . . . . . . . . . . . . . . . 22Figure 13 Satisfaction with Issues: 2005 & 2002 . . . . . . . . . . . . . . . . . . . . . . . . . . . . . . . . . . 23Figure 14 Satisfaction-Importance Matrix . . . . . . . . . . . . . . . . . . . . . . . . . . . . . . . . . . . . . . . 24Figure 15 Priorities for Tax Dollars: 2005 & 2002 . . . . . . . . . . . . . . . . . . . . . . . . . . . . . . . . . 26Figure 16 Agreement with Statements: 2005 & 2002 . . . . . . . . . . . . . . . . . . . . . . . . . . . . . . 27Figure 17 Possible Solution for Relieving Traffic: 2005 & 2002 . . . . . . . . . . . . . . . . . . . . . . . 29Figure 18 Would Occasionally Pay Fee to Use Managed Lanes . . . . . . . . . . . . . . . . . . . . . . . . 30Figure 19 Would Occasionally Pay Fee to Use Managed Lanes by Household Income . . . . . . . 31Figure 20 Effect of Managed Lanes on Joining Carpool/Vanpool . . . . . . . . . . . . . . . . . . . . . . 32Figure 21 Preference for Future Home Building & Neighborhood Design: 2005 & 2002 . . . . . 33Figure 22 Preference for Future Home Building & Neighborhood Design . . . . . . . . . . . . . . . . 34Figure 23 Preference for Future Home Building & Neighborhood Design by Home Type . . . . 35Figure 24 Used Public Transit in Past 12 Months: 2005 & 2002. . . . . . . . . . . . . . . . . . . . . . . 36Figure 25 Used Public Transit in Past 12 Months: Demographic Breakdown. . . . . . . . . . . . . . 37Figure 26 Public Transit Use in Past 12 Months: 2005 & 2002. . . . . . . . . . . . . . . . . . . . . . . . 38Figure 27 Commute on Regular Basis: 2005 & 2002 . . . . . . . . . . . . . . . . . . . . . . . . . . . . . . . 38Figure 28 Primary Form of Transportation for Commute: 2005 & 2002 . . . . . . . . . . . . . . . . . 39Figure 29 Use Other Forms of Transportation for Commute . . . . . . . . . . . . . . . . . . . . . . . . . 40Figure 30 Secondary Forms of Transportation for Commute: 2005 & 2002 . . . . . . . . . . . . . . 40Figure 31 Time of Departure for Commute to Work / School . . . . . . . . . . . . . . . . . . . . . . . . . 41Figure 32 Geographic Area of Commute Destination . . . . . . . . . . . . . . . . . . . . . . . . . . . . . . . 42Figure 33 Distribution of Miles for Commute to Work / School . . . . . . . . . . . . . . . . . . . . . . . 43Figure 34 Distribution of Minutes for Commute to Work / School . . . . . . . . . . . . . . . . . . . . . 43Figure 35 Mean Minutes for Commute to Work / School: 2005 & 2002 . . . . . . . . . . . . . . . . . 44Figure 36 Average Miles & Average Minutes for Commute to Work / School by Area of Region45Figure 37 Primary Reason for Choosing Not to Carpool . . . . . . . . . . . . . . . . . . . . . . . . . . . . . 46Figure 38 Agreement with Statements About Carpooling. . . . . . . . . . . . . . . . . . . . . . . . . . . . 47Figure 39 Agree that Carpooling is Faster Because of Carpool Lanes by Area of Region. . . . . 48Figure 40 Rode Bicycle on Local Streets in Past 12 Months . . . . . . . . . . . . . . . . . . . . . . . . . . 48Figure 41 Trade-offs for Commute of Fewer than 30 Minutes . . . . . . . . . . . . . . . . . . . . . . . . 49Figure 42 Homeownership Status: 2005 & 2002 . . . . . . . . . . . . . . . . . . . . . . . . . . . . . . . . . . 50Figure 43 Home Type: 2005 & 2002 . . . . . . . . . . . . . . . . . . . . . . . . . . . . . . . . . . . . . . . . . . . 51Figure 44 Factors in Choosing Current Home: 2005, 2002 & 2002 I-15/IRP. . . . . . . . . . . . . . 52Figure 45 Factors in Choosing Current Home by Homeownership Status . . . . . . . . . . . . . . . . 53Figure 46 Years in San Diego Region. . . . . . . . . . . . . . . . . . . . . . . . . . . . . . . . . . . . . . . . . . . 54Figure 47 Area Moved From: 2005 & 2002 . . . . . . . . . . . . . . . . . . . . . . . . . . . . . . . . . . . . . . 54Figure 48 Moved from One Area of Region to Another in Past Five Years. . . . . . . . . . . . . . . . 55Figure 49 Reason for Moving Within Region in Past Five Years. . . . . . . . . . . . . . . . . . . . . . . . 56Figure 50 Other Reasons for Moving Within Region in Past Five Years . . . . . . . . . . . . . . . . . . 56Figure 51 Regional Report Card: 2005, 2003 & 2002 . . . . . . . . . . . . . . . . . . . . . . . . . . . . . . 57Figure 52 Survey Universe and Planning Areas . . . . . . . . . . . . . . . . . . . . . . . . . . . . . . . . . . . 61

List of Figures
v. . . . . . . . . . . . . . . .
SANDAG True North Research, Inc. © 2005
Figure 53 Maximum Margin of Error . . . . . . . . . . . . . . . . . . . . . . . . . . . . . . . . . . . . . . . . . . . 63

Introduction
True North Research, Inc. © 2005 1SANDAG. . . . . . . . . . . . . . . .
I N T R O D U C T I O N
SANDAG’s Overall Work Program (OWP) includes an outreach and citizen participation compo-nent, which is designed to both include residents of the San Diego region in the regional plan-ning process and keep SANDAG aware of the issues that matter to people who live in the region.Traditionally, a key element of the outreach and citizen participation component has been a peri-odic survey of adult residents in the region. The survey presents an opportunity for SANDAG tocollect statistically reliable information on a number of different topics, including identifyingissues that are of utmost concern to residents, gauging public opinion and awareness as theyrelate to specific SANDAG programs, policies and planning activities, and exploring public atti-tudes about matters that directly affect the quality of life in the region. By gathering and analyz-ing current opinion data and comparing to the results of prior related surveys, the studyprovides SANDAG with the information it needs to make sound, strategic decisions in a variety ofareas, including establishing regional priorities, program evaluation, planning and public educa-
tion.1
To assist it in this effort, SANDAG selected True North Research to design the research plan andconduct the survey. Broadly defined, the study was designed to:
• Measure opinions about quality of life issues in the region.
• Gauge public awareness of SANDAG and several programs.
• Identify regional issues that the public views as priorities for government attention.
• Profile commute behavior as well as attitudes about possible approaches to relieving traffic congestion.
• Examine the trade-offs residents perceive between their commute and their current housing choice.
• Gather data on policy-related matters.
• Collect additional background and demographic data that is relevant to understanding the perceptions, priorities and concerns of residents.
BUILDING ON PRIOR RESEARCH As noted above, SANDAG previously conducted similarresident surveys as part of the outreach and citizen participation component of the Overall WorkProgram—most recently in 2002. Because there is a natural interest in tracking public opinionover time, many questions that were included in the 2002 survey were incorporated into the cur-rent survey. Throughout this report, the results from the 2002 study are displayed along withresults from the current (2005) study—where appropriate—to provide the reader with a sense forhow opinions and behaviors have changed during the past three years. In several cases, direct
comparisons are also made to other surveys that shared identical questions.2
1. Some of the specific activities that the survey will help inform include monitoring and updated the Regional Transportation Plan and the Regional Comprehensive Plan, gauging public awareness of SANDAG’s TransNet and transportation demand management (TDM) programs, and developing public outreach and education programs.
2. Including the 2003 San Diego Region Transit Public Opinion Survey and a 2002 study that tracked the effec-tiveness of SANDAG’s public outreach efforts.

Introduction
True North Research, Inc. © 2005 2SANDAG. . . . . . . . . . . . . . . .
It should also be noted, however, that several questions that appeared in the 2002 survey wereomitted from the current survey. In some cases, it was determined that the topic was addressedmore thoroughly in another recent study—such as the San Diego Region Transit Public OpinionSurvey conducted by SANDAG in 2003—and thus there was no need to repeat the questions atthis time. In other cases, questions were removed to make room for new questions that betterserve SANDAG’s current information needs.
METHODOLOGY OVERVIEW A full description of the methodology used for this study isincluded later in this report (see “Methodology” on page 60). In brief, a total of 900 adults whoreside in the San Diego region were selected using a random digit dialing (RDD) sampling meth-odology. To accommodate SANDAG’s interest in obtaining reliable parameter estimates for theregion as a whole, as well as within the five planning areas identified in Figure 1, the studyemployed a strategic oversample by planning area to balance the statistical margins of errorassociated with estimates at the planning area level. To adjust for the oversampling, the rawdata were then weighted according to adult population estimates prior to analyses and presenta-tion. The results presented in this report are the weighted results, which are representative atthe regionwide level, as well as within the five planning areas.
FIGURE 1 SURVEY UNIVERSE AND PLANNING AREAS

Introduction
True North Research, Inc. © 2005 3SANDAG. . . . . . . . . . . . . . . .
STATISTICAL SIGNIFICANCE As noted above, many of the figures and tables in thisreport present the results of questions asked in 2005 alongside the results found in previoussurveys for identical questions. In such cases, True North conducted the appropriate tests of sta-tistical significance to identify changes that likely reflect actual changes in public opinion duringthis period—as opposed to being due to chance associated with selecting two samples indepen-dently and at random. Differences between the two studies are identified as statistically signifi-cant if we can be 95% confident that the differences reflect an actual change in public opinionbetween the two studies. Statistically significant differences within response categories over timeare denoted by the † symbol which appears next to the value for the 2005 survey.
ORGANIZATION OF REPORT This report is designed to meet the needs of readers whoprefer a summary of the findings as well as those who are interested in the details of the results.For those who seek an overview of the findings, the sections titled Just the Facts and Conclusionsare for you. They provide a summary of the most important factual findings of the survey in bul-let-point format and a discussion of their implications. For the interested reader, this section isfollowed by a more detailed question-by-question discussion of the results from the survey bytopic area (see Table of Contents), as well as a description of the methodology employed for col-lecting and analyzing the data. And, for the truly ambitious reader, the questionnaires used forthe interviews are contained at the back of this report and a complete set of crosstabulations forthe study results is contained in Appendix A.
ACKNOWLEDGEMENTS True North would like to thank the staff at SANDAG who partici-pated in the design of this study. Their expertise and insight improved the overall quality of theresearch presented here.
DISCLAIMER The statements and conclusions in this report are those of the authors(Dr. Timothy McLarney and Richard Sarles) at True North Research, Inc. and not necessarily thoseof SANDAG. Any errors and omissions are the responsibility of the authors.

Just the Facts
True North Research, Inc. © 2005 4SANDAG. . . . . . . . . . . . . . . .
J U S T T H E F A C T S
The following is an outline of the main factual findings from the survey. For the reader’s conve-nience, we have organized the findings according to the section titles used in the body of thisreport. Thus, if you would like to learn more about a particular finding, simply turn to the appro-priate report section.
LIVING IN THE SAN DIEGO REGION
• Approximately 87% of adults indicated they were satisfied (55% very satisfied, 33% some-what satisfied) with the region as a place to live, 8% indicated they were somewhat dissatis-fied, and 4% were very dissatisfied.
• Eighteen percent (18%) of residents felt San Diego would be a better place to live in the future, 39% thought it would be a worse place to live, and 39% said it would be about the same as it is now.
• When asked to rate aspects of their local community, residents gave the overall quality of life the highest rating, followed by the user-friendliness of walkways and sidewalks, public transportation, traffic conditions on local roads, governmental leadership, and traffic condi-tions on freeways.
AWARENESS
• Nearly half (49%) of respondents had heard of SANDAG. Of those individuals, 10% provided an accurate description of the agency and its role, 9% recognized it is an agency of some sort (political/government/association), 28% mentioned an issue or service (e.g., transporta-tion/freeways or research) that SANDAG is associated with, 17% provided general evaluative comments, and 23% could provide no description.
• Twenty percent (20%) recalled hearing the name RideLink prior to taking the survey. About half (47%) of those residents accurately described RideLink as a carpooling/commuting/pub-lic transit program. The remaining respondents were either not sure what RideLink stands for (29%), made general evaluative comments without demonstrating an understanding of the program (16%), or made general references to transportation (5%) or other comments (3%).
• Twenty-nine percent (29%) of respondents indicated they had heard the term managed lanes prior to taking the survey. Among these respondents, 23% provided an accurate description of managed lanes, and 27% referenced carpooling or a method of reducing traf-fic in general. The remaining respondents indicated they were unsure of what the term meant (10%), made evaluative statements without demonstrating they understood the term (25%), or made other comments that were unrelated or excessively vague (15%).
• Respondents who had heard of SANDAG, RideLink, and/or managed lanes were asked whether their opinion of the each was favorable or unfavorable. The most common response for SANDAG and RideLink was that the respondent had no opinion either way (51% and 61%, respectively). Of those with an opinion, favorable opinions were at least twice as common as unfavorable opinions for both SANDAG and RideLink. Fifty-eight percent (58%) indicated they had a favorable opinion of managed lanes. Just 14% who were familiar with the term indicated they had an unfavorable opinion of it, and 28% had no opinion.

Just the Facts
True North Research, Inc. © 2005 5SANDAG. . . . . . . . . . . . . . . .
REGIONAL PRIORITIES
• When asked to identify the San Diego region’s number one problem, the most common mention was traffic congestion, cited by 26% of all respondents. Other commonly mentioned problems included the availability and cost of housing (13%), government/leadership (13%), cost of living in general (11%), and population growth/overcrowding (10%).
• Given 13 specific regional issues, the most important overall was ensuring an adequate water supply, followed by reducing crime, protecting beaches from pollution, making hous-ing more affordable, reducing traffic congestion, and ensuring reliable energy sources.
• Of the same 13 issues, respondents reported the greatest level of satisfaction with current efforts to encourage recycling, followed by replenish sand on the beaches, protect parks, canyons and other open spaces, reduce crime, improve air quality, and ensure an adequate water supply. Respondents were generally dissatisfied with current efforts to make housing more affordable, reduce traffic congestion, and ensure reliable energy sources.
• Considering residents’ average assigned importance of and satisfaction with each of the 13 regional issues, the best candidates for improvement are making housing more affordable, reducing traffic congestion, and protecting beaches from pollution.
• When presented with a list of 15 possible projects and services to receive tax dollars, resi-dents viewed increasing the use of renewable energy sources, such as solar and wind-gener-ated electricity the highest priority, followed by protecting the environment from pollution, improving freeways in the San Diego region, and improving local streets and roads.
POLICY ATTITUDES
• Ninety-one percent (91%) of residents agreed that, “developers should be required to show that the local and regional water supply is adequate before they can begin construction”, 83% agreed that, “San Diego needs a first class public transit system to meet the region’s increasing travel needs”, and 77% agreed that, “relations between San Diego and Mexico need to be improved”. Only 29% agreed with the statement, “I would be willing to pay higher energy rates if it would prevent blackouts or price swings in the future”.
TRAFFIC MANAGEMENT STRATEGIES
• Flexible work hours was regarded by residents as the most promising traffic management solution proposed, followed by adding lanes to existing freeways, telecommuting, building new freeways, and providing additional public transportation. Allowing solo drivers to pay to use carpool lanes in rush hour was rated as the least effective solution of those tested.
• Nearly half (48%) of respondents anticipated they would pay to use managed lanes, 41% said they would not, and 11% indicated that it would depend or they were unsure.
• Twenty-nine percent (29%) of residents who do not already carpool or vanpool as their primary means of getting to work or school indicated they would be more likely to join a car-pool or vanpool if managed lanes were added to local highways. Nearly two-thirds (66%) said managed lanes would not impact their decision to carpool or vanpool.

Just the Facts
True North Research, Inc. © 2005 6SANDAG. . . . . . . . . . . . . . . .
SMART GROWTH VS. SPRAWL
• Forty-eight percent (48%) of residents sided with the opinion that, “new housing develop-ments should include condos, townhouses, and apartments mixed in with shops and office space, resulting in a more compact design”, compared with 43% who felt that, “most new housing developments should continue to feature single-family homes in areas of the region that are separate from shops and office space, resulting in a more spread-out design”.
COMMUTE BEHAVIOR
• Fifty-three percent (53%) of residents surveyed reported they used transit in the San Diego region in the past 12 months.
• The trolley was the most commonly used form of transit, having been ridden at least once by nearly 40% of residents in the past year. Approximately 24% of residents reported using the bus, and 14% had ridden the Coaster train.
• Forty-five percent (45%) of residents indicated they regularly commute to work, 5% to school, and 40% said they do not commute.
• Seventy-nine percent (79%) of commuters said they drove alone as their primary form of commuting. Carpooling (7%) was the next most common response, followed by the bus (7%), and the trolley (2%). Eighteen percent (18%) of all commuters indicated they used more than one form of transportation for their commute.
• Just under half (47%) of residents begin their commute during the morning peak (6 a.m. to 9 a.m.). A substantial percentage (20%) also begin their commute in the afternoon/early evening hours between noon and 7 p.m.
• Most respondents (53%) provided a destination ZIP code for their commute that fell within the Central planning area of the County, followed by 14% in East County, 13% in North County Inland, 10% in North County Coastal, 7% in South County, and 4% commute out of the region.
• Approximately one-third (31%) of commuters indicated they travel less than 10 miles to work or school, one-third travel between 10 and 19 miles (32%), and the remainder travel more than 20 miles or were unsure.
• When asked how long their commute to work or school typically takes, 19% stated it takes less than 15 minutes, 40% said between 15 minutes and 29 minutes, 20% said between 30 and 44 minutes, and 19% commute 45 minutes or longer on a typical day.
CARPOOLING & BICYCLING
• For those who do not carpool or vanpool and whose commute is greater than 30 minutes, the most commonly mentioned reason for choosing not to carpool was that the respondent had no one to carpool with (38%). A substantial percentage of commuters indicated that the demands of their job or school pose a barrier to carpooling, including the need for travel while on the job (20%), inconsistent hours (10%), and a need for flexibility (4%).
• Among commuters, 75% agreed with the statement, “I would join a carpool if I found some-one whose scheduled matched mine”, although many respondents also qualified this by agreeing with the statement, “I would not feel comfortable carpooling with a stranger” (60%). Over two-thirds (71%) agreed that, “being part of a carpool is too restricting. I need the free-dom and flexibility to go when and where I want”, whereas just 39% agreed that, “If I joined a carpool, I would get to work/school much faster because I could use the carpool lanes”.

Just the Facts
True North Research, Inc. © 2005 7SANDAG. . . . . . . . . . . . . . . .
• Twenty-nine percent (29%) of residents indicated they had ridden a bicycle in the past 12 months.
HOUSING & COMMUTE CHOICES
• Nearly 80% of those who regularly commute over 30 minutes to work or school said they would be willing to telecommute if their employer would allow it, and 54% indicated they would pay to use a toll road. One-quarter (25%) would be willing to move to a home that costs the same as their current home but is 25% smaller, and a similar percentage (24%) would be willing to take a job with a 15% pay cut to reduce their commute to less than 30 minutes.
• Just over half (55%) of respondents indicated they own their home, and 40% said they are renting.
• The most common type of home among respondents was a single-family detached home (65%), followed by an apartment (19%), condominium (11%), and mobile home (4%).
• From a list of potential factors considered in choosing one’s current home, San Diego resi-dents rated affordability as the top factor, followed by safety of the neighborhood, sense of privacy, sense of community and neighbors, overall look and design of the home, and loca-tion relative to their job.
• Most participants (62%) reported they had lived in the San Diego region at least 15 years. For residents who had moved to the region within the past 10 years, nearly half (45%) indicated they moved from another state, and 19% said they moved to the region from another coun-try.
• Nearly half (46%) of respondents who had moved within the San Diego region during the past five years indicated that getting a bigger home was one of the main reasons they chose to move. Approximately one-quarter (24%) said that reducing their commute—and/or the commute of another member of their household—was one of the main reasons for moving. Other reasons mentioned included downsizing or reduced costs/rents, desire to be in a bet-ter location, the opportunity to buy a first home, and changes in their marital or employ-ment status.
REGIONAL REPORT CARD
• Environment of the region, which includes the preservation of open space and natural hab-itat, protection of beaches, and air and water quality: B-.
• Crime in the region, which includes the level of crime, feeling safe in your neighborhood, interactions with law enforcement, as well as crime prevention and intervention efforts: B-.
• Economic health of the region, including the availability of jobs and job skills training pro-grams: C+.
• Transportation system of the region, which includes the freeways, local streets and roads, and the public transit system: C+.
• Housing in the region, which includes the availability and affordability of a variety of hous-ing types: C.

Just the Facts
True North Research, Inc. © 2005 8SANDAG. . . . . . . . . . . . . . . .
SIGNIFICANT CHANGES FROM 2002 TO 2005
• Satisfaction with the San Diego Region: The percentage of very satisfied residents declined significantly over the past three years from 62% to 55%. The percentage of very dis-satisfied residents also increased during this period, from 2% to 4%.
• San Diego in the Future: Whereas 26% of residents in 2002 anticipated that San Diego will be a better place to live in the future, the corresponding figure in 2005 was 18%. Con-versely, the percentage of respondents who expected that the region will be a worse place to live in the future increased significantly from 32% to 39%.
• Aspects of Local Community: Residents perceived a statistically significant decline in the overall quality of life in their community, the user-friendliness of walkways and sidewalks, traffic conditions on local roads, governmental leadership, and traffic conditions on free-ways.
• San Diego Region’s Number One Problem: There was a statistically significant increase in the percentage of residents who mentioned government/leadership, illegal aliens, and pub-lic transportation as the most important problems facing the region. The period also wit-nessed a statistically significant decline in the percentage of residents who view population growth and inadequate infrastructure as the most important regional problems.
• Satisfaction with Issues: Encouraging new businesses to come to San Diego, reducing traf-fic congestion, and making housing more affordable saw statistically significant declines in satisfaction since 2002.
• Possible Solutions to Relieving Traffic: There was a statistically significant decline in the percentage of residents who view telecommuting and allowing solo drivers to pay to use car-pool lanes as effective strategies for relieving congestion during rush hours. They were somewhat more likely to view building new freeways as an effective solution.
• Smart Growth vs. Sprawl: Whereas residents generally favored a spread-out design (sprawl) in 2002, the balance shifted in 2005 such that residents now prefer a more compact design (smart growth).
• Method of Commute: The percentage of respondents who indicated they primarily carpool for their commute decreased significantly from 11% to 7%.
• Home Type: The percentage of respondents who reported living in a single-family detached home increased significantly from 59% to 65%, and the percentage living in an apartment decreased significantly from 25% to 19%.
• Prior Area of Residence: Among residents who had moved to the San Diego region in the past 10 years, the proportion who said they originally moved from another country increased significantly from 8% to 19%, and those who moved from a California county other than Los Angeles, Orange, San Bernardino, or Riverside declined from 27% to 16%.
• Regional Report Card: When compared to the results of the 2002 regionwide survey, resi-dents were slightly more positive in their assessment of the region’s environment, although the average grade remained a B-. Residents were somewhat less positive in their assessment of the region’s economic health, with the average grade dropping from B- to C+.
Conclusions
True North Research, Inc. © 2005 9SANDAG. . . . . . . . . . . . . . . .
C O N C L U S I O N S
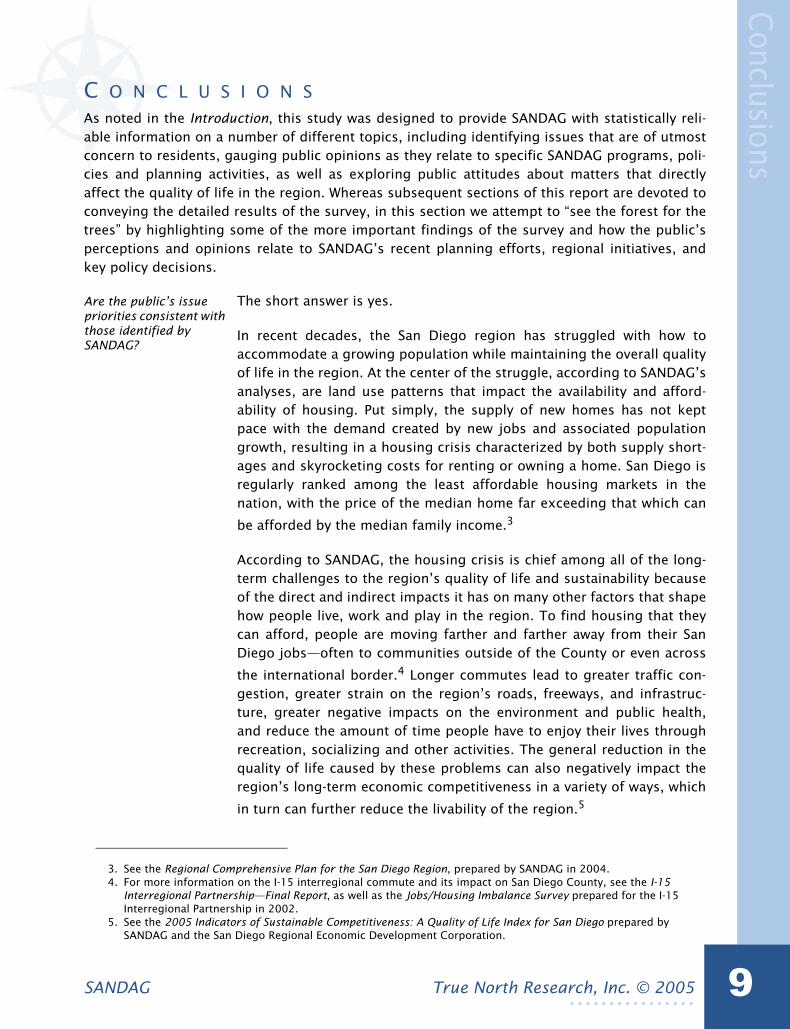
As noted in the Introduction, this study was designed to provide SANDAG with statistically reli-able information on a number of different topics, including identifying issues that are of utmostconcern to residents, gauging public opinions as they relate to specific SANDAG programs, poli-cies and planning activities, as well as exploring public attitudes about matters that directlyaffect the quality of life in the region. Whereas subsequent sections of this report are devoted toconveying the detailed results of the survey, in this section we attempt to “see the forest for thetrees” by highlighting some of the more important findings of the survey and how the public’sperceptions and opinions relate to SANDAG’s recent planning efforts, regional initiatives, andkey policy decisions.
Are the public’s issue priorities consistent with those identified by SANDAG?
The short answer is yes.
In recent decades, the San Diego region has struggled with how toaccommodate a growing population while maintaining the overall qualityof life in the region. At the center of the struggle, according to SANDAG’sanalyses, are land use patterns that impact the availability and afford-ability of housing. Put simply, the supply of new homes has not keptpace with the demand created by new jobs and associated populationgrowth, resulting in a housing crisis characterized by both supply short-ages and skyrocketing costs for renting or owning a home. San Diego isregularly ranked among the least affordable housing markets in thenation, with the price of the median home far exceeding that which can
be afforded by the median family income.3
According to SANDAG, the housing crisis is chief among all of the long-term challenges to the region’s quality of life and sustainability becauseof the direct and indirect impacts it has on many other factors that shapehow people live, work and play in the region. To find housing that theycan afford, people are moving farther and farther away from their SanDiego jobs—often to communities outside of the County or even across
the international border.4 Longer commutes lead to greater traffic con-gestion, greater strain on the region’s roads, freeways, and infrastruc-ture, greater negative impacts on the environment and public health,and reduce the amount of time people have to enjoy their lives throughrecreation, socializing and other activities. The general reduction in thequality of life caused by these problems can also negatively impact theregion’s long-term economic competitiveness in a variety of ways, which
in turn can further reduce the livability of the region.5
3. See the Regional Comprehensive Plan for the San Diego Region, prepared by SANDAG in 2004.4. For more information on the I-15 interregional commute and its impact on San Diego County, see the I-15
Interregional Partnership—Final Report, as well as the Jobs/Housing Imbalance Survey prepared for the I-15 Interregional Partnership in 2002.
5. See the 2005 Indicators of Sustainable Competitiveness: A Quality of Life Index for San Diego prepared by SANDAG and the San Diego Regional Economic Development Corporation.

Conclusions
True North Research, Inc. © 2005 10SANDAG. . . . . . . . . . . . . . . .
The gravity of this system of problems is underscored by the reality thatthe region is continuing to grow—with a net gain of one million residents
expected by the year 2030.6
Among the most encouraging results of the survey is that the public rec-ognizes these problems—and their issue priorities are generally consis-tent with those identified by SANDAG in both the RegionalComprehensive Plan (RCP) and the 2005 Indicators of Sustainable Com-petitiveness. Not only are the issues of housing, transportation, renew-able energy and the environment perceived as the most important issuesfacing the region, they are also viewed as the areas where local govern-ments in the region face the greatest challenges—as well as have thegreatest opportunities for improvement.
Moreover, the public’s assessment of the growing problems with hous-ing and transportation during the past four years, as well as the negativeimpact that these issues can have on the quality of life in the region nowand into the future, closely mirror the trends and implications identifiedin the analysis of objective indicators which comprise the Sustainability
Index.7
The bottom line is that the pubic is aware of the problems that SANDAGhas identified as the key factors that shape the livability of the regionand its future competitiveness in a global economy—and agrees with thepriorities placed on land use, housing, transportation and the environ-ment. This is a necessary step for gaining public acceptance of the inno-vative policies and bold investment strategies that are required toaddress these problems.
Is public opinion gener-ally supportive of the policies and strategies needed to address these problems?
Once again, the short answer is yes.
In the Regional Comprehensive Plan, SANDAG set forth both a vision andan integrated plan for better addressing many of the pressing problemsthat affect the region—including traffic congestion, housing affordabil-ity, protection of sensitive habitats, and economic development—whileensuring equity in planning and development through coordinatedefforts at the local and regional levels. Many elements of the plan, such
as its focus on smart growth8 and its emphasis on improving the connec-tions between land use and transportation, represent a significant breakfrom the way things have been done in the region in the past. And,because change can be an uncomfortable process that requires tough
6. Based on SANDAG’s demographic projections. See the RCP.7. See the 2005 Indicators of Sustainable Competitiveness: A Quality of Life Index for San Diego, pages 5-8.8. Smart growth is defined as a compact, efficient, and environmentally-sensitive pattern of development that
provides people with additional travel, housing, and employment choices by focusing future growth away from rural areas and closer to existing and planned job centers and public facilities, while preserving open space and natural resources and making more efficient use of existing urban infrastructure (RCP, p. 25).

Conclusions
True North Research, Inc. © 2005 11SANDAG. . . . . . . . . . . . . . . .
decisions and collaboration among civic leaders, elected officials andvarious interest groups, having the support of the public is a critical steptoward realizing the vision of the RCP.
Although the survey was not designed as a test for public support of theRCP, the results of the survey nevertheless provide a clear indication thatmany of the broad approaches and specific strategies outlined in the RCPhave the support of the public. For example, factors that shape the sus-tainability of the region—including increasing the use of renewableenergy sources, protecting the environment, improving the transporta-tion infrastructure, and providing more funding for affordable housingprograms—were featured prominently among the public’s priorities forhow tax dollars should be spent. There is broad agreement that theregion needs a first-class public transit system to meet the region’stravel needs, and that a multi-faceted approach to reducing traffic con-gestion that combines demand reduction strategies, convenient alterna-tives to solo driving, as well as road and freeway improvements would beeffective at reducing congestion. In recent years, the public has shiftedfrom favoring the type of residential development that leads to sprawl todesigns consistent with smart growth principles. The appeal of smartgrowth development is especially strong among seniors, a demographicgroup that is projected to become a larger and larger segment of theregion’s population.
The results of the survey do point to some challenges, of course. Thereis a perception that relations between San Diego and Mexico, as well asbetween San Diego and tribal governments, need to be improved.Although the percentage of residents who have heard of SANDAG hasincreased in recent years, the percentage who have an accurate under-standing of what the agency does and its role in regional planning is low.Moreover, following a national trend, the percentage of commuters whocarpool continues to decline.
Nevertheless, even these challenges have solutions—some of which arealready in motion. With respect to improving relations with Mexico andtribal governments, the RCP calls for the coordination of shared infra-structure, efficient transportation systems, integrated environmentalplanning, and economic development strategies. An integrated systemof high-occupancy-vehicle (HOV) lanes and managed lanes is also
planned for the region’s major freeways,9 a change that will provide akey incentive for commuters to carpool and can be expected to lead to
significantly higher vehicle occupancy rates.10
9. See Mobility 2030—the Regional Transportation Plan (RTP).10.For more information on the link between HOV lanes and carpooling, see “Commute Behavior” on page 36
and “Carpooling & Bicycling” on page 46.

Conclusions
True North Research, Inc. © 2005 12SANDAG. . . . . . . . . . . . . . . .
In summary, although the results of the survey certainly highlight manyof the specific challenges that face the region, the overriding message isa positive one. The public is generally on the same page as SANDAGregarding the issues that must be addressed to improve and sustain ourquality of life, as well as the need to accomplish these changes throughcomprehensive and well-coordinated regional public policy-making.

Living in the San Diego Region
True North Research, Inc. © 2005 13SANDAG. . . . . . . . . . . . . . . .
L I V I N G I N T H E S A N D I E G O R E G I O N
The first substantive section of the survey addressed respondents’ general perceptions of thequality of life in the San Diego region, including their satisfaction with the region as a place tolive, their expectations for the future, as well as their perceptions of a number of factors thatimpact daily life in the region.
OVERALL SATISFACTION The initial question in this series simply asked respondents toindicate how satisfied they are with the San Diego region as a place to live. The results to thisquestion for all respondents are shown in Figure 2, as are the results to the same question in2002. Overall, approximately 87% of adults indicated that they were satisfied (55% very satisfied,33% somewhat satisfied) with the region as a place to live, whereas 8% indicated that they weresomewhat dissatisfied and an additional 4% offered that they were very dissatisfied. When com-pared to the prior study in 2002, the percentage of very satisfied residents exhibited a statisti-cally significant decline over the past three years from 62% to 55%. The percentage of verydissatisfied residents also increased during this period, from 1.8% to 4%.
Question 1 All things considered, how satisfied are you with the San Diego region as a place tolive?
FIGURE 2 OVERALL SATISFACTION WITH SAN DIEGO REGION: 2005 & 2002
† Statistically significant difference between 2002 to 2005 at p < .05.
62
33
29
862
55†
4†
0
10
20
30
40
50
60
70
80
90
100
2005 2002
St udy Year
Per
cen
tag
e o
f A
du
lt R
esid
en
ts
Not sure
Very dissatisfied
Somewhat dissatisfied
Somewhat satisfied
Very satisfied

Living in the San Diego Region
True North Research, Inc. © 2005 14SANDAG. . . . . . . . . . . . . . . .
For the interested reader, Figure 3 displays how satisfaction with the San Diego region as a placeto live in 2005 varied by age, ethnicity, household income, commute behavior, and homeowner-ship status. The most striking pattern in the figure is that, with few exceptions, residents exhib-ited similarly high levels of satisfaction with the region. Only one subgroup (African-American)expressed less than 80% satisfaction with the region as a place to live.
FIGURE 3 OVERALL SATISFACTION WITH SAN DIEGO REGION: DEMOGRAPHIC BREAKDOWN
SAN DIEGO’S FUTURE The survey next asked respondents to envision the future of theSan Diego region and indicate whether they anticipate that it will be a better place to live than itis now, a worse place to live, or about the same. Because this question was also asked in 2002,Figure 4 on the next page presents the results from the prior study and the current study in acomparative display. Using a convention that will be followed throughout this report for barcharts that include results from both studies, the 2005 results are represented by blue bars andthe 2002 results are represented by purple bars. Statistically significant differences withinresponse categories over time are denoted by the † symbol which appears next to the value forthe 2005 survey.
As shown in Figure 4, residents are somewhat more pessimistic about the future of the regionwhen compared to three years ago. Whereas 26% of residents in 2002 anticipated that San Diegowill be a better place to live in the future, the corresponding figure in 2005 was 18%. Conversely,the percentage of respondents who expected that the region will be a worse place to live in thefuture increased significantly between 2002 and 2005, from 32% to 39%. The proportion of resi-
47
58
50
65
59
55 56
37
50 5
8
45 5
2
49
61
52
64
59
51 6
1
46
61
36
36
34
34
27
29
33 34
33
35
28
39
36
33
29
36
28
34
35
29
38
29
57
0
10
20
30
40
50
60
70
80
90
100
18 t
o 2
4
25 t
o 3
4
35 t
o 4
4
45 t
o 5
4
55 t
o 6
4
65
an
d o
ver
Cau
casi
an
Lati
no
Afr
ican
-Am
eric
an
Asi
an-A
mer
ican
Mix
ed /
Oth
er
Less
th
an $
25K
$25
K t
o $
35
K
$35
K t
o $
50
K
$50
K t
o $
75
K
$7
5K
to
$1
00
K
$10
0K
to
$1
50
K
Mo
re t
han
$1
50
K
Yes No
Ren
t
Ow
n
Age Ethnic ity Household income RegularlyCommute
HomeOwnership
Status
Perc
en
tag
e o
f A
du
lt R
esid
en
ts
Somewhat satisfied
Very satisfied
Overall Satisfaction (87%)

Living in the San Diego Region
True North Research, Inc. © 2005 15SANDAG. . . . . . . . . . . . . . . .
dents who anticipated that the region will be about the same as it is now was virtually unchangedbetween 2002 and 2005.
Question 2 In the future, do you think San Diego will be a better place to live than it is now, aworse place to live than it is now, or about the same as it is now?
FIGURE 4 PERCEPTION OF SAN DIEGO IN FUTURE: 2005 & 2002
† Statistically significant difference between 2002 to 2005 at p < .05.
Expectations regarding the future of the San Diego region varied substantially by age. As shownin Figure 5, older respondents were the most pessimistic about the region’s future, whereasyounger respondents were more evenly split between optimists and pessimists. At the extremes,pessimists outnumbered optimists among seniors by more than 3 to 1, whereas among resi-dents between the ages of 18 and 24 optimists were slightly more prevalent than pessimists.
39
4
26
32
40
3
39†
18†
0
5
10
15
20
25
30
35
40
45
50
Better place to livethan now
Worse place to livethan now
About the same asnow
Not sure
Percept ion of San Diego in Fut ure
Perc
en
tag
e o
f A
du
lt R
esid
en
ts
2005
2002

Living in the San Diego Region
True North Research, Inc. © 2005 16SANDAG. . . . . . . . . . . . . . . .
FIGURE 5 PERCEPTION OF SAN DIEGO IN FUTURE BY AGE
ASPECTS OF LOCAL COMMUNITY The final question in this series asked respondentsto rate the quality of various aspects of their local community—rather than the region as awhole—using a scale of excellent, good, fair or poor. Participants’ responses were numericallycoded using the scale shown at the bottom of Figure 6, with poor=1, fair=2, good=3 and excel-lent=4. Respondents’ answers were then averaged to arrive at the mean scores shown in the fig-
ure for each aspect tested.11 The aspects tested, as well as the mean responses among allrespondents for 2005 and 2002, are shown in Figure 6. In both studies, the order in which theaspects were presented was randomized for each respondent to avoid a systematic position bias.
The overall quality of life in their community received the highest rating in 2005 (2.95), followedby the user-friendliness of walkways and sidewalks (2.58), public transportation (2.21), trafficconditions on local roads (2.00), governmental leadership (1.75), and traffic conditions on free-ways (1.64). It should be noted that, with the exception of public transportation, each of theaspects tested exhibited a statistically significant decline in the mean score between 2002 and2005, indicating that residents perceived a decline in the quality of these aspects during thisperiod. Although in most cases the decline was small, in one case—government leadership—res-idents’ perceptions changed quite dramatically during this period.
11.To allow for direct comparisons across aspects, only respondents with an opinion were included when calcu-lating the means shown in the figure. Responses of ‘No Opinion’ or ‘Don’t Know’ were omitted. Unless oth-erwise specified, this convention is followed throughout the report.
16
2017
13
25
33
43 42
49
45
25
19
0
10
20
30
40
50
60
18 to 24 25 to 34 35 to 44 45 to 54 55 to 64 65+
Age
Perc
en
tag
e o
f A
du
lt R
esid
en
ts
Better place tolive than now
Worse place tolive than now

Living in the San Diego Region
True North Research, Inc. © 2005 17SANDAG. . . . . . . . . . . . . . . .
Question 3 Next, I am going to read a list of aspects of your local community and for eachplease tell me if you would describe the quality as excellent, good, fair, or poor.
FIGURE 6 RATING OF LOCAL ISSUES: 2005 & 2002
† Statistically significant difference between 2002 to 2005 at p < .05.
2.21
2.95†
2.58†
2.00†
1.75†
1.64†
1 2 3 4
Traffic conditions on freeways
Governmental leadership
Traffic conditions on local roads
Public transportation
User-friendliness of walkways and sidewalks
Overall quality of life
2005
2002
Poor Fair Good Excellent

Aw
areness
True North Research, Inc. © 2005 18SANDAG. . . . . . . . . . . . . . . .
A W A R E N E S S
One of the goals of this study was to gauge public awareness of SANDAG as well as several of theprograms that the agency manages. Recognizing that accurately measuring awareness is a sensi-tive exercise, the awareness questions were strategically placed toward the beginning of the sur-vey so as to preclude potential measurement error associated with a position bias. In otherwords, because many of the questions in the survey addressed topics—such as transportationinfrastructure and regional planning issues—that could either aid a respondent’s recall and/orallow them to guess at describing the agency or program, the awareness questions were pur-posely located early in the survey so as to avoid this potential source of bias.
The two questions in this series were designed to measure name recognition for SANDAG,RideLink and the term managed lanes, and—among those who recognized the name—determinewhether the respondent had an accurate understanding of the agency, program or concept. Theresults to both questions are combined in Figures 7 (SANDAG), 8 (RideLink) and 9 (managedlanes).
AWARENESS OF SANDAG With respect to SANDAG, nearly half (49%) of respondents indi-cated that they had heard the name—which is up from 37% in 2002. However, as shown to theright of Figure 7, many respondents who had heard the name were either not sure of what itmeant (32%) or were unable to describe SANDAG in a way that demonstrated that they had anaccurate understanding of the agency. Overall, approximately 10% of those who had heard ofSANDAG provided an accurate description of the agency and its role, an additional 9% recog-nized it is an agency of some sort (political/government/association), approximately 28% men-tioned an issue or service (e.g., transportation/freeways or research) that SANDAG is associatedwith, and approximately 17% provided an evaluative statement (negative or positive) withoutdemonstrating that they understood what SANDAG stands for.
Question 4 Have you ever heard of _____?
Question 5 Briefly and in your own words, how would you describe_____?
FIGURE 7 AWARENESS & DESCRIPTION OF SANDAG
Refused2%
No48%
Yes49%
2
2
2
3
5
7
7
9
10
21
32
0 10 20 30 40
Other
Carpooling
Comment unrelated to SANDAG
Wasteful / bureaucracy
Regional issues / planning / research
Positive -- general
Negative -- general
Political / government / association
Accurate description of SANDAG
Transportation / freeways
Not sure
Percent age of Adult Resident sWho Had Heard of SANDAG (Q4a)
Aw
areness
True North Research, Inc. © 2005 19SANDAG. . . . . . . . . . . . . . . .
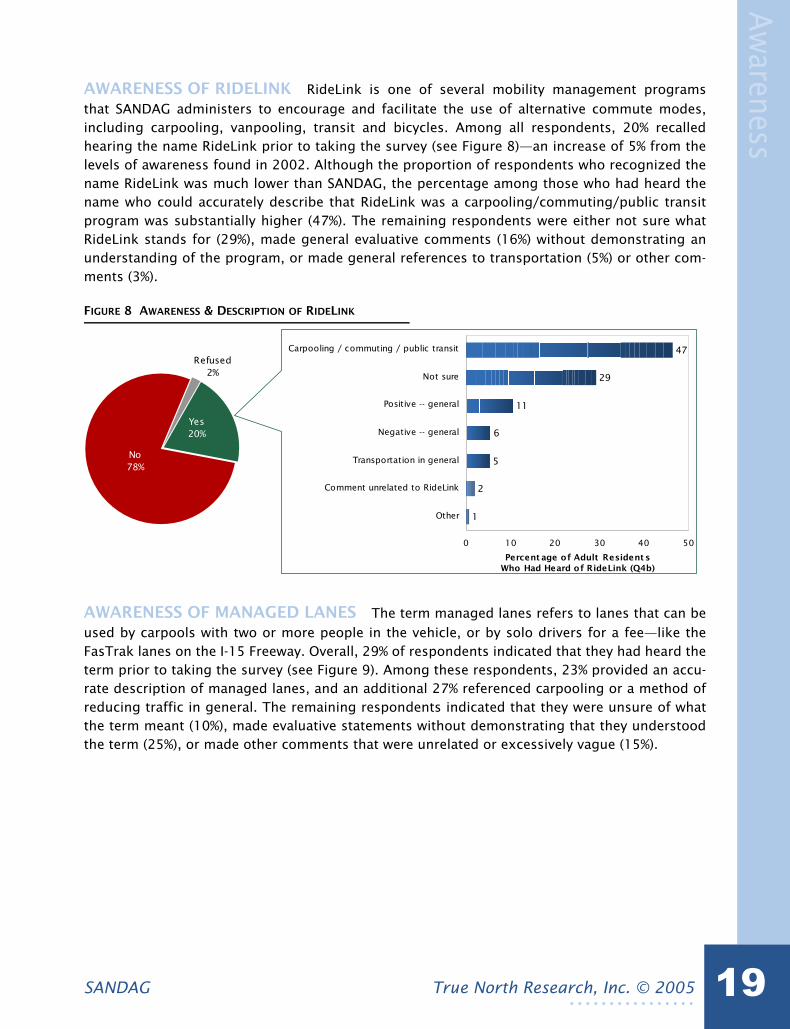
AWARENESS OF RIDELINK RideLink is one of several mobility management programsthat SANDAG administers to encourage and facilitate the use of alternative commute modes,including carpooling, vanpooling, transit and bicycles. Among all respondents, 20% recalledhearing the name RideLink prior to taking the survey (see Figure 8)—an increase of 5% from thelevels of awareness found in 2002. Although the proportion of respondents who recognized thename RideLink was much lower than SANDAG, the percentage among those who had heard thename who could accurately describe that RideLink was a carpooling/commuting/public transitprogram was substantially higher (47%). The remaining respondents were either not sure whatRideLink stands for (29%), made general evaluative comments (16%) without demonstrating anunderstanding of the program, or made general references to transportation (5%) or other com-ments (3%).
FIGURE 8 AWARENESS & DESCRIPTION OF RIDELINK
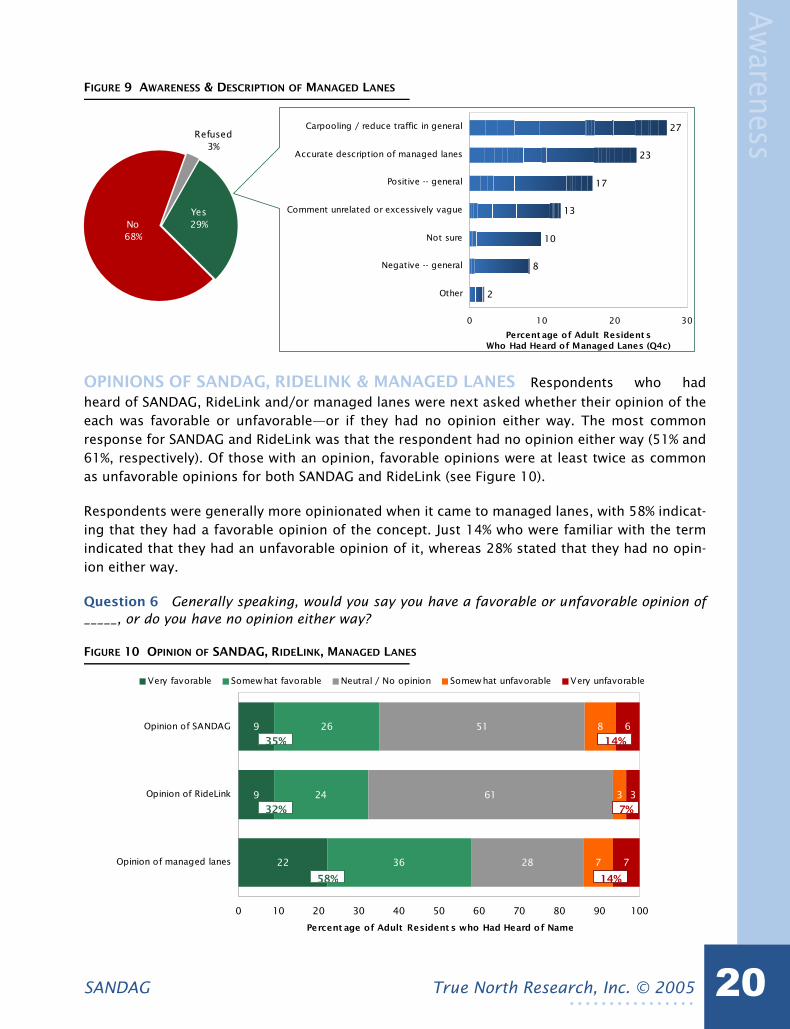
AWARENESS OF MANAGED LANES The term managed lanes refers to lanes that can beused by carpools with two or more people in the vehicle, or by solo drivers for a fee—like theFasTrak lanes on the I-15 Freeway. Overall, 29% of respondents indicated that they had heard theterm prior to taking the survey (see Figure 9). Among these respondents, 23% provided an accu-rate description of managed lanes, and an additional 27% referenced carpooling or a method ofreducing traffic in general. The remaining respondents indicated that they were unsure of whatthe term meant (10%), made evaluative statements without demonstrating that they understoodthe term (25%), or made other comments that were unrelated or excessively vague (15%).
Refused2%
No78%
Yes20%
1
2
5
6
11
29
47
0 10 20 30 40 50
Other
Comment unrelated to RideLink
Transportation in general
Negative -- general
Positive -- general
Not sure
Carpooling / commuting / public transit
Percent age of Adult Resident sWho Had Heard of RideLink (Q4b)
Aw
areness
True North Research, Inc. © 2005 20SANDAG. . . . . . . . . . . . . . . .
FIGURE 9 AWARENESS & DESCRIPTION OF MANAGED LANES
OPINIONS OF SANDAG, RIDELINK & MANAGED LANES Respondents who hadheard of SANDAG, RideLink and/or managed lanes were next asked whether their opinion of theeach was favorable or unfavorable—or if they had no opinion either way. The most commonresponse for SANDAG and RideLink was that the respondent had no opinion either way (51% and61%, respectively). Of those with an opinion, favorable opinions were at least twice as commonas unfavorable opinions for both SANDAG and RideLink (see Figure 10).
Respondents were generally more opinionated when it came to managed lanes, with 58% indicat-ing that they had a favorable opinion of the concept. Just 14% who were familiar with the termindicated that they had an unfavorable opinion of it, whereas 28% stated that they had no opin-ion either way.
Question 6 Generally speaking, would you say you have a favorable or unfavorable opinion of_____, or do you have no opinion either way?
FIGURE 10 OPINION OF SANDAG, RIDELINK, MANAGED LANES
Refused3%
No68%
Yes29%
2
8
10
13
17
23
27
0 10 20 30
Other
Negative -- general
Not sure
Comment unrelated or excessively vague
Positive -- general
Accurate description of managed lanes
Carpooling / reduce traffic in general
Percent age of Adult Resident sWho Had Heard of Managed Lanes (Q4c)
22
9
9
36
24
26
28
61
51
7
3
8
7
3
6
0 10 20 30 40 50 60 70 80 90 100
Opinion of managed lanes
Opinion of RideLink
Opinion of SANDAG
Percent age of Adult Resident s who Had Heard of Name
Very favorable Somewhat favorable Neutral / No opinion Somewhat unfavorable Very unfavorable
35%
58%
14%
7%32%
14%

Regional Priorities
True North Research, Inc. © 2005 21SANDAG. . . . . . . . . . . . . . . .
R E G I O N A L P R I O R I T I E S
Having previously measured respondents’ general perceptions of the quality of life in the region,the survey next became more specific with respect to identifying the issue, policy and programpriorities for the region.
SALIENT PROBLEMS The first question in this series was designed to allow respondentsthe opportunity to indicate what they feel is the number one problem facing the San Diegoregion. Rather than prompt residents with specific issues, this question was asked in an open-ended manner to encourage the respondent to mention the problem that was most salient tothem at the time of the interview. The verbatim responses were later reviewed by True North andgrouped into the categories shown in Figure 11.
Question 7 What would you say is the San Diego region's number one problem?
FIGURE 11 NUMBER ONE PROBLEM IN SAN DIEGO REGION: 2005 & 2002
† Statistically significant difference between 2002 to 2005 at p < .05.
By far the most commonly cited problem was traffic congestion, mentioned by 26% of all respon-dents. Other commonly mentioned problems included government/leadership (13%), the avail-ability and cost of housing (13%), cost of living in general (11%), and population growth/overcrowding (10%). When compared to 2002, there was a statistically significant increase in thepercentage of residents who mentioned government/leadership, illegal aliens and public trans-portation as the most important problems facing the region. The period also witnessed a statisti-
0
1
1
0
6
6
2
8
8
8
16
3
25
6
11
13
26
1610†
4†
4†
3†
3
2
1
0
13†
3†
0 10 20 30
Airport
Education
Economy / availability of jobs
Public transportation
Other
Lacking / inadequate Infrastructure
Illegal aliens
Not sure
Crime / gangs / drugs
Population growth / overcrowding
Cost of living
Housing costs and availability
Government / leadership
Traffic
Percent age of Adult Resident s
2005
2002

Regional Priorities
True North Research, Inc. © 2005 22SANDAG. . . . . . . . . . . . . . . .
cally significant decline in the percentage of residents who view population growth andinadequate infrastructure as the most important problems facing the region.
Whereas Question 7 provided respondents with an open-ended opportunity to identify the mostpressing regional problem, Question 8 presented a list of 13 specific issues and asked respon-dents to identify the importance of each. Participants’ responses were numerically coded usingthe scale shown at the bottom of Figure 12, with not at all important=0, somewhat important=1,very important=2, and extremely important=3. Respondents’ answers were then averaged to
arrive at the mean scores shown in the figure for each issue tested.12 The issues tested, as wellas the mean responses among all respondents for 2005 and—where applicable—2002, areshown in Figure 12. In both studies, the order in which the issues were presented was random-ized for each respondent to avoid a systematic position bias.
Question 8 Do you think that focusing efforts on _____ is extremely important, very important,somewhat important, or not at all important?
FIGURE 12 IMPORTANCE OF ISSUES: 2005 & 2002
† Statistically significant difference between 2002 to 2005 at p < .05.
At the top of the importance ranking in 2005 was ensuring an adequate water supply (2.31), fol-lowed by reducing crime (2.25), protecting beaches from pollution (2.24), making housing moreaffordable (2.20), reducing traffic congestion (2.19) and ensuring reliable energy sources (2.14).
12.To allow for direct comparisons across issues, only respondents with an opinion were included when calcu-lating the means shown in the figure. Responses of ‘No Opinion’ or ‘Don’t Know’ were omitted.
1.84
2.06
2.14
2.19
2.20
2.24
2.25
2.31
2.03
1.88
1.80†
1.74
1.28†
0 1 2 3
Replenishing sand on the beaches
Encouraging new businesses to come to San Diego
Keeping agricultural land
Providing better public transportation services
Improving air quality
Protecting parks, canyons, and other open space
Encouraging recycling
Ensuring reliable energy sources
Reducing traffic congestion
Making housing more affordable
Protecting beaches from pollution
Reducing crime
Ensuring an adequate water supply
2005
2002
Not at all important
Somewhat important
Very important
Extremely important

Regional Priorities
True North Research, Inc. © 2005 23SANDAG. . . . . . . . . . . . . . . .
For all but two issues that were tested in both 2005 and 2002—keeping agricultural land andreplenishing sand on the beaches—the perceived importance has not changed significantly inthe past three years. For these two exceptions, the perceived importance declined significantly.
SATISFACTION For the same list of issues presented in Question 8, respondents were nextasked to identify how satisfied they are with current efforts to address the issue. Participants’responses were numerically coded using the scale shown at the bottom of Figure 13, with very
dissatisfied=-2, somewhat dissatisfied=-1, somewhat satisfied=1, and very satisfied=2.13
Respondents’ answers were then averaged to arrive at the mean scores shown in the figure foreach issue tested. Once again, the order in which the issues were presented was randomized foreach respondent to avoid a position-order bias.
Question 9 Thinking about the same issues that I just read, would you say you are satisfied ordissatisfied with the current efforts to: _____, or do you not have an opinion about this issue?
FIGURE 13 SATISFACTION WITH ISSUES: 2005 & 2002
† Statistically significant difference between 2002 to 2005 at p < .05.
Of the issues tested, respondents reported the greatest level of satisfaction with current effortsto encourage recycling (0.77), followed by replenish sand on the beaches (0.69), protect parks,canyons and other open spaces (0.55), reduce crime (0.48), improve air quality (0.48), andensure an adequate water supply (0.44). At the other extreme, respondents were generally dis-satisfied with current efforts to make housing more affordable (-0.78), reduce traffic congestion
13.Neutral was not a category offered to respondents—it is shown here just for scale. To allow for direct com-parisons across issues, only respondents with an opinion were included when calculating the means shown in the figure. Responses of ‘No Opinion’ or ‘Don’t Know’ were omitted.
-0.07
0.13
0.14
0.29
0.44
0.48
0.48
0.55
0.69
0.77
0.36†
-0.54†
-0.78†
-2 -1 0 1 2
Make housing more affordable
Reduce traffic congestion
Ensure reliable energy sources
Provide better public transportation services
Protect beaches from pollution
Keep agricultural land
Encourage new businesses to come to San Diego
Ensure an adequate water supply
Improve air quality
Reduce crime
Protect parks, canyons, and other open space
Replenish sand on the beaches
Encourage recycling
2005
2002
Very dissatisfied
Somewhat dissatisfied
Neutral Somewhat satisfied
Very satisfied

Regional Priorities
True North Research, Inc. © 2005 24SANDAG. . . . . . . . . . . . . . . .
(-0.54), and ensure reliable energy sources (-0.07). When comparing issues that appeared in boththe 2005 and 2002 studies, three displayed statistically significant declines in satisfaction dur-ing this period: encouraging new businesses to come to San Diego, reducing traffic congestionand making housing more affordable.
PRIORITY RANKINGS With a measure of the importance of an issue to residents (Question8) as well as a measure of residents’ satisfaction with current efforts to address the issue (Ques-tion 9), one is able to examine the relationship between these two dimensions and determineissue areas where local and regional governments have the greatest opportunities—and need—to improve overall resident satisfaction. The Satisfaction-Importance Matrix shown in Figure 14plots the issues tested on the two dimensions, or axes. The scale along the x-axis (horizontal)corresponds to the overall mean level of importance that residents assigned to the issues. Thescale along the y-axis (vertical) corresponds to the overall level of satisfaction with currentefforts to address these issues. For reference, the matrix also shows the division between posi-tive and negative levels of satisfaction, as well as above and below average importance (see thegrey lines). Those issues that have above average importance, but comparatively lower satisfac-tion scores, represent the areas that are priorities for government attention. At the top of this listis making housing more affordable, following by reducing traffic congestion and ensuring reli-able energy sources.
FIGURE 14 SATISFACTION-IMPORTANCE MATRIX
Reducing traffic congestion
Reducing crime
Encouraging recycling
Protecting beaches from pollution
Providing better public transportation services
Protecting parks, canyons, and other open space
Keeping agricultural land
M aking housing more affordable
Encouraging new businesses to come to San Diego
Ensuring reliable energy sources
Replenishing sand on the beaches
Improving air qualityEnsuring an adequate water supply
-2.0
-1.5
-1.0
-0.5
0.0
0.5
1.0
1.5
2.0
0.0 0.5 1.0 1.5 2.0 2.5 3.0
Average importanceof all issues (2.00)
Sati
sfact
ion
ImportanceVery
dissatisfied
Somewhat dissatisfied
Somewhat satisfied
Verysatisfied
Neutral
Not at all important
Somewhat important
Veryimportant
Extremelyimportant

Regional Priorities
True North Research, Inc. © 2005 25SANDAG. . . . . . . . . . . . . . . .
Although plotting the respective positions of the issues in the Satisfaction-Importance Matrix isan intuitive and visual way of comparing issues among each other, some readers may prefer amore refined quantitative approach. By dividing the average level of satisfaction by the averagelevel of importance for each of the 13 issues tested, a ratio is obtained that describes the relativerelationship between satisfaction and importance. The higher the satisfaction-importance ratiofor an issue, the lower the priority for current efforts to focus on addressing that issue. Con-versely, the lower the ratio, the greater the perceived need for local government to focus effortson that particular issue.
Table 1 presents the satisfaction-importance ratios for each of the services tested in 2005, aswell as the corresponding ratios from the 2002 survey where applicable. The issues are sortedfrom the highest priority (making housing more affordable) to the lowest priority (replenishingsand on the beaches). It is worth noting that among the issues that were tested in both 2005 and2002, the issues that represent the best candidates for improvement in 2005—making housingmore affordable, reducing traffic congestion and protecting beaches from pollution—were alsothe top three candidates in 2002.
TABLE 1 SATISFACTION-IMPORTANCE RATIOS: 2005 & 2002
TAX DOLLAR PRIORITIES Question 11 was designed to measure how the public wouldprioritize projects and services given the limited resources that are available to local govern-ments. After reminding respondents that there is a limited amount of funds available to provideprojects and that not all projects can be high priorities, the survey asked respondents to rateeach of the projects and services shown in Figure 15 using a scale of 1 through 5, with 5 repre-senting the highest possible priority and 1 representing the lowest priority. The priority ratingswere averaged by project for all respondents to arrive at the mean scores shown in the figure.
Figure 15 presents the priority scores assigned to each project in 2005 and 2002 (where applica-ble), with projects sorted from highest to lowest priority. Overall, residents viewed increasing theuse of renewable energy sources, such as solar and wind-generated electricity (4.17) as the high-est priority, followed by protecting the environment from pollution (4.11), improving freeways in
the San Diego region (4.11), and improving local streets and roads (4.00).14 When compared tothe 2002 results, the priority ratings assigned in 2005—as well as the relative ranking of
Ratio Priority Ratio PriorityMaking housing more affordable -0.355 1 -0.213 1Reducing traffic congestion -0.246 2 -0.142 2Ensuring reliable energy sources -0.033 3 N/A N/AProtecting beaches from pollution 0.061 4 0.090 3Providing better public transportation services 0.070 5 0.143 4Keeping agricultural land 0.161 6 0.160 5Ensuring an adequate water supply 0.192 7 N/A N/AEncouraging new businesses to come to San Diego 0.206 8 0.356 9Reducing crime 0.216 9 0.248 6Improving air quality 0.258 10 N/A N/AProtecting parks, canyons, and other open space 0.274 11 0.290 7Encouraging recycling 0.374 12 0.351 8Replenishing sand on the beaches 0.537 13 0.407 10
Issue2005 2002

Regional Priorities
True North Research, Inc. © 2005 26SANDAG. . . . . . . . . . . . . . . .
projects—were quite similar. Only two projects increased significantly in their priority rating(improving local streets and roads and providing more police protection), and just one project’spriority reduced significantly (providing more parks and recreation programs and facilities).
Question 11 Please tell me what priority you would give each project using a scale of 1through 5, with a 5 representing the highest possible priority and a 1 representing a relativelylow priority. What priority would you give _____?
FIGURE 15 PRIORITIES FOR TAX DOLLARS: 2005 & 2002
† Statistically significant difference between 2002 to 2005 at p < .05.
14.The approach used in the survey was to disaggregate public transit in general into its main modes -- bus, trolley and the Coaster. If these elements were combined into a single category, analyses indicate that public transportation would rank 5th among the public’s top priorities for receiving tax dollars.
3.34
3.68
3.77
3.79
4.11
4.11
4.17
4.00†
3.86†
3.50†
3.49
3.49
3.17
2.98
2.89
1 2 3 4 5
Replenishing sand on the beaches
Improving quality and quantity of bike lanes and paths
Improving Coaster service
Improving Trolley service
Providing more accessible drug treatment
Implementing faster, more customer-oriented bus system
Providing more parks and recreation programs and facilities
Preserving, protecting habitats and open space
Creating more programs for high risk youth
Providing more funding for affordable housing programs
Providing more police protection
Improving local streets and roads
Improving freeways in San Diego region
Protecting the environment from pollution
Increasing use of renewable energy sources
2005
2002
Lowest priority
Highest priority

Policy Attitudes
True North Research, Inc. © 2005 27SANDAG. . . . . . . . . . . . . . . .
P O L I C Y A T T I T U D E S
As the regional planning agency for San Diego, one of SANDAG’s primary functions is to createplans and establish policies that address a variety of topics, including growth, transportation,environmental management, housing, open space, air quality, energy, fiscal management, eco-nomic development, and criminal justice. The regionwide resident survey is a useful tool in thisprocess, as it helps guide SANDAG’s policy decisions by profiling residents’ opinions on policy-related matters for both current and emerging issues.
Question 10 presented respondents with 13 statements, each of which either deals directly witha policy matter or has policy implications. For each statement, respondents were asked to indi-cate their level of agreement with the statement using the scale shown at the bottom ofFigure 16, with strongly disagree=-2, somewhat disagree=-1, somewhat agree=1 and stronglyagree=2. Respondents’ answers were then averaged to arrive at the mean scores shown in the
figure for each statement tested.15 Truncated versions of the statements tested, as well as themean responses among all respondents for 2005 and 2002 (where applicable), are shown in thefigure. In both studies, the order in which the statements were presented was randomized foreach respondent to avoid a systematic position bias.
Question 10 Do you agree or disagree that: _____?
FIGURE 16 AGREEMENT WITH STATEMENTS: 2005 & 2002
† Statistically significant difference between 2002 to 2005 at p < .05.
15.To allow for direct comparisons across statements, only respondents with an opinion were included when calculating the means shown in the figure. Responses of ‘No Opinion’ or ‘Don’t Know’ were omitted.
-0.03
0.15
0.34
0.65
0.67
1.06
1.23
1.56
-0.01
0.32†
0.34
-0.43†
-0.78
-2 -1 0 1 2
I'm w illing to pay higher energy rates for more reliable service (29%)
I am considering leaving San Diego because of growth (37%)
Controls on population growth hurt the economy (44%)
Wait time at border affects my decision to visit Mexico (42%)
New developments in region pay their share of public services (47%)
I'm considering leaving San Diego because of housing costs (55%)
More people living in an area means it is less desirable (57%)
Residents have enough opps to participate in planning process (58%)
Relations between SD and tribal govs need to be improved (63%)
Highway Patrol needs to enforce carpool lanes more often (65%)
Relations between SD and MX need to be improved (77%)
San Diego needs a first class public transit system (83%)
Developers should be required to show adequate H2O supply (91%)
2005
2002
Stronglydisagree
Somewhat disagree
Neutral Somewhat agree
Strongly agree

Policy Attitudes
True North Research, Inc. © 2005 28SANDAG. . . . . . . . . . . . . . . .
Residents expressed the greatest level of agreement with the statement, “developers should berequired to show that the local and regional water supply is adequate before they can begin con-struction” (1.56), followed by, “San Diego needs a first class public transit system to meet theregion’s increasing travel needs” (1.23), and, “relations between San Diego and Mexico need to beimproved” (1.06). At the other extreme, residents generally disagreed with the statements, “Iwould be willing to pay higher energy rates if it would prevent blackouts or price swings in thefuture” (-0.78) and, “I am considering leaving San Diego because of changes related to growth”(-0.43).
Of the statements that were also asked in 2002, residents generally held the same opinions in2005. The two notable exceptions to this pattern were both related to respondents’ plans to con-tinue residing in San Diego. Whereas in 2002 a majority respondents disagreed with the state-ment, “I’m considering leaving San Diego because of housing is too expensive”, by 2005 amajority of respondents agreed with this statement. Similarly, the intensity with which respon-dents disagreed with the statement, “I am considering leaving San Diego because of changesrelated to growth” was significantly less in 2005 when compared to 2002.

Traffic Managem
ent Strategies
True North Research, Inc. © 2005 29SANDAG. . . . . . . . . . . . . . . .
T R A F F I C M A N A G E M E N T S T R A T E G I E S
The next series of questions in the survey asked residents to evaluate the effectiveness of sev-eral traffic management strategies designed to relieve congestion during the morning and after-noon commute hours. The method for both Questions 12 and 13 was to present the respondentwith possible solutions for relieving traffic congestion and ask them to indicate whether—in theiropinion—the strategy would be very, somewhat or not at all effective at actually relieving con-
gestion.16 Respondents answers were coded according to the scale shown at the bottom ofFigure 17, then averaged to arrive at the mean scores shown in the figure for each strategy.
Question 12 There are many possible solutions for relieving traffic congestion during themorning and afternoon rush hours. Please tell me if you feel each of the following strategies is avery effective, somewhat effective, or not at all effective approach to relieving traffic congestion.
Question 13 One approach to relieving traffic congestion on San Diego highways would be toconstruct additional lanes in the median that would become managed lanes. The managed lanescould be used by carpools with two or more people in the vehicle. They could also be used by solodrivers for a fee - like the FasTrak lanes on the I-15 Freeway. Do you think building additionalmanaged lanes would be a very effective, somewhat effective or not at all effective approach torelieving traffic congestion on San Diego highways?
FIGURE 17 POSSIBLE SOLUTION FOR RELIEVING TRAFFIC: 2005 & 2002
† Statistically significant difference between 2002 to 2005 at p < .05.
16.The concept of managed lanes required a somewhat lengthy description, which is why it was not included in Question 12 but rather introduced as a separate question. Because the root question and scale were the same, however, the results for Question 13 have been combined with those of Question 12 in Figure 17.
1.22
1.42
1.50
1.37†
1.33†
1.32
1.30
1.25
1.21
1.19
0.94†
0 1 2
Allow ing solo drivers to pay to use carpool lanes
Building additional managed lanes
Adding lanes to freeways only for carpoolers
Incentives to encourage alternate forms of transportation
Concentrating developments near areas w ith public transit
Employer-sponsored carpooling programs
Additional public transportation
Building new freeways
Telecommuting
Adding lanes to existing freeways
Flexible work hours
2005
2002
Not at all effective
Somewhat effective
Very effec tive

Traffic Managem
ent Strategies
True North Research, Inc. © 2005 30SANDAG. . . . . . . . . . . . . . . .
As shown in Figure 17, all but one of the strategies—allowing solo drivers to pay to use carpoollanes in rush hour—was viewed by the public as at least a somewhat effective approach to reliev-ing congestion. Flexible work hours (1.50) was regarded by residents as the most promisingsolution proposed, followed by adding lanes to existing freeways (1.42), telecommuting (1.37),building new freeways (1.33) and providing additional public transportation (1.32). Interestingly,the perceived effectiveness of congestion relief strategies does not vary significantly accordingto commute status. Those who regularly commute to work or school shared the same percep-tions as those who do not commute.
When compared to 2002, residents were significantly less inclined in 2005 to view telecommut-ing and allowing solo drivers to pay to use carpool lanes as effective strategies for relieving con-gestion during rush hours. On the other hand, they were somewhat more likely to view buildingnew freeways as an effective solution.
MANAGED LANES As shown in Figure 17, the average respondent viewed adding managedlanes to highways in the region as a somewhat effective approach to relieving traffic congestion.Because managed lanes can be used by carpools as well as solo drivers who are willing to pay afee, it naturally of interest to gauge whether—and under what conditions—respondents expectthat they would use the lanes in the future.
The first question in this series simply asked respondents whether, if they were driving solo,they would occasionally pay a fee to use the managed lanes during rush hour. Overall, nearly half(48%) of respondents anticipated that they would pay to use the lanes, whereas 41% indicatedthat they would not and 11% indicated that it would depend or they were not sure (seeFigure 18).
Question 14 If you were driving by yourself, would you occasionally pay a fee to use the man-aged lanes during rush hour?
FIGURE 18 WOULD OCCASIONALLY PAY FEE TO USE MANAGED LANES
No41%
Yes48%
Depends9%
Not sure /Refused
2%

Traffic Managem
ent Strategies
True North Research, Inc. © 2005 31SANDAG. . . . . . . . . . . . . . . .
As one might expect, a resident’s willingness to pay to use managed lanes is positively related totheir financial situation (see Figure 19). In general, the greater a resident’s household income,the more likely they were to indicate that they would pay to use a managed lane during rushhour. At the extremes, 73% of respondents with annual family incomes in excess of $150,000stated that they would pay to use the lanes, compared to just 40% of respondents from house-holds with annual incomes of less than $25,000.
FIGURE 19 WOULD OCCASIONALLY PAY FEE TO USE MANAGED LANES BY HOUSEHOLD INCOME
Because the San Diego region lacks an integrated system of carpool lanes or managed lanes,some have suggested that commuters do not have as large an incentive to join a carpool or van-pool as they would if these lanes were more prevalent. Accordingly, the survey asked residentswhether they would be more or less inclined to join a carpool or vanpool if managed lanes wereadded to local highways—or if it would have no effect on their decision. The results for this ques-
tion are presented in Figure 20 on the next page.17
Overall, 29% of residents who do not already carpool or vanpool as their primary means of get-ting to work or school indicated that they would be more likely to join a carpool or vanpool ifmanaged lanes were added to local highways. Nearly two-thirds (66%) of residents indicated thatmanaged lanes would not impact their decision to carpool or vanpool, whereas 3% stated thatthey would be less inclined to carpool or vanpool and 2% were unsure. Although not shown as agraphic, it is interesting to note that commute distance bore no relationship to a respondent’s
willingness to join a carpool or vanpool in response to added managed lanes.18
17.Individuals who already carpool or vanpool to work or school were excluded from the analysis.18.The relationship continued to be absent even after controlling for family income using linear regression
analysis.
4450
45
5259
73
40
0
10
20
30
40
50
60
70
80
90
100
Less than$25K
$25K to$35K
$35K to$50K
$50K to$75K
$75K to$100K
$100K to$150K
More than$150K
Household Income
Perc
en
tag
e o
f A
du
lt R
esid
en
ts
Overall Yes (48%)

Traffic Managem
ent Strategies
True North Research, Inc. © 2005 32SANDAG. . . . . . . . . . . . . . . .
Question 15 Would you be more or less inclined to join a carpool or vanpool if managed laneswere added to local highways, or would it have no effect?
FIGURE 20 EFFECT OF MANAGED LANES ON JOINING CARPOOL/VANPOOL19
849748982917849748982928
19.The results are shown only for respondents who do not already carpool or vanpool as their primary mode of commuting to work or school.
Not sure2%
No effect66%
More inclined29%
Less inclined3%

Smart G
rowth vs. Spraw
l
True North Research, Inc. © 2005 33SANDAG. . . . . . . . . . . . . . . .
S M A R T G R O W T H V S . S P R A W L
Land use and transportation decisions are intimately related. The structure of a transportationnetwork will both serve and encourage particular types of development. Likewise, the nature andperformance of the region’s transportation system is dictated, in part, by land use decisions thathave shaped the density and distribution of residences and work places.
Although there are many variations on residential land use models, popular discussions oftenfocus on two distinct approaches—smart growth vs. sprawl. To better understand how San Diegoresidents feel about future home building and neighborhood design in the region, the surveypresented respondents with two opinions that correspond to these two approaches (shownbelow) and asked respondents to indicate which opinion is closest to their own.
Sprawl Smith feels that most new housing developments should continue to fea-ture single-family homes in areas of the region that are separate fromshops and office space, resulting in a more spread-out design.
Smart Growth Jones feels that new housing developments should include condos,townhouses, and apartments mixed in with shops and office space,resulting in a more compact design.
Question 16 Thinking now about future home building and neighborhood design, there are twogeneral opinions. After I read these two opinions, please tell me which is closer to your own.
FIGURE 21 PREFERENCE FOR FUTURE HOME BUILDING & NEIGHBORHOOD DESIGN: 2005 & 2002
† Statistically significant difference between 2002 to 2005 at p < .05.
More spread-outdesign
47
More compactdesign
41
4 25
More spread-outdesign
43
More compactdesign
47†
4
0
10
20
30
40
50
60
70
80
90
100
2005 2002
St udy Year
Perc
en
tag
e o
f A
du
lt R
esid
en
ts
Refused
Some of both
Neither
More compact design
More spread-outdesign

Smart G
rowth vs. Spraw
l
True North Research, Inc. © 2005 34SANDAG. . . . . . . . . . . . . . . .
Figure 21 shows that a subtle, yet statistically significant shift has occurred during the past threeyears with respect to residents’ opinions about future home building and neighborhood designin the region. Whereas residents generally favored a spread-out design (sprawl) in 2002, the bal-ance has shifted such that residents now prefer a more compact design (smart growth).
DESIGN PREFERENCE BY SUBGROUPS Neighborhood design preferences appear to beshaped, in part, by a respondent’s age and current housing situation. Whereas residents underthe age of 35 generally prefer a more spread-out design, older residents (especially seniors) pre-fer a more compact design (see Figure 22). Those who live in a condominium strongly prefer acompact design for the region in the future, whereas residents who have other living arrange-ments (single-family home, apartment or mobile home) exhibit only a slight preference for acompact design (see Figure 23).
FIGURE 22 PREFERENCE FOR FUTURE HOME BUILDING & NEIGHBORHOOD DESIGN
4240 40
28
44
39
5149
47
57
5052
0
10
20
30
40
50
60
70
18 to 24 25 to 34 35 to 44 45 to 54 55 to 64 65+
Age
Perc
en
tag
e o
f A
du
lt R
esid
en
ts
More spread-out design
More compact design

Smart G
rowth vs. Spraw
l
True North Research, Inc. © 2005 35SANDAG. . . . . . . . . . . . . . . .
FIGURE 23 PREFERENCE FOR FUTURE HOME BUILDING & NEIGHBORHOOD DESIGN BY HOME TYPE
34
4446 47
58
49
4344
0
10
20
30
40
50
60
70
Single familydetached
Apartment Condominium Mobile home
Home Type
Perc
en
tag
e o
f A
du
lt R
esid
en
ts
More spread-out design
More compact design

Com
mute Behavior
True North Research, Inc. © 2005 36SANDAG. . . . . . . . . . . . . . . .
C O M M U T E B E H A V I O R
Although much of the regionwide survey focused on the attitudes of residents as they relate toissues and policy-related matters, the study was also designed to accurately profile residentbehaviors that are relevant to SANDAG. One such set of behaviors that is particularly relevant ishow residents travel within the region, including mode choice and commute distance.
USE OF TRANSIT The first question in this series asked respondents whether, in the 12months prior to the survey, they had used public transit in the San Diego region. For those whoindicated that they had, the interviewer probed to determine which forms of transit they used.
Question 17 Have you used public transit, including the Trolley, Bus, Train, or other transitservices in the San Diego region within the past 12 months?
FIGURE 24 USED PUBLIC TRANSIT IN PAST 12 MONTHS: 2005 & 2002
Figure 24 shows—for both the presentstudy and the 2002 survey—the percent-age of respondents who indicated thatthey had used public transit in the regionduring the past 12 months. Overall, justover half (53%) of those who participatedin the 2005 survey reported that they hadused transit during this period, comparedto 48% in 2002.
Past research has shown that althoughapproximately half of the adult residentsin the region have ridden transit withinthe past 12 months, most of these riderscan be classified as occasional users oftransit—meaning that they ride transittwo to three times per month or less
often. A substantial percentage of the occasional riders use transit exclusively for access to spe-cial events like Padres games, Chargers games or Street Scene. Among all adult residents,approximately 9% can be classified as frequent transit users, meaning that they ride transit at
least once per week.20
Moreover, as the reader might expect, use of public transit can vary substantially across demo-graphic subgroups. Figure 25 on the next page shows how use of transit varies by age, ethnicity,household income, commute status and homeownership. Although small to modest differencesin transit use were apparent within age, commute and homeownership categories, the most pro-nounced differences appeared within ethnicity and household income categories. When com-pared to the average respondent, transit use was much more common among African-Americans
20.In addition to the results that are presented in this report, the reader can find more detailed information about transit use in the San Diego region by consulting the 2003 San Diego Region Transit Public Opinion Survey, which was prepared by True North for SANDAG.
4853
0
10
20
30
40
50
60
2005 2002
St udy Year
Perc
en
tag
e o
f A
du
lt R
esid
en
ts

Com
mute Behavior
True North Research, Inc. © 2005 37SANDAG. . . . . . . . . . . . . . . .
(76%) and much less common among Asian-Americans (31%). Transit use was also substantiallygreater among individuals whose annual household income exceeds $75,000.
When reviewing the results shown in Figure 25, it is important to keep in mind that the figurecombines the three main types of transit in the region—bus, trolley and Coaster. Moreover, pastresearch has shown that the typical rider profiles vary substantially by type of transit. When com-pared to transit riders who primarily use the bus, for example, users of the Coaster are moreeducated, have substantially higher family incomes, are more likely to be employed full-time,
and are more likely to have regular access to a personal vehicle.21
FIGURE 25 USED PUBLIC TRANSIT IN PAST 12 MONTHS: DEMOGRAPHIC BREAKDOWN
Although the majority of respondents had ridden transit in the region during the 12 monthsprior to the survey, some forms of transit were more commonly used than others. Figure 26 onthe next page shows the percentage of respondents who indicated that they used each type oftransit—trolley, bus and Coaster train—in 2005 and 2002. The trolley remains the most com-monly used form of transit, having been ridden at least once by nearly 40% of residents in thepast year. Approximately 24% of residents reported that they had used the bus in 2005, downslightly (but not significantly) from 27% in 2002. The percentage of residents who indicated thatthey had ridden the Coaster train at least once in the past year increased to 14% in 2005, upfrom 10% in 2002.
21.See the 2003 San Diego Region Transit Public Opinion Survey.
55
52 5
9
45 47 5
3 54
76
31
52 54 55
48
43
66
59
57
54
51 55
5155
0
10
20
30
40
50
60
70
80
90
100
18
to
24
25
to
34
35
to
44
45
to
54
55
to
64
65
+
Cau
casi
an
Lati
no
Afr
ican
-Am
eric
an
Asi
an-A
mer
ican
Mix
ed /
Oth
er
Less
th
an $
25K
$2
5K
to
$3
5K
$3
5K
to
$5
0K
$5
0K
to
$7
5K
$7
5K
to
$1
00
K
$1
00
K t
o $
15
0K
Mo
re t
han
$1
50
K
Yes No
Ren
t
Ow
n
Age Ethnic ity Household income RegularlyCommute
HomeOwnership
Status
Perc
en
tag
e o
f A
du
lt R
esid
en
ts
Overall Yes (53%)

Com
mute Behavior
True North Research, Inc. © 2005 38SANDAG. . . . . . . . . . . . . . . .
FIGURE 26 PUBLIC TRANSIT USE IN PAST 12 MONTHS: 2005 & 2002
COMMUTE STATUS & MODE Having gauged whether residents had ridden transit duringthe past year, the survey next focused on commute-related questions. The first of these ques-tions simply asked whether the respondent commutes on a regular basis for a job or to school.
Question 18 Do you commute on a regular basis for your job or school?
FIGURE 27 COMMUTE ON REGULAR BASIS: 2005 & 2002
† Statistically significant difference between 2002 to 2005 at p < .05.
0
10
27
38
24
14
1
40
0 10 20 30 40 50
Other
Train
Bus
Trolley
Percent age of Adult Resident s
2005
2002
Work45
School 7
Both 6
Do not commute41
Work45
School 5
Both 10†
Do not commute40
0
10
20
30
40
50
60
70
80
90
100
2005 2002
St udy Year
Perc
en
tag
e o
f A
du
lt R
esid
en
ts
Refused
Do not commute
Both
School
Work

Com
mute Behavior
True North Research, Inc. © 2005 39SANDAG. . . . . . . . . . . . . . . .
Figure 27 presents the results to Question 18 for 2005 and 2002. For the most part, little haschanged in the past three years. Forty-five percent (45%) of residents indicated that they regu-larly commute to work, 5% to school, and 40% stated that they do not commute. The one notablechange is the increase in the percentage of respondents that commute to both work and school(up significantly from 6% in 2002 to 10% in 2005).
Respondents who reported that they did commute on a regular basis to work and/or school wereasked several follow-up questions about their commute. The first of these questions (Question19) asked the respondent to identify the type of transportation they primarily use when com-muting. By far the most common response was solo driving (79%), followed by carpooling (7%),the bus (7%), and the trolley (2%). Overall, 9% reported that they primarily use transit (bus, Trol-ley or Coaster) for their commute. When compared to the 2002 results, the percentage ofrespondents who indicated that they primarily carpool was significantly lower (see Figure 28),
which is consistent with the national trend in carpooling.22 The reasons for the decline in SanDiego could be related to increased congestion and the lack of an integrated system of HOV
lanes.23
Question 19 What form of transportation do you primarily use to get to work / school?
FIGURE 28 PRIMARY FORM OF TRANSPORTATION FOR COMMUTE: 2005 & 2002
† Statistically significant difference between 2002 to 2005 at p < .05.
22.See the 2003 American Community Survey, prepared by the Census Bureau.23.The presence of HOV lanes represents a key incentive for commuters to carpool, as the lanes can reduce the
time that commuters spend reaching their destinations. Studies by SANDAG of the I-15 managed lanes as well as those completed in other areas have shown that the introduction of carpool lanes leads to a general increase in vehicle occupancy rates (see HOV Performance Program Evaluation Report, prepared in 2002 by Parsons Brinckerhoff for the Los Angeles County MTA). When an integrated system of HOV lanes is absent, however, a key incentive is lost. Moreover, as congestion has increased in recent years, the time penalties associated with carpooling in the absence of HOV lanes can also increase—creating a greater disincentive for carpooling.
1
0
0
1
0
0
3
7
11
76
7†
1
2
0
1
1
1
2
7
79
0 10 20 30 40 50 60 70 80 90 100
Other
Vanpool
Train / Coaster
Bicycle
Motorcycle
Walk / jog
Trolley
Bus
Carpool
Drive alone
Percent age of Adult Resident s who Commut e t o Work / School
2005
2002

Com
mute Behavior
True North Research, Inc. © 2005 40SANDAG. . . . . . . . . . . . . . . .
Because commuters can use multiple forms of transportation—in the same day and/or acrossdays—when commuting to work or school, the survey also inquired about whether the respon-dent uses any other forms of transportation and, if yes, which forms. Among regular commuters,just 18% indicated that they use forms of transportation other than their primary mode whencommuting to work or school (see Figure 29). Moreover, as shown in Figure 30, the secondmode most commonly used (among those who reported a second mode) is driving solo (82%),thus indicating that commuters who primarily commute using an alternative mode are the most
likely to report using a second mode.24
Question 20 Do you use any other forms of transportation to get to work / school?
FIGURE 29 USE OTHER FORMS OF TRANSPORTATION FOR COMMUTE
Question 21 What other forms of transportation do you use to get to work / school?
FIGURE 30 SECONDARY FORMS OF TRANSPORTATION FOR COMMUTE: 2005 & 2002
24. Since commuters who primarily drive solo can not also appear in the ‘drive alone’ category in Figure 30, those who drive solo as their ‘other’ form of transportation must come from other primary mode categories.
Yes18%
No82%
2
3
2
3
4
4
10
15
12
79
11
2
4
1
1
3
4
6
9
82
0 10 20 30 40 50 60 70 80 90 100
Other
Vanpool
Train / Coaster
Motorcycle
Walk / jog
Bicycle
Trolley
Carpool
Bus
Drive alone
Percent age of Adult Resident s use More t han One Mode
2005
2002

Com
mute Behavior
True North Research, Inc. © 2005 41SANDAG. . . . . . . . . . . . . . . .
COMMUTE TIME, LOCATION & DISTANCE Commuters were also asked to indicatethe time of day they leave their home to go to work or school, the location of the commute des-tination, the distance of their commute in miles, as well as the length of time it typically takesthem to complete the commute. Just under half (47%) of residents start their commute duringthe morning peak (6am to 9am). A substantial percentage (20%) also start their commute in theafternoon/early evening hours between noon and 7pm (see Figure 31). In terms of commute des-tination, most respondents (53%) provided a destination ZIP code that fell within the Centralplanning area of the County, followed by 14% in East County, 13% in North County Inland, 10% in
North County Coastal, 7% in the South area of the County, and 4% commute out of the region.25
Question 22 On a typical day, what time do you leave home to go to work / school?
FIGURE 31 TIME OF DEPARTURE FOR COMMUTE TO WORK / SCHOOL
25.These results are based on respondents who were able to provide a viable ZIP code for their commute desti-nation.
0
16
15
4
7
12
18
17
11
0 10 20
Refused
8:00pm to 3:00am
4:00pm to 6:59pm
12:00pm to 3:59pm
9:00am to 11:59pm
8:00am to 8:59am
7:00am to 7:59am
6:00am to 6:59am
3:00am to 6:00am
Percent age of Adult Resident s who Commut e t o Work / School

Com
mute Behavior
True North Research, Inc. © 2005 42SANDAG. . . . . . . . . . . . . . . .
Question 23 What is the ZIP code at your work / school?
FIGURE 32 GEOGRAPHIC AREA OF COMMUTE DESTINATION
For the interested reader, Table 2 depicts the relationship between planning area of residenceand commute destination for regular commuters in the region. Reading within rows, the num-bers indicate the percentage of residents who reside in the area indicated to the left of the tablewho also commute to the area identified in the column. Thus, for example, 52% of residents wholive in the North County Coastal area also work or go to school in the same area, whereas 16%commute to North County Inland, 19% commute to the Central region, 2% commute to the Southarea, 5% commute to East County, and 7% commute out of the region. For all but one area(South) the majority of residents live and work in the same area.
TABLE 2 GEOGRAPHIC AREA OF RESIDENCE BY GEOGRAPHIC AREA OF COMMUTE
Describing their commute in miles, approximately one-third (31%) of commuters indicated thatthey travel less than 10 miles, one-third travel between 10 and 19 miles (32%), and the remain-der travel more than 20 miles or were not sure (see Figure 33).
Question 24 In miles, what is the approximate distance between your home and your work /school?
East County13%
Out of Region4%
South7%
Central53%
North CountyCoastal
10%
North CountyInland13%
North County Coastal
North County Inland Central South East County Out of Region
North County Coastal 52% 16% 19% 2% 5% 7%North County Inland 17% 51% 24% 0% 4% 4%
Central 2% 6% 83% 1% 3% 4%South 0% 2% 43% 47% 4% 4%
East County 1% 2% 40% 4% 51% 1%Geo
gra
phic
A
rea
of
Res
iden
ce
Geographic Area of Commute for Work / School

Com
mute Behavior
True North Research, Inc. © 2005 43SANDAG. . . . . . . . . . . . . . . .
FIGURE 33 DISTRIBUTION OF MILES FOR COMMUTE TO WORK / SCHOOL
When asked how long their commute to work or school typically takes, 19% stated it takes lessthan 15 minutes, 40% reported that it takes between 15 minutes and 29 minutes, 20% offeredthat it takes between 30 and 44 minutes, and 19% commute 45 minutes or longer on a typicalday (see Figure 34). When compared to 2002, the average commute time among survey partici-pants increased slightly from 25 minutes to 28 minutes—although this difference is not statisti-cally significant (see Figure 35).
Question 25 In minutes, how long does it typically take you to commute from your home towork / school?
FIGURE 34 DISTRIBUTION OF MINUTES FOR COMMUTE TO WORK / SCHOOL
Not sure5%
30 or more14%
20 to 2918%
Fewer than 1031%
10 to 1932%
Not sure1%
45 or more19%
30 to 4420%
Fewer than 1519%
15 to 2940%

Com
mute Behavior
True North Research, Inc. © 2005 44SANDAG. . . . . . . . . . . . . . . .
FIGURE 35 MEAN MINUTES FOR COMMUTE TO WORK / SCHOOL: 2005 & 2002
For the interested reader, Figure 36 presents the average commute distance and commute timereported by respondents according to the planning area in which they reside (see Figure 1 formap of regions). East County residents reported the least difference between the distance andtime it takes to complete their commute, whereas residents of South County reported the slowestcommute given the length of the average trip. The overall longest commutes in both distanceand time were reported by residents in the North County Coastal area.
2528
2005 2002
St udy Year
Mean
Min
ute
s f
or
Co
mm
ute
to
Wo
rk /
Sch
oo
l

Com
mute Behavior
True North Research, Inc. © 2005 45SANDAG. . . . . . . . . . . . . . . .
FIGURE 36 AVERAGE MILES & AVERAGE MINUTES FOR COMMUTE TO WORK / SCHOOL BY AREA OF REGION
Avg
. M
iles
12.9
4
Avg
. M
iles
15.7
6
Avg
. M
iles
18.9
7
Avg
. M
inute
s 3
5.1
5
Avg
. M
inute
s 3
0.7
6
Avg
. M
inute
s 2
4.0
7
Avg
. M
inute
s 3
0.4
6
Avg
. M
inute
s 2
6.6
9
Avg
. M
iles
20.7
9
Avg
. M
iles
17.9
9
North CountyCostal
North CountyInland
Central South East County
Area of Region

Carpooling &
Bicycling
True North Research, Inc. © 2005 46SANDAG. . . . . . . . . . . . . . . .
C A R P O O L I N G & B I C Y C L I N G
RideLink is one of several mobility management programs that SANDAG administers to encour-age and facilitate the use of alternative commute modes, including carpooling, vanpooling, tran-sit and bicycles. By reducing the number of solo drivers, the RideLink program is designed toreduce congestion and its negative impacts on the region.
To aid RideLink’s marketing strategies, the regionwide survey included several new questions in2005 to measure residents’ attitudes about carpooling and identify some of the barriers thatmay prevent them joining a carpool. The first of these questions simply asked all commuterswho do not already carpool or vanpool and commute at least 30 minutes on average to identifythe primary reason they choose not to carpool. This question was asked in an open-ended andexploratory manner, allowing respondents to offer any answer that made sense to them. Theverbatim responses were later reviewed by True North and grouped into the categories shown inFigure 37.
The most commonly mentioned reason for choosing not to carpool was that the respondent hadno one to carpool with (38%). A substantial percentage of commuters indicated that the demandsof their job or school pose a barrier to carpooling, including the need for travel while on the job(20%), inconsistent hours (10%), and a need for flexibility (4%). An additional 10% of respondentsindicated that carpooling is too inconvenient for them and/or would not save them time (10%),whereas 5% stated flatly that they prefer to drive alone.
Question 26 Earlier you indicated that you do not carpool when you travel to work / school.What is the primary reason why you choose not to carpool?
FIGURE 37 PRIMARY REASON FOR CHOOSING NOT TO CARPOOL
2
3
4
4
5
5
10
10
20
38
0 10 20 30 40 50
Have used just not frequently
Do not have car
Prefer public transit
Need for flexibility in schedule
Other
Prefer to drive alone
Inconvenient / would not save time
Inconsistent work or school hours
Job involves travel / independent contractor
No one to carpool with
Percent age of Adult Resident s who do not Carpool / Vanpooland Have Commute of 30+ mins

Carpooling &
Bicycling
True North Research, Inc. © 2005 47SANDAG. . . . . . . . . . . . . . . .
Next, these same commuters were presented with several attitudinal statements about carpool-ing and asked to indicate their level of agreement with each statement. Truncated versions of thestatements tested, as well as commuters’ responses to each statement, are shown in Figure 38.Among all regular commuters who do not already carpool or vanpool, 75% agreed with the state-ment, “I would join a carpool if I found someone whose scheduled matched mine”, although manyrespondents also qualified this by agreeing with the statement, “I would not feel comfortable car-pooling with a stranger” (60%). The majority of respondents also perceived downsides to car-pooling and/or did not perceive some of the potential benefits. Over two-thirds (71%) agreedthat, “being part of a carpool is too restricting. I need the freedom and flexibility to go when andwhere I want”, whereas just 39% agreed that, “If I joined a carpool, I would get to work/schoolmuch faster because I could use the carpool lanes”.
Question 27 As I read the following statements about carpooling, please indicate whether youagree or disagree with each statement.
FIGURE 38 AGREEMENT WITH STATEMENTS ABOUT CARPOOLING
Because carpool lanes are not prevalent throughout the region, one could expect that residentsin different parts of the region may view the benefits of carpooling differently—especially interms of their ability to improve their commute times. This was indeed the case. As shown inFigure 39, residents in South County feel better served by carpool lanes than their counterpartsand were more likely to agree that they would get to work or school much faster if they joined acarpool.
22
42
41
47
16
18
30
28
5 15
23
18
9
41
16
10
15
0 10 20 30 40 50 60 70 80 90 100
Carpooling would be fasterbecause of carpool lanes
Would not feel comfortablecarpooling w ith stranger
Carpooling too restricting --need flexibility
Would join carpool if foundperson w ith similar schedule
Percent age of Adult Resident s who Commut e t o Work / School
Strongly agree Somewhat agree Neutral / No opinion Somewhat disagree Strongly disagree
75%
60%
24%
39%
71%
56%39%
28%

Carpooling &
Bicycling
True North Research, Inc. © 2005 48SANDAG. . . . . . . . . . . . . . . .
FIGURE 39 AGREE THAT CARPOOLING IS FASTER BECAUSE OF CARPOOL LANES BY AREA OF REGION
The final question in this series asked all residents whether they have ridden a bicycle on localstreets for recreation or to commute in the 12 months prior to the interview. Twenty-nine per-cent (29%) of residents indicated that they had ridden a bicycle during this period.
Question 28 In the past 12 months, have you ridden a bicycle on local streets for recreation orto commute?
FIGURE 40 RODE BICYCLE ON LOCAL STREETS IN PAST 12 MONTHS
20
36
17
10
15
16
15
23
2523
0
10
20
30
40
50
60
North CountyCostal
North CountyInland
Central South East County
Area of Region
Perc
en
tag
e o
f A
du
lt R
esid
en
ts w
ho
C
om
mu
te t
o W
ork
/ S
cho
ol
Somewhat agree
Strongly agree
No71%
Yes29%
Refused0%

Housing &
Com
mute C
hoices
True North Research, Inc. © 2005 49SANDAG. . . . . . . . . . . . . . . .
H O U S I N G & C O M M U T E C H O I C E S
For the past two decades, housing construction has not kept pace with demand for housing inthe San Diego region. The result has been what many view as a housing crisis. San Diego is reg-ularly ranked among the least affordable housing markets in the nation, with the price of themedian home far exceeding that which can be afforded by the median family income. The lack ofavailable and affordable homes in San Diego forces many would-be home buyers and renters tofind homes far away from their job—often outside the region—resulting in longer commutes,increased energy consumption, greater traffic congestion and air pollution, and a general decline
in the quality of life for those who live and work in the region.26
TRADE-OFFS Several questions in the survey focused on residents’ housing choice, as wellas the relationship between their commute and decisions they have and/or are willing to makewith respect to housing. The first question in this series was presented only to residents whoregularly commute more than 30 minutes to work or school. Question 29 focused on the trade-offs that residents would be willing to make in order to reduce their commute time to less than30 minutes. Each of the trade-offs, as well as respondents’ answers, are shown in Figure 41.
Question 29 If you could have a commute time of less than 30 minutes, would you be willing to_____?
FIGURE 41 TRADE-OFFS FOR COMMUTE OF FEWER THAN 30 MINUTES
Residents’ willingness to make trade-offs to reduce their commute varied substantially depend-ing on the nature of the trade-off. Nearly 80% of those who regularly commute over 30 minutesto work or school would be willing to telecommute if their employer would allow it, and 54% indi-
26.For more information on the housing crisis, see SANDAG’s report Solving the San Diego Region’s Housing Crisis. To better understand how the housing crisis has created an interregional jobs/housing imbalance, visit the I-15 Interregional Partnership’s website (www.i15irp.com) for reports and information.
13
24
25
54
79
84
73
71
42
18
3
3
3
4
4
0 10 20 30 40 50 60 70 80 90 100
Move to a 25% moreexpensive home
Take a job w ith a 15% paycut
Move to a 25% smaller home
Pay to use a toll road
Work from home if employerallowed
Percent age of Adult Resident s who and Have Commut e of 30+ mins
Yes No Not sure / Refused
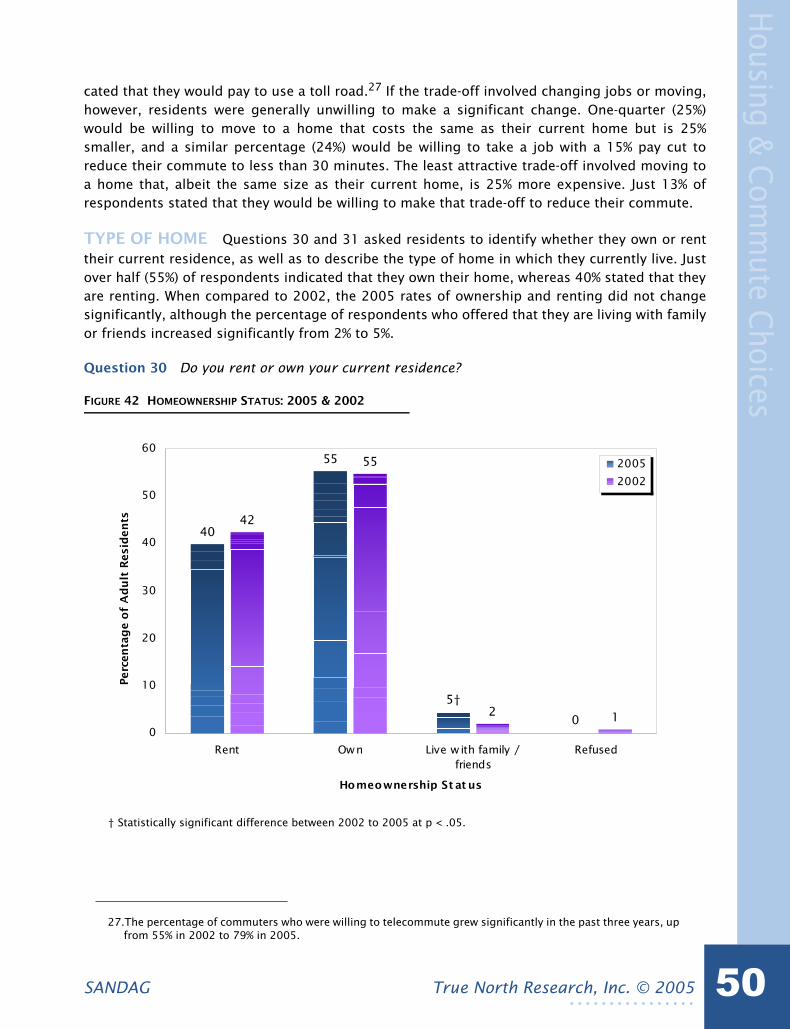
Housing &
Com
mute C
hoices
True North Research, Inc. © 2005 50SANDAG. . . . . . . . . . . . . . . .
cated that they would pay to use a toll road.27 If the trade-off involved changing jobs or moving,however, residents were generally unwilling to make a significant change. One-quarter (25%)would be willing to move to a home that costs the same as their current home but is 25%smaller, and a similar percentage (24%) would be willing to take a job with a 15% pay cut toreduce their commute to less than 30 minutes. The least attractive trade-off involved moving toa home that, albeit the same size as their current home, is 25% more expensive. Just 13% ofrespondents stated that they would be willing to make that trade-off to reduce their commute.
TYPE OF HOME Questions 30 and 31 asked residents to identify whether they own or renttheir current residence, as well as to describe the type of home in which they currently live. Justover half (55%) of respondents indicated that they own their home, whereas 40% stated that theyare renting. When compared to 2002, the 2005 rates of ownership and renting did not changesignificantly, although the percentage of respondents who offered that they are living with familyor friends increased significantly from 2% to 5%.
Question 30 Do you rent or own your current residence?
FIGURE 42 HOMEOWNERSHIP STATUS: 2005 & 2002
† Statistically significant difference between 2002 to 2005 at p < .05.
27.The percentage of commuters who were willing to telecommute grew significantly in the past three years, up from 55% in 2002 to 79% in 2005.
0
42
55
2 15†
40
55
0
10
20
30
40
50
60
Rent Own Live w ith family /friends
Refused
Homeownership St at us
Perc
en
tag
e o
f A
du
lt R
esid
en
ts
2005
2002

Housing &
Com
mute C
hoices
True North Research, Inc. © 2005 51SANDAG. . . . . . . . . . . . . . . .
By far the most common type of home among respondents was the single-family detached home(65%), followed by an apartment (19%), condominium (11%) and mobile home (4%). When com-pared to 2002, the percentage of respondents who reported that they were living in a single-fam-ily detached home increased significantly from 59% to 65%, whereas the percentage living in anapartment decreased significantly from 25% to 19%.
Question 31 Which of the following best describes your current home?
FIGURE 43 HOME TYPE: 2005 & 2002
† Statistically significant difference between 2002 to 2005 at p < .05.
FACTORS IN HOME SELECTION Respondents who owned their current residence orwere renting were next asked to think about what factors they considered when choosing theircurrent home. They were then presented with a series of factors, one-at-a-time, and asked toindicate whether the factor was a very strong factor, a moderate factor, or not a factor in choos-ing their home. The responses to this question were coded according to the scale shown at thebottom of Figure 44, with not a factor=0, moderate factor=1 and strong factor=2. All responseswere pooled and averaged for each factor to arrive at the mean scores shown in the figure. Inaddition to presenting the results of this question for the current study and the prior 2002regionwide survey, for comparison Figure 44 also includes the results from a survey of westernRiverside County residents who regularly commute south on the I-15 into the San Diego region
for work or school.28
28.See the 2002 Jobs/Housing Imbalance Survey prepared for the I-15 Interregional Partnership for more infor-mation on the survey of western Riverside County residents.
41
59
25
12
40
19†
65†
12
0
10
20
30
40
50
60
70
Single-familydetached
Apartment Condominium Mobile home Refused
Home Type
Perc
en
tag
e o
f A
du
lt R
esid
en
ts
2005
2002
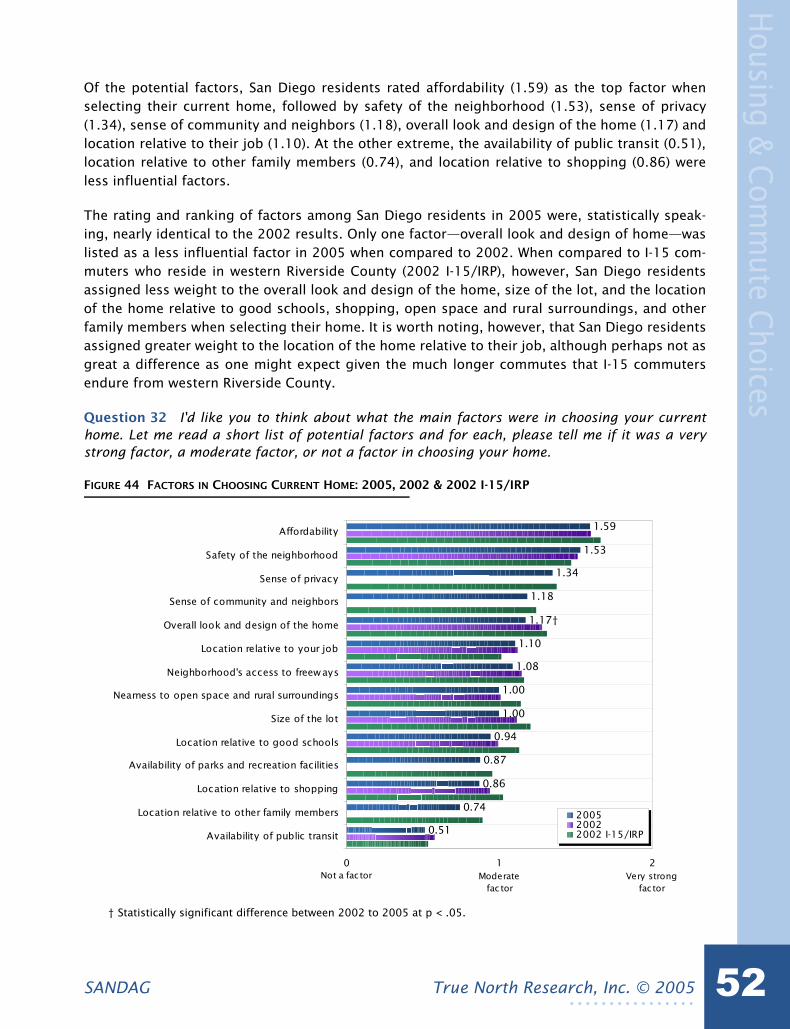
Housing &
Com
mute C
hoices
True North Research, Inc. © 2005 52SANDAG. . . . . . . . . . . . . . . .
Of the potential factors, San Diego residents rated affordability (1.59) as the top factor whenselecting their current home, followed by safety of the neighborhood (1.53), sense of privacy(1.34), sense of community and neighbors (1.18), overall look and design of the home (1.17) andlocation relative to their job (1.10). At the other extreme, the availability of public transit (0.51),location relative to other family members (0.74), and location relative to shopping (0.86) wereless influential factors.
The rating and ranking of factors among San Diego residents in 2005 were, statistically speak-ing, nearly identical to the 2002 results. Only one factor—overall look and design of home—waslisted as a less influential factor in 2005 when compared to 2002. When compared to I-15 com-muters who reside in western Riverside County (2002 I-15/IRP), however, San Diego residentsassigned less weight to the overall look and design of the home, size of the lot, and the locationof the home relative to good schools, shopping, open space and rural surroundings, and otherfamily members when selecting their home. It is worth noting, however, that San Diego residentsassigned greater weight to the location of the home relative to their job, although perhaps not asgreat a difference as one might expect given the much longer commutes that I-15 commutersendure from western Riverside County.
Question 32 I'd like you to think about what the main factors were in choosing your currenthome. Let me read a short list of potential factors and for each, please tell me if it was a verystrong factor, a moderate factor, or not a factor in choosing your home.
FIGURE 44 FACTORS IN CHOOSING CURRENT HOME: 2005, 2002 & 2002 I-15/IRP
† Statistically significant difference between 2002 to 2005 at p < .05.
0.51
0.74
0.86
0.87
0.94
1.00
1.00
1.08
1.10
1.18
1.34
1.53
1.17†
1.59
0 1 2
Availability of public transit
Location relative to other family members
Location relative to shopping
Availability of parks and recreation facilities
Location relative to good schools
Size of the lot
Nearness to open space and rural surroundings
Neighborhood's access to freeways
Location relative to your job
Overall look and design of the home
Sense of community and neighbors
Sense of privacy
Safety of the neighborhood
Affordability
200520022002 I-15/IRP
Not a factor Moderate fac tor
Very strong factor

Housing &
Com
mute C
hoices
True North Research, Inc. © 2005 53SANDAG. . . . . . . . . . . . . . . .
Figure 45 shows how those who own their home differed from renters in 2005 when selectingtheir current residence. When compared to their renter counterparts, home owners assignedsubstantially greater weight to the safety of the neighborhood, sense of privacy, overall look anddesign of home, the location of the home relative to open space and rural surroundings, and thesize of the lot when selecting their residence. Renters, on the other hand, assigned substantiallygreater weight to the location of the home relative to their job, shopping and public transit.
FIGURE 45 FACTORS IN CHOOSING CURRENT HOME BY HOMEOWNERSHIP STATUS
MOVING HISTORY Question 33 begins a series of questions that addressed the movinghistory of respondents, including their length of residence in the San Diego region, how recentlythey moved to the region, from where they moved, and their reasons for moving.
Consistent with the results of the 2002 survey, most participants (62%) in the 2005 surveyreported that they had lived in the San Diego region at least 15 years (see Figure 46), althoughresidents who moved to the region within the past year were less common in 2005 when com-pared to 2002. For residents who had moved to the region within the past 10 years, nearly half(45%) indicated that they had moved to San Diego from another state (see Figure 47). When com-pared to 2002, the proportion of residents who indicated that they originally moved to San Diegofrom the neighboring counties of Los Angeles (10%), Orange (3%), San Bernardino (3%) and River-side (2%) remained consistent. The proportion who indicated they moved to the region fromanother country (19%) increased significantly, whereas those moving from a California Countyother than the four previously identified declined significantly (16%).
0.68
0.76
0.96
0.90
0.95
0.77
0.84
1.05
1.26
0.95
1.11
1.14
1.35
1.61
0.85
0.98
1.22
1.48
1.65
1.58
1.34
1.11
1.10
1.16
0.93
0.79
0.72
0.38
0 1 2
Availability of public transit
Location relative to other family members
Location relative to shopping
Availability of parks and recreation facilities
Location relative to good schools
Size of the lot
Nearness to open space and rural surroundings
Neighborhood's access to freeways
Location relative to your job
Overall look and design of the home
Sense of community and neighbors
Sense of privacy
Safety of the neighborhood
Affordability
HomeownerRenter
Not a factor Moderate factor
Very strong factor

Housing &
Com
mute C
hoices
True North Research, Inc. © 2005 54SANDAG. . . . . . . . . . . . . . . .
Question 33 How many years have you lived in the San Diego region?
FIGURE 46 YEARS IN SAN DIEGO REGION
† Statistically significant difference between 2002 to 2005 at p < .05.
Question 34 Did you move to the San Diego region from Orange County, Los Angeles County,Riverside County, San Bernardino County, another county in California, another state, oranother country?
FIGURE 47 AREA MOVED FROM: 2005 & 2002
† Statistically significant difference between 2002 to 2005 at p < .05.
1310
62
25
1410 10
58
2†1†
11
0
10
20
30
40
50
60
70
Less than 6months
6 months toless than 1
year
1 year to lessthan 5 years
5 years toless than 10
years
10 years toless than 15
15 years orlonger
Years in San Diego Region
Perc
en
tag
e o
f A
du
lt R
esid
en
ts2005
2002
9
27
8
41
2
3
10
5
2
23
19†
16†
45
0 10 20 30 40 50
Riverside County
San Bernardino County
Orange County
Los Angeles County
Another Californiacounty
Another country
Another state
Percent age of Adult Resident s who Moved t oSan Diego Region in Last 10 Years
2005
2002

Housing &
Com
mute C
hoices
True North Research, Inc. © 2005 55SANDAG. . . . . . . . . . . . . . . .
To better understand intra-regional moving behavior, the study included three new questions in2005. For respondents who had lived in the region for at least five years, the survey inquired asto whether in the past five years they had moved from one area of the San Diego region toanother. Approximately one-third (32%) of residents indicated that they had moved within theregion at least once during this period (see Figure 48).
Question 35 In the past five years, have you moved from one area of the San Diego region toanother?
FIGURE 48 MOVED FROM ONE AREA OF REGION TO ANOTHER IN PAST FIVE YEARS
Respondents who indicated that they had moved within the San Diego region during the past fiveyears were next asked several questions regarding why they chose to move. Question 36 pre-sented respondents with three possible reasons for moving and asked, for each, whether it wasone of the main reasons the respondent chose to move from one area of the San Diego region toanother. Nearly half (46%) of intra-regional movers indicated that getting a bigger home was oneof the main reasons they chose to move (see Figure 49). Approximately one-quarter (24%) statedthat reducing their commute—and/or the commute of another member of their household—wasone of the main reasons for moving. A change in employment for the respondent or a member oftheir household was mentioned by 18% of intra-regional movers as one of the main reasons formoving.
Approximately 38% of intra-regional movers indicated that none of the reasons included in Ques-tion 36 were among the main reasons they chose to move. For these respondents, the surveyasked a follow-up question to find out what motivated their move. The question was asked in anopen-ended manner, allowing respondents to describe their motivations for moving in their ownwords. The verbatim responses were later reviewed by True North and grouped into the catego-ries shown in Figure 50. Among these respondents, downsizing or reduced costs/rents was themost commonly mentioned reason for moving (29%), followed by a desire to be in a better loca-tion (28%). The opportunity to buy their first home (10%) and changes in their marital or employ-ment status (10%) were also listed as reasons for moving by at least 10% of respondents whoreceived the question.
Yes32%
No68%

Housing &
Com
mute C
hoices
True North Research, Inc. © 2005 56SANDAG. . . . . . . . . . . . . . . .
Question 36 Was: _____ one of the main reasons why you chose to move from one area of theSan Diego region to another?
FIGURE 49 REASON FOR MOVING WITHIN REGION IN PAST FIVE YEARS
Question 37 Why did you choose to move from one area of the San Diego region to another?
FIGURE 50 OTHER REASONS FOR MOVING WITHIN REGION IN PAST FIVE YEARS
24
46
18
75
53
81
0 10 20 30 40 50 60 70 80 90 100
Reduce commute for memberof household
Get bigger house
Change employment formember of household
Percent age of Adult Resident s who Have Moved from One Area of Region t o Anot her in Past Five Years
Yes No Refused
2
5
5
6
10
10
28
29
0 10 20 30
Closer to businesses /health care
Moved from parents'home
Better schools / closer toschool
Moved to area w ith lesscrime
Marriage / divorce /retirement
Bought first home
Better location in general/ nearer beach
Lower cost of rent /downsized home
Percent age of Adult Resident s who Have Moved from One Area ofRegion t o Anot her in Past Five Years and Said 'No ' t o All It ems in Q36

Regional Report Card
True North Research, Inc. © 2005 57SANDAG. . . . . . . . . . . . . . . .
R E G I O N A L R E P O R T C A R D
The final substantive section of the survey presented respondents with a list of five general topicareas covered in the survey and asked them to think about the present conditions and the qualityof life in the region before assigning each topic area a letter grade (A, B, C, D or F, and for gradesA through D they could specify a plus or minus). Figure 51 presents the average grades assignedby respondents in 2005, as well as 2003 and 2002 for context and trending.
Of the topic areas tested, the environment of the region—which includes the preservation ofopen space and natural habitat, protection of beaches, and air and water quality—received thehighest letter grade (B-), followed closely by crime in the region—which includes the level ofcrime, feeling safe in your neighborhood, interactions with law enforcement, as well as crimeprevention and intervention efforts (B-). The economic health of the region—including the avail-ability of jobs and job skills training programs—as well as the transportation system of theregion—which includes the freeways, local streets and roads, and the public transit system—received a letter grade of C+. Consistent with the findings of other questions in this survey, resi-dents assigned the lowest grade (C) to housing in the region, which includes the availability andaffordability of a variety of housing types.
Question 37 I would like to read you a list of five general issues that cover some of the manytopics we've discussed today. For each issue, I'd like you to think about the present conditionsand the quality of life in the region and give it a letter grade—like a school report card. You maygive an A, B, C, D, or F, and for grades A through D you may specify a plus or a minus if youwould like. And just so we are clear, an A would represent a grade of 'excellent', whereas an Fwould represent a grade of 'failing'.
FIGURE 51 REGIONAL REPORT CARD: 2005, 2003 & 2002
† Statistically significant difference between 2002 to 2005 at p < .05.* The 2003 results were collected in the 2003 San Diego Region Transit Public Opinion Survey.
B-
C+
C-
B-C+
C-
C+
C
C
C+
C+†
B-
B-†
Housing
Transportation system
Economic health
Crime
Environment
Average Grade Assigned
20052003*2002
F D C B A

Regional Report Card
True North Research, Inc. © 2005 58SANDAG. . . . . . . . . . . . . . . .
When compared to the results of the 2002 regionwide survey, residents were significantly morepositive in their assessment of the region’s environmental health, and significantly less positivein their assessment of the region’s economic health.

Dem
ographics
True North Research, Inc. © 2005 59SANDAG. . . . . . . . . . . . . . . .
D E M O G R A P H I C S
Table 3 presents demographic and background information that was collected during the 2005survey. For comparison, the demographics from the 2002 survey and for the universe of alladults in the region are also presented. Because of the sampling methodology, data collectionand weighting protocols followed in this study (see “Methodology” on page 60), the demograph-ics shown below are representative of the English and Spanish speaking adult population in theregion.
TABLE 3 DEMOGRAPHICS OF 2005 & 2002 SAMPLE COMPARED WITH UNIVERSE
* The Universe statistics were compiled from the 2000 Census and 2003 California Department of Finance pro-jections.
** The survey was offered only in English and Spanish, which explains why the language demographics aresomewhat different than the universe of all adults in the region.
2005 2002Age
18 to 24 15% 17% 15%25 to 34 21% 19% 21%35 to 44 21% 17% 21%45 to 54 17% 17% 18%55 to 64 10% 10% 11%65+ 15% 14% 15%Refused 2% 6% 0%
EthnicityCaucasian / White 62% 58% 60%Latino / Hispanic 17% 22% 23%African-American / Black 4% 5% 5%Asian-American 6% 9% 9%Mixed / Other 8% 3% 3%Refused 2% 2% 0%
Household IncomeLess than $10K 5% 4% 7%$10K to $15K 5% 4% 5%$15K to $25K 8% 8% 12%$25K to $35K 11% 12% 12%$35K to $50K 12% 15% 16%$50K to $75K 17% 14% 20%$75K to $100K 12% 9% 12%$100K to $150K 11% 7% 10%$150K to $200K 4% 2% 3%$200K or more 4% 2% 3%DK/NA/Refused 11% 24% 0%
GenderMale 48% 47% 50%Female 52% 53% 50%
Language**English 95% 96% 93%Spanish (linguistically isolated) 5% 4% 4%Other (linguistically isolated) 0% 0% 2%
Study Year Universe*

Methodology
True North Research, Inc. © 2005 60SANDAG. . . . . . . . . . . . . . . .
M E T H O D O L O G Y
The following sections outline the methodology used in the study, as well as the motivation forusing certain techniques.
QUESTIONNAIRE DEVELOPMENT Dr. McLarney of True North Research worked closelywith the SANDAG staff to develop a questionnaire that covered the topics of interest and avoidedthe many possible sources of systematic measurement error, including position-order effects,wording effects, response-category effects, scaling effects and priming. As noted in the Introduc-tion, many of the questions included in the 2005 questionnaire were copied verbatim from ques-tions in the prior regionwide survey (2002) or other studies, including the 2003 San DiegoRegion Transit Public Opinion Survey and the I-15 Interregional Partnership Jobs/Housing Surveyconducted in 2002.
Some of the questions in the survey included multiple individual items. Because asking the itemsin a set order can lead to a systematic position bias in responses, the items were asked in a ran-dom order for each respondent. Some of the questions were also presented only to a subset ofrespondents. For example, only respondents who were regular commuters were asked follow-upquestions regarding their commute. The questionnaires included with this report (see “EnglishQuestionnaire” on page 64 and “Spanish Questionnaire” on page 81) identify the skip patternsthat were used during the interview to ensure that each respondent received the appropriatequestions.
CATI & PRE-TEST Prior to fielding the survey, the questionnaire was CATI (ComputerAssisted Telephone Interviewing) programmed to assist the live interviewers when conductingthe interviews. The CATI program automatically navigates the skip patterns, randomizes theappropriate question items, and alerts the interviewer to certain types of keypunching mistakesshould they happen during the interview. The integrity of the questionnaire was pre-tested inter-nally by True North and by dialing into random homes in the San Diego region prior to formallybeginning the survey.
LANGUAGES The final survey instrument was professionally translated into Spanish andinterviews were conducted in English and Spanish, depending on the preference of the respon-dent.
SAMPLE Households within the San Diego region were chosen for this study using a randomdigit dial (RDD) sampling method. An RDD sample is drawn by first selecting all of the activephone exchanges (first three digits in a seven digit phone number) and working blocks that ser-vice the area. After estimating the number of listed households within each phone exchange thatare located within the area, a sample of randomly selected phone numbers is generated with thenumber of phone numbers per exchange being proportional to the estimated number of house-holds within each exchange in the area. This method ensures that both listed and unlistedhouseholds are included in the sample. It also ensures that new residents and new developmentshave an opportunity to participate in the study, which is not true if the sample were based on atelephone directory.

Methodology
True North Research, Inc. © 2005 61SANDAG. . . . . . . . . . . . . . . .
Although the RDD method is widely used for community surveys, the method also has severalknown limitations that must be adjusted for to ensure representative data. Research has shown,for example, that individuals with certain demographic profiles (e.g., older women) are morelikely to be at home and are more likely to answer the phone even when other members of thehousehold are available. If this tendency is not adjusted for, the RDD sampling method will pro-duce a survey that is biased in favor of women—particularly older women. To adjust for thisbehavioral tendency, the survey included a screening question which initially asked to speak tothe youngest male available in the home. If a male was not available, then the interviewer wasinstructed to speak to the youngest female currently available. This protocol was followed—tothe extent needed—to ensure a representative sample. In addition to following this protocol, thesample demographics were monitored as the interviewing proceeded to make sure they werewithin certain tolerances.
OVERSAMPLING & WEIGHTING Respondents were also initially screened regarding theZIP code of their residence to ensure that they live within the region and to identify in which ofthe five planning areas they reside (see Figure 52). To accommodate SANDAG’s interest inobtaining reliable parameter estimates for the region as a whole, as well as within the five plan-ning areas, the study employed a strategic oversample by planning area to balance the statisticalmargins of error associated with estimates at the planning area level. To adjust for the oversam-pling, the raw data were then weighted according to adult population estimates prior to analysis.The results presented in this report are the weighted results, which are representative at theregionwide level as well as within the five planning areas.
FIGURE 52 SURVEY UNIVERSE AND PLANNING AREAS

Methodology
True North Research, Inc. © 2005 62SANDAG. . . . . . . . . . . . . . . .
MARGIN OF ERROR DUE TO SAMPLING By using an RDD probability-based sample,monitoring the sample characteristics as data collection proceeded, and adjusting for the strate-gic oversampling through weighting, True North ensured that the resulting sample was repre-sentative of adults in the San Diego region. The results of the sample can thus be used toestimate the opinions of all adults in the region. Because not every adult in the region partici-pated in the survey, however, the results have what is known as a statistical margin of error dueto sampling. The margin of error refers to the difference between what was found in the surveyof 900 adults for a particular question and what would have been found if all of the estimated
2,267,100 adults in the region had been interviewed.29
For example, in estimating the percentage of adults who are very satisfied with the San Diegoregion as a place to live (Q1), the margin of error can be calculated if one knows the size of thepopulation, the size of the sample, a chosen confidence level, and the distribution of responsesto the question. The appropriate equation for estimating the margin of error, in this case, isshown below.
where is the proportion of residents who say they are very satisfied (0.55 for 55%, for exam-
ple), is the population size of adults (2,267,100), is the sample size that received the ques-
tion (900), and is the upper point for the t-distribution with degrees of freedom
(1.96 for a 95% confidence interval). Solving this equation using the values just discussed revealsa margin of error of +/- 3.25 percent. This means that, with 55 percent of respondents indicatingthat they are very satisfied with the region as a place to live, we can be 95 percent confident thatthe actual percentage of adults in the region who are very satisfied is between 58.25 and 51.75percent.
Figure 53 provides an approximate plot of the maximum margin of error in this study. The max-imum margin of error for a dichotomous percentage result occurs when the answers are evenly
split such that 50% provide one response and 50% provide the alternative response (i.e., =0.5).
For this survey, the maximum margin of error is approximately +/- 3.27% for questionsanswered by all 900 respondents.
Within this report, figures and tables show how responses to certain questions varied by demo-graphic characteristics such as age of the respondent and family income. Figure 53 is thus usefulfor understanding how the maximum margin of error for a percentage estimate will grow as thenumber of individuals asked a question (or in a particular subgroup) shrinks. For example, asshown in the figure, the margin of error for results within a specific planning area will varybetween +/- 6.55% and +/- 8.28%. Because the margin of error grows exponentially as the sam-ple size decreases, the reader should use caution when generalizing and interpreting the resultsfor small subgroups.
29.The estimated number of adults in the region is based on the most recent population estimates (January 2005) available from the California Department of Finance.
p̂ t N n–N
------------- p̂ 1 p̂–( )
n 1–--------------------±
p̂N n
t α 2⁄ n 1–
p̂

Methodology
True North Research, Inc. © 2005 63SANDAG. . . . . . . . . . . . . . . .
FIGURE 53 MAXIMUM MARGIN OF ERROR
DATA COLLECTION The primary method of data collection was telephone interviewing.Interviews were conducted via telephone during weekday evenings (5:30PM to 9PM) and onweekends (10AM to 5PM) between May 2 to May 20, 2005. It is standard practice not to call dur-ing the day on weekdays because most working adults are unavailable and thus calling duringthose hours would bias the sample. Interviews averaged 23 minutes in length.
For respondents who were recruited via telephone but preferred to complete the survey online, aweb version of the survey was hosted at a secure website. The web survey could only beaccessed if the respondent entered a personal identification number (PIN) that was provided tothem during the recruit. A total of 29 respondents chose to complete the survey online.
DATA PROCESSING Data processing consisted of checking the data for errors or inconsis-tencies, coding and recoding responses, categorizing open-end responses, and preparing fre-quency analyses and cross-tabulations.
ROUNDING Numbers that end in 0.5 or higher are rounded up to the nearest whole num-ber, whereas numbers that end in 0.4 or lower are rounded down to the nearest whole number.These same rounding rules are also applied, when needed, to arrive at numbers that include adecimal place in constructing figures and charts. Occasionally, these rounding rules lead tosmall discrepancies in the first decimal place when comparing tables and pie charts for a givenquestion.
Range by Planning Area+/- 6.55% to
+/- 8.28%
All Respondents900, +/- 3.27%
0%
2%
4%
6%
8%
10%
12%
14%
0 100 200 300 400 500 600 700 800 900 1000
Sample Size (Number of Respondent s)
Marg
in o
f Err
or
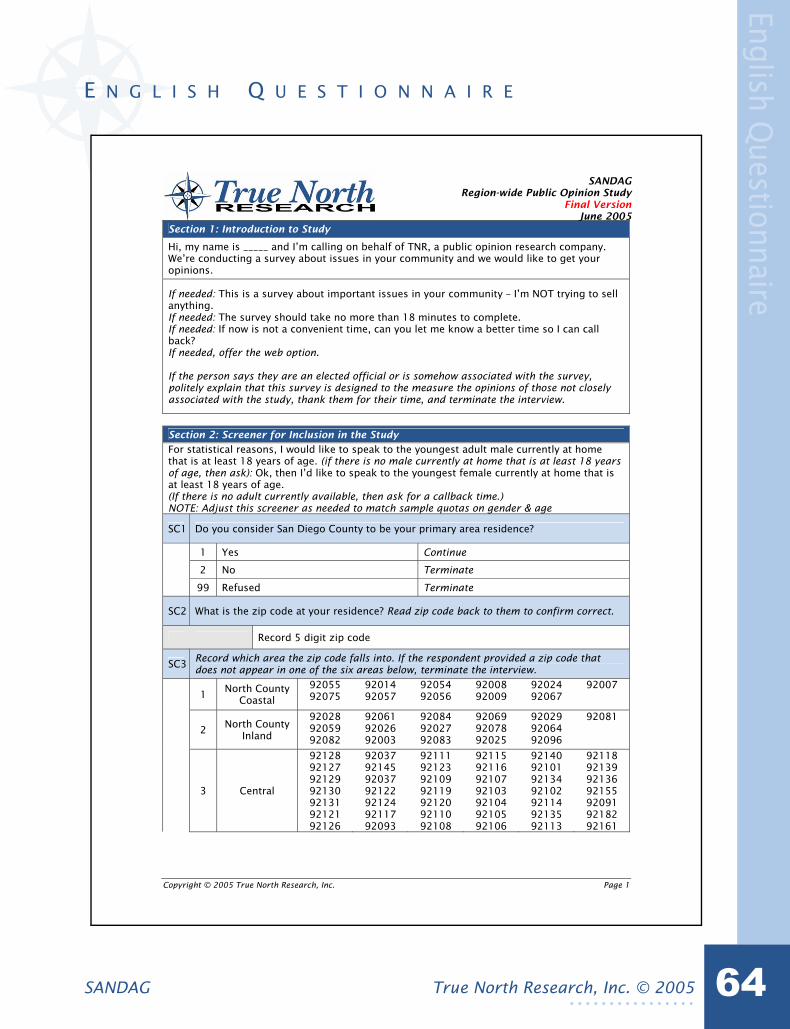
English Questionnaire
True North Research, Inc. © 2005 64SANDAG. . . . . . . . . . . . . . . .
E N G L I S H Q U E S T I O N N A I R E
Copyright © 2005 True North Research, Inc. Page 1
SANDAG Region-wide Public Opinion Study
Final Version June 2005
Section 1: Introduction to Study
Hi, my name is _____ and I’m calling on behalf of TNR, a public opinion research company. We’re conducting a survey about issues in your community and we would like to get your opinions.
If needed: This is a survey about important issues in your community – I’m NOT trying to sell anything. If needed: The survey should take no more than 18 minutes to complete. If needed: If now is not a convenient time, can you let me know a better time so I can call back? If needed, offer the web option.
If the person says they are an elected official or is somehow associated with the survey, politely explain that this survey is designed to the measure the opinions of those not closely associated with the study, thank them for their time, and terminate the interview.
Section 2: Screener for Inclusion in the Study
For statistical reasons, I would like to speak to the youngest adult male currently at home that is at least 18 years of age. (if there is no male currently at home that is at least 18 years of age, then ask): Ok, then I’d like to speak to the youngest female currently at home that is at least 18 years of age. (If there is no adult currently available, then ask for a callback time.) NOTE: Adjust this screener as needed to match sample quotas on gender & age
SC1 Do you consider San Diego County to be your primary area residence?
1 Yes Continue
2 No Terminate
99 Refused Terminate
SC2 What is the zip code at your residence? Read zip code back to them to confirm correct.
Record 5 digit zip code
SC3 Record which area the zip code falls into. If the respondent provided a zip code that does not appear in one of the six areas below, terminate the interview.
1 North County Coastal
92055 92075
92014 92057
92054 92056
92008 92009
92024 92067
92007
2 North County Inland
92028 92059 92082
92061 92026 92003
92084 92027 92083
92069 92078 92025
92029 92064 92096
92081
3 Central
92128 92127 92129 92130 92131 92121 92126
92037 92145 92037 92122 92124 92117 92093
92111 92123 92109 92119 92120 92110 92108
92115 92116 92107 92103 92104 92105 92106
92140 92101 92134 92102 92114 92135 92113
92118 92139 92136 92155 92091 92182 92161

English Questionnaire
True North Research, Inc. © 2005 65SANDAG. . . . . . . . . . . . . . . .
SANDAG Regional Study June 2005
True North Research, Inc. © 2005 Page 2
4 South 91902 91950
91913 91910
91915 91911
92154 91932
92173 91914
5 East County
92060 92004 92086 92070 92065 91934
92066 92036 92040 91916 92071 91948
91962 91901 92021 91931 92020 92019
91980 91942 91905 91941 91935 91977
91978 91945 91906 91963 91917
Section 3: Living in San Diego Region
I’d like to begin by asking you a few questions about living in the San Diego region.
Q1All things considered, how satisfied are you with the San Diego region as a place to live? Get answer, if ‘satisfied’ or ‘dissatisfied’ then ask: Would that be very (satisfied/dissatisfied) or somewhat (satisfied/dissatisfied)?
1 Very satisfied
2 Somewhat satisfied
3 Somewhat dissatisfied
4 Very dissatisfied
98 Not sure
99 Refused
Q2 In the future, do you think San Diego will be a better place to live than it is now, a worse place to live than it is now, or about the same as it is now?
1 A better place to live than it is now
2 A worse place to live than it is now
3 About the same as it is now
98 Not sure
99 Refused

English Questionnaire
True North Research, Inc. © 2005 66SANDAG. . . . . . . . . . . . . . . .
SANDAG Regional Study June 2005
True North Research, Inc. © 2005 Page 3
Q3Next, I am going to read a list of aspects of your local community and for each please tell me if you would describe the quality as excellent, good, fair, or poor. Here’s the first/next: _____
Randomize
Excell
en
t
Go
od
Fair
Po
or
No O
pin
ion
Refu
sed
A Traffic conditions on local roads 1 2 3 4 98 99
B Traffic conditions on freeways 1 2 3 4 98 99
C Public transportation 1 2 3 4 98 99
D Governmental leadership 1 2 3 4 98 99
E Overall quality of life 1 2 3 4 98 99
F User-friendliness of walkways and sidewalks 1 2 3 4 98 99
Section 4: Awareness
Ok – let me change gears a bit.
Q4 Have you ever heard of _____?
Randomize Yes
No
No
t su
re /
R
efu
sed
A SANDAG 1 2 99
B RideLink 1 2 99
C The transportation term “managed lanes” 1 2 99
Ask Q5 for each item where Q4=1. If Q4= 2 or 99 for all items, skip to Q7.
Q5 Briefly and in your own words, how would you describe_____?
A SANDAG Record description
B RideLink Record description
C Managed lanes Record description

English Questionnaire
True North Research, Inc. © 2005 67SANDAG. . . . . . . . . . . . . . . .
SANDAG Regional Study June 2005
True North Research, Inc. © 2005 Page 4
Ask Q6 for each item where Q4=1
Q6Generally speaking, would you say you have a favorable or unfavorable opinion of _____, or do you have no opinion either way? Get answer and ask: Would that be very or somewhat favorable / unfavorable?
Ver
yFa
vora
ble
Som
ewhat
Fa
vora
ble
Neu
tral
/ N
o O
pin
ion
Eith
er W
ay
Som
ewhat
U
nfa
vora
ble
Ver
yU
nfa
vora
ble
Not
Sure
(D
on’t
Rea
d)
A SANDAG 1 2 3 4 5 6
B RideLink 1 2 3 4 5 6
C Managed lanes 1 2 3 4 5 6
Section 5: Regional Priorities
Q7 What would you say is the San Diego region’s number one problem?
Record Verbatim Response – First response only
Q8
Next, I would like to be a bit more specific about the San Diego region. Let me read a list of issues and for each I would like you to tell me if you feel it is extremely important, very important, somewhat important, or not at all important for all people in the region--not just you personally.
Here’s the (first/next) one: _____. Do you think that focusing efforts on this issue is extremely important, very important, somewhat important, or not at all important?
Split Sample. Wave 1 receives items A-G. Wave 2 receives items H-M.
Randomize
Extr
em
ely
Imp
ort
an
t
Very
Imp
ort
an
t
So
mew
hat
Imp
ort
an
t
No
t at
all
Im
po
rtan
t
No O
pin
ion
Refu
sed
A Reducing traffic congestion 1 2 3 4 98 99
B Reducing crime 1 2 3 4 98 99
C Encouraging recycling 1 2 3 4 98 99
D Protecting beaches from pollution 1 2 3 4 98 99
E Providing better public transportation services 1 2 3 4 98 99
F Protecting parks, canyons, and other open space 1 2 3 4 98 99
G Keeping agricultural land 1 2 3 4 98 99
H Making housing more affordable 1 2 3 4 98 99
I Encouraging new businesses to come to San 1 2 3 4 98 99

English Questionnaire
True North Research, Inc. © 2005 68SANDAG. . . . . . . . . . . . . . . .
SANDAG Regional Study June 2005
True North Research, Inc. © 2005 Page 5
Diego
J Ensuring reliable energy sources 1 2 3 4 98 99
K Replenishing sand on the beaches 1 2 3 4 98 99
L Improving air quality 1 2 3 4 98 99
M Ensuring an adequate water supply 1 2 3 4 98 99
Q9
Thinking about the same issues that I just read, would you say you are satisfied or dissatisfied with the current efforts to: _____, or do you not have an opinion about this issue? Get answer, if ‘satisfied’ or ‘dissatisfied’ then ask: Would that be very (satisfied/dissatisfied) or somewhat (satisfied/dissatisfied)?
Split Sample. Wave 1 receives items A-G. Wave 2 receives items H-M.
Randomize
Very
Sati
sfi
ed
So
mew
hat
Sati
sfi
ed
So
mew
hat
Dis
sati
sfi
ed
Very
Dis
sati
sfi
ed
No O
pin
ion
Refu
sed
A Reduce traffic congestion 1 2 3 4 98 99
B Reduce crime 1 2 3 4 98 99
C Encourage recycling 1 2 3 4 98 99
D Protect beaches from pollution 1 2 3 4 98 99
E Provide better public transportation services 1 2 3 4 98 99
F Protect parks, canyons, and other open space 1 2 3 4 98 99
G Keep agricultural land 1 2 3 4 98 99
H Make housing more affordable 1 2 3 4 98 99
I Encourage new businesses to come to San Diego 1 2 3 4 98 99
J Ensure reliable energy sources 1 2 3 4 98 99
K Replenish sand on the beaches 1 2 3 4 98 99
L Improve air quality 1 2 3 4 98 99
M Ensure an adequate water supply 1 2 3 4 98 99

English Questionnaire
True North Research, Inc. © 2005 69SANDAG. . . . . . . . . . . . . . . .
SANDAG Regional Study June 2005
True North Research, Inc. © 2005 Page 6
Q10
Next, I am going to read you a list of statements. For each, please tell me if you agree or disagree with the statement. Do you agree or disagree that: _____. Get answer, if ‘agree’ or ‘disagree’ then ask: Would that be strongly (agree/disagree) or somewhat (agree/disagree)?
Split Sample. Wave 1 receives items A-F. Wave 2 receives items G-M.
Randomize
Str
on
gly
ag
ree
So
mew
hat
ag
ree
So
mew
hat
dis
ag
ree
Str
on
gly
d
isag
ree
No O
pin
ion
Refu
sed
A Controls on population growth hurt the economy 1 2 3 4 98 99
BDevelopers should be required to show that local and regional water supply is adequate before they can begin construction
1 2 3 4 98 99
C I am considering leaving San Diego because of changes related to growth 1 2 3 4 98 99
D New developments in the region currently pay for their share of public services 1 2 3 4 98 99
E More people living in an area means that it is a less desirable place to live 1 2 3 4 98 99
F I’m considering leaving San Diego because housing is too expensive 1 2 3 4 98 99
G The wait time at the border affects my decision to visit Mexico 1 2 3 4 98 99
HI would be willing to pay higher energy rates if it would prevent blackouts or price swings in the future
1 2 3 4 98 99
I Relations between San Diego and Mexico need to be improved 1 2 3 4 98 99
J Relations between San Diego and tribal governments need to be improved 1 2 3 4 98 99
KSan Diego needs a first class public transit system to meet the region’s increasing travel needs
1 2 3 4 98 99
L
Residents who are interested in participating in the planning and decision-making processes that affect the San Diego region have adequate opportunities and forums to do so
1 2 3 4 98 99
MThe Highway Patrol needs to enforce the carpool lanes more often so that solo drivers don’t use them
1 2 3 4 98 99
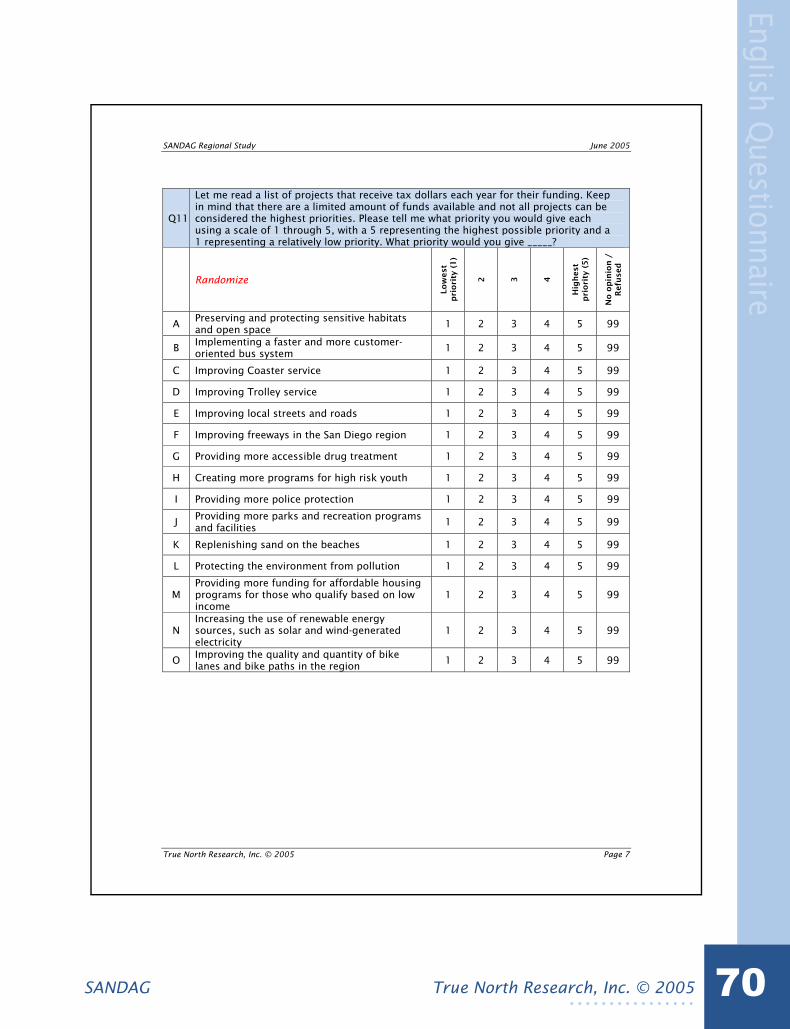
English Questionnaire
True North Research, Inc. © 2005 70SANDAG. . . . . . . . . . . . . . . .
SANDAG Regional Study June 2005
True North Research, Inc. © 2005 Page 7
Q11
Let me read a list of projects that receive tax dollars each year for their funding. Keep in mind that there are a limited amount of funds available and not all projects can be considered the highest priorities. Please tell me what priority you would give each using a scale of 1 through 5, with a 5 representing the highest possible priority and a 1 representing a relatively low priority. What priority would you give _____?
Randomize
Lo
west
pri
ori
ty (
1)
2 3 4
Hig
hest
pri
ori
ty (
5)
No
op
inio
n /
R
efu
sed
A Preserving and protecting sensitive habitats and open space 1 2 3 4 5 99
B Implementing a faster and more customer-oriented bus system 1 2 3 4 5 99
C Improving Coaster service 1 2 3 4 5 99
D Improving Trolley service 1 2 3 4 5 99
E Improving local streets and roads 1 2 3 4 5 99
F Improving freeways in the San Diego region 1 2 3 4 5 99
G Providing more accessible drug treatment 1 2 3 4 5 99
H Creating more programs for high risk youth 1 2 3 4 5 99
I Providing more police protection 1 2 3 4 5 99
J Providing more parks and recreation programs and facilities 1 2 3 4 5 99
K Replenishing sand on the beaches 1 2 3 4 5 99
L Protecting the environment from pollution 1 2 3 4 5 99
MProviding more funding for affordable housing programs for those who qualify based on low income
1 2 3 4 5 99
NIncreasing the use of renewable energy sources, such as solar and wind-generated electricity
1 2 3 4 5 99
O Improving the quality and quantity of bike lanes and bike paths in the region 1 2 3 4 5 99

English Questionnaire
True North Research, Inc. © 2005 71SANDAG. . . . . . . . . . . . . . . .
SANDAG Regional Study June 2005
True North Research, Inc. © 2005 Page 8
Section 6: Traffic
Q12
There are many possible solutions for relieving traffic congestion during the morning and afternoon rush hours. Please tell me if you feel each of the following strategies is a very effective, somewhat effective, or not at all effective approach to relieving traffic congestion. Here’s the first/next one:
Randomize
Very
Eff
ecti
ve
So
mew
hat
Eff
ecti
ve
No
t at
all
Eff
ecti
ve
No O
pin
ion
Refu
sed
A Employer-sponsored carpooling programs 1 2 3 98 99
B Flexible work hours 1 2 3 98 99
C Telecommuting 1 2 3 98 99
D Additional public transportation 1 2 3 98 99
E Building new freeways 1 2 3 98 99
F Adding lanes to existing freeways 1 2 3 98 99
G Allowing solo drivers to pay to use carpool lanes in rush hour, like the I-15 (Eye-Fifteen) FASTRAK 1 2 3 98 99
H Adding lanes to existing freeways just for carpoolers 1 2 3 98 99
I Financial incentives to encourage people to ride public transit, car pool, bike, or walk 1 2 3 98 99
J Concentrating new development that occurs near areas served by public transit 1 2 3 98 99
Q13
One approach to relieving traffic congestion on San Diego highways would be to construct additional lanes in the median that would become managed lanes. The managed lanes could be used by carpools with two or more people in the vehicle. They could also be used by solo drivers for a fee – like the Fastrak lanes on the 15 Freeway.
Do you think building additional managed lanes would be a very effective, somewhat effective or not at all effective approach to relieving traffic congestion on San Diego highways?
1 Very effective
2 Somewhat effective
3 Not at all effective
98 Not sure/No Opinion
99 Refused

English Questionnaire
True North Research, Inc. © 2005 72SANDAG. . . . . . . . . . . . . . . .
SANDAG Regional Study June 2005
True North Research, Inc. © 2005 Page 9
Q14 If you were driving by yourself, would you occasionally pay a fee to use the managed lanes during rush hour?
1 Yes
2 No
3 Depends
98 Not sure/No Opinion
99 Refused
Q15 Would you be more or less inclined to join a carpool or vanpool if managed lanes were added to local highways, or would it have no effect?
1 More inclined
2 Less inclined
3 No effect
98 Not sure/No Opinion
99 Refused
Section 7: Smart vs. Sprawl
Q16Thinking now about future home building and neighborhood design, there are two general opinions. After I read these two opinions, please tell me which is closer to your own.
Randomize statements 1 & 2. Do not read options 3, 4 or 99.
1
Smith feels that most new housing developments should continue to feature single-family homes in areas of the region that are separate from shops and office space, resulting in a more spread-out design.
2
Jones feels that new housing developments should include condos, townhouses, and apartments mixed in with shops and office space, resulting in a more compact design.
3 Neither
4 Some of both
99 Not sure / Refused

English Questionnaire
True North Research, Inc. © 2005 73SANDAG. . . . . . . . . . . . . . . .
SANDAG Regional Study June 2005
True North Research, Inc. © 2005 Page 10
Section 8: Commute Behavior
Q17Have you used public transit, including the Trolley, Bus, Train, or other transit services in the San Diego region within the past 12 months? Probe and record specific methods. Multiple responses allowed.
1 Has not used public transit in past 12 months
2 Trolley
3 Bus
4 Train / Coaster
5 Other Specify
99 Refused
Q18Do you commute on a regular basis for your job or school? If ‘yes’, ask: Would that be for work or for school? If respondent mentions ‘both’, probe for primary commute destination.
1 Yes – work
2 Yes - school
3 Both (work primary)
4 Both (school primary)
5 No Skip to Q28
99 Refused Skip to Q28
Q19What form of transportation do you primarily use to get to <<work/school>>?Reference ‘work’ if Q18=1 or 3, use ‘school’ if Q18=2 or 4. Same rules apply wherever the ‘<<work/school>>’ insert point appears.
1 Drive alone
2 Carpool
3 Vanpool
4 Bus
5 Trolley
6 Train / Coaster
7 Bicycle
8 Motorcycle
9 Walk / jog
10 Other Specify
99 Not sure / Refused Skip to Q22

English Questionnaire
True North Research, Inc. © 2005 74SANDAG. . . . . . . . . . . . . . . .
SANDAG Regional Study June 2005
True North Research, Inc. © 2005 Page 11
Q20 Do you use any other forms of transportation to get to <<work/school>>?
1 Yes Ask Q21
2 No Skip to Q22
98 Not sure Skip to Q22
99 Refused Skip to Q22
Q21 What other forms of transportation do you use to get to <<work/school>>? Multiple responses permitted.
1 Drive alone
2 Carpool
3 Vanpool
4 Bus
5 Trolley
6 Train / Coaster
7 Bicycle
8 Motorcycle
9 Walk / jog
10 Other Specify
11 No other forms of transportation used
99 Not sure / Refused
Q22 On a typical day, what time do you leave home to go to <<work/school>>? Ifrespondent unsure or says it varies, ask them to provide the most typical time.
Record time of day in military time
Q23 What is the zip code at your <<work/school>>?
Record five-digit zip code; refused = 99999
Q24 In miles, what is the approximate distance between your home and your <<work/school>>? If respondent is unsure, ask them to estimate.
Record distance in miles; refused = 999
Q25In minutes, how long does it typically take you to commute from your home to <<work/school>>? If respondent is unsure or says it varies, ask them to estimate their average commute time.
Record time in minutes; refused = 999

English Questionnaire
True North Research, Inc. © 2005 75SANDAG. . . . . . . . . . . . . . . .
SANDAG Regional Study June 2005
True North Research, Inc. © 2005 Page 12
Only ask Q26 if (neither Q19 nor Q21 = 2 or 3) AND Q25>29 minutes. Otherwise, skip to Q28.
Q26 Earlier you indicated that you do not carpool when you travel to <<work/school>>.What is the primary reason why you choose not to carpool? Do NOT read options.
Record verbatim
Q27
As I read the following statements about carpooling, please indicate whether you agree or disagree with each statement.
Here is the (first/next) one: _____. Do you agree or disagree? Get answer, if ‘agree’ or ‘disagree’ then ask: Would that be strongly (agree/disagree) or somewhat (agree/disagree)?
Read in Order
Str
on
gly
ag
ree
So
mew
hat
ag
ree
So
mew
hat
dis
ag
ree
Str
on
gly
d
isag
ree
No O
pin
ion
Refu
sed
A I would join a carpool if I found someone whose schedule matched mine 1 2 3 4 98 99
B I would not feel comfortable carpooling with a stranger 1 2 3 4 98 99
CBeing part of a carpool is too restricting. I need the freedom and flexibility to go when and where I want.
1 2 3 4 98 99
DIf I joined a carpool, I would get to <<work/school>> much faster because I could use the carpool lanes
1 2 3 4 98 99
Q28 In the past 12 months, have you ridden a bicycle on local streets for recreation or to commute?
1 Yes
2 No
98 Not sure
99 Refused

English Questionnaire
True North Research, Inc. © 2005 76SANDAG. . . . . . . . . . . . . . . .
SANDAG Regional Study June 2005
True North Research, Inc. © 2005 Page 13
Section 9: Housing & Commute Choices
Only ask Q29 if Q18=(1, 2, 3 or 4) AND Q25>30 minutes. Otherwise skip to Q30.
Q29 If you could have a commute time of less than 30 minutes, would you be willing to _____?
Read in order Yes
No
No
t su
re /
R
efu
sed
A Take a job with a 15 percent pay cut 1 2 99
B Move to a home that costs the same as your current home, but is 25 percent smaller 1 2 99
C Move to a home that is the same size as your current home, but is 25 percent more expensive 1 2 99
D Work from home if your employer would agree to it 1 2 99
E Pay to use a toll road 1 2 99
Q30 Do you rent or own your current residence?
1 Rent
2 Own
3 Live with family / friends and don’t pay rent
99 Refused
Q31 Which of the following best describes your current home?
1 Single family detached home
2 Apartment
3 Condominium
4 Mobile home
99 Refused

English Questionnaire
True North Research, Inc. © 2005 77SANDAG. . . . . . . . . . . . . . . .
SANDAG Regional Study June 2005
True North Research, Inc. © 2005 Page 14
If Q30=3 or 99, skip to Q33.
Q32
I’d like you to think about what the main factors were in choosing your current home. Let me read a short list of potential factors and for each, please tell me if it was a very strong factor, a moderate factor, or not a factor in choosing your home. Was the _____ a strong factor, moderate factor, or not a factor in your decision?
Split Sample. Wave 1 receives items A-G. Wave 2 receives items H-N..
Randomize
Very
str
on
g
facto
r
Mo
dera
tefa
cto
r
No
t a f
acto
r
No
t su
re /
R
efu
sed
A Affordability 1 2 3 99
B Size of the lot 1 2 3 99
C Location relative to your job 1 2 3 99
D Location relative to shopping 1 2 3 99
E Location relative to good schools 1 2 3 99
F Availability of public transit 1 2 3 99
G Overall look and design of the home 1 2 3 99
H Neighborhood’s access to freeways 1 2 3 99
I Location relative to open space and rural surroundings 1 2 3 99
J Safety of the neighborhood 1 2 3 99
K Location relative to other family members 1 2 3 99
L Availability of parks and recreation facilities nearby 1 2 3 99
M Sense of community and neighbors 1 2 3 99
N Sense of privacy 1 2 3 99
Q33 How many years have you lived in the San Diego region?
1 Less than 6 months Ask Q34
2 6 months to less than 1 year Ask Q34
3 1 year to less than 5 years Ask Q34
4 5 years to less than 10 years Ask Q34
5 10 years to less than 15 Skip to instructions preceding Q35
6 15 years or longer (or: my whole life) Skip to instructions preceding Q35
99 Refused Skip to instructions preceding Q35

English Questionnaire
True North Research, Inc. © 2005 78SANDAG. . . . . . . . . . . . . . . .
SANDAG Regional Study June 2005
True North Research, Inc. © 2005 Page 15
Q34Did you move to the San Diego region from Orange County, Los Angeles County, Riverside County, San Bernardino County, another county in California, another state, or another country?
1 Orange County
2 Los Angeles County
3 Riverside County
4 San Bernardino County
5 Another California County
6 Another state
7 Another country
99 Refused
Ask Q35 if Q33=4, 5 or 6. Otherwise, skip to Q38.
Q35 In the past five years, have you moved from one area of the San Diego region to another?
1 Yes Ask Q36
2 No Skip to Q38
99 Refused Skip to Q38
Q36 Was: _____ one of the main reasons why you chose to move from one area of the San Diego region to another?
Randomize Yes
No
No
t su
re /
R
efu
sed
A Reducing your commute or the commute of another member of your household 1 2 99
B Getting a bigger house 1 2 99
C A change in employment for you or another member of your household 1 2 99
If Q36a, Q36b AND Q36c=2, ask Q37. Otherwise, skip to Q38.
Q37 Why did you choose to move from one area of the San Diego region to another?
Record verbatim

English Questionnaire
True North Research, Inc. © 2005 79SANDAG. . . . . . . . . . . . . . . .
SANDAG Regional Study June 2005
True North Research, Inc. © 2005 Page 16
Section 10: Report Card
Q38
I would like to read you a list of five general issues that cover some of the many topics we’ve discussed today. For each issue, I’d like you to think about the present conditions and the quality of life in the region and give it a letter grade--like a school report card. You may give an A, B, C, D, or F, and for grades A through D you may specify a plus or a minus if you would like. And just so we are clear, an A would represent a grade of ‘excellent’, whereas an F would represent a grade of ‘failing’.
Randomize. Record grade as number, where A+ = 1, A = 2, A- = 3, B+ = 4. . . F = 13; Refused = 99
A The economic health of the region, which includes the availability of jobs and job skills training programs.
BThe transportation system of the region, which includes the freeways, local streets and roads, and the public transit system.
CThe housing in the region, which includes the availability and affordability of a variety of housing types such as condominiums, single family homes, and apartments.
DThe environment of the region, which includes the preservation of open space and natural habitat, protection of beaches, and air and water quality.
E
Crime in the region, which includes the level of crime, feeling safe in your neighborhood, interactions with law enforcement, as well as crime prevention and intervention efforts
Section 11: Background & Miscellaneous Questions
D1 In what year were you born?
Record two-digit year
D2 What ethnic group do you consider yourself a part of or feel closest to? (Read list if respondent hesitates)
1 Caucasian/White
2 Latino/Hispanic
3 African-American/Black
4 American Indian or Alaskan Native
5 Asian -- Korean, Japanese, Chinese, Vietnamese, Filipino or other Asian
6 Pacific Islander
7 Mixed Heritage
98 Other
99 Refused

English Questionnaire
True North Research, Inc. © 2005 80SANDAG. . . . . . . . . . . . . . . .
SANDAG Regional Study June 2005
True North Research, Inc. © 2005 Page 17
D3I have just one more question for you for statistical reasons. I am going to read some income categories. Please stop me when I reach the category that best describes your total household income.
1 Less than $10,000
2 $10,000 to $14,999
3 $15,000 to $24,999
4 $25,000 to $34,999
5 $35,000 to $49,999
6 $50,000 to $74,999
7 $75,000 to $99,999
8 $100,000 to $149,999
9 $150,000 to $199,999
10 $200,000 or more
98 Not sure
99 Refused
Post-Interview Items
D4 Gender
1 Male
2 Female
D5 Interview language
1 English
2 Spanish
2 Web

Spanish Questionnaire
True North Research, Inc. © 2005 81SANDAG. . . . . . . . . . . . . . . .
S P A N I S H Q U E S T I O N N A I R E
Derechos de autor © 2005 True North Research, Inc. Página 1
SANDAG Region-wide Public Opinion Study - Estudio
Regional de Opinión Pública Versión Final
J ne 2005Section 1: Introduction to Study - Introducción al Estudio
Hola, mi nombre es ____ y le estoy llamando de parte de la compañía de investigación de opinión pública TNR. Estamos llevando a cabo una encuesta acerca de temas sobre su comunidad y nos gustaría obtener sus opiniones.
If needed: Esto es una encuesta acerca de temas de importancia en su comunidad –NO estoy tratando de venderle algo. If needed: La encuesta no debe tomar más de 18 minutos para completar. If needed: Si ahora no es un buen momento, ¿me puede decir una hora más conveniente para volverle a llamar? If needed, offer the web option.
If the person says they are an elected official or is somehow associated with the survey, politely explain that this survey is designed to the measure the opinions of those not closely associated with the study, thank them for their time, and terminate the interview.
Section 2: Screener for Inclusion in the Study - Filtro para Incluir a la Persona en el Estudio Por razones estadísticas, quisiera hablar con el adulto más joven de sexo masculino que viva actualmente en su hogar y que tenga por lo menos 18 años de edad. (if there is no male currently at home that is at least 18 years of age, then ask): Bueno, entonces quisiera hablar con la persona más joven de sexo femenino que viva actualmente en su hogar y que tenga por lo menos 18 años de edad. (If there is no adult currently available, then ask for a callback time.) NOTE: Adjust this screener as needed to match sample quotas on gender & age
SC1 ¿Usted considera al Condado de San Diego como el área principal de su residencia?
1 Sí Continue
2 No Terminate
99 Refused Terminate
SC2 ¿Cuál es el código postal de su domicilio? Read zip code back to them to confirm correct.
Record 5 digit zip code
SC3 Record which area the zip code falls into. If the respondent provided a zip code that does not appear in one of the six areas below, terminate the interview.
1 North County Coastal
92055 92075
92014 92057
92054 92056
92008 92009
92024 92067
92007
2 North County Inland
92028 92059 92082
92061 92026 92003
92084 92027 92083
92069 92078 92025
92029 92064 92096
92081
3 Central
92128 92127 92129 92130 92131 92121 92126
92037 92145 92037 92122 92124 92117 92093
92111 92123 92109 92119 92120 92110 92108
92115 92116 92107 92103 92104 92105 92106
92140 92101 92134 92102 92114 92135 92113
92118 92139 92136 92155 92091 92182 92161

Spanish Questionnaire
True North Research, Inc. © 2005 82SANDAG. . . . . . . . . . . . . . . .
SANDAG Regional Study - Estudio Regional de SANDAG June 2005
True North Research, Inc. © 2005 Página 2
4 South 91902 91950
91913 91910
91915 91911
92154 91932
92173 91914
5 East County
92060 92004 92086 92070 92065 91934
92066 92036 92040 91916 92071 91948
91962 91901 92021 91931 92020 92019
91980 91942 91905 91941 91935 91977
91978 91945 91906 91963 91917
Section 3: Living in San Diego Region - Viviendo en la Región de San Diego
Quisiera comenzar al hacerle unas cuantas preguntas acerca de vivir en la región de San Diego.
Q1Teniendo en cuenta todos los factores, ¿qué tan satisfecho se siente usted con la región de San Diego como lugar para vivir? Get answer, if 'satisfecho' or 'insatisfecho' then ask:¿Está muy (satisfecho/insatisfecho) o un poco (satisfecho/insatisfecho)?
1 Muy satisfecho
2 Un poco satisfecho
3 Un poco insatisfecho
4 Muy insatisfecho
98 Not sure
99 Refused
Q2En el futuro, ¿piensa usted que San Diego será un mejor lugar en donde vivir que lo que es hoy en día, un peor lugar en donde vivir que lo que es hoy en día, o más o menos igual como es hoy en día?
1 Un lugar mejor para vivir de lo que es hoy en día
2 Un lugar peor para vivir de lo que es hoy en día
3 Un lugar más o menos igual al que es hoy en día
98 Not sure
99 Refused

Spanish Questionnaire
True North Research, Inc. © 2005 83SANDAG. . . . . . . . . . . . . . . .
SANDAG Regional Study - Estudio Regional de SANDAG June 2005
True North Research, Inc. © 2005 Página 3
Q3A continuación, voy a leerle una lista de aspectos de su comunidad local y a medida que los vaya nombrando quisiera que describiera la calidad de cada aspecto como excelente, buena, regular o mala. El primer/siguiente aspecto es: _____
Randomize
Excele
nte
Bu
en
a
Reg
ula
r
Mala
No O
pin
ion
Refu
sed
A Condiciones de tráfico en los caminos locales 1 2 3 4 98 99
B Condiciones de tráfico en las autopistas y carreteras 1 2 3 4 98 99
C Transporte público 1 2 3 4 98 99
D Liderazgo del gobierno 1 2 3 4 98 99
E Calidad general del estilo de vida 1 2 3 4 98 99
F Lo fácil que es para los usuarios usar las aceras, callejones y senderos para caminar 1 2 3 4 98 99
Section 4: Awareness - Conscientización
Bien, ahora quisiera cambiar de tema por un momento.–
Q4 ¿Alguna vez escuchó algo sobre _____?
Randomize Sí
No
No
t su
re /
R
efu
sed
A SANDAG 1 2 99
B RideLink 1 2 99
C El término de transporte “managed lanes” (carriles administrados) 1 2 99
Ask Q5 for each item where Q4=1. If Q4= 2 or 99 for all items, skip to Q7.
Q5 Brevemente y en sus propias palabras, ¿cómo describiría _____?
A SANDAG Record description
B RideLink Record description
C Carriles administrados Record description

Spanish Questionnaire
True North Research, Inc. © 2005 84SANDAG. . . . . . . . . . . . . . . .
SANDAG Regional Study - Estudio Regional de SANDAG June 2005
True North Research, Inc. © 2005 Página 4
Ask Q6 for each item where Q4=1
Q6En general, ¿diría usted que tiene una opinión "favorable" o "desfavorable" de ______, o realmente no tiene una opinión al respecto? Get answer and ask: ¿Diría que su opinión es muy o un poco (favorable/desfavorable)?
Muy
favo
rable
Un p
oco
fa
vora
ble
Neu
tral
/ N
o t
iene
opin
ión a
l re
s pec
to
Un p
oco
des
favo
rable
Muy
des
favo
rable
No e
stá
seguro
(D
on't
read
)
A SANDAG 1 2 3 4 5 6
B RideLink 1 2 3 4 5 6
C Carriles administrados 1 2 3 4 5 6
Section 5: Regional Priorities - Prioridades Regionales
Q7 ¿Cuál es, en su opinión, el problema número uno de la región de San Diego?
Record Verbatim Response – First response only
Q8
Ahora, quisiera ser un poco más específico en cuanto a la región de San Diego. Permítame leerle una lista de temas, y a medida que los vaya nombrando quisiera que usted me diga si considera que es extremadamente importante, muy importante, un poco importante o no es nada importante para toda la gente de la región, y no sólo para usted personalmente.
Aquí está el (primer/siguiente) tema: _____. ¿Piensa que es extremadamente importante, muy importante, un poco importante o no es importante en lo absoluto que se dedique un esfuerzo en cuanto a este tema?
Split Sample. Wave 1 receives items A-G. Wave 2 receives items H-M.
Randomize
Extr
em
ad
am
en
teim
po
rtan
te
Mu
yim
po
rtan
te
Alg
oim
po
rtan
te
No
es
imp
ort
an
te
en
lo
ab
so
luto
Sin
op
inió
n
Refu
sed
A Reducir el congestionamiento del tránsito 1 2 3 4 98 99
B Reducir el crimen 1 2 3 4 98 99
C Fomentar el reciclaje 1 2 3 4 98 99
D Proteger las playas contra la contaminación 1 2 3 4 98 99
E Proporcionar mejores servicios de transporte público 1 2 3 4 98 99
F Proteger los parques, cañones, y otros espacios abiertos 1 2 3 4 98 99
G Mantener las tierras agrícolas 1 2 3 4 98 99

Spanish Questionnaire
True North Research, Inc. © 2005 85SANDAG. . . . . . . . . . . . . . . .
SANDAG Regional Study - Estudio Regional de SANDAG June 2005
True North Research, Inc. © 2005 Página 5
H Hacer más económica y accesible la vivienda 1 2 3 4 98 99
I Fomentar que nuevos negocios se establezcan en San Diego 1 2 3 4 98 99
J Asegurar fuentes confiables de energía 1 2 3 4 98 99
K Reponer la arena en las playas 1 2 3 4 98 99
L Mejorar la calidad del aire 1 2 3 4 98 99
M Asegurar un suministro adecuado de agua 1 2 3 4 98 99
Q9
Teniendo en cuenta la misma lista de temas que le acabo de leer, ¿diría usted que está satisfecho o insatisfecho con los esfuerzos actuales para: _____, o ¿no tiene ninguna opinión al respecto? Get answer, if 'satisfecho' or 'insatisfecho' then ask: ¿Estaba muy (satisfecho/insatisfecho) o un poco (satisfecho/insatisfecho)?
Split Sample. Wave 1 receives items A-G. Wave 2 receives items H-M.
Randomize
Mu
ysati
sfe
ch
o
Alg
osati
sfe
ch
o
Un
po
co
in
sati
sfe
ch
o
Mu
yin
sati
sfe
ch
o
Sin
op
inió
n
Refu
sed
A Reducir el congestionamiento del tránsito 1 2 3 4 98 99
B Reducir el crimen 1 2 3 4 98 99
C Fomentar el reciclaje 1 2 3 4 98 99
D Proteger las playas contra la contaminación 1 2 3 4 98 99
E Proporcionar mejores servicios de transporte público 1 2 3 4 98 99
F Proteger los parques, cañones, y otros espacios abiertos 1 2 3 4 98 99
G Mantener las tierras agrícolas 1 2 3 4 98 99
H Hacer más económica y accesible la vivienda 1 2 3 4 98 99
I Fomentar que nuevos negocios se establezcan en San Diego 1 2 3 4 98 99
J Asegurar fuentes confiables de energía 1 2 3 4 98 99
K Reponer la arena en las playas 1 2 3 4 98 99
L Mejorar la calidad del aire 1 2 3 4 98 99
M Asegurar un suministro adecuado de agua 1 2 3 4 98 99

Spanish Questionnaire
True North Research, Inc. © 2005 86SANDAG. . . . . . . . . . . . . . . .
SANDAG Regional Study - Estudio Regional de SANDAG June 2005
True North Research, Inc. © 2005 Página 6
Q10
Ahora, voy a leerle una lista breve de opiniones. A medida que las vaya leyendo, sírvase decirme si usted está de acuerdo o en desacuerdo con estas opiniones. ¿Está de acuerdo o en desacuerdo con: _____. Get answer, if 'de acuerdo' or 'en desacuerdo' then ask: ¿Usted está totalmente (de acuerdo/en desacuerdo) o un poco (de acuerdo/en desacuerdo)?
Split Sample. Wave 1 receives items A-F. Wave 2 receives items G-M.
Randomize
To
talm
en
te
de a
cu
erd
o
Un
po
co
de
acu
erd
o
Un
po
co
en
d
esacu
erd
o
To
talm
en
te
en
desacu
erd
o
Sin
op
inió
n
Refu
sed
A Los controles en el crecimiento de la población dañan a la economía 1 2 3 4 98 99
B
Se les debe requerir a los fraccionadores que muestren que hay suficiente agua local y regional antes de que puedan comenzar a construir
1 2 3 4 98 99
C Estoy considerando salirme de San Diego por los cambios relacionados con el crecimiento 1 2 3 4 98 99
DLos nuevos desarrollos en la región actualmente pagan su parte de los servicios públicos
1 2 3 4 98 99
EMás gente viviendo en una zona significa que la zona sea un lugar menos deseable en donde vivir
1 2 3 4 98 99
F Estoy considerando salirme de San Diego porque la vivienda es demasiado cara 1 2 3 4 98 99
G El tiempo de espera en la frontera afecta mi decisión de visitar a México 1 2 3 4 98 99
HEstaría dispuesto a pagar tarifas más altas de energía si esto evitara los apagones o cambios en los precios en el futuro
1 2 3 4 98 99
I Las relaciones entre San Diego y México necesitan ser mejoradas 1 2 3 4 98 99
JLas relaciones entre San Diego y los gobiernos de las tribus de indios americanos necesitan ser mejoradas
1 2 3 4 98 99
K
San Diego necesita un sistema de transporte público de primera para responder a las crecientes necesidades de transporte de la región
1 2 3 4 98 99
L
Los residentes que tienen interés en participar en los proceses de planeación y de toma de decisiones que afectan la región de San Diego tienen suficientes oportunidades y foros para hacerlo
1 2 3 4 98 99
M
La Patrulla de Caminos necesita hacer cumplir las leyes de los carriles de transporte compartido (carpool) con más frecuencia para que los conductores viajando solos no los usen
1 2 3 4 98 99

Spanish Questionnaire
True North Research, Inc. © 2005 87SANDAG. . . . . . . . . . . . . . . .
SANDAG Regional Study - Estudio Regional de SANDAG June 2005
True North Research, Inc. © 2005 Página 7
Q11
Permítame leerle una lista de proyectos que cada año son financiados con dinero de impuestos. Tenga en cuenta que hay un monto limitado de fondos disponibles y no todos los proyectos pueden ser considerados como de alta prioridad. Por favor dígame qué prioridad le daría usted a cada uno, usando una escala de 1 a 5, en donde el 5 representa la prioridad más alta y el 1 representa una prioridad relativamente baja. ¿Qué prioridad le daría a _____?
Randomize
Pri
ori
dad
m
ás b
aja
(1
)
2 3 4
Pri
ori
dad
m
ás a
lta (
5)
No
op
inio
n /
R
efu
sed
A La conservación y la protección de los hábitats delicados y espacios abiertos 1 2 3 4 5 99
B La implementación de un sistema de autobuses más rápido y orientado a los clientes 1 2 3 4 5 99
C Mejoramiento del servicio del Coaster (tren ligero) 1 2 3 4 5 99
D Mejoramiento del servicio del Trolley 1 2 3 4 5 99
E Mejoramiento de las calles y caminos locales 1 2 3 4 5 99
F Mejoramiento de las carreteras y autopistas en la región de San Diego 1 2 3 4 5 99
G Proporcionar más tratamiento accesible para la drogadicción 1 2 3 4 5 99
H La creación de más programas para adolescentes con altos riesgos 1 2 3 4 5 99
I Proporcionar más protección de la policía 1 2 3 4 5 99
J Proporcionar más instalaciones en los parques y programas recreativos 1 2 3 4 5 99
K Reponer la arena en las playas 1 2 3 4 5 99
L Protección del medio ambiente contra la contaminación 1 2 3 4 5 99
M
Proporcionar más fondos para programas de viviendas a precios accesibles para aquellas personas que tengan derecho en base a sus bajos ingresos
1 2 3 4 5 99
NAumentar el uso de fuentes renovables de energía, tales como energía solar y electricidad generada por el viento
1 2 3 4 5 99
OMejoramiento de la calidad y cantidad de carriles para bicicletas y senderos para bicicletas en la región
1 2 3 4 5 99

Spanish Questionnaire
True North Research, Inc. © 2005 88SANDAG. . . . . . . . . . . . . . . .
SANDAG Regional Study - Estudio Regional de SANDAG June 2005
True North Research, Inc. © 2005 Página 8
Section 6: Traffic - Tráfico
Q12
Existen muchas posibles soluciones para aliviar el congestionamiento del tránsito durante las horas de mayor tráfico en la mañana y en la tarde. Sírvase decirme si considera que cada una de las siguientes estrategias representa un enfoque muy efectivo, un poco efectivo o para nada efectivo en cuanto a aliviar el congestionamiento del tránsito. La primera/siguiente estrategia es:
Randomize
Mu
y e
fecti
va
Un
po
co
efe
cti
va
Nad
a
efe
cti
va
No O
pin
ion
Refu
sed
A Programas de transporte compartido (carpool) patrocinados por el empleador 1 2 3 98 99
B Horas de trabajo flexibles 1 2 3 98 99
C Trabajar a distancia 1 2 3 98 99
D Más transporte público 1 2 3 98 99
E La construcción de nuevas carreteras y autopistas 1 2 3 98 99
F Añadir carriles a las autopistas existentes 1 2 3 98 99
G
Permitir que los conductores manejando solos paguen para usar los carriles de transporte compartido durante las horas de mayor tráfico, como FASTRAK en la carretera I-15
1 2 3 98 99
HAñadir carriles a las autopistas existentes solo para dos o más personas que usan el carril de transporte compartido
1 2 3 98 99
IIncentivos financieros para animar a las personas para que usen transporte público, transporte compartido, bicicleta, o caminen
1 2 3 98 99
JConcentrar a los nuevos complejos habitacionales y desarrollos cerca de áreas que tengan transporte público
1 2 3 98 99
Q13
Una manera de aliviar el congestionamiento del tránsito en las carreteras de San Diego sería construir carriles adicionales en el camellón que serían carriles administrados . Los carriles administrados serían usados como transporte compartido con dos o más personas en el vehículo. También podrían ser usados por conductores manejando solos que paguen una tarifa – como los carriles de Fastrak en la carretera 15.
¿Piensa usted que la construcción de más carriles administrados sería muy efectiva, un poco efectiva o nada efectiva para aliviar el congestionamiento del tránsito en las carreteras de San Diego?
1 Muy efectiva
2 Un poco efectiva
3 Nada efectiva
98 Not sure/No Opinion
99 Refused

Spanish Questionnaire
True North Research, Inc. © 2005 89SANDAG. . . . . . . . . . . . . . . .
SANDAG Regional Study - Estudio Regional de SANDAG June 2005
True North Research, Inc. © 2005 Página 9
Q14 Si usted estuviera manejando solo, ¿de vez en cuando consideraría pagar una tarifa para usar los carriles administrados durante las horas de mayor tráfico?
1 Sí
2 No
3 Depende
98 Not sure/No Opinion
99 Refused
Q15¿Estaría más o menos inclinado de formar parte del transporte compartido (carpool) o transporte compartido en camioneta (vanpool) si los carriles administrados fueran agregados a las carreteras locales, o esto no tendría ningún efecto?
1 Más inclinado
2 Menos inclinado
3 Ningún efecto
98 Not sure/No Opinion
99 Refused
Section 7: Smart vs. Sprawl - Fraccionamientos Inteligentes comparado con la Expansión Descontrolada
Q16Considerando ahora la futura construcción de viviendas y el diseño de vecindarios, existen dos opiniones generales. Después de que lea estas dos opiniones, por favor dígame cuál de ellas se acerca más a su propia opinión.
Randomize statements 1 & 2. Do not read options 3, 4 or 99.
1
El Sr. Rodríguez considera que la mayoría de los nuevos conjuntos de viviendas deberían seguir incluyendo viviendas unifamiliares en áreas de la región apartadas de las tiendas y negocios y de las oficinas, resultando así en un diseño más esparcido.
2
El Sr. García considera que los nuevos conjuntos de viviendas deberían incluir condominios, casas tipo dúplex y departamentos, mezclados con tiendas y oficinas, resultando así en un diseño más compacto.
3 Ninguno
4 Algo de ambos
99 Not sure / Refused

Spanish Questionnaire
True North Research, Inc. © 2005 90SANDAG. . . . . . . . . . . . . . . .
SANDAG Regional Study - Estudio Regional de SANDAG June 2005
True North Research, Inc. © 2005 Página 10
Section 8: Commute Behavior - Comportamiento respecto al Transporte
Q17¿Ha usado transporte público, incluyendo el Trolley, autobús, tren, u otros servicios de transporte público en la región de San Diego durante los últimos 12 meses? Probe and record specific methods. Multiple responses allowed.
1 No ha usado el transporte público en los últimos 12 meses
2 Trolley
3 Autobús
4 Tren / Coaster
5 Otro Especifique:
99 Refused
Q18¿Usted tiene que viajar en forma regular a su trabajo o escuela? If 'Sí', ask: ¿Sería para ir a su trabajo o para ir a la escuela? If respondent mentions 'ambos', probe for primary commute destination.
1 Sí – trabajo
2 Sí - escuela
3 Ambos (trabajo principalmente)
4 Ambos (escuela principalmente)
5 No Skip toQ28
99 Refused Skip toQ28
Q19¿Qué forma de transporte usa usted principalmente para ir a <<work/school>>?Reference 'trabajo' if Q18=1 or 3, use 'escuela' if Q18=2 or 4. Same rules apply wherever the '<<work/school>>' insert point appears.
1 Maneja solo
2 Transporte compartido (carpool)
3 Transporte compartido en camioneta (vanpool)
4 Autobús
5 Trolley
6 Tren / Coaster
7 Bicicleta
8 Motocicleta
9 Camina o corre
10 Otro Especifique:
99 Not sure / Refused Skip toQ22
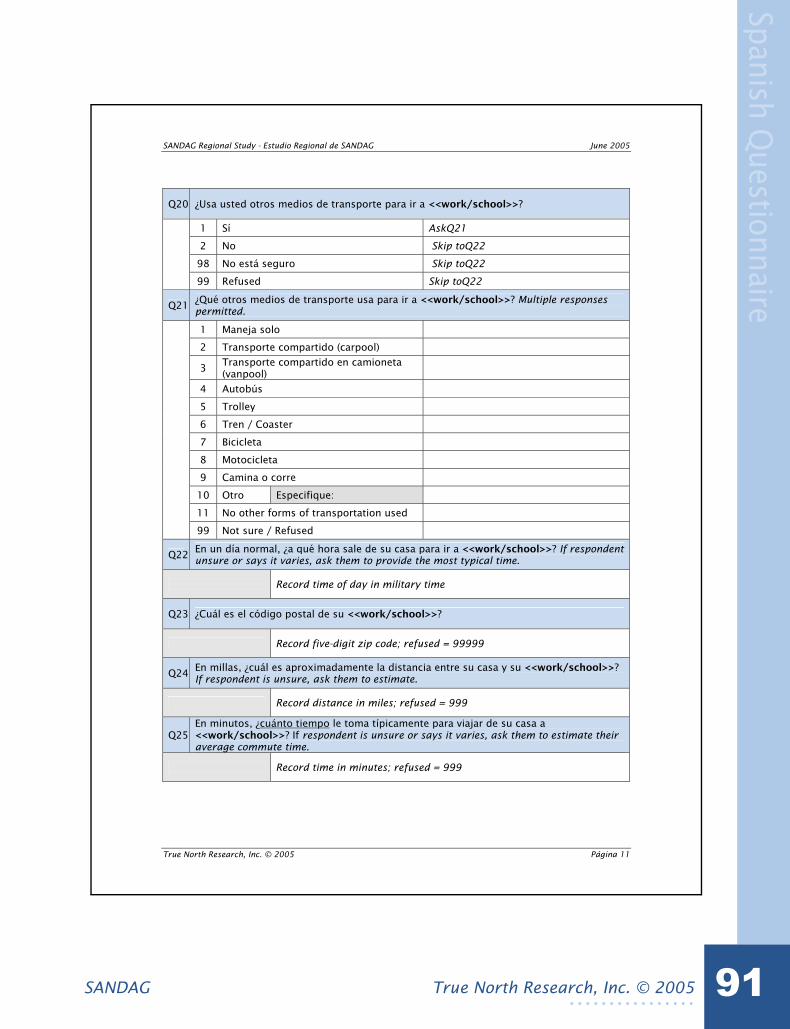
Spanish Questionnaire
True North Research, Inc. © 2005 91SANDAG. . . . . . . . . . . . . . . .
SANDAG Regional Study - Estudio Regional de SANDAG June 2005
True North Research, Inc. © 2005 Página 11
Q20 ¿Usa usted otros medios de transporte para ir a <<work/school>>?
1 Sí AskQ21
2 No Skip toQ22
98 No está seguro Skip toQ22
99 Refused Skip toQ22
Q21 ¿Qué otros medios de transporte usa para ir a <<work/school>>? Multiple responses permitted.
1 Maneja solo
2 Transporte compartido (carpool)
3 Transporte compartido en camioneta (vanpool)
4 Autobús
5 Trolley
6 Tren / Coaster
7 Bicicleta
8 Motocicleta
9 Camina o corre
10 Otro Especifique:
11 No other forms of transportation used
99 Not sure / Refused
Q22 En un día normal, ¿a qué hora sale de su casa para ir a <<work/school>>? If respondent unsure or says it varies, ask them to provide the most typical time.
Record time of day in military time
Q23 ¿Cuál es el código postal de su <<work/school>>?
Record five-digit zip code; refused = 99999
Q24 En millas, ¿cuál es aproximadamente la distancia entre su casa y su <<work/school>>?If respondent is unsure, ask them to estimate.
Record distance in miles; refused = 999
Q25En minutos, ¿cuánto tiempo le toma típicamente para viajar de su casa a <<work/school>>? If respondent is unsure or says it varies, ask them to estimate their average commute time.
Record time in minutes; refused = 999

Spanish Questionnaire
True North Research, Inc. © 2005 92SANDAG. . . . . . . . . . . . . . . .
SANDAG Regional Study - Estudio Regional de SANDAG June 2005
True North Research, Inc. © 2005 Página 12
Only ask Q26 if (neither Q19 nor Q21 = 2 or 3) AND Q25>29 minutes. Otherwise, skip to Q28.
Q26Anteriormente usted indicó que no usa el transporte compartido (carpool) cuando viaja a <<work/school>>. ¿Cuál es la razón principal de no usar el transporte compartido? Do NOT read options.
Record verbatim
Q27
Al leer cada una de las siguientes frases acerca del transporte compartido, dígame por favor si está o no está a favor con cada frase.
Aquí está la (primera/siguiente) frase: _____. ¿Está de acuerdo o en desacuerdo? Get answer, if 'de acuerdo' or 'en desacuerdo' then ask: ¿Usted está totalmente (de acuerdo/en desacuerdo) o un poco (de acuerdo/en desacuerdo)?
Read in Order
Fir
mem
en
te
de a
cu
erd
o
Un
po
co
de
acu
erd
o
Un
po
co
en
d
esacu
erd
o
To
talm
en
te
en
desacu
erd
o
No O
pin
ion
Refu
sed
ATrataría de usar el transporte compartido si pudiera encontrar a alguien con un horario similar al mío
1 2 3 4 98 99
B No me sentiría cómodo viajando en transporte compartido con un extraño 1 2 3 4 98 99
CEl formar parte de un transporte compartido es demasiado restrictivo. Necesito la libertad y flexibilidad de ir y venir cuando quiero.
1 2 3 4 98 99
D
Si formara parte de un transporte compartido, llegaría más rápidamente al <<work/school>> porque podría usar los carriles de transporte compartido
1 2 3 4 98 99
Q28 Durante los últimos 12 meses, ¿ha usado una bicicleta en las calles locales para recreación o para viajar a algún lado?
1 Sí
2 No
98 Not sure
99 Refused

Spanish Questionnaire
True North Research, Inc. © 2005 93SANDAG. . . . . . . . . . . . . . . .
SANDAG Regional Study - Estudio Regional de SANDAG June 2005
True North Research, Inc. © 2005 Página 13
Section 9: Housing & Commute Choices - Selecciones de Vivienda y Transporte
Only ask Q29 if Q18=(1, 2, 3 or 4) AND Q25>30 minutes. Otherwise skip to Q30.
Q29 Si usted pudiera lograr que el viaje a su destino final tardara menos de 30 minutos, ¿estaría dispuesto a _____?
Read in Order Sí
No
No
t su
re /
R
efu
sed
A Aceptar un trabajo con una reducción del 15 por ciento en el sueldo 1 2 99
B Cambiarse a una casa que cueste lo mismo que su actual casa, pero que fuera 25 por ciento más pequeña 1 2 99
C Cambiarse a una casa que sea del mismo tamaño que su actual casa, pero que cueste 25 por ciento más cara 1 2 99
D Trabajar desde su casa si su empleador estuviera de acuerdo 1 2 99
E Pagar por el uso de un camino de cuota 1 2 99
Q30 ¿Usted es propietario o está alquilando su casa actual?
1 Alquila
2 Es dueño
3 Vivo con familia / amigos y no pago renta
99 Refused
Q31 ¿Cuál de las siguientes descripciones se adapta mejor a su vivienda actual?
1 Vivienda unifamiliar separada
2 Departamento
3 Condominio
4 Casa móvil, casa rodante
99 Refused

Spanish Questionnaire
True North Research, Inc. © 2005 94SANDAG. . . . . . . . . . . . . . . .
SANDAG Regional Study - Estudio Regional de SANDAG June 2005
True North Research, Inc. © 2005 Página 14
If Q30=3 or 99, skip to Q33.
Q32
Quisiera que piense cuáles fueron los factores principales que tuvo en cuenta al seleccionar su vivienda actual. Permítame leerle una lista breve de factores potenciales y, para cada uno de ellos, por favor dígame si fue un factor muy importante, moderadamente importante o no fue un factor al seleccionar su vivienda. ¿Fue _____ un factor importante, moderadamente importante o no fue un factor en su decisión?
Split Sample. Wave 1 receives items A-G. Wave 2 receives items H-N..
Randomize
Facto
r m
uy
imp
ort
an
te
Facto
rm
od
era
dam
en
teim
po
rtan
te
No
fu
e u
n
facto
r
No
está
seg
uro
/
Reh
úsa
co
nte
sta
r
A Lo económico en general 1 2 3 99
B Tamaño del terreno 1 2 3 99
C Ubicación en relación a su trabajo 1 2 3 99
D Ubicación en relación a los centros comerciales 1 2 3 99
E Ubicación en relación a las buenas escuelas 1 2 3 99
F Disponibilidad de transporte público 1 2 3 99
G Aspecto y diseño en general de la casa 1 2 3 99
H Acceso del vecindario a las carreteras 1 2 3 99
I Ubicación en relación a los espacios abiertos y ámbitos rurales 1 2 3 99
J Seguridad del vecindario 1 2 3 99
K Ubicación en relación a otros miembros de la familia 1 2 3 99
L Disponibilidad de parques e instalaciones recreativas cercanos 1 2 3 99
M Sentido de la comunidad y de los vecinos 1 2 3 99
N Sentido de privacidad 1 2 3 99
Q33 ¿Cuántos años ha vivido en la región de San Diego?
1 Menos de 6 meses AskQ34
2 De 6 meses a menos de 1 año AskQ34
3 De 1 año a menos de 5 años AskQ34
4 De 5 años a menos de 10 años AskQ34
5 De 10 años a menos de 15 años Skip to instructions preceding Q35
6 15 años o más toda mi vida) Skip to instructions preceding Q35
99 Refused Skip to instructions preceding Q35

Spanish Questionnaire
True North Research, Inc. © 2005 95SANDAG. . . . . . . . . . . . . . . .
SANDAG Regional Study - Estudio Regional de SANDAG June 2005
True North Research, Inc. © 2005 Página 15
Q34¿Se cambió usted a la región de San Diego del Condado de Orange, Condado de Los Ángeles, Condado de Riverside, Condado de San Bernardino, otro condado en California, de otro estado o de otro país?
1 Condado de Orange
2 Condado de Los Ángeles
3 Condado de Riverside
4 Condado de San Bernardino
5 Otro condado en California
6 De otro estado
7 De otro país
99 Refused
Ask Q35 if Q33=4, 5 or 6. Otherwise, skip to Q38.
Q35 En los últimos cinco años, ¿se ha cambiado de un área de la región de San Diego a otra?
1 Sí AskQ36
2 No Skip toQ38
99 Refused Skip toQ38
Q36 ¿Fue: _____ una de las razones principales por la cual decidió cambiarse de un área de la región de San Diego a otra?
Randomize Sí
No
No
está
seg
uro
/
Reh
úsa
co
nte
sta
r
A Para reducir el tiempo viajando de usted o de otro miembro de su hogar 1 2 99
B Para vivir en una casa más grande 1 2 99
C Un cambio de empleo para usted o para otro miembro de su hogar 1 2 99
If Q36a, Q36b AND Q36c=2, ask Q37. Otherwise, skip to Q38.
Q37 ¿Por qué decidió cambiarse de un área de la región de San Diego a otra?
Record verbatim

Spanish Questionnaire
True North Research, Inc. © 2005 96SANDAG. . . . . . . . . . . . . . . .
SANDAG Regional Study - Estudio Regional de SANDAG June 2005
True North Research, Inc. © 2005 Página 16
Section 10: Report Card - Su tarjeta de calificaciones
Q38
|Quisiera leerle una lista de cinco temas generales que cubren algunos de los diversos asuntos que hemos discutido hoy. Para cada tema, quisiera que usted piense en las condiciones actuales y la calidad de vida en la región, y que le otorgue una calificación con letra -- como las calificaciones que se dan en la escuela. Puede usar la escala de A, B, C, D, o F, y para las calificaciones entre A y D, si desea, puede especificar si le pondría un menos o un más a cada letra. Para estar seguros, la letra A representa la calificación 'excelente', mientras que una F representa la calificación de 'reprobado'.
Randomize. Record grade as number, where A+ = 1, A = 2, A- = 3, B+ = 4. . . F = 13; Refused = 99
ALa situación económica de la región, la cual incluye la disponibilidad de empleos y programas de entrenamiento laboral.
BEl sistema de transporte de la región, el cual incluye autopistas, carreteras, calles y caminos locales, y el sistema de transporte público.
C
Vivienda en la región, la cual incluye la disponibilidad y lo económico de una variedad de diferentes tipos de vivienda tales como condominios, viviendas unifamiliares, y apartamentos.
DEl medio ambiente de la región, el cual incluye la conservación de espacios abiertos y hábitat natural, protección de las playas, y la calidad del aire y del agua.
E
Crimen en la región, el cual incluye el nivel del crimen, sintiéndose seguro en su vecindario, interacciones con las agencias policíacas, así como la prevención de crímenes y esfuerzos de intervención
Section 11: Background & Miscellaneous Questions - Antecedentes y preguntas diversas
D1 ¿En qué año nació?
Record two-digit year
D2 ¿De cuál grupo étnico se considera usted parte o se siente más cercano? (Read list if respondent hesitates)
1 Caucásico o Blanco
2 Hispano o Latino
3 Afroamericano/Negro
4 Indio americano o Nativo de Alaska
5 Asiático u oriental -- coreano, japonés, chino, vietnamita, filipino u otra nacionalidad oriental
6 De las Islas del Pacífico
7 De herencia o antepasados mixtos
98 Otro
99 Refused
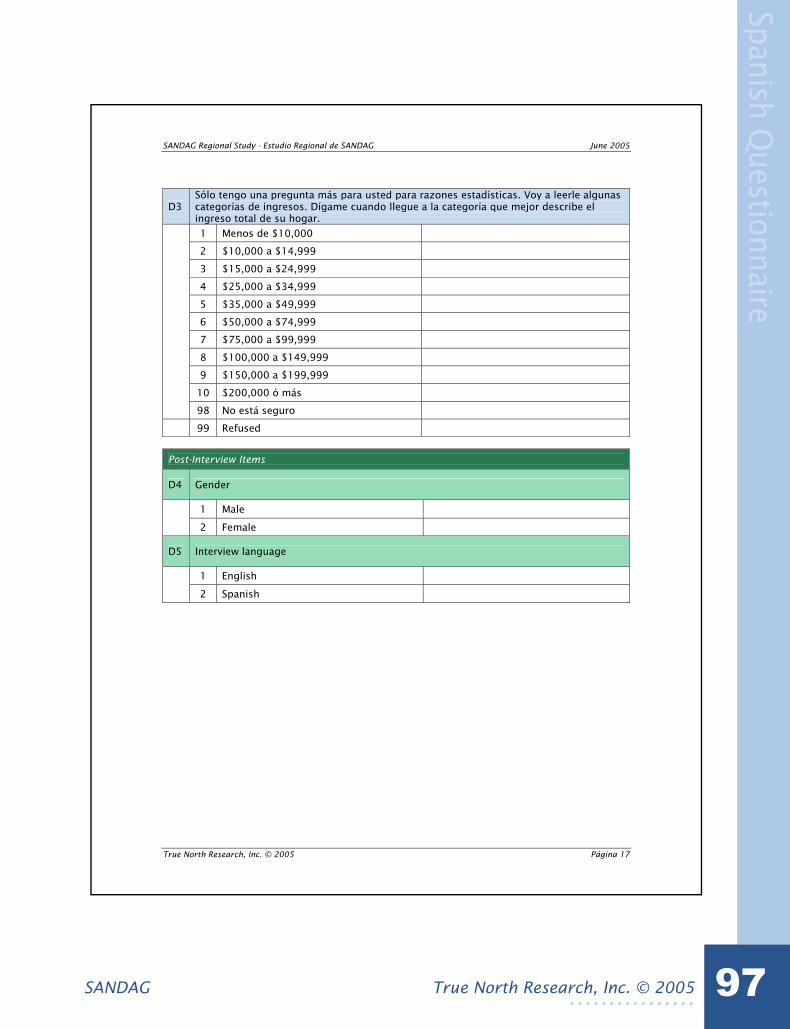
Spanish Questionnaire
True North Research, Inc. © 2005 97SANDAG. . . . . . . . . . . . . . . .
SANDAG Regional Study - Estudio Regional de SANDAG June 2005
True North Research, Inc. © 2005 Página 17
D3Sólo tengo una pregunta más para usted para razones estadísticas. Voy a leerle algunas categorías de ingresos. Dígame cuando llegue a la categoría que mejor describe el ingreso total de su hogar.
1 Menos de $10,000
2 $10,000 a $14,999
3 $15,000 a $24,999
4 $25,000 a $34,999
5 $35,000 a $49,999
6 $50,000 a $74,999
7 $75,000 a $99,999
8 $100,000 a $149,999
9 $150,000 a $199,999
10 $200,000 ó más
98 No está seguro
99 Refused
Post-Interview Items
D4 Gender
1 Male
2 Female
D5 Interview language
1 English
2 Spanish