San Francisco Juvenile Probation Department · Profile of Girls –Law Violation by Age and Race...
50
San Francisco Juvenile Probation Department Annual Statistical Report Calendar Year 2003 1/1/2003 To 12/31/2003 Created by Jose Luis Perla IT Director Information Technology Unit 375 Woodside Avenue San Francisco, CA 94127 (415) 753-7686 4/14/2004
Transcript of San Francisco Juvenile Probation Department · Profile of Girls –Law Violation by Age and Race...

San Francisco Juvenile Probation Department
Annual Statistical ReportCalendar Year 2003
1/1/2003 To 12/31/2003
Created byJose Luis Perla
IT DirectorInformation Technology Unit
375 Woodside AvenueSan Francisco, CA 94127
(415) 753-7686
4/14/2004

Table of Contents Statistical Reports Two-Year Statistical Summary............................................................................................1 Five-Year Statistical Summary.............................................................................................2 Five-Year Comparison of Law Violation Referrals By Geographical Residence.................................................................................................3 Law Violation Referrals by Geographical Residence of Youth..............................................4 Law Violation Referrals by San Francisco Police Department Districts .................................5 Law Violation Referrals by San Francisco Zip Codes...........................................................6 Law Violation Referrals by Age, Sex, and Race...................................................................8 Probation Referrals Sorted Most to Least Serious Referral Reasons.....................................9 Law Violation Referrals by Referral Source .......................................................................10 San Francisco Juvenile Probation Referrals 1988-2003......................................................12 San Francisco Juvenile Probation Referrals by Month 2000-2003......................................13 Detention Referrals............................................................................................................14 Detention Referrals Sorted Most to Least Serious Detention Reasons.................................17 Analysis of the Prior Probation Contacts of Youth Admitted to Detention...........................18 Detention Referrals By Geographical Residence of Youth...................................................19
Juvenile Hall Admissions By Month (2001-2003) ..............................................................20 Juvenile Hall Average Daily Population by Month (2001-2003)..........................................21 Detainees on December 31, 2003 .....................................................................................22
i

Juvenile Hall Average Length of Stay by Month (2001-2003) ............................................29 Petitions Filed for Law Violations (1984-2003) .................................................................30 Petition Reason Sorted Most to Least Serious Petition Reasons .........................................31 Petition Sustained Sorted Most to Least Serious Petition Sustained ....................................32 Current Status on December 31st, 2003.............................................................................33 Disposition of Petitions for Status Offenders and Law Violators..........................................35 Commitments to the California Youth Authority (1984-2003).............................................37 Remands to Adult Court (1979-2003)...............................................................................38 Court Dispositions to Youth Authority, Remands to Adult Court and Log Cabin Ranch (1990-2003)...................................................................................39 Log Cabin Ranch Admissions, Average Daily Population, Graduation (1990-2003)...................................................................................................40 Profile of Girls –Law Violation by Age and Race ...............................................................41 Profile of Girls –Detention Referrals...................................................................................42 Profile of Girls –Detention Referrals By Geographical Residence of Youth..........................45 Profile of Girls -- Analysis of the Prior Probation Contacts of Youth Admitted to Detention.........................................................................................46 Juvenile Probation Processing of Law Violation Cases .......................................................47
ii
1
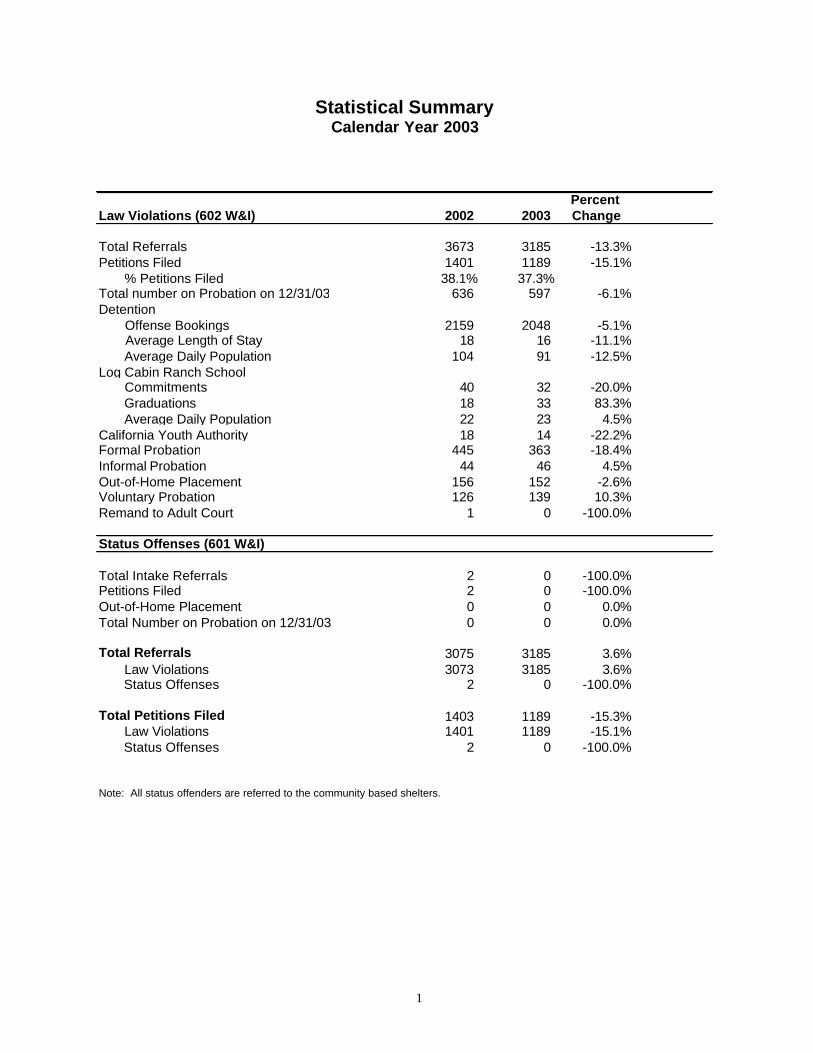
Statistical SummaryCalendar Year 2003
Percent
Law Violations (602 W&I) 2002 2003 Change Total Referrals 3673 3185 -13.3%Petitions Filed 1401 1189 -15.1% % Petitions Filed 38.1% 37.3%Total number on Probation on 12/31/03 636 597 -6.1%Detention Offense Bookings 2159 2048 -5.1% Average Length of Stay 18 16 -11.1% Average Daily Population 104 91 -12.5%Log Cabin Ranch School Commitments 40 32 -20.0% Graduations 18 33 83.3% Average Daily Population 22 23 4.5%California Youth Authority 18 14 -22.2%Formal Probation 445 363 -18.4%Informal Probation 44 46 4.5%Out-of-Home Placement 156 152 -2.6%Voluntary Probation 126 139 10.3%Remand to Adult Court 1 0 -100.0% Status Offenses (601 W&I) Total Intake Referrals 2 0 -100.0%Petitions Filed 2 0 -100.0%Out-of-Home Placement 0 0 0.0%Total Number on Probation on 12/31/03 0 0 0.0% Total Referrals 3075 3185 3.6% Law Violations 3073 3185 3.6% Status Offenses 2 0 -100.0% Total Petitions Filed 1403 1189 -15.3% Law Violations 1401 1189 -15.1% Status Offenses 2 0 -100.0%
Note: All status offenders are referred to the community based shelters.

2
Statistical Summary1999 - 2003
PercentInc/Dec
Law Violations (602 W&I) 1999 2000 2001 2002 2003 1999-2003
Total Referrals 4872 4139 3963 3673 3185 -34.6%Petitions Filed 1568 1460 1448 1401 1189 -24.2% Petition Filing Rate 32.2% 35.3% 36.5% 38.1% 37.3% Total Number on Probation on 12/31/03 1037 914 832 636 597 -42.4%Detention Offense Bookings 2913 2369 2302 2159 2048 -29.7% Average Length of Stay 14 18 18 18 16 14.3% Average Daily Population 119 120 115 104 91 -23.5%Log Cabin Ranch School Commitments 45 70 41 40 32 -28.9% Graduations 44 32 60 18 33 -25.0% Average Daily Population 43 42 41 22 23 -46.5%California Youth Authority 14 19 18 18 14 0.0%Formal Probation 568 536 580 445 363 -36.1%Informal Probation 60 67 47 44 46 -23.3%Out-of-Home Placement 184 163 185 156 152 -17.4%Voluntary Probation 127 94 112 126 139 9.4%Remand to Adult Court 2 5 0 1 0 -100.0%% of Referrals Detained 60 57 58 59 64 7.5% Status Offenses (601 W&I) Total Intake Referrals 2 4 5 2 0 -100.0%Petitions Filed 1 4 3 2 0 -100.0%Out-of-Home Placement 1 4 3 0 0 -100.0%Total number on Probation on 12/31/03 2 5 0 0 0 -100.0% Total Referrals 4874 4139 3968 3075 3185 -34.7% Law Violations 4872 4135 3963 3073 3185 -34.6% Status Offenses 2 4 5 2 0 -100.0% Total Petitions Filed 1569 1464 1451 1403 1189 -24.2% Law Violations 1568 1460 1448 1401 1189 -24.2% Status Offenses 1 4 3 2 0 -100.0%
Note: All status offenders are referred to the community based shelters.Detention includes a new category of court ordered detention which overlaps with offense bookings.

3
Five-Year Comparison of Law Violation Referrals
By Geographical Residence (W&I Code 602)
1999-2003 N=31851
Percent Inc/Dec 1999 2000 2001 2002 2003 99-03 Bayview 896 815 676 671 548 -38.84 Haight Ashbury/Castro/Upper Market 67 67 60 68 32 -52.24 Ingleside (West of Twin Peaks) 405 321 272 276 200 -50.62 Inner Mission 302 274 227 243 172 -43.05 Marina 60 35 31 28 25 -58.33 North of Market/Downtown 121 80 92 66 40 -66.94 Outer Mission 887 683 692 617 540 -39.12 Parkside 150 125 95 115 68 -54.67 Potrero 108 143 114 96 95 -12.04 Richmond 167 113 117 112 75 -55.09 South of Market/Tenderloin 112 99 61 119 76 -32.14 Sunset 160 87 72 83 73 -54.38 Treasure Island/Yerba Buena * 5 13 33 26 * Western Addition 513 421 358 432 384 -25.15 TOTAL 3948 3268 2880 2959 2354 -40.37
*Statistics are not available for previous years.
1 Non-San Francisco and UnavailableCity Count %
OAKLAND 118 14.20%DALY CITY 55 6.62%RICHMOND 41 4.93%VALLEJO 26 3.13%SACRAMENTO 21 2.53%SAN ANDREAS 15 1.81%FRESNO 13 1.56%HAYWARD 13 1.56%BOONVILLE 13 1.56%PACIFICA 12 1.44%SAN JOSE 12 1.44%SOUTH SAN FRANCISCO 12 1.44%CAMPBELL 10 1.20%BERKELEY 9 1.08%SAN LEANDRO 9 1.08%ANTIOCH 9 1.08%OTHER CITIES 358 43.08%UNAVAILABLE 85 10.23%
Total 831 100.00%

4
2003 Law Violation Referrals By Geographic Residence of Youth
(W&I Code 602)
N= 31851
1Non-San Francisco 831 : Oakland 118, Daly City 55, Richmond 41, Vallejo 26, Sacramento 21, San Andreas 15, Fresno 13, Hayward 13, Boonville 13, Pacifica 12, San Jose 12, South San Francisco 12, Campbell 10, Berkeley 9, San Leandro 9, Antioch 9, Other Cities 358, Unavailable 85

5
2003 Law Violations Referrals By San Francisco Police Department Districts
(Geographic Residence of Youth)
N=31851
1Non-San Francisco 831 : Oakland 118, Daly City 55, Richmond 41, Vallejo 26, Sacramento 21, San Andreas 15, Fresno 13, Hayward 13, Boonville 13, Pacifica 12, San Jose 12, South San Francisco 12, Campbell 10, Berkeley 9, San Leandro 9, Antioch 9, Other Cities 358, Unavailable 85
6
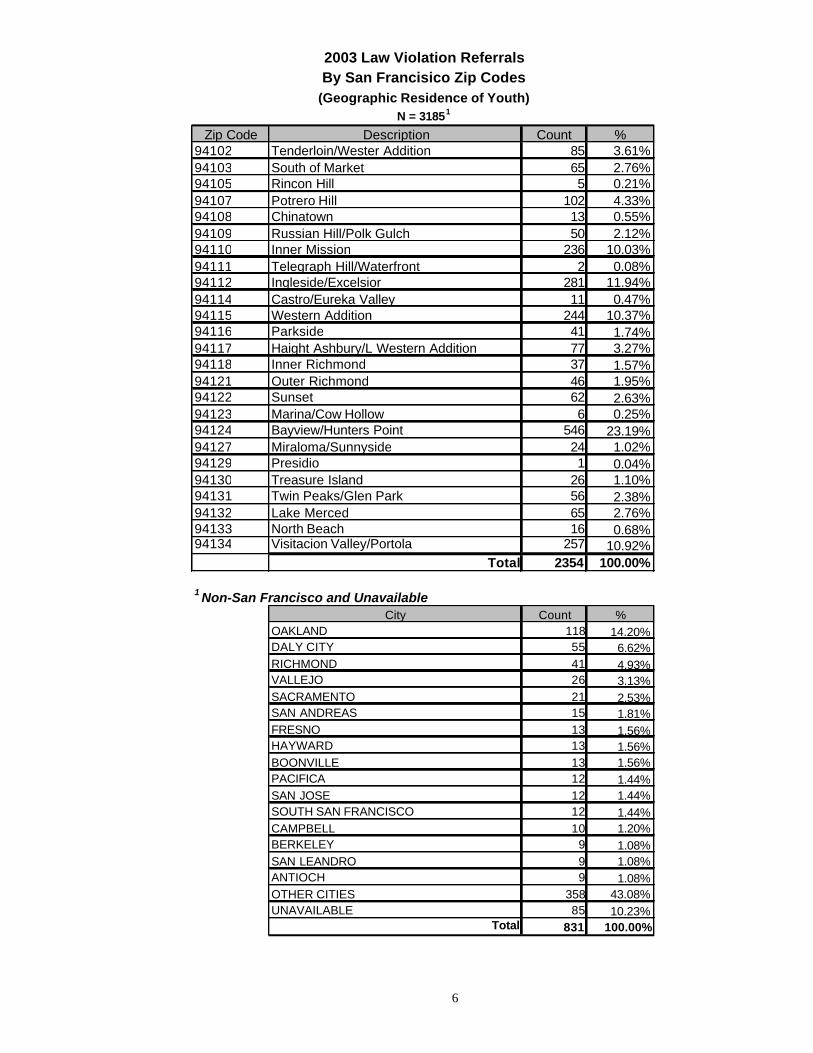
2003 Law Violation ReferralsBy San Francisico Zip Codes
(Geographic Residence of Youth)N = 31851
Zip Code Description Count %94102 Tenderloin/Wester Addition 85 3.61%94103 South of Market 65 2.76%94105 Rincon Hill 5 0.21%94107 Potrero Hill 102 4.33%94108 Chinatown 13 0.55%94109 Russian Hill/Polk Gulch 50 2.12%94110 Inner Mission 236 10.03%94111 Telegraph Hill/Waterfront 2 0.08%94112 Ingleside/Excelsior 281 11.94%94114 Castro/Eureka Valley 11 0.47%94115 Western Addition 244 10.37%94116 Parkside 41 1.74%94117 Haight Ashbury/L Western Addition 77 3.27%94118 Inner Richmond 37 1.57%94121 Outer Richmond 46 1.95%94122 Sunset 62 2.63%94123 Marina/Cow Hollow 6 0.25%94124 Bayview/Hunters Point 546 23.19%94127 Miraloma/Sunnyside 24 1.02%94129 Presidio 1 0.04%94130 Treasure Island 26 1.10%94131 Twin Peaks/Glen Park 56 2.38%94132 Lake Merced 65 2.76%94133 North Beach 16 0.68%94134 Visitacion Valley/Portola 257 10.92%
Total 2354 100.00%
1 Non-San Francisco and UnavailableCity Count %
OAKLAND 118 14.20%DALY CITY 55 6.62%RICHMOND 41 4.93%VALLEJO 26 3.13%SACRAMENTO 21 2.53%SAN ANDREAS 15 1.81%FRESNO 13 1.56%HAYWARD 13 1.56%BOONVILLE 13 1.56%PACIFICA 12 1.44%SAN JOSE 12 1.44%SOUTH SAN FRANCISCO 12 1.44%CAMPBELL 10 1.20%BERKELEY 9 1.08%SAN LEANDRO 9 1.08%ANTIOCH 9 1.08%OTHER CITIES 358 43.08%UNAVAILABLE 85 10.23%
Total 831 100.00%

7
2003 Law Violation Referrals By San Francisco Zip Codes
(Geographic Residence of Youth)
N=31851
1Non-San Francisco 831 : Oakland 118, Daly City 55, Richmond 41, Vallejo 26, Sacramento 21, San Andreas 15, Fresno 13, Hayward 13, Boonville 13, Pacifica 12, San Jose 12, South San Francisco 12, Campbell 10, Berkeley 9, San Leandro 9, Antioch 9, Other Cities 358, Unavailable 85

8
Calendar Year 2003 Law Violation
By Age, Sex and Race N=3185
Age Number Percent
11 Years 23 0.72 12 Years 104 3.27 13 Years 236 7.41 14 Years 463 14.54 15 Years 658 20.66 16 Years 772 24.24 17 Years 774 24.30 18 Years 147 4.62 Over 18 Years 8 0.25
Total 3185 100.0 Sex Number Percent
Male 2311 72.6 Female 874 27.4
Total 3185 100.0 Race/Ethnic Origin Number Percent
African American 1725 54.2 Asian Indian 3 0.1 Cambodian 20 0.6 Chinese 89 2.8 Filipino 69 2.2 Hawaiian 1 0.0 Japanese 4 0.1 Korean 2 0.1 Laotian 0 0 Latin American 592 18.6 Native American 5 0.2 Other 123 3.9 Other Asian 124 3.9 Pacific Islander 2 0.1 Samoan 87 2.7 Unknown 5 0.2 Vietnamese 48 1.5 White 286 9.0
Total 3185 100.0

9
City and County of San Francisco2003 Juvenile Probation Referrals –Sorted Most to Least SeriousReferral Reason Using Department of Justice Summary Codes
Black White Hispanic Asian OtherReferral Reason Male Female Male Female Male Female Male Female Male Female Total %Willful Homicide 3 1 1 0 0 0 1 0 0 0 6 0.19Forcible Rape 0 0 0 0 3 0 0 0 0 0 3 0.09Robbery 142 38 14 0 30 5 21 1 26 1 278 8.73Assault 99 59 22 4 43 11 51 4 17 5 315 9.89Kidnapping 1 1 0 0 1 0 0 1 1 0 5 0.16Burglary 73 19 3 6 27 6 17 5 9 3 168 5.27Theft 25 17 3 9 7 4 5 4 3 0 77 2.42Motor Vehicle Theft 57 8 6 2 3 4 5 1 4 0 90 2.83Forgery, Checks, Access Cards 1 2 0 1 1 1 0 0 1 0 7 0.22Narcotics 43 39 3 2 49 13 6 0 5 1 161 5.05Marijuana –Felony 29 5 8 1 4 0 4 0 2 0 53 1.66Dangerous Drugs 1 1 4 1 2 1 7 1 0 0 18 0.57Child Molest –Felony 4 0 0 0 2 0 0 0 2 0 8 0.25Sexual Battery 14 0 0 0 4 0 0 0 0 0 18 0.57Weapons –Felony 27 1 2 0 24 1 5 0 4 0 64 2.01Drive Under the Influence -F 0 0 0 0 1 1 0 0 0 0 2 0.06Hit and Run –Felony 1 0 0 0 1 0 0 0 0 0 2 0.06Arson 1 0 2 1 0 0 0 1 0 0 5 0.16Other Felonies 22 9 16 2 10 2 13 2 9 1 86 2.70Assault Battery 83 36 15 8 26 8 16 2 10 6 210 6.59Petty Theft 81 104 14 25 27 17 22 28 11 18 347 10.89Defrauding Innkeeper 3 2 0 1 0 1 2 0 0 0 9 0.28Marijuana –Misdemeanor 3 1 0 0 3 0 0 0 1 0 8 0.25Indecent Exposure 1 0 0 0 0 0 0 0 0 0 1 0.03Prostitution 1 24 2 6 3 7 0 3 3 0 49 1.54Drunk 0 0 1 0 1 0 0 0 1 0 3 0.09Liquor Laws 0 0 0 1 2 0 0 1 0 0 4 0.13Disorderly Conduct 1 0 1 1 0 1 0 0 0 0 4 0.13Disturbing Peace 6 5 7 2 3 0 6 3 0 0 32 1.00Vandalism 15 7 2 0 13 1 0 2 1 0 41 1.29Malicious Mischief 2 0 0 0 3 0 1 0 0 0 6 0.19Trespassing 5 6 4 3 0 5 5 1 4 0 33 1.04Weapons –Misdemeanor 4 0 0 0 5 0 1 0 5 0 15 0.47Drive Under the Influence -M 0 0 2 0 1 0 0 1 0 0 4 0.13Hit and Run –Misdemeanor 0 1 0 0 1 0 0 0 0 0 2 0.06Selected Traffic 1 0 1 0 0 0 0 0 0 0 2 0.06Joy Riding 11 1 0 0 1 0 4 1 0 0 18 0.57Other Misdemeanors 10 1 1 5 9 2 1 1 3 1 34 1.07Burglary Tools 2 1 1 0 0 0 1 1 0 0 6 0.19Sex Crimes - Misdemeanor 2 0 0 0 0 0 0 0 0 0 2 0.06Escape 1 0 1 0 0 0 0 0 0 0 2 0.06Probation Violation 71 21 8 5 34 6 16 1 8 4 174 5.46Miscellaneous Traffic 8 1 2 3 3 0 0 0 0 0 17 0.53Other Drugs –Misdemeanor 2 0 2 1 2 0 5 0 0 0 12 0.38Other Miscellaneous Codes 344 114 32 16 121 25 68 8 48 8 784 24.62
Total 1200 525 180 106 470 122 283 73 178 48 3185 100.00% 37.68 16.48 5.65 3.33 14.76 3.83 8.89 2.29 5.59 1.51 100.00

10
Calendar Year 2003
Referral Source Law Violations
N=3185
LAW ENFORCEMENT REFERRALS
Local Number Percent BART PD 9 San Francisco Police 1877
Total 1886 59.22
Out-of-County Police Departments Number Percent
Other County PD 2 PD San Mateo 2
Total 4 0.11 State Number Percent
California Highway Patrol 7 California State Police 2
Total 9 0.28 Federal Number Percent
Federal Park Police 6
Total 6 0.19
Total Law Enforcement Referrals 1905 59.81

11
Referral Source Law Violations -Calendar Year 2003 (Continued) Court Referrals Number Percent
Adult Court San Francisco 9 Alameda 17 Butte 1 Contra Costa 16 El Dorado 1 Fresno 2 Lake 1 Los Angeles 5 Marin 9 Merced 1 Napa 1 Placer 3 Sacramento 4 San Joaquin 1 San Mateo 102 Santa Clara 11 Santa Cruz 1 Shasta 1 Solano 21 Sonoma 2 Santa Barbara 2 Stanislaus 1 San Francisco Juvenile Court 17 Traffic Court 1
Total Court Referrals 230 7.22 Department/Agency Referrals Number Percent
California Youth Authority 5 CARC 237 Department of Human Services 1 Group Home 4 Institution 2 Log Cabin Ranch 12 Other 18 Probation Officer 757 Self 14
Total 1,050 32.97
Total Referrals - All Sources 3185 100.00

12
San Francisco Juvenile Probation Referrals
1988-2003
Total
Year
Year Law Violations Status Offenses88 7381 85589 6527 28490 5899 4791 5850 2792 5348 2093 5888 794 5679 1495 5341 1396 6038 997 5521 698 5222 2499 4872 200 4135 401 3963 502 3673 203 3185 0
0
1000
2000
3000
4000
5000
6000
7000
8000
88 89 90 91 92 93 94 95 96 97 98 99 00 01 02 03
Law Violations
Status Offenses

13
San Francisco Juvenile ProbationProbation Referrals (all sources) By Month
(2001-2003)
2001 Probation Referrals Jan Feb Mar Apr May Jun Jul Aug Sep Oct Nov Dec Total361 348 437 370 394 301 292 296 262 309 287 311 3968
2002 Probation Referrals Jan Feb Mar Apr May Jun Jul Aug Sep Oct Nov Dec Total308 320 318 305 384 240 286 283 315 333 294 289 3675
2003 Probation Referrals Jan Feb Mar Apr May Jun Jul Aug Sep Oct Nov Dec Total238 283 320 288 313 248 245 231 261 297 218 243 3185
2001 Probation Referrals
0
100
200
300
400
500
Jan Feb Mar Apr May Jun Jul Aug Sep Oct Nov Dec
Month
Pro
bat
ion
Ref
erra
ls
2002 Probation Referrals
0
100
200
300
400
500
Jan Feb Mar Apr May Jun Jul Aug Sep Oct Nov Dec
Month
Pro
bat
ion
Ref
erra
ls
2003 Probation Referrals
050
100150200250300350
Jan Feb Mar Apr May Jun Jul Aug Sep Oct Nov Dec
Month
Pro
bat
ion
Ref
erra
ls

14
Calendar Year 2003 Juvenile Hall Detention Referrals
N=2048
Sex Number Percent
Female 496 24.2 Male 1552 75.8
Total 2048 100.0
Race/Ethnic Origin Number Percent
African American 1147 56.0 Asian Indian 1 0.0 Cambodian 15 0.7 Chinese 69 3.4 Filipino 48 2.3 Hawaiian 0 0.0 Japanese 4 0.2 Korean 2 0.1 Laotian 0 0.0 Latin American 394 19.2 Native American 4 0.2 Other 47 2.3 Other Asian 30 1.5 Pacific Islander 1 0.0 Samoan 75 3.7 Vietnamese 29 1.4 White 182 8.9
Total 2048 100.0 Age Number Percent
11 years 7 0.3 12 years 43 2.1 13 years 120 5.9 14 years 286 14.0 15 years 427 20.8 16 years 524 25.6 17 years 524 25.6 18 years 112 5.5 Over 18 5 0.2
Total 2048 100.0 Primary Referral Sources Number Percent
Law Enforcement/Court/ San Francisco Police 1368 66.8 California Highway Patrol 5 0.2 State Police/Federal Park 8 0.4 Probation 667 32.6
Total 2048 100.0
(Continued Next Page)

15
Juvenile Hall Detention Referrals Calendar Year 2003 (Continued)
Day of Week Custody Intake Total Percent Monday 250 12.2 Tuesday 365 17.8 Wednesday 297 14.5 Thursday 366 17.9 Friday 421 20.6 Saturday 184 9.0 Sunday 165 8.1
Total 2048 100.0 Hour of Day Custody Intake 1 a.m. 157 7.7 2 a.m. 53 2.6 3 a.m. 56 2.7 4 a.m. 44 2.1 5 a.m. 18 0.9 6 a.m. 31 1.5 7 a.m. 15 0.7 8 a.m. 25 1.2 9 a.m. 61 3.0 10 a.m. 113 5.5 11 a.m. 135 6.6 Noon 145 7.1 1 p.m. 121 5.9 2 p.m. 130 6.3 3 p.m. 157 7.7 4 p.m. 141 6.9 5 p.m. 151 7.4 6 p.m. 107 5.2 7 p.m. 94 4.6 8 p.m. 85 4.2 9 p.m. 78 3.8 10 p.m. 52 2.5 11 p.m. to Midnight 79 3.9
Total 2048 100.0
(Continued Next Page)

16
Juvenile Hall Detention Referrals Calendar Year 2003 (Continued) Average Length of Stay1 Males Females Total Percent 1 day 91 60 151 7.4 2 days 196 83 279 13.6 3 days 293 60 353 17.2 4 days 113 36 149 7.3 5 days 104 25 129 6.3 6 days 89 17 106 5.2 7 days 56 17 73 3.6 8 - 14 days 212 67 279 13.6 15 - 21 days 97 36 133 6.5 22 - 29 days 73 24 97 4.7 30 days or more 228 71 299 14.6
Total 1552 496 2048 100.0 Released within 72 hours2 580 203 783 38.2 Released within 1 week 942 298 1240 60.5 Released within 2 weeks 1154 365 1519 74.2 Released within 3 weeks 1251 401 1652 80.7 Released within 30 days 1324 425 1749 85.4 Released more than 30 days 228 71 299 14.6
Total 1552 496 2048 100.0 1 Calculated at time of release 2Cumulative Percents NOTE: The number of detentions does not necessarily match the number of releases.

17
City and County of San Francisco2003 Juvenile Probation Detentions –Sorted Most to Least SeriousDetention Reason Using Department of Justice Summary Codes
Black White Hispanic Asian OtherDetention Reason Male Female Male Female Male Female Male Female Male Female Total %Willful Homicide 3 1 1 0 0 0 1 0 0 0 6 0.29Forcible Rape 0 0 0 0 3 0 0 0 0 0 3 0.15Robbery 133 35 14 0 28 5 19 1 24 1 260 12.70Assault 72 40 21 2 35 9 42 2 11 3 237 11.57Kidnapping 1 1 0 0 0 0 0 0 1 0 3 0.15Burglary 48 9 2 2 16 2 12 2 2 2 97 4.74Theft 14 4 1 4 5 2 2 1 2 0 35 1.71Motor Vehicle Theft 37 7 6 1 3 3 5 0 4 0 66 3.22Forgery, Checks, Access Cards 0 0 0 1 1 0 0 0 0 0 2 0.10Narcotics 33 33 2 2 42 11 3 0 1 1 128 6.25Marijuana –Felony 14 3 5 0 2 0 1 0 0 0 25 1.22Dangerous Drugs 1 1 2 0 2 1 2 0 0 0 9 0.44Child Molest –Felony 3 0 0 0 2 0 0 0 1 0 6 0.29Sexual Battery 11 0 0 0 3 0 0 0 0 0 14 0.68Weapons –Felony 20 0 1 0 6 1 0 0 2 0 30 1.46Drive Under the Influence -F 0 0 0 0 1 0 0 0 0 0 1 0.05Hit and Run –Felony 0 0 0 0 1 0 0 0 0 0 1 0.05Arson 1 0 2 1 0 0 0 0 0 0 4 0.20Other Felonies 9 1 8 0 7 1 3 1 2 0 32 1.56Assault Battery 31 7 9 5 9 5 2 0 1 1 70 3.42Petty Theft 23 27 3 2 6 3 1 3 0 2 70 3.42Defrauding Innkeeper 2 0 0 0 0 1 0 0 0 0 3 0.15Prostitution 1 24 0 6 0 6 0 3 0 0 40 1.95Drunk 0 0 0 0 0 0 0 0 1 0 1 0.05Liquor Laws 0 0 0 0 1 0 0 0 0 0 1 0.05Disorderly Conduct 0 0 1 1 0 1 0 0 0 0 3 0.15Disturbing Peace 0 0 6 1 0 0 0 2 0 0 9 0.44Vandalism 2 2 0 0 3 0 0 0 1 0 8 0.39Malicious Mischief 1 0 0 0 0 0 0 0 0 0 1 0.05Trespassing 2 0 1 1 0 1 0 0 0 0 5 0.24Weapons –Misdemeanor 1 0 0 0 0 0 0 0 1 0 2 0.10Drive Under the Influence -M 0 0 2 0 0 0 0 0 0 0 2 0.10Hit and Run –Misdemeanor 0 1 0 0 1 0 0 0 0 0 2 0.10Selected Traffic 1 0 0 0 0 0 0 0 0 0 1 0.05Joy Riding 2 0 0 0 0 0 0 0 0 0 2 0.10Other Misdemeanors 3 1 0 5 3 1 0 1 1 0 15 0.73Burglary Tools 0 0 0 0 0 0 0 1 0 0 1 0.05Escape 1 0 1 0 0 0 0 0 0 0 2 0.10Probation Violation 33 9 4 4 20 3 10 0 5 4 92 4.49Miscellaneous Traffic 1 0 1 2 0 0 0 0 0 0 4 0.20Other Drugs –Misdemeanor 2 0 1 1 1 0 3 0 0 0 8 0.39Other Miscellaneous Codes 327 108 30 16 115 23 66 8 47 7 747 36.47
Total 833 314 124 57 316 79 172 25 107 21 2048 100.00% 40.67 15.33 6.05 2.78 15.43 3.86 8.40 1.22 5.22 1.03 100.00

18
Juvenile Hall Detention ReferralsAnalysis of the Prior Probation Contacts
of Youth Admitted to Juvenile Hall in 2003N=2048
PriorContact (s) Total
0 5271 2512 1813 1744 1455 1156 1087 1098 859 68
10 5411 3912 3113 3014 3115 2616 2217 1318 619 620 721 3
22-28 17
Total
Number of Prior Probation Contacts
0
100
200
300
400
500
600
0 1 2 3 4 5 6 7 8 9 10 11 12 13 14 15 16 17 18 19 20 21 22-28

19
Calendar Year 2003
Juvenile Hall Detention Referrals By Geographical Residence of Youth
Geographical Residence Total Percent Bayview 354 17.3 Haight Ashbury/Castro 13 0.6 Ingleside (West of Twin Peaks) 126 6.2 Inner Mission 106 5.2 Marina 14 0.7 North of Market/Downtown 22 1.1 Outer Mission 332 16.2 Parkside 32 1.6 Potrero 47 2.3 Richmond 38 1.9 South of Market/Tenderloin 51 2.5 Sunset 47 2.3 Treasure Island/Yerba Buena 19 0.9 Western Addition 231 11.3 1Non-San Francisco and Unknown 616 30.1
Total 2048 100.0 1Non-San Francisco and Unavailable
Oakland 94 15.3% Unavailable 69 11.2% Daily City 33 5.4% Richmond 29 4.7% Vallejo 25 4.1% Sacramento 21 3.4% San Andreas 14 2.3% Fresno 11 1.8% San Jose 9 1.5% South San Francisco 9 1.5% Other Cities 302 49.0%
Total 616 100.0%

20
San Francisco Juvenile ProbationJuvenile Hall Admissions By Month
(Calendar Years 2001-2003)
2001 Admissions Jan Feb Mar Apr May Jun Jul Aug Sep Oct Nov Dec Total210 197 260 220 209 176 174 190 145 173 170 178 2302
2002 Admissions Jan Feb Mar Apr May Jun Jul Aug Sep Oct Nov Dec Total193 160 181 185 213 145 177 173 179 206 183 164 2159
2003 Admissions Jan Feb Mar Apr May Jun Jul Aug Sep Oct Nov Dec Total144 156 181 189 191 176 145 158 179 208 151 170 2048
2001 Admissions to Juvenile Hall
0
100
200
300
400
500
Jan Feb Mar Apr May Jun Jul Aug Sep Oct Nov Dec
Month
Num
ber
of A
dmis
sion
s
2002 Admissions to Juvenile Hall
0
100
200
300
400
500
Jan Feb Mar Apr May Jun Jul Aug Sep Oct Nov Dec
Month
Num
ber
of A
dmis
sion
s
2003 Admissions to Juvenile Hall
0
100
200
300
400
500
Jan Feb Mar Apr May Jun Jul Aug Sep Oct Nov Dec
Month
Num
ber
of A
dmis
sion
s

21
San Francisco Juvenile ProbationJuvenile Hall Average Daily Population By Month
(Calendar Years 2001-2003)
2001 Avg. Daily Pop. Jan Feb Mar Apr May Jun Jul Aug Sep Oct Nov Dec Total120 122 134 130 132 119 109 110 107 92 97 102 115
2002 Avg. Daily Pop. Jan Feb Mar Apr May Jun Jul Aug Sep Oct Nov Dec Total113 96 113 103 102 100 97 104 96 116 108 95 104
2003 Avg. Daily Pop. Jan Feb Mar Apr May Jun Jul Aug Sep Oct Nov Dec Total86 93 90 88 94 92 89 80 84 100 98 92 91
2001 Average Daily Population
020406080
100120140160
Jan Feb Mar Apr May Jun Jul Aug Sep Oct Nov Dec
Month
Ave
rage
Dai
ly P
opul
atio
n
2002 Average Daily Population
020
4060
80
100120140
Jan Feb Mar Apr May Jun Jul Aug Sep Oct Nov Dec
Month
Ave
rage
Dai
ly P
opul
atio
n
2003 Average Daily Population
0
20
40
60
80
100
120
Jan Feb Mar Apr May Jun Jul Aug Sep Oct Nov Dec
Month
Ave
rage
Dai
ly P
opul
atio
n

22
Detainees on December 31st, 2003 Sex Frequency Percent Cumulative
Percent Female 10 12.0 12.0 Male 73 88.0 100.0
Total 83 100.0 Race/Ethnic Origin Frequency Percent Cumulative
Percent African American 48 57.8 57.8 Chinese 1 1.2 59.0 Filipino 5 6.0 65.1 Hispanic 17 20.5 85.5 Other 3 3.6 89.2 Samoan 2 2.4 91.6 Vietnamese 1 1.2 92.8 White 6 7.2 100.0
Total 83 100.0 Age Frequency Percent Cumulative
Percent 12 1 1.2 1.2 13 4 4.8 6.0 14 3 3.6 9.6 15 17 20.5 30.1 16 26 31.3 61.4 17 25 30.1 91.6 18 7 8.4 100.0
Total 83 100.0

23
Detainees on December 31st, 2003 School
Frequency Percent Cumulative
Percent BALBOA HS 1 1.2 1.2 BAY HIGH 3 3.6 4.8 BURTON HS 2 2.4 7.2 CHALLENGE TO LEARNING 1 1.2 8.4 DOWNTOWN HS 1 1.2 9.6 EVERETT MS 1 1.2 10.8 FRANKLIN MS 2 2.4 13.3 GALILEO HS 4 4.8 18.1 GIANNINI 2 2.4 20.5 HS - NOT IN ANY 1 1.2 21.7 INDEPENDENT LEARNING CENTER 1 1.2 22.9 JEFFERSON 1 1.2 24.1 LICK MS 1 1.2 25.3 LINCOLN HS 1 1.2 26.5 LOG CABIN RANCH SCHOOL 4 4.8 31.3 MARINA MS 1 1.2 32.5 MARTIN LUTHER KING JR MS 1 1.2 33.7 MISSION EDUCATION CENTER 2 2.4 36.1 MISSION HS 3 3.6 39.8 MT. ST. JOSEPH 1 1.2 41.0 NO ASSIGNED SCHOOL 7 8.4 49.4 NON-SAN FRANCISCO 8 9.6 59.0 NOT CURRENTLY ATTENDING 15 18.1 77.1 NOT ENROLLED 1 1.2 78.3 PHOENIX 3 3.6 81.9 RAP 1 1.2 83.1 SCHOOL OF THE ARTS 2 2.4 85.5 SPEC ED - NON PUBLIC 2 2.4 88.0 UNITY JR. HIGH SCHOOL 1 1.2 89.2 UNKNOWN 1 1.2 90.4 WASHINGTON HS 1 1.2 91.6 WELLS HS 4 4.8 96.4 YGC 3 3.6 100.0 Total 83 100.0

24
Detainees on December 31st, 2003
Geographical Residence of Youth
Frequency Percent
Bayview 13 15.66%
Haight Ashbury/Castro/Upper Market 1 1.20%
Ingleside (West Twin Peaks) 4 4.82%
Inner Mission 6 7.23%
Marina 0 0.00%
North of Market/Downtown 0 0.00%
Outer Mission 20 24.10%
Parkside 1 1.20%
Potrero 4 4.82%
Richmond 3 3.61%
South of Market/Tenderloin 4 4.82%
Sunset 3 3.61%
Treasure Island/Yerba Buena 2 2.41%
Western Addition 7 8.43%1Non-San Francisco and Unknown 15 18.07%
Total 83 100.00%
1Non-San Francisco and Unknown
Frequency Percent
Campbell 1 1.20%
Clearlake Oaks 1 1.20%
Daly City 2 2.41%
Lakeport 1 1.20%
Orangevale 2 2.41%
Sacramento 1 1.20%
San Andreas 1 1.20%
San Mateo 1 1.20%
Unknown 4 4.82%
Vallejo 1 1.20%Total 15 18.07%

25
Detainees on December 31st, 2003 Length of Stay
Frequency
Percent
Cumulative Percent
1 day 2 2.4 2.4 2 days 4 4.8 7.2 3 days 2 2.4 9.6 4 days 3 3.6 13.3 5 days 1 1.2 14.5 6 days 6 7.2 21.7 7 days 2 2.4 24.1 8-14 days 7 8.4 32.5 15-21 days 9 10.8 43.4 22-29 days 6 7.2 50.6 30 days or more 41 49.4 100.0
Total 83 100.0 Prior Juvenile Probation Referrals
Frequency
Percent
Cumulative Percent
No Prior Probation Referrals 8 9.6 9.6 1 Probation Referral 6 7.2 16.9 2 Probation Referrals 5 6.0 22.9 3 Probation Referrals 9 10.8 33.7 4 Probation Referrals 5 6.0 39.8 5 Probation Referrals 2 2.4 42.2 6-12 Probation Referrals 33 39.8 81.9 13-20 Probation Referrals 12 14.5 96.4 21 or More Probation Referrals 3 3.6 100.0
Total 83 100.0

26
Detainees on December 31st, 2003 Cumulative Time of Detention Frequency Percent Percent 1 a.m. 6 7.2 7.2 2 a.m. 2 2.4 9.6 3 a.m. 2 2.4 12.0 4 a.m. 1 1.2 13.3 6 a.m. 2 2.4 15.7 7 a.m. 1 1.2 16.9 8 a.m. 1 1.2 18.1 9 a.m. 3 3.6 21.7 10 a.m. 1 1.2 22.9 11 a.m. 9 10.8 33.7 Noon 7 8.4 42.2 1 p.m. 4 4.8 47.0 2 p.m. 7 8.4 55.4 3 p.m. 5 6.0 61.4 4 p.m. 6 7.2 68.7 5 p.m. 6 7.2 75.9 6 p.m. 3 3.6 79.5 7 p.m. 5 6.0 85.5 8 p.m. 3 3.6 89.2 9 p.m. 3 3.6 92.8 10 p.m. 3 3.6 96.4 11 p.m. to midnight 3 3.6 100.0 ------- ------- ------- Total 83 100.0 100.0

27
Characteristics of Juvenile Hall Detainees on December 31st, 2003Using CJIS Code from the California Department of Justice
Detention Reason Offense Code Count %ACCESSORY 32 PC 1 1.20%AGGRAVATED MAYHEM 205 PC 1 1.20%ASSAULT:DEADLY WEAPON OR FORCE:POSSIBLE GREAT BODILY INJ 245 (A) PC 2 2.41%ATTEMPTED MURDER 664 /187 (A) PC 6 7.23%BATTERY ON PEACE OFFICER/EMERGENCY PERSONNEL/ETC W/INJURY 242 /243 PC 2 2.41%BURGLARY 459 PC 4 4.82%CARJACKING 215 PC 2 2.41%CHANGE OF PLACEMENT/PLACEMENT FAILURE 737 WI 8 9.64%COURT ORDER 602 CTORD 602 XX 9 10.84%DISORDERLY CONDUCT:PROSTITUTION 647 (B) PC 1 1.20%FAIL TO OBEY ORDER OF JUVENILE COURT 602 WI 777 (A)(2) WI 10 12.05%FORCE OR ADW NOT FIREARM:GBI LIKELY 245 (A)(1) PC 4 4.82%INFLICT CORPORAL INJURY ON SPOUSE/COHABITANT 273.5 PC 2 2.41%MURDER 187 (A) PC 4 4.82%OBSTRUCT/RESIST/ETC PUBLIC/PEACE OFFICER/EMERGENCY MED TECH 148 (A)(1) PC 1 1.20%POSSESS MARIJUANA FOR SALE 11359 HS 1 1.20%POSSESS NARCOTIC CONTROLLED SUBSTANCE 11350 (A) HS 4 4.82%POSSESS/PURCHASE COCAINE BASE FOR SALE 11351.5 HS 1 1.20%ROBBERY 211 PC 1 1.20%ROBBERY:SECOND DEGREE 212.5(C) PC 5 6.02%SEXUAL PENETRATION WITH FORCE/ETC 289 (A)(1) PC 2 2.41%TRANSPORT/SELL NARCOTIC/CONTROLLED SUBSTANCE 11352 (A) HS 2 2.41%VIOLATION(S) OF HOME SUPERVISION CONDITION 628.1 WI 5 6.02%WARRANT 602 WRNT602 XX 5 6.02%
Total 83 100.00%

28
Detainees on December 31st, 2003
Age by Gender Sex Age Female Male Total 12 0 1 1 13 0 4 4 14 1 2 3 15 2 15 17 16 2 24 26 17 4 21 25 18 1 6 7
Total 10 73 83 % 12.0% 88.0% 100%
Race/Ethnic Groups by GenderFemale Male Total Percent
African American 4 44 48 57.83%
Chinese 1 0 1 1.20%
Filipino 1 4 5 6.02%
Latin American 2 15 17 20.48%
Other 1 2 3 3.61%
Samoan 0 2 2 2.41%
Vietnamese 0 1 1 1.20%
White 1 5 6 7.23%
TOTAL 10 73 83 100.00%
29
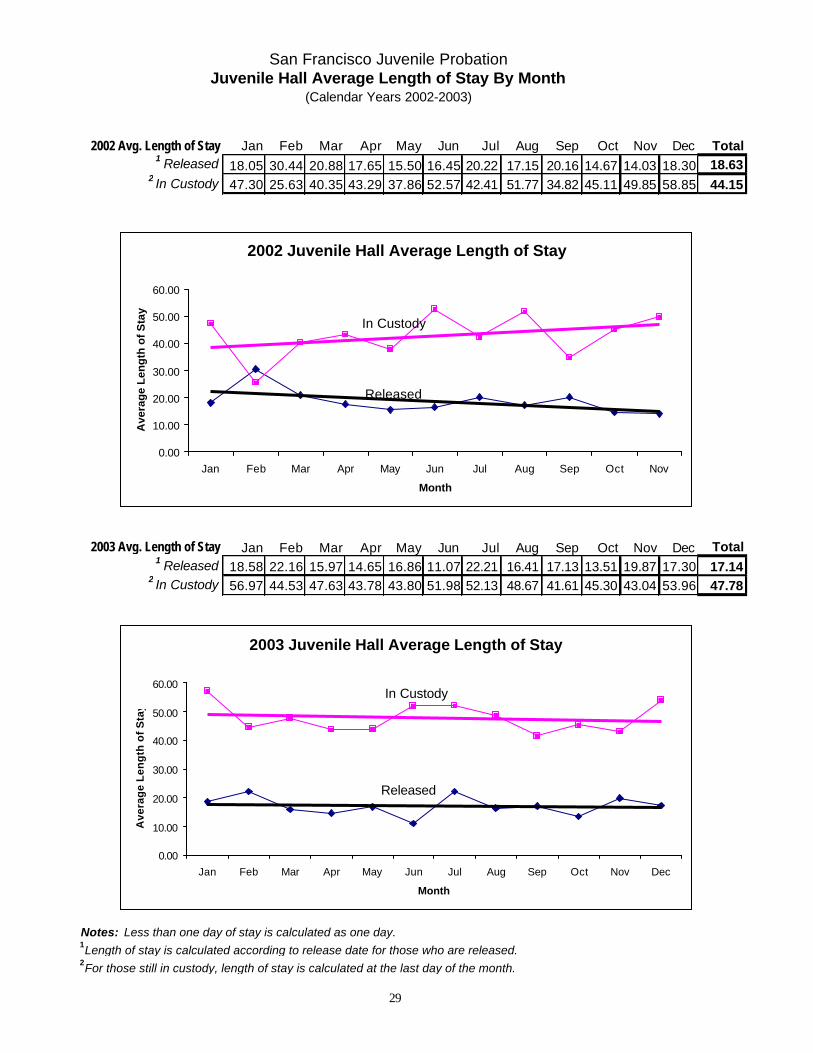
San Francisco Juvenile ProbationJuvenile Hall Average Length of Stay By Month
(Calendar Years 2002-2003)
2002 Avg. Length of Stay Jan Feb Mar Apr May Jun Jul Aug Sep Oct Nov Dec Total1 Released 18.05 30.44 20.88 17.65 15.50 16.45 20.22 17.15 20.16 14.67 14.03 18.30 18.63
2 In Custody 47.30 25.63 40.35 43.29 37.86 52.57 42.41 51.77 34.82 45.11 49.85 58.85 44.15
2003 Avg. Length of Stay Jan Feb Mar Apr May Jun Jul Aug Sep Oct Nov Dec Total1 Released 18.58 22.16 15.97 14.65 16.86 11.07 22.21 16.41 17.13 13.51 19.87 17.30 17.14
2 In Custody 56.97 44.53 47.63 43.78 43.80 51.98 52.13 48.67 41.61 45.30 43.04 53.96 47.78
Notes: Less than one day of stay is calculated as one day.1Length of stay is calculated according to release date for those who are released.2For those still in custody, length of stay is calculated at the last day of the month.
2002 Juvenile Hall Average Length of Stay
0.00
10.00
20.00
30.00
40.00
50.00
60.00
Jan Feb Mar Apr May Jun Jul Aug Sep Oct Nov
Month
Ave
rag
e L
eng
th o
f S
tay
2003 Juvenile Hall Average Length of Stay
0.00
10.00
20.00
30.00
40.00
50.00
60.00
Jan Feb Mar Apr May Jun Jul Aug Sep Oct Nov Dec
Month
Ave
rag
e L
eng
th o
f S
tay
In Custody
Released
In Custody
Released

30
Petitions Filed for Law Violations1984-2003
Year Petitions84 193285 188286 187887 213888 236789 240490 197491 176992 182493 200994 191395 174896 186597 172298 162099 156800 146001 145102 140103 1189
Total
Year
1000
1200
1400
1600
1800
2000
2200
2400
2600
84 85 86 87 88 89 90 91 92 93 94 95 96 97 98 99 00 01 02 03

31
City and County of San Francisco2003 Juvenile Probation Petition Reasons
–Sorted Most to Least Serious Reason Using Department of Justice Summary Codes
Black White Hispanic Asian OtherPetition Reason Male Female Male Female Male Female Male Female Male Female Total %Willful Homicide 8 1 1 0 0 0 4 2 1 0 17 1.43Forcible Rape 1 0 0 0 1 0 0 0 0 0 2 0.17Robbery 109 30 10 0 21 5 17 0 21 1 214 18.00Assault 54 32 11 1 22 4 33 0 10 1 168 14.13Kidnapping 1 0 1 0 1 0 2 0 2 0 7 0.59Burglary 39 9 4 2 14 5 13 2 2 3 93 7.82Theft 15 9 1 2 4 1 5 0 2 2 41 3.45Motor Vehicle Theft 30 7 2 1 1 2 5 0 2 0 50 4.21Forgery, Checks, Access Cards 0 1 0 1 1 1 0 2 0 0 6 0.50Narcotics 33 32 4 2 37 9 5 0 3 0 125 10.51Marijuana –Felony 11 4 7 0 3 0 3 0 1 0 29 2.44Dangerous Drugs 1 1 1 1 1 0 3 1 0 0 9 0.76Other Drug Law Violation 0 1 0 0 0 0 0 0 0 0 1 0.08Child Molest –Felony 6 0 0 0 2 0 0 0 2 0 10 0.84Sexual Battery 3 0 0 0 2 0 0 0 0 0 5 0.42Weapons –Felony 20 0 1 0 4 0 2 0 2 0 29 2.44Hit and Run –Felony 0 0 0 0 1 0 0 0 0 0 1 0.08Arson 0 0 1 1 0 0 0 0 0 0 2 0.17Other Felonies 12 2 1 1 14 0 7 0 2 0 39 3.28Assault Battery 20 3 4 2 6 1 2 2 5 1 46 3.87Petty Theft 6 9 0 0 6 2 1 1 2 5 32 2.69Defrauding Innkeeper 0 0 0 1 0 0 0 0 0 0 1 0.08Annoying Children 0 0 0 0 1 0 0 0 0 0 1 0.08Lewd Conduct-Misdemeanor 0 1 0 0 0 0 0 0 0 0 1 0.08Prostitution 1 5 0 2 1 1 0 1 0 0 11 0.93Liquor Laws 0 0 1 0 1 0 0 0 0 0 2 0.17Disturbing Peace 1 0 0 0 0 0 2 0 1 0 4 0.34Vandalism 2 3 1 0 3 0 0 0 0 0 9 0.76Malicious Mischief 0 0 0 0 1 0 0 0 0 0 1 0.08Weapons –Misdemeanor 1 0 1 0 0 0 0 0 4 0 6 0.50Drive Under the Influence 0 0 0 0 1 0 0 0 0 0 1 0.08Hit and Run –Misdemeanor 0 1 0 0 1 0 0 0 0 0 2 0.17Selected Traffic 0 0 1 0 1 0 0 0 0 0 2 0.17Joy Riding 1 0 0 0 1 0 0 0 1 0 3 0.25Other Misdemeanors 2 4 0 0 0 1 0 2 0 0 9 0.76Sex Crimes - Misdemeanor 1 0 0 0 1 0 0 0 0 0 2 0.17Probation Violation 72 21 6 2 37 5 17 1 5 4 170 14.30Miscellaneous Traffic 3 0 0 0 1 0 0 0 0 0 4 0.34Other Drugs –Misdemeanor 0 0 0 1 2 0 0 0 0 0 3 0.25Other Miscellaneous Codes 13 6 0 0 6 2 1 0 2 1 31 2.61
Total 466 182 59 20 199 39 122 14 70 18 1189 100.00% 39.19 15.31 4.96 1.68 16.74 3.28 10.26 1.18 5.89 1.51 100.00

32
City and County of San Francisco2003 Juvenile Probation Petitions Sustained
–Sorted Most to Least Serious Petition Sustained Using Department of Justice Summary Codes
Black White Hispanic Asian OtherPetition Sustained Male Female Male Female Male Female Male Female Male Female Total %Robbery 14 2 1 0 2 2 1 0 4 0 26 3.48Assault 18 7 4 1 5 2 8 0 5 0 50 6.69Burglary 20 8 1 2 6 2 7 2 2 2 52 6.96Theft 47 15 5 1 9 1 4 1 11 1 95 12.72Motor Vehicle Theft 5 0 1 1 1 0 2 0 1 0 11 1.47Forgery, Checks, Access Cards 0 0 0 0 0 1 0 0 0 0 1 0.13Narcotics 2 4 0 0 6 0 0 0 0 0 12 1.61Marijuana –Felony 0 0 0 0 1 0 0 0 0 0 1 0.13Dangerous Drugs 0 0 0 0 0 0 2 0 0 0 2 0.27Child Molest –Felony 0 0 0 0 2 0 0 0 0 0 2 0.27Sexual Battery 1 0 0 0 1 0 0 0 0 0 2 0.27Weapons –Felony 9 0 1 0 3 0 1 0 2 0 16 2.14Hit and Run –Felony 0 0 0 0 1 0 0 0 0 0 1 0.13Arson 1 0 0 1 0 0 0 0 0 0 2 0.27Other Felonies 39 29 5 1 25 5 15 1 7 0 127 17.00Assault Battery 36 12 6 2 10 2 7 1 9 2 87 11.65Petty Theft 16 9 1 0 11 4 2 0 3 2 48 6.43Defrauding Innkeeper 0 0 0 1 2 1 3 0 0 0 7 0.94Checks, Access Cards 0 1 0 1 0 0 0 2 0 0 4 0.54Marijuana –Misdemeanor 3 0 0 0 0 0 0 0 0 0 3 0.40Annoying Children 0 0 0 0 1 0 0 0 0 0 1 0.13Prostitution 2 2 0 0 1 0 0 1 0 0 6 0.80Liquor Laws 0 0 0 0 1 0 0 0 0 0 1 0.13Disturbing Peace 2 4 2 0 1 0 1 0 0 0 10 1.34Vandalism 3 3 2 0 3 0 0 0 0 0 11 1.47Malicious Mischief 1 0 0 0 1 0 0 0 0 0 2 0.27Trespassing 1 0 0 0 0 0 0 0 0 0 1 0.13Weapons –Misdemeanor 3 0 0 0 1 0 1 0 3 0 8 1.07Drive Under the Influence-Misd. 0 0 0 0 1 0 0 0 0 0 1 0.13Joy Riding 10 3 0 0 1 1 1 0 0 0 16 2.14Other Misdemeanors 4 2 0 1 1 0 0 1 0 0 9 1.20Sex Crimes -Misdemeanor 0 0 0 0 1 0 0 0 0 0 1 0.13Probation Violation 41 9 4 1 25 5 12 1 3 3 104 13.92Miscellaneous Traffic 2 1 0 0 2 0 0 0 0 0 5 0.67Other Drugs-Misdemeanor 0 0 0 1 1 0 0 0 0 0 2 0.27Other Miscellaneous Codes 8 3 0 0 5 2 1 0 1 0 20 2.68
Total 288 114 33 14 131 28 68 10 51 10 747 100.00% 38.55 15.26 4.42 1.87 17.54 3.75 9.10 1.34 6.83 1.34 100.00

33
Current Statuson December 31st, 2003
Voluntary Informal Formal FormalSEX Probation Probation Probation Probation Total Percent
(602WI) (602WI) (602WI) (601WI)
Male 34 15 437 0 486 81.4
Female 8 8 95 0 111 18.6
42 23 532 0 597 100.0
Voluntary Informal Formal FormalRace/Ethnic Groups Probation Probation Probation Probation Total Percent
(602WI) (602WI) (602WI) (601WI)
African American 25 15 286 0 326 54.6
Cambodian 0 0 3 0 3 0.5
Chinese 0 0 21 0 21 3.5
Filipino 1 0 13 0 14 2.3
Hawaiian 0 0 1 0 1 0.2
Japanese 0 0 0 0 0 0.0
Korean 0 0 1 0 1 0.2
Laotian 0 0 1 0 1 0.2
Latin American 6 5 115 0 126 21.1
Native American 1 0 0 0 1 0.2
Other 2 3 21 0 26 4.4
Other Asian 3 0 12 0 15 2.5
Pacific Islander 0 0 1 0 1 0.2
Samoan 2 0 19 0 21 3.5
Vietnamese 0 0 6 0 6 1.0
White 2 0 32 0 34 5.7
TOTAL 42 23 532 0 597 100.0

34
Current Statuson December 31st, 2003 (Continued)
Voluntary Informal Formal FormalAGE Probation Probation Probation Probation Total Percent
(602WI) (602WI) (602WI) (601WI)
12 0 0 8 0 8 1.3
13 0 0 13 0 13 2.2
14 11 2 26 0 39 6.5
15 9 5 82 0 96 16.1
16 9 9 123 0 141 23.6
17 8 3 140 0 151 25.3
18 and over 5 4 140 0 149 25.0
TOTAL 42 23 532 0 597 100.0
Voluntary Informal Formal FormalGeographical Residence Probation Probation Probation Probation Total Percent
(602WI) (602WI) (602WI) (601WI)
Bayview 8 9 100 0 117 19.6
Haight Ashbury/Castro/Upper Market 1 0 11 0 12 2.0
Ingleside (West Twin Peaks) 4 2 40 0 46 7.7
Inner Mission 4 3 29 0 36 6.0
Marina 0 0 4 0 4 0.7
North of Market/Downtown 0 0 5 0 5 0.8
Outer Mission 8 5 106 0 119 19.9
Parkside 0 0 18 0 18 3.0
Potrero 3 1 12 0 16 2.7
Richmond 0 0 19 0 19 3.2
South of Market/Tenderloin 1 1 18 0 20 3.4
Sunset 1 0 13 0 14 2.3
Treasure Island/Yerba Buena 0 0 5 0 5 0.8
Western Addition 4 1 70 0 75 12.61Non-San Francisco and Unknown 8 1 82 0 91 15.2
TOTAL 42 23 532 0 597 100.0
1 Non-San Francisco 89 and Unknown 2
35
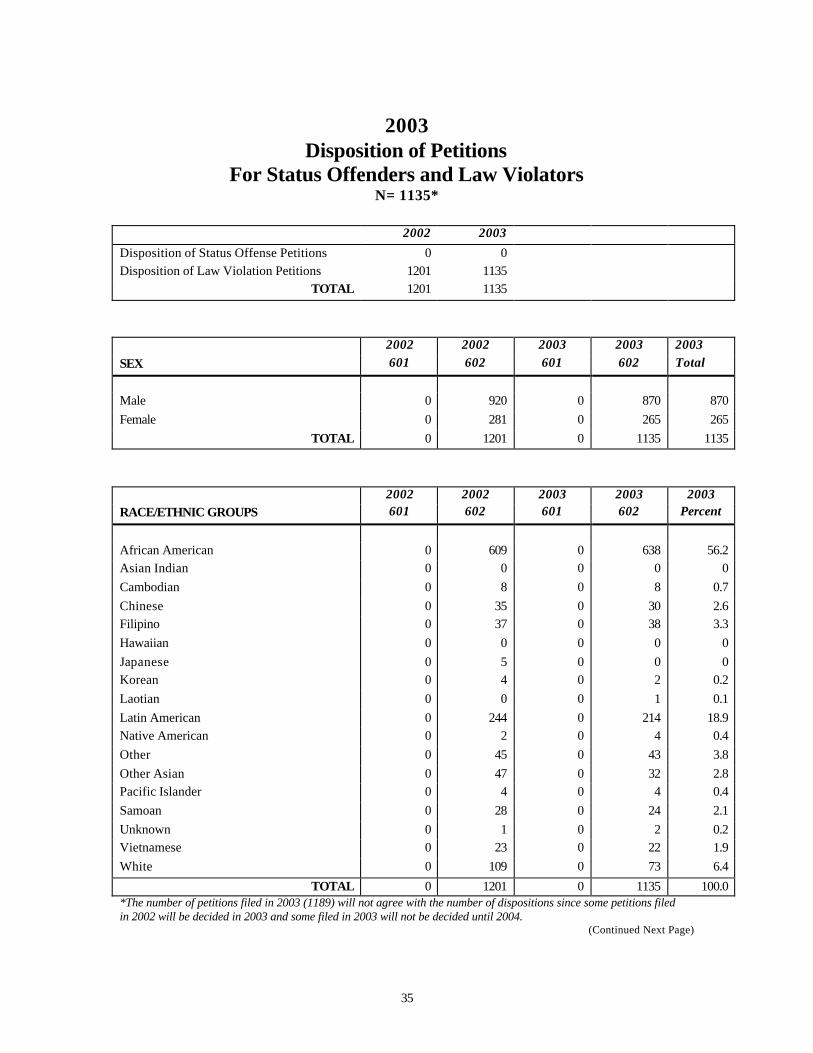
2003
Disposition of Petitions For Status Offenders and Law Violators
N= 1135* 2002 2003 Disposition of Status Offense Petitions 0 0 Disposition of Law Violation Petitions 1201 1135
TOTAL 1201 1135
2002 2002 2003 2003 2003 SEX 601 602 601 602 Total
Male 0 920 0 870 870 Female 0 281 0 265 265
TOTAL 0 1201 0 1135 1135
2002 2002 2003 2003 2003 RACE/ETHNIC GROUPS 601 602 601 602 Percent
African American 0 609 0 638 56.2 Asian Indian 0 0 0 0 0 Cambodian 0 8 0 8 0.7 Chinese 0 35 0 30 2.6 Filipino 0 37 0 38 3.3 Hawaiian 0 0 0 0 0 Japanese 0 5 0 0 0 Korean 0 4 0 2 0.2 Laotian 0 0 0 1 0.1 Latin American 0 244 0 214 18.9 Native American 0 2 0 4 0.4 Other 0 45 0 43 3.8 Other Asian 0 47 0 32 2.8 Pacific Islander 0 4 0 4 0.4 Samoan 0 28 0 24 2.1 Unknown 0 1 0 2 0.2 Vietnamese 0 23 0 22 1.9 White 0 109 0 73 6.4
TOTAL 0 1201 0 1135 100.0 *The number of petitions filed in 2003 (1189) will not agree with the number of dispositions since some petitions filed in 2002 will be decided in 2003 and some filed in 2003 will not be decided until 2004.
(Continued Next Page)

36
2003 Disposition of Petitions
For Status Offenders and Law Violators (Continued) N= 1135*
2002 2002 2002 2003 2003 2003 02-03 602 601 Total 602 601 Total Percent
Change
PETITION OUTCOME* California Youth Authority 18 0 18 14 0 14 -22.22 Log Cabin Ranch 40 0 40 32 0 32 -20.00 Out-of-Home Placement 156 0 156 152 0 152 -2.56 Voluntary Probation 126 0 126 139 0 139 10.32 Formal Probation 445 0 445 363 0 363 -18.43 Informal Probation 44 0 44 46 0 46 4.55 Dismissed 257 0 257 303 0 303 17.90 Remand to Adult Court 1 0 1 0 0 0 -100.00 Transfer out to Another County 114 0 114 86 0 86 -24.56
TOTAL 1201 0 1201 1135 0 1135 -5.50
*Juvenile Hall Commitments (26) and stayed commitments to Juvenile Hall: 1 overlap with other dispositions and therefore are not reported on the table. In 102 cases, charges on other petitions were combined and only one disposition resulted. In 29 cases community service was ordered, fines were assessed in 140 instances. Restitution was ordered in 76 cases. Three cases were referred for California Youth Authority Evaluation. There were 148 transfers from other jurisdictions.

37
Commitments to The California Youth Authority1984-2003
Year CYA84 6685 5986 4887 2988 2889 2490 2291 2692 2093 3294 2795 2796 2397 1598 1099 1400 1901 1802 1803 14
Total
Year
0
10
20
30
40
50
60
70
80
90
100
84 85 86 87 88 89 90 91 92 93 94 95 96 97 98 99 00 01 02 03

38
Remands to Adult Court1979-2003
Year Remands79 1580 1581 2382 1383 684 785 1486 987 388 089 690 1491 892 793 1294 1295 1096 397 498 299 200 501 002 103 0
Total
Year
0
5
10
15
20
25
79 80 81 82 83 84 85 86 87 88 89 90 91 92 93 94 95 96 97 98 99 00 01 02 03

39
Court DispositionsCalifornia Youth Authority-Remands-Log Cabin Ranch
1990-2003
Total
Year
Year CYA Remands LCR90 22 14 11191 26 8 7992 20 7 11593 32 12 10694 27 12 9995 26 10 9696 23 3 6597 15 4 6698 10 4 5599 14 2 4500 19 5 7001 18 0 4102 18 1 4003 14 0 32
0
20
40
60
80
100
120
140
90 91 92 93 94 95 96 97 98 99 00 01 02 03
CYA
RemandsLCR

40
Log Cabin RanchAdmission-Average Daily Population-Graduation
1990-2003
Total
Year
Year Admissions Avg. Daily Pop. Graduations90 104 41 5791 79 30 4092 115 40 4293 106 38 5194 99 40 2395 96 45 5896 65 64 5597 66 52 5098 55 43 5399 47 43 4400 70 42 3201 41 41 6002 40 22 1803 29 23 33
0
20
40
60
80
100
120
140
90 91 92 93 94 95 96 97 98 99 00 01 02 03
Admissions
Avg. Daily Pop.Graduations

41
Calendar Year 2003 Profile of Girls Law Violation By
Age and Race
Age Number Percent
11 Years 5 0.6 12 Years 32 3.7 13 Years 66 7,6 14 Years 144 16.5 15 Years 192 22.0 16 Years 207 23.7 17 Years 205 23.5 18 Years 23 2.6
Total 874 100.0
Race/Ethnic Origin Number Percent
African American 525 60.1 Asian Indian 0 0 Cambodian 4 0.5 Chinese 11 1.3 Filipino 18 2.1 Hawaiian 1 0.1 Japanese 0 0 Korean 0 0 Laotian 0 0 Latin American 122 14.0 Native American 1 0.1 Other 29 3.3 Other Asian 36 4.1 Pacific Islander 2 0.2 Samoan 15 1.7 Vietnamese 4 0.5 White 106 12.1
Total 874 100.0
42
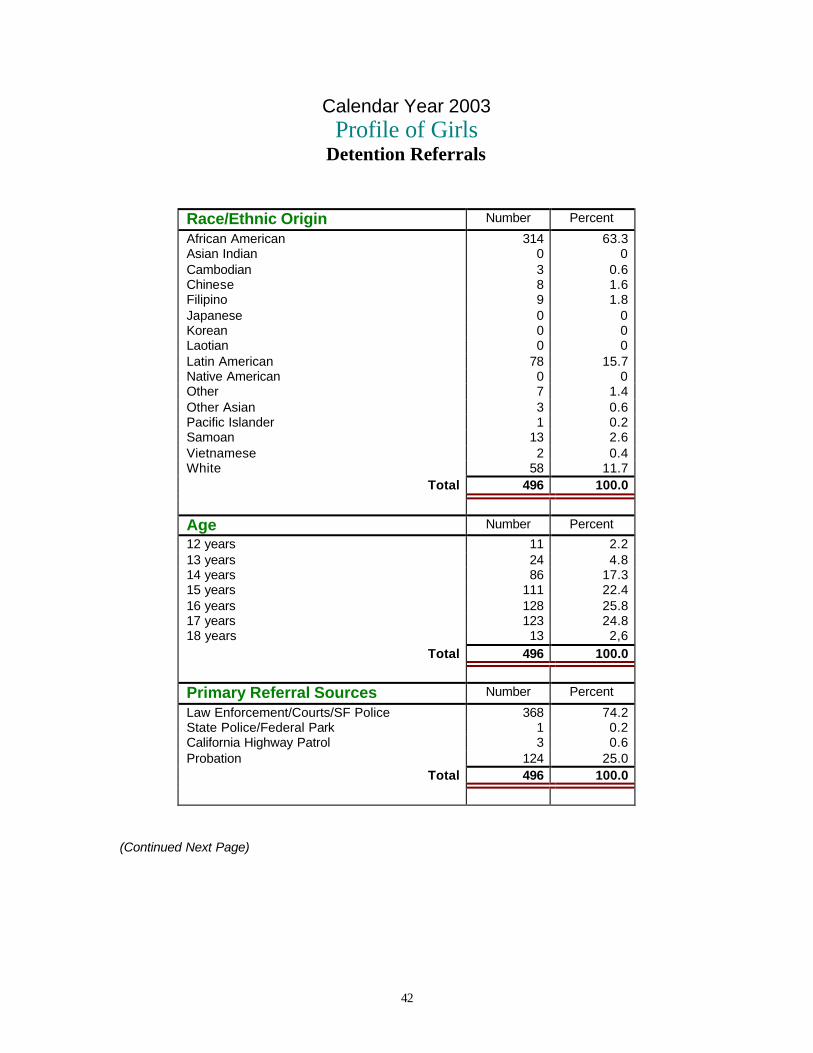
Calendar Year 2003 Profile of Girls
Detention Referrals
Race/Ethnic Origin Number Percent
African American 314 63.3 Asian Indian 0 0 Cambodian 3 0.6 Chinese 8 1.6 Filipino 9 1.8 Japanese 0 0 Korean 0 0 Laotian 0 0 Latin American 78 15.7 Native American 0 0 Other 7 1.4 Other Asian 3 0.6 Pacific Islander 1 0.2 Samoan 13 2.6 Vietnamese 2 0.4 White 58 11.7
Total 496 100.0
Age Number Percent
12 years 11 2.2 13 years 24 4.8 14 years 86 17.3 15 years 111 22.4 16 years 128 25.8 17 years 123 24.8 18 years 13 2,6
Total 496 100.0
Primary Referral Sources Number Percent
Law Enforcement/Courts/SF Police 368 74.2 State Police/Federal Park 1 0.2 California Highway Patrol 3 0.6 Probation 124 25.0
Total 496 100.0
(Continued Next Page)

43
Profile of Girls Detention Referrals Calendar Year 2003 (Continued)
Day of Week Custody Intake Total Percent
Monday 60 12.1 Tuesday 93 18.8 Wednesday 73 14.7 Thursday 96 19.4 Friday 91 18.3 Saturday 45 9.1 Sunday 38 7.7
Total 496 100.0
Hour of Day Custody Intake
1 a.m. 46 9.3 2 a.m. 13 2.6 3 a.m. 16 3.2 4 a.m. 18 3.6 5 a.m. 3 0.6 6 a.m. 10 2.0 7 a.m. 4 0.8 8 a.m. 4 0.8 9 a.m. 13 2.6 10 a.m. 22 4.4 11 a.m. 35 7.1 Noon 24 4.8 1 p.m. 24 4.8 2 p.m. 30 6.0 3 p.m. 37 7.5 4 p.m. 28 5.6 5 p.m. 22 4.4 6 p.m. 26 5.2 7 p.m. 20 4.0 8 p.m. 19 3.8 9 p.m. 30 6.0 10 p.m. 17 3.4 11 p.m. to midnight 35 7.1
Total 496 100.0
(Continued Next Page)

44
Profile of Girls Detention Referrals Calendar Year 2003 (Continued) Average Length of Stay1 Total Percent
1 day 60 12.1 2 days 83 16.7 3 days 60 12.1 4 days 36 7.3 5 days 25 5.0 6 days 17 3.4 7 days 17 3.4 8 - 14 days 67 13.5 15 - 21 days 36 7.3 22 - 29 days 24 4.8 30 days or more 71 14.3
Total 496 100.0 Released within 72 hours2 203 40.9 Released within 1 week 298 60.1 Released within 2 weeks 365 73.6 Released within 3 weeks 401 80.8 Released within 30 days 425 85.7
Released more than 30 days 71 14.3
Total 496 100.0
1Calculated at time of release 2Cumulative Percents NOTE: The number of detentions does not necessarily match the number of releases.

45
Calendar Year 2003 Detention Referrals -Profile of Girls By Geographical Residence of Youth
N=4961
Geographical Residence Total Percent Bayview 74 14.9 Haight Ashbury/Castro/Upper Market 3 0.6 Ingleside (West of Twin Peaks) 38 7.7 Inner Mission 19 3.8 Marina 3 0.6 North of Market/Downtown 2 0.4 Outer Mission 57 11.5 Parkside 5 1.0 Potrero 13 2.6 Richmond 1 0.2 South of Market/Tenderloin 20 4.0 Sunset 10 2.0 Treasure Island/Yerba Buena Island 1 0.2 Western Addition 47 9.5 Non-San Francisco and Unavailable 203 40.9
Total 496 100.0 1Non-San Francisco and Unavailable
Oakland 44 21.67% Richmond 10 4.93% San Jose 8 3.94% Daly City 8 3.94% Vallejo 6 2.96% Sacramento 5 2.46% San Leandro 4 1.97% San Mateo 3 1.48% Other Cities 89 43.84% Unavailable 26 12.81%
Total 203 100.0%

46
Detention Referrals -Girls ProfileAnalysis of the Prior Probation Contactsof Girls Admitted to Detention in 2003
N=496
Prior Contact Total
0 1661 692 523 464 365 186 267 238 169 12
10 911 312 413 414 215 316 317 118 3
Total
Number of Prior Probation Contacts
0
20
40
60
80
100
120
140
160
180
0 1 2 3 4 5 6 7 8 9 10 11 12 13 14 15 16 17 18

47
Log Cabin Ranch 32 2.69%
San Francisco Juvenile Probation Processing of Law Violation Cases Calendar Year 2003
Out of Home Placement 152 12.78%
Informal Probation ‘725’ Probation 46 3.87%
Formal Probation 363 30.53%
California Youth Authority 14 1.18%
Transferred Out of County 86 7.23%
Voluntary Probation Dismissed For ‘654 WI’ 139 11.69%
Combined Dispositions 102 8.58%
Petition OutcomesPetition Filed 1189 37.33%
No Petition Filed 1996 62.66%
Referrals 3185
Juvenile Hall Detentions 2048 64.30%
Petition Dismissed 303 25.48%