San Francisco Bay: Preparing for the next level · San Francisco Bay: Preparing for the next level...
57
San Francisco Bay: Preparing for the next level 21 September 2009 In collaboraon with:
Transcript of San Francisco Bay: Preparing for the next level · San Francisco Bay: Preparing for the next level...

San Francisco Bay: Preparing for the next level
21 September 2009
In collaboration with:
San Francisco Bay: Preparing for the next level
21 September 2009

5
Acknowledgements
This report provides new insights on the impacts climate change poses on San Francisco Bay, the opportunities this challenge brings and some potential guidelines on how to move forward, as the Bay Area continues to position itself in leading the way nationally and internationally on climate change adaptation.
This report is also a landmark in the cooperation between the Netherlands and California on climate change adaptation. A dedicated team of professionals from both sides of the ocean has worked on this project to bring the best of both worlds together.
The team members on this project are: David van Raalten, Thijs van der Laan, Peter Wijsman, Ludo Boeije, Eric Schellekens, Piet Dircke and Bob Pyke of ARCADIS, Eddy Moors and Saskia van Pelt of Alterra-Wageningen University, Edwin Elias and Jos Dijkman of Deltares and Will Travis, Brad McCrea, Joe LaClair and Steve Goldbeck of BCDC.
This report would have never seen the daylight without the excellent input and reflection from many stakeholders around the Bay, including: Bay Planning Coalition, California Natural Resources Agency, US Army Corps of Engineers, Port and Airport of Oakland, San Francisco Public Utilities Commission, San Francisco International Airport, Santa Clara Valley Water District, Pacific Institute, Stanford University, UC Berkeley, California Ocean Protection Council, Coastal Conservancy, Cargill Salt and Redwood City Salt Works.
This study was conducted with financial support of Partners for Water, the Royal Netherlands Embassy, Delta Alliance, ARCADIS, Deltares and Alterra-Wageningen University.
In collaboration with:
Financial support:

6 7
Contents
PreFACe 8
COMPONeNT 1 Impact of sea-level rise on the San Francisco Bay 26
COMPONeNT 2 Potential measures and Strategy Development Method (SDM) 42
COMPONeNT 3 Institutional and organizational approaches 82
COMPONENT 4 Scope for future cooperation 98

8 9
PREFACE
10 11
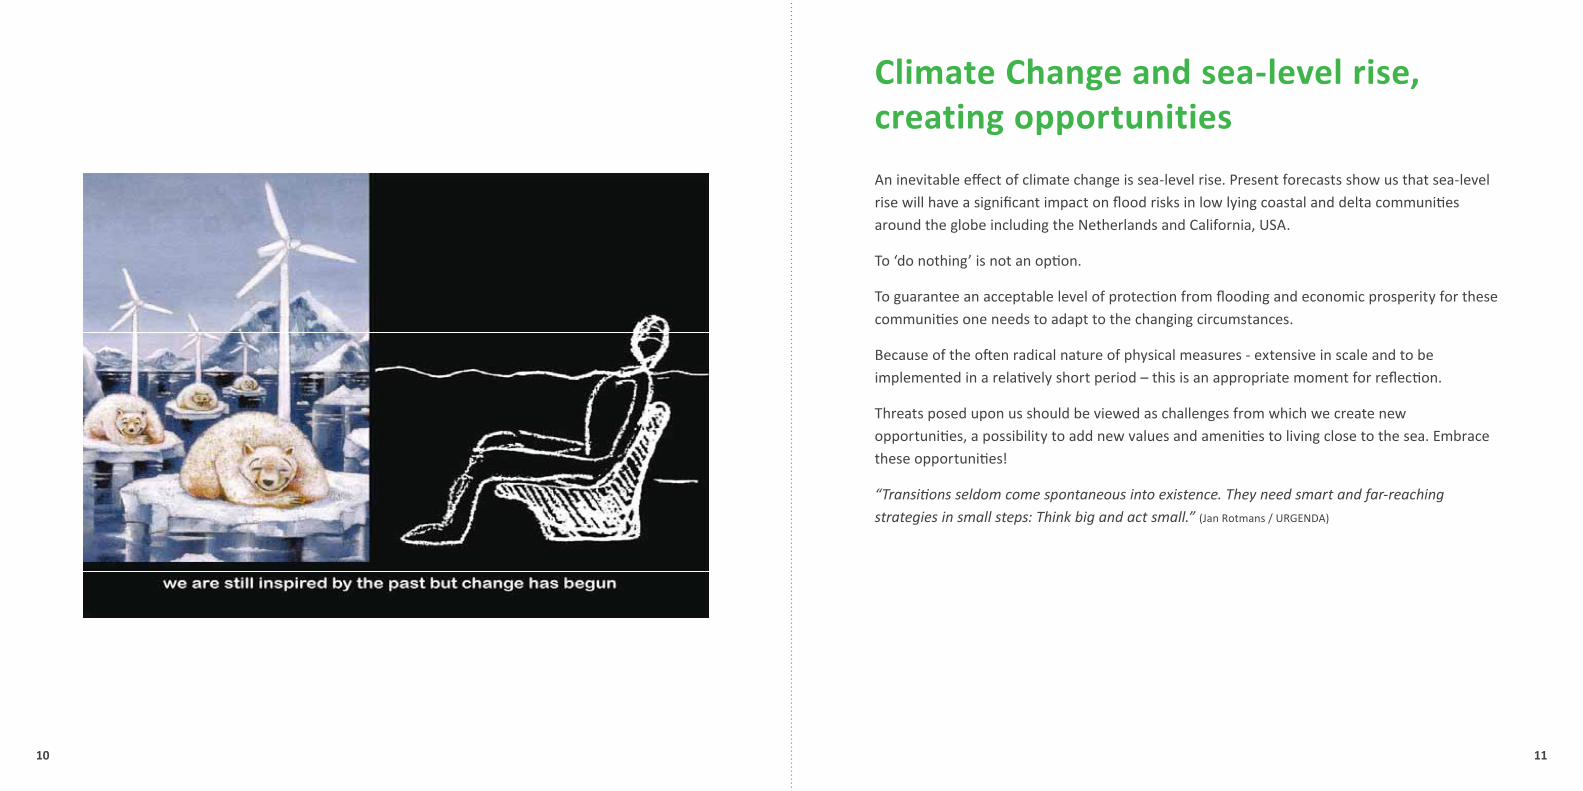
Climate Change and sea-level rise, creating opportunities
An inevitable effect of climate change is sea-level rise. Present forecasts show us that sea-level rise will have a significant impact on flood risks in low lying coastal and delta communities around the globe including the Netherlands and California, USA.
To ‘do nothing’ is not an option.
To guarantee an acceptable level of protection from flooding and economic prosperity for these communities one needs to adapt to the changing circumstances.
Because of the often radical nature of physical measures - extensive in scale and to be implemented in a relatively short period – this is an appropriate moment for reflection.
Threats posed upon us should be viewed as challenges from which we create new opportunities, a possibility to add new values and amenities to living close to the sea. Embrace these opportunities!
“Transitions seldom come spontaneous into existence. They need smart and far-reaching strategies in small steps: Think big and act small.” (Jan Rotmans / URGENDA)

12 13
San Francisco Bay
“A richly varied composite and nature exist in and around San Francisco Bay. Urban waterfronts, critical habitat areas, industrial areas and residential neighborhoods coexist within walking distance of each other. Overlaid on these shorelines is a vital system of public infrastructure, including freeways, seaports, railroads and airports …….” (from Living with a rising Bay; BCDC, 7 April 2009)
Shoreline locations are highly appreciated for residential development and commercial activities despite the vulnerability of these low lying coastal areas. Over the last century vast areas along the shoreline of the Bay have been intensively developed, including areas on low-lying reclaimed land and subsided land. As a result the Bay Area has a diverse landscape, from wetlands to Silicon Valley, from salt ponds to seaports, and from San Francisco’s urban downtown to the region’s international airports.
As a consequence flood defenses are necessary to provide an acceptable level of flood safety. Most of these areas are protected against a Base Flood Elevation (BFE 1:100) by different types of defense structures. Areas beneath BFE level are categorized for emergency procedures in case of a flood event and insurance purposes.
Sea-level rise increases the importance of an adequate flood defense system: adaptive to future sea-level rise and resilient to seismic events.

15
The impact of sea-level rise on the California coastOver the past year extremely useful reports have been prepared by renowned agencies, such as “Living with a Rising Bay: Vulnerability and Adaptation in San Francisco Bay and on the Shoreline” by the BCDC, “The impacts of Sea-Level Rise on the California Coast” by the California Climate Change Center and “Preparing California for a Changing Climate” by the Public Policy Institute of California. All reports stress the importance of climate change, and the necessity ‘to take action’.
Some striking aspects in those studies – also in comparison to the Dutch situation - are the following:Flood safety is generally defined by Base Flood Elevation (BFE 1:100). In the above mentioned •
studies, the area threatened by flooding is based on the comparison between the terrain-level and water level (rise), ignoring the effect of sea barriers such as levees and seawalls protecting these areas.
The reports emphasize several scenarios for sea-level rise, going up to 1.4 m (55 inches) by the •
year 2100. The effect of increased storm surge is not taken into account. However there is general consensus that today’s 100-year event may well be the normal water level by the year 2050, with a predicted sea-level rise of 16 inches.
Historical development has followed the natural grading of the landscape. The large areas •
relatively recent developed are the lower lying areas and the part that were filled. These are as a consequence already within the present and hence future BFE boundaries. The area with the current BFE flood risk (light blue areas) is much larger than the additional surface area that would be impacted by a 55 inch to sea-level rise BFE 2100 (dark blue areas) because of the sudden grade change.
Responsibility for construction, operation and maintenance and climate proofing of flood •
defenses is fragmented (federal, state, regional, private). Because there is a gap in adequate information on the current status of the flood protection •
structures, the urgency in the climate change studies is only stressed from a view point as if the defenses weren’t there. There seems to be a lack of information and uncertainty of the effect of a flood risk event in the current situation.

17
The Netherlands, the Low Countries
There is a historical sense of urgency on flood safety in the Netherlands. There is a recorded history of severe flood events since the 10th century, and public water awareness has always been a part of the collective memory of the Dutch. The western part of the country became even more vulnerable as polders were created; water was pumped out and land subsided in the centuries following, while at the same time development was increasingly concentrated in these low lying western regions of the Netherlands.
As a result institutions like water boards were founded with the responsibility to provide flood protection, starting in the 12th century and onwards. Funding was provided through a property tax. Together with the willingness of the population to financially contribute, these are the founding characteristics of the Dutch flood defense system. The current flood defense system, the way it is constructed, maintained and the way it is being adapted to withstand and absorb the effects of climate change, is shaped by heritage of this historical process.
19
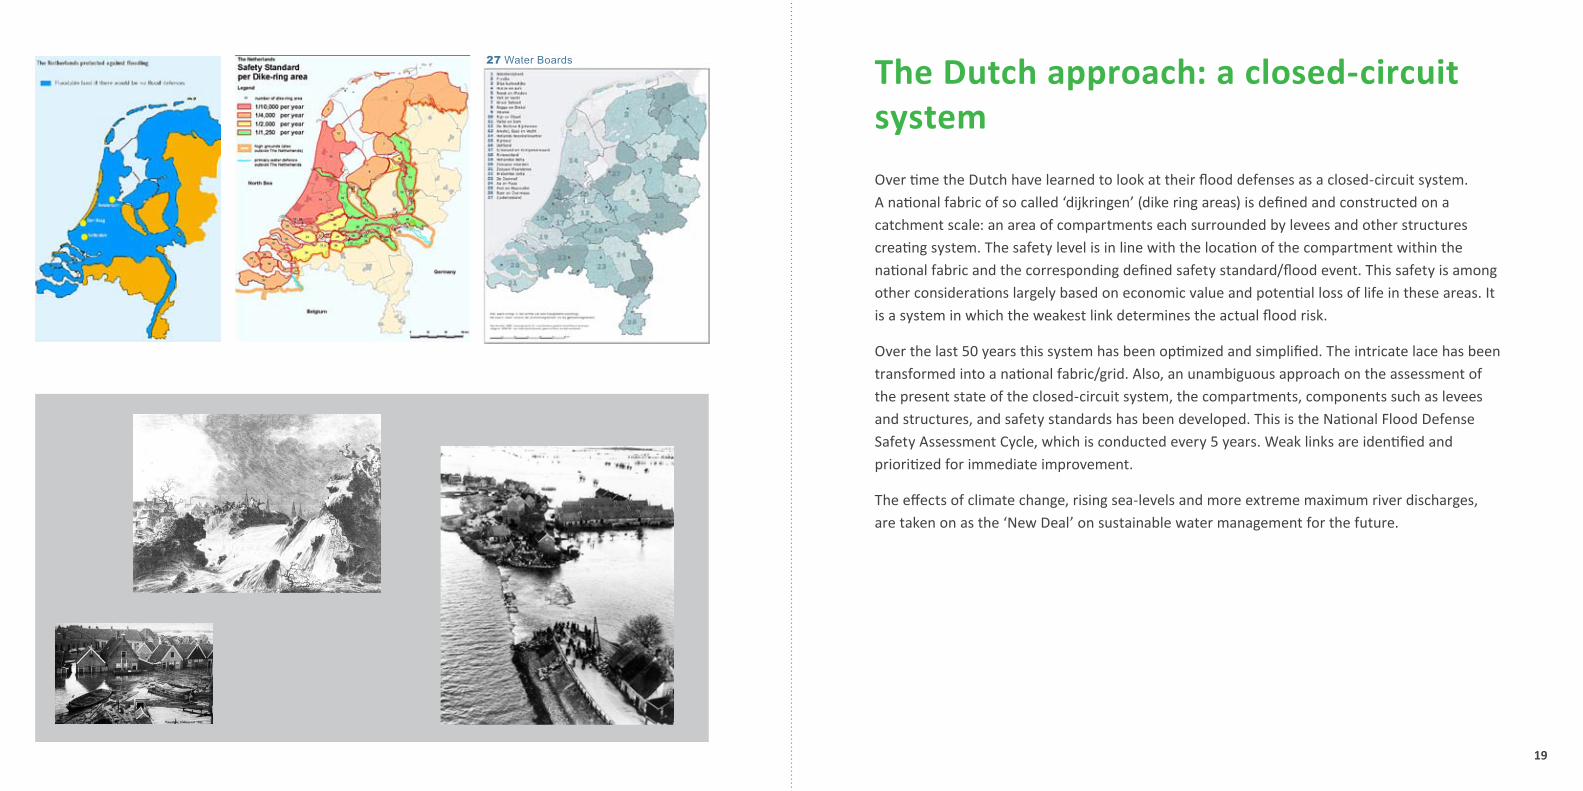
The Dutch approach: a closed-circuit system
Over time the Dutch have learned to look at their flood defenses as a closed-circuit system. A national fabric of so called ‘dijkringen’ (dike ring areas) is defined and constructed on a catchment scale: an area of compartments each surrounded by levees and other structures creating system. The safety level is in line with the location of the compartment within the national fabric and the corresponding defined safety standard/flood event. This safety is among other considerations largely based on economic value and potential loss of life in these areas. It is a system in which the weakest link determines the actual flood risk.
Over the last 50 years this system has been optimized and simplified. The intricate lace has been transformed into a national fabric/grid. Also, an unambiguous approach on the assessment of the present state of the closed-circuit system, the compartments, components such as levees and structures, and safety standards has been developed. This is the National Flood Defense Safety Assessment Cycle, which is conducted every 5 years. Weak links are identified and prioritized for immediate improvement.
The effects of climate change, rising sea-levels and more extreme maximum river discharges, are taken on as the ‘New Deal’ on sustainable water management for the future.
27 Water Boards

20 21
The new approach - 2nd Delta Committee Advice
The famous Delta Works were the Dutch answer to the severe 1953 floods. The 1st Delta Committee initiated these works and proposed a set of flood risk standards, which still comprise the legal standards today.
Four decades later the circumstances have changed. The number of citizens and the invested capital protected by the Dutch levees and dunes has doubled since. Additionally anticipated climate change impacts will make storm conditions more severe at sea and cause an increased chance of river flooding.
Especially climate change demands a long term vision on water management and flood protection. This will be the basis for future policy development. The 2nd Delta Committee Report provides both this long term vision and suggestions for concrete measures in the short term. The 2nd Delta Committee proposes region specific approaches for flood protection and water supply embedded in a National Delta Plan.
The Dutch Government is about to implement the majority of the delta Committee Advices into the National Water Policy Plan. The implementation will comprise an extensive Delta program, a special Delta Law and a Delta Fund with guaranteed yearly budgets. In the framework of the National Water Policy Plan new standards for flood protection will be developed, which take into account the actual invested capital and potential loss of life.
22 23
Some key figures
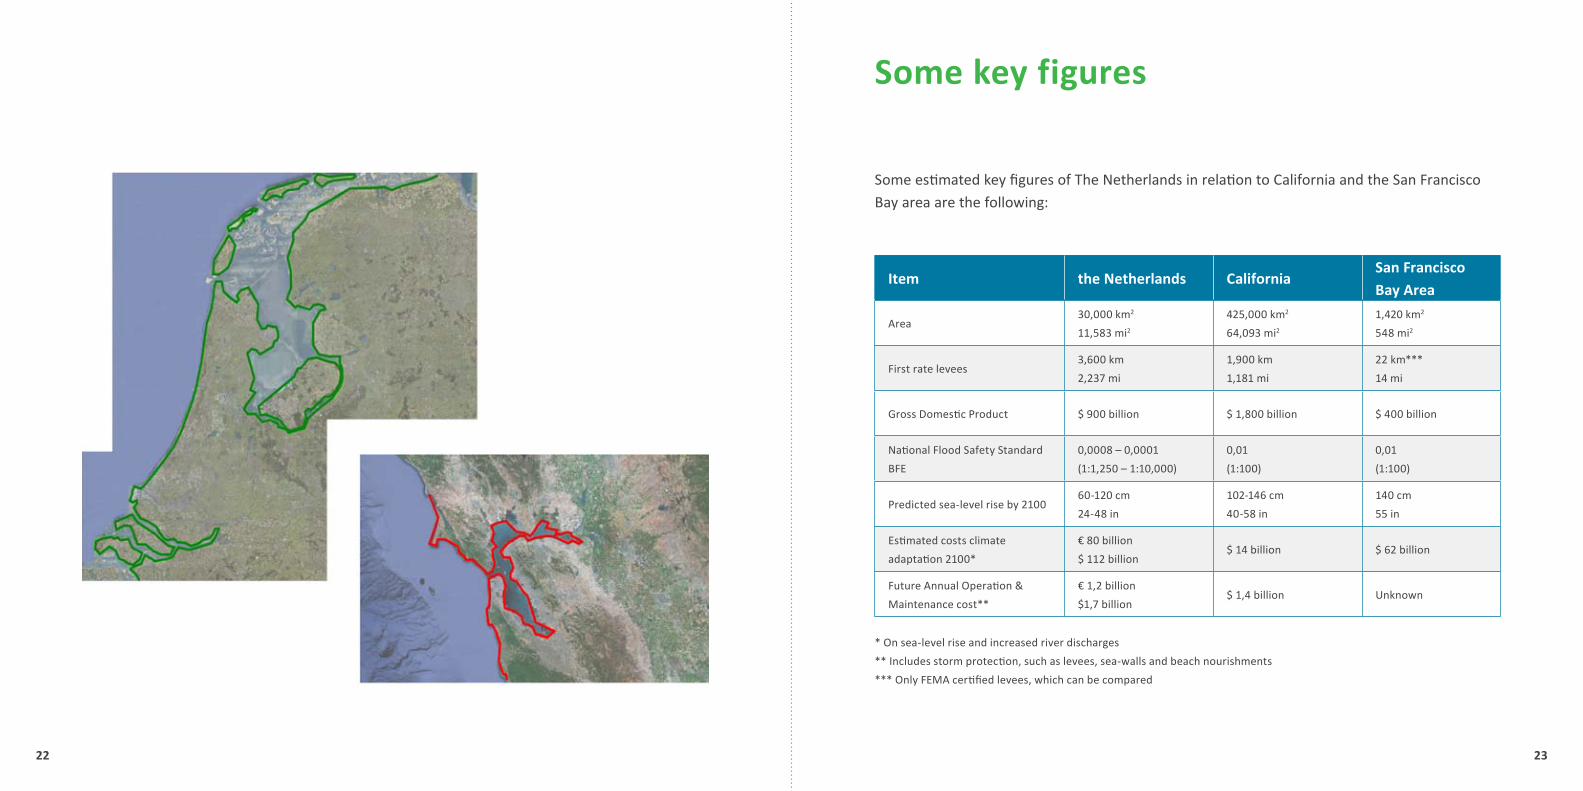
Some estimated key figures of The Netherlands in relation to California and the San Francisco Bay area are the following:
* On sea-level rise and increased river discharges
** Includes storm protection, such as levees, sea-walls and beach nourishments
*** Only FEMA certified levees, which can be compared
Item the Netherlands California San Francisco Bay Area
Area 30,000 km2
11,583 mi2
425,000 km2
64,093 mi2
1,420 km2
548 mi2
First rate levees 3,600 km
2,237 mi
1,900 km
1,181 mi
22 km***
14 mi
Gross Domestic Product $ 900 billion $ 1,800 billion $ 400 billion
National Flood Safety Standard
BFE
0,0008 – 0,0001
(1:1,250 – 1:10,000)
0,01
(1:100)
0,01
(1:100)
Predicted sea-level rise by 210060-120 cm
24-48 in
102-146 cm
40-58 in
140 cm
55 in
Estimated costs climate
adaptation 2100*
€ 80 billion
$ 112 billion $ 14 billion $ 62 billion
Future Annual Operation &
Maintenance cost**
€ 1,2 billion
$1,7 billion$ 1,4 billion Unknown

24 25
Components of the project
Based on the described situation in this Preface, there are a range of aspects relevant to be further explored in the attempt to formulate appropriate climate change adaptation strategies for the Bay Area. In this pilot the focus has been on four components, all being presented in this report:
COMPONeNT 1 Impact of sea-level rise on the San Francisco Bay This component deals with the technical analysis of the impacts of sea-level rise by making use of the Dutch hydraulic model Delft3D, a model to investigate hydrodynamics, sediment transport and morphology and water quality for fluvial, estuarine and coastal environments. For this project the water levels, flow velocities and fluxes, and wave height have been studied more in detail.
COMPONeNT 2 Potential measures and Strategy Development Method (SDM) A lot of measures are applicable in the attempt to adapt to sea-level rise in the Bay Area. These measures are structured in a matrix providing a total overview of potential measures ranging from purely technical to total concepts and even more can be added. In the Appendix Measures - on the right side - these measures are illustrated.
To be able to make choices between all those potential measures, a classification of the Bay Area in shoreline typologies is provided and a Strategy Development Method based on Tidal Rise Intentions is presented. This SDM is providing a conceptual framework for choosing appropriate measures as part of an adaptation strategy. A few specific locations have been further elaborated as an example.
COMPONeNT 3 Institutional and organizational approaches While discussing possible physical measures, it became ample clear that there are several institutional and organizational differences between the Netherlands and California on how to deal with water management. Differences related to policy making, administrative levels, laws and policy instruments, actors and responsibilities, knowledge development and sharing, and culture. These differences are analyzed and presented in a SWOT, and several challenges and opportunities identified.
COMPONeNT 4 Scope for future cooperation This pilot project clearly shows the value of working together in an international context on the issue of climate change adaptation strategies. It also shows that joining hands in the effort to define appropriate strategies brings us to higher levels. Jointly we position ourselves in leading the way nationally and internationally on climate change adaptation. There is ample scope for future cooperation on a wide range of possible topics and themes. This can be done through concrete (pilot) projects, research programs, advisory services, product development, exchange programs and alliances.
26 27
COMPONENT 1
Impact of sea-level rise on the San Francisco Bay

29
Shoreline areas vulnerable to sea-level rise
Global warming is expected to result in a sea-level rise in San Francisco Bay of 55 inches (1.4m) by the end of the century putting an estimated 270,000 people and an estimated $62 billion in economic resources at risk of flooding (BCDC, 2009). These numbers clearly underscore the need to act. A recent study of USGS (Knowles, 2008) presents a comprehensive analysis of future inundation due to sea-level rise in the Bay Area. The modeling results presented in this report uses the Delft3D model to refine (rather than improve or replace) the main findings of the USGS report and to extend the sea-level rise research to include an analysis of velocities, waves and to some degree sediment transport. Due to time constraints, this report focuses on South Bay in part because it is a focal point of economic activity. The multi-functional Delft3D model supports sediment transport computations; however, the sediment transport module needs extensive validation, calibration and most likely improvement in order to present valid results in complex areas such as San Francisco Bay. Sediment transport results are, therefore, not presented.
Source: Inundation data from Knowles, 2008. From BCDC 2009.
Light blue: 16 inch sea-level rise
Dark blue: 55 inch sea-level rise
30 31
research approach
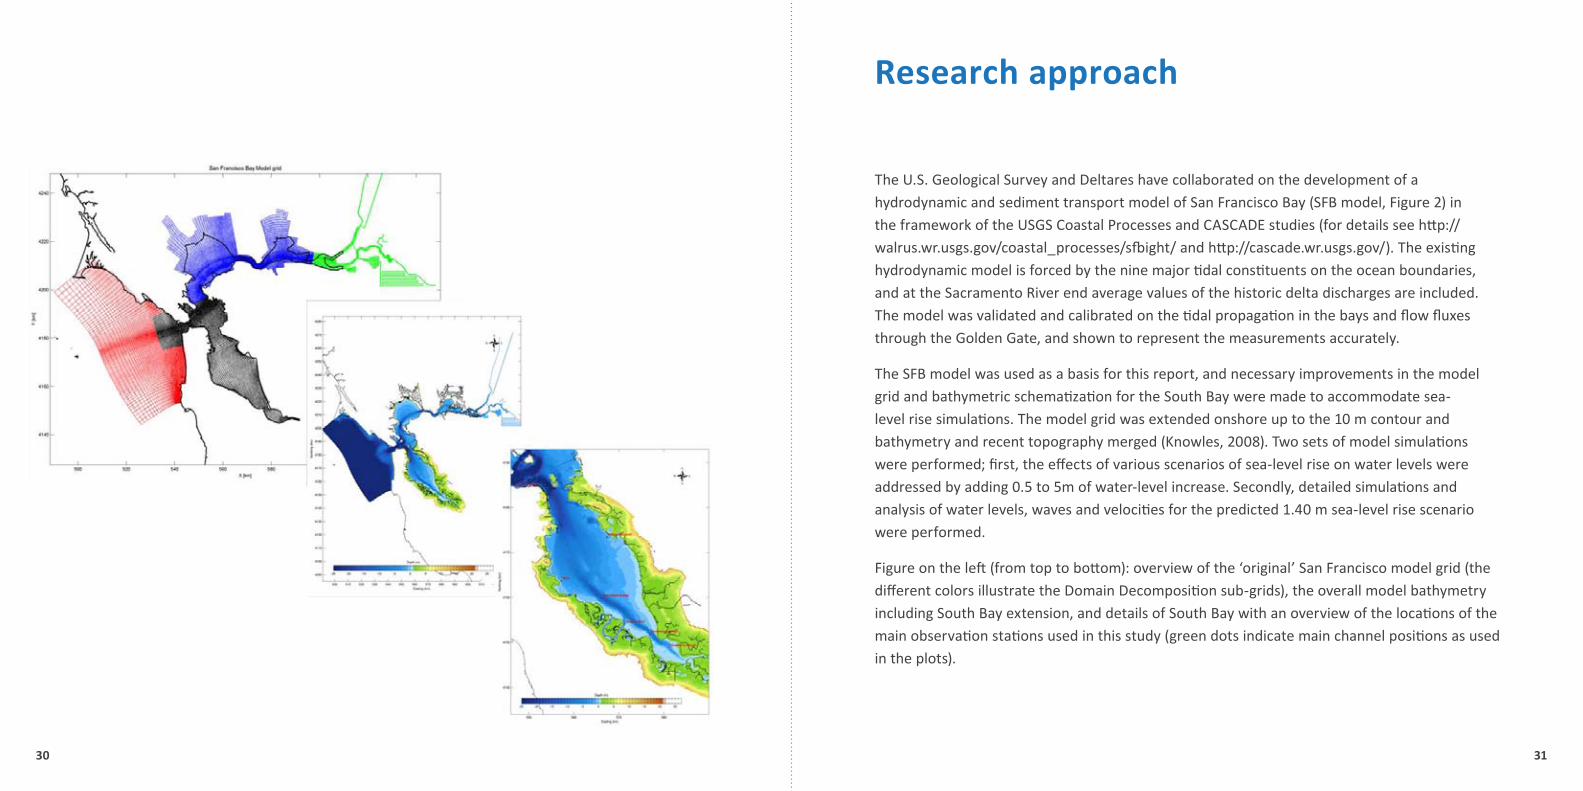
The U.S. Geological Survey and Deltares have collaborated on the development of a hydrodynamic and sediment transport model of San Francisco Bay (SFB model, Figure 2) in the framework of the USGS Coastal Processes and CASCADE studies (for details see http://walrus.wr.usgs.gov/coastal_processes/sfbight/ and http://cascade.wr.usgs.gov/). The existing hydrodynamic model is forced by the nine major tidal constituents on the ocean boundaries, and at the Sacramento River end average values of the historic delta discharges are included. The model was validated and calibrated on the tidal propagation in the bays and flow fluxes through the Golden Gate, and shown to represent the measurements accurately.
The SFB model was used as a basis for this report, and necessary improvements in the model grid and bathymetric schematization for the South Bay were made to accommodate sea-level rise simulations. The model grid was extended onshore up to the 10 m contour and bathymetry and recent topography merged (Knowles, 2008). Two sets of model simulations were performed; first, the effects of various scenarios of sea-level rise on water levels were addressed by adding 0.5 to 5m of water-level increase. Secondly, detailed simulations and analysis of water levels, waves and velocities for the predicted 1.40 m sea-level rise scenario were performed.
Figure on the left (from top to bottom): overview of the ‘original’ San Francisco model grid (the different colors illustrate the Domain Decomposition sub-grids), the overall model bathymetry including South Bay extension, and details of South Bay with an overview of the locations of the main observation stations used in this study (green dots indicate main channel positions as used in the plots).

32 33
Water levels
The effects of sea-level rise on the water levels in the Bay were investigated by running a base case simulation (no sea-level rise) and a 1.40 m sea-level rise scenario. To investigate the sensitivity of the results six additional simulations were performed wherein sea-level rise was varied: adding 0.5, 1.0, 1.5, 2.0, 3.0 and 5.0m. Each simulation was run over a selected 1-month period to include spring-neap variability.
The figure illustrates the change in water levels and tidal propagation characteristics following the main channel in the South Bay (see other figure for locations, 0 km = Golden Gate). The near-horizontal lines of mean and maximum water levels with and without sea-level rise (upper right and middle plots) illustrate that the response throughout the South Bay is near-linear; an increase in ocean water level basically results in a similar increase inside the bay. Some non-linearity is present (upper left and middle plots); however, these variations are in the O(cm) compared to the O(m) sea-level rise scenarios. Harmonic analysis of the tidal signal does indicate a change in tidal characteristics (lower plots). The amplitudes of the major constituents reduce, with the major change being in the amplitude of the M2 constituent (lower left plot). The reasons for this M2 amplitude reduction need to be investigated, but might be related to changes in bed friction and accommodation due to inundation. Increased water levels allow for a faster tidal propagation (lower right). Despite the significant changes in the major tidal components the tidal excursion does not appear to alter drastically, as illustrated for the SFO station (next page).

34 35
Simulated water level variations near San Francisco Airport due to various sea-level rise scenarios (top panel), change in
tidal characteristics by detrending the time series signal (middle panel) and probability of water level occurrence (in 0.10m
increments) in bottom panel.
Water levels
Changes in the tidal water levels following the main channel southward (12-km is Golden Gate) for the mean (top) and
maximum (middle) water level in the left column. Right column is corrected for sea-level rise. Bottom plot: M2 water level
amplitude and phase (left and right).

36 37
South Bay flow velocities and Golden Gate fluxes
Since sea-level rise induces a fairly linear response in Bay water levels, and the tidal prism through the Golden Gate can be defined as area times tidal range, a similar increase in tidal fluxes through the Golden Gate can be observed. In case of 1.40 m of sea-level rise, fluxes increase by roughly 10%. With increasing sea-level the velocities tend to increase. The figures to the left provide snapshots of the flow fields at high and low tides. In these areas maximum and mean velocity increases are generally below 5%. Locally up to 10% increases can be observed at the Golden gate and along the San Francisco waterfront. Velocity changes are fairly mild for the 1.40 m scenario, but velocities further increase with higher levels of sea-level rise, potentially inducing scour and undermining stability of the San Francisco shoreline, and impacting safe shipping to the Oakland and San Francisco harbors.
The major velocity increases are observed south of Dumbarton Bridge. These changes are related to the inundation of low-lying lands that significantly alter the local flow. Since the model resolution is coarse with respect to the channel-shoal systems in this area, we cannot predict the flow in detail. However, we can conclude from the results that with increasing sea-level rise, the largest changes in basin hydrodynamics and related morphodynamics are likely to occur in this area.

38 39
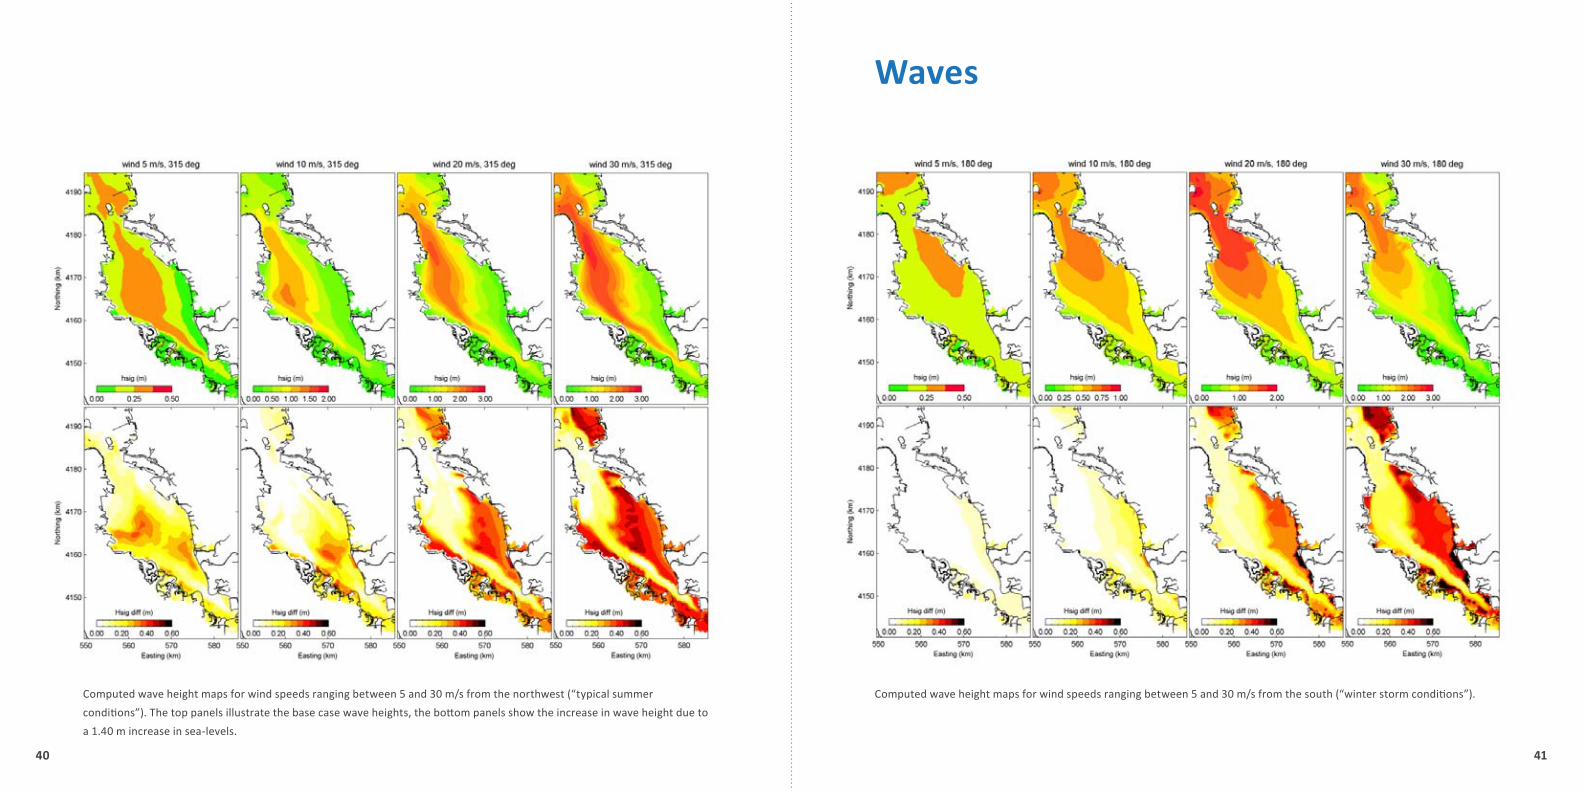
Waves
The wave climate in San Francisco Bay, with the exception of the direct vicinity of Golden Gate, is dominated by waves generated by the local wind climate. In general, the wind climate in the South Bay is seasonal dominated by fairly constant northwesterly winds during the spring and summer months. In winter, winds are governed by storm events from southerly directions. On a smaller scale, a daily variation occurs with peak wind velocities in the afternoon. In detail, the wind climate is extremely complex, dominated by micro-climates, due to the mountain ranges surrounding San Francisco Bay.
A realistic modeling of the wave fields would require intensive studies of the wind climate and some assumption on how these wind climates may alter in future due to climate change. Both of these aspects are beyond the scope of this project. We can however estimate the effects of the changes in sea-level on the generation of waves by running a range of wind velocities and speeds. Wave generation and hydrodynamics for a range of uniform fields of wind speeds ranging between 0 and 30 m/s for selected directions (0, 180, 225, 270 and 315°) have been performed. Wind speeds over 20 m/s seem excessive but these are included to provide an indication of possible effects of increased wind velocities due to climate change.
The figures on the following pages summarize the most interesting results. In general: (1) for all wind speeds and direction, wave heights increase with rising sea-levels. In the model a static bathymetry is used, sea-level rise increases the water depth, thereby reducing the importance of bed friction and allowing the generation of larger waves; and (2) larger wind speeds creates larger wave heights and sea-level rise augments the wave height increase.
Compared to the ocean wave climate facing San Francisco Bay the waves in the Bay are minor; however, increases in the maximum wave height up to 25% are observed locally. Such increases might impose a hazard for recreational boating, might induce structural damage to ‘soft’ sea defenses, and are likely to augment erosion of valuable mud flats and unprotected shorelines.
40 41
Waves
Computed wave height maps for wind speeds ranging between 5 and 30 m/s from the northwest (“typical summer
conditions”). The top panels illustrate the base case wave heights, the bottom panels show the increase in wave height due to
a 1.40 m increase in sea-levels.
Computed wave height maps for wind speeds ranging between 5 and 30 m/s from the south (“winter storm conditions”).

42 43
COMPONENT 2
Potential measures and Strategy Development Method (SDM)
44 45
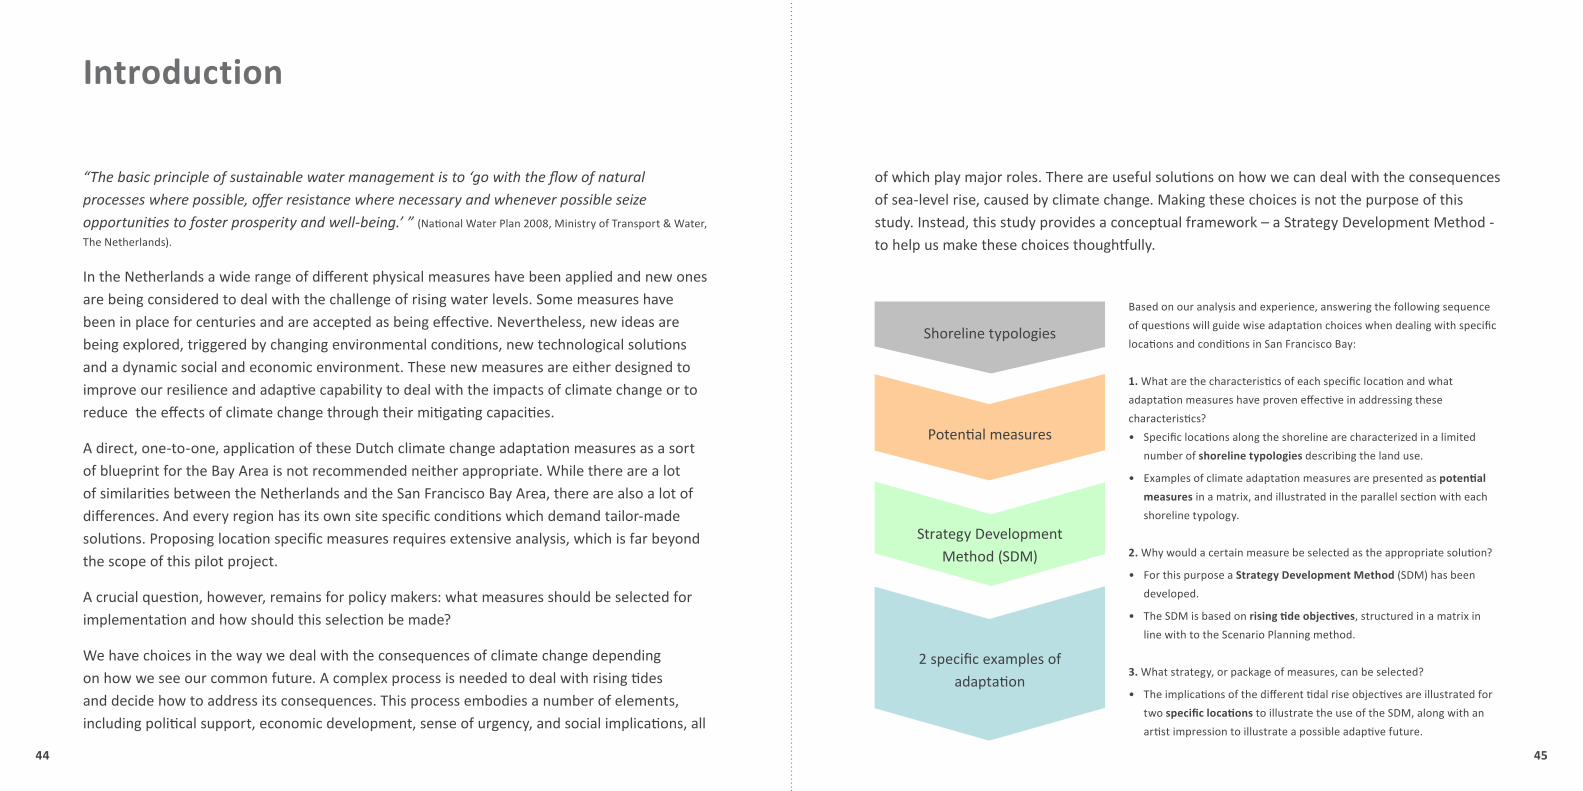
Introduction
“The basic principle of sustainable water management is to ‘go with the flow of natural processes where possible, offer resistance where necessary and whenever possible seize opportunities to foster prosperity and well-being.’ ” (National Water Plan 2008, Ministry of Transport & Water,
The Netherlands).
In the Netherlands a wide range of different physical measures have been applied and new ones are being considered to deal with the challenge of rising water levels. Some measures have been in place for centuries and are accepted as being effective. Nevertheless, new ideas are being explored, triggered by changing environmental conditions, new technological solutions and a dynamic social and economic environment. These new measures are either designed to improve our resilience and adaptive capability to deal with the impacts of climate change or to reduce the effects of climate change through their mitigating capacities.
A direct, one-to-one, application of these Dutch climate change adaptation measures as a sort of blueprint for the Bay Area is not recommended neither appropriate. While there are a lot of similarities between the Netherlands and the San Francisco Bay Area, there are also a lot of differences. And every region has its own site specific conditions which demand tailor-made solutions. Proposing location specific measures requires extensive analysis, which is far beyond the scope of this pilot project.
A crucial question, however, remains for policy makers: what measures should be selected for implementation and how should this selection be made?
We have choices in the way we deal with the consequences of climate change depending on how we see our common future. A complex process is needed to deal with rising tides and decide how to address its consequences. This process embodies a number of elements, including political support, economic development, sense of urgency, and social implications, all
Shoreline typologies
Potential measures
Strategy Development Method (SDM)
2 specific examples of adaptation
of which play major roles. There are useful solutions on how we can deal with the consequences of sea-level rise, caused by climate change. Making these choices is not the purpose of this study. Instead, this study provides a conceptual framework – a Strategy Development Method - to help us make these choices thoughtfully.
Based on our analysis and experience, answering the following sequence
of questions will guide wise adaptation choices when dealing with specific
locations and conditions in San Francisco Bay:
1. What are the characteristics of each specific location and what
adaptation measures have proven effective in addressing these
characteristics?
Specific locations along the shoreline are characterized in a limited •
number of shoreline typologies describing the land use.
Examples of climate adaptation measures are presented as • potential
measures in a matrix, and illustrated in the parallel section with each
shoreline typology.
2. Why would a certain measure be selected as the appropriate solution?
For this purpose a • Strategy Development Method (SDM) has been
developed.
The SDM is based on • rising tide objectives, structured in a matrix in
line with to the Scenario Planning method.
3. What strategy, or package of measures, can be selected?
The implications of the different tidal rise objectives are illustrated for •
two specific locations to illustrate the use of the SDM, along with an
artist impression to illustrate a possible adaptive future.

46 47
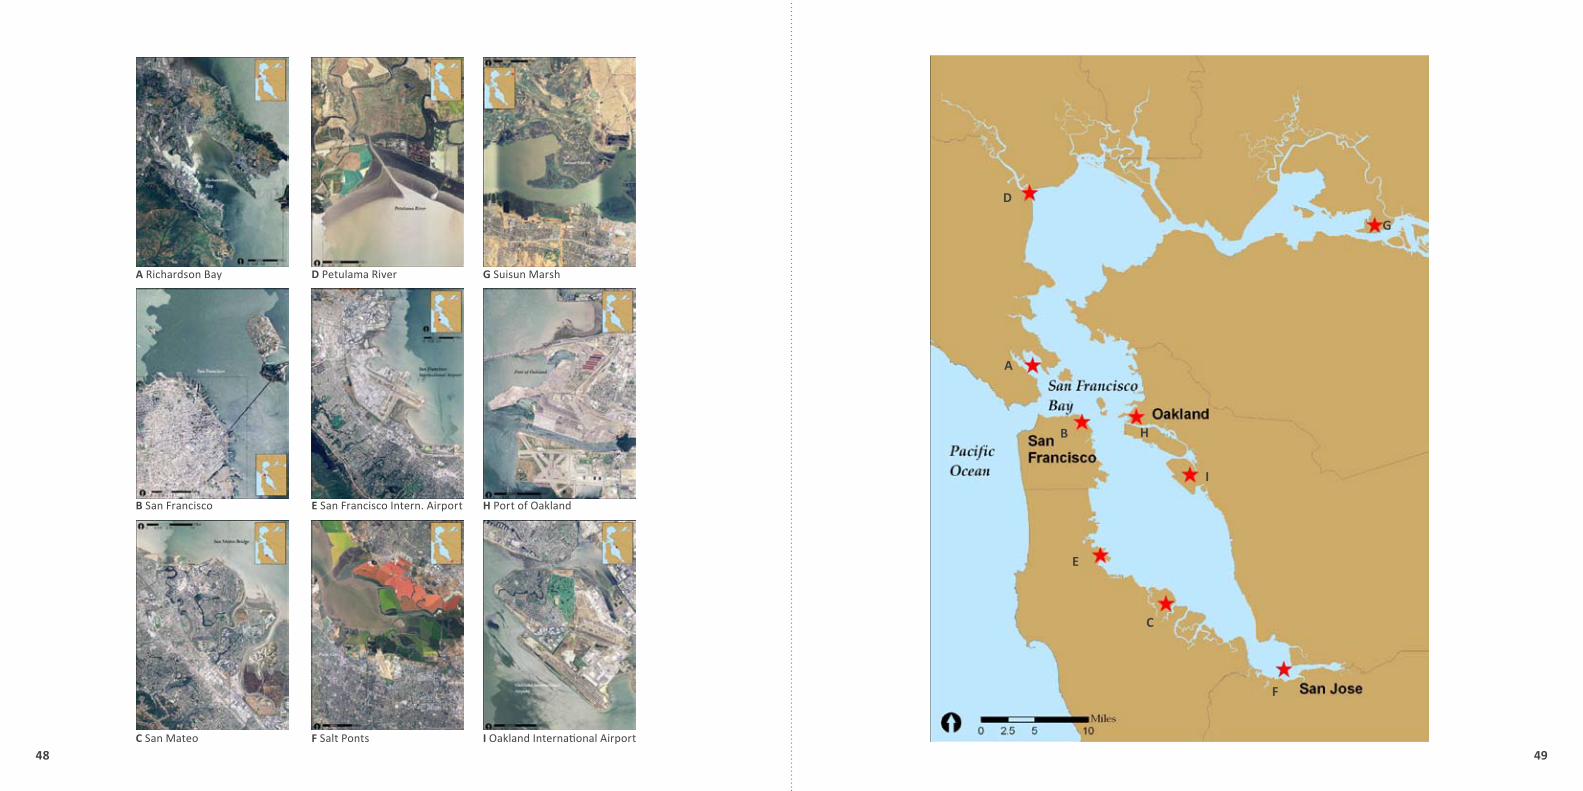
Shoreline typologies
In the first stage of the project specific locations were identified as “hot spots” for the South Bay. The hot spots characterize the different type of conditions around the Bay, each having its different land use, which demands different kinds of measures to adapt to the challenges of sea-level rise.
When comparing the Californian cases with the Dutch cases, it became ample clear that every hotspot is unique on its own, and that every hotspot demands a tailor-made solution. Just copying some measures from elsewhere is inappropriate. However, to categorize the locations, and to make it possible to pre-select certain measures, shoreline typologies have been defined, describing the main types of land use in the Bay Area. For instance, a metropolitan setting such as the waterfront of San Francisco, with a lot of human activity, high economic value and capital investment, asks for a different package of measures compared to for instance an area with salt ponds. This shoreline usage is characterized in a limited number of typologies, valid for both the California and Dutch situations.
The main characteristics and some quick facts of each hot spot is illustrated on the following pages.
Shoreline typology Sub-level Hotspots
Urban
City City San Francisco
Suburban City San Mateo, Treasure Island
Airport SFO and OAK
Port Port of Oakland
Non-urbanRural – Agricultural bay land Not applicable for the South Bay
Rural – Unimproved Not applicable for the South Bay
HabitatAltered Salt ponds
Natural Tidal flats, former salt ponds
BayAltered Shipping lanes, channels
Natural Shallow part bay , tidal flats
48 49
A Richardson Bay
A
C
B
e
D
H
F
I
G
D Petulama River G Suisun Marsh
B San Francisco e San Francisco Intern. Airport H Port of Oakland
C San Mateo F Salt Ponts I Oakland International Airport
50 51
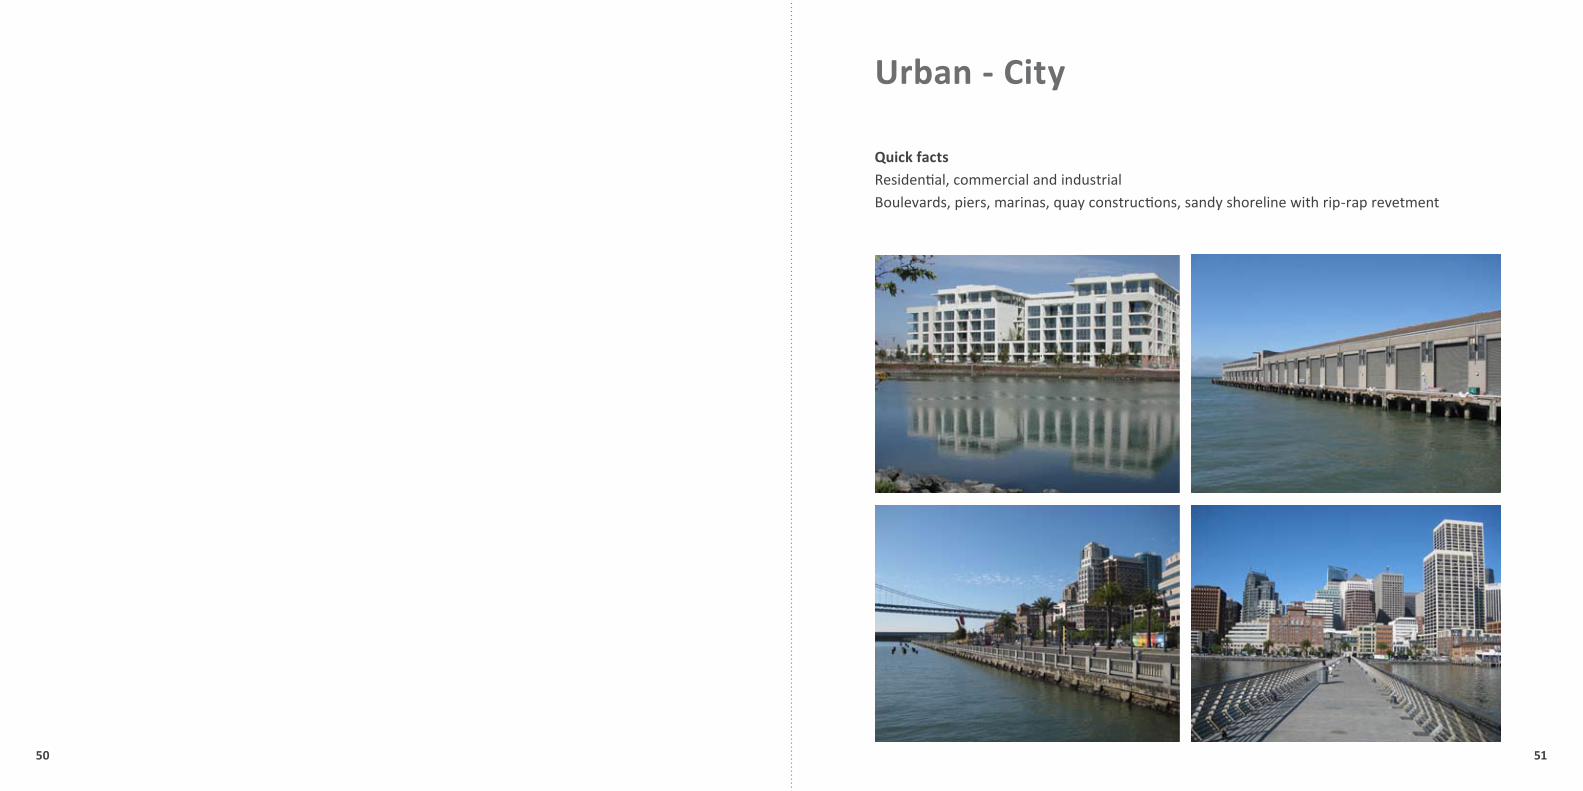
Urban - City
Quick facts Residential, commercial and industrial Boulevards, piers, marinas, quay constructions, sandy shoreline with rip-rap revetment

52 53
Urban - Suburban San Mateo, Redwood City, Foster City, Palo AltoQuick facts Residential areas
Urban - Suburban Treasure IslandQuick facts Artificial island, Naval base, film location, job training centre and residential area

54 55
Urban - Airport Oakland Airport (OAK)Quick facts Owned by the Port of Oakland; 11.5 million passengers (2008)
Urban - Airport San Francisco International Airport (SFO)Quick facts Second busiest airport of California, 37 million passengers (2008); Elevation runways 3-10 ft. above MSL; Extensive and long shoreline; Flood control maintenance done by airport Various types of defense structures (rip-rap revetments, concrete walls, sheet piles)
56 57
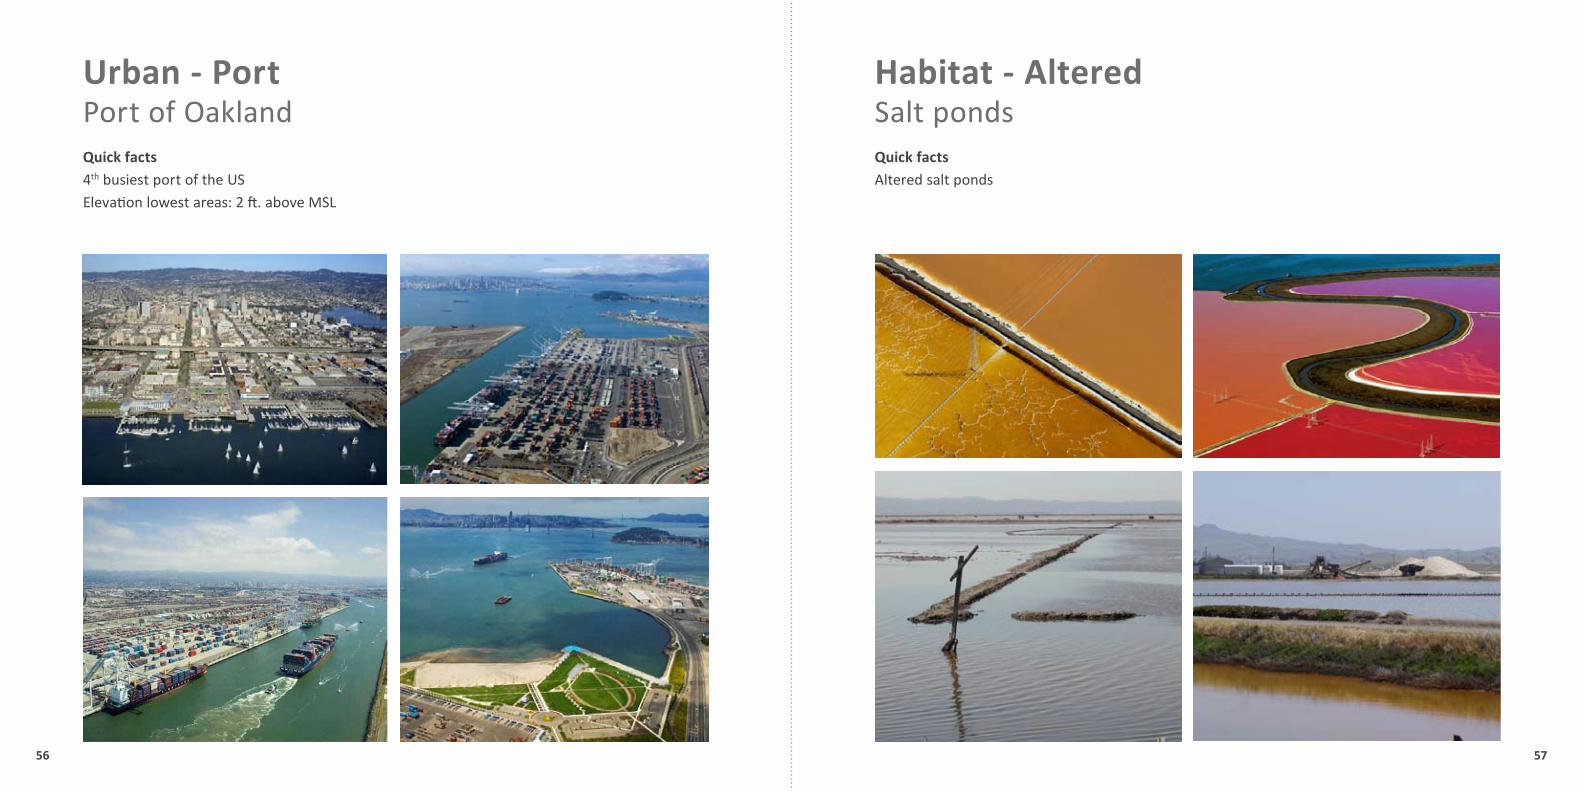
Habitat - Altered Salt pondsQuick facts Altered salt ponds
Urban - Port Port of OaklandQuick facts 4th busiest port of the US Elevation lowest areas: 2 ft. above MSL

58 59
Habitat - Natural not managed
Bay - Altered & Natural
Quick facts Altered Channels: maintenance dredging Natural Shallow parts: floating homes, tidal flats
Quick facts Not managed Former salt ponds, tidal wetlands, marshes

61
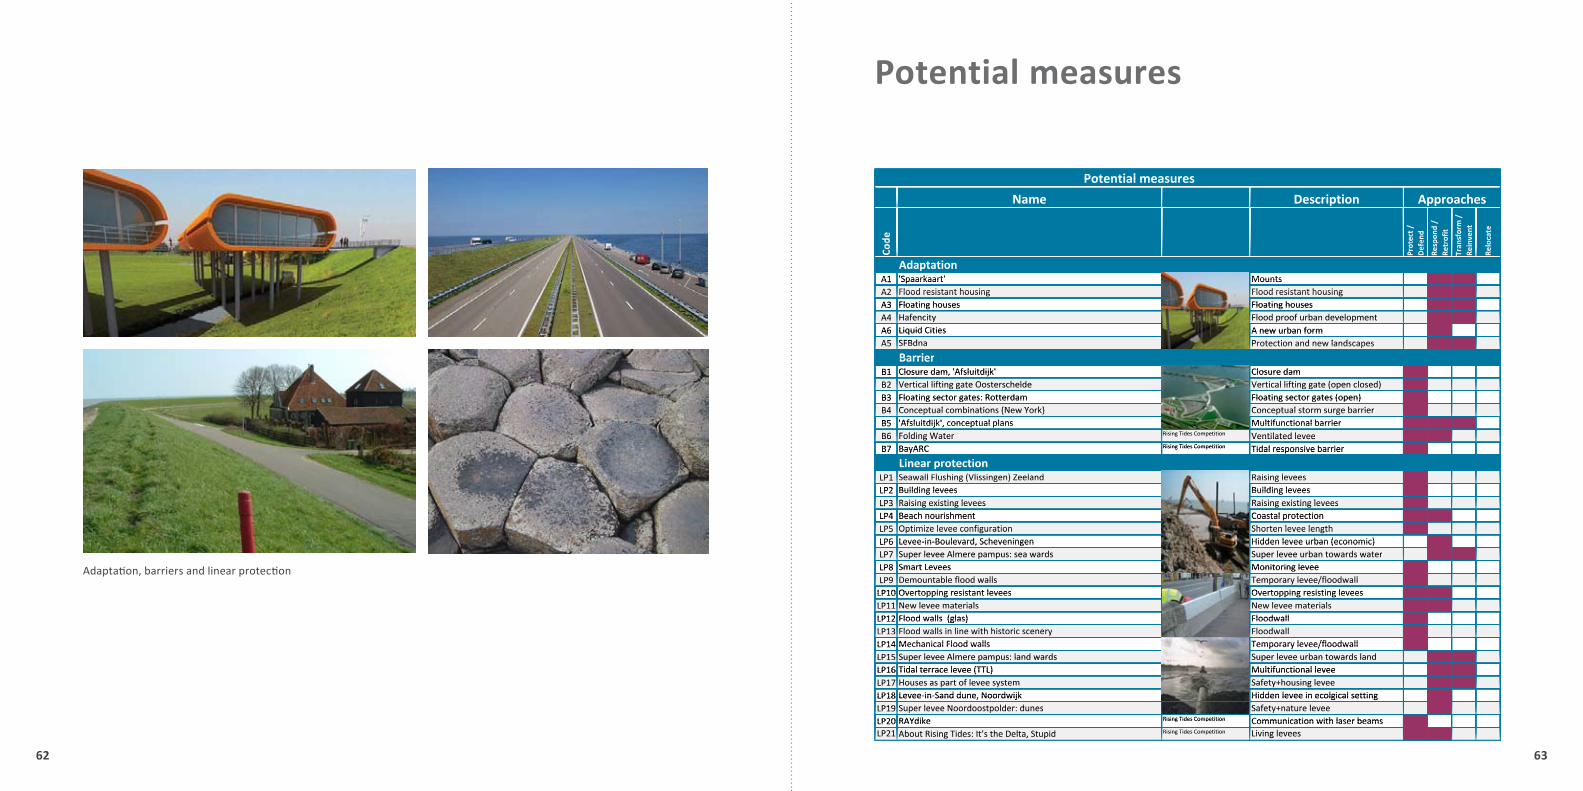
Potential measures
There are many potential measures, old and new, some already in existence and some in a planning stage, to deal with the challenges of rising water levels in the Netherlands. These measures have made the Netherlands famous for its water management and have spawned the expression: “While God created the world, the Dutch created Holland”. All these adaptation measures deal directly with problems related to sea-level rise and increased river discharges.
In this report, examples of climate adaptation measures and recent ideas have been arranged in a matrix according to different categories describing the physical character of the measure. These examples have been divided into six broad categories: adaptation; barriers; land reclamation; linear protection; management; and transition.
Accordingly, these measures are classified in four approaches, ranging from ‘clock like’ (linear technocratic) to ‘cloud like’ (cyclic holistic):
Protect and defend•
Respond and retrofit•
Transform and reinvent•
Relocate (if no measure is appropriate)•
This approach has been used to classify and characterize the measures and relate them to the SDM.
The examples of the measures are illustrated in the Appendix Measures.
In addition the winners and honorary mentions of ‘The Rising Tides’ competition are also incorporated into the matrix.
Marshes
Retreat
RAY dikeSuburban
Economy
Linear protection
LeveesRaising Levees
Beach nourishment
Sea level rise
Climate change Wetlands
Shoreline
Wetland restoration
Salt ponds
Sea wall
Bay AreaPiersHarbor
Closure dam
Rising tidesSuper levee
Wildlife
EcologyAirportRiprap revetments
Closure damHidden levees
Flood safe
Flood resistant
DevelopmentStorm surge barrierMounts
Liquid cities
Overtopping resistantSmart levees
Retrofit
Transform
62 63
Potential measures
Adaptation, barriers and linear protection
P i lPotential measuresPotential measuresPotential measuresPotential measures
N D i i A hName Description ApproachesName Description ApproachesName Description ApproachesName Description Approachesp pp
/ /
/ m // m
/ / m t e/ d rm nt et /
d nd t or nt tee ct d nd it o en ate ct nd on fi fo e at
de ec n o of sf ve cad te en po ro ns nv ocod te fe sp ro n nv ood ot efe sp tr an in loo ro ef es et ra ei elCo Pr
oDe
Re Re Tra
Re ReC Pr D Re Re Tr Re ReC P D R R T R RT
Ad t tiAdaptationAdaptationAdaptationAdaptationA1 'Spaarkaart' MountsA1 'Spaarkaart' MountsA1 Spaarkaart MountsA1 Spaarkaart MountsA2 Flood resistant housing Flood resistant housingA2 Flood resistant housing Flood resistant housingA2 Flood resistant housing Flood resistant housingA2 Flood resistant housing Flood resistant housingA3 Floating houses Floating housesA3 Floating houses Floating housesA3 Floating houses Floating housesA3 Floating houses Floating housesA4 Hafencity Flood proof urban developmentA4 Hafencity Flood proof urban developmentA4 Hafencity Flood proof urban developmentA4 Hafencity Flood proof urban developmentA6 Liquid Cities A new urban formA6 Liquid Cities A new urban formA6 Liquid Cities A new urban formA6 Liquid Cities A new urban form
dA5 SFBdna Protection and new landscapesA5 SFBdna Protection and new landscapesA5 SFBdna Protection and new landscapes A5 SFBdna Protection and new landscapes
B iBarrierBarrierBarrierBarrierB1 Closure dam 'Afsluitdijk' Closure damB1 Closure dam 'Afsluitdijk' Closure damB1 Closure dam, Afsluitdijk Closure damB1 Closure dam, Afsluitdijk Closure dam
( )B2 Vertical lifting gate Oosterschelde Vertical lifting gate (open closed)B2 Vertical lifting gate Oosterschelde Vertical lifting gate (open closed)B2 Vertical lifting gate Oosterschelde Vertical lifting gate (open closed)B2 Vertical lifting gate Oosterschelde Vertical lifting gate (open closed)( )B3 Floating sector gates: Rotterdam Floating sector gates (open)B3 Floating sector gates: Rotterdam Floating sector gates (open)B3 Floating sector gates: Rotterdam Floating sector gates (open)B3 Floating sector gates: Rotterdam Floating sector gates (open)
( )B4 Conceptual combinations (New York) Conceptual storm surge barrierB4 Conceptual combinations (New York) Conceptual storm surge barrierB4 Conceptual combinations (New York) Conceptual storm surge barrierB4 Conceptual combinations (New York) Conceptual storm surge barrier' f l d k' l l l f l bB5 'Afsluitdijk' conceptual plans Multifunctional barrierB5 'Afsluitdijk' conceptual plans Multifunctional barrierB5 Afsluitdijk , conceptual plans Multifunctional barrierB5 Afsluitdijk , conceptual plans Multifunctional barrierld Ri i Tid C titiB6 Folding Water Rising Tides Competition Ventilated leveeB6 Folding Water Rising Tides Competition Ventilated leveeB6 Folding Water g p Ventilated leveeB6 Folding Water Ventilated levee
Ri i Tid C titiB7 BayARC Rising Tides Competition Tidal responsive barrierB7 BayARC Rising Tides Competition Tidal responsive barrierB7 BayARC g p Tidal responsive barrierB7 BayARC Tidal responsive barrier
Li t tiLinear protectionLinear protectionLinear protectionLinear protection( )LP1 Seawall Flushing (Vlissingen) Zeeland Raising leveesLP1 Seawall Flushing (Vlissingen) Zeeland Raising leveesLP1 Seawall Flushing (Vlissingen) Zeeland Raising leveesLP1 Seawall Flushing (Vlissingen) Zeeland Raising levees
LP2 Building levees Building leveesLP2 Building levees Building leveesLP2 Building levees Building leveesLP2 Building levees Building leveesl lLP3 Raising existing levees Raising existing leveesLP3 Raising existing levees Raising existing leveesLP3 Raising existing levees Raising existing leveesLP3 Raising existing levees Raising existing levees
h h lLP4 Beach nourishment Coastal protectionLP4 Beach nourishment Coastal protectionLP4 Beach nourishment Coastal protectionLP4 Beach nourishment Coastal protectionl f h l l hLP5 Optimize levee configuration Shorten levee lengthLP5 Optimize levee configuration Shorten levee lengthLP5 Optimize levee configuration Shorten levee lengthLP5 Optimize levee configuration Shorten levee length
l d h dd l b ( )LP6 Levee in Boulevard Scheveningen Hidden levee urban (economic)LP6 Levee‐in‐Boulevard Scheveningen Hidden levee urban (economic)LP6 Levee‐in‐Boulevard, Scheveningen Hidden levee urban (economic)LP6 Levee in Boulevard, Scheveningen Hidden levee urban (economic)l l d l b dLP7 Super levee Almere pampus: sea wards Super levee urban towards waterLP7 Super levee Almere pampus: sea wards Super levee urban towards waterLP7 Super levee Almere pampus: sea wards Super levee urban towards waterLP7 Super levee Almere pampus: sea wards Super levee urban towards water
lLP8 Smart Levees Monitoring leveeLP8 Smart Levees Monitoring leveeLP8 Smart Levees Monitoring leveeLP8 S a t e ees o to g e eebl fl d ll l /fl d llLP9 Demountable flood walls Temporary levee/floodwallLP9 Demountable flood walls Temporary levee/floodwallLP9 Demountable flood walls Temporary levee/floodwallLP9 p y /
O i i l O i i i lLP10 Overtopping resistant levees Overtopping resisting leveesLP10 Overtopping resistant levees Overtopping resisting leveesLP10 Overtopping resistant levees Overtopping resisting leveesLP10 pp g pp g gN l i l N l i lLP11 New levee materials New levee materialsLP11 New levee materials New levee materialsLP11 New levee materials New levee materials PFl d ll ( l ) Fl d llLP12 Flood walls (glas) FloodwallLP12 Flood walls (glas) FloodwallLP12 Flood walls (glas) Floodwall(g )Fl d ll i li i h hi i Fl d llLP13 Flood walls in line with historic scenery FloodwallLP13 Flood walls in line with historic scenery FloodwallLP13 Flood walls in line with historic scenery FloodwallyM h i l Fl d ll T l /fl d llLP14 Mechanical Flood walls Temporary levee/floodwallLP14 Mechanical Flood walls Temporary levee/floodwallLP14 Mechanical Flood walls Temporary levee/floodwallp y /
L 1 S l Al l d d S l b d l dLP15 Super levee Almere pampus: land wards Super levee urban towards landLP15 Super levee Almere pampus: land wards Super levee urban towards landLP15 Super levee Almere pampus: land wards Super levee urban towards landp p p pLP16 Tid l l (TTL) M l if i l lLP16 Tidal terrace levee (TTL) Multifunctional leveeLP16 Tidal terrace levee (TTL) Multifunctional leveeLP16 Tidal terrace levee (TTL) Multifunctional levee( )LP17 H f l S f h i lLP17 Houses as part of levee system Safety+housing leveeLP17 Houses as part of levee system Safety+housing leveeLP17 Houses as part of levee system Safety+housing leveep y y gLP18 L i S d d N d ijk Hidd l i l i l iLP18 Levee in Sand dune Noordwijk Hidden levee in ecolgical settingLP18 Levee‐in‐Sand dune, Noordwijk Hidden levee in ecolgical settingLP18 Levee in Sand dune, Noordwijk Hidden levee in ecolgical setting, j g gLP19 S l N d ld d S f lLP19 Super levee Noordoostpolder: dunes Safety+nature leveeLP19 Super levee Noordoostpolder: dunes Safety+nature leveeLP19 Super levee Noordoostpolder: dunes Safety+nature leveep p yLP20 RAYdik Rising Tides Competition C i ti ith l bLP20 RAYdike Rising Tides Competition Communication with laser beamsLP20 RAYdike Rising Tides Competition Communication with laser beamsLP20 RAYdike Communication with laser beamsLP21 Ab t Ri i Tid It’ th D lt St id Rising Tides Competition Li i lLP21 About Rising Tides: It’s the Delta Stupid Rising Tides Competition Living leveesLP21 About Rising Tides: It’s the Delta, Stupid Rising Tides Competition Living leveesLP21 About Rising Tides: It s the Delta, Stupid Living leveesg , p g

64 65
Potential measures
Land reclamation, management, retention and transition
Name Description
Potential measures
ApproachesName Description
e ct /
d ond /
fit
form
/
ent
ate
Approaches
Code
Protec
Defen
d
Respo
Retrof
Tran
sfRe
inve
Reloca
Land reclamationLand reclamationLR1 Coastal extention Coastal land reclamationLR2 'IJburg'‐ Amsterdam Artificial islands, monofunctional
h h l l ( ld ) ldLR3 Schiphol Haarlemmermeer (polders) PolderLR4 Rotterdam port: Maasvlakte 1 Land reclamation monofunct.LR5 Flyland: Schiphol in sea Artificial island in seaLR5 Flyland: Schiphol in sea Artificial island in seaLR6 'Schaalsprong Almere' Artificial islands multifunctional LR7 Rotterdam port: 'Maasvlakte 2' Land reclamation multifunctionalLR8 S d E i D t h t B ildi ith tLR8 Sand Engine Dutch coast Building with natureLR9 South Western Delta, the Netherlands Artificial islands unprotected
ManagementManagementM1 Waddenzee wetland Adaptive wetland managementM2 Occurrence / Intervention Rising Tides Competition Water management3 E l i R Rising Tides Competition dM3 Evolutionary Recovery Rising Tides Competition Integrated Bay area management
M4 The 100 Year Plan Rising Tides Competition Integrated Water Management
RetentionRetentionR1 Fresh water retention IJsselmeer (2nd Delta commitee) Level rising IJsselmeerR2 Adaptive measures: Water retention in garages (R''dam) Retention (underground)R3 Adaptive measures: Green roofs Retention (rooftop)R4 Adaptive measures: Infiltration of precipitation (open paving) Infiltration/retentionR5 Adaptive measures: Open water in urban environment Retention (public space)R5 Adaptive measures: Open water in urban environment Retention (public space)
TransitionT1 Rotterdam Cityports ('Heysehaven/RDM') TransformationT2 Depoldering Noordwaard Depoldering and bypassT3 Adaptive residential areas Rotterdam Integrated urban water managementT4 Tidal Economy Tidal way of lifeT4 Tidal Economy Tidal way of lifeT5 Create ecological connectivity: Oosterwold / Westenholte Relocation of farm houses T6 Perkpolder Climate proof zone DepolderingT7 Plan Tureluur Schouwen Duiveland Habitat restorationT8 Kleine Noordwaard Depoldering ecologic developmentT9 Topographical Shifts at the Urban Waterfront Rising Tides Competition Nature developmentT9 Topographical Shifts at the Urban Waterfront Nature developmentT10 Embracing the Rise: Multiple Adaptations to the Living Edge Rising Tides Competition Identify, respond and adaptT11 The Estuarine City Rising Tides Competition Ecocity developmentT12 F il ! Rising Tides Competition Lif hibi dT12 Failure! Rising Tides Competition Life on an amphibious edge
66 67
Strategy Development Method (SDM)
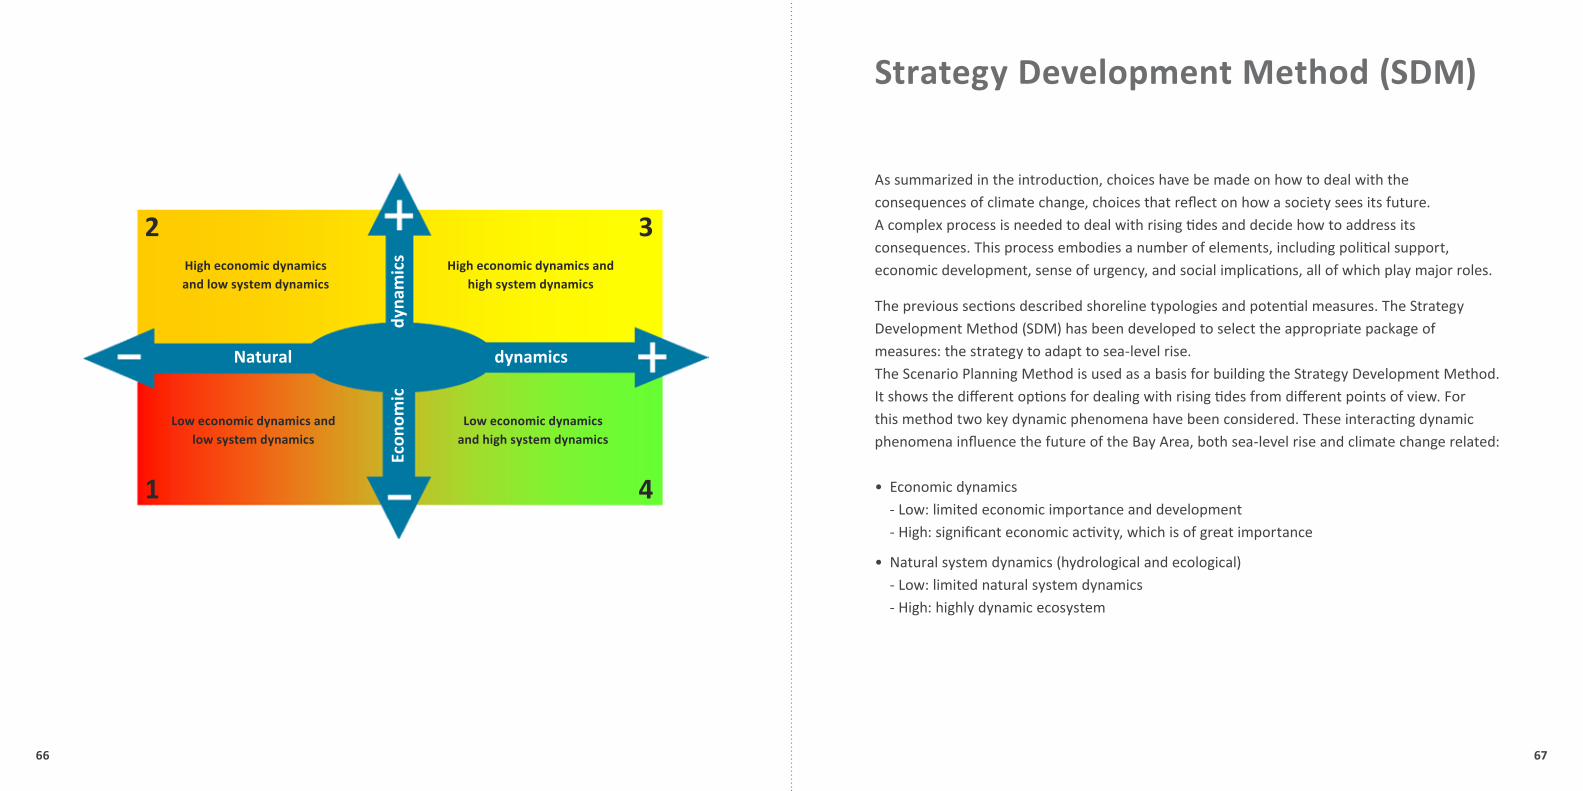
As summarized in the introduction, choices have be made on how to deal with the consequences of climate change, choices that reflect on how a society sees its future. A complex process is needed to deal with rising tides and decide how to address its consequences. This process embodies a number of elements, including political support, economic development, sense of urgency, and social implications, all of which play major roles.
The previous sections described shoreline typologies and potential measures. The Strategy Development Method (SDM) has been developed to select the appropriate package of measures: the strategy to adapt to sea-level rise. The Scenario Planning Method is used as a basis for building the Strategy Development Method. It shows the different options for dealing with rising tides from different points of view. For this method two key dynamic phenomena have been considered. These interacting dynamic phenomena influence the future of the Bay Area, both sea-level rise and climate change related:
Economic dynamics • - Low: limited economic importance and development - High: significant economic activity, which is of great importance
Natural system dynamics (hydrological and ecological) • - Low: limited natural system dynamics - High: highly dynamic ecosystem
1
2 3
4
High economic dynamics and low system dynamics
High economic dynamics and high system dynamics
Low economic dynamics and low system dynamics
Low economic dynamics and high system dynamics
Natural dynamics
econ
omic
dyn
amic
s
68 69
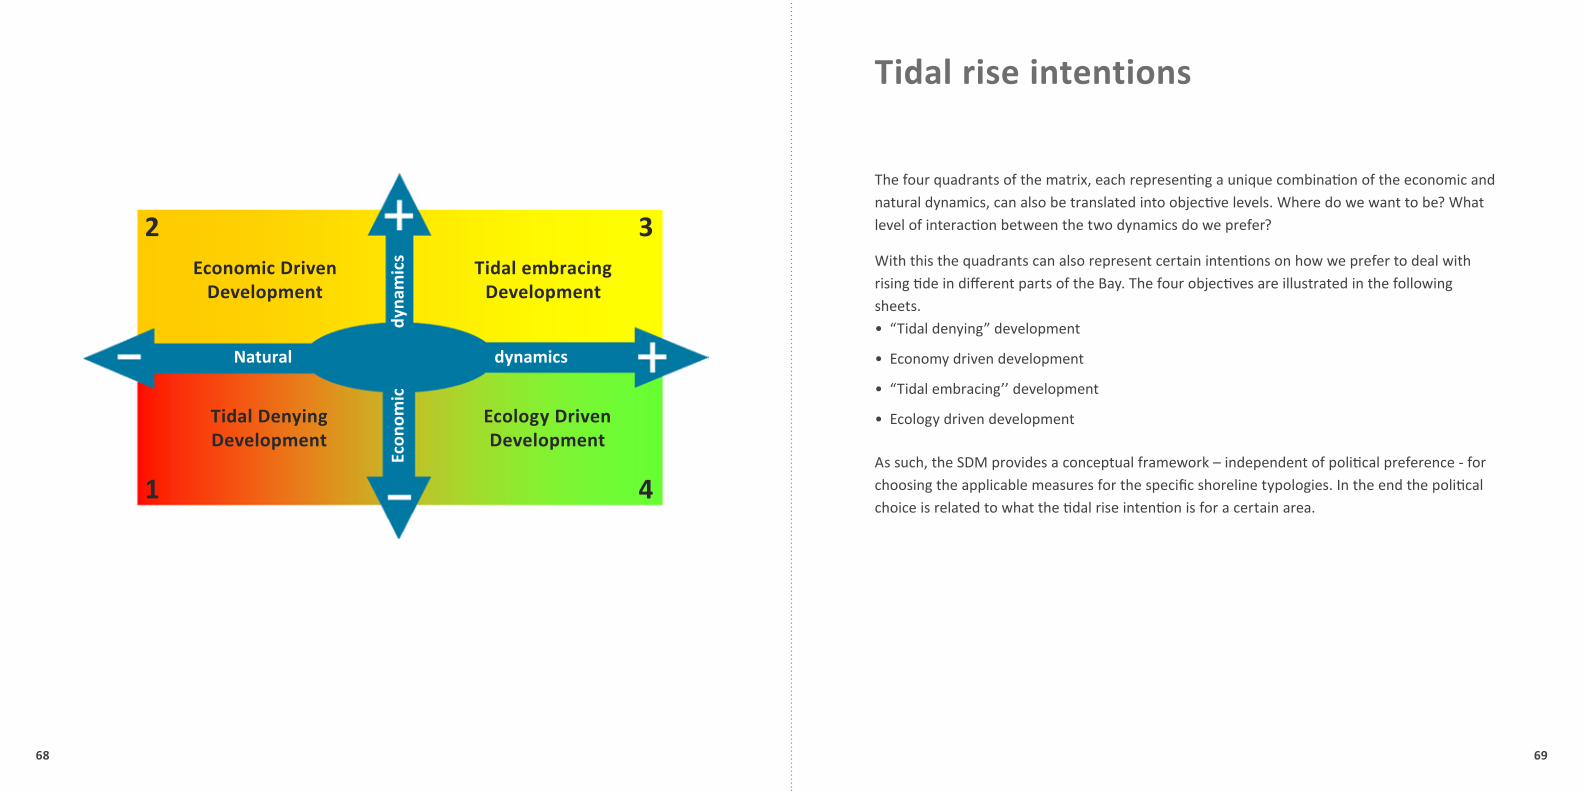
Tidal rise intentions
The four quadrants of the matrix, each representing a unique combination of the economic and natural dynamics, can also be translated into objective levels. Where do we want to be? What level of interaction between the two dynamics do we prefer?
With this the quadrants can also represent certain intentions on how we prefer to deal with rising tide in different parts of the Bay. The four objectives are illustrated in the following sheets.
“Tidal denying” development•
Economy driven development•
“Tidal embracing’’ development•
Ecology driven development•
As such, the SDM provides a conceptual framework – independent of political preference - for choosing the applicable measures for the specific shoreline typologies. In the end the political choice is related to what the tidal rise intention is for a certain area.
1
2 3
4
Economic Driven Development
Tidal embracing Development
Tidal Denying Development
Ecology Driven Development
Natural dynamics
econ
omic
dyn
amic
s

70 71
Steekwoorden
2. Economic Driven Development
Characteristic: Measures for dealing with rising tides will be integrated in projects which are focused on economic development. Growth and economic development have priority over ecologic development and sustainability. Consequences of rising tides are of secondary interest and dealt with as a functional approach to accommodate economic development. Key words: Urban development, a smaller San Francisco Bay, linear protection, land reclamation.
1. Tidal Denying Development
Characteristic: Principle line of thought is denial of economic and ecologic opportunities that deal with rising tides due to climate change. Another notion connected to this principle is delay. Hydro-economic dynamics are excluded and not used for ongoing developments. No profits from climate change, and if necessary fighting climate change. Key words: Delay, Denial, Fortress, Avoidance.

72 73
3. Tidal Embracing Development
Characteristic: Rising tide is used as a driver for both economic and ecologic/environmental growth and development. Innovative solutions are used to integrate and connect economy and ecology in line with the ‘genius loci’. Key words: Embracing the system, rising tide as opportunity for change, transformation, best of both worlds.
4. Ecology Driven Development
Characteristic: The Bay as a natural system. Conservation, restoration and development of estuarine habitats, salt marches and wetlands have priority over economic development. Key words: Retreat, ecological values, natural origin Bay.

74 75
Synthesis options for the Bay
For this pilot project the different shoreline typologies according to the developed SDM are integrated into the potential •
measures matrix
The measures were assigned as appropriate solutions for a certain typology (on a rather strict basis). •
The color corresponds with the four objectives •
Potential measures Shoreline Typologies
Name Description Urban Habitat Bay
e rban
rt ed al ed al
Code
City
Subu
rb
Airpo
r
Port
Altere
Natura
Altere
Natura
AdaptationA1 'Spaarkaart' Mounts 1A1 Spaarkaart Mounts 1
A2 Flood resistant housing Flood resistant housing 3 3
A3 Floating houses Floating houses 3 3A3 Floating houses Floating houses 3 3
A4 Hafencity Flood proof urban development 3 3 3
A6 Liquid Cities A new urban form 3 3 3 3A6 Liquid Cities A new urban form 3 3 3 3
A5 SFBdna Protection and new landscapes 3 3 3 3 3 3 3 3
BarrierB1 Closure dam, 'Afsluitdijk' Closure dam 1B1 Closure dam, Afsluitdijk Closure damB2 Vertical lifting gate Oosterschelde Vertical lifting gate (open closed)B3 Floating sector gates: Rotterdam Floating sector gates (open) 3
1
2
3B3 Floating sector gates: Rotterdam Floating sector gates (open) 3
B4 Conceptual combinations (New York) Conceptual storm surge barrier 3
B5 'Afsluitdijk' conceptual plans Multifunctional barrier 3
3
3
B5 'Afsluitdijk', conceptual plans Multifunctional barrierB6 Folding Water Rising Tides Competition Ventilated levee 2 2 2
B7 B ARC Rising Tides Competition Tid l i b i
3
B7 BayARC Rising Tides Competition Tidal responsive barrier 3
Linear protectionpLP1 Seawall Flushing (Vlissingen) Zeeland Raising levees 1 1 1 1
LP2 Building levees Building levees 1 1 1 1LP2 Building levees Building levees 1 1 1 1
LP3 Raising existing levees Raising existing levees 1 1 1 1
LP4 Beach nourishment Coastal protection 1LP4 Beach nourishment Coastal protection 1
LP5 Optimize levee configuration Shorten levee length 1
LP6 L i B l d S h i Hidd l b ( i )LP6 Levee‐in‐Boulevard, Scheveningen Hidden levee urban (economic) 2 2 2
LP7 Super levee Almere pampus: sea wards Super levee urban towards water 2 2 2
LP8 Smart Levees Monitoring levee 2 2 2 2
LP9 Demountable flood walls Temporary levee/floodwall 2 2p y /LP10 Overtopping resistant levees Overtopping resisting levees 2
LP11 New levee materials New levee materials 2 2 2 2LP11 New levee materials New levee materials 2 2 2 2
LP12 Flood walls (glas) Floodwall 2 2
LP13 Flood walls in line with historic scenery Floodwall 2 2LP13 Flood walls in line with historic scenery Floodwall 2 2
LP14 Mechanical Flood walls Temporary levee/floodwall 2 2
LP15 S l Al l d d S l b t d l dLP15 Super levee Almere pampus: land wards Super levee urban towards land 3 3 3
LP16 Tidal terrace levee (TTL) Multifunctional levee 3 3
LP17 Houses as part of levee system Safety+housing levee 3 3 3
LP18 Levee‐in‐Sand dune, Noordwijk Hidden levee in ecolgical settingLP19 Super levee Noordoostpolder: dunes Safety+nature leveeLP20 RAYdike Rising Tides Competition Communication with laser beams 2 2 2 2 2 2LP20 RAYdike Communication with laser beams 2 2 2 2 2 2
LP21 About Rising Tides: It’s the Delta, Stupid Rising Tides Competition Living levees 3 3 3 3 3
Potential measures Shoreline Typologies
Name Description
yp g
Urban Habitat BayName Description Urban Habitat Bay
ban
t d l d l
ode
ty uburba
rport
ort
tered
atural
tered
atural
Co Cit
Sub
Air
Po Alt
Na
Alt
Na
Land reclamationLand reclamationLR1 Coastal extention Coastal land reclamation 1LR1 Coastal extention Coastal land reclamation 1
LR2 'IJburg'‐ Amsterdam Artificial islands, monofunctional 2 2 2g ,LR3 Schiphol Haarlemmermeer (polders) Polder 2 2 2 2
LR4 Rotterdam port: Maasvlakte 1 Land reclamation monofunctional 2
LR5 Flyland: Schiphol in sea Artificial island in sea 2LR5 Flyland: Schiphol in sea Artificial island in sea 2
LR6 'Schaalsprong Almere' Artificial islands multifunctional 3 3 3 3LR6 Schaalsprong Almere Artificial islands multifunctional 3 3 3 3
LR7 Rotterdam port: 'Maasvlakte 2' Land reclamation multifunctional 3 3
LR8 Sand Engine Dutch coast Building with nature 3 3
LR9 S th W t D lt th N th l d A tifi i l i l d t t dLR9 South Western Delta, the Netherlands Artificial islands unprotected
ManagementManagementM1 Waddenzee wetland Adaptive wetland management 3 3 3 3M1 Waddenzee wetland Adaptive wetland management 3 3 3 3
M2 Occurrence / Intervention Rising Tides Competition Water management 2 2/ gM3 Evolutionary Recovery Rising Tides Competition Integrated Bay area management 3 3 3 3 3 3 3 3
Ri i Tid C titiM4 The 100 Year Plan Rising Tides Competition Integrated Water Management 3 3 3 3
RetentionRetentionR1 Fresh water retention IJsselmeer (2nd Delta commitee) Level rising IJsselmeer 2R1 Fresh water retention IJsselmeer (2nd Delta commitee) Level rising IJsselmeer 2
R2 Adaptive measures: Water retention in garages (R'dam) Retention (underground) 3R2 Adaptive measures: Water retention in garages (R dam) Retention (underground) 3
R3 Adaptive measures: Green roofs Retention (rooftop) 3
R4 Adaptive measures: Infiltration of precipitation (open paving) Infiltration/retention 3
R5 Ad ti O t i b i t R t ti ( bli ) 3 3R5 Adaptive measures: Open water in urban environment Retention (public space) 3 3
TransitionTransitionT1 Rotterdam Cityports ('Heysehaven/RDM') Transformation 3 3 3T1 Rotterdam Cityports ( Heysehaven/RDM ) Transformation 3 3 3
T2 Depoldering Noordwaard Depoldering and bypass 3p g ypT3 Adaptive residential areas Rotterdam Integrated urban water manag. 3 3
Tid l E id l f lifT4 Tidal Economy Tidal way of life 3 3 3 3 3 3 3 3
T5 Create ecological connectivity: Oosterwold / Westenholte Relocation of farm housesT5 Create ecological connectivity: Oosterwold / Westenholte Relocation of farm housesT6 Perkpolder Climate proof zone DepolderingT6 Perkpolder Climate proof zone DepolderingT7 Plan Tureluur Schouwen Duiveland Habitat restorationT8 Kleine Noordwaard Depoldering ecologic develop.T9 T hi l Shift t th U b W t f t Rising Tides Competition N t d l t 3T9 Topographical Shifts at the Urban Waterfront Rising Tides Competition Nature development 3
T10 Embracing the Rise: Multiple Adaptations to the Living Edge Rising Tides Competition Identify respond and adapt 3 3T10 Embracing the Rise: Multiple Adaptations to the Living Edge g p Identify, respond and adapt 3 3
T11 The Estuarine City Rising Tides Competition Ecocity development 3 3 3 3 3 3y y pT12 Failure! Rising Tides Competition Life on an amphibious edge 3 3 3 3 3 3
Tidal Denying Development
Economic Driven Development
Tidal Embracing Development
Ecology Driven
Development
Intentions
76 77
View on an adaptive future
Based on the Strategy Development Method two typologies/hotspots were selected for which the matrix is used to portray the result of each of the tidal rise intentions for that specific hot spot. This is presented as a hypothetical solution, and in a rather exaggerated way, to illustrate the result of a certain ambition.
For each of the two hot spots four artist impressions of possible solutions were created based on the four types of objectives.
78 79
A
A’
Cross-section A-A’
A
A’
Cross-section A-A’
A
A’
Cross-section A-A’
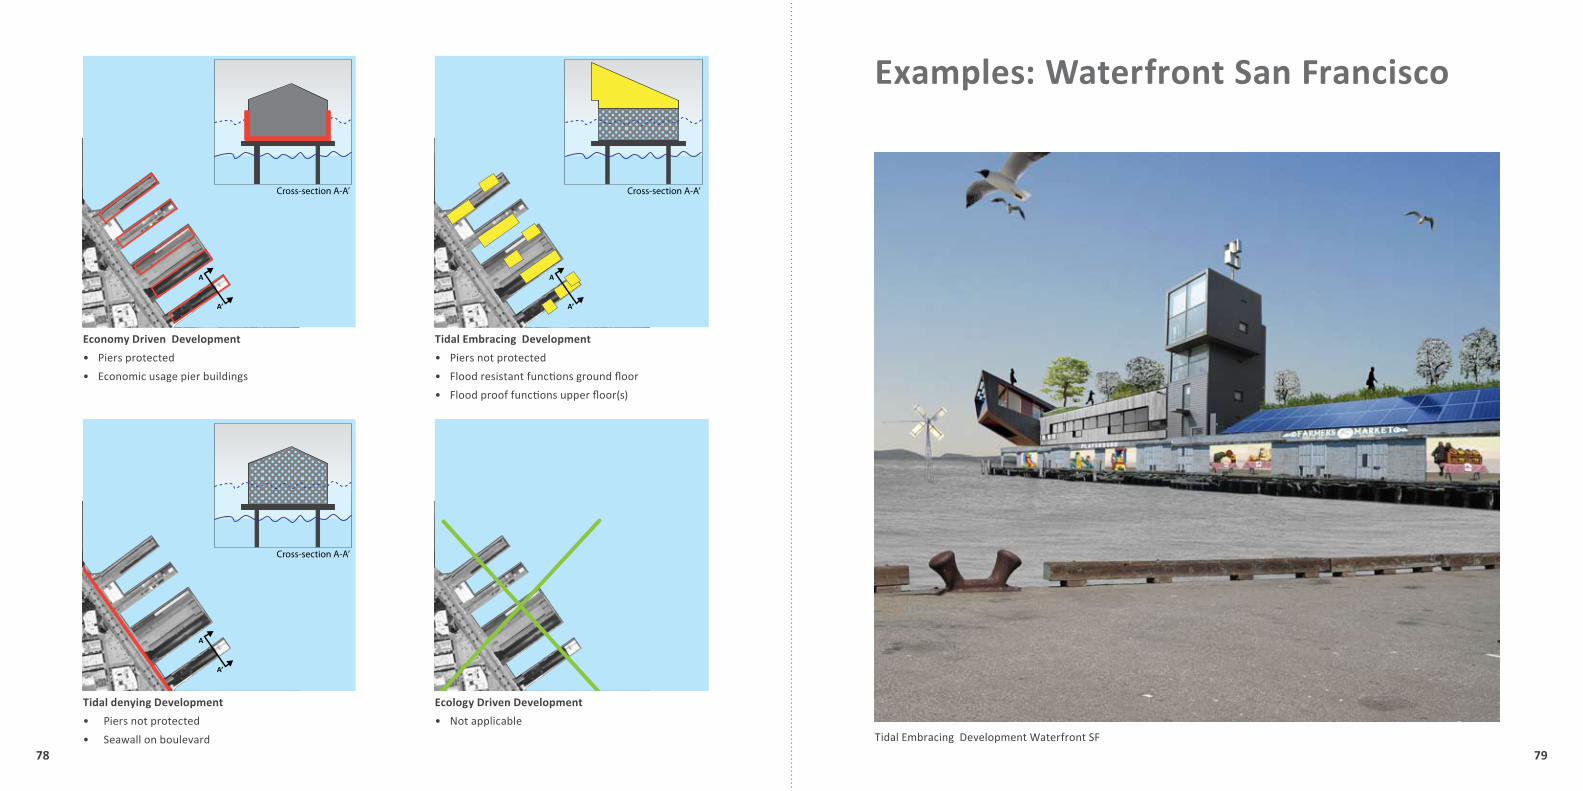
Economy Driven Development
Piers protected•
Economic usage pier buildings•
Tidal Embracing Development
Piers not protected•
Flood resistant functions ground floor•
Flood proof functions upper floor(s)•
Tidal denying Development
Piers not protected•
Seawall on boulevard•
Ecology Driven Development
Not applicable•
examples: Waterfront San Francisco
Tidal Embracing Development Waterfront SF
80 81
A
A’
Cross-section A-A’
A
A’
Cross-section A-A’
A
A’
Cross-section A-A’
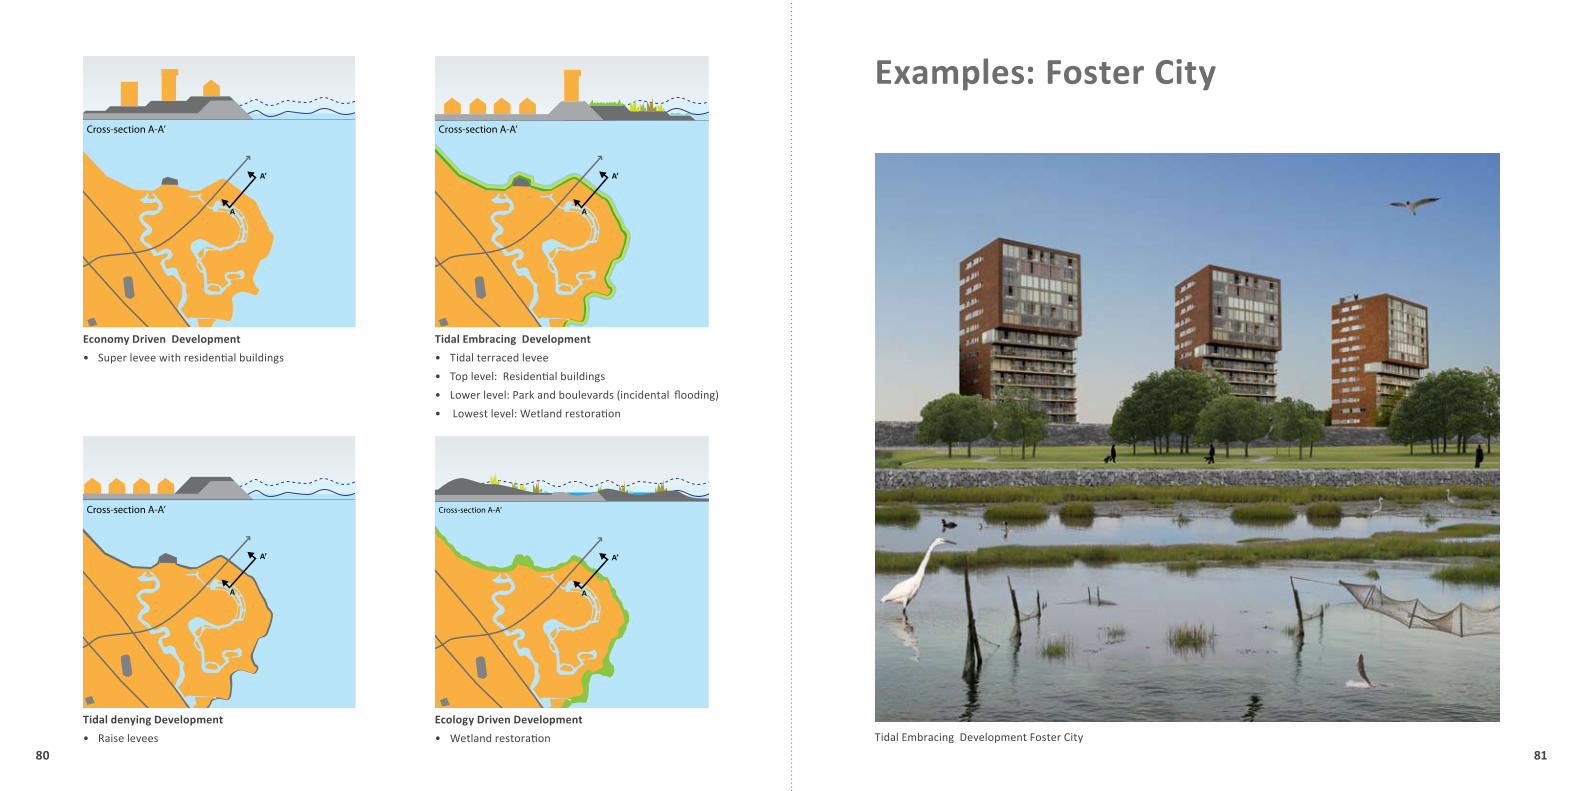
examples: Foster City
A
A’
Cross-section A-A’
Tidal Embracing Development Foster City
Economy Driven Development
Super levee with residential buildings•
Tidal Embracing Development
Tidal terraced levee•
Top level: Residential buildings •
Lower level: Park and boulevards (incidental flooding)•
Lowest level: Wetland restoration •
Tidal denying Development
Raise levees•
Ecology Driven Development
Wetland restoration•

82 83
COMPONENT 3
Institutional and organizational approaches
84 85
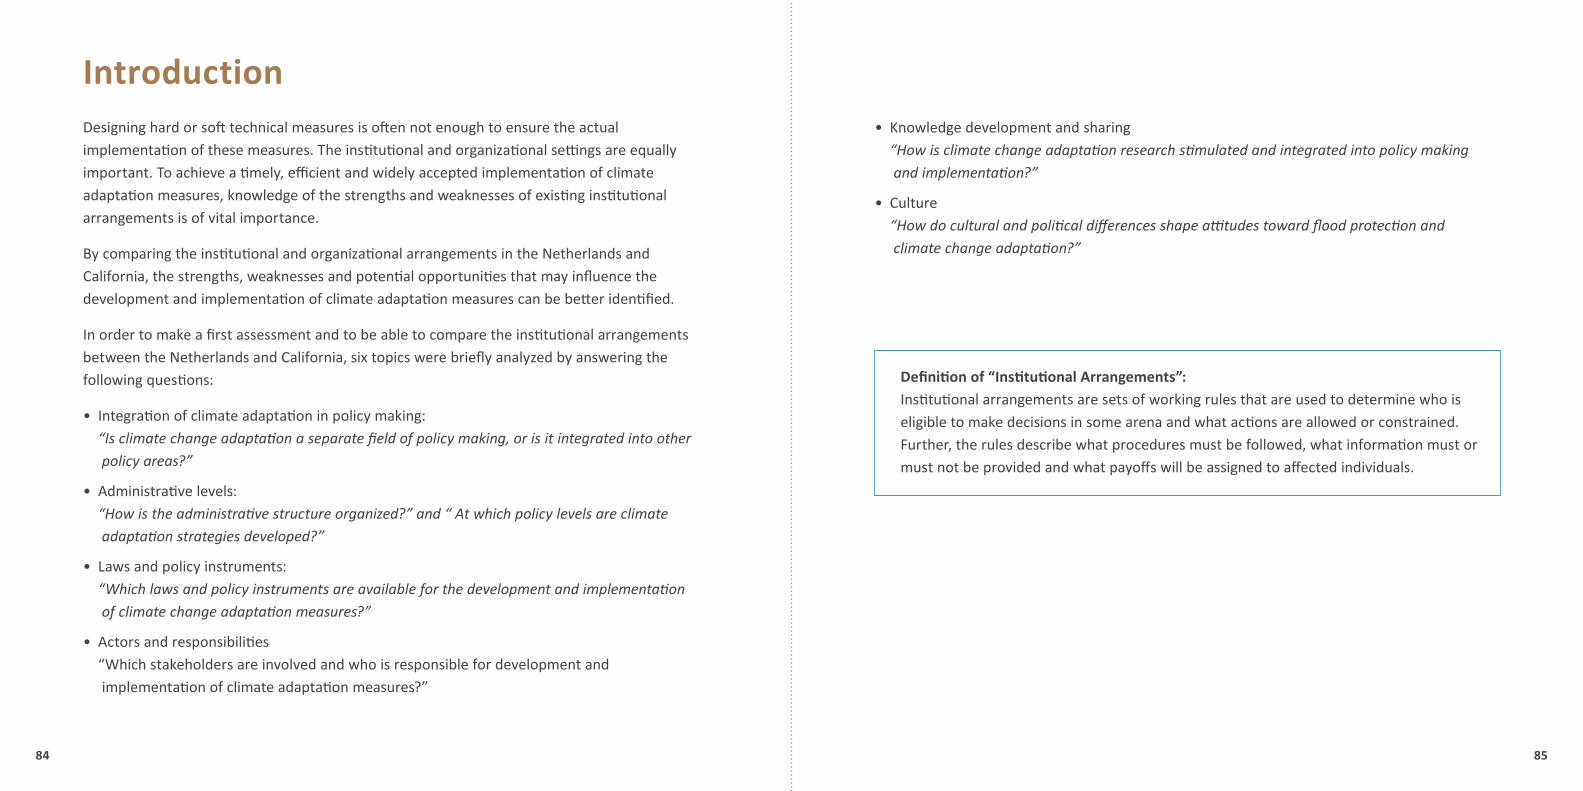
IntroductionDesigning hard or soft technical measures is often not enough to ensure the actual implementation of these measures. The institutional and organizational settings are equally important. To achieve a timely, efficient and widely accepted implementation of climate adaptation measures, knowledge of the strengths and weaknesses of existing institutional arrangements is of vital importance.
By comparing the institutional and organizational arrangements in the Netherlands and California, the strengths, weaknesses and potential opportunities that may influence the development and implementation of climate adaptation measures can be better identified.
In order to make a first assessment and to be able to compare the institutional arrangements between the Netherlands and California, six topics were briefly analyzed by answering the following questions:
Integration of climate adaptation in policy making: • “Is climate change adaptation a separate field of policy making, or is it integrated into other policy areas?”
Administrative levels: • “How is the administrative structure organized?” and “ At which policy levels are climate adaptation strategies developed?”
Laws and policy instruments: • “Which laws and policy instruments are available for the development and implementation of climate change adaptation measures?”
Actors and responsibilities • “Which stakeholders are involved and who is responsible for development and implementation of climate adaptation measures?”
Knowledge development and sharing • “How is climate change adaptation research stimulated and integrated into policy making and implementation?”
Culture • “How do cultural and political differences shape attitudes toward flood protection and climate change adaptation?”
Definition of “Institutional Arrangements”: Institutional arrangements are sets of working rules that are used to determine who is eligible to make decisions in some arena and what actions are allowed or constrained. Further, the rules describe what procedures must be followed, what information must or must not be provided and what payoffs will be assigned to affected individuals.

86 87
Netherlands California - SF Bay Area
Is climate change
adaptation a separate
field of policy making, or
is it integrated into other
policy areas?
With regard to climate change adaptation, • water is a dominant and structuring element in spatial planning in the Netherlands.
Recently, climate change adaptation has • been incorporated into spatial planning.
In California, state policy on climate • change adaptation is being formulated by a multi-agency team led by the California Natural Resources Agency pursuant to an Executive Order by California Governor Arnold Schwarzenegger.
BCDC plays a lead role in sea-level rise • adaptation planning for the Bay Area.
How is the administrative
structure organized?
At which policy levels
are climate change
adaptation strategies
developed?
The Netherlands has a three-tier • administrative structure with a national government, provinces and municipalities.
Water Boards are relatively autonomous • government organizations at regional level. They have, in contrast with the other authorities, a specific water management task.
The provinces are responsible for the • translation of national policy into the policy of water boards and municipalities by setting the boundary conditions. Provinces are primarily charged with the spatial planning of water management.
In the United States, much of the land use • planning and flood management is handled by the states, which, in turn, delegate considerable power to local government.
Local government in California consists of • cities, counties and special districts, including flood control districts.
Climate adaptation strategies are being • developed at the federal, state, regional and, increasingly, at the local level.
Which laws and policy
instruments are available
for the development
and implementation
of climate change
adaptation measures?
Climate change adaptation has recently • been integrated into national water management policies.
A new Delta Act on adaptation will provide • the legislative basis for implementation.
A variety of legal and administrative • procedures are used to ensure that all national, provincial and local land use plans, as well as decisions regarding individual development projects, are consistent with national water management laws and policies.
In the United States, there are no national • laws governing land use planning or water management.
In California, state law requires all local • governments to prepare a master plan, known as a general plan, for land use and future development. General plans are required to include a safety element, which covers flood protection and emergency preparedness.
Some of the laws that may be used to • address sea-level rise in the Bay Area include the California Environmental Quality Act, the federal Disaster Mitigation Act, and the McAteer-Petris Act, which created BCDC and was recently amended to address climate change adaptation planning for the Bay Area.
Which stakeholders are involved and who is responsible for development and implementation of climate adaptation measures?
In the Netherlands public participation • is integrated in most water and land-use planning procedures.
Public-private partnerships in climate • change adaptation are gaining more attention.
The hierarchical system of decision-making • inhibits innovation, negotiation, and public/private partnerships to develop effective climate change adaptation strategies.
In the United States, public participation • by individuals, lobbyists and special interest groups is integral to almost all government decision-making.
Innovation and public-private partnerships • are widely embraced and may facilitate the development of pioneering approaches for adapting to sea-level rise.
How is climate change adaptation research stimulated and integrated into policy making and implementation?
A number of research programs have been • developed to bring together scientists, policy makers and private sector.
Many projects move beyond traditional • research to applied experiments on the ground, that include adaptive management.
With respect to sea-level rise, research • programs have primarily focused on vulnerability assessments for the built environment and ecosystems and evaluation of adaptation strategies, although some projects are incorporating applied research on adaptation implementation.
For example, the South Bay Salt Ponds • Restoration Project is a major wetland restoration project that is using adaptive management. Research and monitoring will guide management decisions over time to achieve habitat improvement and flood protection.
How do cultural and political differences shape attitudes toward flood protection and climate change adaptation?
Citizens in the Netherlands accept that • their communal responsibilities are often more important than individual rights.
Due to a history of catastrophic floods • and the presence of over seven million people living below sea-level, each individual understands the critical importance of flood protection and places its trust in and expects the national government to assure this protection is provided.
In areas that are vulnerable to flooding, • the national government determines where development can and cannot take place. In areas where development is permitted to occur, flood insurance is neither required nor allowed.
Citizens in the United States believe that • the individual rights are the foundation of their democracy and communal responsibilities are often secondary.
A relatively small percentage of the • population lives below sea-level, and the flood risk associated with sea-level rise is not widely recognized as a problem.
The Federal Emergency Management • Agency maps areas that are vulnerable to flooding. In those areas development is allowed if certain flood protection standards are met, and flood insurance is required.
Accepting flood risk is seen as an individual • choice, and communal efforts to address the perils of flooding by restricting development in certain areas or requiring assessments to pay for flood protection infrastructure may be seen as infringing on individual freedom.

88 89
Case study in the Netherlands: “Reinforcement sea wall coastal city of Scheveningen-The Hague”The provinces of North and South Holland have formulated a Strategic Coastal Plan 2050 in order to protect the Dutch coast from sea-level rise and to comply with the Law on Flood Protection Structures. In this plan several weak links were identified for which the safety norm as defined by the national government is below standard in the long term. One of these links is the sea wall of coastal town Scheveningen.
Scheveningen, close to the Hague, is the largest coastal city of the Netherlands, with 13.9 million visitors each year. Almost all historic features are located on the boulevard. While increasing safety and reinforcing the sea wall it was very important to strengthen the spatial quality and keep the unique landmarks on the sea side. In this way the the plan contributes towards realizing the ambition of The Hague of being a “World City on the Coast”.
For the preparation of the plan a Project Group was established, consisting of the four main stakeholders. The engineering and consultancy firm ARCADIS supported the entire planning process, starting with defining the design criteria based on the predicted sea-level rise scenario’s, exploring possible technical solutions, preparation of necessary technical reports and plans, and assist in overall planning process, including the consultation of the public and specific stakeholder groups.
Participant role in processWater Board Delfland Administrator of the sea wall and initiator of the project group. Primarily concerned
with safety, robustness, controllability and maintenance of the seawall.
Municipality of The Hague Focus on spatial planning and aims for an attractive boulevard. They finance the additional cost for creating added value to this project that is not flood protection related (e.g. boulevard).
Province of South Holland Approves the planned reinforcement of the sea wall and controls the directives of the Environmental Impact Assessment (EIA). They also stimulate improvement of the attractiveness of the Dutch coast to enhance economic development and ecological restoration
National government - Directorate-General for Public Works and Water Management
Responsible for overall safety and financer of the “flood protection part” of this project. This includes reinforcement of the sea wall and compensation for the existing spatial quality.
Other stakeholders, including citizens, managers of the beach pavilions, environmental organizations, etc.
During several meetings, stakeholders outside the project group had the opportunity to respond on the (conceptual) design. Over the course of the project they were invited to the table multiple times.
Organization
Formal procedure
Steps Action responsible party1 Initial start document Water Board
2 Publish start document Province
3 Formal consultation & advice All stakeholders
4 Advice on EIA guidelines EIA-Commission
Finalise guidelines for Project Report/EIA Province
5 Preparation Project Report/EIA Water Board
6 Preparation Reinforcement Plan and Requests for Permits Water Board
7 Publish Preparation Project Report/EIA & Reinforcement Plan and Requests for Permits
Province
8 Formal consultation & advice All stakeholders and public
9 Review EIA report EIA-Commission
10 Clarification Memo Province
11 Completion of Final Project Report/EIA, Final Reinforcement Plan and related Requests for Permits
Water Board
12 Approval & Publication Province
13 Possibility for Appeal State Council

90 91
Case study San Francisco Bay “Planning for Sea-level Rise – Treasure Island Redevelopment”
Outcome The outcome of this process resulted in adaptation measures which combined both the safety and spatial planning objectives. On one hand sand suppletion will be applied on the beach as a ‘soft’ measure, while on the other hand a ‘hard’ dike (sea wall) will be build inside the boulevard. Here beach nourishment is going to be used as a way to increase safety (reduction of wave height and energy) and thereby allowing a lower sea wall, highly desired to avoid losing too much of the beautiful sea sight from the boulevard.
Treasure Island is a man-made island that was constructed with fill dredged from the San Francisco Bay in 1938 and is connected to the naturally occurring Yerba Buena Island to the south. It is located midway between San Francisco and Oakland, California, and is approximately 400 acres in size.
Treasure Island was originally constructed to be the site of San Francisco’s airport and served as host to the Golden Gate International Exposition in 1938 and 1939. The outbreak of World War II prevented the island from becoming an airport. Instead, ownership of the island was then transferred from the City of San Francisco to the U.S. Navy for military use by the U.S. Navy. In 1997, the naval base was closed and the Treasure Island Development Authority (TIDA) was created as a single purpose entity, a non-profit public benefit corporation with the powers of a redevelopment agency, to oversee redevelopment of both Treasure Island and Yerba Buena Island.
92 93
In 2003, TIDA selected Treasure Island Community Development (TICD) as the prospective master developer, subject to the terms of an Exclusive Negotiating Agreement under which both parties agree to negotiate the terms of a final Disposition and Development Agreement. In 2006, the San Francisco Board of Supervisors (the local legislative body) and the TIDA Board endorsed a Development Plan and Term Sheet that serves as the basis for a Final Redevelopment Plan that is currently being prepared.
As part of the long-term redevelopment planning process, TIDA and TICD have prepared an adaptive management strategy to address potential sea-level rise in the future. Moffatt & Nichol, TICD’s coastal engineers, have led a collaborative planning process involving local, regional and state agencies, to review projections of sea-level rise, and to develop appropriate design criteria and strategies for both short term and long term improvements to address rising seas. Funding mechanisms are also being explored for future improvements.
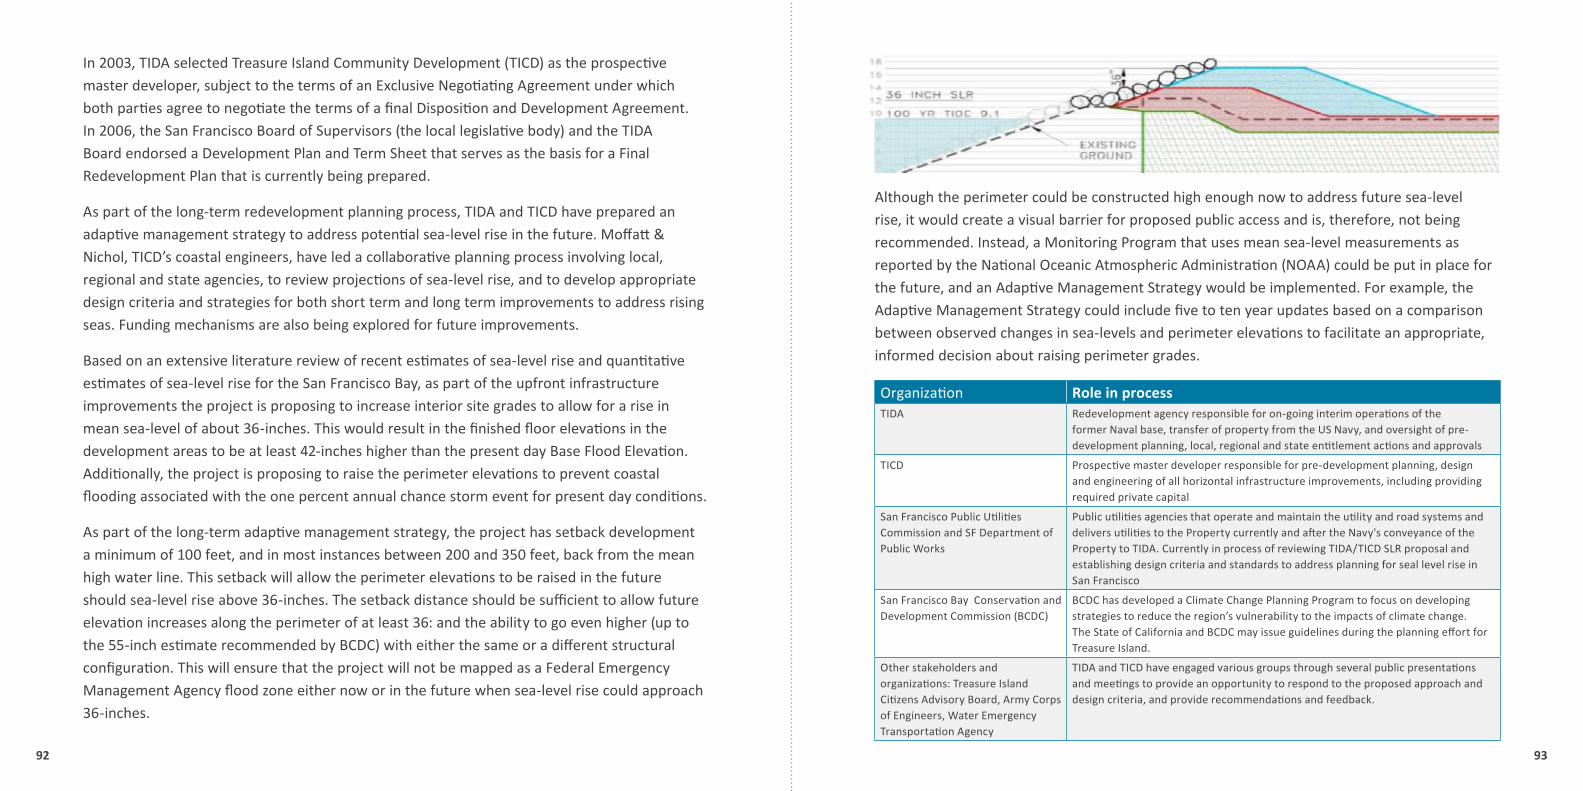
Based on an extensive literature review of recent estimates of sea-level rise and quantitative estimates of sea-level rise for the San Francisco Bay, as part of the upfront infrastructure improvements the project is proposing to increase interior site grades to allow for a rise in mean sea-level of about 36-inches. This would result in the finished floor elevations in the development areas to be at least 42-inches higher than the present day Base Flood Elevation. Additionally, the project is proposing to raise the perimeter elevations to prevent coastal flooding associated with the one percent annual chance storm event for present day conditions.
As part of the long-term adaptive management strategy, the project has setback development a minimum of 100 feet, and in most instances between 200 and 350 feet, back from the mean high water line. This setback will allow the perimeter elevations to be raised in the future should sea-level rise above 36-inches. The setback distance should be sufficient to allow future elevation increases along the perimeter of at least 36: and the ability to go even higher (up to the 55-inch estimate recommended by BCDC) with either the same or a different structural configuration. This will ensure that the project will not be mapped as a Federal Emergency Management Agency flood zone either now or in the future when sea-level rise could approach 36-inches.
Although the perimeter could be constructed high enough now to address future sea-level rise, it would create a visual barrier for proposed public access and is, therefore, not being recommended. Instead, a Monitoring Program that uses mean sea-level measurements as reported by the National Oceanic Atmospheric Administration (NOAA) could be put in place for the future, and an Adaptive Management Strategy would be implemented. For example, the Adaptive Management Strategy could include five to ten year updates based on a comparison between observed changes in sea-levels and perimeter elevations to facilitate an appropriate, informed decision about raising perimeter grades.
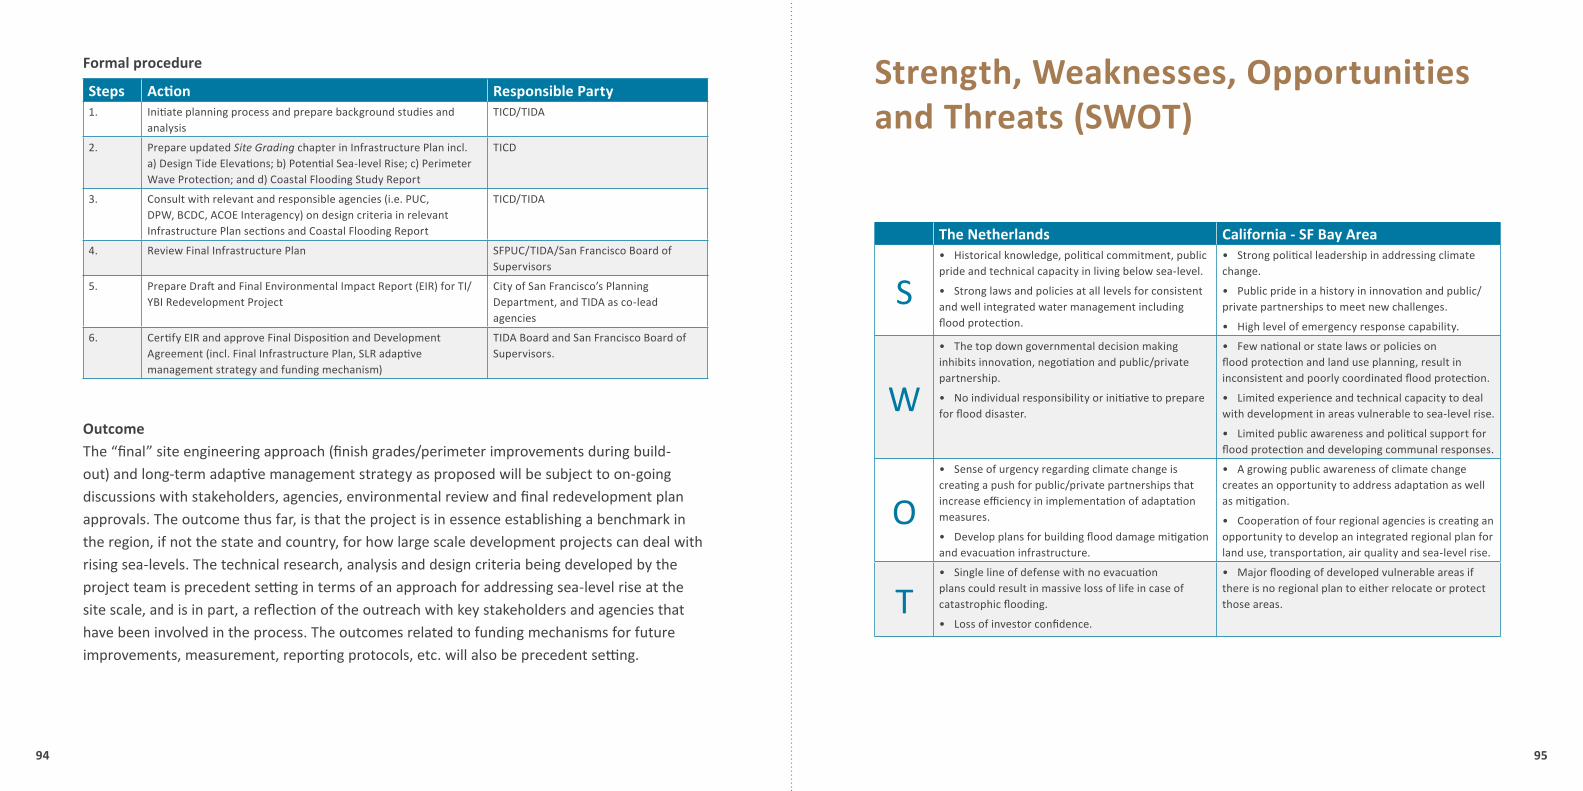
Organization role in processTIDA Redevelopment agency responsible for on-going interim operations of the
former Naval base, transfer of property from the US Navy, and oversight of pre-development planning, local, regional and state entitlement actions and approvals
TICD Prospective master developer responsible for pre-development planning, design and engineering of all horizontal infrastructure improvements, including providing required private capital
San Francisco Public Utilities Commission and SF Department of Public Works
Public utilities agencies that operate and maintain the utility and road systems and delivers utilities to the Property currently and after the Navy's conveyance of the Property to TIDA. Currently in process of reviewing TIDA/TICD SLR proposal and establishing design criteria and standards to address planning for seal level rise in San Francisco
San Francisco Bay Conservation and Development Commission (BCDC)
BCDC has developed a Climate Change Planning Program to focus on developing strategies to reduce the region’s vulnerability to the impacts of climate change. The State of California and BCDC may issue guidelines during the planning effort for Treasure Island.
Other stakeholders and organizations: Treasure Island Citizens Advisory Board, Army Corps of Engineers, Water Emergency Transportation Agency
TIDA and TICD have engaged various groups through several public presentations and meetings to provide an opportunity to respond to the proposed approach and design criteria, and provide recommendations and feedback.
94 95
Formal procedure
Steps Action responsible Party1. Initiate planning process and prepare background studies and
analysis TICD/TIDA
2. Prepare updated Site Grading chapter in Infrastructure Plan incl. a) Design Tide Elevations; b) Potential Sea-level Rise; c) Perimeter Wave Protection; and d) Coastal Flooding Study Report
TICD
3. Consult with relevant and responsible agencies (i.e. PUC, DPW, BCDC, ACOE Interagency) on design criteria in relevant Infrastructure Plan sections and Coastal Flooding Report
TICD/TIDA
4. Review Final Infrastructure Plan SFPUC/TIDA/San Francisco Board of Supervisors
5. Prepare Draft and Final Environmental Impact Report (EIR) for TI/YBI Redevelopment Project
City of San Francisco’s Planning Department, and TIDA as co-lead agencies
6. Certify EIR and approve Final Disposition and Development Agreement (incl. Final Infrastructure Plan, SLR adaptive management strategy and funding mechanism)
TIDA Board and San Francisco Board of Supervisors.
Outcome The “final” site engineering approach (finish grades/perimeter improvements during build-out) and long-term adaptive management strategy as proposed will be subject to on-going discussions with stakeholders, agencies, environmental review and final redevelopment plan approvals. The outcome thus far, is that the project is in essence establishing a benchmark in the region, if not the state and country, for how large scale development projects can deal with rising sea-levels. The technical research, analysis and design criteria being developed by the project team is precedent setting in terms of an approach for addressing sea-level rise at the site scale, and is in part, a reflection of the outreach with key stakeholders and agencies that have been involved in the process. The outcomes related to funding mechanisms for future improvements, measurement, reporting protocols, etc. will also be precedent setting.
Strength, Weaknesses, Opportunities and Threats (SWOT)
The Netherlands California - SF Bay Area
SHistorical knowledge, political commitment, public •
pride and technical capacity in living below sea-level.
Strong laws and policies at all levels for consistent • and well integrated water management including flood protection.
Strong political leadership in addressing climate • change.
Public pride in a history in innovation and public/• private partnerships to meet new challenges.
High level of emergency response capability.•
W
The top down governmental decision making • inhibits innovation, negotiation and public/private partnership.
No individual responsibility or initiative to prepare • for flood disaster.
Few national or state laws or policies on • flood protection and land use planning, result in inconsistent and poorly coordinated flood protection.
Limited experience and technical capacity to deal • with development in areas vulnerable to sea-level rise.
Limited public awareness and political support for • flood protection and developing communal responses.
OSense of urgency regarding climate change is •
creating a push for public/private partnerships that increase efficiency in implementation of adaptation measures.
Develop plans for building flood damage mitigation • and evacuation infrastructure.
A growing public awareness of climate change • creates an opportunity to address adaptation as well as mitigation.
Cooperation of four regional agencies is creating an • opportunity to develop an integrated regional plan for land use, transportation, air quality and sea-level rise.
TSingle line of defense with no evacuation •
plans could result in massive loss of life in case of catastrophic flooding.
Loss of investor confidence.•
Major flooding of developed vulnerable areas if • there is no regional plan to either relocate or protect those areas.

96 97
ChallengesCoastal areas and estuaries have strong economic and environmental potential. For this reason they have been, and still are, attractive places for people to live and work. The San Francisco Bay Area and the Netherlands are examples of highly populated places that strive to meet their economic and environmental potential.
At the same time these areas are increasingly vulnerable to external pressures as a result of climate change. For example, sea-level rise and it’s associated problems are expected to increase in the coming decades.
Taking advantage of the Californian and Dutch leadership in climate change will open new possibilities to develop innovative adaptation measures and institutional settings to address sea-level rise.
OpportunitiesCombining the strengths of the Californian side with those of the Dutch side will help to address the threats, overcome our weaknesses and capitalize on the identified combined opportunities.
Pilot areas Combination of Californian business entrepreneurship and Dutch knowledge will, for example, create more physical space to experiment. The Bay Area provides an excellent opportunity for a demonstration project to advance the partnership between California and the Dutch.
regional approach Just as pressures such as climate change do not stop at jurisdictional boundaries, a regional approach to address adaptation measures is essential. A regional approach towards spatial planning, water resource management and urbanization in the San Francisco Bay Area, and the
catchments of the main tributaries flowing into the Bay, will help to develop and implement measures that address climate changeand other issues, such as urban sprawl.
Creating an institution that combines the planning capacity and jurisdiction to address flood protection, spatial planning and water management would be ideal.
The regional coordination in place in Portland, Oregon, and Vancouver, Canada, can be used as an example and combined with the strong points of the regional organization in The Netherlands.
This could lead to an institution combining the coordination and planning of the Joint Policy Committee (JPC) with the jurisdiction of local governments, including cities, counties and special districts.
A proposal to achieve scenario implementation The implementation of climate adaptation measures can be stimulated by an organizational structure consisting of a non-profit legal entity (e.g. Bay Visions) and a for-profit entity (e.g. Bay Venture).
The non-profit legal entity Bay Visions will encompass research, innovation and education program, technological development programs and demonstration projects.
Bay Visions will have an associated start-up fund (Bay Venture) through which partners can create investment syndicates in areas of common strategic importance. The intent is to create cross representation between the two entities to the mutual benefit of all partners involved. Bay Venture could be presented as a single ‘core partner’ in the governing body of Bay Visions.

98 99
COMPONENT 4
Scope for future cooperation

100 101
Opportunities for continued cooperationThis pilot project clearly shows the value of working together in an international context. It encouraged fresh ideas, new perspectives and approaches. The project also showed that there are many geographical similarities between the Netherlands and California and that both are confronted with substantial effects due to climate change.
Both the Netherlands and California:
are confronted with substantial sea-level rise due to climate change;•
are searching for appropriate strategies to overcome this challenge;•
want to be frontrunners in this field;•
jointly can set the stage and be an example for the rest of the world by their progressive and •
innovative approaches to problem solving.
As was noticed when we combine the above, and join forces it really becomes 1 + 1 = 3, or as Governor Schwarzenegger perceived a new alliance: 2 + 2 = 6.
During the course of this project it became clear that there are many opportunities where we could further expand the initiated cooperation. Some of the opportunities are related to the specific components of this pilot project. But there are other opportunities related to overall approaches and integrating all the components.
Continued cooperation can be implemented in several ways. Opportunities include: concrete pilot projects, zooming in to a particular location in California, the Netherlands or other delta and coastal areas in the world facing similar challenges; research projects, exchange programs at universities and partnerships; continued cooperation in the form of consultancy and engineering services; or the development of new and innovative products.
The following paragraphs provide an overview of possible areas of collaboration that came out of this study.
2 + 2 = 6
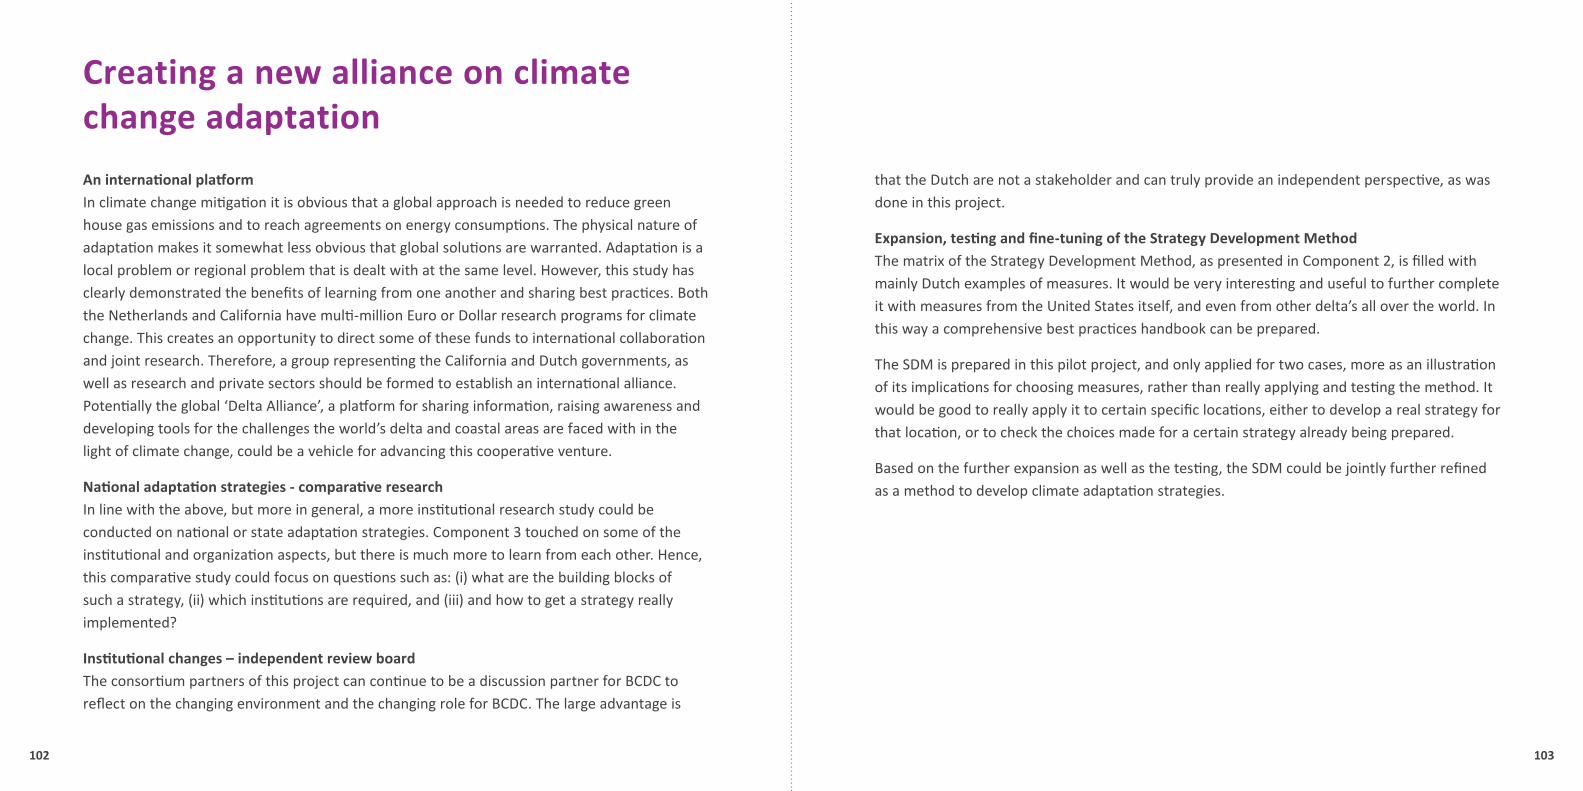
102 103
Creating a new alliance on climate change adaptation
An international platform In climate change mitigation it is obvious that a global approach is needed to reduce green house gas emissions and to reach agreements on energy consumptions. The physical nature of adaptation makes it somewhat less obvious that global solutions are warranted. Adaptation is a local problem or regional problem that is dealt with at the same level. However, this study has clearly demonstrated the benefits of learning from one another and sharing best practices. Both the Netherlands and California have multi-million Euro or Dollar research programs for climate change. This creates an opportunity to direct some of these funds to international collaboration and joint research. Therefore, a group representing the California and Dutch governments, as well as research and private sectors should be formed to establish an international alliance. Potentially the global ‘Delta Alliance’, a platform for sharing information, raising awareness and developing tools for the challenges the world’s delta and coastal areas are faced with in the light of climate change, could be a vehicle for advancing this cooperative venture.
National adaptation strategies - comparative research In line with the above, but more in general, a more institutional research study could be conducted on national or state adaptation strategies. Component 3 touched on some of the institutional and organization aspects, but there is much more to learn from each other. Hence, this comparative study could focus on questions such as: (i) what are the building blocks of such a strategy, (ii) which institutions are required, and (iii) and how to get a strategy really implemented?
Institutional changes – independent review board The consortium partners of this project can continue to be a discussion partner for BCDC to reflect on the changing environment and the changing role for BCDC. The large advantage is
that the Dutch are not a stakeholder and can truly provide an independent perspective, as was done in this project.
Expansion, testing and fine-tuning of the Strategy Development Method The matrix of the Strategy Development Method, as presented in Component 2, is filled with mainly Dutch examples of measures. It would be very interesting and useful to further complete it with measures from the United States itself, and even from other delta’s all over the world. In this way a comprehensive best practices handbook can be prepared.
The SDM is prepared in this pilot project, and only applied for two cases, more as an illustration of its implications for choosing measures, rather than really applying and testing the method. It would be good to really apply it to certain specific locations, either to develop a real strategy for that location, or to check the choices made for a certain strategy already being prepared.
Based on the further expansion as well as the testing, the SDM could be jointly further refined as a method to develop climate adaptation strategies.

104 105
Awareness creation through web-based decision support system The results of this project, with concrete measures for certain places, depending on a chosen intention, as part of the Strategy Development Method, can also be placed on an interactive website. The public can access this site with a web-based database, and select their own preferred strategy and measures, and assess its applicability to the Bay Area. This can be set up in a combination of Dutch expertise from this study with IT support from Silicon Valley.
Awareness creation through special activities The results of BCDC’s Rising Tides International Design Competition provided several examples of creating more awareness, such as the RAYdike. This competition raised public awareness and stimulated discussion among citizens. However, many of the entries in the competition raised the same question: how can this ever happen? The Dutch situation is quite different from the Californian situation: in the Netherlands the public expects the government to protect the people from flooding. In California, there are so many other pressing problems that the danger from sea-level rise is given less attention. Special activities could be organized, making use of the Dutch experiences in campaigns on awareness creation, for instance the program “Living with Water”.
research on how to overcome social barriers To deal with social change issues and physical challenges, a collaborative research program could be developed to assess how to overcome these kinds of social barriers and better address the physical challenges resulting by climate change.
Human Capital - Exchange of PhD positions / scholarships The mentioned research programs and studies, as well as many other ideas can be executed through the exchange of students and/or combination of PhD positions or scholarships, for instance between the universities of Wageningen and Berkely.
Creating awareness and social change Modeling and planning
Modeling studies The modeling work done on the impacts of sea-level rise including wave height, flow velocities and tidal changes is very preliminary, touching on some of the impacts.
It would be advisable to continue to elaborate on these findings, potentially in partnership with USGS, which would include:
Sensitivity analysis on exceeding certain water levels;•
Simulation of navigation to assess impact of changed velocities;•
More detailed analysis of wave height related to predominant wind directions and speed. •
Assess likelihood of occurrence of additional 0.5 m wave height;
Analysis of sedimentation due to changed velocities and current directions;•
Analysis of sedimentation in combination with tidal movement and sea-level rise, with effects •
on flora & fauna, turbidity and salinity.
Basin wide modeling ànd planning The modeling work in this pilot is limited to the open water area of the bay and its shoreline. It would be good to upscale the modeling work to a total system approach where the entire Bay estuary system, including the rivers that flow into the South Bay and their tributaries are included. This makes it possible to investigate the interaction between the Bay and the Delta. Only in this way can a comprehensive overview be derived of the total challenges ahead in the light of climate change, and, more importantly, can the information necessary for an integrated planning process be developed. This could further focus (i) on flood management, for instance the flood events at Alviso, or (ii) fresh-salt water interaction between the Bay and the Delta.

106 107
More than adaptation
Combining mitigation measures with chosen adaptation measures This is a subject hardly touched upon, but it provides good scope for linking adaptive measures with additional mitigating measures. It is not yet included in the strategy developed method, and could provide additional win-win situations. For example, how to combine a new flood defense structure with a new public transport system, optimizing travel distances, or using new modes of transport, resulting in reduced emissions? Or how to use a super levee for generating green energy with solar panels and wind mills? How to optimize use of tidal energy, in combination with providing safety against flooding?
Nitrous and Methane inclusion Some of the studies and documents studied in this pilot project mentioned the advantage of wetlands for carbon dioxide (CO2) fixation, which is an adaptive measure that is also mitigating increased greenhouse gas emissions. However, research in the Netherlands found that marine wetlands also produce other gasses that might counterbalance these positive results. Therefore a research project that investigates methane (CH4) and nitrous oxide (N2O) production from wetlands could yield a more integrated green house gas balance.

108 109
Entrepreneurship and new business opportunities
As stated before a changing climate also brings new business opportunities. More and more businesses steer toward a green way of doing business, developing new values and requirements. One such result is for example that the civil engineering world sees nontraditional partners enter the field of climate change adaptation. IT companies see an opportunity of delivering more intelligent flood protection and water quality systems and venture capital firms seek investment in green, climate change and water related companies. This is a market development that will further foster the cooperation between top technology in IT and venture capital in California and the top expertise in water and climate in the Netherlands.
If you want to know your past, look at your present conditions
If you want to know your future, look into your present actions

110 111
COLOPHON

112 113
Colophon
Project team:
Date: 21 September 2009 Document number: C03021/CE9/0E0/000009
ARCADIS David van Raalten (project manager) Thijs van der Laan Peter Wijsman Ludo Boeije Eric Schellekens Piet Dircke Bob Pyke
Alterra – Wageningen University Eddy Moors Saskia van Pelt
Deltares Edwin Elias Jos Dijkman
BCDC Will Travis Brad McCrea Joe LaClair Steve Goldbeck
Grafic design Martijn Schoots