San Diego County · 2015 DEMOGRAPHIC PROFILES. San Diego County. Published May 2017 . County of San...
52
2015 DEMOGRAPHIC PROFILES San Diego County Published May 2017 County of San Diego, Health & Human Services Agency, Public Health Services, Community Health Stascs Unit. Occupaon Age Housing Veterans Income Educaon
Transcript of San Diego County · 2015 DEMOGRAPHIC PROFILES. San Diego County. Published May 2017 . County of San...

2015 DEMOGRAPHIC PROFILES
San Diego County Published May 2017
County of San Diego, Health & Human Services Agency, Public Health Services, Community Health Statistics Unit.
Occupation
Age
Housing
Veterans
Income
Education

Basic Population CharacteristicsTotal Population 1Age 2Gender 3Race/Ethnicity 4Asian/Pacific Islander Population 5-8Language Spoken at Home 9-17School Enrollment (K-12) 18Education Attainment 19Marital Status 20Single Parent Households 21Vehicles in Household 22
Income and PovertyLabor Force 23Labor Force by Occupation 24Occupation by Industry 25-26Ways of Commuting to Work 27Household Income 28Median and Persons Per Household Income 29Owner vs. Renter Occupancy 30Median Rent and House Value 31Housing Cost as Percent of Household Income 32Poverty Level 33Poverty Level by Age 34Population and Families Living Below Poverty 35
Special PopulationsSeniors: Household Type 36Seniors: Labor Force and Poverty 37Disability 38Disability by Age 39Foreign Born Population 40Grandparents Living with Grandchildren Under 18 Years by Responsibility for Grandchildren 41Health Insurance Status 42Income and Benefits 43CalFresh/SNAP/Food Stamps Receipt and Eligibility 44
VeteransVeteran Population and by Gender 45Veterans by Race/Ethnicity 46Veterans by Age Group 47Veterans: Median Income and Poverty 48Veterans: Educational Attainment 49Veterans: Period of Service (Detailed) 50
Table of Contents
Please visit the County of San Diego's data access portal, Socrata, to download demographic profile data and/or health outcome data: https://data.livewellsd.org.

Source: U.S. Census Bureau; 2011-2015 American Community Survey 5-Year Estimates, Table B01001.
Geography Total PopulationCentral Region 503,845
Central San Diego 169,456Mid-City 169,472Southeastern San Diego 164,917
East Region 482,772Alpine 15,672El Cajon 129,950Harbison-Crest 15,489Jamul 19,165La Mesa 61,282Laguna-Pine Valley 5,653Lakeside 57,417Lemon Grove 31,127Mountain Empire 7,178Santee 52,911Spring Valley 86,928
North Central Region 625,333Coastal 75,670Del Mar-Mira Mesa 168,711Elliott-Navajo 91,923Kearny Mesa 163,800Miramar 5,027Peninsula 63,119University 57,083
North Coastal Region 524,777Carlsbad 121,237Oceanside 164,326Pendleton 39,454San Dieguito 96,984Vista 102,776
North Inland Region 591,808Anza-Borrego Springs 3,498Escondido 170,061Fallbrook 48,673North San Diego 112,537Palomar-Julian 5,517Pauma 7,067Poway 89,473Ramona 36,388San Marcos 95,452Valley Center 23,142
South Region 494,561Chula Vista 117,224Coronado 24,447National City 59,631South Bay 147,225Sweetwater 146,034
San Diego County 3,223,096
Total Population
503,84515.6%
482,77215.0%
625,33319.4%
524,77716.3%
591,80818.4%
494,56115.3%
San Diego County Population Distribution by HHSA Regions, 2015
Central RegionEast RegionNorth Central RegionNorth Coastal RegionNorth Inland RegionSouth Region
Source: U.S. Census Bureau; 2011-2015 American Community Survey 5-Year Estimates, Table B01001. Prepared by: County of San Diego, Health and Human Services Agency, Public Health Services, Community Health Statistics Unit, 2017.
Page 1

Source: U.S. Census Bureau; 2011-2015 American Community Survey 5-Year Estimates, Table B01001.
# % # % # % # % # % # %Central Region 33,290 6.6% 56,008 11.1% 83,472 16.6% 171,907 34.1% 110,995 22.0% 48,173 9.6%
Central San Diego 8,196 4.8% 11,037 6.5% 21,508 12.7% 73,500 43.4% 37,728 22.3% 17,487 10.3%Mid-City 12,031 7.1% 20,649 12.2% 34,787 20.5% 52,693 31.1% 35,520 21.0% 13,792 8.1%Southeastern San Diego 13,063 7.9% 24,322 14.7% 27,177 16.5% 45,714 27.7% 37,747 22.9% 16,894 10.2%
East Region 30,900 6.4% 61,892 12.8% 69,168 14.3% 127,350 26.4% 129,023 26.7% 64,439 13.3%Alpine 751 4.8% 1,641 10.5% 2,294 14.6% 3,133 20.0% 4,950 31.6% 2,903 18.5%El Cajon 8,962 6.9% 17,412 13.4% 20,330 15.6% 35,050 27.0% 32,152 24.7% 16,044 12.3%Harbison-Crest 531 3.4% 1,783 11.5% 1,921 12.4% 3,064 19.8% 5,303 34.2% 2,887 18.6%Jamul 675 3.5% 2,277 11.9% 3,134 16.4% 4,778 24.9% 5,783 30.2% 2,518 13.1%La Mesa 4,209 6.9% 6,483 10.6% 7,584 12.4% 18,754 30.6% 15,071 24.6% 9,181 15.0%Laguna-Pine Valley 392 6.9% 604 10.7% 906 16.0% 1,145 20.3% 1,713 30.3% 893 15.8%Lakeside 3,811 6.6% 8,426 14.7% 7,573 13.2% 14,678 25.6% 15,718 27.4% 7,211 12.6%Lemon Grove 1,745 5.6% 4,247 13.6% 4,619 14.8% 8,634 27.7% 8,212 26.4% 3,670 11.8%Mountain Empire 548 7.6% 842 11.7% 1,027 14.3% 1,670 23.3% 1,996 27.8% 1,095 15.3%Santee 3,459 6.5% 6,628 12.5% 7,116 13.4% 14,113 26.7% 15,071 28.5% 6,524 12.3%Spring Valley 5,817 6.7% 11,549 13.3% 12,664 14.6% 22,331 25.7% 23,054 26.5% 11,513 13.2%
North Central Region 35,720 5.7% 63,046 10.1% 96,522 15.4% 199,826 32.0% 150,208 24.0% 80,011 12.8%Coastal 2,888 3.8% 4,790 6.3% 11,047 14.6% 28,165 37.2% 15,929 21.1% 12,851 17.0%Del Mar-Mira Mesa 10,147 6.0% 23,213 13.8% 20,532 12.2% 49,483 29.3% 48,319 28.6% 17,017 10.1%Elliott-Navajo 6,555 7.1% 11,309 12.3% 10,760 11.7% 25,821 28.1% 23,158 25.2% 14,320 15.6%Kearny Mesa 9,436 5.8% 15,361 9.4% 25,155 15.4% 53,647 32.8% 38,889 23.7% 21,312 13.0%Miramar 383 7.6% 563 11.2% 2,858 56.9% 1,176 23.4% 47 0.9% 0 0.0%Peninsula 3,667 5.8% 4,580 7.3% 12,611 20.0% 20,039 31.7% 14,508 23.0% 7,714 12.2%University 2,644 4.6% 3,230 5.7% 13,559 23.8% 21,495 37.7% 9,358 16.4% 6,797 11.9%
North Coastal Region 36,117 6.9% 64,865 12.4% 81,463 15.5% 145,035 27.6% 129,561 24.7% 67,736 12.9%Carlsbad 6,792 5.6% 15,678 12.9% 12,718 10.5% 31,016 25.6% 34,620 28.6% 20,413 16.8%Oceanside 10,872 6.6% 20,211 12.3% 24,843 15.1% 47,306 28.8% 40,892 24.9% 20,202 12.3%Pendleton 6,321 16.0% 3,365 8.5% 19,688 49.9% 9,938 25.2% 112 0.3% 30 0.1%San Dieguito 5,409 5.6% 12,345 12.7% 9,533 9.8% 25,029 25.8% 28,917 29.8% 15,751 16.2%Vista 6,723 6.5% 13,266 12.9% 14,681 14.3% 31,746 30.9% 25,020 24.3% 11,340 11.0%
North Inland Region 41,135 7.0% 79,326 13.4% 76,678 13.0% 156,971 26.5% 157,106 26.5% 80,592 13.6%Anza-Borrego Springs 234 6.7% 184 5.3% 350 10.0% 661 18.9% 987 28.2% 1,082 30.9%Escondido 13,185 7.8% 22,217 13.1% 26,442 15.5% 49,820 29.3% 40,097 23.6% 18,300 10.8%Fallbrook 3,046 6.3% 5,191 10.7% 6,163 12.7% 11,236 23.1% 13,516 27.8% 9,521 19.6%North San Diego 7,938 7.1% 15,871 14.1% 12,377 11.0% 30,639 27.2% 30,452 27.1% 15,260 13.6%Palomar-Julian 220 4.0% 679 12.3% 402 7.3% 1,052 19.1% 1,680 30.5% 1,484 26.9%Pauma 754 10.7% 1,121 15.9% 937 13.3% 1,930 27.3% 1,554 22.0% 771 10.9%Poway 6,152 6.9% 12,506 14.0% 10,535 11.8% 21,940 24.5% 25,760 28.8% 12,580 14.1%Ramona 1,920 5.3% 5,187 14.3% 4,741 13.0% 8,332 22.9% 11,845 32.6% 4,363 12.0%San Marcos 6,449 6.8% 13,482 14.1% 12,204 12.8% 26,783 28.1% 23,372 24.5% 13,162 13.8%Valley Center 1,237 5.3% 2,888 12.5% 2,527 10.9% 4,578 19.8% 7,843 33.9% 4,069 17.6%
South Region 33,712 6.8% 69,352 14.0% 81,996 16.6% 138,083 27.9% 114,695 23.2% 56,723 11.5%Chula Vista 8,188 7.0% 15,774 13.5% 18,134 15.5% 31,869 27.2% 27,306 23.3% 15,953 13.6%Coronado 1,075 4.4% 2,524 10.3% 4,625 18.9% 5,971 24.4% 5,953 24.4% 4,299 17.6%National City 3,888 6.5% 7,607 12.8% 11,335 19.0% 17,115 28.7% 13,244 22.2% 6,442 10.8%South Bay 11,148 7.6% 20,923 14.2% 25,541 17.3% 41,058 27.9% 33,251 22.6% 15,304 10.4%Sweetwater 9,413 6.4% 22,524 15.4% 22,361 15.3% 42,070 28.8% 34,941 23.9% 14,725 10.1%
San Diego County 210,874 6.5% 394,489 12.2% 489,299 15.2% 939,172 29.1% 791,588 24.6% 397,674 12.3%
Age
Geography 0-4 5-14 15-24 65+ 45-64 25-44
33,290 30,900 35,720 36,117 41,135 33,712 210,874
56,008 61,892 63,046 64,865 79,326 69,352 394,489
83,472 69,168 96,52281,463 76,678 81,996 489,299
171,907127,350 199,826 145,035 156,971
138,083 939,172
110,995129,023 150,208 129,561 157,106
114,695 791,588
48,173 64,439 80,011 67,736 80,592 56,723 397,674
CentralRegion
East Region North CentralRegion
North CoastalRegion
North InlandRegion
South Region San DiegoCounty
Population by Age Group and HHSA Region, 20150-4 5-14 15-24 25-44 45-64 65+
Source: U.S. Census Bureau; 2011-2015 American Community Survey 5-Year Estimates, Table B01001. Prepared by: County of San Diego, Health and Human Services Agency, Public Health Services, Community Health Statistics Unit, 2017.
6.6%
6.4%
5.7%
6.9%
7.0%
6.8%
6.5%
11.1%
12.8%
10.1%
12.4%
13.4%
14.0%
12.2%
16.6%
14.3%
15.4%
15.5%
13.0%
16.6%
15.2%
34.1%
26.4%
32.0%
27.6%
26.5%
27.9%
29.1%
22.0%
26.7%
24.0%
24.7%
26.5%
23.2%
24.6%
9.6%
13.3%
12.8%
12.9%
13.6%
11.5%
12.3%
Central Region
East Region
North CentralRegion
North CoastalRegion
North InlandRegion
South Region
San Diego County
Percent of Population by Age Group and HHSA Region, 20150-4 5-14 15-24 25-44 45-64 65+
Source: U.S. Census Bureau; 2011-2015 American Community Survey 5-Year Estimates, Table B01001. Prepared by: County of San Diego, Health and Human Services Agency, Public Health Services, Community Health Statistics Unit, 2017.
Page 2
Source: U.S. Census Bureau; 2011-2015 American Community Survey 5-Year Estimates, Table B01001.
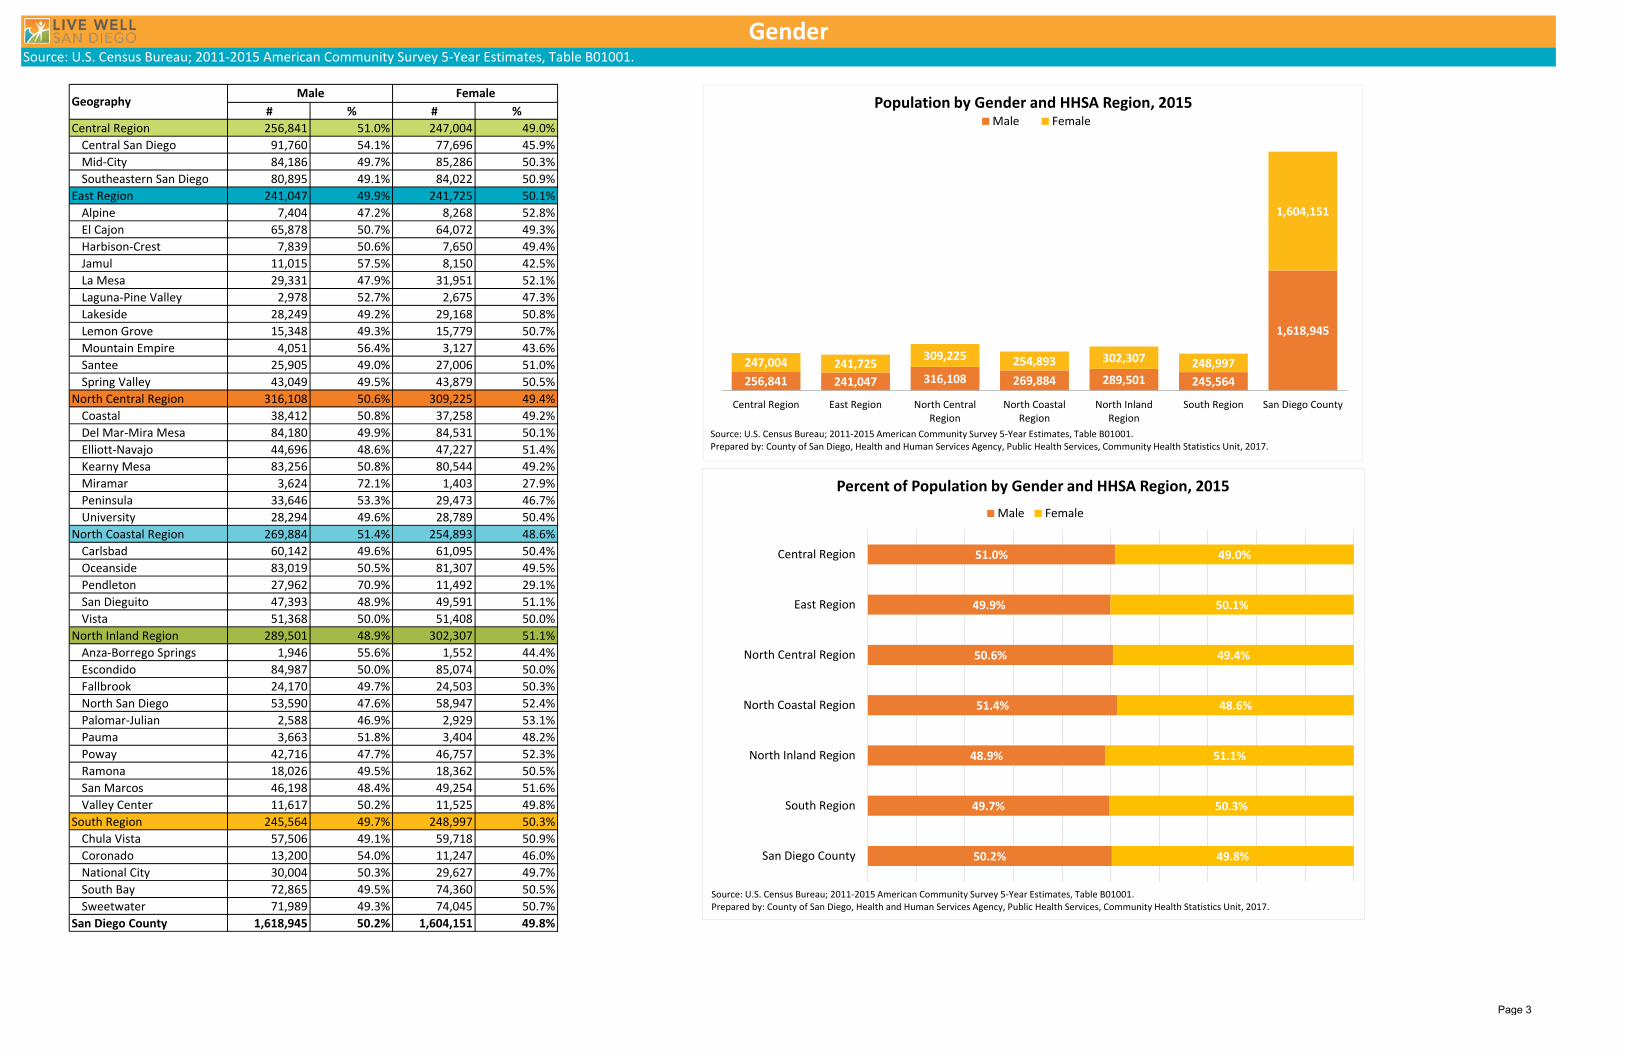
# % # %Central Region 256,841 51.0% 247,004 49.0%
Central San Diego 91,760 54.1% 77,696 45.9%Mid-City 84,186 49.7% 85,286 50.3%Southeastern San Diego 80,895 49.1% 84,022 50.9%
East Region 241,047 49.9% 241,725 50.1%Alpine 7,404 47.2% 8,268 52.8%El Cajon 65,878 50.7% 64,072 49.3%Harbison-Crest 7,839 50.6% 7,650 49.4%Jamul 11,015 57.5% 8,150 42.5%La Mesa 29,331 47.9% 31,951 52.1%Laguna-Pine Valley 2,978 52.7% 2,675 47.3%Lakeside 28,249 49.2% 29,168 50.8%Lemon Grove 15,348 49.3% 15,779 50.7%Mountain Empire 4,051 56.4% 3,127 43.6%Santee 25,905 49.0% 27,006 51.0%Spring Valley 43,049 49.5% 43,879 50.5%
North Central Region 316,108 50.6% 309,225 49.4%Coastal 38,412 50.8% 37,258 49.2%Del Mar-Mira Mesa 84,180 49.9% 84,531 50.1%Elliott-Navajo 44,696 48.6% 47,227 51.4%Kearny Mesa 83,256 50.8% 80,544 49.2%Miramar 3,624 72.1% 1,403 27.9%Peninsula 33,646 53.3% 29,473 46.7%University 28,294 49.6% 28,789 50.4%
North Coastal Region 269,884 51.4% 254,893 48.6%Carlsbad 60,142 49.6% 61,095 50.4%Oceanside 83,019 50.5% 81,307 49.5%Pendleton 27,962 70.9% 11,492 29.1%San Dieguito 47,393 48.9% 49,591 51.1%Vista 51,368 50.0% 51,408 50.0%
North Inland Region 289,501 48.9% 302,307 51.1%Anza-Borrego Springs 1,946 55.6% 1,552 44.4%Escondido 84,987 50.0% 85,074 50.0%Fallbrook 24,170 49.7% 24,503 50.3%North San Diego 53,590 47.6% 58,947 52.4%Palomar-Julian 2,588 46.9% 2,929 53.1%Pauma 3,663 51.8% 3,404 48.2%Poway 42,716 47.7% 46,757 52.3%Ramona 18,026 49.5% 18,362 50.5%San Marcos 46,198 48.4% 49,254 51.6%Valley Center 11,617 50.2% 11,525 49.8%
South Region 245,564 49.7% 248,997 50.3%Chula Vista 57,506 49.1% 59,718 50.9%Coronado 13,200 54.0% 11,247 46.0%National City 30,004 50.3% 29,627 49.7%South Bay 72,865 49.5% 74,360 50.5%Sweetwater 71,989 49.3% 74,045 50.7%
San Diego County 1,618,945 50.2% 1,604,151 49.8%
Gender
Male FemaleGeography
51.0%
49.9%
50.6%
51.4%
48.9%
49.7%
50.2%
49.0%
50.1%
49.4%
48.6%
51.1%
50.3%
49.8%
Central Region
East Region
North Central Region
North Coastal Region
North Inland Region
South Region
San Diego County
Percent of Population by Gender and HHSA Region, 2015Male Female
Source: U.S. Census Bureau; 2011-2015 American Community Survey 5-Year Estimates, Table B01001. Prepared by: County of San Diego, Health and Human Services Agency, Public Health Services, Community Health Statistics Unit, 2017.
256,841 241,047 316,108 269,884 289,501 245,564
1,618,945
247,004 241,725 309,225 254,893 302,307 248,997
1,604,151
Central Region East Region North CentralRegion
North CoastalRegion
North InlandRegion
South Region San Diego County
Population by Gender and HHSA Region, 2015Male Female
Source: U.S. Census Bureau; 2011-2015 American Community Survey 5-Year Estimates, Table B01001. Prepared by: County of San Diego, Health and Human Services Agency, Public Health Services, Community Health Statistics Unit, 2017.
Page 3

Source: U.S. Census Bureau; 2011-2015 American Community Survey 5-Year Estimates, Table B03002.
# % # % # % # % # %Central Region 216,273 42.9% 148,608 29.5% 56,729 11.3% 67,032 13.3% 15,203 3.0%
Central San Diego 59,612 35.2% 84,621 49.9% 10,819 6.4% 9,076 5.4% 5,328 3.1%Mid-City 70,231 41.4% 47,707 28.2% 22,114 13.0% 24,643 14.5% 4,777 2.8%Southeastern San Diego 86,430 52.4% 16,280 9.9% 23,796 14.4% 33,313 20.2% 5,098 3.1%
East Region 133,643 27.7% 276,751 57.3% 25,568 5.3% 24,026 5.0% 22,784 4.7%Alpine 2,532 16.2% 12,322 78.6% 191 1.2% 212 1.4% 415 2.6%El Cajon 37,166 28.6% 73,738 56.7% 6,723 5.2% 5,781 4.4% 6,542 5.0%Harbison-Crest 2,327 15.0% 12,183 78.7% 64 0.4% 224 1.4% 691 4.5%Jamul 6,213 32.4% 9,640 50.3% 1,255 6.5% 1,281 6.7% 776 4.0%La Mesa 15,747 25.7% 34,806 56.8% 3,906 6.4% 3,454 5.6% 3,369 5.5%Laguna-Pine Valley 791 14.0% 4,350 77.0% 73 1.3% 89 1.6% 350 6.2%Lakeside 11,381 19.8% 40,873 71.2% 1,122 2.0% 1,734 3.0% 2,307 4.0%Lemon Grove 13,724 44.1% 9,547 30.7% 3,992 12.8% 2,561 8.2% 1,303 4.2%Mountain Empire 2,788 38.8% 3,423 47.7% 177 2.5% 166 2.3% 624 8.7%Santee 8,886 16.8% 38,421 72.6% 774 1.5% 2,364 4.5% 2,466 4.7%Spring Valley 32,088 36.9% 37,448 43.1% 7,291 8.4% 6,160 7.1% 3,941 4.5%
North Central Region 96,885 15.5% 361,300 57.8% 21,485 3.4% 119,257 19.1% 26,406 4.2%Coastal 7,789 10.3% 62,219 82.2% 491 0.6% 3,273 4.3% 1,898 2.5%Del Mar-Mira Mesa 18,518 11.0% 74,481 44.1% 4,942 2.9% 62,724 37.2% 8,046 4.8%Elliott-Navajo 14,970 16.3% 59,178 64.4% 4,917 5.3% 9,068 9.9% 3,790 4.1%Kearny Mesa 38,089 23.3% 86,792 53.0% 7,324 4.5% 23,636 14.4% 7,959 4.9%Miramar 1,184 23.6% 3,053 60.7% 415 8.3% 173 3.4% 202 4.0%Peninsula 10,184 16.1% 45,758 72.5% 2,024 3.2% 2,984 4.7% 2,169 3.4%University 6,151 10.8% 29,819 52.2% 1,372 2.4% 17,399 30.5% 2,342 4.1%
North Coastal Region 147,981 28.2% 310,125 59.1% 17,010 3.2% 33,398 6.4% 16,263 3.1%Carlsbad 18,703 15.4% 87,875 72.5% 1,235 1.0% 9,720 8.0% 3,704 3.1%Oceanside 60,234 36.7% 76,779 46.7% 8,271 5.0% 12,815 7.8% 6,227 3.8%Pendleton 9,087 23.0% 23,885 60.5% 3,685 9.3% 1,158 2.9% 1,639 4.2%San Dieguito 12,074 12.4% 76,502 78.9% 810 0.8% 5,079 5.2% 2,519 2.6%Vista 47,883 46.6% 45,084 43.9% 3,009 2.9% 4,626 4.5% 2,174 2.1%
North Inland Region 167,709 28.3% 321,331 54.3% 11,606 2.0% 68,044 11.5% 23,118 3.9%Anza-Borrego Springs 844 24.1% 2,343 67.0% 116 3.3% 121 3.5% 74 2.1%Escondido 75,824 44.6% 75,520 44.4% 3,533 2.1% 11,083 6.5% 4,101 2.4%Fallbrook 16,450 33.8% 28,273 58.1% 869 1.8% 1,579 3.2% 1,502 3.1%North San Diego 12,554 11.2% 61,935 55.0% 2,479 2.2% 29,228 26.0% 6,341 5.6%Palomar-Julian 735 13.3% 3,932 71.3% 35 0.6% 159 2.9% 656 11.9%Pauma 1,858 26.3% 3,754 53.1% 77 1.1% 410 5.8% 968 13.7%Poway 11,910 13.3% 56,957 63.7% 1,423 1.6% 15,395 17.2% 3,788 4.2%Ramona 8,378 23.0% 25,589 70.3% 661 1.8% 589 1.6% 1,171 3.2%San Marcos 34,764 36.4% 47,142 49.4% 2,324 2.4% 8,392 8.8% 2,830 3.0%Valley Center 4,392 19.0% 15,886 68.6% 89 0.4% 1,088 4.7% 1,687 7.3%
South Region 298,504 60.4% 97,201 19.7% 20,626 4.2% 64,194 13.0% 14,036 2.8%Chula Vista 86,218 73.5% 19,784 16.9% 3,482 3.0% 5,959 5.1% 1,781 1.5%Coronado 3,551 14.5% 18,509 75.7% 809 3.3% 796 3.3% 782 3.2%National City 37,809 63.4% 6,159 10.3% 2,663 4.5% 11,960 20.1% 1,040 1.7%South Bay 103,387 70.2% 20,242 13.7% 5,500 3.7% 14,317 9.7% 3,779 2.6%Sweetwater 67,539 46.2% 32,507 22.3% 8,172 5.6% 31,162 21.3% 6,654 4.6% *API refers to Asian/ Pacific Islanders and include Asian, Pacific Islander, and Native Hawaiian. Other includes American Indian
San Diego County 1,060,995 32.9% 1,515,316 47.0% 153,024 4.7% 375,951 11.7% 117,810 3.7% or Alaska Native, 2 or more races, and other.
Race/Ethnicity
OtherAPI*BlackWhiteHispanicGeography
42.9%
27.7%
15.5%
28.2%
28.3%
60.4%
32.9%
29.5%
57.3%
57.8%
59.1%
54.3%
19.7%
47.0%
11.3%
5.3%
3.4%
3.2%
2.0%
4.2%
4.7%
13.3%
5.0%
19.1%
6.4%
11.5%
13.0%
11.7%
3.0%
4.7%
4.2%
3.1%
3.9%
2.8%
3.7%
Central Region
East Region
North Central Region
North Coastal Region
North Inland Region
South Region
San Diego County
Percent of Population by Race/Ethnicity and HHSA Region, 2015 Hispanic White Black API* Other
*API refers to Asian/ Pacific Islanders and include Asian, Pacific Islander, and Native Hawaiian. Other includes American Indian or Alaska Native, 2or more races, and other.
Source: U.S. Census Bureau; 2011-2015 American Community Survey 5-Year Estimates, Table B03002. Prepared by: County of San Diego, Health and Human Services Agency, Public Health Services, Community Health Statistics Unit, 2017.
216,273
133,64396,885
147,981 167,709
298,504
1,060,995
148,608 276,751
361,300
310,125 321,331
97,201
1,515,316
56,729
25,568
21,485
17,01011,606 20,626 153,024
67,032 24,026119,257
33,39868,044 64,194 375,951
15,203 22,784 26,406 16,263 23,118 14,036 117,810
Central Region East Region North CentralRegion
North CoastalRegion
North InlandRegion
South Region San Diego County
Population by Race/Ethnicity and HHSA Region, 2015 Hispanic White Black API* Other
*API refers to Asian/ Pacific Islanders and include Asian, Pacific Islander, and Native Hawaiian. Other includes American Indian or Alaska Native, 2or more races, and other.
Source: U.S. Census Bureau; 2011-2015 American Community Survey 5-Year Estimates, Table B03002. Prepared by: County of San Diego, Health and Human Services Agency, Public Health Services, Community Health Statistics Unit, 2017.
Page 4

Source: U.S. Census Bureau; 2011-2015 American Community Survey 5-Year Estimates, Table B02015, B02016.
Geography Asian Indian
Bangladeshi Burmese CambodianChinese; except
TaiwaneseFilipino Hmong Indonesian Japanese Korean Laotian Malaysian Melanesian Micronesian Pakistani Polynesian Sri Lankan Taiwanese Thai Vietnamese
Other Asian/Pacific
Islander
Other Asian/Pacific Islander; not
specifiedCentral Region 973 36 787 2,808 5,191 32,426 336 45 1,498 1,456 3,400 0 228 1,093 90 694 36 294 659 14,456 1,822 55
Central San Diego 529 0 35 235 2,102 2,936 29 0 620 686 154 0 14 100 20 310 0 175 226 804 494 0Mid-City 358 36 752 2,091 2,676 2,874 285 45 464 598 1,035 0 80 70 0 88 36 96 264 12,323 719 22Southeastern San Diego 86 0 0 482 413 26,616 22 0 414 172 2,211 0 134 923 70 296 0 23 169 1,329 609 33
East Region 815 0 317 833 1,978 10,853 117 71 1,128 852 323 18 80 1,295 110 1,824 0 39 261 2,814 738 336Alpine 45 0 0 0 54 70 0 0 0 10 0 0 0 24 0 0 0 0 0 0 9 0El Cajon 194 0 305 203 360 2,063 0 13 185 161 60 15 0 477 36 790 0 0 0 749 175 162Harbison-Crest 0 0 0 0 22 122 0 0 20 11 10 0 0 0 0 46 0 0 0 1 0 0Jamul 208 0 0 7 60 725 0 0 47 97 47 0 0 7 0 23 0 0 5 90 59 0La Mesa 47 0 0 410 547 1,089 0 0 189 217 36 0 0 101 0 126 0 14 97 539 160 48Laguna-Pine Valley 0 0 0 0 5 30 0 0 0 0 40 0 0 0 0 7 0 0 0 7 0 0Lakeside 160 0 0 33 85 715 0 0 57 79 10 0 12 136 62 174 0 6 38 128 34 17Lemon Grove 47 0 0 22 229 786 117 22 125 4 79 0 0 91 0 113 0 17 8 956 16 0Mountain Empire 0 0 12 0 4 44 0 0 5 9 0 0 0 8 0 48 0 0 11 0 25 0Santee 37 0 0 0 274 1,516 0 32 175 61 29 3 0 84 9 140 0 0 49 37 42 30Spring Valley 77 0 0 158 338 3,693 0 4 325 203 12 0 68 367 3 357 0 2 53 307 218 79
North Central Region 14,191 301 174 579 25,551 31,863 1,125 437 5,111 8,527 1,831 53 86 1,415 725 1,030 128 2,074 960 19,458 4,911 45Coastal 311 0 0 16 756 1,028 0 13 298 400 0 0 0 61 14 25 7 116 35 155 130 0Del Mar-Mira Mesa 7,757 27 138 175 12,663 19,768 754 190 1,354 3,986 804 22 61 636 422 160 104 955 327 10,350 2,580 0Elliott-Navajo 614 0 0 114 1,199 2,878 0 73 690 581 58 8 0 325 55 245 0 108 200 1,544 556 5Kearny Mesa 1,532 274 0 220 3,621 5,727 333 11 1,359 1,439 916 9 25 353 201 382 0 180 253 6,149 1,102 20Miramar 0 0 0 0 32 30 8 0 30 0 0 0 0 8 0 5 0 0 0 33 28 0Peninsula 159 0 0 17 436 1,230 2 12 324 183 16 14 0 32 0 171 0 76 76 160 108 0University 3,818 0 36 37 6,844 1,202 28 138 1,056 1,938 37 0 0 0 33 42 17 639 69 1,067 407 20
North Coastal Region 3,990 0 151 738 4,556 10,890 39 62 3,860 2,359 53 58 244 347 417 1,747 92 427 382 3,165 792 26Carlsbad 1,886 0 0 136 1,391 1,880 0 53 1,258 782 0 16 0 26 287 54 76 281 123 1,204 439 0Oceanside 681 0 151 404 1,009 6,021 0 9 1,173 625 53 0 141 263 23 1,390 0 118 142 901 116 7Pendleton 63 0 0 197 44 369 39 0 188 107 0 0 31 18 0 81 0 0 35 77 8 0San Dieguito 801 0 0 0 1,445 739 0 0 938 615 0 0 71 13 107 13 0 28 42 232 156 0Vista 559 0 0 1 667 1,881 0 0 303 230 0 42 1 27 0 209 16 0 40 751 73 19
North Inland Region 10,200 43 260 109 12,510 22,390 113 382 3,701 4,250 550 12 0 425 277 1,160 70 452 377 9,491 2,239 146Anza-Borrego Springs 0 0 0 0 0 89 0 0 32 0 0 0 0 0 0 0 0 0 0 0 0 0Escondido 716 0 95 5 1,548 4,697 11 15 583 364 361 0 0 169 7 157 26 58 76 2,207 411 29Fallbrook 22 0 0 0 304 564 0 0 271 67 0 0 0 27 0 0 0 0 52 230 34 8North San Diego 6,175 30 137 0 6,037 9,501 12 252 1,112 2,280 23 0 0 179 131 129 24 135 160 2,520 731 14Palomar-Julian 5 0 0 0 28 24 0 0 29 34 0 0 0 0 0 0 0 0 6 21 12 0Pauma 4 0 0 0 2 37 51 0 1 23 0 0 0 0 0 259 0 0 0 0 33 0Poway 2,862 0 4 73 3,567 4,073 39 77 893 981 0 12 0 33 23 26 0 137 27 2,088 598 33Ramona 33 0 10 0 18 118 0 0 22 210 0 0 0 2 0 110 0 0 0 55 19 0San Marcos 353 13 14 31 937 2,978 0 25 682 252 164 0 0 15 116 356 20 122 56 2,158 174 46Valley Center 30 0 0 0 69 309 0 13 76 39 2 0 0 0 0 123 0 0 0 212 227 16
South Region 1,023 203 0 385 3,372 49,196 130 30 2,787 3,059 362 9 10 831 33 980 113 307 218 1,184 1,605 201Chula Vista 12 0 0 8 433 4,242 130 20 441 133 45 9 0 105 8 108 60 45 7 126 220 4Coronado 33 0 0 0 179 283 0 0 72 65 0 0 10 23 0 28 30 0 0 41 37 0National City 172 0 0 87 353 10,469 0 0 199 27 146 0 0 76 25 191 0 29 16 117 187 0South Bay 75 0 0 61 750 11,866 0 0 384 224 110 0 0 175 0 228 0 118 114 391 219 197Sweetwater 731 203 0 229 1,657 22,336 0 10 1,691 2,610 61 0 0 452 0 425 23 115 81 509 942 0
San Diego County 31,192 583 1,689 5,452 53,158 157,618 1,860 1,027 18,085 20,503 6,519 150 648 5,406 1,652 7,435 439 3,593 2,857 50,568 12,107 809
Asian/Pacific Islander (API) Population: Number
Page 5

Source: U.S. Census Bureau; 2011-2015 American Community Survey 5-Year Estimates, Table B02015, B02016.
Geography Asian Indian
Bangladeshi Burmese CambodianChinese; except
TaiwaneseFilipino Hmong Indonesian Japanese Korean Laotian Malaysian Melanesian Micronesian Pakistani Polynesian
Sri Lankan
Taiwanese Thai VietnameseOther
Asian/Pacific Islander
Other Asian/Pacific Islander; not
specifiedCentral Region 1.42% 0.05% 1.15% 4.11% 7.59% 47.42% 0.49% 0.07% 2.19% 2.13% 4.97% 0.00% 0.33% 1.60% 0.13% 1.01% 0.05% 0.43% 0.96% 21.14% 2.66% 0.08%
Central San Diego 5.59% 0.00% 0.37% 2.48% 22.20% 31.01% 0.31% 0.00% 6.55% 7.24% 1.63% 0.00% 0.15% 1.06% 0.21% 3.27% 0.00% 1.85% 2.39% 8.49% 5.22% 0.00%Mid-City 1.44% 0.14% 3.02% 8.39% 10.74% 11.54% 1.14% 0.18% 1.86% 2.40% 4.15% 0.00% 0.32% 0.28% 0.00% 0.35% 0.14% 0.39% 1.06% 49.47% 2.89% 0.09%Southeastern San Diego 0.25% 0.00% 0.00% 1.42% 1.21% 78.28% 0.06% 0.00% 1.22% 0.51% 6.50% 0.00% 0.39% 2.71% 0.21% 0.87% 0.00% 0.07% 0.50% 3.91% 1.79% 0.10%
East Region 3.29% 0.00% 1.28% 3.36% 7.98% 43.76% 0.47% 0.29% 4.55% 3.44% 1.30% 0.07% 0.32% 5.22% 0.44% 7.35% 0.00% 0.16% 1.05% 11.35% 2.98% 1.35%Alpine 21.23% 0.00% 0.00% 0.00% 25.47% 33.02% 0.00% 0.00% 0.00% 4.72% 0.00% 0.00% 0.00% 11.32% 0.00% 0.00% 0.00% 0.00% 0.00% 0.00% 4.25% 0.00%El Cajon 3.26% 0.00% 5.13% 3.41% 6.05% 34.68% 0.00% 0.22% 3.11% 2.71% 1.01% 0.25% 0.00% 8.02% 0.61% 13.28% 0.00% 0.00% 0.00% 12.59% 2.94% 2.72%Harbison-Crest 0.00% 0.00% 0.00% 0.00% 9.48% 52.59% 0.00% 0.00% 8.62% 4.74% 4.31% 0.00% 0.00% 0.00% 0.00% 19.83% 0.00% 0.00% 0.00% 0.43% 0.00% 0.00%Jamul 15.13% 0.00% 0.00% 0.51% 4.36% 52.73% 0.00% 0.00% 3.42% 7.05% 3.42% 0.00% 0.00% 0.51% 0.00% 1.67% 0.00% 0.00% 0.36% 6.55% 4.29% 0.00%La Mesa 1.30% 0.00% 0.00% 11.33% 15.11% 30.08% 0.00% 0.00% 5.22% 5.99% 0.99% 0.00% 0.00% 2.79% 0.00% 3.48% 0.00% 0.39% 2.68% 14.89% 4.42% 1.33%Laguna-Pine Valley 0.00% 0.00% 0.00% 0.00% 5.62% 33.71% 0.00% 0.00% 0.00% 0.00% 44.94% 0.00% 0.00% 0.00% 0.00% 7.87% 0.00% 0.00% 0.00% 7.87% 0.00% 0.00%Lakeside 9.16% 0.00% 0.00% 1.89% 4.87% 40.95% 0.00% 0.00% 3.26% 4.52% 0.57% 0.00% 0.69% 7.79% 3.55% 9.97% 0.00% 0.34% 2.18% 7.33% 1.95% 0.97%Lemon Grove 1.79% 0.00% 0.00% 0.84% 8.70% 29.86% 4.45% 0.84% 4.75% 0.15% 3.00% 0.00% 0.00% 3.46% 0.00% 4.29% 0.00% 0.65% 0.30% 36.32% 0.61% 0.00%Mountain Empire 0.00% 0.00% 7.23% 0.00% 2.41% 26.51% 0.00% 0.00% 3.01% 5.42% 0.00% 0.00% 0.00% 4.82% 0.00% 28.92% 0.00% 0.00% 6.63% 0.00% 15.06% 0.00%Santee 1.47% 0.00% 0.00% 0.00% 10.88% 60.21% 0.00% 1.27% 6.95% 2.42% 1.15% 0.12% 0.00% 3.34% 0.36% 5.56% 0.00% 0.00% 1.95% 1.47% 1.67% 1.19%Spring Valley 1.23% 0.00% 0.00% 2.52% 5.40% 58.96% 0.00% 0.06% 5.19% 3.24% 0.19% 0.00% 1.09% 5.86% 0.05% 5.70% 0.00% 0.03% 0.85% 4.90% 3.48% 1.26%
North Central Region 11.77% 0.25% 0.14% 0.48% 21.19% 26.43% 0.93% 0.36% 4.24% 7.07% 1.52% 0.04% 0.07% 1.17% 0.60% 0.85% 0.11% 1.72% 0.80% 16.14% 4.07% 0.04%Coastal 9.24% 0.00% 0.00% 0.48% 22.47% 30.55% 0.00% 0.39% 8.86% 11.89% 0.00% 0.00% 0.00% 1.81% 0.42% 0.74% 0.21% 3.45% 1.04% 4.61% 3.86% 0.00%Del Mar-Mira Mesa 12.27% 0.04% 0.22% 0.28% 20.03% 31.26% 1.19% 0.30% 2.14% 6.30% 1.27% 0.03% 0.10% 1.01% 0.67% 0.25% 0.16% 1.51% 0.52% 16.37% 4.08% 0.00%Elliott-Navajo 6.64% 0.00% 0.00% 1.23% 12.96% 31.10% 0.00% 0.79% 7.46% 6.28% 0.63% 0.09% 0.00% 3.51% 0.59% 2.65% 0.00% 1.17% 2.16% 16.69% 6.01% 0.05%Kearny Mesa 6.36% 1.14% 0.00% 0.91% 15.02% 23.76% 1.38% 0.05% 5.64% 5.97% 3.80% 0.04% 0.10% 1.46% 0.83% 1.58% 0.00% 0.75% 1.05% 25.51% 4.57% 0.08%Miramar 0.00% 0.00% 0.00% 0.00% 18.39% 17.24% 4.60% 0.00% 17.24% 0.00% 0.00% 0.00% 0.00% 4.60% 0.00% 2.87% 0.00% 0.00% 0.00% 18.97% 16.09% 0.00%Peninsula 5.27% 0.00% 0.00% 0.56% 14.46% 40.78% 0.07% 0.40% 10.74% 6.07% 0.53% 0.46% 0.00% 1.06% 0.00% 5.67% 0.00% 2.52% 2.52% 5.31% 3.58% 0.00%University 21.91% 0.00% 0.21% 0.21% 39.27% 6.90% 0.16% 0.79% 6.06% 11.12% 0.21% 0.00% 0.00% 0.00% 0.19% 0.24% 0.10% 3.67% 0.40% 6.12% 2.34% 0.11%
North Coastal Region 11.60% 0.00% 0.44% 2.15% 13.25% 31.66% 0.11% 0.18% 11.22% 6.86% 0.15% 0.17% 0.71% 1.01% 1.21% 5.08% 0.27% 1.24% 1.11% 9.20% 2.30% 0.08%Carlsbad 19.07% 0.00% 0.00% 1.37% 14.06% 19.01% 0.00% 0.54% 12.72% 7.91% 0.00% 0.16% 0.00% 0.26% 2.90% 0.55% 0.77% 2.84% 1.24% 12.17% 4.44% 0.00%Oceanside 5.15% 0.00% 1.14% 3.05% 7.63% 45.52% 0.00% 0.07% 8.87% 4.73% 0.40% 0.00% 1.07% 1.99% 0.17% 10.51% 0.00% 0.89% 1.07% 6.81% 0.88% 0.05%Pendleton 5.01% 0.00% 0.00% 15.67% 3.50% 29.36% 3.10% 0.00% 14.96% 8.51% 0.00% 0.00% 2.47% 1.43% 0.00% 6.44% 0.00% 0.00% 2.78% 6.13% 0.64% 0.00%San Dieguito 15.40% 0.00% 0.00% 0.00% 27.79% 14.21% 0.00% 0.00% 18.04% 11.83% 0.00% 0.00% 1.37% 0.25% 2.06% 0.25% 0.00% 0.54% 0.81% 4.46% 3.00% 0.00%Vista 11.60% 0.00% 0.00% 0.02% 13.84% 39.03% 0.00% 0.00% 6.29% 4.77% 0.00% 0.87% 0.02% 0.56% 0.00% 4.34% 0.33% 0.00% 0.83% 15.58% 1.51% 0.39%
North Inland Region 14.75% 0.06% 0.38% 0.16% 18.09% 32.38% 0.16% 0.55% 5.35% 6.15% 0.80% 0.02% 0.00% 0.61% 0.40% 1.68% 0.10% 0.65% 0.55% 13.72% 3.24% 0.21%Anza-Borrego Springs 0.00% 0.00% 0.00% 0.00% 0.00% 73.55% 0.00% 0.00% 26.45% 0.00% 0.00% 0.00% 0.00% 0.00% 0.00% 0.00% 0.00% 0.00% 0.00% 0.00% 0.00% 0.00%Escondido 6.21% 0.00% 0.82% 0.04% 13.42% 40.72% 0.10% 0.13% 5.05% 3.16% 3.13% 0.00% 0.00% 1.47% 0.06% 1.36% 0.23% 0.50% 0.66% 19.13% 3.56% 0.25%Fallbrook 1.39% 0.00% 0.00% 0.00% 19.25% 35.72% 0.00% 0.00% 17.16% 4.24% 0.00% 0.00% 0.00% 1.71% 0.00% 0.00% 0.00% 0.00% 3.29% 14.57% 2.15% 0.51%North San Diego 20.87% 0.10% 0.46% 0.00% 20.41% 32.12% 0.04% 0.85% 3.76% 7.71% 0.08% 0.00% 0.00% 0.61% 0.44% 0.44% 0.08% 0.46% 0.54% 8.52% 2.47% 0.05%Palomar-Julian 3.14% 0.00% 0.00% 0.00% 17.61% 15.09% 0.00% 0.00% 18.24% 21.38% 0.00% 0.00% 0.00% 0.00% 0.00% 0.00% 0.00% 0.00% 3.77% 13.21% 7.55% 0.00%Pauma 0.98% 0.00% 0.00% 0.00% 0.49% 9.02% 12.44% 0.00% 0.24% 5.61% 0.00% 0.00% 0.00% 0.00% 0.00% 63.17% 0.00% 0.00% 0.00% 0.00% 8.05% 0.00%Poway 18.41% 0.00% 0.03% 0.47% 22.94% 26.20% 0.25% 0.50% 5.74% 6.31% 0.00% 0.08% 0.00% 0.21% 0.15% 0.17% 0.00% 0.88% 0.17% 13.43% 3.85% 0.21%Ramona 5.53% 0.00% 1.68% 0.00% 3.02% 19.77% 0.00% 0.00% 3.69% 35.18% 0.00% 0.00% 0.00% 0.34% 0.00% 18.43% 0.00% 0.00% 0.00% 9.21% 3.18% 0.00%San Marcos 4.15% 0.15% 0.16% 0.36% 11.01% 34.99% 0.00% 0.29% 8.01% 2.96% 1.93% 0.00% 0.00% 0.18% 1.36% 4.18% 0.23% 1.43% 0.66% 25.35% 2.04% 0.54%Valley Center 2.69% 0.00% 0.00% 0.00% 6.18% 27.69% 0.00% 1.16% 6.81% 3.49% 0.18% 0.00% 0.00% 0.00% 0.00% 11.02% 0.00% 0.00% 0.00% 19.00% 20.34% 1.43%
South Region 1.55% 0.31% 0.00% 0.58% 5.11% 74.50% 0.20% 0.05% 4.22% 4.63% 0.55% 0.01% 0.02% 1.26% 0.05% 1.48% 0.17% 0.46% 0.33% 1.79% 2.43% 0.30%Chula Vista 0.19% 0.00% 0.00% 0.13% 7.03% 68.91% 2.11% 0.32% 7.16% 2.16% 0.73% 0.15% 0.00% 1.71% 0.13% 1.75% 0.97% 0.73% 0.11% 2.05% 3.57% 0.06%Coronado 4.12% 0.00% 0.00% 0.00% 22.35% 35.33% 0.00% 0.00% 8.99% 8.11% 0.00% 0.00% 1.25% 2.87% 0.00% 3.50% 3.75% 0.00% 0.00% 5.12% 4.62% 0.00%National City 1.42% 0.00% 0.00% 0.72% 2.92% 86.56% 0.00% 0.00% 1.65% 0.22% 1.21% 0.00% 0.00% 0.63% 0.21% 1.58% 0.00% 0.24% 0.13% 0.97% 1.55% 0.00%South Bay 0.50% 0.00% 0.00% 0.41% 5.03% 79.57% 0.00% 0.00% 2.58% 1.50% 0.74% 0.00% 0.00% 1.17% 0.00% 1.53% 0.00% 0.79% 0.76% 2.62% 1.47% 1.32%Sweetwater 2.28% 0.63% 0.00% 0.71% 5.17% 69.64% 0.00% 0.03% 5.27% 8.14% 0.19% 0.00% 0.00% 1.41% 0.00% 1.33% 0.07% 0.36% 0.25% 1.59% 2.94% 0.00%
San Diego County 8.14% 0.15% 0.44% 1.42% 13.87% 41.12% 0.49% 0.27% 4.72% 5.35% 1.70% 0.04% 0.17% 1.41% 0.43% 1.94% 0.11% 0.94% 0.75% 13.19% 3.16% 0.21%
Asian/Pacific Islander (API) Population: Percent of API Population
Page 6

Source: U.S. Census Bureau; 2011-2015 American Community Survey 5-Year Estimates, Table B02015, B02016. Asian/Pacific Islander (API) Distribution: Percent of API Population
0% 10% 20% 30% 40% 50% 60% 70% 80% 90% 100%
Central Region
East Region
North CentralRegion
North CoastalRegion
North InlandRegion
South Region
San DiegoCounty
Asian/Pacific Islander (API) Distribution: Percent of API Population by HHSA Region, 2015 Asian Indian
Bangladeshi
Cambodian
Chinese; except Taiwanese
Filipino
Hmong
Indonesian
Japanese
Korean
Laotian
Malaysian
Melanesian
Micronesian
Pakistani
Polynesian
Sri Lankan
Taiwanese
Thai
Vietnamese
Other Asian/Pacific Islander
Other Asian/Pacific Islander; notspecified
Source: U.S. Census Bureau, 2011-2015 American Community Survey 5-Year Estimates, Table B02015., B02016.Prepared by: County of San Diego, Health and Human Services Agency, Public Health Services, Community Health Statistics Unit, 2017.
Page 7

Source: U.S. Census Bureau; 2011-2015 American Community Survey 5-Year Estimates, Table B02015, B02016.
Geography Asian Indian
Bangladeshi Burmese CambodianChinese; except
TaiwaneseFilipino Hmong Indonesian Japanese Korean Laotian Malaysian Melanesian Micronesian Pakistani Polynesian
Sri Lankan
Taiwanese Thai VietnameseOther
Asian/Pacific Islander
Other Asian/Pacific Islander; not
specifiedCentral Region 0.19% 0.01% 0.16% 0.56% 1.03% 6.44% 0.07% 0.01% 0.30% 0.29% 0.67% 0.00% 0.05% 0.22% 0.02% 0.14% 0.01% 0.06% 0.13% 2.87% 0.36% 0.01%
Central San Diego 0.31% 0.00% 0.02% 0.14% 1.24% 1.73% 0.02% 0.00% 0.37% 0.40% 0.09% 0.00% 0.01% 0.06% 0.01% 0.18% 0.00% 0.10% 0.13% 0.47% 0.29% 0.00%Mid-City 0.21% 0.02% 0.44% 1.23% 1.58% 1.70% 0.17% 0.03% 0.27% 0.35% 0.61% 0.00% 0.05% 0.04% 0.00% 0.05% 0.02% 0.06% 0.16% 7.27% 0.42% 0.01%Southeastern San Diego 0.05% 0.00% 0.00% 0.29% 0.25% 16.14% 0.01% 0.00% 0.25% 0.10% 1.34% 0.00% 0.08% 0.56% 0.04% 0.18% 0.00% 0.01% 0.10% 0.81% 0.37% 0.02%
East Region 0.17% 0.00% 0.07% 0.17% 0.41% 2.25% 0.02% 0.01% 0.23% 0.18% 0.07% 0.00% 0.02% 0.27% 0.02% 0.38% 0.00% 0.01% 0.05% 0.58% 0.15% 0.07%Alpine 0.29% 0.00% 0.00% 0.00% 0.34% 0.45% 0.00% 0.00% 0.00% 0.06% 0.00% 0.00% 0.00% 0.15% 0.00% 0.00% 0.00% 0.00% 0.00% 0.00% 0.06% 0.00%El Cajon 0.15% 0.00% 0.23% 0.16% 0.28% 1.59% 0.00% 0.01% 0.14% 0.12% 0.05% 0.01% 0.00% 0.37% 0.03% 0.61% 0.00% 0.00% 0.00% 0.58% 0.13% 0.12%Harbison-Crest 0.00% 0.00% 0.00% 0.00% 0.14% 0.79% 0.00% 0.00% 0.13% 0.07% 0.06% 0.00% 0.00% 0.00% 0.00% 0.30% 0.00% 0.00% 0.00% 0.01% 0.00% 0.00%Jamul 1.09% 0.00% 0.00% 0.04% 0.31% 3.78% 0.00% 0.00% 0.25% 0.51% 0.25% 0.00% 0.00% 0.04% 0.00% 0.12% 0.00% 0.00% 0.03% 0.47% 0.31% 0.00%La Mesa 0.08% 0.00% 0.00% 0.67% 0.89% 1.78% 0.00% 0.00% 0.31% 0.35% 0.06% 0.00% 0.00% 0.16% 0.00% 0.21% 0.00% 0.02% 0.16% 0.88% 0.26% 0.08%Laguna-Pine Valley 0.00% 0.00% 0.00% 0.00% 0.09% 0.53% 0.00% 0.00% 0.00% 0.00% 0.71% 0.00% 0.00% 0.00% 0.00% 0.12% 0.00% 0.00% 0.00% 0.12% 0.00% 0.00%Lakeside 0.28% 0.00% 0.00% 0.06% 0.15% 1.25% 0.00% 0.00% 0.10% 0.14% 0.02% 0.00% 0.02% 0.24% 0.11% 0.30% 0.00% 0.01% 0.07% 0.22% 0.06% 0.03%Lemon Grove 0.15% 0.00% 0.00% 0.07% 0.74% 2.53% 0.38% 0.07% 0.40% 0.01% 0.25% 0.00% 0.00% 0.29% 0.00% 0.36% 0.00% 0.05% 0.03% 3.07% 0.05% 0.00%Mountain Empire 0.00% 0.00% 0.17% 0.00% 0.06% 0.61% 0.00% 0.00% 0.07% 0.13% 0.00% 0.00% 0.00% 0.11% 0.00% 0.67% 0.00% 0.00% 0.15% 0.00% 0.35% 0.00%Santee 0.07% 0.00% 0.00% 0.00% 0.52% 2.87% 0.00% 0.06% 0.33% 0.12% 0.05% 0.01% 0.00% 0.16% 0.02% 0.26% 0.00% 0.00% 0.09% 0.07% 0.08% 0.06%Spring Valley 0.09% 0.00% 0.00% 0.18% 0.39% 4.25% 0.00% 0.00% 0.37% 0.23% 0.01% 0.00% 0.08% 0.42% 0.00% 0.41% 0.00% 0.00% 0.06% 0.35% 0.25% 0.09%
North Central Region 2.27% 0.05% 0.03% 0.09% 4.09% 5.10% 0.18% 0.07% 0.82% 1.36% 0.29% 0.01% 0.01% 0.23% 0.12% 0.16% 0.02% 0.33% 0.15% 3.11% 0.79% 0.01%Coastal 0.41% 0.00% 0.00% 0.02% 1.00% 1.36% 0.00% 0.02% 0.39% 0.53% 0.00% 0.00% 0.00% 0.08% 0.02% 0.03% 0.01% 0.15% 0.05% 0.20% 0.17% 0.00%Del Mar-Mira Mesa 4.60% 0.02% 0.08% 0.10% 7.51% 11.72% 0.45% 0.11% 0.80% 2.36% 0.48% 0.01% 0.04% 0.38% 0.25% 0.09% 0.06% 0.57% 0.19% 6.13% 1.53% 0.00%Elliott-Navajo 0.67% 0.00% 0.00% 0.12% 1.30% 3.13% 0.00% 0.08% 0.75% 0.63% 0.06% 0.01% 0.00% 0.35% 0.06% 0.27% 0.00% 0.12% 0.22% 1.68% 0.60% 0.01%Kearny Mesa 0.94% 0.17% 0.00% 0.13% 2.21% 3.50% 0.20% 0.01% 0.83% 0.88% 0.56% 0.01% 0.02% 0.22% 0.12% 0.23% 0.00% 0.11% 0.15% 3.75% 0.67% 0.01%Miramar 0.00% 0.00% 0.00% 0.00% 0.64% 0.60% 0.16% 0.00% 0.60% 0.00% 0.00% 0.00% 0.00% 0.16% 0.00% 0.10% 0.00% 0.00% 0.00% 0.66% 0.56% 0.00%Peninsula 0.25% 0.00% 0.00% 0.03% 0.69% 1.95% 0.00% 0.02% 0.51% 0.29% 0.03% 0.02% 0.00% 0.05% 0.00% 0.27% 0.00% 0.12% 0.12% 0.25% 0.17% 0.00%University 6.69% 0.00% 0.06% 0.06% 11.99% 2.11% 0.05% 0.24% 1.85% 3.40% 0.06% 0.00% 0.00% 0.00% 0.06% 0.07% 0.03% 1.12% 0.12% 1.87% 0.71% 0.04%
North Coastal Region 0.76% 0.00% 0.03% 0.14% 0.87% 2.08% 0.01% 0.01% 0.74% 0.45% 0.01% 0.01% 0.05% 0.07% 0.08% 0.33% 0.02% 0.08% 0.07% 0.60% 0.15% 0.00%Carlsbad 1.56% 0.00% 0.00% 0.11% 1.15% 1.55% 0.00% 0.04% 1.04% 0.65% 0.00% 0.01% 0.00% 0.02% 0.24% 0.04% 0.06% 0.23% 0.10% 0.99% 0.36% 0.00%Oceanside 0.41% 0.00% 0.09% 0.25% 0.61% 3.66% 0.00% 0.01% 0.71% 0.38% 0.03% 0.00% 0.09% 0.16% 0.01% 0.85% 0.00% 0.07% 0.09% 0.55% 0.07% 0.00%Pendleton 0.16% 0.00% 0.00% 0.50% 0.11% 0.94% 0.10% 0.00% 0.48% 0.27% 0.00% 0.00% 0.08% 0.05% 0.00% 0.21% 0.00% 0.00% 0.09% 0.20% 0.02% 0.00%San Dieguito 0.83% 0.00% 0.00% 0.00% 1.49% 0.76% 0.00% 0.00% 0.97% 0.63% 0.00% 0.00% 0.07% 0.01% 0.11% 0.01% 0.00% 0.03% 0.04% 0.24% 0.16% 0.00%Vista 0.54% 0.00% 0.00% 0.00% 0.65% 1.83% 0.00% 0.00% 0.29% 0.22% 0.00% 0.04% 0.00% 0.03% 0.00% 0.20% 0.02% 0.00% 0.04% 0.73% 0.07% 0.02%
North Inland Region 1.72% 0.01% 0.04% 0.02% 2.11% 3.78% 0.02% 0.06% 0.63% 0.72% 0.09% 0.00% 0.00% 0.07% 0.05% 0.20% 0.01% 0.08% 0.06% 1.60% 0.38% 0.02%Anza-Borrego Springs 0.00% 0.00% 0.00% 0.00% 0.00% 2.54% 0.00% 0.00% 0.91% 0.00% 0.00% 0.00% 0.00% 0.00% 0.00% 0.00% 0.00% 0.00% 0.00% 0.00% 0.00% 0.00%Escondido 0.42% 0.00% 0.06% 0.00% 0.91% 2.76% 0.01% 0.01% 0.34% 0.21% 0.21% 0.00% 0.00% 0.10% 0.00% 0.09% 0.02% 0.03% 0.04% 1.30% 0.24% 0.02%Fallbrook 0.05% 0.00% 0.00% 0.00% 0.62% 1.16% 0.00% 0.00% 0.56% 0.14% 0.00% 0.00% 0.00% 0.06% 0.00% 0.00% 0.00% 0.00% 0.11% 0.47% 0.07% 0.02%North San Diego 5.49% 0.03% 0.12% 0.00% 5.36% 8.44% 0.01% 0.22% 0.99% 2.03% 0.02% 0.00% 0.00% 0.16% 0.12% 0.11% 0.02% 0.12% 0.14% 2.24% 0.65% 0.01%Palomar-Julian 0.09% 0.00% 0.00% 0.00% 0.51% 0.44% 0.00% 0.00% 0.53% 0.62% 0.00% 0.00% 0.00% 0.00% 0.00% 0.00% 0.00% 0.00% 0.11% 0.38% 0.22% 0.00%Pauma 0.06% 0.00% 0.00% 0.00% 0.03% 0.52% 0.72% 0.00% 0.01% 0.33% 0.00% 0.00% 0.00% 0.00% 0.00% 3.66% 0.00% 0.00% 0.00% 0.00% 0.47% 0.00%Poway 3.20% 0.00% 0.00% 0.08% 3.99% 4.55% 0.04% 0.09% 1.00% 1.10% 0.00% 0.01% 0.00% 0.04% 0.03% 0.03% 0.00% 0.15% 0.03% 2.33% 0.67% 0.04%Ramona 0.09% 0.00% 0.03% 0.00% 0.05% 0.32% 0.00% 0.00% 0.06% 0.58% 0.00% 0.00% 0.00% 0.01% 0.00% 0.30% 0.00% 0.00% 0.00% 0.15% 0.05% 0.00%San Marcos 0.37% 0.01% 0.01% 0.03% 0.98% 3.12% 0.00% 0.03% 0.71% 0.26% 0.17% 0.00% 0.00% 0.02% 0.12% 0.37% 0.02% 0.13% 0.06% 2.26% 0.18% 0.05%Valley Center 0.13% 0.00% 0.00% 0.00% 0.30% 1.34% 0.00% 0.06% 0.33% 0.17% 0.01% 0.00% 0.00% 0.00% 0.00% 0.53% 0.00% 0.00% 0.00% 0.92% 0.98% 0.07%
South Region 0.21% 0.04% 0.00% 0.08% 0.68% 9.95% 0.03% 0.01% 0.56% 0.62% 0.07% 0.00% 0.00% 0.17% 0.01% 0.20% 0.02% 0.06% 0.04% 0.24% 0.32% 0.04%Chula Vista 0.01% 0.00% 0.00% 0.01% 0.37% 3.62% 0.11% 0.02% 0.38% 0.11% 0.04% 0.01% 0.00% 0.09% 0.01% 0.09% 0.05% 0.04% 0.01% 0.11% 0.19% 0.00%Coronado 0.13% 0.00% 0.00% 0.00% 0.73% 1.16% 0.00% 0.00% 0.29% 0.27% 0.00% 0.00% 0.04% 0.09% 0.00% 0.11% 0.12% 0.00% 0.00% 0.17% 0.15% 0.00%National City 0.29% 0.00% 0.00% 0.15% 0.59% 17.56% 0.00% 0.00% 0.33% 0.05% 0.24% 0.00% 0.00% 0.13% 0.04% 0.32% 0.00% 0.05% 0.03% 0.20% 0.31% 0.00%South Bay 0.05% 0.00% 0.00% 0.04% 0.51% 8.06% 0.00% 0.00% 0.26% 0.15% 0.07% 0.00% 0.00% 0.12% 0.00% 0.15% 0.00% 0.08% 0.08% 0.27% 0.15% 0.13%Sweetwater 0.50% 0.14% 0.00% 0.16% 1.13% 15.30% 0.00% 0.01% 1.16% 1.79% 0.04% 0.00% 0.00% 0.31% 0.00% 0.29% 0.02% 0.08% 0.06% 0.35% 0.65% 0.00%
San Diego County 0.97% 0.02% 0.05% 0.17% 1.65% 4.89% 0.06% 0.03% 0.56% 0.64% 0.20% 0.00% 0.02% 0.17% 0.05% 0.23% 0.01% 0.11% 0.09% 1.57% 0.38% 0.03%
Asian/Pacific Islander (API) Distribution: Percent of Total Population
Page 8

Source: U.S. Census Bureau; 2011-2015 American Community Survey 5-Year Estimates, Table DP02.
Geography Population Age 5+ English Only % Spanish Only % API Only % Other Language Only % Bilingual %
Central Region 470,555 51.3% 13.9% 5.5% 1.4% 27.9%Central San Diego 161,260 64.8% 11.4% 1.5% 1.3% 21.0%Mid-City 157,441 48.8% 12.0% 7.4% 2.2% 29.7%Southeastern San Diego 151,854 39.6% 18.5% 7.8% 0.6% 33.5%
East Region 451,872 70.0% 5.5% 1.3% 3.9% 19.3%Alpine 14,921 85.8% 1.9% 0.3% 0.5% 11.5%El Cajon 120,988 60.1% 6.5% 1.2% 10.0% 22.2%Harbison-Crest 14,958 86.5% 3.7% 0.0% 1.5% 8.3%Jamul 18,490 65.8% 8.3% 1.6% 1.3% 22.9%La Mesa 57,073 76.5% 3.7% 1.4% 1.4% 17.0%Laguna-Pine Valley 5,261 86.6% 1.9% 0.5% 0.2% 10.8%Lakeside 53,606 82.8% 3.8% 0.8% 1.1% 11.6%Lemon Grove 29,382 59.1% 11.1% 3.3% 0.8% 25.8%Mountain Empire 6,630 63.2% 10.5% 0.0% 0.2% 26.1%Santee 49,452 85.2% 1.8% 1.1% 1.2% 10.7%Spring Valley 81,111 60.7% 6.7% 1.9% 3.2% 27.4%
North Central Region 589,613 70.4% 2.6% 5.8% 1.8% 19.3%Coastal 72,782 82.7% 1.6% 0.8% 1.2% 13.7%Del Mar-Mira Mesa 158,564 58.0% 1.6% 12.1% 2.3% 26.0%Elliott-Navajo 85,368 80.9% 2.0% 2.8% 1.5% 12.8%Kearny Mesa 154,364 69.3% 5.5% 5.0% 1.6% 18.6%Miramar 4,644 84.2% 0.5% 0.9% 0.0% 14.5%Peninsula 59,452 84.8% 1.6% 1.0% 0.9% 11.8%University 54,439 60.2% 1.3% 6.3% 3.8% 28.4%
North Coastal Region 488,660 74.2% 9.8% 1.7% 0.9% 13.4%Carlsbad 114,445 81.6% 3.4% 2.0% 1.2% 11.7%Oceanside 153,454 67.9% 12.3% 2.1% 0.8% 16.9%Pendleton 33,133 91.7% 0.4% 0.4% 0.1% 7.4%San Dieguito 91,575 84.0% 3.6% 1.0% 1.1% 10.3%Vista 96,053 59.8% 22.6% 1.8% 0.7% 15.0%
North Inland Region 550,673 66.6% 11.6% 3.5% 1.5% 16.8%Anza-Borrego Springs 3,264 75.1% 17.9% 0.0% 0.0% 7.1%Escondido 156,876 56.0% 20.6% 2.2% 0.9% 20.3%Fallbrook 45,627 69.8% 14.7% 1.5% 0.7% 13.2%North San Diego 104,599 67.2% 1.1% 7.5% 4.0% 20.2%Palomar-Julian 5,297 85.4% 3.9% 1.5% 0.0% 9.2%Pauma 6,313 77.8% 8.9% 0.6% 0.3% 12.5%Poway 83,321 75.0% 2.9% 4.8% 1.7% 15.6%Ramona 34,468 80.2% 7.7% 0.5% 0.5% 11.2%San Marcos 89,003 64.0% 17.6% 3.1% 0.9% 14.3%Valley Center 21,905 80.2% 8.4% 0.5% 0.3% 10.6%
South Region 460,849 39.6% 19.0% 3.8% 0.5% 37.0%Chula Vista 109,036 36.0% 24.9% 1.8% 0.6% 36.7%Coronado 23,372 85.6% 2.4% 0.4% 0.1% 11.5%National City 55,743 29.1% 22.6% 7.8% 0.3% 40.2%South Bay 136,077 29.5% 25.1% 2.7% 0.3% 42.4%Sweetwater 136,621 49.1% 9.6% 5.4% 0.8% 35.0%
San Diego County 3,012,222 62.6% 10.1% 3.7% 1.7% 22.0%
The language currently used by respondents at home, either "English only" or a non-English language which is used in addition to English or in place of English.
Language Spoken at Home
51.3%
70.0% 70.4% 74.2%66.6%
39.6%
62.6%
13.9%
5.5% 2.6%
9.8%
11.6%
19.0%
10.1%5.5%
1.3% 5.8%
1.7%3.5%
3.8%
3.7%1.4%
3.9% 1.8%
0.9%1.5%
0.5%
1.7%
27.9%19.3% 19.3%
13.4% 16.8%
37.0%
22.0%
Central Region East Region North Central Region
North Coastal Region
North Inland Region
South Region San Diego County
Language Spoken at Home Among Population 5 Years and Older by HHSA Region, 2015
English Only % Spanish Only % API Only % Other Language Only % Bilingual %
Source: U.S. Census Bureau, 2011-2015 American Community Survey 5-Year Estimates, Table DP02.Prepared by: County of San Diego, Health and Human Services Agency, Public Health Services, Community Health Statistics Unit, 2017.
Page 9

Source: U.S. Census Bureau; 2011-2015 American Community Survey 5-Year Estimates, Table B16001.
Geography English OnlySpanish
OnlyFrench
OnlyItalian Only
Portuguese Only
German Only
Yiddish Only
Other West Germanic Languages
Only
Scandinavian Only
Greek Only
Russian Only
Polish Only
Serbo-Croatian
Only
Other Slavic
Languages Only
Armenian Only
Persian Only
Gujarati Only
Hindi Only
Urdu Only
Other Indic Languages
Only
Other Indo-European Languages
Only
Chinese Only
Japanese Only
Korean Only
Mon-Kmer, Cambodian
Only
Hmong Only
Thai Only Laotian OnlyVietnamese
Only
Other Asian Languages
Only
Tagalog Only
Central Region 241,327 65,409 657 182 63 251 - 7 - 143 777 10 32 26 46 439 58 83 15 49 65 2,673 604 571 1,162 120 237 1,563 8,052 703 9,716 Central San Diego 104,435 18,426 127 87 20 151 - - - 115 551 6 19 21 46 147 50 - 15 - 33 911 219 222 34 - 83 20 318 137 409 Mid-City 76,757 18,891 353 81 30 93 - - - 10 176 4 - - - 228 8 58 - 48 32 1,542 140 291 916 107 88 512 6,999 534 464 Southeastern San Diego 60,135 28,092 177 14 13 7 - 7 - 18 50 - 13 5 - 64 - 25 - 1 - 220 245 58 212 13 66 1,031 735 32 8,843
East Region 316,189 24,748 141 255 58 169 - - 54 67 482 72 - 211 135 773 85 81 7 82 721 895 301 433 236 - 183 167 1,286 178 1,995 Alpine 12,803 290 9 - - 9 - - - - - - - - 27 29 - - - - - 21 - - - - - - - - 23 El Cajon 72,769 7,823 21 127 26 4 - - - 19 128 6 - 95 39 393 - - 7 - 534 259 73 70 61 - 9 26 279 136 329 Harbison-Crest 12,942 553 - - - 13 - - - 29 66 - - - - - - - - - 24 - - - - - - - - - - Jamul 12,169 1,542 26 10 - - - - - - - - - - - - - - - 72 - - 30 87 - - - 15 29 23 117 La Mesa 43,677 2,099 - 51 13 24 - - 25 - 241 29 - 89 27 163 - 5 - - - 251 9 45 104 - 48 18 228 12 43 Laguna-Pine Valley 4,558 102 - - - - - - - - - - - - - - - - - - - 2 - - - - - 24 - - - Lakeside 44,381 2,019 6 - 13 16 - - - - 2 - - - 42 61 85 - - - 32 11 - 30 28 - 45 2 92 - 182 Lemon Grove 17,364 3,248 - 18 6 8 - - 9 - 18 26 - 11 - - - - - 10 24 93 72 4 - - 9 73 501 - 207 Mountain Empire 4,190 696 - - - 15 - - - - - - - - - - - - - - - - - - - - - - - - - Santee 42,115 910 28 - - 31 - - - - 9 11 - - - 59 - 8 - - 53 86 25 - - - 46 9 44 7 294 Spring Valley 49,221 5,466 51 49 - 49 - - 20 19 18 - - 16 - 68 - 68 - - 54 172 92 197 43 - 26 - 113 - 800
North Central Region 415,339 15,518 566 467 750 483 8 122 84 140 1,628 104 85 426 94 1,916 207 458 84 527 244 9,401 1,720 2,847 111 313 297 767 9,971 1,138 6,762 Coastal 60,203 1,143 192 55 8 87 - 4 6 - 192 - 12 9 4 145 - - - - 14 99 98 41 - - 53 - 26 32 230 Del Mar-Mira Mesa 91,948 2,525 125 169 74 158 8 83 - 56 686 50 12 65 30 927 62 251 67 143 92 5,088 390 1,361 64 278 57 312 5,496 719 5,071 Elliott-Navajo 69,049 1,673 25 64 92 45 - 13 - 20 479 46 24 44 23 75 31 32 - 11 - 518 285 278 - - 90 31 818 69 264 Kearny Mesa 107,020 8,528 74 94 202 33 - - 47 23 140 8 - 99 17 230 87 - 17 220 113 1,610 420 486 47 33 38 414 3,496 89 890 Miramar 3,910 22 - - - - - - - - - - - - - - - - - - - - 16 - - - - - 24 - - Peninsula 50,425 934 31 - 246 29 - - 18 - - - 16 59 20 18 - - - - - 108 81 95 - 2 24 - - 26 234 University 32,784 693 119 85 128 131 - 22 13 41 131 - 21 150 - 521 27 175 - 153 25 1,978 430 586 - - 35 10 111 203 73
North Coastal Region 362,444 47,896 200 315 157 273 - 18 23 32 537 38 209 72 39 624 199 103 303 161 168 1,873 1,193 831 43 - 118 1 1,611 184 1,974 Carlsbad 93,418 3,947 53 68 94 89 - 18 - - 151 - 61 35 27 226 97 36 17 129 78 667 344 373 - - 10 - 575 107 161 Oceanside 104,225 18,843 82 42 10 54 - - 16 - 117 33 81 - - 131 - 22 179 - 53 403 408 199 43 - 44 1 441 77 1,356 Pendleton 30,398 127 - - 32 - - - - - - - - - - - - - - - - - 116 - - - - - - - - San Dieguito 76,944 3,262 48 16 21 81 - - - 30 224 - 67 8 12 225 76 16 107 10 - 351 254 98 - - 24 - 49 - 63 Vista 57,459 21,717 17 189 - 49 - - 7 2 45 5 - 29 - 42 26 29 - 22 37 452 71 161 - - 40 - 546 - 394
North Inland Region 366,602 63,998 236 77 130 225 - 211 7 51 701 197 142 341 23 2,118 165 1,017 56 452 260 5,523 1,011 1,810 68 36 152 300 4,032 839 4,984 Anza-Borrego Springs 2,450 583 - - - - - - - - - - - - - - - - - - - - - - - - - - - - - Escondido 87,889 32,244 55 15 28 62 - - - 51 87 98 33 108 - 210 - 126 - 131 11 839 189 141 5 - 7 218 935 35 957 Fallbrook 31,861 6,704 13 13 - 39 - 21 - - 11 82 - 65 - - - - - - - 127 37 - 8 - - - 183 - 323 North San Diego 70,308 1,148 58 - 31 65 - 106 7 - 478 - 11 101 8 1,399 97 750 13 229 47 2,786 299 1,057 - 8 108 - 867 460 2,154 Palomar-Julian 4,525 208 - - - - - - - - - - - - - - - - - - - 22 - 28 - - 13 - 8 - 7 Pauma 4,914 559 - - - - - - - - - - - - - - - - - 1 - - - - - 28 - - - - 9 Poway 62,504 2,408 30 20 7 29 - - - - 86 5 - 26 15 371 68 19 43 75 131 1,204 292 449 23 - 14 12 670 344 934 Ramona 27,637 2,642 33 - - 12 - 14 - - - - - - - 70 - - - - 8 - 11 37 18 - - - 74 - 31 San Marcos 56,938 15,662 22 10 64 18 - 70 - - 39 - 98 41 - 68 - 122 - 12 63 526 169 75 14 - 10 70 1,248 - 558 Valley Center 17,576 1,840 25 19 - - - - - - - 12 - - - - - - - 4 - 19 14 23 - - - - 47 - 11
South Region 182,726 87,691 92 209 135 39 - 7 42 - 170 22 - 38 79 169 89 32 - 381 82 1,273 844 1,164 120 - 116 178 556 4 12,403 Chula Vista 39,229 27,200 10 9 78 11 - 7 - - 55 - - - 13 108 - - - 50 41 254 128 102 - - - 38 88 4 1,296 Coronado 20,004 561 13 - - - - - 12 - - - - - 6 - - - - - - 33 22 1 - - - - - - 28 National City 16,213 12,608 - - - - - - - - 12 - - 17 - - 6 8 - 33 - 108 39 13 16 - - 140 58 - 3,870 South Bay 40,142 34,183 40 12 - 13 - - - - 28 - - - 60 - - 24 - - - 267 140 113 13 - 42 - 244 - 2,743 Sweetwater 67,138 13,139 29 188 57 15 - - 30 - 75 22 - 21 - 61 83 - - 298 41 611 515 935 91 - 74 - 166 - 4,466
San Diego County 1,884,627 305,260 1,892 1,505 1,293 1,440 8 365 210 433 4,295 443 468 1,114 416 6,039 803 1,774 465 1,652 1,540 21,638 5,673 7,656 1,740 469 1,103 2,976 25,508 3,046 37,834
Language Spoken at Home for the Population 5 Years and Over: Number (Detailed)
Page 10

Source: U.S. Census Bureau; 2011-2015 American Community Survey 5-Year Estimates, Table B16001.
GeographyOther Pacific
Island Languages Only
Navajo Only
Other Native
American Languages
Only
Hungarian Only
Arabic OnlyHebrew
Only
African Languages
Only
Other and Unspecified
OnlyBilingual
Central Region 409 - 146 - 791 51 2,549 97 131,472 Central San Diego 3 - 13 - 372 20 312 40 33,898 Mid-City 28 - 126 - 205 31 1,917 38 46,734 Southeastern San Diego 378 - 7 - 214 - 320 19 50,840
East Region 394 - 2 75 8,423 6 449 5,168 87,351 Alpine - - - - - - - - 1,710 El Cajon 195 - - 52 5,995 - 127 4,539 26,847 Harbison-Crest - - - - 87 6 - 1 1,237 Jamul - - - - 37 - - 99 4,234 La Mesa 34 - - 14 36 - 43 58 9,687 Laguna-Pine Valley - - 2 - 7 - - - 566 Lakeside 37 - - - 272 - - 44 6,206 Lemon Grove 17 - - 9 - - 88 - 7,567 Mountain Empire - - - - - - - - 1,729 Santee 15 - - - 340 - 45 4 5,313 Spring Valley 96 - - - 1,649 - 146 423 22,255
North Central Region 610 - - 56 1,720 197 296 99 114,058 Coastal 22 - - - 114 8 - 13 9,972 Del Mar-Mira Mesa 395 - - 21 303 119 36 41 41,282 Elliott-Navajo 24 - - - 230 9 57 - 10,949 Kearny Mesa 146 - - 27 791 10 139 39 28,737 Miramar - - - - - - - - 672 Peninsula 17 - - - - - 64 6 6,999 University 6 - - 8 282 51 - - 15,447
North Coastal Region 447 - - 71 486 17 202 155 65,643 Carlsbad 37 - - 45 144 - - - 13,438 Oceanside 243 - - - 189 17 148 86 25,911 Pendleton - - - - - - - - 2,460 San Dieguito 58 - - 26 15 - 11 54 9,425 Vista 109 - - - 138 - 43 15 14,409
North Inland Region 370 - 12 109 1,254 92 131 443 92,498 Anza-Borrego Springs - - - - - - - - 231 Escondido 82 - 9 27 259 - 17 111 31,897 Fallbrook 19 - - - - 39 - 38 6,044 North San Diego 91 - - 35 489 53 62 113 21,161 Palomar-Julian - - - - - - - - 486 Pauma - - - - 1 - - 15 786 Poway 52 - - 3 316 - 39 166 12,966 Ramona - - - 22 - - 7 - 3,852 San Marcos 126 - - 22 189 - 6 - 12,763 Valley Center - - 3 - - - - - 2,312
South Region 895 - - - 429 16 194 134 170,520 Chula Vista 89 - - - 62 - 33 134 39,997 Coronado - - - - - 4 - - 2,688 National City 129 - - - 87 - - - 22,386 South Bay 109 - - - 79 12 139 - 57,674 Sweetwater 568 - - - 201 - 22 - 47,775
San Diego County 3,125 - 160 311 13,103 379 3,821 6,096 661,542
Language Spoken at Home for the Population 5 Years and Over: Number (Detailed) [Continued]
English Only241,327
English Only316,189
English Only415,339
English Only362,444
English Only366,602
English Only182,726
English Only1,884,627
Spanish Only65,409
Spanish Only24,748 Spanish Only
15,518
Spanish Only47,896
Spanish Only63,998
Spanish Only87,691
Spanish Only305,260
Chinese Only9,401
Chinese Only5,523
Chinese Only21,638
Vietnamese Only9,971
Tagalog Only9,716
Tagalog Only12,403
Tagalog Only37,834
Arabic Only8,423
Bilingual131,472
Bilingual87,351
Bilingual114,058
Bilingual65,643 Bilingual
92,498
Bilingual170,520
Bilingual661,542
Central Region East Region North Central Region North Coastal Region North Inland Region South Region San Diego County
Population 5 Years and Over by Language Spoken at Home, 2015
BilingualAfrican Languages OnlyHebrew OnlyArabic OnlyHungarian OnlyOther Native American Languages OnlyNavajo OnlyOther Pacific Island Languages OnlyTagalog OnlyOther Asian Languages OnlyVietnamese OnlyLaotian OnlyThai OnlyHmong OnlyMon-Kmer, Cambodian OnlyKorean OnlyJapanese OnlyChinese OnlyOther Indo-European Languages OnlyOther Indic Languages OnlyUrdu OnlyHindi OnlyGujarati OnlyPersian OnlyArmenian OnlyOther Slavic Languages OnlySerbo-Croatian OnlyPolish OnlyRussian OnlyGreek OnlyScandinavian OnlyOther West Germanic Languages OnlyYiddish OnlyGerman OnlyPortuguese OnlyItalian OnlyFrench OnlySpanish OnlyEnglish Only
Source: U.S. Census Bureau, 2011-2015 American Community Survey 5-Year Estimates, Table B16001.Prepared by: County of San Diego, Health and Human Services Agency, Public Health Services, Community Health Statistics Unit, 2017.
Page 11

Source: U.S. Census Bureau; 2011-2015 American Community Survey 5-Year Estimates, Table B16001. *In this case, monolingual* refers to those who speak English only or another language at home and speak English less than very well.
Geography English Only
Spanish Only
French Only
Italian Only
Portuguese Only
German Only
Yiddish Only
Other West Germanic Languages
Only
Scandinavian Only
Greek Only
Russian Only
Polish Only
Serbo-Croatian
Only
Other Slavic
Languages Only
Armenian Only
Persian Only
Gujarati Only
Hindi Only
Urdu Only
Other Indic Languages
Only
Other Indo-European Languages
Only
Chinese Only
Japanese Only
Korean Only
Mon-Kmer, Cambodian
OnlyHmong Only Thai Only Laotian Only
Vietnamese Only
Other Asian Languages
Only
Tagalog Only
Central Region 71.17% 19.29% 0.19% 0.05% 0.02% 0.07% 0.00% 0.00% 0.00% 0.04% 0.23% 0.00% 0.01% 0.01% 0.01% 0.13% 0.02% 0.02% 0.00% 0.01% 0.02% 0.79% 0.18% 0.17% 0.34% 0.04% 0.07% 0.46% 2.37% 0.21% 2.87%Central San Diego 82.00% 14.47% 0.10% 0.07% 0.02% 0.12% 0.00% 0.00% 0.00% 0.09% 0.43% 0.00% 0.01% 0.02% 0.04% 0.12% 0.04% 0.00% 0.01% 0.00% 0.03% 0.72% 0.17% 0.17% 0.03% 0.00% 0.07% 0.02% 0.25% 0.11% 0.32%Mid-City 69.33% 17.06% 0.32% 0.07% 0.03% 0.08% 0.00% 0.00% 0.00% 0.01% 0.16% 0.00% 0.00% 0.00% 0.00% 0.21% 0.01% 0.05% 0.00% 0.04% 0.03% 1.39% 0.13% 0.26% 0.83% 0.10% 0.08% 0.46% 6.32% 0.48% 0.42%Southeastern San Diego 59.53% 27.81% 0.18% 0.01% 0.01% 0.01% 0.00% 0.01% 0.00% 0.02% 0.05% 0.00% 0.01% 0.00% 0.00% 0.06% 0.00% 0.02% 0.00% 0.00% 0.00% 0.22% 0.24% 0.06% 0.21% 0.01% 0.07% 1.02% 0.73% 0.03% 8.75%
East Region 86.74% 6.79% 0.04% 0.07% 0.02% 0.05% 0.00% 0.00% 0.01% 0.02% 0.13% 0.02% 0.00% 0.06% 0.04% 0.21% 0.02% 0.02% 0.00% 0.02% 0.20% 0.25% 0.08% 0.12% 0.06% 0.00% 0.05% 0.05% 0.35% 0.05% 0.55%Alpine 96.91% 2.20% 0.07% 0.00% 0.00% 0.07% 0.00% 0.00% 0.00% 0.00% 0.00% 0.00% 0.00% 0.00% 0.20% 0.22% 0.00% 0.00% 0.00% 0.00% 0.00% 0.16% 0.00% 0.00% 0.00% 0.00% 0.00% 0.00% 0.00% 0.00% 0.17%El Cajon 77.30% 8.31% 0.02% 0.13% 0.03% 0.00% 0.00% 0.00% 0.00% 0.02% 0.14% 0.01% 0.00% 0.10% 0.04% 0.42% 0.00% 0.00% 0.01% 0.00% 0.57% 0.28% 0.08% 0.07% 0.06% 0.00% 0.01% 0.03% 0.30% 0.14% 0.35%Harbison-Crest 94.32% 4.03% 0.00% 0.00% 0.00% 0.09% 0.00% 0.00% 0.00% 0.21% 0.48% 0.00% 0.00% 0.00% 0.00% 0.00% 0.00% 0.00% 0.00% 0.00% 0.17% 0.00% 0.00% 0.00% 0.00% 0.00% 0.00% 0.00% 0.00% 0.00% 0.00%Jamul 85.36% 10.82% 0.18% 0.07% 0.00% 0.00% 0.00% 0.00% 0.00% 0.00% 0.00% 0.00% 0.00% 0.00% 0.00% 0.00% 0.00% 0.00% 0.00% 0.51% 0.00% 0.00% 0.21% 0.61% 0.00% 0.00% 0.00% 0.11% 0.20% 0.16% 0.82%La Mesa 92.17% 4.43% 0.00% 0.11% 0.03% 0.05% 0.00% 0.00% 0.05% 0.00% 0.51% 0.06% 0.00% 0.19% 0.06% 0.34% 0.00% 0.01% 0.00% 0.00% 0.00% 0.53% 0.02% 0.09% 0.22% 0.00% 0.10% 0.04% 0.48% 0.03% 0.09%Laguna-Pine Valley 97.08% 2.17% 0.00% 0.00% 0.00% 0.00% 0.00% 0.00% 0.00% 0.00% 0.00% 0.00% 0.00% 0.00% 0.00% 0.00% 0.00% 0.00% 0.00% 0.00% 0.00% 0.04% 0.00% 0.00% 0.00% 0.00% 0.00% 0.51% 0.00% 0.00% 0.00%Lakeside 93.63% 4.26% 0.01% 0.00% 0.03% 0.03% 0.00% 0.00% 0.00% 0.00% 0.00% 0.00% 0.00% 0.00% 0.09% 0.13% 0.18% 0.00% 0.00% 0.00% 0.07% 0.02% 0.00% 0.06% 0.06% 0.00% 0.09% 0.00% 0.19% 0.00% 0.38%Lemon Grove 79.60% 14.89% 0.00% 0.08% 0.03% 0.04% 0.00% 0.00% 0.04% 0.00% 0.08% 0.12% 0.00% 0.05% 0.00% 0.00% 0.00% 0.00% 0.00% 0.05% 0.11% 0.43% 0.33% 0.02% 0.00% 0.00% 0.04% 0.33% 2.30% 0.00% 0.95%Mountain Empire 85.49% 14.20% 0.00% 0.00% 0.00% 0.31% 0.00% 0.00% 0.00% 0.00% 0.00% 0.00% 0.00% 0.00% 0.00% 0.00% 0.00% 0.00% 0.00% 0.00% 0.00% 0.00% 0.00% 0.00% 0.00% 0.00% 0.00% 0.00% 0.00% 0.00% 0.00%Santee 95.41% 2.06% 0.06% 0.00% 0.00% 0.07% 0.00% 0.00% 0.00% 0.00% 0.02% 0.02% 0.00% 0.00% 0.00% 0.13% 0.00% 0.02% 0.00% 0.00% 0.12% 0.19% 0.06% 0.00% 0.00% 0.00% 0.10% 0.02% 0.10% 0.02% 0.67%Spring Valley 83.63% 9.29% 0.09% 0.08% 0.00% 0.08% 0.00% 0.00% 0.03% 0.03% 0.03% 0.00% 0.00% 0.03% 0.00% 0.12% 0.00% 0.12% 0.00% 0.00% 0.09% 0.29% 0.16% 0.33% 0.07% 0.00% 0.04% 0.00% 0.19% 0.00% 1.36%
North Central Region 87.34% 3.26% 0.12% 0.10% 0.16% 0.10% 0.00% 0.03% 0.02% 0.03% 0.34% 0.02% 0.02% 0.09% 0.02% 0.40% 0.04% 0.10% 0.02% 0.11% 0.05% 1.98% 0.36% 0.60% 0.02% 0.07% 0.06% 0.16% 2.10% 0.24% 1.42%Coastal 95.85% 1.82% 0.31% 0.09% 0.01% 0.14% 0.00% 0.01% 0.01% 0.00% 0.31% 0.00% 0.02% 0.01% 0.01% 0.23% 0.00% 0.00% 0.00% 0.00% 0.02% 0.16% 0.16% 0.07% 0.00% 0.00% 0.08% 0.00% 0.04% 0.05% 0.37%Del Mar-Mira Mesa 78.40% 2.15% 0.11% 0.14% 0.06% 0.13% 0.01% 0.07% 0.00% 0.05% 0.58% 0.04% 0.01% 0.06% 0.03% 0.79% 0.05% 0.21% 0.06% 0.12% 0.08% 4.34% 0.33% 1.16% 0.05% 0.24% 0.05% 0.27% 4.69% 0.61% 4.32%Elliott-Navajo 92.78% 2.25% 0.03% 0.09% 0.12% 0.06% 0.00% 0.02% 0.00% 0.03% 0.64% 0.06% 0.03% 0.06% 0.03% 0.10% 0.04% 0.04% 0.00% 0.01% 0.00% 0.70% 0.38% 0.37% 0.00% 0.00% 0.12% 0.04% 1.10% 0.09% 0.35%Kearny Mesa 85.19% 6.79% 0.06% 0.07% 0.16% 0.03% 0.00% 0.00% 0.04% 0.02% 0.11% 0.01% 0.00% 0.08% 0.01% 0.18% 0.07% 0.00% 0.01% 0.18% 0.09% 1.28% 0.33% 0.39% 0.04% 0.03% 0.03% 0.33% 2.78% 0.07% 0.71%Miramar 98.44% 0.55% 0.00% 0.00% 0.00% 0.00% 0.00% 0.00% 0.00% 0.00% 0.00% 0.00% 0.00% 0.00% 0.00% 0.00% 0.00% 0.00% 0.00% 0.00% 0.00% 0.00% 0.40% 0.00% 0.00% 0.00% 0.00% 0.00% 0.60% 0.00% 0.00%Peninsula 96.13% 1.78% 0.06% 0.00% 0.47% 0.06% 0.00% 0.00% 0.03% 0.00% 0.00% 0.00% 0.03% 0.11% 0.04% 0.03% 0.00% 0.00% 0.00% 0.00% 0.00% 0.21% 0.15% 0.18% 0.00% 0.00% 0.05% 0.00% 0.00% 0.05% 0.45%University 84.08% 1.78% 0.31% 0.22% 0.33% 0.34% 0.00% 0.06% 0.03% 0.11% 0.34% 0.00% 0.05% 0.38% 0.00% 1.34% 0.07% 0.45% 0.00% 0.39% 0.06% 5.07% 1.10% 1.50% 0.00% 0.00% 0.09% 0.03% 0.28% 0.52% 0.19%
North Coastal Region 85.68% 11.32% 0.05% 0.07% 0.04% 0.06% 0.00% 0.00% 0.01% 0.01% 0.13% 0.01% 0.05% 0.02% 0.01% 0.15% 0.05% 0.02% 0.07% 0.04% 0.04% 0.44% 0.28% 0.20% 0.01% 0.00% 0.03% 0.00% 0.38% 0.04% 0.47%Carlsbad 92.49% 3.91% 0.05% 0.07% 0.09% 0.09% 0.00% 0.02% 0.00% 0.00% 0.15% 0.00% 0.06% 0.03% 0.03% 0.22% 0.10% 0.04% 0.02% 0.13% 0.08% 0.66% 0.34% 0.37% 0.00% 0.00% 0.01% 0.00% 0.57% 0.11% 0.16%Oceanside 81.72% 14.77% 0.06% 0.03% 0.01% 0.04% 0.00% 0.00% 0.01% 0.00% 0.09% 0.03% 0.06% 0.00% 0.00% 0.10% 0.00% 0.02% 0.14% 0.00% 0.04% 0.32% 0.32% 0.16% 0.03% 0.00% 0.03% 0.00% 0.35% 0.06% 1.06%Pendleton 99.10% 0.41% 0.00% 0.00% 0.10% 0.00% 0.00% 0.00% 0.00% 0.00% 0.00% 0.00% 0.00% 0.00% 0.00% 0.00% 0.00% 0.00% 0.00% 0.00% 0.00% 0.00% 0.38% 0.00% 0.00% 0.00% 0.00% 0.00% 0.00% 0.00% 0.00%San Dieguito 93.66% 3.97% 0.06% 0.02% 0.03% 0.10% 0.00% 0.00% 0.00% 0.04% 0.27% 0.00% 0.08% 0.01% 0.01% 0.27% 0.09% 0.02% 0.13% 0.01% 0.00% 0.43% 0.31% 0.12% 0.00% 0.00% 0.03% 0.00% 0.06% 0.00% 0.08%Vista 70.38% 26.60% 0.02% 0.23% 0.00% 0.06% 0.00% 0.00% 0.01% 0.00% 0.06% 0.01% 0.00% 0.04% 0.00% 0.05% 0.03% 0.04% 0.00% 0.03% 0.05% 0.55% 0.09% 0.20% 0.00% 0.00% 0.05% 0.00% 0.67% 0.00% 0.48%
North Inland Region 80.01% 13.97% 0.05% 0.02% 0.03% 0.05% 0.00% 0.05% 0.00% 0.01% 0.15% 0.04% 0.03% 0.07% 0.01% 0.46% 0.04% 0.22% 0.01% 0.10% 0.06% 1.21% 0.22% 0.40% 0.01% 0.01% 0.03% 0.07% 0.88% 0.18% 1.09%Anza-Borrego Springs 80.78% 19.22% 0.00% 0.00% 0.00% 0.00% 0.00% 0.00% 0.00% 0.00% 0.00% 0.00% 0.00% 0.00% 0.00% 0.00% 0.00% 0.00% 0.00% 0.00% 0.00% 0.00% 0.00% 0.00% 0.00% 0.00% 0.00% 0.00% 0.00% 0.00% 0.00%Escondido 70.32% 25.80% 0.04% 0.01% 0.02% 0.05% 0.00% 0.00% 0.00% 0.04% 0.07% 0.08% 0.03% 0.09% 0.00% 0.17% 0.00% 0.10% 0.00% 0.10% 0.01% 0.67% 0.15% 0.11% 0.00% 0.00% 0.01% 0.17% 0.75% 0.03% 0.77%Fallbrook 80.49% 16.94% 0.03% 0.03% 0.00% 0.10% 0.00% 0.05% 0.00% 0.00% 0.03% 0.21% 0.00% 0.16% 0.00% 0.00% 0.00% 0.00% 0.00% 0.00% 0.00% 0.32% 0.09% 0.00% 0.02% 0.00% 0.00% 0.00% 0.46% 0.00% 0.82%North San Diego 84.26% 1.38% 0.07% 0.00% 0.04% 0.08% 0.00% 0.13% 0.01% 0.00% 0.57% 0.00% 0.01% 0.12% 0.01% 1.68% 0.12% 0.90% 0.02% 0.27% 0.06% 3.34% 0.36% 1.27% 0.00% 0.01% 0.13% 0.00% 1.04% 0.55% 2.58%Palomar-Julian 94.06% 4.32% 0.00% 0.00% 0.00% 0.00% 0.00% 0.00% 0.00% 0.00% 0.00% 0.00% 0.00% 0.00% 0.00% 0.00% 0.00% 0.00% 0.00% 0.00% 0.00% 0.46% 0.00% 0.58% 0.00% 0.00% 0.27% 0.00% 0.17% 0.00% 0.15%Pauma 88.91% 10.11% 0.00% 0.00% 0.00% 0.00% 0.00% 0.00% 0.00% 0.00% 0.00% 0.00% 0.00% 0.00% 0.00% 0.00% 0.00% 0.00% 0.00% 0.02% 0.00% 0.00% 0.00% 0.00% 0.00% 0.51% 0.00% 0.00% 0.00% 0.00% 0.16%Poway 88.84% 3.42% 0.04% 0.03% 0.01% 0.04% 0.00% 0.00% 0.00% 0.00% 0.12% 0.01% 0.00% 0.04% 0.02% 0.53% 0.10% 0.03% 0.06% 0.11% 0.19% 1.71% 0.42% 0.64% 0.03% 0.00% 0.02% 0.02% 0.95% 0.49% 1.33%Ramona 90.27% 8.63% 0.11% 0.00% 0.00% 0.04% 0.00% 0.05% 0.00% 0.00% 0.00% 0.00% 0.00% 0.00% 0.00% 0.23% 0.00% 0.00% 0.00% 0.00% 0.03% 0.00% 0.04% 0.12% 0.06% 0.00% 0.00% 0.00% 0.24% 0.00% 0.10%San Marcos 74.68% 20.54% 0.03% 0.01% 0.08% 0.02% 0.00% 0.09% 0.00% 0.00% 0.05% 0.00% 0.13% 0.05% 0.00% 0.09% 0.00% 0.16% 0.00% 0.02% 0.08% 0.69% 0.22% 0.10% 0.02% 0.00% 0.01% 0.09% 1.64% 0.00% 0.73%Valley Center 89.71% 9.39% 0.13% 0.10% 0.00% 0.00% 0.00% 0.00% 0.00% 0.00% 0.00% 0.06% 0.00% 0.00% 0.00% 0.00% 0.00% 0.00% 0.00% 0.02% 0.00% 0.10% 0.07% 0.12% 0.00% 0.00% 0.00% 0.00% 0.24% 0.00% 0.06%
South Region 62.94% 30.20% 0.03% 0.07% 0.05% 0.01% 0.00% 0.00% 0.01% 0.00% 0.06% 0.01% 0.00% 0.01% 0.03% 0.06% 0.03% 0.01% 0.00% 0.13% 0.03% 0.44% 0.29% 0.40% 0.04% 0.00% 0.04% 0.06% 0.19% 0.00% 4.27%Chula Vista 56.82% 39.40% 0.01% 0.01% 0.11% 0.02% 0.00% 0.01% 0.00% 0.00% 0.08% 0.00% 0.00% 0.00% 0.02% 0.16% 0.00% 0.00% 0.00% 0.07% 0.06% 0.37% 0.19% 0.15% 0.00% 0.00% 0.00% 0.06% 0.13% 0.01% 1.88%Coronado 96.71% 2.71% 0.06% 0.00% 0.00% 0.00% 0.00% 0.00% 0.06% 0.00% 0.00% 0.00% 0.00% 0.00% 0.03% 0.00% 0.00% 0.00% 0.00% 0.00% 0.00% 0.16% 0.11% 0.00% 0.00% 0.00% 0.00% 0.00% 0.00% 0.00% 0.14%National City 48.60% 37.80% 0.00% 0.00% 0.00% 0.00% 0.00% 0.00% 0.00% 0.00% 0.04% 0.00% 0.00% 0.05% 0.00% 0.00% 0.02% 0.02% 0.00% 0.10% 0.00% 0.32% 0.12% 0.04% 0.05% 0.00% 0.00% 0.42% 0.17% 0.00% 11.60%South Bay 51.20% 43.60% 0.05% 0.02% 0.00% 0.02% 0.00% 0.00% 0.00% 0.00% 0.04% 0.00% 0.00% 0.00% 0.08% 0.00% 0.00% 0.03% 0.00% 0.00% 0.00% 0.34% 0.18% 0.14% 0.02% 0.00% 0.05% 0.00% 0.31% 0.00% 3.50%Sweetwater 75.57% 14.79% 0.03% 0.21% 0.06% 0.02% 0.00% 0.00% 0.03% 0.00% 0.08% 0.02% 0.00% 0.02% 0.00% 0.07% 0.09% 0.00% 0.00% 0.34% 0.05% 0.69% 0.58% 1.05% 0.10% 0.00% 0.08% 0.00% 0.19% 0.00% 5.03%
San Diego County 80.17% 12.99% 0.08% 0.06% 0.06% 0.06% 0.00% 0.02% 0.01% 0.02% 0.18% 0.02% 0.02% 0.05% 0.02% 0.26% 0.03% 0.08% 0.02% 0.07% 0.07% 0.92% 0.24% 0.33% 0.07% 0.02% 0.05% 0.13% 1.09% 0.13% 1.61%
Language Spoken at Home for the Monolingual* Population 5 Years and Over
Page 12

Source: U.S. Census Bureau; 2011-2015 American Community Survey 5-Year Estimates, Table B16001.
GeographyOther Pacific
Island Languages Only
Navajo Only
Other Native
American Languages
Only
Hungarian Only
Arabic Only
Hebrew Only
African Languages
Only
Other and Unspecified
Only
Central Region 0.12% 0.00% 0.04% 0.00% 0.23% 0.02% 0.75% 0.03%Central San Diego 0.00% 0.00% 0.01% 0.00% 0.29% 0.02% 0.24% 0.03%Mid-City 0.03% 0.00% 0.11% 0.00% 0.19% 0.03% 1.73% 0.03%Southeastern San Diego 0.37% 0.00% 0.01% 0.00% 0.21% 0.00% 0.32% 0.02%
East Region 0.11% 0.00% 0.00% 0.02% 2.31% 0.00% 0.12% 1.42%Alpine 0.00% 0.00% 0.00% 0.00% 0.00% 0.00% 0.00% 0.00%El Cajon 0.21% 0.00% 0.00% 0.06% 6.37% 0.00% 0.13% 4.82%Harbison-Crest 0.00% 0.00% 0.00% 0.00% 0.63% 0.04% 0.00% 0.01%Jamul 0.00% 0.00% 0.00% 0.00% 0.26% 0.00% 0.00% 0.69%La Mesa 0.07% 0.00% 0.00% 0.03% 0.08% 0.00% 0.09% 0.12%Laguna-Pine Valley 0.00% 0.00% 0.04% 0.00% 0.15% 0.00% 0.00% 0.00%Lakeside 0.08% 0.00% 0.00% 0.00% 0.57% 0.00% 0.00% 0.09%Lemon Grove 0.08% 0.00% 0.00% 0.04% 0.00% 0.00% 0.40% 0.00%Mountain Empire 0.00% 0.00% 0.00% 0.00% 0.00% 0.00% 0.00% 0.00%Santee 0.03% 0.00% 0.00% 0.00% 0.77% 0.00% 0.10% 0.01%Spring Valley 0.16% 0.00% 0.00% 0.00% 2.80% 0.00% 0.25% 0.72%
North Central Region 0.13% 0.00% 0.00% 0.01% 0.36% 0.04% 0.06% 0.02%Coastal 0.04% 0.00% 0.00% 0.00% 0.18% 0.01% 0.00% 0.02%Del Mar-Mira Mesa 0.34% 0.00% 0.00% 0.02% 0.26% 0.10% 0.03% 0.03%Elliott-Navajo 0.03% 0.00% 0.00% 0.00% 0.31% 0.01% 0.08% 0.00%Kearny Mesa 0.12% 0.00% 0.00% 0.02% 0.63% 0.01% 0.11% 0.03%Miramar 0.00% 0.00% 0.00% 0.00% 0.00% 0.00% 0.00% 0.00%Peninsula 0.03% 0.00% 0.00% 0.00% 0.00% 0.00% 0.12% 0.01%University 0.02% 0.00% 0.00% 0.02% 0.72% 0.13% 0.00% 0.00%
North Coastal Region 0.11% 0.00% 0.00% 0.02% 0.11% 0.00% 0.05% 0.04%Carlsbad 0.04% 0.00% 0.00% 0.04% 0.14% 0.00% 0.00% 0.00%Oceanside 0.19% 0.00% 0.00% 0.00% 0.15% 0.01% 0.12% 0.07%Pendleton 0.00% 0.00% 0.00% 0.00% 0.00% 0.00% 0.00% 0.00%San Dieguito 0.07% 0.00% 0.00% 0.03% 0.02% 0.00% 0.01% 0.07%Vista 0.13% 0.00% 0.00% 0.00% 0.17% 0.00% 0.05% 0.02%
North Inland Region 0.08% 0.00% 0.00% 0.02% 0.27% 0.02% 0.03% 0.10%Anza-Borrego Springs 0.00% 0.00% 0.00% 0.00% 0.00% 0.00% 0.00% 0.00%Escondido 0.07% 0.00% 0.01% 0.02% 0.21% 0.00% 0.01% 0.09%Fallbrook 0.05% 0.00% 0.00% 0.00% 0.00% 0.10% 0.00% 0.10%North San Diego 0.11% 0.00% 0.00% 0.04% 0.59% 0.06% 0.07% 0.14%Palomar-Julian 0.00% 0.00% 0.00% 0.00% 0.00% 0.00% 0.00% 0.00%Pauma 0.00% 0.00% 0.00% 0.00% 0.02% 0.00% 0.00% 0.27%Poway 0.07% 0.00% 0.00% 0.00% 0.45% 0.00% 0.06% 0.24%Ramona 0.00% 0.00% 0.00% 0.07% 0.00% 0.00% 0.02% 0.00%San Marcos 0.17% 0.00% 0.00% 0.03% 0.25% 0.00% 0.01% 0.00%Valley Center 0.00% 0.00% 0.02% 0.00% 0.00% 0.00% 0.00% 0.00%
South Region 0.31% 0.00% 0.00% 0.00% 0.15% 0.01% 0.07% 0.05%Chula Vista 0.13% 0.00% 0.00% 0.00% 0.09% 0.00% 0.05% 0.19%Coronado 0.00% 0.00% 0.00% 0.00% 0.00% 0.02% 0.00% 0.00%National City 0.39% 0.00% 0.00% 0.00% 0.26% 0.00% 0.00% 0.00%South Bay 0.14% 0.00% 0.00% 0.00% 0.10% 0.02% 0.18% 0.00%Sweetwater 0.64% 0.00% 0.00% 0.00% 0.23% 0.00% 0.02% 0.00%
San Diego County 0.13% 0.00% 0.01% 0.01% 0.56% 0.02% 0.16% 0.26%
Language Spoken at Home for the Monolingual* Population 5 Years and Over [Continued]
0% 10% 20% 30% 40% 50% 60% 70% 80% 90% 100%
Central Region
East Region
North CentralRegion
North CoastalRegion
North InlandRegion
South Region
San DiegoCounty
Language Spoken at Home for the Monolingual* Population 5 Years and Over, 2015
English OnlySpanish OnlyFrench OnlyItalian OnlyPortuguese OnlyGerman OnlyYiddish OnlyOther West Germanic Languages OnlyScandinavian OnlyGreek OnlyRussian OnlyPolish OnlySerbo-Croatian OnlyOther Slavic Languages OnlyArmenian OnlyPersian OnlyGujarati OnlyHindi OnlyUrdu OnlyOther Indic Languages OnlyOther Indo-European Languages OnlyChinese OnlyJapanese OnlyKorean OnlyMon-Kmer, Cambodian OnlyHmong OnlyThai OnlyLaotian OnlyVietnamese OnlyOther Asian Languages OnlyTagalog OnlyOther Pacific Island Languages OnlyNavajo OnlyOther Native American Languages OnlyHungarian OnlyArabic OnlyHebrew OnlyAfrican Languages OnlyOther and Unspecified Only
*In this case, monolingual* refers to those who speak English only or another language at home and speak English less than very well.Source: U.S. Census Bureau, 2011-2015 American Community Survey 5-Year Estimates, Table B16001.Prepared by: County of San Diego, Health and Human Services Agency, Public Health Services, Community Health Statistics Unit, 2017.
Page 13

Source: U.S. Census Bureau; 2011-2015 American Community Survey 5-Year Estimates, Table B16001.
Geography Spanish French Italian Portuguese German Yiddish Other West Germanic Languages
Scandinavian Greek Russian Polish Serbo-
Croatian
Other Slavic
Languages Armenian Persian Gujarati Hindi Urdu
Other Indic Languages
Other Indo-European Languages
Chinese Japanese Korean Mon-Kmer, Cambodian
Hmong Thai Laotian Vietnamese Other Asian Languages
Tagalog
Central Region 97,206 1,646 645 495 1,492 15 232 117 295 614 150 371 159 101 268 45 454 36 222 125 1,486 581 326 1,143 189 182 1,380 4,445 511 11,542 Central San Diego 25,912 961 458 374 1,142 - 127 57 231 298 81 319 127 63 157 5 104 12 55 87 569 273 139 104 - 97 83 279 201 804 Mid-City 34,062 421 110 80 247 15 105 56 48 224 58 13 24 18 89 20 244 - 116 38 780 192 147 863 167 35 464 3,749 295 1,081 Southeastern San Diego 37,232 264 77 41 103 - - 4 16 92 11 39 8 20 22 20 106 24 51 - 137 116 40 176 22 50 833 417 15 9,657
East Region 59,736 736 788 294 1,189 21 167 308 167 438 338 89 198 165 617 52 143 109 46 1,046 596 524 255 439 33 178 244 1,068 142 4,253 Alpine 1,213 6 54 9 62 - - - - 39 - - - 83 42 - 25 - - 53 33 - - - - - - - - - El Cajon 16,321 106 154 83 228 15 12 - 26 58 17 44 96 51 151 - 91 6 - 550 125 73 24 54 - - 34 305 - 820 Harbison-Crest 765 14 60 - 26 - 12 - - 162 - - - - - - - - - 20 - - - 10 - - 10 1 - 66 Jamul 3,048 14 102 13 81 6 17 138 - - - - - - 16 - - - 37 6 29 2 10 7 - 5 32 42 75 283 La Mesa 6,309 260 86 52 196 - 17 110 33 102 151 45 93 25 205 - 19 - - 26 107 176 102 303 - 78 - 136 67 271 Laguna-Pine Valley 467 5 - - - - 15 - - - 6 - - - - - - - - - 3 5 - - - - - 7 - 30 Lakeside 4,123 33 46 16 93 - 35 - - - - - 9 - 94 52 8 103 - 65 86 52 69 5 - 37 8 15 - 344 Lemon Grove 6,009 62 15 - 92 - 6 - - 22 54 - - - - - - - 9 56 53 41 - - 33 11 99 382 - 362 Mountain Empire 1,571 - - - 19 - 2 - - - - - - 6 - - - - - 4 4 - - - - 23 - - - - Santee 3,449 126 132 - 107 - 22 30 38 33 44 - - - 48 - - - - 136 75 56 48 - - - 20 11 - 439 Spring Valley 16,461 110 139 121 285 - 29 30 70 22 66 - - - 61 - - - - 130 81 119 2 60 - 24 41 169 - 1,638
North Central Region 39,896 2,699 1,279 1,971 3,066 29 661 1,109 701 1,815 463 480 631 414 4,207 857 3,146 724 1,324 834 12,458 1,916 3,389 378 643 417 695 6,143 3,666 12,375 Coastal 3,873 622 291 513 770 19 150 621 102 282 57 145 52 - 379 24 177 4 7 127 515 84 154 16 - 10 - 81 8 309 Del Mar-Mira Mesa 7,938 542 290 211 730 - 320 183 261 524 164 37 102 126 1,939 371 1,422 294 799 259 6,007 606 1,817 112 423 94 255 3,280 2,355 8,075 Elliott-Navajo 4,719 260 145 156 466 - 24 6 7 432 129 44 205 - 463 - 216 36 71 182 478 209 176 32 - 47 31 496 57 992 Kearny Mesa 15,190 795 359 451 478 - 80 162 111 155 58 115 70 26 277 145 476 375 263 162 1,508 526 496 192 167 180 382 1,900 181 2,048 Miramar 498 - 25 - 9 - - - - 2 - - - - 2 - 9 - - - 1 35 - - 8 - - 10 - 37 Peninsula 4,414 116 42 435 163 - 18 47 142 41 22 35 6 33 126 - 65 - - 18 171 165 48 17 - 52 - 14 64 476 University 3,264 364 127 205 450 10 69 90 78 379 33 104 196 229 1,021 317 781 15 184 86 3,778 291 698 9 45 34 27 362 1,001 438
North Coastal Region 44,598 1,708 744 632 2,074 10 371 285 190 852 390 302 114 136 762 202 652 30 326 364 1,554 1,084 612 254 6 165 - 696 836 3,979 Carlsbad 7,216 486 249 201 597 - 93 55 86 366 6 192 25 57 173 49 220 17 186 191 556 290 249 88 - 57 - 268 452 576 Oceanside 18,812 383 162 110 415 - 140 29 10 160 343 26 55 16 358 33 124 - 112 116 327 347 134 116 - 89 - 227 123 2,443 Pendleton 1,879 37 12 44 83 - - - - 10 - - - - - - 8 - - 10 30 78 62 50 6 - - 6 - 122 San Dieguito 4,874 673 246 223 763 10 91 180 90 201 24 52 18 39 169 93 217 - 22 14 501 301 92 - - 11 - 87 103 150 Vista 11,817 129 75 54 216 - 47 21 4 115 17 32 16 24 62 27 83 13 6 33 140 68 75 - - 8 - 108 158 688
North Inland Region 54,378 1,105 574 251 1,664 79 615 415 137 1,114 318 260 283 261 2,317 455 1,464 291 1,498 680 4,310 1,479 1,655 71 36 107 218 3,203 1,570 8,012 Anza-Borrego Springs 219 - - - - - 12 - - - - - - - - - - - - - - - - - - - - - - - Escondido 25,490 281 107 25 301 - 273 32 29 63 174 - 37 110 382 - 83 - 85 51 389 346 143 7 11 10 161 682 217 1,574 Fallbrook 5,056 38 74 - 166 - 17 124 9 16 79 5 22 - - - - - - 3 38 65 6 3 - - - 26 12 147 North San Diego 5,165 214 151 191 558 13 88 107 7 537 - 134 173 62 1,300 358 872 255 860 424 2,120 417 813 19 12 58 32 969 807 3,257 Palomar-Julian 323 21 - - 18 - 6 9 - 44 - - 5 - - - - - - - 6 11 6 - - 5 - - - 8 Pauma 532 3 3 - 2 - - - - - - - 17 - - - - - - - - - - - - - - - - 22 Poway 3,840 269 93 12 343 51 77 86 24 397 24 6 24 66 472 97 509 36 492 53 1,433 402 384 25 13 8 - 733 460 1,702 Ramona 3,235 93 - - 86 - 30 13 43 9 8 - 5 - - - - - 13 - 22 - 173 - - - - 55 6 23 San Marcos 8,993 123 73 23 144 15 83 - 25 35 20 91 - 23 163 - - - 37 123 253 177 130 17 - 26 25 575 68 1,212 Valley Center 1,525 63 73 - 46 - 29 44 - 13 13 24 - - - - - - 11 26 49 61 - - - - - 163 - 67
South Region 141,151 698 205 219 633 - 69 86 101 202 29 95 40 97 170 243 15 29 92 384 1,051 1,166 1,534 138 93 61 185 524 131 18,833 Chula Vista 37,490 118 40 45 105 - 43 12 - 35 16 11 - 71 23 - - 8 10 28 84 84 42 8 93 - 7 61 - 1,286 Coronado 1,822 149 1 18 111 - - 36 55 6 5 7 6 - 42 - - - - 22 115 21 17 - - - - 26 8 145 National City 16,871 18 19 9 96 - 9 - - 14 - 17 - - - 69 15 21 5 6 146 29 3 71 - - 63 49 - 4,643 South Bay 50,398 234 27 8 207 - 17 10 8 62 - 16 6 18 28 - - - 11 26 308 307 97 20 - 61 54 104 8 4,740 Sweetwater 34,570 179 118 139 114 - - 28 38 85 8 44 28 8 77 174 - - 66 302 398 725 1,375 39 - - 61 284 115 8,019
San Diego County 436,965 8,592 4,235 3,862 10,118 154 2,115 2,320 1,591 5,035 1,688 1,597 1,425 1,174 8,341 1,854 5,874 1,219 3,508 3,433 21,455 6,750 7,771 2,423 1,000 1,110 2,722 16,079 6,856 58,994
Language Spoken at Home for the Bilingual Population 5 Years and Over (Detailed)
Page 14

Source: U.S. Census Bureau; 2011-2015 American Community Survey 5-Year Estimates, Table B16001.
GeographyOther Pacific
Island Languages
Navajo
Other Native
American Languages
Hungarian Arabic Hebrew African
Languages Other and
Unspecified
Central Region 821 9 48 26 481 146 3,382 86 Central San Diego 55 9 14 10 250 43 364 34 Mid-City 60 - 34 16 177 103 2,531 52 Southeastern San Diego 706 - - - 54 - 487 -
East Region 1,389 - 165 53 5,743 102 693 4,827 Alpine 24 - 4 - 44 - - 19 El Cajon 387 - 55 30 3,267 15 252 3,397 Harbison-Crest - - 14 6 71 - - - Jamul 26 - - - 108 - - 137 La Mesa 168 - - 14 261 61 145 69 Laguna-Pine Valley 5 - 23 - - - - - Lakeside 54 - 57 - 546 - - 256 Lemon Grove 122 - - - 7 - 125 7 Mountain Empire 56 - 12 - 16 - - 16 Santee 122 - - 3 296 - 63 15 Spring Valley 425 - - - 1,127 26 108 911
North Central Region 1,333 6 86 194 2,244 876 587 346 Coastal 53 - - - 270 224 17 16 Del Mar-Mira Mesa 679 - - 48 562 222 75 160 Elliott-Navajo 117 - - 62 515 88 62 26 Kearny Mesa 253 6 86 31 403 117 380 133 Miramar 36 - - - - - - - Peninsula 32 - - 13 204 - 9 11 University 163 - - 40 290 225 44 -
North Coastal Region 734 63 - 111 482 114 117 94 Carlsbad 213 - - 21 109 47 5 42 Oceanside 385 63 - 14 150 27 62 - Pendleton 5 - - - - - 18 - San Dieguito 38 - - 13 94 12 20 4 Vista 93 - - 63 129 28 12 48
North Inland Region 813 15 87 189 1,544 190 385 455 Anza-Borrego Springs - - - - - - - - Escondido 233 10 - 52 429 32 30 48 Fallbrook 48 - - 7 41 - 9 33 North San Diego 142 - - 19 604 123 201 99 Palomar-Julian - - 24 - - - - - Pauma 173 - 15 - - 19 - - Poway 77 - 16 89 337 16 101 199 Ramona - - - - - - - 38 San Marcos 97 - - 22 129 - 44 17 Valley Center 43 5 32 - 4 - - 21
South Region 1,009 37 28 12 665 42 400 53 Chula Vista 152 - - - 71 - 16 38 Coronado 28 - - - 14 9 25 - National City 106 1 - - 59 - 47 - South Bay 328 36 14 - 203 33 270 15 Sweetwater 395 - 14 12 318 - 42 -
San Diego County 6,099 130 414 585 11,159 1,470 5,564 5,861
Language Spoken at Home for the Bilingual Population 5 Years and Over (Detailed) [Continued]
Central Region
East Region
North Central Region
North Coastal Region
North Inland Region
South Region
San Diego County
Language Spoken for the Bilingual Population 5 Years and Over, 2015
Spanish
French
Italian
Portuguese
German
Yiddish
Other West Germanic Languages
Scandinavian
Greek
Russian
Polish
Serbo-Croatian
Other Slavic Languages
Armenian
Persian
Gujarati
Hindi
Urdu
Other Indic Languages
Other Indo-European Languages
Chinese
Japanese
Korean
Mon-Kmer, Cambodian
Hmong
Thai
Laotian
Vietnamese
Other Asian Languages
Tagalog
Other Pacific Island Languages
Navajo
Other Native American Languages
Hungarian
Arabic
Hebrew
African Languages
Other and UnspecifiedSource: U.S. Census Bureau, 2011-2015 American Community Survey 5-Year Estimates, Table B16001.Prepared by: County of San Diego, Health and Human Services Agency, Public Health Services, Community Health Statistics Unit, 2017.
Page 15

Source: U.S. Census Bureau; 2011-2015 American Community Survey 5-Year Estimates, Table B16001. *In this case, bilingual* refers to those who speak English very well and speak another language at home.
Geography Spanish French Italian Portuguese German Yiddish Other West Germanic Languages
Scandinavian Greek Russian Polish Serbo-
Croatian
Other Slavic
Languages Armenian Persian Gujarati Hindi Urdu
Other Indic Languages
Other Indo-European Languages
Chinese Japanese Korean Mon-Kmer, Cambodian
Hmong Thai Laotian Vietnamese Other Asian Languages
Tagalog
Central Region 20.66% 0.35% 0.14% 0.11% 0.32% 0.00% 0.05% 0.02% 0.06% 0.13% 0.03% 0.08% 0.03% 0.02% 0.06% 0.01% 0.10% 0.01% 0.05% 0.03% 0.32% 0.12% 0.07% 0.24% 0.04% 0.04% 0.29% 0.94% 0.11% 2.45%Central San Diego 16.07% 0.60% 0.28% 0.23% 0.71% 0.00% 0.08% 0.04% 0.14% 0.18% 0.05% 0.20% 0.08% 0.04% 0.10% 0.00% 0.06% 0.01% 0.03% 0.05% 0.35% 0.17% 0.09% 0.06% 0.00% 0.06% 0.05% 0.17% 0.12% 0.50%Mid-City 21.63% 0.27% 0.07% 0.05% 0.16% 0.01% 0.07% 0.04% 0.03% 0.14% 0.04% 0.01% 0.02% 0.01% 0.06% 0.01% 0.15% 0.00% 0.07% 0.02% 0.50% 0.12% 0.09% 0.55% 0.11% 0.02% 0.29% 2.38% 0.19% 0.69%Southeastern San Diego 24.52% 0.17% 0.05% 0.03% 0.07% 0.00% 0.00% 0.00% 0.01% 0.06% 0.01% 0.03% 0.01% 0.01% 0.01% 0.01% 0.07% 0.02% 0.03% 0.00% 0.09% 0.08% 0.03% 0.12% 0.01% 0.03% 0.55% 0.27% 0.01% 6.36%
East Region 13.22% 0.16% 0.17% 0.07% 0.26% 0.00% 0.04% 0.07% 0.04% 0.10% 0.07% 0.02% 0.04% 0.04% 0.14% 0.01% 0.03% 0.02% 0.01% 0.23% 0.13% 0.12% 0.06% 0.10% 0.01% 0.04% 0.05% 0.24% 0.03% 0.94%Alpine 8.13% 0.04% 0.36% 0.06% 0.42% 0.00% 0.00% 0.00% 0.00% 0.26% 0.00% 0.00% 0.00% 0.56% 0.28% 0.00% 0.17% 0.00% 0.00% 0.36% 0.22% 0.00% 0.00% 0.00% 0.00% 0.00% 0.00% 0.00% 0.00% 0.00%El Cajon 13.49% 0.09% 0.13% 0.07% 0.19% 0.01% 0.01% 0.00% 0.02% 0.05% 0.01% 0.04% 0.08% 0.04% 0.12% 0.00% 0.08% 0.00% 0.00% 0.45% 0.10% 0.06% 0.02% 0.04% 0.00% 0.00% 0.03% 0.25% 0.00% 0.68%Harbison-Crest 5.11% 0.09% 0.40% 0.00% 0.17% 0.00% 0.08% 0.00% 0.00% 1.08% 0.00% 0.00% 0.00% 0.00% 0.00% 0.00% 0.00% 0.00% 0.00% 0.13% 0.00% 0.00% 0.00% 0.07% 0.00% 0.00% 0.07% 0.01% 0.00% 0.44%Jamul 16.48% 0.08% 0.55% 0.07% 0.44% 0.03% 0.09% 0.75% 0.00% 0.00% 0.00% 0.00% 0.00% 0.00% 0.09% 0.00% 0.00% 0.00% 0.20% 0.03% 0.16% 0.01% 0.05% 0.04% 0.00% 0.03% 0.17% 0.23% 0.41% 1.53%La Mesa 11.05% 0.46% 0.15% 0.09% 0.34% 0.00% 0.03% 0.19% 0.06% 0.18% 0.26% 0.08% 0.16% 0.04% 0.36% 0.00% 0.03% 0.00% 0.00% 0.05% 0.19% 0.31% 0.18% 0.53% 0.00% 0.14% 0.00% 0.24% 0.12% 0.47%Laguna-Pine Valley 8.88% 0.10% 0.00% 0.00% 0.00% 0.00% 0.29% 0.00% 0.00% 0.00% 0.11% 0.00% 0.00% 0.00% 0.00% 0.00% 0.00% 0.00% 0.00% 0.00% 0.06% 0.10% 0.00% 0.00% 0.00% 0.00% 0.00% 0.13% 0.00% 0.57%Lakeside 7.69% 0.06% 0.09% 0.03% 0.17% 0.00% 0.07% 0.00% 0.00% 0.00% 0.00% 0.00% 0.02% 0.00% 0.18% 0.10% 0.01% 0.19% 0.00% 0.12% 0.16% 0.10% 0.13% 0.01% 0.00% 0.07% 0.01% 0.03% 0.00% 0.64%Lemon Grove 20.45% 0.21% 0.05% 0.00% 0.31% 0.00% 0.02% 0.00% 0.00% 0.07% 0.18% 0.00% 0.00% 0.00% 0.00% 0.00% 0.00% 0.00% 0.03% 0.19% 0.18% 0.14% 0.00% 0.00% 0.11% 0.04% 0.34% 1.30% 0.00% 1.23%Mountain Empire 23.70% 0.00% 0.00% 0.00% 0.29% 0.00% 0.03% 0.00% 0.00% 0.00% 0.00% 0.00% 0.00% 0.09% 0.00% 0.00% 0.00% 0.00% 0.00% 0.06% 0.06% 0.00% 0.00% 0.00% 0.00% 0.35% 0.00% 0.00% 0.00% 0.00%Santee 6.97% 0.25% 0.27% 0.00% 0.22% 0.00% 0.04% 0.06% 0.08% 0.07% 0.09% 0.00% 0.00% 0.00% 0.10% 0.00% 0.00% 0.00% 0.00% 0.28% 0.15% 0.11% 0.10% 0.00% 0.00% 0.00% 0.04% 0.02% 0.00% 0.89%Spring Valley 20.29% 0.14% 0.17% 0.15% 0.35% 0.00% 0.04% 0.04% 0.09% 0.03% 0.08% 0.00% 0.00% 0.00% 0.08% 0.00% 0.00% 0.00% 0.00% 0.16% 0.10% 0.15% 0.00% 0.07% 0.00% 0.03% 0.05% 0.21% 0.00% 2.02%
North Central Region 6.77% 0.46% 0.22% 0.33% 0.52% 0.00% 0.11% 0.19% 0.12% 0.31% 0.08% 0.08% 0.11% 0.07% 0.71% 0.15% 0.53% 0.12% 0.22% 0.14% 2.11% 0.32% 0.57% 0.06% 0.11% 0.07% 0.12% 1.04% 0.62% 2.10%Coastal 5.32% 0.85% 0.40% 0.70% 1.06% 0.03% 0.21% 0.85% 0.14% 0.39% 0.08% 0.20% 0.07% 0.00% 0.52% 0.03% 0.24% 0.01% 0.01% 0.17% 0.71% 0.12% 0.21% 0.02% 0.00% 0.01% 0.00% 0.11% 0.01% 0.42%Del Mar-Mira Mesa 5.01% 0.34% 0.18% 0.13% 0.46% 0.00% 0.20% 0.12% 0.16% 0.33% 0.10% 0.02% 0.06% 0.08% 1.22% 0.23% 0.90% 0.19% 0.50% 0.16% 3.79% 0.38% 1.15% 0.07% 0.27% 0.06% 0.16% 2.07% 1.49% 5.09%Elliott-Navajo 5.53% 0.30% 0.17% 0.18% 0.55% 0.00% 0.03% 0.01% 0.01% 0.51% 0.15% 0.05% 0.24% 0.00% 0.54% 0.00% 0.25% 0.04% 0.08% 0.21% 0.56% 0.24% 0.21% 0.04% 0.00% 0.06% 0.04% 0.58% 0.07% 1.16%Kearny Mesa 9.84% 0.52% 0.23% 0.29% 0.31% 0.00% 0.05% 0.10% 0.07% 0.10% 0.04% 0.07% 0.05% 0.02% 0.18% 0.09% 0.31% 0.24% 0.17% 0.10% 0.98% 0.34% 0.32% 0.12% 0.11% 0.12% 0.25% 1.23% 0.12% 1.33%Miramar 10.72% 0.00% 0.54% 0.00% 0.19% 0.00% 0.00% 0.00% 0.00% 0.04% 0.00% 0.00% 0.00% 0.00% 0.04% 0.00% 0.19% 0.00% 0.00% 0.00% 0.02% 0.75% 0.00% 0.00% 0.17% 0.00% 0.00% 0.22% 0.00% 0.80%Peninsula 7.42% 0.20% 0.07% 0.73% 0.27% 0.00% 0.03% 0.08% 0.24% 0.07% 0.04% 0.06% 0.01% 0.06% 0.21% 0.00% 0.11% 0.00% 0.00% 0.03% 0.29% 0.28% 0.08% 0.03% 0.00% 0.09% 0.00% 0.02% 0.11% 0.80%University 6.00% 0.67% 0.23% 0.38% 0.83% 0.02% 0.13% 0.17% 0.14% 0.70% 0.06% 0.19% 0.36% 0.42% 1.88% 0.58% 1.43% 0.03% 0.34% 0.16% 6.94% 0.53% 1.28% 0.02% 0.08% 0.06% 0.05% 0.66% 1.84% 0.80%
North Coastal Region 9.13% 0.35% 0.15% 0.13% 0.42% 0.00% 0.08% 0.06% 0.04% 0.17% 0.08% 0.06% 0.02% 0.03% 0.16% 0.04% 0.13% 0.01% 0.07% 0.07% 0.32% 0.22% 0.13% 0.05% 0.00% 0.03% 0.00% 0.14% 0.17% 0.81%Carlsbad 6.31% 0.42% 0.22% 0.18% 0.52% 0.00% 0.08% 0.05% 0.08% 0.32% 0.01% 0.17% 0.02% 0.05% 0.15% 0.04% 0.19% 0.01% 0.16% 0.17% 0.49% 0.25% 0.22% 0.08% 0.00% 0.05% 0.00% 0.23% 0.39% 0.50%Oceanside 12.26% 0.25% 0.11% 0.07% 0.27% 0.00% 0.09% 0.02% 0.01% 0.10% 0.22% 0.02% 0.04% 0.01% 0.23% 0.02% 0.08% 0.00% 0.07% 0.08% 0.21% 0.23% 0.09% 0.08% 0.00% 0.06% 0.00% 0.15% 0.08% 1.59%Pendleton 5.67% 0.11% 0.04% 0.13% 0.25% 0.00% 0.00% 0.00% 0.00% 0.03% 0.00% 0.00% 0.00% 0.00% 0.00% 0.00% 0.02% 0.00% 0.00% 0.03% 0.09% 0.24% 0.19% 0.15% 0.02% 0.00% 0.00% 0.02% 0.00% 0.37%San Dieguito 5.32% 0.73% 0.27% 0.24% 0.83% 0.01% 0.10% 0.20% 0.10% 0.22% 0.03% 0.06% 0.02% 0.04% 0.18% 0.10% 0.24% 0.00% 0.02% 0.02% 0.55% 0.33% 0.10% 0.00% 0.00% 0.01% 0.00% 0.10% 0.11% 0.16%Vista 12.30% 0.13% 0.08% 0.06% 0.22% 0.00% 0.05% 0.02% 0.00% 0.12% 0.02% 0.03% 0.02% 0.02% 0.06% 0.03% 0.09% 0.01% 0.01% 0.03% 0.15% 0.07% 0.08% 0.00% 0.00% 0.01% 0.00% 0.11% 0.16% 0.72%
North Inland Region 9.87% 0.20% 0.10% 0.05% 0.30% 0.01% 0.11% 0.08% 0.02% 0.20% 0.06% 0.05% 0.05% 0.05% 0.42% 0.08% 0.27% 0.05% 0.27% 0.12% 0.78% 0.27% 0.30% 0.01% 0.01% 0.02% 0.04% 0.58% 0.29% 1.45%Anza-Borrego Springs 6.71% 0.00% 0.00% 0.00% 0.00% 0.00% 0.37% 0.00% 0.00% 0.00% 0.00% 0.00% 0.00% 0.00% 0.00% 0.00% 0.00% 0.00% 0.00% 0.00% 0.00% 0.00% 0.00% 0.00% 0.00% 0.00% 0.00% 0.00% 0.00% 0.00%Escondido 16.25% 0.18% 0.07% 0.02% 0.19% 0.00% 0.17% 0.02% 0.02% 0.04% 0.11% 0.00% 0.02% 0.07% 0.24% 0.00% 0.05% 0.00% 0.05% 0.03% 0.25% 0.22% 0.09% 0.00% 0.01% 0.01% 0.10% 0.43% 0.14% 1.00%Fallbrook 11.08% 0.08% 0.16% 0.00% 0.36% 0.00% 0.04% 0.27% 0.02% 0.04% 0.17% 0.01% 0.05% 0.00% 0.00% 0.00% 0.00% 0.00% 0.00% 0.01% 0.08% 0.14% 0.01% 0.01% 0.00% 0.00% 0.00% 0.06% 0.03% 0.32%North San Diego 4.94% 0.20% 0.14% 0.18% 0.53% 0.01% 0.08% 0.10% 0.01% 0.51% 0.00% 0.13% 0.17% 0.06% 1.24% 0.34% 0.83% 0.24% 0.82% 0.41% 2.03% 0.40% 0.78% 0.02% 0.01% 0.06% 0.03% 0.93% 0.77% 3.11%Palomar-Julian 6.10% 0.40% 0.00% 0.00% 0.34% 0.00% 0.11% 0.17% 0.00% 0.83% 0.00% 0.00% 0.09% 0.00% 0.00% 0.00% 0.00% 0.00% 0.00% 0.00% 0.11% 0.21% 0.11% 0.00% 0.00% 0.09% 0.00% 0.00% 0.00% 0.15%Pauma 8.43% 0.05% 0.05% 0.00% 0.03% 0.00% 0.00% 0.00% 0.00% 0.00% 0.00% 0.00% 0.27% 0.00% 0.00% 0.00% 0.00% 0.00% 0.00% 0.00% 0.00% 0.00% 0.00% 0.00% 0.00% 0.00% 0.00% 0.00% 0.00% 0.35%Poway 4.61% 0.32% 0.11% 0.01% 0.41% 0.06% 0.09% 0.10% 0.03% 0.48% 0.03% 0.01% 0.03% 0.08% 0.57% 0.12% 0.61% 0.04% 0.59% 0.06% 1.72% 0.48% 0.46% 0.03% 0.02% 0.01% 0.00% 0.88% 0.55% 2.04%Ramona 9.39% 0.27% 0.00% 0.00% 0.25% 0.00% 0.09% 0.04% 0.12% 0.03% 0.02% 0.00% 0.01% 0.00% 0.00% 0.00% 0.00% 0.00% 0.04% 0.00% 0.06% 0.00% 0.50% 0.00% 0.00% 0.00% 0.00% 0.16% 0.02% 0.07%San Marcos 10.10% 0.14% 0.08% 0.03% 0.16% 0.02% 0.09% 0.00% 0.03% 0.04% 0.02% 0.10% 0.00% 0.03% 0.18% 0.00% 0.00% 0.00% 0.04% 0.14% 0.28% 0.20% 0.15% 0.02% 0.00% 0.03% 0.03% 0.65% 0.08% 1.36%Valley Center 6.96% 0.29% 0.33% 0.00% 0.21% 0.00% 0.13% 0.20% 0.00% 0.06% 0.06% 0.11% 0.00% 0.00% 0.00% 0.00% 0.00% 0.00% 0.05% 0.12% 0.22% 0.28% 0.00% 0.00% 0.00% 0.00% 0.00% 0.74% 0.00% 0.31%
South Region 30.63% 0.15% 0.04% 0.05% 0.14% 0.00% 0.01% 0.02% 0.02% 0.04% 0.01% 0.02% 0.01% 0.02% 0.04% 0.05% 0.00% 0.01% 0.02% 0.08% 0.23% 0.25% 0.33% 0.03% 0.02% 0.01% 0.04% 0.11% 0.03% 4.09%Chula Vista 34.38% 0.11% 0.04% 0.04% 0.10% 0.00% 0.04% 0.01% 0.00% 0.03% 0.01% 0.01% 0.00% 0.07% 0.02% 0.00% 0.00% 0.01% 0.01% 0.03% 0.08% 0.08% 0.04% 0.01% 0.09% 0.00% 0.01% 0.06% 0.00% 1.18%Coronado 7.80% 0.64% 0.00% 0.08% 0.47% 0.00% 0.00% 0.15% 0.24% 0.03% 0.02% 0.03% 0.03% 0.00% 0.18% 0.00% 0.00% 0.00% 0.00% 0.09% 0.49% 0.09% 0.07% 0.00% 0.00% 0.00% 0.00% 0.11% 0.03% 0.62%National City 30.27% 0.03% 0.03% 0.02% 0.17% 0.00% 0.02% 0.00% 0.00% 0.03% 0.00% 0.03% 0.00% 0.00% 0.00% 0.12% 0.03% 0.04% 0.01% 0.01% 0.26% 0.05% 0.01% 0.13% 0.00% 0.00% 0.11% 0.09% 0.00% 8.33%South Bay 37.04% 0.17% 0.02% 0.01% 0.15% 0.00% 0.01% 0.01% 0.01% 0.05% 0.00% 0.01% 0.00% 0.01% 0.02% 0.00% 0.00% 0.00% 0.01% 0.02% 0.23% 0.23% 0.07% 0.01% 0.00% 0.04% 0.04% 0.08% 0.01% 3.48%Sweetwater 25.30% 0.13% 0.09% 0.10% 0.08% 0.00% 0.00% 0.02% 0.03% 0.06% 0.01% 0.03% 0.02% 0.01% 0.06% 0.13% 0.00% 0.00% 0.05% 0.22% 0.29% 0.53% 1.01% 0.03% 0.00% 0.00% 0.04% 0.21% 0.08% 5.87%
San Diego County 14.51% 0.29% 0.14% 0.13% 0.34% 0.01% 0.07% 0.08% 0.05% 0.17% 0.06% 0.05% 0.05% 0.04% 0.28% 0.06% 0.20% 0.04% 0.12% 0.11% 0.71% 0.22% 0.26% 0.08% 0.03% 0.04% 0.09% 0.53% 0.23% 1.96%
Language Spoken at Home for the Bilingual* Population 5 Years and Over
Page 16

Source: U.S. Census Bureau; 2011-2015 American Community Survey 5-Year Estimates, Table B16001.
GeographyOther Pacific
Island Languages
Navajo
Other Native
American Languages
Hungarian Arabic Hebrew African
Languages Other and
Unspecified
Central Region 0.17% 0.00% 0.01% 0.01% 0.10% 0.03% 0.72% 0.02%Central San Diego 0.03% 0.01% 0.01% 0.01% 0.16% 0.03% 0.23% 0.02%Mid-City 0.04% 0.00% 0.02% 0.01% 0.11% 0.07% 1.61% 0.03%Southeastern San Diego 0.46% 0.00% 0.00% 0.00% 0.04% 0.00% 0.32% 0.00%
East Region 0.31% 0.00% 0.04% 0.01% 1.27% 0.02% 0.15% 1.07%Alpine 0.16% 0.00% 0.03% 0.00% 0.29% 0.00% 0.00% 0.13%El Cajon 0.32% 0.00% 0.05% 0.02% 2.70% 0.01% 0.21% 2.81%Harbison-Crest 0.00% 0.00% 0.09% 0.04% 0.47% 0.00% 0.00% 0.00%Jamul 0.14% 0.00% 0.00% 0.00% 0.58% 0.00% 0.00% 0.74%La Mesa 0.29% 0.00% 0.00% 0.02% 0.46% 0.11% 0.25% 0.12%Laguna-Pine Valley 0.10% 0.00% 0.44% 0.00% 0.00% 0.00% 0.00% 0.00%Lakeside 0.10% 0.00% 0.11% 0.00% 1.02% 0.00% 0.00% 0.48%Lemon Grove 0.42% 0.00% 0.00% 0.00% 0.02% 0.00% 0.43% 0.02%Mountain Empire 0.84% 0.00% 0.18% 0.00% 0.24% 0.00% 0.00% 0.24%Santee 0.25% 0.00% 0.00% 0.01% 0.60% 0.00% 0.13% 0.03%Spring Valley 0.52% 0.00% 0.00% 0.00% 1.39% 0.03% 0.13% 1.12%
North Central Region 0.23% 0.00% 0.01% 0.03% 0.38% 0.15% 0.10% 0.06%Coastal 0.07% 0.00% 0.00% 0.00% 0.37% 0.31% 0.02% 0.02%Del Mar-Mira Mesa 0.43% 0.00% 0.00% 0.03% 0.35% 0.14% 0.05% 0.10%Elliott-Navajo 0.14% 0.00% 0.00% 0.07% 0.60% 0.10% 0.07% 0.03%Kearny Mesa 0.16% 0.00% 0.06% 0.02% 0.26% 0.08% 0.25% 0.09%Miramar 0.78% 0.00% 0.00% 0.00% 0.00% 0.00% 0.00% 0.00%Peninsula 0.05% 0.00% 0.00% 0.02% 0.34% 0.00% 0.02% 0.02%University 0.30% 0.00% 0.00% 0.07% 0.53% 0.41% 0.08% 0.00%
North Coastal Region 0.15% 0.01% 0.00% 0.02% 0.10% 0.02% 0.02% 0.02%Carlsbad 0.19% 0.00% 0.00% 0.02% 0.10% 0.04% 0.00% 0.04%Oceanside 0.25% 0.04% 0.00% 0.01% 0.10% 0.02% 0.04% 0.00%Pendleton 0.02% 0.00% 0.00% 0.00% 0.00% 0.00% 0.05% 0.00%San Dieguito 0.04% 0.00% 0.00% 0.01% 0.10% 0.01% 0.02% 0.00%Vista 0.10% 0.00% 0.00% 0.07% 0.13% 0.03% 0.01% 0.05%
North Inland Region 0.15% 0.00% 0.02% 0.03% 0.28% 0.03% 0.07% 0.08%Anza-Borrego Springs 0.00% 0.00% 0.00% 0.00% 0.00% 0.00% 0.00% 0.00%Escondido 0.15% 0.01% 0.00% 0.03% 0.27% 0.02% 0.02% 0.03%Fallbrook 0.11% 0.00% 0.00% 0.02% 0.09% 0.00% 0.02% 0.07%North San Diego 0.14% 0.00% 0.00% 0.02% 0.58% 0.12% 0.19% 0.09%Palomar-Julian 0.00% 0.00% 0.45% 0.00% 0.00% 0.00% 0.00% 0.00%Pauma 2.74% 0.00% 0.24% 0.00% 0.00% 0.30% 0.00% 0.00%Poway 0.09% 0.00% 0.02% 0.11% 0.40% 0.02% 0.12% 0.24%Ramona 0.00% 0.00% 0.00% 0.00% 0.00% 0.00% 0.00% 0.11%San Marcos 0.11% 0.00% 0.00% 0.02% 0.14% 0.00% 0.05% 0.02%Valley Center 0.20% 0.02% 0.15% 0.00% 0.02% 0.00% 0.00% 0.10%
South Region 0.22% 0.01% 0.01% 0.00% 0.14% 0.01% 0.09% 0.01%Chula Vista 0.14% 0.00% 0.00% 0.00% 0.07% 0.00% 0.01% 0.03%Coronado 0.12% 0.00% 0.00% 0.00% 0.06% 0.04% 0.11% 0.00%National City 0.19% 0.00% 0.00% 0.00% 0.11% 0.00% 0.08% 0.00%South Bay 0.24% 0.03% 0.01% 0.00% 0.15% 0.02% 0.20% 0.01%Sweetwater 0.29% 0.00% 0.01% 0.01% 0.23% 0.00% 0.03% 0.00%
San Diego County 0.20% 0.00% 0.01% 0.02% 0.37% 0.05% 0.18% 0.19%
Language Spoken at Home for the Bilingual* Population 5 Years and Over [Continued]
0% 10% 20% 30% 40% 50% 60% 70% 80% 90% 100%
Central Region
East Region
North CentralRegion
North CoastalRegion
North InlandRegion
South Region
San DiegoCounty
Language Spoken at Home for the Bilingual* Population 5 Years and Over, 2015
Spanish
French
Italian
Portuguese
German
Yiddish
Other West Germanic Languages
Scandinavian
Greek
Russian
Polish
Serbo-Croatian
Other Slavic Languages
Armenian
Persian
Gujarati
Hindi
Urdu
Other Indic Languages
Other Indo-European Languages
Chinese
Japanese
Korean
Mon-Kmer, Cambodian
Hmong
Thai
Laotian
Vietnamese
Other Asian Languages
Tagalog
Other Pacific Island Languages
Navajo
Other Native American Languages
Hungarian
Arabic
Hebrew
African Languages
Other and Unspecified
*In this case, bilingual* refers to those who speak English very well and speak another language at home.Source: U.S. Census Bureau, 2011-2015 American Community Survey 5-Year Estimates, Table B16001.Prepared by: County of San Diego, Health and Human Services Agency, Public Health Services, Community Health Statistics Unit, 2017.
Page 17

Source: U.S. Census Bureau; 2011-2015 American Community Survey 5-Year Estimates, Table B14002, S1401.
Geography Population Ages 4-18* Enrolled in K-12 Public K-12 (%) Private K-12 (%)Central Region 87,660 75,181 95.2% 4.8%
Central San Diego 17,283 14,768 91.8% 8.2%Mid-City 33,761 28,060 95.3% 4.7%Southeastern San Diego 36,615 32,353 96.7% 3.3%
East Region 95,509 84,515 92.1% 7.9%Alpine 2,764 2,517 91.9% 8.1%El Cajon 26,773 23,631 95.4% 4.6%Harbison-Crest 2,656 2,337 94.9% 5.1%Jamul 3,787 3,224 82.3% 17.7%La Mesa 9,659 8,323 92.5% 7.5%Laguna-Pine Valley 1,112 979 87.9% 12.1%Lakeside 12,214 11,201 87.2% 12.8%Lemon Grove 6,705 6,074 95.4% 4.6%Mountain Empire 1,475 1,313 87.1% 12.9%Santee 10,296 9,162 93.5% 6.5%Spring Valley 18,068 15,754 90.7% 9.3%
North Central Region 97,832 82,424 86.9% 13.1%Coastal 7,618 6,660 72.7% 27.3%Del Mar-Mira Mesa 34,269 30,423 90.0% 10.0%Elliott-Navajo 16,590 14,074 89.1% 10.9%Kearny Mesa 24,604 20,328 87.5% 12.5%Miramar 980 679 87.9% 12.1%Peninsula 8,548 6,038 87.9% 12.1%University 5,224 4,222 75.2% 24.8%
North Coastal Region 97,679 82,878 92.1% 7.9%Carlsbad 22,401 19,500 91.1% 8.9%Oceanside 31,229 27,065 94.4% 5.6%Pendleton 6,916 3,551 93.2% 6.8%San Dieguito 17,899 15,701 86.0% 14.0%Vista 19,234 17,061 95.2% 4.8%
North Inland Region 119,630 105,501 92.3% 7.7%Anza-Borrego Springs 389 382 78.3% 21.7%Escondido 34,916 30,481 93.4% 6.6%Fallbrook 7,901 6,911 90.1% 9.9%North San Diego 23,683 21,123 90.3% 9.7%Palomar-Julian 898 758 98.3% 1.7%Pauma 1,690 1,438 93.0% 7.0%Poway 18,574 16,476 90.7% 9.3%Ramona 7,841 7,074 95.9% 4.1%San Marcos 19,476 16,890 92.9% 7.1%Valley Center 4,263 3,968 97.1% 2.9%
South Region 106,932 94,999 94.0% 6.0%Chula Vista 24,069 21,655 96.7% 3.3%Coronado 3,921 3,314 88.5% 11.5%National City 11,973 10,508 97.6% 2.4%South Bay 32,717 29,015 96.5% 3.5%Sweetwater 34,254 30,507 89.1% 10.9%
San Diego County 605,241 525,498 92.1% 7.9%*Population ages 4-18 refers to those who would be eligible for Kindergarten to 12th grade. This estimate is based on the assumption that there is an equal distribution among specific age groups.
School Enrollment (K-12)
95.2%92.1%
86.9%92.1% 92.3% 94.0% 92.1%
4.8%7.9%
13.1%7.9% 7.7% 6.0% 7.9%
0%
10%
20%
30%
40%
50%
60%
70%
80%
90%
100%
Central Region East Region North CentralRegion
North CoastalRegion
North Inland Region South Region San Diego County
Type of School Enrollment Among Students in K-12 by HHSA Region, 2015Public K-12 (%) Private K-12 (%)
Source: U.S. Census Bureau, 2011-2015 American Community Survey 5-Year Estimates, Table B14002, S1401.Prepared by: County of San Diego, Health and Human Services Agency, Public Health Services, Community Health Statistics Unit, 2017.
Page 18

Source: U.S. Census Bureau; 2011-2015 American Community Survey 5-Year Estimates, Table DP02.
Geography Population Age 25+
Not a High School Graduate
High School Graduate
Some College or AA Bachelor's Degree Graduate Degree
Central Region 331,075 20.4% 19.7% 29.7% 19.5% 10.6%Central San Diego 128,715 13.2% 14.0% 26.7% 27.9% 18.2%Mid-City 102,005 23.8% 21.5% 30.0% 16.1% 8.6%Southeastern San Diego 100,355 26.3% 25.3% 33.3% 12.2% 3.0%
East Region 320,812 13.0% 25.6% 36.7% 16.3% 8.5%Alpine 10,986 9.5% 22.0% 40.5% 17.0% 11.0%El Cajon 83,246 17.9% 28.4% 32.5% 14.4% 6.8%Harbison-Crest 11,254 7.7% 29.4% 42.2% 13.3% 7.5%Jamul 13,079 16.5% 22.6% 31.2% 16.6% 13.2%La Mesa 43,006 8.8% 18.8% 36.8% 23.4% 12.2%Laguna-Pine Valley 3,751 6.8% 26.8% 41.3% 16.2% 8.9%Lakeside 37,607 9.2% 30.7% 39.6% 13.9% 6.6%Lemon Grove 20,516 18.1% 29.2% 37.8% 10.7% 4.2%Mountain Empire 4,761 24.6% 25.5% 29.8% 12.4% 7.6%Santee 35,708 7.4% 25.3% 40.8% 17.9% 8.7%Spring Valley 56,898 13.4% 22.5% 37.5% 17.1% 9.5%
North Central Region 430,045 5.5% 13.1% 27.4% 30.7% 23.3%Coastal 56,945 2.0% 8.2% 22.1% 39.9% 27.8%Del Mar-Mira Mesa 114,819 5.2% 10.5% 24.1% 31.9% 28.4%Elliott-Navajo 63,299 4.0% 14.8% 32.6% 28.9% 19.6%Kearny Mesa 113,848 10.0% 18.9% 31.4% 25.3% 14.4%Miramar 1,223 2.5% 27.3% 57.8% 9.4% 3.0%Peninsula 42,261 3.8% 14.7% 30.5% 30.7% 20.2%University 37,650 2.2% 6.2% 20.0% 33.2% 38.5%
North Coastal Region 342,332 11.5% 18.3% 32.4% 23.1% 14.6%Carlsbad 86,049 4.6% 12.3% 31.5% 30.2% 21.3%Oceanside 108,400 15.3% 22.6% 36.8% 16.9% 8.3%Pendleton 10,080 1.2% 29.6% 48.3% 15.4% 5.6%San Dieguito 69,697 5.0% 9.8% 24.1% 35.0% 26.1%Vista 68,106 22.4% 25.9% 32.9% 12.9% 5.9%
North Inland Region 394,669 14.0% 17.9% 30.9% 23.5% 13.8%Anza-Borrego Springs 2,730 18.8% 30.9% 31.3% 11.3% 7.7%Escondido 108,217 23.8% 19.5% 32.8% 16.1% 7.7%Fallbrook 34,273 15.4% 21.0% 35.8% 19.1% 8.7%North San Diego 76,351 3.5% 11.3% 24.6% 35.6% 24.9%Palomar-Julian 4,216 13.2% 28.4% 34.0% 13.0% 11.4%Pauma 4,255 13.9% 22.4% 32.3% 21.4% 10.0%Poway 60,280 5.0% 13.4% 26.4% 32.1% 23.0%Ramona 24,540 13.7% 26.2% 36.3% 16.0% 7.9%San Marcos 63,317 17.9% 19.5% 33.7% 20.3% 8.6%Valley Center 16,490 13.2% 22.0% 34.2% 21.1% 9.5%
South Region 309,501 22.5% 21.8% 32.2% 16.1% 7.4%Chula Vista 75,128 29.1% 25.5% 31.4% 9.8% 4.3%Coronado 16,223 2.0% 12.0% 28.0% 30.0% 28.0%National City 36,801 28.3% 27.6% 31.5% 10.2% 2.3%South Bay 89,613 30.9% 24.0% 30.7% 10.8% 3.7%Sweetwater 91,736 10.3% 15.9% 35.5% 26.3% 12.0%
San Diego County 2,128,434 14.0% 19.0% 31.3% 22.1% 13.6%
Refers to the highest level of education completed in terms of the highest degree or the highest level of schooling completed.
Education Attainment Among Population 25 Years and Older
20.4%13.0%
5.5%11.5% 14.0%
22.5%14.0%
19.7%25.6%
13.1%
18.3%17.9%
21.8%
19.0%
29.7% 36.7%
27.4%
32.4% 30.9%
32.2%
31.3%
19.5%16.3%
30.7%
23.1% 23.5%
16.1%
22.1%
10.6% 8.5%
23.3%14.6% 13.8%
7.4%13.6%
Central Region East Region North CentralRegion
North CoastalRegion
North InlandRegion
South Region San DiegoCounty
Education Attainment Among Population 25 Years and Older by HHSA Region, 2015
Not a High School Graduate High School Graduate Some College or AA
Bachelor's Degree Graduate Degree
Source: U.S. Census Bureau, 2011-2015 American Community Survey 5-Year Estimates, Table DP02.Prepared by: County of San Diego, Health and Human Services Agency, Public Health Services, Community Health Statistics Unit, 2017.
Page 19

Source: U.S. Census Bureau; 2011-2015 American Community Survey 5-Year Estimates, Table DP02.
Geography Population Age 15+ Single, Never
Married Married Separated Widowed Divorced
Central Region 414,547 47.2% 35.5% 2.6% 4.2% 10.6%Central San Diego 150,223 51.9% 30.1% 2.2% 3.3% 12.5%Mid-City 136,792 49.0% 34.1% 2.8% 4.0% 10.2%Southeastern San Diego 127,532 39.7% 43.3% 2.9% 5.5% 8.7%
East Region 389,980 32.5% 47.2% 1.9% 5.9% 12.5%Alpine 13,280 28.6% 51.7% 1.8% 8.7% 9.2%El Cajon 103,576 35.9% 44.0% 1.9% 6.2% 12.0%Harbison-Crest 13,175 22.4% 56.8% 1.5% 7.4% 12.0%Jamul 16,213 35.4% 50.7% 2.1% 2.7% 9.0%La Mesa 50,590 32.8% 43.1% 1.5% 7.4% 15.2%Laguna-Pine Valley 4,657 29.1% 52.2% 2.1% 3.5% 13.1%Lakeside 45,180 28.3% 52.9% 1.6% 5.1% 12.0%Lemon Grove 25,135 37.6% 41.3% 2.1% 5.0% 14.0%Mountain Empire 5,788 29.6% 47.8% 1.9% 9.0% 11.7%Santee 42,824 29.4% 50.0% 1.8% 5.2% 13.6%Spring Valley 69,562 32.6% 47.7% 2.6% 5.5% 11.7%
North Central Region 526,567 37.9% 46.5% 1.3% 4.4% 10.0%Coastal 67,992 45.6% 39.3% 1.3% 4.0% 9.7%Del Mar-Mira Mesa 135,351 29.4% 57.8% 1.2% 3.5% 8.1%Elliott-Navajo 74,059 28.4% 53.8% 1.2% 5.7% 10.8%Kearny Mesa 139,003 39.9% 41.8% 1.6% 5.0% 11.7%Miramar 4,081 68.9% 28.9% 0.1% 0.0% 2.1%Peninsula 54,872 43.7% 38.6% 1.1% 4.2% 12.4%University 51,209 49.6% 37.8% 1.1% 4.0% 7.6%
North Coastal Region 423,795 32.5% 51.2% 1.4% 4.6% 10.3%Carlsbad 98,767 26.1% 56.1% 1.0% 5.3% 11.5%Oceanside 133,243 32.6% 48.8% 2.0% 5.1% 11.5%Pendleton 29,768 52.6% 45.2% 0.2% 0.0% 2.0%San Dieguito 79,230 28.7% 55.6% 1.2% 5.2% 9.4%Vista 82,787 36.5% 47.1% 1.3% 4.4% 10.7%
North Inland Region 471,347 28.7% 54.7% 1.6% 5.4% 9.6%Anza-Borrego Springs 3,080 22.7% 51.2% 1.3% 8.7% 16.0%Escondido 134,659 35.6% 48.0% 2.1% 4.6% 9.7%Fallbrook 40,436 25.7% 58.4% 2.1% 5.7% 8.1%North San Diego 88,728 24.7% 59.2% 1.2% 5.6% 9.2%Palomar-Julian 4,618 23.1% 54.8% 1.3% 6.8% 14.1%Pauma 5,192 28.1% 60.6% 1.4% 3.9% 6.0%Poway 70,815 24.0% 60.9% 1.1% 5.2% 8.8%Ramona 29,281 28.9% 54.2% 1.6% 5.1% 10.3%San Marcos 75,521 28.7% 52.6% 1.2% 6.9% 10.6%Valley Center 19,017 23.8% 59.0% 1.6% 5.1% 10.5%
South Region 391,497 35.3% 47.2% 2.8% 5.3% 9.4%Chula Vista 93,262 36.4% 42.5% 3.6% 6.5% 11.0%Coronado 20,848 32.3% 51.7% 1.4% 5.5% 9.1%National City 48,136 38.8% 42.2% 3.2% 6.2% 9.6%South Bay 115,154 37.8% 43.6% 3.6% 5.2% 9.7%Sweetwater 114,097 31.1% 55.8% 1.3% 4.1% 7.7%
San Diego County 2,617,733 35.6% 47.2% 1.9% 4.9% 10.3%
Marital status among population 15 years and older.
Marital Status
47.2%
32.5%37.9%
32.5%28.7%
35.3% 35.6%
35.5%
47.2%
46.5%51.2%
54.7%47.2% 47.2%
2.6%1.9%
1.3% 1.4% 1.6% 2.8% 1.9%4.2%
5.9%4.4% 4.6% 5.4% 5.3% 4.9%
10.6% 12.5% 10.0% 10.3% 9.6% 9.4% 10.3%
Central Region East Region North CentralRegion
North CoastalRegion
North InlandRegion
South Region San Diego County
Marital Status Among Population 15 Years and Olderby HHSA Region, 2015
Single, Never Married Married Separated Widowed Divorced
Source: U.S. Census Bureau, 2011-2015 American Community Survey 5-Year Estimates, Table DP02. Prepared by: County of San Diego, Health and Human Services Agency, Public Health Services, Community Health Statistics Unit, 2017.
Page 20

Source: U.S. Census Bureau; 2011-2015 American Community Survey 5-Year Estimates, Table S1101.
GeographyHouseholds with Own Children Under 18 yrs.
Old
Single Parent Households from Households with
Own Children Under 18
Single Father
Household
Single Mother
Household
Central Region 44,906 39.0% 9.1% 29.9%Central San Diego 10,807 37.6% 10.9% 26.7%Mid-City 16,957 42.3% 11.6% 30.7%Southeastern San Diego 17,142 36.7% 5.5% 31.2%
East Region 51,585 32.3% 9.7% 22.6%Alpine 1,593 31.3% 8.5% 22.8%El Cajon 14,224 36.0% 9.5% 26.5%Harbison-Crest 1,301 18.8% 8.0% 10.8%Jamul 1,712 13.7% 7.1% 6.5%La Mesa 6,233 34.9% 8.3% 26.5%Laguna-Pine Valley 423 22.9% 1.9% 21.0%Lakeside 6,616 27.3% 9.7% 17.6%Lemon Grove 3,264 39.8% 16.1% 23.7%Mountain Empire 523 39.0% 18.4% 20.7%Santee 6,057 29.2% 7.5% 21.7%Spring Valley 9,639 33.4% 11.1% 22.3%
North Central Region 60,485 22.1% 5.9% 16.3%Coastal 5,026 20.5% 5.9% 14.5%Del Mar-Mira Mesa 21,290 16.9% 4.5% 12.4%Elliott-Navajo 10,158 21.3% 5.4% 15.9%Kearny Mesa 14,685 29.3% 7.7% 21.5%Miramar 431 13.7% 0.0% 13.7%Peninsula 5,090 28.5% 8.6% 19.9%University 3,805 20.4% 4.5% 15.9%
North Coastal Region 56,033 24.6% 7.6% 17.0%Carlsbad 13,447 22.9% 7.3% 15.6%Oceanside 16,699 27.3% 9.9% 17.4%Pendleton 5,020 19.5% 2.1% 17.4%San Dieguito 10,845 20.4% 5.3% 15.1%Vista 10,022 29.5% 9.6% 19.9%
North Inland Region 66,607 22.9% 6.7% 16.1%Anza-Borrego Springs 380 34.7% 0.0% 34.7%Escondido 18,047 29.4% 9.0% 20.4%Fallbrook 4,154 29.0% 11.4% 17.6%North San Diego 15,123 16.9% 4.7% 12.2%Palomar-Julian 481 37.0% 7.7% 29.3%Pauma 842 20.4% 5.7% 14.7%Poway 11,433 17.1% 3.7% 13.4%Ramona 3,540 29.0% 10.9% 18.1%San Marcos 10,533 21.2% 5.5% 15.6%Valley Center 2,074 22.2% 9.6% 12.6%
South Region 55,063 32.3% 7.4% 24.9%Chula Vista 12,530 42.6% 10.4% 32.1%Coronado 2,232 26.4% 4.0% 22.4%National City 5,831 40.6% 9.4% 31.2%South Bay 15,367 37.5% 8.5% 29.0%Sweetwater 19,103 19.5% 4.2% 15.3%
San Diego County 334,679 28.2% 7.6% 20.6%A child under 18 years old who is a son or daughter by birth, marriage (a stepchild), or adoption.
Single Parent Households
39.0%
32.3%
22.1% 24.6% 22.9%
32.3%28.2%
0%
10%
20%
30%
40%
50%
60%
70%
80%
90%
100%
Central Region East Region North CentralRegion
North CoastalRegion
North InlandRegion
South Region San Diego County
Percent of Single Parent Household by HHSA Region, 2015Central Region East Region North Central Region North Coastal RegionNorth Inland Region South Region San Diego County
Source: U.S. Census Bureau, 2011-2015 American Community Survey 5-Year Estimates, Table S1101.Prepared by: County of San Diego, Health and Human Services Agency, Public Health Services, Community Health Statistics Unit, 2017.
Page 21

Source: U.S. Census Bureau; 2011-2015 American Community Survey 5-Year Estimates, Table DP04.
Geography Occupied Housing Units No vehicle 1 vehicle 2 vehicles 3+ vehicles
Central Region 176,377 11.7% 39.9% 32.8% 15.6%Central San Diego 76,359 13.9% 47.3% 31.1% 7.8%Mid-City 57,011 12.2% 39.4% 33.2% 15.2%Southeastern San Diego 43,007 7.3% 27.5% 35.2% 30.0%
East Region 161,962 6.2% 30.2% 37.9% 25.7%Alpine 5,667 4.9% 25.0% 37.2% 32.9%El Cajon 41,823 8.0% 37.1% 34.2% 20.7%Harbison-Crest 5,444 2.1% 23.8% 37.4% 36.8%Jamul 4,792 1.6% 11.4% 40.7% 46.2%La Mesa 24,715 9.0% 35.9% 39.1% 16.0%Laguna-Pine Valley 1,928 1.8% 21.8% 39.8% 36.5%Lakeside 19,491 4.1% 28.2% 39.0% 28.7%Lemon Grove 9,746 7.8% 25.8% 39.4% 27.0%Mountain Empire 2,277 3.4% 29.6% 32.9% 34.1%Santee 18,275 2.6% 29.3% 37.9% 30.2%Spring Valley 27,804 6.8% 24.7% 40.9% 27.5%
North Central Region 237,488 4.6% 34.8% 41.8% 18.8%Coastal 35,045 5.5% 39.9% 39.1% 15.5%Del Mar-Mira Mesa 55,425 2.3% 25.0% 46.5% 26.1%Elliott-Navajo 35,131 3.5% 30.2% 45.8% 20.4%Kearny Mesa 61,877 5.1% 36.8% 40.0% 18.2%Miramar 532 0.8% 39.3% 49.8% 10.2%Peninsula 25,058 6.4% 41.2% 38.4% 14.0%University 24,420 6.6% 44.6% 37.5% 11.3%
North Coastal Region 179,429 3.9% 29.0% 43.5% 23.7%Carlsbad 47,025 3.7% 28.4% 47.2% 20.7%Oceanside 56,351 5.0% 30.6% 40.0% 24.3%Pendleton 6,661 0.0% 32.1% 64.7% 3.3%San Dieguito 37,035 3.7% 28.2% 42.2% 25.9%Vista 32,357 3.1% 27.2% 41.0% 28.7%
North Inland Region 196,816 4.4% 26.0% 42.6% 27.0%Anza-Borrego Springs 1,627 15.3% 28.4% 43.5% 12.8%Escondido 51,908 5.9% 27.1% 40.5% 26.6%Fallbrook 17,251 4.5% 25.5% 40.8% 29.3%North San Diego 40,424 3.9% 28.6% 46.6% 20.8%Palomar-Julian 2,280 2.5% 30.6% 41.4% 25.5%Pauma 2,153 2.5% 14.6% 50.6% 32.3%Poway 30,092 3.2% 22.5% 44.9% 29.4%Ramona 11,456 2.6% 18.8% 37.2% 41.4%San Marcos 31,796 4.5% 28.7% 42.9% 23.9%Valley Center 7,829 1.5% 21.1% 35.1% 42.3%
South Region 142,085 6.5% 30.4% 38.5% 24.6%Chula Vista 37,326 8.7% 40.1% 34.1% 17.1%Coronado 8,500 5.0% 37.2% 40.3% 17.5%National City 15,210 11.1% 36.0% 31.4% 21.5%South Bay 38,313 7.2% 29.1% 36.0% 27.6%Sweetwater 42,736 2.7% 19.6% 46.7% 31.0%
San Diego County 1,094,157 6.1% 31.8% 39.7% 22.3%
Vehicles in Housing Unit
11.7%6.2% 4.6% 3.9% 4.4% 6.5% 6.1%
39.9%
30.2% 34.8%29.0% 26.0%
30.4% 31.8%
32.8%
37.9%41.8%
43.5%42.6%
38.5% 39.7%
15.6%25.7%
18.8%23.7% 27.0% 24.6% 22.3%
Central Region East Region North CentralRegion
North CoastalRegion
North InlandRegion
South Region San Diego County
Percentage of Vehicles in Occupied Housing Units by Number of Vehicles by HHSA Region, 2015
No vehicle 1 vehicle 2 vehicles 3+ vehicles
Source: U.S. Census Bureau, 2011-2015 American Community Survey 5-Year Estimates, Table DP04. Prepared by: County of San Diego, Health and Human Services Agency, Public Health Services, Community Health Statistics Unit, 2017.
Page 22

Source: U.S. Census Bureau; 2011-2015 American Community Survey 5-Year Estimates, Table DP03.
GeographyPopulation Age
16+ Employed Civilians*
Unemployed* Armed Forces*Percent
Unemployment‡
Central Region 409,137 236,104 27,146 11,282 9.9%Central San Diego 149,052 91,931 7,686 8,553 7.1%Mid-City 134,803 77,939 9,187 1,129 10.4%Southeastern San Diego 125,282 66,234 10,273 1,600 13.2%
East Region 383,719 213,861 25,285 3,221 10.4%Alpine 12,939 7,580 555 28 6.8%El Cajon 102,140 54,700 8,650 765 13.5%Harbison-Crest 12,955 7,095 413 15 5.5%Jamul 15,926 7,030 391 78 5.2%La Mesa 50,173 29,541 2,617 658 8.0%Laguna-Pine Valley 4,555 2,401 239 0 9.1%Lakeside 44,350 26,536 2,598 346 8.8%Lemon Grove 24,661 13,579 2,059 104 13.1%Mountain Empire 5,709 2,249 433 26 16.0%Santee 42,139 25,209 2,493 357 8.9%Spring Valley 68,172 37,941 4,837 844 11.1%
North Central Region 520,334 318,864 22,838 16,599 6.4%Coastal 67,418 43,896 2,482 679 5.3%Del Mar-Mira Mesa 133,088 86,925 6,142 785 6.5%Elliott-Navajo 72,953 42,675 2,986 2,405 6.2%Kearny Mesa 137,420 82,885 7,126 3,084 7.7%Miramar 4,055 317 85 3,205 2.4%Peninsula 54,509 31,207 2,439 6,069 6.1%University 50,891 30,959 1,578 372 4.8%
North Coastal Region 418,458 224,431 18,092 26,764 6.7%Carlsbad 97,615 55,478 4,445 1,090 7.3%Oceanside 131,206 73,073 6,859 3,292 8.2%Pendleton 29,666 3,548 653 21,405 2.6%San Dieguito 78,269 46,103 3,118 187 6.3%Vista 81,702 46,229 3,017 790 6.0%
North Inland Region 463,555 265,387 19,977 3,568 6.9%Anza-Borrego Springs 3,043 1,192 447 0 27.3%Escondido 132,429 75,907 6,819 692 8.2%Fallbrook 39,938 20,058 1,759 664 7.8%North San Diego 86,957 54,161 2,951 644 5.1%Palomar-Julian 4,556 1,979 266 0 11.8%Pauma 5,086 2,552 319 172 10.5%Poway 69,559 42,025 2,591 660 5.7%Ramona 28,623 16,881 1,520 85 8.2%San Marcos 74,623 41,300 2,553 565 5.7%Valley Center 18,741 9,332 752 86 7.4%
South Region 384,139 203,483 25,964 14,231 10.7%Chula Vista 91,807 47,647 7,938 429 14.2%Coronado 20,677 7,597 443 5,492 3.3%National City 47,548 23,196 2,971 4,084 9.8%South Bay 112,899 58,383 9,134 1,734 13.2%Sweetwater 111,208 66,660 5,478 2,492 7.3%
San Diego County 2,579,342 1,462,130 139,302 75,665 8.3%*Eligible labor force.
‡Percent unemployed of the 16 year and older eligible labor force.
Labor Force
9.9% 10.4%6.4% 6.7% 6.9%
10.7% 8.3%
0%
10%
20%
30%
40%
50%
60%
70%
80%
90%
100%
Central Region East Region North CentralRegion
North CoastalRegion
North InlandRegion
South Region San DiegoCounty
Average Percentage of Unemployment by HHSA Region, 2011-2015
Source: U.S. Census Bureau, 2011-2015 American Community Survey 5-Year Estimates, Table DP03.Prepared by: County of San Diego, Health and Human Services Agency, Public Health Services, Community Health Statistics Unit, 2017.
Page 23

Source: U.S. Census Bureau; 2011-2015 American Community Survey 5-Year Estimates, Table DP03.
Geography Employed Population Management ServiceSales and
OfficeConstruction Production
Central Region 236,104 35.8% 25.9% 22.1% 7.6% 8.7%Central San Diego 91,931 50.2% 19.7% 20.1% 4.5% 5.5%Mid-City 77,939 29.3% 30.0% 22.0% 8.7% 10.0%Southeastern San Diego 66,234 23.3% 29.6% 24.9% 10.7% 11.6%
East Region 213,861 34.8% 19.5% 26.4% 10.1% 9.2%Alpine 7,580 38.4% 17.4% 25.2% 9.9% 9.1%El Cajon 54,700 27.8% 24.0% 27.8% 9.8% 10.6%Harbison-Crest 7,095 31.2% 18.4% 24.0% 17.4% 9.0%Jamul 7,030 43.7% 13.2% 25.2% 8.8% 9.0%La Mesa 29,541 44.0% 16.9% 24.3% 8.8% 6.1%Laguna-Pine Valley 2,401 42.6% 25.9% 19.9% 7.2% 4.4%Lakeside 26,536 32.4% 17.6% 27.3% 13.4% 9.3%Lemon Grove 13,579 28.7% 21.8% 26.7% 11.6% 11.2%Mountain Empire 2,249 29.7% 19.2% 22.8% 17.3% 10.9%Santee 25,209 40.5% 14.8% 27.5% 8.4% 8.8%Spring Valley 37,941 35.8% 20.1% 26.0% 8.7% 9.4%
North Central Region 318,864 53.2% 15.7% 21.1% 4.5% 5.5%Coastal 43,896 56.3% 16.4% 20.7% 3.2% 3.4%Del Mar-Mira Mesa 86,925 57.1% 12.7% 20.5% 3.1% 6.6%Elliott-Navajo 42,675 53.0% 14.4% 21.7% 5.6% 5.3%Kearny Mesa 82,885 44.2% 20.0% 22.7% 6.2% 6.8%Miramar 317 32.8% 9.5% 42.3% 12.9% 2.5%Peninsula 31,207 49.6% 17.7% 21.9% 5.9% 5.0%University 30,959 66.2% 11.3% 17.5% 2.4% 2.6%
North Coastal Region 224,431 41.4% 18.7% 23.6% 7.8% 8.6%Carlsbad 55,478 51.3% 14.7% 24.6% 4.4% 5.0%Oceanside 73,073 33.0% 22.4% 24.9% 9.1% 10.7%Pendleton 3,548 43.5% 14.8% 17.1% 16.3% 8.3%San Dieguito 46,103 56.5% 13.8% 22.1% 3.9% 3.7%Vista 46,229 27.6% 22.7% 22.2% 13.1% 14.3%
North Inland Region 265,387 42.0% 18.0% 22.7% 9.0% 8.3%Anza-Borrego Springs 1,192 18.0% 23.2% 19.3% 35.2% 4.4%Escondido 75,907 29.7% 23.2% 23.3% 12.9% 10.9%Fallbrook 20,058 33.8% 18.5% 23.7% 13.8% 10.2%North San Diego 54,161 59.1% 10.8% 23.0% 2.5% 4.6%Palomar-Julian 1,979 32.9% 28.9% 16.3% 12.9% 9.0%Pauma 2,552 43.1% 15.9% 16.5% 15.9% 8.6%Poway 42,025 58.0% 12.2% 21.0% 3.7% 5.2%Ramona 16,881 34.1% 21.6% 22.0% 12.7% 9.6%San Marcos 41,300 34.8% 21.9% 23.8% 9.1% 10.4%Valley Center 9,332 38.1% 17.0% 22.6% 14.1% 8.2%
South Region 203,483 30.0% 22.2% 27.2% 9.0% 11.5%Chula Vista 47,647 21.9% 24.0% 28.1% 12.1% 13.9%Coronado 7,597 60.6% 11.8% 20.1% 5.2% 2.3%National City 23,196 17.0% 29.5% 24.5% 12.6% 16.4%South Bay 58,383 22.1% 25.3% 29.6% 10.3% 12.7%Sweetwater 66,660 43.7% 17.0% 26.4% 4.9% 8.1%
San Diego County 1,462,130 40.6% 19.7% 23.6% 7.8% 8.4%
Labor Force by Occupation
35.8% 34.8%
53.2%
41.4% 42.0%
30.0%
40.6%
25.9%19.5%
15.7%
18.7% 18.0%
22.2%
19.7%
22.1%
26.4%
21.1%
23.6% 22.7%
27.2%
23.6%
7.6% 10.1%
4.5%7.8% 9.0%
9.0%7.8%
8.7% 9.2% 5.5% 8.6% 8.3% 11.5% 8.4%
Central Region East Region North CentralRegion
North CoastalRegion
North InlandRegion
South Region San DiegoCounty
Labor Force by Occupation by HHSA Region, 2015
Management Service Sales and Office Construction Production
Source: U.S. Census Bureau, 2011-2015 American Community Survey 5-Year Estimates, Table DP03. Prepared by: County of San Diego, Health and Human Services Agency, Public Health Services, Community Health Statistics Unit, 2017.
Page 24
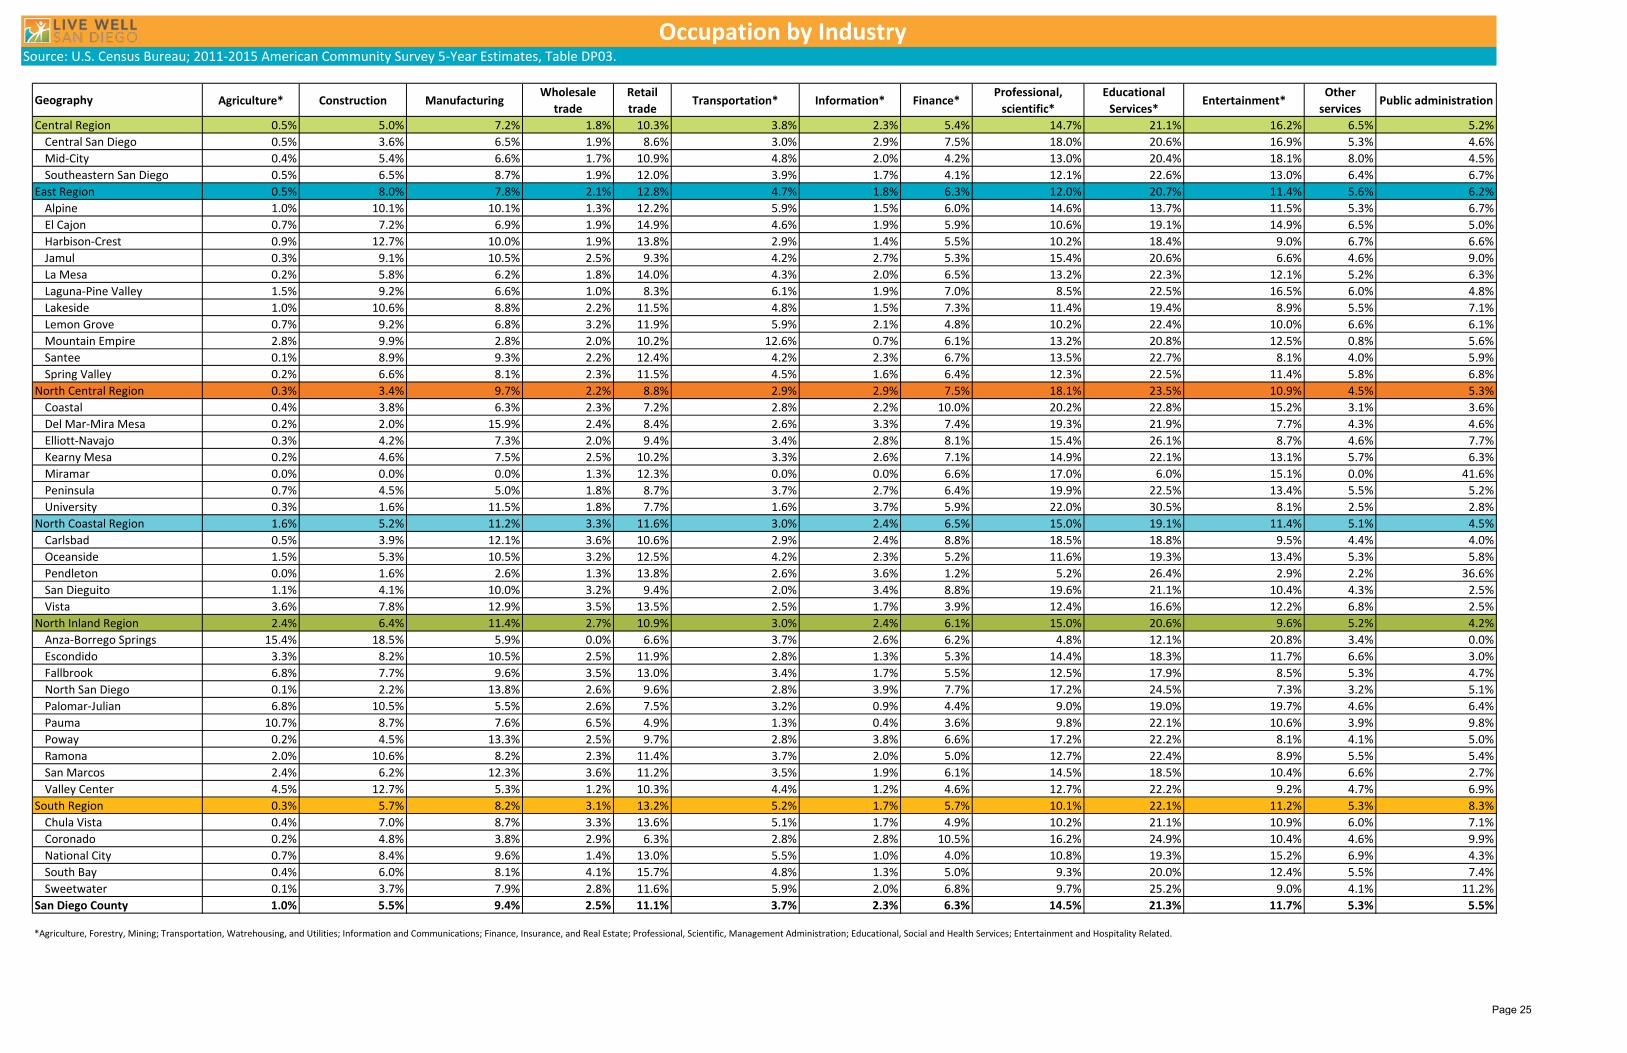
Source: U.S. Census Bureau; 2011-2015 American Community Survey 5-Year Estimates, Table DP03.
Geography Agriculture* Construction ManufacturingWholesale
tradeRetail trade
Transportation* Information* Finance*Professional,
scientific*Educational
Services*Entertainment*
Other services
Public administration
Central Region 0.5% 5.0% 7.2% 1.8% 10.3% 3.8% 2.3% 5.4% 14.7% 21.1% 16.2% 6.5% 5.2%Central San Diego 0.5% 3.6% 6.5% 1.9% 8.6% 3.0% 2.9% 7.5% 18.0% 20.6% 16.9% 5.3% 4.6%Mid-City 0.4% 5.4% 6.6% 1.7% 10.9% 4.8% 2.0% 4.2% 13.0% 20.4% 18.1% 8.0% 4.5%Southeastern San Diego 0.5% 6.5% 8.7% 1.9% 12.0% 3.9% 1.7% 4.1% 12.1% 22.6% 13.0% 6.4% 6.7%
East Region 0.5% 8.0% 7.8% 2.1% 12.8% 4.7% 1.8% 6.3% 12.0% 20.7% 11.4% 5.6% 6.2%Alpine 1.0% 10.1% 10.1% 1.3% 12.2% 5.9% 1.5% 6.0% 14.6% 13.7% 11.5% 5.3% 6.7%El Cajon 0.7% 7.2% 6.9% 1.9% 14.9% 4.6% 1.9% 5.9% 10.6% 19.1% 14.9% 6.5% 5.0%Harbison-Crest 0.9% 12.7% 10.0% 1.9% 13.8% 2.9% 1.4% 5.5% 10.2% 18.4% 9.0% 6.7% 6.6%Jamul 0.3% 9.1% 10.5% 2.5% 9.3% 4.2% 2.7% 5.3% 15.4% 20.6% 6.6% 4.6% 9.0%La Mesa 0.2% 5.8% 6.2% 1.8% 14.0% 4.3% 2.0% 6.5% 13.2% 22.3% 12.1% 5.2% 6.3%Laguna-Pine Valley 1.5% 9.2% 6.6% 1.0% 8.3% 6.1% 1.9% 7.0% 8.5% 22.5% 16.5% 6.0% 4.8%Lakeside 1.0% 10.6% 8.8% 2.2% 11.5% 4.8% 1.5% 7.3% 11.4% 19.4% 8.9% 5.5% 7.1%Lemon Grove 0.7% 9.2% 6.8% 3.2% 11.9% 5.9% 2.1% 4.8% 10.2% 22.4% 10.0% 6.6% 6.1%Mountain Empire 2.8% 9.9% 2.8% 2.0% 10.2% 12.6% 0.7% 6.1% 13.2% 20.8% 12.5% 0.8% 5.6%Santee 0.1% 8.9% 9.3% 2.2% 12.4% 4.2% 2.3% 6.7% 13.5% 22.7% 8.1% 4.0% 5.9%Spring Valley 0.2% 6.6% 8.1% 2.3% 11.5% 4.5% 1.6% 6.4% 12.3% 22.5% 11.4% 5.8% 6.8%
North Central Region 0.3% 3.4% 9.7% 2.2% 8.8% 2.9% 2.9% 7.5% 18.1% 23.5% 10.9% 4.5% 5.3%Coastal 0.4% 3.8% 6.3% 2.3% 7.2% 2.8% 2.2% 10.0% 20.2% 22.8% 15.2% 3.1% 3.6%Del Mar-Mira Mesa 0.2% 2.0% 15.9% 2.4% 8.4% 2.6% 3.3% 7.4% 19.3% 21.9% 7.7% 4.3% 4.6%Elliott-Navajo 0.3% 4.2% 7.3% 2.0% 9.4% 3.4% 2.8% 8.1% 15.4% 26.1% 8.7% 4.6% 7.7%Kearny Mesa 0.2% 4.6% 7.5% 2.5% 10.2% 3.3% 2.6% 7.1% 14.9% 22.1% 13.1% 5.7% 6.3%Miramar 0.0% 0.0% 0.0% 1.3% 12.3% 0.0% 0.0% 6.6% 17.0% 6.0% 15.1% 0.0% 41.6%Peninsula 0.7% 4.5% 5.0% 1.8% 8.7% 3.7% 2.7% 6.4% 19.9% 22.5% 13.4% 5.5% 5.2%University 0.3% 1.6% 11.5% 1.8% 7.7% 1.6% 3.7% 5.9% 22.0% 30.5% 8.1% 2.5% 2.8%
North Coastal Region 1.6% 5.2% 11.2% 3.3% 11.6% 3.0% 2.4% 6.5% 15.0% 19.1% 11.4% 5.1% 4.5%Carlsbad 0.5% 3.9% 12.1% 3.6% 10.6% 2.9% 2.4% 8.8% 18.5% 18.8% 9.5% 4.4% 4.0%Oceanside 1.5% 5.3% 10.5% 3.2% 12.5% 4.2% 2.3% 5.2% 11.6% 19.3% 13.4% 5.3% 5.8%Pendleton 0.0% 1.6% 2.6% 1.3% 13.8% 2.6% 3.6% 1.2% 5.2% 26.4% 2.9% 2.2% 36.6%San Dieguito 1.1% 4.1% 10.0% 3.2% 9.4% 2.0% 3.4% 8.8% 19.6% 21.1% 10.4% 4.3% 2.5%Vista 3.6% 7.8% 12.9% 3.5% 13.5% 2.5% 1.7% 3.9% 12.4% 16.6% 12.2% 6.8% 2.5%
North Inland Region 2.4% 6.4% 11.4% 2.7% 10.9% 3.0% 2.4% 6.1% 15.0% 20.6% 9.6% 5.2% 4.2%Anza-Borrego Springs 15.4% 18.5% 5.9% 0.0% 6.6% 3.7% 2.6% 6.2% 4.8% 12.1% 20.8% 3.4% 0.0%Escondido 3.3% 8.2% 10.5% 2.5% 11.9% 2.8% 1.3% 5.3% 14.4% 18.3% 11.7% 6.6% 3.0%Fallbrook 6.8% 7.7% 9.6% 3.5% 13.0% 3.4% 1.7% 5.5% 12.5% 17.9% 8.5% 5.3% 4.7%North San Diego 0.1% 2.2% 13.8% 2.6% 9.6% 2.8% 3.9% 7.7% 17.2% 24.5% 7.3% 3.2% 5.1%Palomar-Julian 6.8% 10.5% 5.5% 2.6% 7.5% 3.2% 0.9% 4.4% 9.0% 19.0% 19.7% 4.6% 6.4%Pauma 10.7% 8.7% 7.6% 6.5% 4.9% 1.3% 0.4% 3.6% 9.8% 22.1% 10.6% 3.9% 9.8%Poway 0.2% 4.5% 13.3% 2.5% 9.7% 2.8% 3.8% 6.6% 17.2% 22.2% 8.1% 4.1% 5.0%Ramona 2.0% 10.6% 8.2% 2.3% 11.4% 3.7% 2.0% 5.0% 12.7% 22.4% 8.9% 5.5% 5.4%San Marcos 2.4% 6.2% 12.3% 3.6% 11.2% 3.5% 1.9% 6.1% 14.5% 18.5% 10.4% 6.6% 2.7%Valley Center 4.5% 12.7% 5.3% 1.2% 10.3% 4.4% 1.2% 4.6% 12.7% 22.2% 9.2% 4.7% 6.9%
South Region 0.3% 5.7% 8.2% 3.1% 13.2% 5.2% 1.7% 5.7% 10.1% 22.1% 11.2% 5.3% 8.3%Chula Vista 0.4% 7.0% 8.7% 3.3% 13.6% 5.1% 1.7% 4.9% 10.2% 21.1% 10.9% 6.0% 7.1%Coronado 0.2% 4.8% 3.8% 2.9% 6.3% 2.8% 2.8% 10.5% 16.2% 24.9% 10.4% 4.6% 9.9%National City 0.7% 8.4% 9.6% 1.4% 13.0% 5.5% 1.0% 4.0% 10.8% 19.3% 15.2% 6.9% 4.3%South Bay 0.4% 6.0% 8.1% 4.1% 15.7% 4.8% 1.3% 5.0% 9.3% 20.0% 12.4% 5.5% 7.4%Sweetwater 0.1% 3.7% 7.9% 2.8% 11.6% 5.9% 2.0% 6.8% 9.7% 25.2% 9.0% 4.1% 11.2%
San Diego County 1.0% 5.5% 9.4% 2.5% 11.1% 3.7% 2.3% 6.3% 14.5% 21.3% 11.7% 5.3% 5.5%
*Agriculture, Forestry, Mining; Transportation, Watrehousing, and Utilities; Information and Communications; Finance, Insurance, and Real Estate; Professional, Scientific, Management Administration; Educational, Social and Health Services; Entertainment and Hospitality Related.
Occupation by Industry
Page 25

Source: U.S. Census Bureau; American Community Survey 5-Year Estimates, Table DP03. Occupation by Industry
0% 10% 20% 30% 40% 50% 60% 70% 80% 90% 100%
Central Region
East Region
North Central Region
North Coastal Region
North Inland Region
South Region
San Diego County
Labor Force by Industry by HHSA Region, 2015
Agriculture*
Construction
Manufacturing
Wholesale trade
Retail trade
Transportation*
Information*
Finance*
Professional, scientific*
Educational Services*
Entertainment*
Other services
Public administration
Source: U.S. Census Bureau, 2011-2015 American Community Survey 5-Year Estimates, Table DP03.Prepared by: County of San Diego, Health and Human Services Agency, Public Health Services, Community Health Statistics Unit, 2017.
Page 26
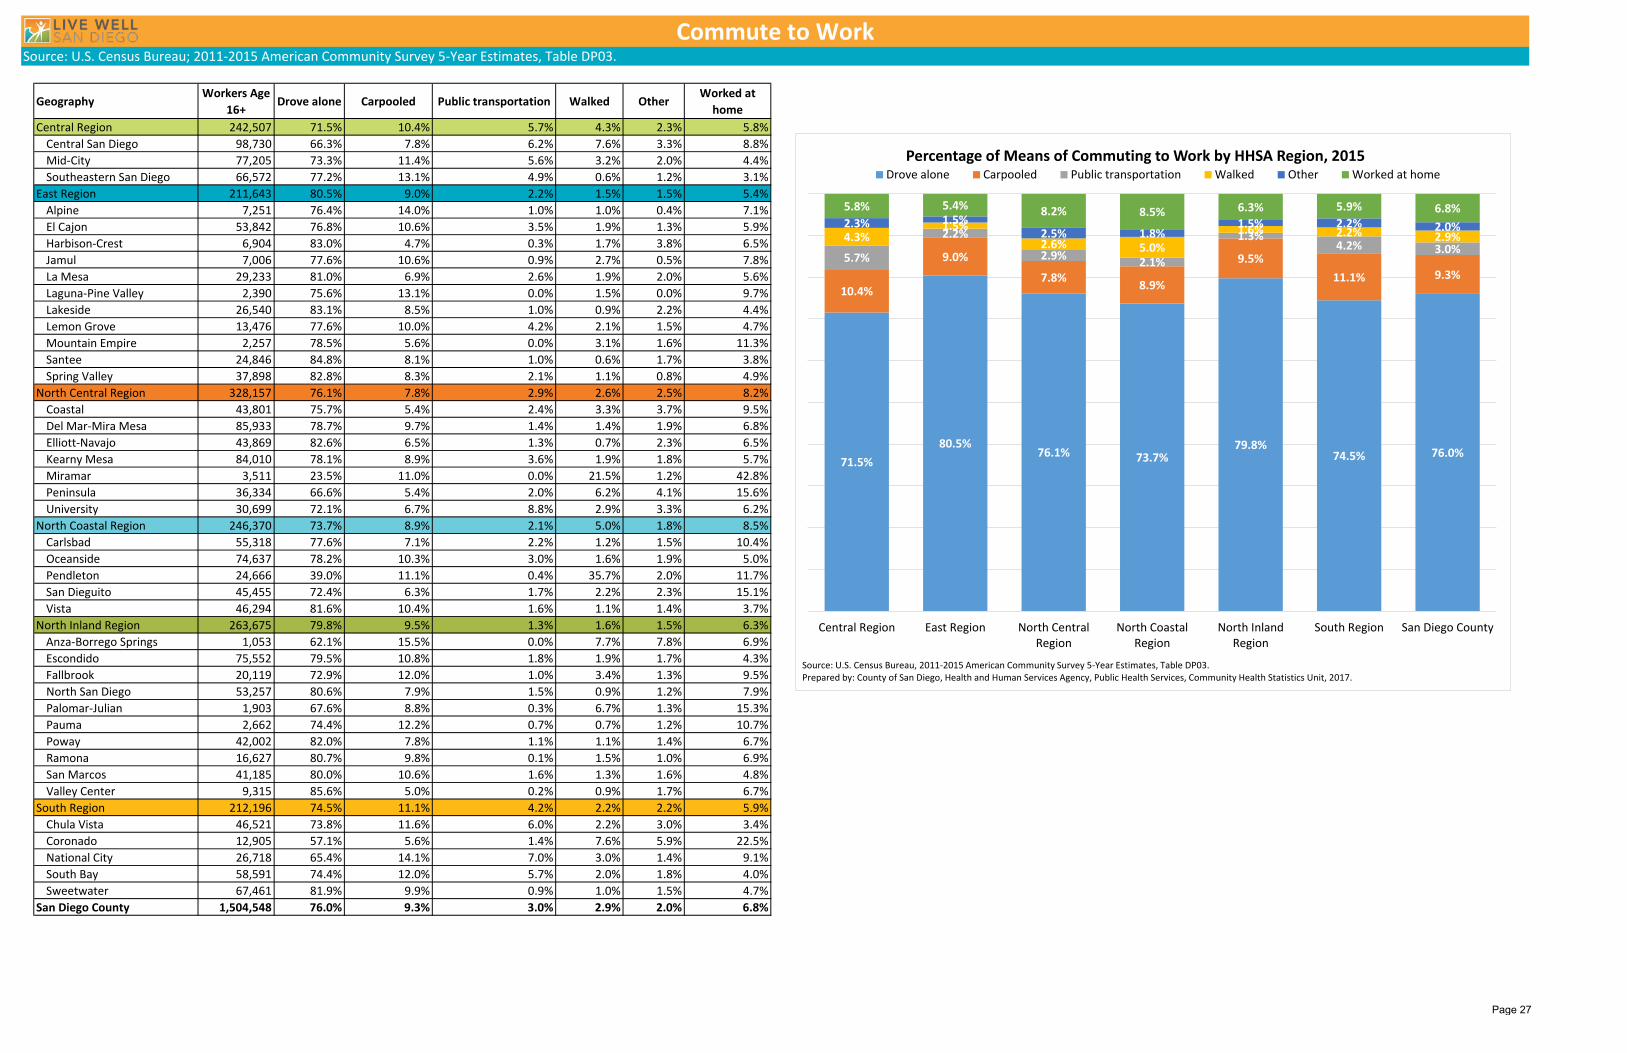
Source: U.S. Census Bureau; 2011-2015 American Community Survey 5-Year Estimates, Table DP03.
GeographyWorkers Age
16+Drove alone Carpooled Public transportation Walked Other
Worked at home
Central Region 242,507 71.5% 10.4% 5.7% 4.3% 2.3% 5.8%Central San Diego 98,730 66.3% 7.8% 6.2% 7.6% 3.3% 8.8%Mid-City 77,205 73.3% 11.4% 5.6% 3.2% 2.0% 4.4%Southeastern San Diego 66,572 77.2% 13.1% 4.9% 0.6% 1.2% 3.1%
East Region 211,643 80.5% 9.0% 2.2% 1.5% 1.5% 5.4%Alpine 7,251 76.4% 14.0% 1.0% 1.0% 0.4% 7.1%El Cajon 53,842 76.8% 10.6% 3.5% 1.9% 1.3% 5.9%Harbison-Crest 6,904 83.0% 4.7% 0.3% 1.7% 3.8% 6.5%Jamul 7,006 77.6% 10.6% 0.9% 2.7% 0.5% 7.8%La Mesa 29,233 81.0% 6.9% 2.6% 1.9% 2.0% 5.6%Laguna-Pine Valley 2,390 75.6% 13.1% 0.0% 1.5% 0.0% 9.7%Lakeside 26,540 83.1% 8.5% 1.0% 0.9% 2.2% 4.4%Lemon Grove 13,476 77.6% 10.0% 4.2% 2.1% 1.5% 4.7%Mountain Empire 2,257 78.5% 5.6% 0.0% 3.1% 1.6% 11.3%Santee 24,846 84.8% 8.1% 1.0% 0.6% 1.7% 3.8%Spring Valley 37,898 82.8% 8.3% 2.1% 1.1% 0.8% 4.9%
North Central Region 328,157 76.1% 7.8% 2.9% 2.6% 2.5% 8.2%Coastal 43,801 75.7% 5.4% 2.4% 3.3% 3.7% 9.5%Del Mar-Mira Mesa 85,933 78.7% 9.7% 1.4% 1.4% 1.9% 6.8%Elliott-Navajo 43,869 82.6% 6.5% 1.3% 0.7% 2.3% 6.5%Kearny Mesa 84,010 78.1% 8.9% 3.6% 1.9% 1.8% 5.7%Miramar 3,511 23.5% 11.0% 0.0% 21.5% 1.2% 42.8%Peninsula 36,334 66.6% 5.4% 2.0% 6.2% 4.1% 15.6%University 30,699 72.1% 6.7% 8.8% 2.9% 3.3% 6.2%
North Coastal Region 246,370 73.7% 8.9% 2.1% 5.0% 1.8% 8.5%Carlsbad 55,318 77.6% 7.1% 2.2% 1.2% 1.5% 10.4%Oceanside 74,637 78.2% 10.3% 3.0% 1.6% 1.9% 5.0%Pendleton 24,666 39.0% 11.1% 0.4% 35.7% 2.0% 11.7%San Dieguito 45,455 72.4% 6.3% 1.7% 2.2% 2.3% 15.1%Vista 46,294 81.6% 10.4% 1.6% 1.1% 1.4% 3.7%
North Inland Region 263,675 79.8% 9.5% 1.3% 1.6% 1.5% 6.3%Anza-Borrego Springs 1,053 62.1% 15.5% 0.0% 7.7% 7.8% 6.9%Escondido 75,552 79.5% 10.8% 1.8% 1.9% 1.7% 4.3%Fallbrook 20,119 72.9% 12.0% 1.0% 3.4% 1.3% 9.5%North San Diego 53,257 80.6% 7.9% 1.5% 0.9% 1.2% 7.9%Palomar-Julian 1,903 67.6% 8.8% 0.3% 6.7% 1.3% 15.3%Pauma 2,662 74.4% 12.2% 0.7% 0.7% 1.2% 10.7%Poway 42,002 82.0% 7.8% 1.1% 1.1% 1.4% 6.7%Ramona 16,627 80.7% 9.8% 0.1% 1.5% 1.0% 6.9%San Marcos 41,185 80.0% 10.6% 1.6% 1.3% 1.6% 4.8%Valley Center 9,315 85.6% 5.0% 0.2% 0.9% 1.7% 6.7%
South Region 212,196 74.5% 11.1% 4.2% 2.2% 2.2% 5.9%Chula Vista 46,521 73.8% 11.6% 6.0% 2.2% 3.0% 3.4%Coronado 12,905 57.1% 5.6% 1.4% 7.6% 5.9% 22.5%National City 26,718 65.4% 14.1% 7.0% 3.0% 1.4% 9.1%South Bay 58,591 74.4% 12.0% 5.7% 2.0% 1.8% 4.0%Sweetwater 67,461 81.9% 9.9% 0.9% 1.0% 1.5% 4.7%
San Diego County 1,504,548 76.0% 9.3% 3.0% 2.9% 2.0% 6.8%
Commute to Work
71.5%80.5%
76.1% 73.7%79.8%
74.5% 76.0%
10.4%
9.0%
7.8% 8.9%
9.5%11.1% 9.3%
5.7%
2.2%
2.9% 2.1%
1.3%4.2% 3.0%
4.3%1.5%
2.6% 5.0%1.6% 2.2% 2.9%
2.3% 1.5%2.5% 1.8%
1.5% 2.2% 2.0%
5.8% 5.4% 8.2% 8.5% 6.3% 5.9% 6.8%
Central Region East Region North CentralRegion
North CoastalRegion
North InlandRegion
South Region San Diego County
Percentage of Means of Commuting to Work by HHSA Region, 2015Drove alone Carpooled Public transportation Walked Other Worked at home
Source: U.S. Census Bureau, 2011-2015 American Community Survey 5-Year Estimates, Table DP03. Prepared by: County of San Diego, Health and Human Services Agency, Public Health Services, Community Health Statistics Unit, 2017.
Page 27

Source: U.S. Census Bureau; 2011-2015 American Community Survey 5-Year Estimates, Table DP03.
# % # % # % # % # % # %Central Region 64,487 36.6% 24,899 14.1% 31,496 17.9% 20,451 11.6% 20,552 11.7% 14,492 8.2%
Central San Diego 25,669 33.6% 9,693 12.7% 13,410 17.6% 9,012 11.8% 9,593 12.6% 8,982 11.8%Mid-City 24,174 42.4% 8,591 15.1% 9,784 17.2% 5,802 10.2% 5,357 9.4% 3,303 5.8%Southeastern San Diego 14,644 34.1% 6,615 15.4% 8,302 19.3% 5,637 13.1% 5,602 13.0% 2,207 5.1%
East Region 45,251 27.9% 21,428 13.2% 29,831 18.4% 22,365 13.8% 25,387 15.7% 17,700 10.9%Alpine 1,242 21.9% 662 11.7% 784 13.8% 674 11.9% 1,316 23.2% 989 17.5%El Cajon 15,761 37.7% 5,638 13.5% 7,397 17.7% 4,802 11.5% 4,690 11.2% 3,535 8.5%Harbison-Crest 1,068 19.6% 811 14.9% 1,006 18.5% 803 14.8% 991 18.2% 765 14.1%Jamul 615 12.8% 406 8.5% 582 12.1% 654 13.6% 1,088 22.7% 1,447 30.2%La Mesa 7,075 28.6% 3,778 15.3% 4,682 18.9% 3,493 14.1% 3,424 13.9% 2,263 9.2%Laguna-Pine Valley 452 23.4% 253 13.1% 243 12.6% 220 11.4% 410 21.3% 350 18.2%Lakeside 4,769 24.5% 2,345 12.0% 3,730 19.1% 3,073 15.8% 3,349 17.2% 2,225 11.4%Lemon Grove 2,884 29.6% 1,432 14.7% 2,162 22.2% 1,456 14.9% 1,239 12.7% 573 5.9%Mountain Empire 945 41.5% 276 12.1% 464 20.4% 174 7.6% 206 9.0% 212 9.3%Santee 3,695 20.2% 1,987 10.9% 3,409 18.7% 3,010 16.5% 3,919 21.4% 2,255 12.3%Spring Valley 6,745 24.3% 3,840 13.8% 5,372 19.3% 4,006 14.4% 4,755 17.1% 3,086 11.1%
North Central Region 50,127 21.1% 23,964 10.1% 38,907 16.4% 31,868 13.4% 44,021 18.5% 48,601 20.5%Coastal 7,617 21.7% 3,288 9.4% 5,805 16.6% 4,682 13.4% 5,356 15.3% 8,297 23.7%Del Mar-Mira Mesa 6,784 12.2% 3,794 6.8% 6,994 12.6% 7,317 13.2% 12,785 23.1% 17,751 32.0%Elliott-Navajo 7,034 20.0% 3,619 10.3% 6,236 17.8% 5,214 14.8% 6,283 17.9% 6,745 19.2%Kearny Mesa 16,062 26.0% 7,635 12.3% 11,434 18.5% 8,018 13.0% 11,097 17.9% 7,631 12.3%Miramar 170 32.0% 64 12.0% 165 31.0% 71 13.3% 46 8.6% 16 3.0%Peninsula 5,908 23.6% 2,917 11.6% 4,635 18.5% 3,402 13.6% 4,051 16.2% 4,145 16.5%University 6,552 26.8% 2,647 10.8% 3,638 14.9% 3,164 13.0% 4,403 18.0% 4,016 16.4%
North Coastal Region 47,080 26.2% 20,934 11.7% 29,874 16.6% 22,530 12.6% 28,156 15.7% 30,855 17.2%Carlsbad 9,918 21.1% 4,221 9.0% 6,815 14.5% 6,224 13.2% 9,205 19.6% 10,642 22.6%Oceanside 16,384 29.1% 7,712 13.7% 10,622 18.8% 7,770 13.8% 7,951 14.1% 5,912 10.5%Pendleton 2,311 34.7% 2,017 30.3% 1,525 22.9% 342 5.1% 374 5.6% 92 1.4%San Dieguito 7,491 20.2% 2,665 7.2% 4,720 12.7% 4,065 11.0% 6,514 17.6% 11,580 31.3%Vista 10,976 33.9% 4,319 13.3% 6,192 19.1% 4,129 12.8% 4,112 12.7% 2,629 8.1%
North Inland Region 48,747 24.8% 22,259 11.3% 31,554 16.0% 24,798 12.6% 33,403 17.0% 36,055 18.3%Anza-Borrego Springs 903 55.5% 257 15.8% 284 17.5% 110 6.8% 56 3.4% 17 1.0%Escondido 17,367 33.5% 6,949 13.4% 9,463 18.2% 5,803 11.2% 6,536 12.6% 5,790 11.2%Fallbrook 4,985 28.9% 2,240 13.0% 3,174 18.4% 2,268 13.1% 2,383 13.8% 2,201 12.8%North San Diego 5,521 13.7% 3,369 8.3% 6,048 15.0% 5,279 13.1% 8,503 21.0% 11,704 29.0%Palomar-Julian 813 35.7% 414 18.2% 370 16.2% 322 14.1% 249 10.9% 112 4.9%Pauma 440 20.4% 378 17.6% 276 12.8% 382 17.7% 323 15.0% 354 16.4%Poway 4,463 14.8% 2,534 8.4% 3,358 11.2% 3,906 13.0% 6,552 21.8% 9,279 30.8%Ramona 2,231 19.5% 1,279 11.2% 2,131 18.6% 1,585 13.8% 2,505 21.9% 1,725 15.1%San Marcos 9,895 31.1% 4,263 13.4% 5,360 16.9% 4,231 13.3% 4,658 14.6% 3,389 10.7%Valley Center 2,129 27.2% 576 7.4% 1,090 13.9% 912 11.6% 1,638 20.9% 1,484 19.0%
South Region 43,102 30.3% 18,999 13.4% 25,030 17.6% 19,419 13.7% 22,021 15.5% 13,514 9.5%Chula Vista 15,163 40.6% 6,332 17.0% 6,497 17.4% 4,333 11.6% 3,504 9.4% 1,497 4.0%Coronado 1,607 18.9% 836 9.8% 1,216 14.3% 996 11.7% 1,609 18.9% 2,236 26.3%National City 6,730 44.2% 2,397 15.8% 2,908 19.1% 1,302 8.6% 1,292 8.5% 581 3.8%South Bay 12,883 33.6% 6,094 15.9% 7,372 19.2% 5,328 13.9% 4,634 12.1% 2,002 5.2%Sweetwater 6,719 15.7% 3,340 7.8% 7,037 16.5% 7,460 17.5% 10,982 25.7% 7,198 16.8%
San Diego County 298,794 27.3% 132,483 12.1% 186,692 17.1% 141,431 12.9% 173,540 15.9% 161,217 14.7%
Number of Households by Household Income
$150,000 and Higher$100,000-under $150,000$75,000-under $100,000$50,000-under$75,000$35,000-under $50,000Under $35,000Geography
Page 28

Source: U.S. Census Bureau; 2011-2015 American Community Survey 5-Year Estimates, Table DP03, DP04.
Geography Median Household Income*
Persons Per Household (PPH)*
PPH Income
Central Region 51,899$ 2.52 $20,564Central San Diego 55,858$ 1.83 $30,516Mid-City 47,210$ 2.69 $17,541Southeastern San Diego 52,048$ 3.60 $14,444
East Region 65,137$ 2.73 $23,828Alpine 83,031$ 2.63 $31,613El Cajon 55,928$ 2.89 $19,341Harbison-Crest 72,441$ 2.68 $27,040Jamul 104,242$ 2.91 $35,779La Mesa 57,755$ 2.31 $24,951Laguna-Pine Valley 78,599$ 2.09 $37,646Lakeside 68,070$ 2.72 $25,063Lemon Grove 58,508$ 3.04 $19,266Mountain Empire 40,493$ 2.06 $19,672Santee 76,546$ 2.70 $28,310Spring Valley 66,269$ 2.93 $22,627
North Central Region 85,121$ 2.37 $35,872Coastal 92,146$ 1.83 $50,467Del Mar-Mira Mesa 112,984$ 2.89 $39,136Elliott-Navajo 82,185$ 2.48 $33,196Kearny Mesa 67,225$ 2.44 $27,608Miramar 53,173$ 3.70 $14,379Peninsula 74,698$ 2.02 $36,935University 72,265$ 2.14 $33,840
North Coastal Region 72,950$ 2.59 $28,126Carlsbad 84,803$ 2.39 $35,452Oceanside 59,932$ 2.66 $22,543Pendleton 40,988$ 2.92 $14,014San Dieguito 100,535$ 2.37 $42,388Vista 54,580$ 2.97 $18,385
North Inland Region 76,311$ 2.78 $27,464Anza-Borrego Springs 30,661$ 1.00 $30,758Escondido 61,457$ 3.08 $19,976Fallbrook 61,875$ 2.61 $23,686North San Diego 95,288$ 2.63 $36,284Palomar-Julian 48,265$ 1.50 $32,195Pauma 73,250$ 2.81 $26,112Poway 109,376$ 2.83 $38,591Ramona 81,617$ 2.89 $28,289San Marcos 57,149$ 2.84 $20,092Valley Center 73,953$ 2.64 $27,962
South Region 60,483$ 3.10 $19,503Chula Vista 45,637$ 2.82 $16,164Coronado 96,233$ 1.85 $52,151National City 40,842$ 3.35 $12,209South Bay 51,860$ 3.53 $14,673Sweetwater 90,530$ 3.18 $28,465
San Diego County 64,309$ 2.65 $24,229
Median and People Per Household Income
$51,899
$65,137
$85,121
$72,950 $76,311
$60,483 $64,309
Central Region East Region North CentralRegion
North CoastalRegion
North InlandRegion
South Region San DiegoCounty
Median Household Income by HHSA Region, 2015
Source: U.S. Census Bureau; 2011-2015 American Community Survey 5-Year Estimates, Table DP03, DP04.Prepared by: County of San Diego, Health and Human Services Agency, Public Health Services, Community Health Statistics Unit, 2017.
$20,564
$23,828
$35,872
$28,126
$27,464
$19,503
$24,229
Central Region
East Region
North Central Region
North Coastal Region
North Inland Region
South Region
San Diego County
Person Per Household Income by HHSA Region, 2015
Source: U.S. Census Bureau; 2011-2015 American Community Survey 5-Year Estimates, Table DP03, DP04.Prepared by: County of San Diego, Health and Human Services Agency, Public Health Services, Community Health Statistics Unit, 2017.
Page 29

Source: U.S. Census Bureau; 2011-2015 American Community Survey 5-Year Estimates, Table S2503, DP04.
# % # % # %Central Region 192,184 62,775 32.7% 113,602 59.1% 15,807 8.2%
Central San Diego 85,465 20,667 24.2% 55,692 65.2% 9,106 10.7%Mid-City 61,369 18,292 29.8% 38,719 63.1% 4,358 7.1%Southeastern San Diego 45,350 23,816 52.5% 19,191 42.3% 2,343 5.2%
East Region 172,540 92,601 53.7% 69,361 40.2% 10,578 6.1%Alpine 5,898 4,005 67.9% 1,662 28.2% 231 3.9%El Cajon 43,896 18,088 41.2% 23,735 54.1% 2,073 4.7%Harbison-Crest 5,729 4,655 81.3% 789 13.8% 285 5.0%Jamul 5,385 4,189 77.8% 603 11.2% 593 11.0%La Mesa 26,138 11,057 42.3% 13,658 52.3% 1,423 5.4%Laguna-Pine Valley 2,550 1,643 64.4% 285 11.2% 622 24.4%Lakeside 20,971 12,272 58.5% 7,219 34.4% 1,480 7.1%Lemon Grove 10,123 5,762 56.9% 3,984 39.4% 377 3.7%Mountain Empire 3,319 1,496 45.1% 781 23.5% 1,042 31.4%Santee 19,055 13,115 68.8% 5,160 27.1% 780 4.1%Spring Valley 29,476 16,319 55.4% 11,485 39.0% 1,672 5.7%
North Central Region 256,536 121,529 47.4% 115,959 45.2% 19,048 7.4%Coastal 41,235 14,785 35.9% 20,260 49.1% 6,190 15.0%Del Mar-Mira Mesa 58,294 35,917 61.6% 19,508 33.5% 2,869 4.9%Elliott-Navajo 36,940 21,274 57.6% 13,857 37.5% 1,809 4.9%Kearny Mesa 65,266 31,449 48.2% 30,428 46.6% 3,389 5.2%Miramar 553 11 2.0% 521 94.2% 21 3.8%Peninsula 27,619 10,508 38.0% 14,550 52.7% 2,561 9.3%University 26,629 7,585 28.5% 16,835 63.2% 2,209 8.3%
North Coastal Region 194,205 101,607 52.3% 77,822 40.1% 14,776 7.6%Carlsbad 50,512 30,107 59.6% 16,918 33.5% 3,487 6.9%Oceanside 61,454 30,962 50.4% 25,389 41.3% 5,103 8.3%Pendleton 7,665 13 0.2% 6,648 86.7% 1,004 13.1%San Dieguito 40,699 24,049 59.1% 12,986 31.9% 3,664 9.0%Vista 33,875 16,476 48.6% 15,881 46.9% 1,518 4.5%
North Inland Region 210,845 127,297 60.4% 69,519 33.0% 14,029 6.7%Anza-Borrego Springs 3,498 1,082 30.9% 545 15.6% 1,871 53.5%Escondido 54,294 27,429 50.5% 24,479 45.1% 2,386 4.4%Fallbrook 18,528 11,633 62.8% 5,618 30.3% 1,277 6.9%North San Diego 42,526 26,282 61.8% 14,142 33.3% 2,102 4.9%Palomar-Julian 3,554 1,687 47.5% 593 16.7% 1,274 35.8%Pauma 2,506 1,573 62.8% 580 23.1% 353 14.1%Poway 31,375 23,047 73.5% 7,045 22.5% 1,283 4.1%Ramona 12,453 8,473 68.0% 2,983 24.0% 997 8.0%San Marcos 33,398 19,687 58.9% 12,109 36.3% 1,602 4.8%Valley Center 8,713 6,404 73.5% 1,425 16.4% 884 10.1%
South Region 154,496 73,270 47.4% 68,815 44.5% 12,411 8.0%Chula Vista 41,127 15,657 38.1% 21,669 52.7% 3,801 9.2%Coronado 10,883 4,046 37.2% 4,454 40.9% 2,383 21.9%National City 16,504 4,704 28.5% 10,506 63.7% 1,294 7.8%South Bay 40,297 17,501 43.4% 20,812 51.6% 1,984 4.9%Sweetwater 45,685 31,362 68.6% 11,374 24.9% 2,949 6.5%
San Diego County 1,180,806 579,079 49.0% 515,078 43.6% 86,649 7.3%
Owner-Occupied Housing Units Renter-Occupied Housing UnitsGeography
Owner vs. Renter Occupied Housing
Unoccupied Housing UnitsTotal Housing Units
32.7%
53.7%
47.4%
52.3%
60.4%
47.4%
49.0%
59.1%
40.2%
45.2%
40.1%
33.0%
44.5%
43.6%
8.2%
6.1%
7.4%
7.6%
6.7%
8.0%
7.3%
Central Region
East Region
North CentralRegion
North CoastalRegion
North InlandRegion
South Region
San Diego County
Housing Occupancy Distribution by HHSA Region, 2015Owner-Occupied Housing Units Renter-Occupied Housing Units Unoccupied Housing Units
Source: U.S. Census Bureau, 2011-2015 American Community Survey 5-Year Estimates, Table S2503, DP04.Prepared by: County of San Diego, Health and Human Services Agency, Public Health Services, Community Health Statistics Unit, 2017.
Page 30

Source: U.S. Census Bureau; 2011-2015 American Community Survey 5-Year Estimates, Table B25064, DP04.
Geography Median Rent Median House
Value Central Region 1,226$ 369,687$
Central San Diego 1,171$ 454,536$ Mid-City 1,202$ 349,997$ Southeastern San Diego 1,314$ 289,697$
East Region 1,394$ 361,797$ Alpine 1,359$ 482,167$ El Cajon 1,299$ 340,328$ Harbison-Crest 1,789$ 350,133$ Jamul 2,443$ 529,800$ La Mesa 1,279$ 421,667$ Laguna-Pine Valley 1,040$ 338,250$ Lakeside 1,468$ 355,160$ Lemon Grove 1,250$ 287,586$ Mountain Empire 867$ 182,400$ Santee 1,488$ 336,567$ Spring Valley 1,398$ 367,533$
North Central Region 1,786$ 597,531$ Coastal 1,776$ 912,638$ Del Mar-Mira Mesa 2,070$ 624,700$ Elliott-Navajo 1,735$ 496,782$ Kearny Mesa 1,588$ 437,381$ Miramar 2,085$ -Peninsula 1,666$ 641,854$ University 1,818$ 497,231$
North Coastal Region 1,646$ 515,066$ Carlsbad 1,848$ 570,868$ Oceanside 1,495$ 372,162$ Pendleton 1,813$ -San Dieguito 1,981$ 894,210$ Vista 1,328$ 364,365$
North Inland Region 1,508$ 434,060$ Anza-Borrego Springs 737$ 161,000$ Escondido 1,368$ 349,244$ Fallbrook 1,175$ 438,511$ North San Diego 1,720$ 549,256$ Palomar-Julian 943$ 282,550$ Pauma 1,240$ 364,700$ Poway 1,901$ 590,995$ Ramona 1,656$ 400,500$ San Marcos 1,447$ 337,213$ Valley Center 1,257$ 422,025$
South Region 1,453$ 382,962$ Chula Vista 1,256$ 256,581$ Coronado 2,287$ 1,304,157$ National City 1,025$ 272,985$ South Bay 1,247$ 287,064$ Sweetwater 1,977$ 417,947$
San Diego County 1,344$ 429,600$
Median Rent and House Value
$1,226
$1,394
$1,786 $1,646
$1,508 $1,453 $1,344
Central Region East Region North CentralRegion
North CoastalRegion
North Inland Region South Region San Diego County
Median Rent by HHSA Region, 2015
Source: U.S. Census Bureau, 2011-2015 American Community Survey 5-Year Estimates, Table B25064. Prepared by: County of San Diego, Health and Human Services Agency, Public Health Services, Community Health Statistics Unit, 2017.
$369,687 $361,797
$597,531
$515,066
$434,060 $382,962
$429,600
Central Region East Region North CentralRegion
North CoastalRegion
North Inland Region South Region San Diego County
Median House Value by HHSA Region, 2015
Source: U.S. Census Bureau, 2011-2015 American Community Survey 5-Year Estimates, Table DP04. Prepared by: County of San Diego, Health and Human Services Agency, Public Health Services, Community Health Statistics Unit, 2017.
Page 31

Source: U.S. Census Bureau; 2011-2015 American Community Survey 5-Year Estimates, Table S2503.
Geography <20% 20-29% 30+%Central Region 28.3% 22.9% 48.8%
Central San Diego 30.5% 25.0% 44.5%Mid-City 26.4% 21.7% 51.9%Southeastern San Diego 27.8% 21.5% 50.7%
East Region 30.8% 24.0% 45.2%Alpine 26.0% 24.8% 49.2%El Cajon 27.6% 22.5% 49.9%Harbison-Crest 40.5% 21.8% 37.8%Jamul 33.6% 28.2% 38.3%La Mesa 29.6% 23.1% 47.4%Laguna-Pine Valley 44.1% 24.0% 32.1%Lakeside 33.8% 25.5% 40.7%Lemon Grove 28.2% 23.9% 47.9%Mountain Empire 50.8% 15.9% 33.2%Santee 31.9% 27.0% 41.1%Spring Valley 31.1% 23.7% 45.2%
North Central Region 36.3% 22.6% 41.1%Coastal 36.0% 21.8% 42.2%Del Mar-Mira Mesa 39.1% 25.8% 35.2%Elliott-Navajo 36.2% 22.5% 41.3%Kearny Mesa 34.1% 22.9% 43.0%Miramar 11.6% 7.9% 80.4%Peninsula 37.8% 19.6% 42.5%University 36.2% 21.2% 42.6%
North Coastal Region 33.7% 23.0% 43.3%Carlsbad 35.9% 24.7% 39.4%Oceanside 30.6% 23.6% 45.8%Pendleton 18.6% 6.7% 74.6%San Dieguito 39.3% 21.3% 39.3%Vista 31.3% 23.1% 45.5%
North Inland Region 33.2% 23.7% 43.1%Anza-Borrego Springs 38.3% 14.1% 47.6%Escondido 29.5% 22.2% 48.3%Fallbrook 33.3% 21.3% 45.3%North San Diego 34.4% 27.3% 38.3%Palomar-Julian 52.9% 12.5% 34.6%Pauma 32.1% 23.6% 44.4%Poway 37.5% 26.4% 36.1%Ramona 31.8% 25.4% 42.8%San Marcos 30.8% 22.4% 46.8%Valley Center 38.5% 21.4% 40.2%
South Region 29.8% 22.9% 47.4%Chula Vista 29.8% 21.2% 49.0%Coronado 34.6% 23.1% 42.3%National City 29.2% 20.0% 50.8%South Bay 27.6% 24.5% 47.9%Sweetwater 31.0% 24.9% 44.1%
San Diego County 32.2% 23.1% 44.6%
Monthly housing costs as a percentage of household income in the past 12months.
Monthly Housing Costs as Percentage of Household Income
28.3% 30.8%36.3% 33.7% 33.2% 29.8% 32.2%
22.9%24.0%
22.6%23.0% 23.7%
22.9%23.1%
48.8% 45.2%41.1% 43.3% 43.1%
47.4% 44.6%
Central Region East Region North CentralRegion
North CoastalRegion
North InlandRegion
South Region San Diego County
Monthly Housing Costs as Percentage of Household Income by HHSA Region, 2015
<20% 20-29% 30+%
Source: U.S. Census Bureau, 2011-2015 American Community Survey 5-Year Estimates, Table S2503.Prepared by: County of San Diego, Health and Human Services Agency, Public Health Services, Community Health Statistics Unit, 2017.
Page 32

Source: U.S. Census Bureau; 2011-2015 American Community Survey 5-Year Estimates, Table B17024.
Geography <50% 50-74% 75-99% 100-124% 125-149% 150-199% 200+%Central Region 10.0% 5.4% 7.5% 6.3% 6.4% 11.3% 53.1%
Central San Diego 9.1% 4.5% 7.2% 5.3% 5.1% 8.8% 60.0%Mid-City 11.8% 6.3% 8.0% 7.8% 7.6% 12.7% 45.8%Southeastern San Diego 9.2% 5.3% 7.2% 5.7% 6.4% 12.5% 53.7%
East Region 6.4% 3.4% 4.6% 4.2% 4.9% 9.1% 67.3%Alpine 5.2% 0.9% 2.6% 3.2% 3.5% 5.5% 79.1%El Cajon 9.9% 5.4% 6.5% 5.9% 6.9% 10.6% 54.8%Harbison-Crest 4.8% 3.7% 1.8% 1.3% 5.7% 9.5% 73.2%Jamul 3.0% 1.7% 3.1% 1.6% 2.7% 3.0% 84.9%La Mesa 4.9% 3.1% 4.0% 4.3% 4.5% 8.1% 71.1%Laguna-Pine Valley 5.3% 1.8% 6.7% 2.7% 8.1% 3.5% 71.9%Lakeside 4.8% 2.8% 3.4% 2.9% 2.9% 10.2% 72.9%Lemon Grove 6.8% 3.9% 4.4% 4.3% 6.0% 13.1% 61.5%Mountain Empire 12.2% 2.7% 6.3% 6.6% 12.3% 5.5% 54.5%Santee 3.4% 1.8% 2.7% 2.2% 3.6% 6.0% 80.3%Spring Valley 5.9% 2.4% 4.9% 4.9% 3.8% 9.7% 68.4%
North Central Region 6.0% 2.0% 2.8% 3.2% 3.1% 6.1% 76.8%Coastal 7.4% 1.8% 2.3% 2.5% 2.2% 7.1% 76.6%Del Mar-Mira Mesa 3.1% 1.5% 1.7% 2.0% 2.1% 4.0% 85.6%Elliott-Navajo 3.5% 1.1% 2.1% 3.9% 3.2% 6.0% 80.2%Kearny Mesa 6.1% 3.1% 4.6% 4.4% 4.5% 7.0% 70.2%Miramar 5.4% 0.0% 0.9% 15.4% 9.4% 14.5% 54.4%Peninsula 5.4% 1.4% 3.4% 3.4% 3.7% 8.8% 73.9%University 17.1% 3.3% 2.6% 2.1% 2.5% 5.2% 67.2%
North Coastal Region 7.5% 2.0% 3.2% 4.5% 4.1% 9.3% 69.4%Carlsbad 6.7% 1.2% 2.5% 2.1% 2.3% 5.4% 79.8%Oceanside 8.4% 2.3% 3.9% 5.9% 4.0% 10.7% 64.8%Pendleton 4.4% 3.3% 1.9% 7.9% 12.1% 19.8% 50.6%San Dieguito 5.4% 1.2% 1.7% 2.9% 2.1% 5.3% 81.4%Vista 9.4% 2.7% 4.6% 5.8% 6.7% 13.4% 57.4%
North Inland Region 6.5% 2.4% 3.2% 3.9% 4.6% 8.9% 70.5%Anza-Borrego Springs 5.6% 0.5% 13.5% 3.2% 14.1% 17.3% 45.7%Escondido 9.3% 3.6% 4.7% 6.4% 7.0% 12.2% 56.9%Fallbrook 8.4% 3.9% 3.9% 3.7% 6.7% 9.5% 63.9%North San Diego 2.5% 0.9% 1.5% 1.3% 2.2% 4.2% 87.3%Palomar-Julian 11.3% 2.2% 2.7% 5.9% 6.4% 10.5% 61.1%Pauma 7.1% 3.3% 5.7% 2.2% 7.0% 12.1% 62.6%Poway 2.4% 1.4% 1.3% 2.4% 1.9% 5.0% 85.6%Ramona 4.2% 1.6% 2.1% 4.4% 4.6% 8.0% 74.9%San Marcos 9.7% 2.4% 3.6% 3.7% 5.0% 12.0% 63.6%Valley Center 6.6% 1.6% 4.1% 3.3% 2.1% 8.2% 74.1%
South Region 6.3% 3.6% 5.6% 4.9% 5.7% 10.7% 63.2%Chula Vista 6.9% 4.8% 7.3% 6.3% 7.4% 13.8% 53.6%Coronado 3.7% 0.8% 1.5% 1.7% 2.1% 6.5% 83.6%National City 9.8% 5.9% 8.8% 7.1% 7.8% 13.8% 46.7%South Bay 7.6% 4.9% 6.1% 6.4% 7.8% 11.6% 55.7%Sweetwater 3.7% 0.7% 3.1% 1.9% 2.0% 6.9% 81.7%
San Diego County 7.1% 3.0% 4.4% 4.4% 4.7% 9.1% 67.3%
Poverty Level
10.0% 6.4% 6.0% 7.5% 6.5% 6.3% 7.1%
5.4%3.4% 2.0% 2.0% 2.4% 3.6% 3.0%
7.5%
4.6%2.8% 3.2% 3.2%
5.6% 4.4%
6.3%
4.2%3.2%
4.5% 3.9%4.9% 4.4%
6.4%
4.9%
3.1%4.1% 4.6%
5.7% 4.7%
11.3%
9.1%
6.1%
9.3% 8.9%
10.7%9.1%
53.1%
67.3%76.8%
69.4% 70.5%63.2% 67.3%
0%
10%
20%
30%
40%
50%
60%
70%
80%
90%
100%
Central Region East Region North CentralRegion
North CoastalRegion
North InlandRegion
South Region San Diego County
Percent of Population by Poverty Level by HHSA Region, 2015
<50% 50-74% 75-99% 100-124% 125-149% 150-199% 200+%
Source: U.S. Census Bureau, 2011-2015 American Community Survey 5-Year Estimates, Table B17024.Prepared by: County of San Diego, Health and Human Services Agency, Public Health Services, Community Health Statistics Unit, 2017.
Page 33

Source: U.S. Census Bureau; 2011-2015 American Community Survey 5-Year Estimates, Table B17024.*Refers to the percentage of people within the age group living below 100% of the federal poverty level (FPL).
Geography Under 6 Years
6-11 Years 12-17 Years 18-24 Years 25-34 Years 35-44 Years 45-54 Years 55-64 Years 65-74 Years 75+ Years
Central Region 33.0% 36.3% 32.4% 32.9% 16.7% 20.4% 17.9% 16.8% 14.8% 16.8%Central San Diego 35.0% 41.4% 31.0% 33.1% 15.1% 16.2% 18.1% 19.5% 17.8% 20.2%Mid-City 32.4% 37.4% 33.1% 40.5% 19.5% 23.6% 18.7% 19.2% 12.9% 15.3%Southeastern San Diego 32.4% 33.2% 32.6% 23.1% 16.4% 22.1% 16.8% 12.1% 13.3% 14.8%
East Region 21.9% 19.3% 17.9% 19.6% 14.5% 13.8% 11.5% 9.8% 8.7% 9.3%Alpine 26.6% 2.5% 5.9% 13.8% 8.3% 11.8% 9.4% 5.4% 2.8% 7.1%El Cajon 31.5% 29.6% 32.0% 26.0% 21.3% 21.7% 19.1% 13.1% 9.7% 12.0%Harbison-Crest 17.1% 14.6% 3.2% 8.7% 23.8% 9.1% 7.5% 9.1% 10.5% 6.5%Jamul 10.8% 9.0% 6.8% 3.3% 12.0% 8.1% 7.3% 9.2% 6.5% 5.7%La Mesa 17.1% 13.9% 10.4% 24.9% 11.2% 9.3% 8.8% 8.4% 7.8% 11.4%Laguna-Pine Valley 20.1% 22.9% 21.3% 35.4% 12.5% 9.2% 11.2% 5.8% 5.2% 9.8%Lakeside 12.8% 13.7% 14.8% 10.0% 13.6% 11.0% 10.9% 7.1% 9.9% 4.8%Lemon Grove 24.2% 25.6% 17.1% 15.9% 12.3% 16.8% 8.7% 11.6% 12.9% 12.8%Mountain Empire 30.4% 16.7% 31.6% 58.7% 10.9% 18.3% 11.6% 13.9% 30.5% 7.3%Santee 10.1% 14.0% 8.6% 9.3% 8.8% 6.4% 5.2% 8.2% 5.4% 6.2%Spring Valley 23.9% 15.3% 15.0% 19.7% 11.3% 12.9% 10.2% 9.8% 8.0% 8.5%
North Central Region 9.4% 10.9% 10.0% 32.8% 10.0% 6.8% 6.7% 7.5% 5.4% 7.9%Coastal 3.2% 5.3% 9.1% 37.2% 10.2% 8.7% 8.1% 9.0% 4.5% 5.5%Del Mar-Mira Mesa 5.6% 7.8% 6.6% 12.6% 7.5% 5.1% 4.4% 4.9% 4.6% 6.1%Elliott-Navajo 8.5% 7.6% 5.8% 14.6% 8.9% 3.7% 4.8% 4.5% 3.1% 6.9%Kearny Mesa 16.3% 20.0% 18.3% 28.6% 12.0% 8.6% 10.0% 11.7% 8.4% 11.4%Miramar 6.4% 10.9% 4.5% 3.6% 7.2% 2.2% 11.6% 0.0% - -Peninsula 11.5% 11.5% 11.5% 24.3% 8.2% 9.5% 8.7% 8.0% 5.4% 6.2%University 7.3% 9.7% 8.9% 72.0% 11.8% 7.6% 5.5% 7.5% 4.9% 8.7%
North Coastal Region 13.1% 14.1% 14.8% 14.7% 14.0% 14.9% 11.3% 10.9% 7.3% 8.3%Carlsbad 11.8% 11.6% 15.9% 12.8% 11.9% 13.7% 8.3% 8.6% 4.4% 6.6%Oceanside 14.2% 15.1% 17.2% 15.0% 13.9% 17.7% 13.2% 15.4% 10.5% 11.5%Pendleton 13.6% 3.2% 1.4% 14.6% 6.7% 0.9% 0.0% - 0.0% -San Dieguito 4.3% 8.7% 9.3% 15.8% 10.5% 7.8% 10.1% 6.2% 5.3% 6.0%Vista 19.7% 22.7% 16.9% 15.2% 20.7% 20.1% 13.7% 12.3% 9.3% 9.1%
North Inland Region 13.3% 15.1% 13.9% 15.2% 13.7% 13.1% 9.6% 10.7% 6.1% 9.0%Anza-Borrego Springs 17.6% 0.0% 34.3% 71.4% 21.9% 15.0% 27.4% 27.5% 7.1% 0.0%Escondido 20.6% 23.7% 21.5% 19.2% 18.5% 19.4% 14.1% 13.4% 8.6% 12.7%Fallbrook 28.8% 30.6% 23.0% 15.7% 20.3% 18.6% 12.6% 12.7% 5.6% 7.0%North San Diego 3.6% 4.8% 5.8% 8.5% 6.3% 3.1% 3.2% 5.8% 4.6% 6.5%Palomar-Julian 43.4% 16.8% 31.2% 25.0% 22.5% 21.2% 16.2% 13.4% 2.5% 6.4%Pauma 14.1% 22.7% 25.7% 33.9% 6.2% 25.7% 5.3% 16.0% 7.1% 5.0%Poway 4.6% 5.7% 5.7% 8.0% 4.8% 5.6% 4.1% 4.4% 4.2% 6.0%Ramona 6.2% 5.2% 6.0% 8.6% 11.1% 4.7% 8.3% 10.3% 3.8% 15.0%San Marcos 13.6% 19.1% 16.4% 18.1% 16.7% 20.1% 14.0% 14.4% 9.4% 10.4%Valley Center 11.7% 12.0% 17.2% 8.7% 10.6% 18.9% 14.2% 15.0% 2.8% 8.4%
South Region 20.1% 20.8% 22.9% 18.0% 11.9% 14.5% 13.0% 11.3% 11.2% 13.2%Chula Vista 28.8% 24.4% 27.6% 20.7% 15.3% 16.2% 17.5% 15.8% 12.3% 15.1%Coronado 5.8% 6.3% 8.6% 8.4% 5.4% 6.1% 7.4% 6.5% 2.8% 4.1%National City 30.8% 34.3% 35.1% 27.9% 18.8% 24.2% 21.8% 16.8% 19.7% 19.3%South Bay 22.9% 26.4% 29.0% 21.5% 13.2% 17.4% 14.4% 13.3% 12.2% 16.5%Sweetwater 6.5% 10.9% 11.3% 7.8% 5.5% 8.3% 6.3% 4.1% 8.0% 7.2%
San Diego County 18.0% 19.0% 18.3% 23.0% 13.4% 13.6% 11.3% 10.9% 8.4% 10.2% How to interpret this data: 18% of the population under 6 years in San Diego County lived below 100% federal poverty level in 2015.
Percent of the Population, by Age Group, Living Below 100% Federal Poverty Level (FPL)*
33.0%
36.3%
32.4%
32.9%
16.7%
20.4%
17.9%
16.8%
14.8%
16.8%
21.9%
19.3%
17.9%
19.6%
14.5%
13.8%
11.5%
9.8%
8.7%
9.3%
9.4%
10.9%
10.0%
32.8%
10.0%
6.8%
6.7%
7.5%
5.4%
7.9%
13.1%
14.1%
14.8%
14.7%
14.0%
14.9%
11.3%
10.9%
7.3%
8.3%
13.3%
15.1%
13.9%
15.2%
13.7%
13.1%
9.6%
10.7%
6.1%
9.0%
20.1%
20.8%
22.9%
18.0%
11.9%
14.5%
13.0%
11.3%
11.2%
13.2%
18.0%
19.0%
18.3%
23.0%
13.4%
13.6%
11.3%
10.9%
8.4%
10.2%
Under 6 Years
6-11 Years
12-17 Years
18-24 Years
25-34 Years
35-44 Years
45-54 Years
55-64 Years
65-74 Years
75+ Years
Percent Below Poverty Level by Age Group and HHSA Region, 2015
Central Region
East Region
North Central Region
North Coastal Region
North Inland Region
South Region
San Diego County
*Refers to the percentage of people within the age group living below 100% of the federal poverty level (FPL). Source: U.S. Census Bureau, 2011-2015 American Community Survey 5-Year Estimates, Table B17024.Prepared by: County of San Diego, Health and Human Services Agency, Public Health Services, Community Health Statistics Unit, 2017.
Page 34

Source: U.S. Census Bureau; 2011-2015 American Community Survey 5-Year Estimates, Table B17024, B17010.
GeographyPopulation below 100%
federal poverty level (FPL)Families below poverty level
Families with children under 18 years below poverty level
Central Region 22.9% 18.4% 27.8%Central San Diego 20.9% 15.4% 26.8%Mid-City 26.1% 20.1% 29.1%Southeastern San Diego 21.6% 19.0% 27.3%
East Region 14.4% 11.0% 16.6%Alpine 8.7% 5.7% 9.2%El Cajon 21.8% 18.1% 26.1%Harbison-Crest 10.3% 5.9% 8.3%Jamul 7.8% 6.1% 7.3%La Mesa 12.0% 8.6% 13.2%Laguna-Pine Valley 13.7% 8.4% 21.8%Lakeside 11.1% 7.9% 12.6%Lemon Grove 15.2% 11.0% 17.0%Mountain Empire 21.2% 17.2% 21.2%Santee 8.0% 6.2% 9.5%Spring Valley 13.2% 10.3% 14.7%
North Central Region 10.9% 5.9% 8.7%Coastal 11.5% 4.6% 5.0%Del Mar-Mira Mesa 6.3% 4.7% 6.3%Elliott-Navajo 6.7% 3.7% 6.2%Kearny Mesa 13.8% 9.3% 14.4%Miramar 6.3% 6.3% 7.7%Peninsula 10.2% 5.9% 11.1%University 22.9% 5.9% 7.9%
North Coastal Region 12.6% 9.5% 12.3%Carlsbad 10.4% 8.0% 11.4%Oceanside 14.7% 11.4% 14.9%Pendleton 9.6% 9.8% 9.2%San Dieguito 8.3% 6.3% 7.5%Vista 16.7% 11.8% 15.3%
North Inland Region 12.0% 8.9% 11.0%Anza-Borrego Springs 19.6% 18.5% 24.2%Escondido 17.6% 13.3% 17.6%Fallbrook 16.2% 12.3% 19.4%North San Diego 4.9% 3.3% 4.2%Palomar-Julian 16.2% 9.7% 17.3%Pauma 16.1% 10.1% 15.6%Poway 5.1% 3.5% 4.9%Ramona 8.0% 5.2% 4.1%San Marcos 15.7% 12.7% 13.4%Valley Center 12.4% 10.5% 10.4%
South Region 15.5% 13.1% 18.4%Chula Vista 19.0% 17.3% 25.1%Coronado 6.0% 3.9% 6.8%National City 24.5% 22.3% 29.5%South Bay 18.5% 16.3% 22.3%Sweetwater 7.5% 5.5% 8.0%
San Diego County 14.5% 10.6% 15.3%
Poverty Level
22.9%
14.4%
10.9%
12.6%
12.0%
15.5%
14.5%
18.4%
11.0%
5.9%
9.5%
8.9%
13.1%
10.6%
27.8%
16.6%
8.7%
12.3%
11.0%
18.4%
15.3%
Central Region
East Region
North Central Region
North Coastal Region
North Inland Region
South Region
San Diego County
Percent Below Poverty Level by HHSA Region, 2015Population below 100% federal poverty level (FPL)
Families below poverty level
Families with children under 18 years below poverty level
Source: U.S. Census Bureau, 2011-2015 American Community Survey 5-Year Estimates, Table B17024, B17010.Prepared by: County of San Diego, Health and Human Services Agency, Public Health Services, Community Health Statistics Unit, 2017.
Page 35

Source: U.S. Census Bureau; 2011-2015 American Community Survey 5-Year Estimates, Table B09020.
GeographyPopulation Age
65+ Married Couple
FamiliesFamily Household, No
Spouse PresentNon-Family Household
Group Quarters
Male Living Alone
Female Living Alone
Central Region 48,173 45.4% 19.3% 5.5% 3.2% 9.6% 17.0%Central San Diego 17,487 38.0% 11.0% 7.6% 4.8% 15.5% 23.1%Mid-City 13,792 47.4% 19.5% 5.3% 2.0% 8.8% 17.0%Southeastern San Diego 16,894 51.5% 27.8% 3.6% 2.5% 4.1% 10.5%
East Region 64,439 53.4% 14.9% 4.2% 4.0% 7.5% 16.0%Alpine 2,903 55.9% 16.5% 3.6% 1.0% 4.9% 18.2%El Cajon 16,044 52.1% 14.3% 4.3% 7.7% 7.1% 14.4%Harbison-Crest 2,887 61.9% 13.4% 6.9% 0.5% 7.2% 10.0%Jamul 2,518 70.3% 19.9% 1.9% 1.7% 1.8% 4.4%La Mesa 9,181 42.6% 11.7% 3.0% 5.4% 10.1% 27.2%Laguna-Pine Valley 893 70.0% 8.6% 1.3% 0.9% 5.0% 14.1%Lakeside 7,211 54.5% 15.8% 4.9% 2.7% 8.8% 13.3%Lemon Grove 3,670 51.2% 15.1% 4.6% 2.7% 8.9% 17.5%Mountain Empire 1,095 42.6% 20.5% 12.5% 0.0% 10.4% 13.9%Santee 6,524 58.5% 10.4% 3.0% 3.9% 7.5% 16.7%Spring Valley 11,513 54.3% 18.8% 4.5% 1.9% 6.8% 13.9%
North Central Region 80,011 55.5% 13.2% 4.2% 1.7% 8.5% 16.9%Coastal 12,851 60.3% 6.5% 2.7% 1.4% 10.0% 19.1%Del Mar-Mira Mesa 17,017 55.8% 27.1% 3.1% 0.5% 4.1% 9.4%Elliott-Navajo 14,320 59.9% 8.2% 4.1% 1.5% 8.1% 18.2%Kearny Mesa 21,312 52.6% 12.4% 4.3% 3.0% 9.7% 17.9%Miramar 0 - - - - - -Peninsula 7,714 52.8% 6.8% 7.1% 1.6% 11.6% 20.1%University 6,797 48.8% 11.6% 5.9% 2.0% 9.9% 21.7%
North Coastal Region 67,736 58.7% 11.3% 4.1% 2.0% 6.8% 17.0%Carlsbad 20,413 63.1% 8.7% 3.7% 0.9% 6.4% 17.1%Oceanside 20,202 55.1% 13.1% 4.5% 1.2% 8.5% 17.4%Pendleton 30 50.0% 0.0% 0.0% 50.0% 0.0% 0.0%San Dieguito 15,751 60.1% 8.6% 3.9% 2.2% 5.8% 19.4%Vista 11,340 55.4% 16.4% 4.2% 5.0% 6.0% 13.0%
North Inland Region 80,592 57.2% 13.8% 4.0% 2.4% 6.1% 16.6%Anza-Borrego Springs 1,082 59.2% 0.0% 5.9% 0.1% 24.7% 10.1%Escondido 18,300 51.9% 17.4% 3.9% 4.4% 6.0% 16.4%Fallbrook 9,521 66.4% 12.0% 3.5% 0.7% 5.3% 12.0%North San Diego 15,260 55.3% 14.0% 2.6% 3.7% 5.4% 19.0%Palomar-Julian 1,484 71.3% 4.3% 2.6% 0.0% 7.3% 14.6%Pauma 771 73.0% 4.2% 2.9% 2.2% 5.3% 12.5%Poway 12,580 58.4% 13.8% 5.1% 1.9% 5.5% 15.3%Ramona 4,363 62.4% 15.7% 5.8% 0.9% 4.7% 10.5%San Marcos 13,162 50.8% 13.6% 4.6% 1.0% 6.5% 23.5%Valley Center 4,069 68.7% 8.8% 4.1% 0.3% 7.7% 10.4%
South Region 56,723 50.2% 24.7% 3.6% 2.6% 5.5% 13.4%Chula Vista 15,953 50.6% 17.5% 3.5% 2.1% 7.8% 18.5%Coronado 4,299 64.4% 3.4% 3.7% 2.7% 5.5% 20.1%National City 6,442 45.0% 24.2% 3.8% 6.3% 6.8% 13.8%South Bay 15,304 48.4% 32.6% 3.3% 1.4% 4.5% 9.8%Sweetwater 14,725 49.8% 30.6% 3.8% 2.8% 3.6% 9.5%
San Diego County 397,674 54.1% 15.6% 4.2% 2.6% 7.3% 16.2%
Seniors by Household Type
45.4%53.4% 55.5% 58.7% 57.2%
50.2% 54.1%
19.3%14.9% 13.2% 11.3% 13.8% 24.7% 15.6%
5.5%4.2% 4.2% 4.1% 4.0%
3.6%4.2%3.2%
4.0% 1.7% 2.0% 2.4%2.6%
2.6%9.6% 7.5% 8.5% 6.8% 6.1%
5.5%7.3%
17.0% 16.0% 16.9% 17.0% 16.6% 13.4% 16.2%
Central Region
East Region North Central Region
North Coastal Region
North Inland Region
South Region
San Diego County
Senior Household Type by HHSA Region, 2015
Married Couple Families Family Household, No Spouse Present
Non-Family Household Group Quarters
Male Living Alone Female Living Alone
Source: U.S. Census Bureau, 2011-2015 American Community Survey 5-Year Estimates, Table B09020. Prepared by: County of San Diego, Health and Human Services Agency, Public Health Services, Community Health Statistics Unit, 2017.
Page 36

Source: U.S. Census Bureau; 2011-2015 American Community Survey 5-Year Estimates, Table B23001, B17024.
In Labor Force Living below 100% FPL Living below 200% FPLCentral Region 16.1% 15.7% 41.3%
Central San Diego 17.8% 18.8% 44.1%Mid-City 16.2% 13.9% 43.6%Southeastern San Diego 14.3% 14.0% 36.8%
East Region 16.0% 9.0% 27.2%Alpine 18.8% 4.7% 18.9%El Cajon 14.3% 10.8% 32.3%Harbison-Crest 17.7% 9.0% 25.1%Jamul 21.2% 6.3% 13.7%La Mesa 12.3% 9.7% 28.0%Laguna-Pine Valley 26.8% 6.4% 14.1%Lakeside 19.3% 7.9% 23.3%Lemon Grove 13.2% 12.8% 32.8%Mountain Empire 8.0% 20.0% 41.3%Santee 16.9% 5.7% 24.9%Spring Valley 17.3% 8.2% 26.8%
North Central Region 20.4% 6.5% 19.1%Coastal 24.5% 4.9% 14.4%Del Mar-Mira Mesa 25.5% 5.1% 13.4%Elliott-Navajo 17.1% 5.0% 17.8%Kearny Mesa 16.6% 9.8% 26.8%Miramar - - -Peninsula 20.2% 5.8% 22.1%University 19.3% 6.6% 18.4%
North Coastal Region 16.6% 7.8% 22.8%Carlsbad 16.3% 5.4% 18.3%Oceanside 16.4% 11.0% 29.2%Pendleton 50.0% 0.0% 0.0%San Dieguito 18.0% 5.6% 16.9%Vista 15.3% 9.2% 27.5%
North Inland Region 16.8% 7.4% 24.1%Anza-Borrego Springs 25.7% 4.0% 44.5%Escondido 15.3% 10.4% 31.2%Fallbrook 17.8% 6.2% 18.2%North San Diego 17.6% 5.5% 19.5%Palomar-Julian 13.1% 3.8% 20.7%Pauma 25.8% 6.2% 15.4%Poway 17.0% 5.0% 17.4%Ramona 21.2% 8.6% 20.4%San Marcos 14.3% 9.9% 32.4%Valley Center 18.7% 5.2% 19.1%
South Region 14.4% 12.1% 33.3%Chula Vista 12.8% 13.6% 42.4%Coronado 18.4% 3.4% 12.1%National City 14.0% 19.5% 45.1%South Bay 13.5% 14.1% 38.9%Sweetwater 16.1% 7.7% 18.7%
San Diego County 16.9% 9.2% 26.8%
Seniors, Aged 65+ Geography
Seniors: Labor Force and Poverty
16.1% 16.0%
20.4%
16.6% 16.8%
14.4%
16.9%
Central Region East Region North CentralRegion
North CoastalRegion
North InlandRegion
South Region San Diego County
Percent of Seniors, Aged 65+, in the Labor Force by HHSA Region, 2015
Source: U.S. Census Bureau, 2011-2015 American Community Survey 5-Year Estimates, Table B23001.Prepared by: County of San Diego, Health and Human Services Agency, Public Health Services, Community Health Statistics Unit, 2017.
15.7%
9.0%
6.5%7.8% 7.4%
12.1%
9.2%
Central Region East Region North CentralRegion
North CoastalRegion
North InlandRegion
South Region San Diego County
Percent of Seniors, Aged 65+, Living below 100% of the Federal Poverty Level by HHSA Region, 2015
Source: U.S. Census Bureau, 2011-2015 American Community Survey 5-Year Estimates, Table B17024.Prepared by: County of San Diego, Health and Human Services Agency, Public Health Services, Community Health Statistics Unit, 2017.
Page 37

Source: U.S. Census Bureau; 2011-2015 American Community Survey 5-Year Estimates, Table S1810.
# % # % # % # % # % # % # %Central Region 46,759 9.6% 10,079 2.1% 8,343 1.7% 20,164 4.4% 24,976 5.5% 10,174 2.2% 18,760 4.9%
Central San Diego 15,542 9.9% 3,498 2.2% 2,929 1.9% 6,964 4.7% 8,104 5.4% 3,186 2.1% 5,644 4.2%Mid-City 15,750 9.4% 3,640 2.2% 3,050 1.8% 6,646 4.3% 8,131 5.2% 3,236 2.1% 5,803 4.5%Southeastern San Diego 15,467 9.5% 2,941 1.8% 2,364 1.4% 6,554 4.4% 8,741 5.8% 3,752 2.5% 7,313 6.2%
East Region 58,194 12.3% 15,477 3.3% 9,721 2.1% 23,253 5.3% 30,881 7.0% 12,808 2.9% 24,046 6.7%Alpine 2,115 13.5% 844 5.4% 389 2.5% 800 5.4% 1,262 8.5% 494 3.3% 908 7.3%El Cajon 16,499 12.9% 3,559 2.8% 3,067 2.4% 6,671 5.6% 8,759 7.4% 4,115 3.5% 6,975 7.3%Harbison-Crest 2,343 15.2% 622 4.0% 271 1.8% 893 6.0% 1,250 8.4% 441 3.0% 673 5.4%Jamul 1,593 10.1% 496 3.2% 264 1.7% 556 3.7% 754 5.0% 267 1.8% 601 5.0%La Mesa 7,017 11.7% 1,863 3.1% 1,125 1.9% 2,424 4.3% 3,957 7.1% 1,628 2.9% 3,173 6.7%Laguna-Pine Valley 758 14.2% 193 3.6% 91 1.7% 250 5.1% 292 5.9% 143 2.9% 210 5.0%Lakeside 6,349 11.1% 1,982 3.5% 1,018 1.8% 2,800 5.3% 2,941 5.5% 1,075 2.0% 2,416 5.7%Lemon Grove 3,932 12.7% 900 2.9% 619 2.0% 1,543 5.3% 2,400 8.2% 862 3.0% 1,500 6.4%Mountain Empire 1,410 20.6% 654 9.6% 411 6.0% 491 7.8% 651 10.3% 274 4.3% 496 9.5%Santee 5,469 10.7% 1,661 3.2% 982 1.9% 2,111 4.4% 2,697 5.6% 956 2.0% 1,987 5.1%Spring Valley 10,709 12.5% 2,703 3.1% 1,484 1.7% 4,714 5.9% 5,918 7.4% 2,553 3.2% 5,107 7.9%
North Central Region 48,575 8.0% 14,705 2.4% 8,083 1.3% 18,205 3.2% 23,851 4.2% 10,332 1.8% 19,278 3.9%Coastal 5,131 6.9% 1,891 2.5% 780 1.0% 1,692 2.4% 2,361 3.3% 845 1.2% 2,111 3.2%Del Mar-Mira Mesa 10,576 6.3% 2,734 1.6% 1,613 1.0% 4,169 2.6% 4,976 3.2% 2,361 1.5% 4,090 3.2%Elliott-Navajo 8,166 9.1% 2,511 2.8% 1,475 1.6% 3,251 3.9% 3,911 4.7% 1,610 1.9% 3,183 4.6%Kearny Mesa 16,139 10.1% 4,757 3.0% 2,668 1.7% 5,976 4.0% 8,033 5.3% 3,602 2.4% 6,246 4.8%Miramar 67 4.0% 0 0.0% 13 0.8% 54 4.2% 0 0.0% 0 0.0% 10 1.5%Peninsula 5,163 9.1% 1,769 3.1% 1,085 1.9% 2,031 3.8% 2,778 5.2% 1,055 2.0% 2,210 4.7%University 3,333 5.9% 1,043 1.8% 449 0.8% 1,032 1.9% 1,792 3.3% 859 1.6% 1,428 2.9%
North Coastal Region 43,844 8.8% 13,860 2.8% 7,007 1.4% 16,896 3.7% 21,281 4.6% 8,563 1.9% 17,874 4.7%Carlsbad 10,427 8.7% 4,058 3.4% 1,579 1.3% 3,312 2.9% 4,943 4.4% 2,053 1.8% 4,173 4.5%Oceanside 16,750 10.4% 4,945 3.1% 2,957 1.8% 6,774 4.5% 8,165 5.4% 3,498 2.3% 6,874 5.6%Pendleton 409 2.3% 0 0.0% 117 0.7% 214 1.9% 78 0.7% 0 0.0% 39 0.5%San Dieguito 6,816 7.1% 2,539 2.6% 997 1.0% 2,532 2.8% 3,733 4.1% 1,540 1.7% 2,804 3.7%Vista 9,442 9.4% 2,318 2.3% 1,357 1.3% 4,064 4.3% 4,362 4.6% 1,472 1.6% 3,984 5.1%
North Inland Region 55,123 9.4% 16,589 2.8% 9,650 1.6% 21,309 3.9% 28,131 5.2% 10,967 2.0% 22,896 5.2%Anza-Borrego Springs 715 20.5% 177 5.1% 186 5.3% 90 2.8% 406 12.5% 89 2.7% 395 13.5%Escondido 16,201 9.6% 4,285 2.5% 3,041 1.8% 6,982 4.5% 7,779 5.0% 2,928 1.9% 6,641 5.3%Fallbrook 5,993 12.5% 1,843 3.9% 1,207 2.5% 2,578 5.8% 3,164 7.1% 1,240 2.8% 2,633 6.9%North San Diego 8,438 7.6% 2,650 2.4% 970 0.9% 2,683 2.6% 4,475 4.3% 1,887 1.8% 3,333 4.1%Palomar-Julian 681 12.6% 257 4.7% 76 1.4% 203 3.9% 330 6.3% 122 2.3% 273 6.2%Pauma 608 8.8% 125 1.8% 132 1.9% 184 3.0% 309 5.0% 174 2.8% 237 5.0%Poway 6,840 7.7% 2,395 2.7% 1,504 1.7% 2,129 2.6% 3,758 4.6% 1,411 1.7% 3,038 4.6%Ramona 3,847 10.6% 1,228 3.4% 638 1.8% 1,188 3.5% 2,050 6.0% 733 2.1% 1,192 4.4%San Marcos 9,139 9.6% 2,796 3.0% 1,492 1.6% 4,224 4.8% 4,645 5.3% 2,037 2.3% 4,243 5.9%Valley Center 2,661 11.5% 833 3.6% 404 1.8% 1,048 4.8% 1,215 5.6% 346 1.6% 911 5.1%
South Region 49,102 10.3% 13,085 2.8% 10,316 2.2% 19,326 4.4% 26,031 5.9% 12,984 2.9% 20,935 6.0%Chula Vista 13,782 11.9% 3,246 2.8% 2,396 2.1% 6,118 5.7% 7,778 7.2% 4,067 3.8% 6,495 7.5%Coronado 1,808 9.6% 809 4.3% 295 1.6% 510 2.9% 971 5.5% 448 2.5% 660 4.6%National City 5,595 10.1% 1,581 2.9% 1,153 2.1% 1,785 3.5% 3,138 6.1% 1,515 3.0% 2,674 6.5%South Bay 17,842 12.6% 4,705 3.3% 4,916 3.5% 7,076 5.4% 9,139 7.0% 4,612 3.5% 6,809 6.7%Sweetwater 10,075 7.0% 2,744 1.9% 1,556 1.1% 3,837 2.9% 5,005 3.7% 2,342 1.8% 4,297 4.1%
San Diego County 301,597 9.7% 83,795 2.7% 53,120 1.7% 119,153 4.1% 155,151 5.3% 65,828 2.3% 123,789 5.2%
Disability
Hearing difficulty Vision difficulty Cognitive difficultyAmbulatory
difficultySelf-care difficulty
Independent living difficultyGeography
Any disability
9.6%
12.3%
8.0%
8.8%
9.4%
10.3%
9.7%
Central Region
East Region
North Central Region
North Coastal Region
North Inland Region
South Region
San Diego County
Percentage of Population With A Disability by HHSA Region, 2015
Source: U.S. Census Bureau, 2011-2015 American Community Survey 5-Year Estimates, Table S1810.Prepared by: County of San Diego, Health and Human Services Agency,Public Health Services, Community Health Statistics Unit, 2017.
Page 38

Source: U.S. Census Bureau; 2011-2015 American Community Survey 5-Year Estimates, Table S1810.*Please note that # refer to the number of people within the age group with a disability and % refers to the percent of those with a disability within that age group.
# % # % # % # % # % # %Central Region 291 0.9% 2,727 3.8% 6,253 3.9% 19,616 11.1% 7,394 27.2% 10,478 52.1%
Central San Diego 87 1.1% 486 3.4% 1,941 3.4% 6,680 10.8% 2,666 26.8% 3,682 52.2%Mid-City 159 1.3% 1,144 4.3% 2,104 3.6% 7,031 12.2% 2,494 30.8% 2,818 51.3%Southeastern San Diego 45 0.3% 1,097 3.5% 2,208 4.9% 5,905 10.4% 2,234 24.3% 3,978 52.5%
East Region 188 0.6% 4,179 5.1% 6,185 5.6% 23,377 12.6% 9,417 26.7% 14,848 54.4%Alpine 0 0.0% 171 7.0% 134 4.3% 696 10.9% 354 21.6% 760 60.3%El Cajon 86 1.0% 1,223 5.3% 2,090 6.2% 7,179 15.2% 2,404 29.3% 3,517 50.8%Harbison-Crest 0 0.0% 203 8.7% 204 7.5% 999 14.3% 451 25.3% 486 44.5%Jamul 0 0.0% 98 3.3% 188 7.9% 513 7.2% 470 27.7% 324 40.2%La Mesa 29 0.7% 429 5.2% 672 4.2% 2,502 11.0% 852 20.1% 2,533 56.2%Laguna-Pine Valley 0 0.0% 43 5.7% 65 5.7% 314 14.5% 205 31.1% 131 56.0%Lakeside 0 0.0% 449 4.2% 791 6.4% 2,201 9.6% 1,244 28.7% 1,664 58.9%Lemon Grove 7 0.4% 336 5.8% 278 3.9% 1,568 12.4% 741 36.1% 1,002 64.6%Mountain Empire 41 7.5% 76 6.9% 48 3.5% 741 27.1% 140 23.3% 364 73.5%Santee 0 0.0% 374 4.2% 652 5.8% 2,363 11.1% 919 24.1% 1,161 46.8%Spring Valley 25 0.4% 777 4.9% 1,063 5.4% 4,301 12.9% 1,637 26.2% 2,906 56.9%
North Central Region 165 0.5% 3,181 3.9% 5,339 3.0% 15,245 6.6% 8,285 18.9% 16,360 46.3%Coastal 0 0.0% 232 3.5% 494 1.8% 1,258 5.1% 1,043 14.8% 2,104 37.2%Del Mar-Mira Mesa 19 0.2% 1,125 3.7% 1,345 3.7% 3,496 4.7% 1,806 16.2% 2,785 47.3%Elliott-Navajo 10 0.2% 583 4.0% 757 3.7% 2,378 7.0% 1,323 18.3% 3,115 44.1%Kearny Mesa 136 1.4% 904 4.6% 1,835 3.8% 5,723 9.4% 2,651 24.4% 4,890 49.0%Miramar 0 0.0% 49 8.0% 18 3.6% 0 0.0% 0 - 0 -Peninsula 0 0.0% 114 1.9% 551 3.2% 1,685 7.6% 883 22.7% 1,930 51.7%University 0 0.0% 174 4.3% 339 1.2% 705 4.5% 579 15.8% 1,536 51.1%
North Coastal Region 167 0.5% 2,495 3.0% 5,113 4.5% 14,404 7.4% 6,473 18.0% 15,192 49.5%Carlsbad 35 0.5% 571 2.9% 959 4.4% 2,745 5.3% 1,449 13.7% 4,668 48.1%Oceanside 34 0.3% 840 3.1% 2,437 6.1% 6,356 10.1% 2,480 22.2% 4,603 52.0%Pendleton 86 1.4% 89 2.4% 234 3.5% 0 0.0% 0 0.0% 0 -San Dieguito 0 0.0% 428 2.7% 421 2.4% 1,647 3.9% 1,166 14.0% 3,154 44.3%Vista 12 0.2% 567 3.4% 1,062 3.7% 3,656 9.6% 1,378 23.1% 2,767 54.8%
North Inland Region 126 0.3% 3,147 3.0% 5,604 4.4% 18,945 8.0% 8,967 20.7% 18,334 51.2%Anza-Borrego Springs 0 0.0% 0 0.0% 0 0.0% 284 22.3% 137 22.6% 294 61.9%Escondido 36 0.3% 1,102 3.7% 2,274 5.0% 5,928 9.5% 2,779 28.4% 4,082 51.4%Fallbrook 0 0.0% 288 4.3% 607 6.1% 1,928 10.4% 993 19.2% 2,177 50.6%North San Diego 51 0.6% 425 2.0% 855 4.2% 2,705 5.7% 1,175 14.8% 3,227 47.6%Palomar-Julian 0 0.0% 23 2.8% 37 6.3% 236 10.2% 200 20.0% 185 38.2%Pauma 2 0.3% 45 3.1% 54 3.5% 187 7.8% 199 44.1% 121 37.8%Poway 13 0.2% 325 2.0% 636 4.0% 2,010 5.3% 1,198 17.1% 2,658 49.9%Ramona 24 1.3% 297 4.4% 380 5.5% 1,474 9.2% 496 19.9% 1,176 63.0%San Marcos 0 0.0% 511 3.0% 531 2.6% 3,036 8.1% 1,463 22.4% 3,598 54.9%Valley Center 0 0.0% 131 3.5% 230 5.7% 1,157 11.6% 327 14.0% 816 46.9%
South Region 193 0.6% 3,549 3.9% 5,091 4.3% 17,494 10.0% 8,141 26.8% 14,634 57.6%Chula Vista 26 0.3% 990 4.8% 1,457 4.8% 4,816 11.8% 2,118 26.5% 4,375 56.4%Coronado 0 0.0% 95 2.9% 49 1.7% 435 5.8% 268 12.6% 961 46.7%National City 26 0.7% 286 2.8% 500 3.5% 2,086 10.0% 909 28.3% 1,788 60.8%South Bay 105 0.9% 1,588 5.7% 2,056 5.5% 6,822 13.6% 2,903 34.1% 4,368 65.9%Sweetwater 36 0.4% 590 2.0% 1,029 3.1% 3,335 5.9% 1,943 22.9% 3,142 52.2%
San Diego County 1,130 0.5% 19,278 3.7% 33,585 4.2% 109,081 9.1% 48,677 22.5% 89,846 51.4%
How to interpret this data: In 2015, over half (51.4%) of the population 75 years and over in San Diego County had a disability.
Percent of the Population with a Disability by Age Group*
GeographyUnder 5 Years 5-17 Years 18-34 Years 35-64 Years 65-74 Years 75+ Years
0.9%
0.6%
0.5%
0.5%
0.3%
0.6%
0.5%
3.8%
5.1%
3.9%
3.0%
3.0%
3.9%
3.7%
3.9%
5.6%
3.0%
4.5%
4.4%
4.3%
4.2%
11.1%
12.6%
6.6%
7.4%
8.0%
10.0%
9.1%
27.2%
26.7%
18.9%
18.0%
20.7%
26.8%
22.5%
52.1%
54.4%
46.3%
49.5%
51.2%
57.6%
51.4%
Central Region
East Region
North Central Region
North Coastal Region
North Inland Region
South Region
San Diego County
Percentage of Population With A Disability*, by Age Group, by HHSA Region, 2015
*Refers to the percent of those with a disability within the specific age group. Source: U.S. Census Bureau, 2011-2015 American Community Survey 5-Year Estimates, Table S1810.Prepared by: County of San Diego, Health and Human Services Agency, Public Health Services, Community Health Statistics Unit, 2017.
Page 39
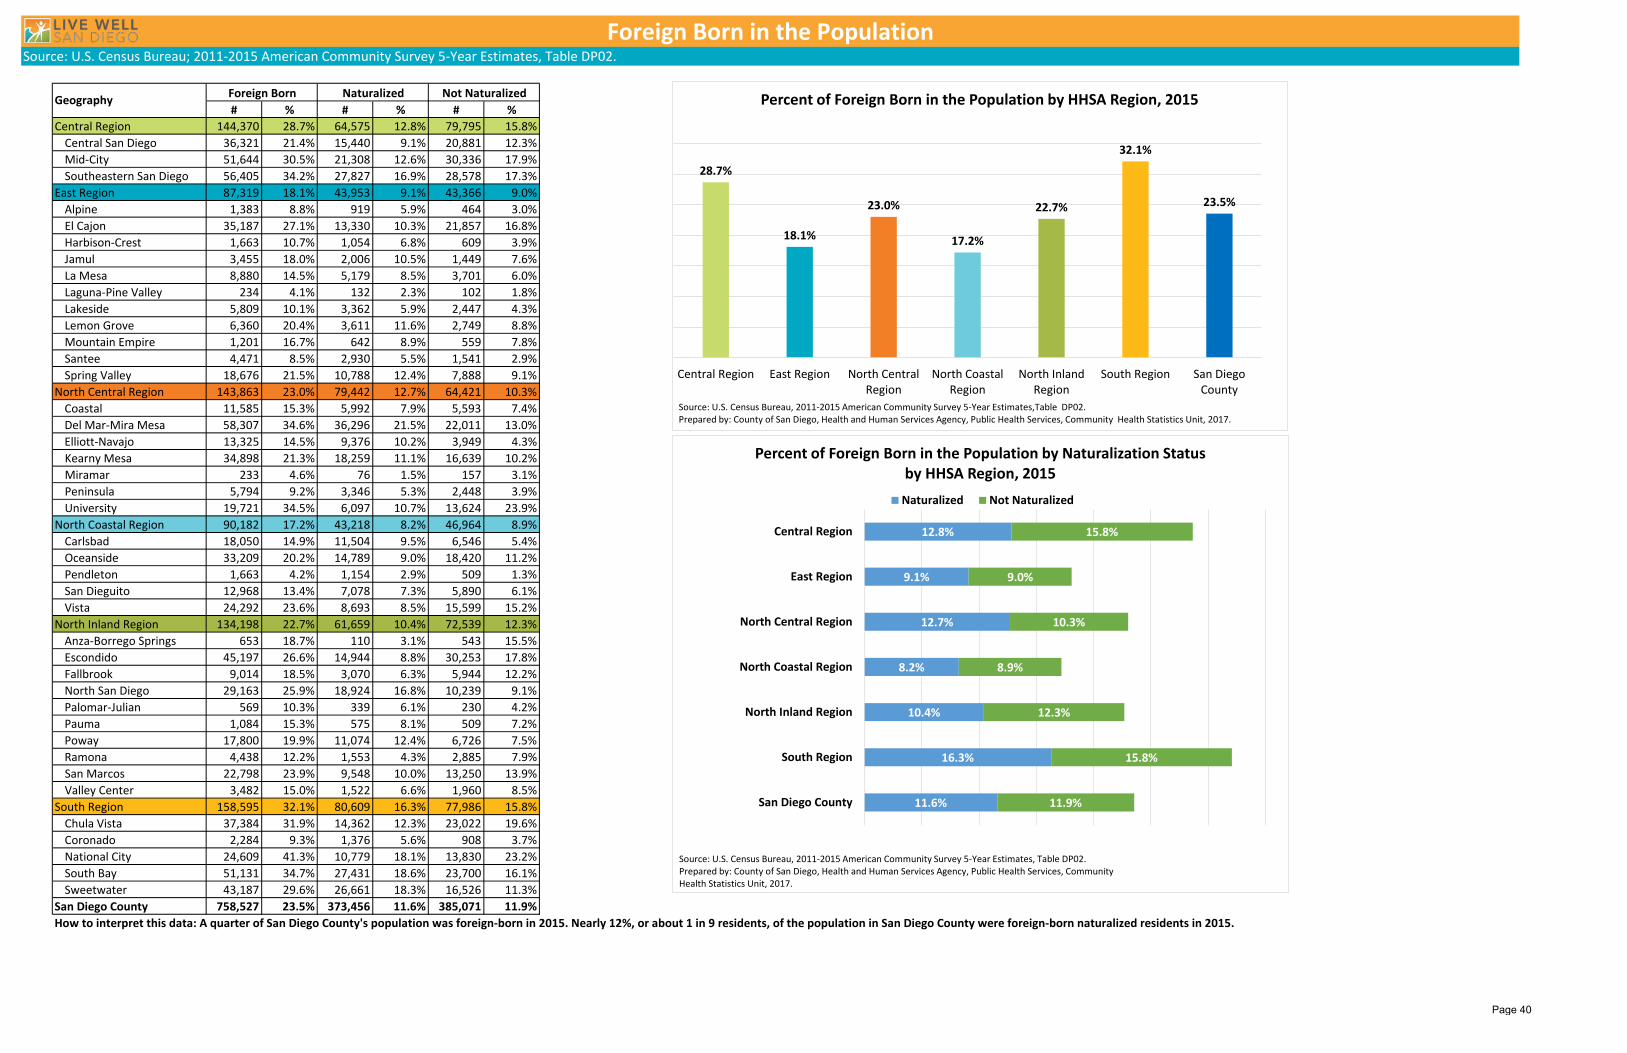
Source: U.S. Census Bureau; 2011-2015 American Community Survey 5-Year Estimates, Table DP02.
# % # % # %Central Region 144,370 28.7% 64,575 12.8% 79,795 15.8%
Central San Diego 36,321 21.4% 15,440 9.1% 20,881 12.3%Mid-City 51,644 30.5% 21,308 12.6% 30,336 17.9%Southeastern San Diego 56,405 34.2% 27,827 16.9% 28,578 17.3%
East Region 87,319 18.1% 43,953 9.1% 43,366 9.0%Alpine 1,383 8.8% 919 5.9% 464 3.0%El Cajon 35,187 27.1% 13,330 10.3% 21,857 16.8%Harbison-Crest 1,663 10.7% 1,054 6.8% 609 3.9%Jamul 3,455 18.0% 2,006 10.5% 1,449 7.6%La Mesa 8,880 14.5% 5,179 8.5% 3,701 6.0%Laguna-Pine Valley 234 4.1% 132 2.3% 102 1.8%Lakeside 5,809 10.1% 3,362 5.9% 2,447 4.3%Lemon Grove 6,360 20.4% 3,611 11.6% 2,749 8.8%Mountain Empire 1,201 16.7% 642 8.9% 559 7.8%Santee 4,471 8.5% 2,930 5.5% 1,541 2.9%Spring Valley 18,676 21.5% 10,788 12.4% 7,888 9.1%
North Central Region 143,863 23.0% 79,442 12.7% 64,421 10.3%Coastal 11,585 15.3% 5,992 7.9% 5,593 7.4%Del Mar-Mira Mesa 58,307 34.6% 36,296 21.5% 22,011 13.0%Elliott-Navajo 13,325 14.5% 9,376 10.2% 3,949 4.3%Kearny Mesa 34,898 21.3% 18,259 11.1% 16,639 10.2%Miramar 233 4.6% 76 1.5% 157 3.1%Peninsula 5,794 9.2% 3,346 5.3% 2,448 3.9%University 19,721 34.5% 6,097 10.7% 13,624 23.9%
North Coastal Region 90,182 17.2% 43,218 8.2% 46,964 8.9%Carlsbad 18,050 14.9% 11,504 9.5% 6,546 5.4%Oceanside 33,209 20.2% 14,789 9.0% 18,420 11.2%Pendleton 1,663 4.2% 1,154 2.9% 509 1.3%San Dieguito 12,968 13.4% 7,078 7.3% 5,890 6.1%Vista 24,292 23.6% 8,693 8.5% 15,599 15.2%
North Inland Region 134,198 22.7% 61,659 10.4% 72,539 12.3%Anza-Borrego Springs 653 18.7% 110 3.1% 543 15.5%Escondido 45,197 26.6% 14,944 8.8% 30,253 17.8%Fallbrook 9,014 18.5% 3,070 6.3% 5,944 12.2%North San Diego 29,163 25.9% 18,924 16.8% 10,239 9.1%Palomar-Julian 569 10.3% 339 6.1% 230 4.2%Pauma 1,084 15.3% 575 8.1% 509 7.2%Poway 17,800 19.9% 11,074 12.4% 6,726 7.5%Ramona 4,438 12.2% 1,553 4.3% 2,885 7.9%San Marcos 22,798 23.9% 9,548 10.0% 13,250 13.9%Valley Center 3,482 15.0% 1,522 6.6% 1,960 8.5%
South Region 158,595 32.1% 80,609 16.3% 77,986 15.8%Chula Vista 37,384 31.9% 14,362 12.3% 23,022 19.6%Coronado 2,284 9.3% 1,376 5.6% 908 3.7%National City 24,609 41.3% 10,779 18.1% 13,830 23.2%South Bay 51,131 34.7% 27,431 18.6% 23,700 16.1%Sweetwater 43,187 29.6% 26,661 18.3% 16,526 11.3%
San Diego County 758,527 23.5% 373,456 11.6% 385,071 11.9%How to interpret this data: A quarter of San Diego County's population was foreign-born in 2015. Nearly 12%, or about 1 in 9 residents, of the population in San Diego County were foreign-born naturalized residents in 2015.
Foreign Born in the Population
Not NaturalizedNaturalizedForeign BornGeography
12.8%
9.1%
12.7%
8.2%
10.4%
16.3%
11.6%
15.8%
9.0%
10.3%
8.9%
12.3%
15.8%
11.9%
Central Region
East Region
North Central Region
North Coastal Region
North Inland Region
South Region
San Diego County
Percent of Foreign Born in the Population by Naturalization Status by HHSA Region, 2015
Naturalized Not Naturalized
Source: U.S. Census Bureau, 2011-2015 American Community Survey 5-Year Estimates, Table DP02.Prepared by: County of San Diego, Health and Human Services Agency, Public Health Services, Community Health Statistics Unit, 2017.
28.7%
18.1%
23.0%
17.2%
22.7%
32.1%
23.5%
Central Region East Region North CentralRegion
North CoastalRegion
North InlandRegion
South Region San DiegoCounty
Percent of Foreign Born in the Population by HHSA Region, 2015
Source: U.S. Census Bureau, 2011-2015 American Community Survey 5-Year Estimates,Table DP02.Prepared by: County of San Diego, Health and Human Services Agency, Public Health Services, Community Health Statistics Unit, 2017.
Page 40

Source: U.S. Census Bureau; 2011-2015 American Community Survey 5-Year Estimates, Table B10051.
Living with Grandchild
Responsible for Grandchild (no parent present)
Living with Grandchild
Responsible for Grandchild (no parent
present)Central Region 14,371 5.7% 7,369 49.6% 7,002 50.4%
Central San Diego 2,164 12.2% 1,154 53.6% 1,010 46.4%Mid-City 4,523 2.5% 2,297 27.7% 2,226 72.3%Southeastern San Diego 7,684 5.8% 3,918 52.8% 3,766 47.2%
East Region 12,806 11.3% 5,577 47.8% 7,229 52.2%Alpine 195 5.1% 28 0.0% 167 100.0%El Cajon 3,192 11.0% 1,508 45.2% 1,684 54.8%Harbison-Crest 583 10.6% 170 0.0% 413 100.0%Jamul 588 16.0% 203 67.0% 385 33.0%La Mesa 1,305 16.2% 770 76.3% 535 23.7%Laguna-Pine Valley 117 5.1% 23 16.7% 94 83.3%Lakeside 1,182 9.2% 428 26.6% 754 73.4%Lemon Grove 1,061 7.9% 422 57.1% 639 42.9%Mountain Empire 312 60.3% 173 55.3% 139 44.7%Santee 1,000 11.9% 322 40.3% 678 59.7%Spring Valley 3,271 6.3% 1,530 36.9% 1,741 63.1%
North Central Region 10,033 5.6% 2,647 29.7% 7,386 70.3%Coastal 613 13.4% 130 24.4% 483 75.6%Del Mar-Mira Mesa 4,500 4.7% 1,110 18.0% 3,390 82.0%Elliott-Navajo 1,439 8.1% 442 39.7% 997 60.3%Kearny Mesa 2,757 2.7% 796 76.0% 1,961 24.0%Miramar 0 0.0% 0 0.0% 0 0.0%Peninsula 243 10.7% 97 19.2% 146 80.8%University 481 10.0% 72 0.0% 409 100.0%
North Coastal Region 9,838 6.3% 4,315 54.8% 5,523 45.2%Carlsbad 1,299 3.2% 358 43.9% 941 56.1%Oceanside 4,213 9.1% 2,007 59.9% 2,206 40.1%Pendleton 15 0.0% 0 - 15 -San Dieguito 1,420 5.0% 446 83.1% 974 16.9%Vista 2,891 4.4% 1,504 27.0% 1,387 73.0%
North Inland Region 14,501 6.1% 6,413 56.0% 8,088 44.0%Anza-Borrego Springs 142 0.0% 0 - 142 -Escondido 4,776 4.0% 2,631 75.3% 2,145 24.7%Fallbrook 1,235 10.4% 478 23.3% 757 76.7%North San Diego 2,180 4.0% 445 21.6% 1,735 78.4%Palomar-Julian 39 5.1% 24 100.0% 15 0.0%Pauma 172 14.5% 133 56.0% 39 44.0%Poway 1,929 4.4% 557 0.0% 1,372 100.0%Ramona 1,177 13.8% 586 60.5% 591 39.5%San Marcos 2,147 4.8% 1,093 100.0% 1,054 0.0%Valley Center 704 14.6% 466 85.4% 238 14.6%
South Region 21,850 3.9% 9,716 35.9% 12,134 64.1%Chula Vista 4,343 3.3% 2,180 35.9% 2,163 64.1%Coronado 158 20.9% 0 0.0% 158 100.0%National City 2,733 4.7% 1,401 50.4% 1,332 49.6%South Bay 9,077 3.1% 4,620 53.4% 4,457 46.6%Sweetwater 5,539 4.8% 1,515 14.7% 4,024 85.3%
San Diego County 83,399 6.2% 36,037 46.4% 47,362 53.6%Please note that there was a change in methodology to estimate the percentage of grandparents living and/or responsible for own grandchildren under 18 years. Therefore, this data cannot be compared to past years of demographic profiles.*Grandparent 30 years or older living with own grandchildren under 18 years in households out of grandparents 30 years and older. Grandparent reponsible for grandchild without parent of children present.
Grandparents Living with Grandchildren Under 18 Years by Responsibility for Grandchildren
Geography
30-59 Population 60+ PopulationNumber of Grandparents Living
with Grandchildren*
Responsible for Grandchild without a
parent present
14,371 12,80610,033 9,838
14,501
21,850
83,399
Central Region East Region North CentralRegion
North CoastalRegion
North InlandRegion
South Region San DiegoCounty
Number of Grandparents, 30 Years and Older, Living with Own Grandchild(ren)* by HHSA Region, 2015
*Grandparent, 30 years or older, living with own grandchildren under 18 years in households out of total population 30 years and older. Source: U.S. Census Bureau, 2011-2015 American Community Survey 5-Year Estimates, Table B10051.Prepared by: County of San Diego, Health and Human Services Agency, Public Health Services, Community Health Statistics Unit, 2017.
5.7%
11.3%
5.6%6.3% 6.1%
3.9%
6.2%
0%
2%
4%
6%
8%
10%
12%
14%
16%
18%
20%
Central Region East Region North CentralRegion
North CoastalRegion
North InlandRegion
South Region San DiegoCounty
Percent of Grandparent 30 Years and Older Raising Grandchild Without Parent Present by HHSA Region, 2015
*Grandparent, 30 years or older, raising own grandchildren under 18 years in households out of total population 30 years and older. Source: U.S. Census Bureau, 2011-2015 American Community Survey 5-Year Estimates, Table B10051.Prepared by: County of San Diego, Health and Human Services Agency, Public Health Services, Community Health Statistics Unit, 2017.
Page 41

Source: U.S. Census Bureau; 2011-2015 American Community Survey 5-Year Estimates, Table B27001.
Geography With Health Insurance
No Health Insurance
0-17 w/ HealthInsurance
18-24 w/ HealthInsurance
25-44 w/ HealthInsurance
45-64 w/ HealthInsurance
65+ w/ Health Insurance
Central Region 79.4% 20.6% 90.0% 69.6% 70.9% 79.5% 97.2%Central San Diego 80.2% 19.8% 87.8% 66.5% 75.7% 80.4% 98.0%Mid-City 79.0% 21.0% 90.8% 73.6% 67.5% 80.5% 96.5%Southeastern San Diego 78.9% 21.1% 90.4% 65.7% 67.6% 77.7% 97.0%
East Region 87.1% 12.9% 92.8% 78.6% 79.7% 86.5% 98.7%Alpine 91.5% 8.5% 95.5% 89.0% 85.6% 88.6% 99.8%El Cajon 83.9% 16.1% 92.0% 75.3% 73.7% 84.1% 98.1%Harbison-Crest 91.6% 8.4% 94.3% 87.0% 83.9% 91.9% 98.6%Jamul 92.0% 8.0% 97.9% 89.3% 85.0% 89.5% 98.3%La Mesa 87.7% 12.3% 93.3% 82.4% 82.7% 84.9% 98.3%Laguna-Pine Valley 84.4% 15.6% 85.2% 66.0% 72.4% 90.1% 98.2%Lakeside 89.4% 10.6% 92.7% 82.7% 85.3% 87.7% 99.6%Lemon Grove 82.9% 17.1% 89.8% 72.5% 77.8% 79.4% 96.9%Mountain Empire 81.1% 18.9% 81.6% 68.8% 69.2% 82.9% 100.0%Santee 91.7% 8.3% 95.4% 82.7% 87.1% 92.1% 100.0%Spring Valley 86.7% 13.3% 93.2% 75.6% 77.9% 86.9% 98.6%
North Central Region 90.5% 9.5% 95.8% 85.2% 86.0% 90.2% 98.8%Coastal 90.0% 10.0% 95.4% 85.1% 84.7% 91.1% 99.7%Del Mar-Mira Mesa 92.9% 7.1% 97.0% 86.5% 89.7% 92.7% 98.1%Elliott-Navajo 93.2% 6.8% 96.9% 88.4% 88.9% 91.5% 99.8%Kearny Mesa 86.7% 13.3% 93.0% 79.9% 80.9% 86.6% 98.6%Miramar 99.5% 0.5% 100.0% 100.0% 98.2% 100.0% -Peninsula 88.4% 11.6% 95.2% 81.6% 81.5% 89.9% 99.8%University 92.3% 7.7% 97.4% 92.0% 91.4% 88.0% 96.6%
North Coastal Region 87.3% 12.7% 94.2% 79.5% 79.1% 86.5% 98.5%Carlsbad 91.3% 8.7% 93.3% 87.1% 85.9% 90.8% 99.4%Oceanside 84.9% 15.1% 93.4% 74.9% 76.9% 83.9% 97.5%Pendleton 100.0% 0.0% 100.0% 100.0% 100.0% 100.0% 100.0%San Dieguito 90.9% 9.1% 94.4% 87.5% 84.8% 89.6% 99.3%Vista 80.6% 19.4% 93.8% 71.0% 67.8% 80.8% 97.2%
North Inland Region 86.6% 13.4% 93.6% 77.4% 76.0% 87.1% 99.2%Anza-Borrego Springs 85.7% 14.3% 100.0% 100.0% 60.7% 75.9% 100.0%Escondido 79.8% 20.2% 90.7% 70.2% 65.1% 82.3% 98.8%Fallbrook 83.8% 16.2% 93.5% 72.0% 66.3% 83.7% 99.2%North San Diego 94.8% 5.2% 96.8% 87.7% 92.4% 94.8% 99.5%Palomar-Julian 80.5% 19.5% 90.9% 63.5% 60.8% 71.8% 98.7%Pauma 84.4% 15.6% 92.2% 71.9% 76.5% 79.9% 99.4%Poway 94.9% 5.1% 98.0% 89.6% 90.7% 94.9% 99.1%Ramona 85.3% 14.7% 89.8% 84.5% 76.1% 83.5% 99.3%San Marcos 84.2% 15.8% 93.6% 77.6% 72.7% 82.0% 99.0%Valley Center 84.2% 15.8% 88.0% 72.0% 62.8% 88.6% 99.6%
South Region 83.1% 16.9% 90.6% 72.2% 75.9% 80.9% 97.3%Chula Vista 81.5% 18.5% 90.4% 72.4% 72.6% 76.8% 98.1%Coronado 94.7% 5.3% 97.9% 94.2% 89.3% 92.2% 99.5%National City 72.8% 27.2% 85.1% 58.5% 61.1% 69.4% 96.1%South Bay 80.0% 20.0% 87.9% 67.2% 72.6% 78.1% 96.8%Sweetwater 89.9% 10.1% 94.6% 82.7% 86.2% 89.0% 96.9%
San Diego County 85.9% 14.1% 92.9% 77.2% 78.1% 85.5% 98.4%
Health Insurance Status
79.4%87.1% 90.5% 87.3% 86.6% 83.1% 85.9%
20.6%12.9% 9.5% 12.7% 13.4% 16.9% 14.1%
CentralRegion
East Region North CentralRegion
North CoastalRegion
North InlandRegion
South Region San DiegoCounty
Health Insurance Status by HHSA Region, 2015With Health Insurance No Health Insurance
Source: U.S. Census Bureau, 2011-2015 American Community Survey 5-Year Estimates, Table B27001.Prepared by: County of San Diego, Health and Human Services Agency, Public Health Services, Community Health Statistics Unit, 2017.
Page 42

Source: U.S. Census Bureau; 2011-2015 American Community Survey 5-Year Estimates, Table DP03.
Earnings Social Security IncomeSupplemental Security
IncomeCash Public Assistance
IncomeRetirement Income
Food Stamps/ SNAP Benefits
Central Region 176,377 65,416$ 82.2% 20.0% 6.4% 3.8% 12.8% 10.9%Central San Diego 76,359 75,925$ 82.8% 17.1% 5.0% 2.3% 10.0% 6.7%Mid-City 57,011 58,971$ 81.6% 19.3% 7.5% 4.9% 11.2% 14.1%Southeastern San Diego 43,007 59,807$ 82.0% 26.0% 7.5% 4.9% 19.9% 14.2%
East Region 161,962 76,664$ 79.0% 28.5% 6.7% 4.5% 21.5% 9.9%Alpine 5,667 92,793$ 78.2% 33.9% 5.1% 2.6% 25.2% 3.6%El Cajon 41,823 68,427$ 78.3% 26.8% 9.1% 8.6% 17.8% 18.5%Harbison-Crest 5,444 86,354$ 73.2% 37.5% 7.1% 2.5% 28.2% 5.3%Jamul 4,792 117,485$ 84.1% 29.4% 4.0% 1.2% 25.2% 2.3%La Mesa 24,715 75,822$ 76.4% 28.9% 6.1% 2.0% 21.0% 6.9%Laguna-Pine Valley 1,928 86,959$ 77.2% 36.5% 3.8% 2.6% 27.3% 3.8%Lakeside 19,491 78,311$ 81.7% 26.1% 5.8% 3.5% 19.6% 6.4%Lemon Grove 9,746 65,654$ 80.1% 29.2% 6.7% 3.7% 21.4% 9.7%Mountain Empire 2,277 64,727$ 65.4% 38.2% 9.6% 3.0% 24.9% 6.9%Santee 18,275 84,685$ 81.1% 27.2% 5.4% 2.8% 22.9% 5.1%Spring Valley 27,804 75,605$ 80.5% 28.7% 5.8% 4.3% 24.3% 9.8%
North Central Region 237,488 102,570$ 83.0% 22.0% 3.4% 1.4% 16.1% 2.6%Coastal 35,045 119,845$ 80.0% 23.5% 1.6% 0.9% 15.0% 1.5%Del Mar-Mira Mesa 55,425 127,112$ 89.5% 17.7% 3.8% 1.3% 14.7% 2.4%Elliott-Navajo 35,131 95,485$ 79.9% 27.0% 3.5% 1.3% 21.9% 2.7%Kearny Mesa 61,877 81,806$ 81.5% 24.2% 4.8% 1.9% 16.9% 3.9%Miramar 532 60,643$ 95.7% 0.0% 0.0% 1.1% 0.0% 2.1%Peninsula 25,058 94,986$ 82.2% 21.6% 2.8% 1.2% 15.9% 2.8%University 24,420 91,177$ 81.3% 17.8% 2.1% 1.0% 11.2% 1.4%
North Coastal Region 179,429 93,361$ 77.1% 25.8% 3.2% 2.0% 17.6% 4.0%Carlsbad 47,025 108,055$ 74.3% 29.7% 2.5% 1.1% 20.0% 2.0%Oceanside 56,351 74,476$ 77.4% 26.2% 4.8% 2.5% 19.7% 6.2%Pendleton 6,661 47,602$ 94.9% 1.6% 0.0% 0.2% 2.1% 4.6%San Dieguito 37,035 132,525$ 77.3% 27.0% 1.7% 1.5% 16.1% 1.5%Vista 32,357 69,909$ 76.6% 22.9% 3.9% 3.3% 15.5% 5.7%
North Inland Region 196,816 92,568$ 78.2% 27.9% 3.7% 1.9% 19.3% 4.8%Anza-Borrego Springs 1,627 32,443$ 64.3% 46.7% 9.3% 5.3% 28.1% 19.6%Escondido 51,908 76,550$ 79.9% 23.9% 4.4% 2.6% 15.5% 7.3%Fallbrook 17,251 76,601$ 71.8% 37.6% 3.8% 1.9% 23.6% 6.2%North San Diego 40,424 112,638$ 83.0% 25.1% 3.6% 1.1% 18.6% 2.3%Palomar-Julian 2,280 54,033$ 63.1% 48.4% 2.1% 5.1% 29.1% 10.9%Pauma 2,153 78,250$ 79.7% 25.3% 1.7% 1.6% 14.1% 5.3%Poway 30,092 132,243$ 81.8% 26.6% 3.2% 1.2% 20.3% 1.6%Ramona 11,456 91,020$ 81.7% 28.9% 4.3% 4.4% 20.7% 6.8%San Marcos 31,796 74,455$ 71.6% 29.4% 3.2% 1.3% 20.2% 4.4%Valley Center 7,829 86,385$ 71.7% 35.9% 2.9% 1.7% 26.5% 3.8%
South Region 142,085 70,196$ 81.8% 26.8% 6.9% 3.6% 18.7% 10.6%Chula Vista 37,326 55,760$ 75.8% 30.5% 7.4% 3.8% 19.4% 14.1%Coronado 8,500 122,706$ 72.9% 34.0% 1.6% 0.9% 27.1% 1.1%National City 15,210 52,480$ 80.3% 28.2% 8.7% 5.6% 13.2% 14.9%South Bay 38,313 58,501$ 83.3% 28.0% 9.0% 5.5% 17.1% 15.4%Sweetwater 42,736 95,350$ 88.0% 20.6% 4.8% 1.6% 19.7% 3.5%
San Diego County 1,094,157 87,081$ 80.3% 24.9% 4.8% 2.7% 17.5% 6.7%
GeographyMean Household Earnings
Percent of Households
Income and Benefits
Total Households
Page 43

Source: U.S. Census Bureau; 2011-2015 American Community Survey 5-Year Estimates, Table B22002, B22007, B17024.
Geography HouseholdFamilies with
Children under 18 years
Population at or Below 130% FLP
Population at or Below 138% FPL
Population 139 to 350% FPL
Central Region 10.9% 13.7% 30.7% 32.7% 36.6%Central San Diego 6.7% 9.7% 27.4% 29.0% 30.3%Mid-City 14.1% 16.5% 35.7% 38.2% 37.3%Southeastern San Diego 14.2% 14.1% 28.9% 30.9% 42.1%
East Region 9.9% 9.6% 19.8% 21.4% 34.5%Alpine 3.6% 4.2% 12.7% 13.8% 25.4%El Cajon 18.5% 17.7% 29.4% 31.6% 34.8%Harbison-Crest 5.3% 5.0% 13.0% 14.8% 34.9%Jamul 2.3% 2.3% 10.0% 10.9% 20.9%La Mesa 6.9% 7.0% 17.4% 18.8% 33.4%Laguna-Pine Valley 3.8% 3.3% 18.4% 21.0% 28.3%Lakeside 6.4% 5.8% 14.6% 15.6% 36.0%Lemon Grove 9.7% 12.3% 20.9% 22.8% 44.1%Mountain Empire 6.9% 6.3% 30.7% 34.7% 29.0%Santee 5.1% 3.9% 11.0% 12.1% 29.9%Spring Valley 9.8% 9.1% 19.1% 20.3% 37.8%
North Central Region 2.6% 2.5% 14.8% 15.8% 26.1%Coastal 1.5% 1.1% 14.6% 15.3% 23.5%Del Mar-Mira Mesa 2.4% 2.2% 8.8% 9.5% 21.3%Elliott-Navajo 2.7% 2.4% 11.4% 12.4% 26.9%Kearny Mesa 3.9% 3.8% 19.3% 20.8% 31.0%Miramar 2.1% 2.1% 23.9% 26.9% 51.1%Peninsula 2.8% 2.4% 14.5% 15.6% 30.6%University 1.4% 2.1% 25.7% 26.5% 23.6%
North Coastal Region 4.0% 4.0% 18.1% 19.4% 32.0%Carlsbad 2.0% 2.1% 13.1% 13.8% 21.7%Oceanside 6.2% 6.3% 21.5% 22.8% 36.5%Pendleton 4.6% 4.6% 20.4% 24.3% 59.6%San Dieguito 1.5% 1.2% 11.7% 12.4% 21.2%Vista 5.7% 5.7% 24.1% 26.2% 41.3%
North Inland Region 4.8% 4.4% 17.0% 18.5% 31.2%Anza-Borrego Springs 19.6% 28.2% 26.2% 30.7% 46.4%Escondido 7.3% 7.2% 25.7% 27.9% 37.2%Fallbrook 6.2% 5.5% 21.5% 23.6% 33.6%North San Diego 2.3% 2.0% 6.7% 7.5% 22.4%Palomar-Julian 10.9% 8.3% 23.6% 25.6% 37.4%Pauma 5.3% 4.6% 19.9% 22.2% 29.6%Poway 1.6% 1.6% 8.0% 8.6% 21.7%Ramona 6.8% 4.4% 13.5% 15.0% 36.5%San Marcos 4.4% 4.1% 20.7% 22.3% 36.7%Valley Center 3.8% 2.8% 16.1% 16.8% 27.2%
South Region 10.6% 9.9% 21.7% 23.6% 39.0%Chula Vista 14.1% 13.9% 27.0% 29.4% 44.0%Coronado 1.1% 0.3% 8.3% 8.9% 24.8%National City 14.9% 14.6% 33.5% 36.0% 44.8%South Bay 15.4% 14.4% 26.8% 29.3% 43.4%Sweetwater 3.5% 2.9% 9.9% 10.6% 30.6%
San Diego County 6.7% 6.8% 20.0% 21.5% 32.9%
Food Stamps/SNAP/CalFresh Receipt and Income Eligibility
10.9%
9.9%
2.6%
4.0%
4.8%
10.6%
6.7%
13.7%
9.6%
2.5%
4.0%
4.4%
9.9%
6.8%
Central Region
East Region
North Central Region
North Coastal Region
North Inland Region
South Region
San Diego County
Food Stamps/SNAP/CalFresh Receipt by HHSA Region, 2015
Household Families with Children under 18 years
Source: U.S. Census Bureau, 2011-2015 American Community Survey 5-Year Estimates, Table B22002, B22007, B17024.Prepared by: County of San Diego, Health and Human Services Agency, Public Health Services, Community Health Statistics Unit, 2017.
Page 44

Source: U.S. Census Bureau; 2011-2015 American Community Survey 5-Year Estimates, Table S2101.
# % Male FemaleCentral Region 32,012 8.3% 90.2% 9.8%
Central San Diego 11,532 8.3% 90.9% 9.1%Mid-City 9,308 7.2% 88.3% 11.7%Southeastern San Diego 11,172 9.4% 91.1% 8.9%
East Region 43,168 11.8% 89.4% 10.6%Alpine 1,610 13.0% 83.5% 16.5%El Cajon 9,288 9.6% 89.5% 10.5%Harbison-Crest 1,883 15.0% 93.6% 6.4%Jamul 1,352 9.0% 89.4% 10.6%La Mesa 5,883 12.2% 87.4% 12.6%Laguna-Pine Valley 431 10.0% 93.5% 6.5%Lakeside 5,513 13.0% 87.6% 12.4%Lemon Grove 2,990 12.7% 91.0% 9.0%Mountain Empire 779 14.6% 98.3% 1.7%Santee 5,008 12.5% 91.1% 8.9%Spring Valley 8,431 13.1% 89.6% 10.4%
North Central Region 47,897 9.8% 89.5% 10.5%Coastal 4,875 7.4% 92.2% 7.8%Del Mar-Mira Mesa 10,818 8.5% 91.9% 8.1%Elliott-Navajo 9,411 13.7% 88.4% 11.6%Kearny Mesa 14,001 10.7% 87.8% 12.2%Miramar 301 36.4% 83.4% 16.6%Peninsula 5,570 11.7% 90.4% 9.6%University 2,921 5.8% 86.1% 13.9%
North Coastal Region 36,951 9.7% 90.4% 9.6%Carlsbad 7,775 8.3% 93.2% 6.8%Oceanside 15,870 12.9% 90.6% 9.4%Pendleton 1,913 23.8% 64.1% 35.9%San Dieguito 5,574 7.4% 94.3% 5.7%Vista 5,819 7.4% 90.8% 9.2%
North Inland Region 40,660 9.2% 92.3% 7.7%Anza-Borrego Springs 315 10.8% 100.0% 0.0%Escondido 9,377 7.4% 92.8% 7.2%Fallbrook 4,387 11.5% 94.5% 5.5%North San Diego 7,725 9.3% 90.1% 9.9%Palomar-Julian 527 11.8% 93.4% 6.6%Pauma 536 11.4% 98.9% 1.1%Poway 6,588 9.9% 91.7% 8.3%Ramona 3,066 11.2% 90.1% 9.9%San Marcos 5,851 8.2% 92.9% 7.1%Valley Center 2,288 12.7% 94.3% 5.7%
South Region 33,175 9.4% 89.0% 11.0%Chula Vista 6,682 7.6% 91.6% 8.4%Coronado 2,836 19.4% 86.5% 13.5%National City 2,505 6.0% 92.9% 7.1%South Bay 9,332 8.8% 87.3% 12.7%Sweetwater 11,820 11.4% 88.7% 11.3%
San Diego County 233,863 9.7% 90.1% 9.9%
Veterans: Civilians who served the US officially or non-officially during any conflic domestically or at war.
Veterans in the Population and by Gender
Veterans in PopulationGeography Veterans by Gender
8.3%11.8% 9.8% 9.7% 9.2% 9.4% 9.7%
0%
10%
20%
30%
40%
50%
60%
70%
80%
90%
100%
Central Region East Region North CentralRegion
North CoastalRegion
North InlandRegion
South Region San DiegoCounty
Veteran Status by HHSA Region, 2015
Source: U.S. Census Bureau, 2011-2015 American Community Survey 5-Year Estimates, Table S2101. Prepared by: County of San Diego, Health and Human Services Agency, Public Health Services, Community Health Statistics Unit, 2017.
90.2% 89.4% 89.5% 90.4% 92.3%89.0% 90.1%
9.8% 10.6% 10.5% 9.6% 7.7%11.0% 9.9%
0%
10%
20%
30%
40%
50%
60%
70%
80%
90%
100%
Central Region East Region North CentralRegion
North CoastalRegion
North InlandRegion
South Region San DiegoCounty
Veterans by Gender by HHSA Region, 2015Male Female
Source: U.S. Census Bureau, 2011-2015 American Community Survey 5-Year Estimates, Table S2101. Prepared by: County of San Diego, Health and Human Services Agency, Public Health Services, Community Health Statistics Unit, 2017.
Page 45

Source: U.S. Census Bureau; 2011-2015 American Community Survey 5-Year Estimates, Table S2101.
Geography Hispanic or Latino (of any race)
White alone, not Hispanic or Latino
All other races
Central Region 17.3% 47.1% 35.6%Central San Diego 15.5% 65.9% 18.5%Mid-City 18.7% 48.6% 32.7%Southeastern San Diego 18.1% 26.5% 55.5%
East Region 12.2% 72.5% 15.3%Alpine 9.0% 79.2% 11.8%El Cajon 9.1% 74.6% 16.3%Harbison-Crest 3.9% 89.5% 6.6%Jamul 13.6% 70.9% 15.5%La Mesa 14.5% 66.1% 19.4%Laguna-Pine Valley 2.1% 88.2% 9.7%Lakeside 10.2% 79.6% 10.2%Lemon Grove 18.3% 54.1% 27.6%Mountain Empire 12.7% 78.4% 8.9%Santee 12.1% 82.8% 5.1%Spring Valley 16.1% 64.2% 19.7%
North Central Region 10.4% 70.7% 18.9%Coastal 5.7% 89.9% 4.4%Del Mar-Mira Mesa 8.7% 57.4% 34.0%Elliott-Navajo 11.2% 71.5% 17.3%Kearny Mesa 13.2% 68.7% 18.1%Miramar 32.6% 50.5% 16.9%Peninsula 9.8% 79.3% 10.9%University 6.9% 80.8% 12.3%
North Coastal Region 14.5% 71.8% 13.7%Carlsbad 7.2% 83.7% 9.1%Oceanside 18.1% 63.7% 18.2%Pendleton 36.3% 33.9% 29.7%San Dieguito 6.9% 88.3% 4.8%Vista 14.4% 74.5% 11.1%
North Inland Region 8.6% 78.1% 13.3%Anza-Borrego Springs 6.0% 93.7% 0.3%Escondido 13.6% 72.3% 14.0%Fallbrook 7.9% 85.4% 6.7%North San Diego 6.3% 73.6% 20.0%Palomar-Julian 8.7% 85.6% 5.7%Pauma 3.2% 76.3% 20.5%Poway 5.4% 80.7% 13.9%Ramona 6.0% 86.2% 7.8%San Marcos 11.0% 75.2% 13.8%Valley Center 5.6% 88.1% 6.3%
South Region 23.9% 46.0% 30.1%Chula Vista 31.2% 53.5% 15.3%Coronado 5.4% 86.7% 7.9%National City 23.4% 34.7% 41.9%South Bay 25.7% 40.6% 33.7%Sweetwater 22.9% 38.5% 38.6%
San Diego County 13.9% 65.7% 20.3%
Veterans by Race/Ethnicity
17.3%
12.2%
10.4%
14.5%
8.6%
23.9%
13.9%
47.1%
72.5%
70.7%
71.8%
78.1%
46.0%
65.7%
35.6%
15.3%
18.9%
13.7%
13.3%
30.1%
20.3%
Central Region
East Region
North CentralRegion
North CoastalRegion
North InlandRegion
South Region
San DiegoCounty
Race of Veterans by HHSA Region, 2015Hispanic or Latino (of any race) White alone, not Hispanic or Latino All other races
Source: U.S. Census Bureau, 2011-2015 American Community Survey 5-Year Estimates, Table S2101. Prepared by: County of San Diego, Health and Human Services Agency, Public Health Services, Community Health Statistics Unit, 2017.
Page 46

Source: U.S. Census Bureau; 2011-2015 American Community Survey 5-Year Estimates, Table S2101.
18-34 35-54 55-64 65-74 75+Central Region 20.4% 31.2% 19.8% 15.5% 13.2%
Central San Diego 20.2% 33.4% 15.4% 17.0% 14.1%Mid-City 25.7% 32.7% 18.0% 12.6% 11.1%Southeastern San Diego 16.1% 27.6% 25.8% 16.3% 14.1%
East Region 13.9% 27.9% 20.0% 20.6% 17.6%Alpine 12.6% 26.7% 20.6% 23.7% 16.3%El Cajon 14.8% 29.3% 18.4% 18.9% 18.6%Harbison-Crest 5.9% 20.9% 27.3% 25.0% 21.0%Jamul 4.8% 31.4% 29.8% 22.9% 11.1%La Mesa 20.7% 25.0% 14.1% 20.6% 19.6%Laguna-Pine Valley 2.8% 8.8% 28.1% 31.8% 28.5%Lakeside 18.6% 24.6% 18.4% 22.9% 15.6%Lemon Grove 12.4% 34.3% 21.9% 16.4% 15.0%Mountain Empire 1.7% 19.1% 35.7% 18.9% 24.6%Santee 8.5% 30.8% 23.1% 22.4% 15.2%Spring Valley 14.2% 29.2% 19.2% 19.3% 18.1%
North Central Region 17.5% 26.8% 15.1% 19.4% 21.1%Coastal 13.7% 16.7% 8.9% 28.7% 32.0%Del Mar-Mira Mesa 12.7% 37.5% 19.2% 21.4% 9.2%Elliott-Navajo 20.0% 22.9% 12.8% 17.3% 27.1%Kearny Mesa 18.9% 28.2% 16.7% 15.8% 20.4%Miramar 78.7% 21.3% 0.0% 0.0% 0.0%Peninsula 18.0% 23.8% 15.5% 19.5% 23.3%University 19.5% 16.8% 11.9% 22.9% 29.0%
North Coastal Region 16.6% 24.0% 17.1% 18.6% 23.7%Carlsbad 8.6% 20.1% 14.9% 21.5% 34.9%Oceanside 18.4% 29.3% 18.5% 16.9% 16.8%Pendleton 74.5% 25.5% 0.0% 0.0% 0.0%San Dieguito 4.8% 15.1% 19.0% 25.3% 35.8%Vista 14.3% 23.1% 19.7% 19.1% 23.9%
North Inland Region 10.1% 23.4% 19.8% 22.9% 23.7%Anza-Borrego Springs 13.0% 0.3% 14.9% 28.6% 43.2%Escondido 13.4% 25.5% 17.8% 20.7% 22.7%Fallbrook 9.0% 14.6% 18.6% 26.4% 31.3%North San Diego 8.7% 29.8% 20.5% 19.3% 21.7%Palomar-Julian 5.9% 6.5% 19.0% 39.5% 29.2%Pauma 22.0% 21.8% 19.2% 31.2% 5.8%Poway 10.1% 25.6% 18.7% 24.2% 21.3%Ramona 10.4% 20.6% 29.9% 24.1% 15.0%San Marcos 8.4% 22.4% 18.1% 22.6% 28.5%Valley Center 5.2% 17.7% 23.0% 27.1% 27.0%
South Region 17.4% 28.6% 21.0% 16.2% 16.7%Chula Vista 14.6% 23.2% 18.0% 18.7% 25.5%Coronado 10.5% 23.0% 20.5% 21.3% 24.7%National City 10.4% 27.8% 24.8% 18.3% 18.7%South Bay 21.8% 28.8% 21.3% 14.3% 13.8%Sweetwater 18.7% 33.0% 21.9% 14.7% 11.7%
San Diego County 15.8% 26.8% 18.6% 19.1% 19.6%
Veterans by Age Group
Geography Veterans by Age Group
20.4%13.9% 17.5% 16.6%
10.1%17.4% 15.8%
31.2%
27.9%26.8% 24.0%
23.4%
28.6%26.8%
19.8%
20.0% 15.1%17.1%
19.8%
21.0%18.6%
15.5%
20.6%19.4% 18.6% 22.9%
16.2%19.1%
13.2% 17.6% 21.1% 23.7% 23.7%16.7% 19.6%
Central Region East Region North CentralRegion
North CoastalRegion
North InlandRegion
South Region San Diego County
Veteran Status by Age Group by HHSA Region, 201518-34 35-54 55-64 65-74 75+
Source: U.S. Census Bureau, 2011-2015 American Community Survey 5-Year Estimates, Table S2101. Prepared by: County of San Diego, Health and Human Services Agency, Public Health Services, Community Health Statistics Unit, 2017.
Page 47

Source: U.S. Census Bureau; 2011-2015 American Community Survey 5-Year Estimates, Table S2101.
Central Region 41,056$ 10.7%Central San Diego 46,153$ 13.4%Mid-City 35,740$ 11.8%Southeastern San Diego 38,572$ 7.1%
East Region 47,929$ 6.5%Alpine 54,260$ 10.9%El Cajon 47,345$ 8.0%Harbison-Crest 60,633$ 6.8%Jamul 70,282$ 0.9%La Mesa 49,186$ 5.6%Laguna-Pine Valley 34,762$ 4.3%Lakeside 39,376$ 4.2%Lemon Grove 37,669$ 9.6%Mountain Empire 32,683$ 9.1%Santee 54,656$ 4.1%Spring Valley 47,494$ 6.9%
North Central Region 56,152$ 5.5%Coastal 77,302$ 7.3%Del Mar-Mira Mesa 62,513$ 3.5%Elliott-Navajo 50,485$ 2.0%Kearny Mesa 46,143$ 8.5%Miramar - 0.0%Peninsula 45,599$ 5.0%University 57,956$ 8.1%
North Coastal Region 51,614$ 6.9%Carlsbad 61,367$ 5.1%Oceanside 47,851$ 7.4%Pendleton 33,050$ 9.6%San Dieguito 58,874$ 5.2%Vista 41,249$ 8.9%
North Inland Region 51,894$ 5.7%Anza-Borrego Springs 31,296$ 0.3%Escondido 42,401$ 10.3%Fallbrook 52,045$ 6.3%North San Diego 67,562$ 2.9%Palomar-Julian 37,961$ 3.4%Pauma 56,197$ 1.1%Poway 68,271$ 2.3%Ramona 50,280$ 3.9%San Marcos 39,225$ 7.0%Valley Center 59,863$ 6.7%
South Region 44,298$ 5.7%Chula Vista 42,213$ 7.7%Coronado 73,954$ 4.6%National City 35,436$ 8.4%South Bay 40,169$ 7.5%Sweetwater 60,545$ 2.9%
San Diego County 46,461$ 6.7%
Veterans: Median Income and Poverty
Geography Median IncomeBelow 100% Federal Poverty
Lvel (FPL)
$41,056
$47,929
$56,152 $51,614 $51,894
$44,298 $46,461
Central Region East Region North CentralRegion
North CoastalRegion
North InlandRegion
South Region San Diego County
Median Income Among Veteran Population by HHSA Region, 2015
Source: U.S. Census Bureau, 2011-2015 American Community Survey 5-Year Estimates, Table S2101. Prepared by: County of San Diego, Health and Human Services Agency, Public Health Services, Community Health Statistics Unit, 2017.
10.7%
6.5%
5.5%
6.9%
5.7% 5.7%
6.7%
Central Region East Region North CentralRegion
North CoastalRegion
North InlandRegion
South Region San Diego County
Percent of Veteran Population Below 100% Federal Poverty Level (FPL) by HHSA Region, 2015
Source: U.S. Census Bureau, 2011-2015 American Community Survey 5-Year Estimates, Table S2101. Prepared by: County of San Diego, Health and Human Services Agency, Public Health Services, Community Health Statistics Unit, 2017.
Page 48

Source: U.S. Census Bureau; 2011-2015 American Community Survey 5-Year Estimates, Table S2101.
Less than High School Diploma
High School Graduate or Equivalent
Some College or Associate's Degree
Bachelor's Degree or Higher
Central Region 5.3% 20.1% 44.7% 29.8%Central San Diego 4.3% 15.9% 35.4% 44.3%Mid-City 6.3% 18.8% 49.3% 25.6%Southeastern San Diego 5.4% 25.7% 50.8% 18.1%
East Region 4.5% 20.3% 47.3% 27.8%Alpine 5.3% 16.9% 48.1% 29.7%El Cajon 4.4% 21.6% 44.6% 29.4%Harbison-Crest 2.9% 21.4% 50.9% 24.8%Jamul 7.9% 23.7% 34.4% 34.0%La Mesa 5.7% 15.3% 48.9% 30.1%Laguna-Pine Valley 4.3% 26.7% 46.1% 22.9%Lakeside 2.9% 23.7% 52.2% 21.3%Lemon Grove 5.6% 29.0% 48.5% 17.0%Mountain Empire 4.7% 21.2% 47.5% 26.6%Santee 3.7% 18.7% 48.2% 29.4%Spring Valley 4.6% 17.6% 46.4% 31.4%
North Central Region 2.3% 13.1% 37.0% 47.6%Coastal 0.7% 9.1% 23.1% 67.0%Del Mar-Mira Mesa 1.7% 10.1% 36.9% 51.2%Elliott-Navajo 2.0% 13.8% 36.4% 47.8%Kearny Mesa 3.9% 17.7% 43.2% 35.2%Miramar 0.0% 15.3% 75.9% 8.8%Peninsula 2.2% 13.1% 36.1% 48.6%University 0.7% 7.2% 33.0% 59.1%
North Coastal Region 3.3% 14.1% 40.8% 41.8%Carlsbad 2.3% 8.2% 30.3% 59.3%Oceanside 3.9% 16.2% 46.1% 33.8%Pendleton 0.0% 13.3% 72.0% 14.6%San Dieguito 0.7% 9.0% 31.7% 58.6%Vista 6.4% 21.6% 43.6% 28.4%
North Inland Region 3.1% 16.1% 39.4% 41.4%Anza-Borrego Springs 1.6% 23.5% 52.1% 22.9%Escondido 4.9% 16.6% 45.8% 32.7%Fallbrook 2.4% 17.9% 40.6% 39.1%North San Diego 1.8% 13.2% 30.8% 54.2%Palomar-Julian 8.3% 23.3% 40.4% 27.9%Pauma 2.6% 10.3% 56.9% 30.2%Poway 1.3% 12.0% 32.6% 54.1%Ramona 1.5% 20.3% 47.3% 30.9%San Marcos 4.4% 17.7% 44.5% 33.3%Valley Center 3.9% 20.3% 31.1% 44.8%
South Region 5.8% 18.6% 44.5% 31.1%Chula Vista 9.3% 25.9% 44.7% 20.1%Coronado 0.2% 4.7% 23.3% 71.7%National City 10.7% 24.3% 45.2% 19.9%South Bay 6.7% 23.0% 50.0% 20.3%Sweetwater 3.5% 13.3% 45.1% 38.1%
San Diego County 3.9% 16.9% 42.1% 37.2%
GeographyVeterans, Ages 25 Years and Over, by Educational Attainment
Veterans: Educational Attainment
5.3% 4.5% 2.3% 3.3% 3.1% 5.8% 3.9%
20.1% 20.3%13.1% 14.1% 16.1%
18.6% 16.9%
44.7% 47.3%
37.0%40.8% 39.4%
44.5%42.1%
29.8% 27.8%
47.6% 41.8% 41.4%31.1% 37.2%
Central Region East Region North CentralRegion
North CoastalRegion
North InlandRegion
South Region San DiegoCounty
Veteran Educational Attainment by HHSA Region, 2015Less than High School Diploma High School Graduate or Equivalent
Some College or Associate's Degree Bachelor's Degree or Higher
Source: U.S. Census Bureau, 2011-2015 American Community Survey 5-Year Estimates, Table S2101. Prepared by: County of San Diego, Health and Human Services Agency, Public Health Services, Community Health Statistics Unit, 2017.
Page 49

Source: U.S. Census Bureau; 2011-2015 American Community Survey 5-Year Estimates, Table B21002.
Pre World War II Only
Between Korean War and WW2
Only
Between Vietnam Era and Korean War
Only
Between Gulf War and Vietnam Era
Only
WW2, no Korean War or Vietnam Era
Korean War and WW2, no Vietnam
Era
Korean War, No Vietnam Era, no
WW2
Vietnam, Korean War, and WW2
Vietnam Era and Koran War, no
WW2
Vietnam Era, no Korean War, no
WW2
Gulf War (8/1990 to
8/2001) and Vietnam Era
Gulf War (8/1990 to 8/2001), no Vietnam Era
Gulf War (9/2001 or later), and Gulf War (8/1990 to 8/2001),
and Vietnam Era
Gulf War (9/2001 or later) and Gulf War (8/1990 to 8/2001),
no Vietnam Era
Gulf War (9/2001 or later), no Gulf War
(8/1990 to 8/2001), no Vietnam Era
Central Region 0.02% 0.48% 3.56% 12.84% 2.92% 0.66% 4.66% 0.43% 0.96% 23.81% 2.44% 17.26% 0.41% 9.29% 20.26%Central San Diego 0.04% 0.10% 4.74% 12.57% 3.56% 0.85% 5.71% 0.60% 0.43% 24.61% 0.84% 17.01% 0.09% 8.17% 20.66%Mid-City 0.00% 1.16% 3.17% 14.58% 3.50% 0.34% 3.63% 0.08% 0.50% 20.83% 1.45% 19.26% 0.44% 7.21% 23.84%Southeastern San Diego 0.00% 0.30% 2.68% 11.65% 1.77% 0.73% 4.45% 0.56% 1.88% 25.47% 4.92% 15.83% 0.71% 12.19% 16.85%
East Region 0.27% 0.40% 5.79% 12.81% 4.92% 0.57% 6.00% 0.22% 1.40% 29.06% 1.93% 14.11% 0.56% 8.84% 13.14%Alpine 0.50% 0.00% 8.07% 17.83% 4.47% 1.49% 3.79% 0.00% 0.50% 29.81% 2.24% 9.94% 0.93% 12.98% 7.45%El Cajon 0.16% 0.71% 5.63% 13.39% 4.58% 0.37% 7.48% 0.20% 1.38% 26.89% 1.32% 15.97% 0.12% 7.49% 14.30%Harbison-Crest 0.00% 1.27% 9.35% 12.80% 5.84% 0.64% 8.07% 0.00% 2.34% 31.39% 3.72% 11.10% 0.96% 2.39% 10.14%Jamul 0.00% 0.00% 5.40% 13.31% 5.84% 0.00% 2.07% 0.00% 0.52% 32.54% 1.11% 18.42% 2.00% 12.65% 6.14%La Mesa 0.82% 0.42% 5.52% 7.55% 5.95% 0.56% 7.85% 0.51% 0.85% 26.19% 2.01% 14.06% 0.08% 10.25% 17.37%Laguna-Pine Valley 0.00% 1.39% 7.19% 7.89% 10.21% 0.00% 16.94% 0.00% 0.00% 45.94% 1.16% 2.55% 1.39% 0.00% 5.34%Lakeside 0.00% 0.54% 6.31% 11.74% 4.26% 0.73% 4.86% 0.09% 1.72% 29.09% 1.78% 12.48% 0.78% 6.42% 19.19%Lemon Grove 0.80% 0.23% 3.11% 17.49% 5.12% 0.37% 3.85% 0.20% 1.37% 28.29% 0.97% 15.75% 1.30% 8.53% 12.61%Mountain Empire 0.00% 0.00% 11.68% 14.12% 9.63% 2.18% 6.16% 0.00% 0.00% 37.23% 2.82% 2.70% 1.93% 6.68% 4.88%Santee 0.12% 0.00% 5.33% 15.10% 3.41% 0.36% 4.67% 0.14% 2.54% 33.95% 3.08% 12.82% 0.66% 9.54% 8.29%Spring Valley 0.19% 0.19% 5.23% 12.61% 4.86% 0.66% 5.36% 0.31% 1.23% 27.94% 1.93% 15.75% 0.36% 11.29% 12.07%
North Central Region 0.17% 0.52% 6.43% 10.99% 5.04% 0.90% 6.51% 0.81% 1.53% 25.77% 2.40% 11.48% 0.29% 9.87% 17.29%Coastal 0.00% 0.86% 7.98% 8.16% 11.38% 1.03% 8.86% 1.42% 2.32% 28.47% 1.50% 7.16% 0.35% 5.99% 14.52%Del Mar-Mira Mesa 0.00% 0.11% 4.58% 11.86% 1.72% 0.04% 2.52% 0.47% 0.86% 27.08% 3.78% 20.11% 0.31% 13.34% 13.22%Elliott-Navajo 0.16% 0.35% 7.31% 9.67% 5.27% 1.42% 9.18% 1.00% 2.01% 22.56% 3.29% 8.63% 0.60% 11.47% 17.09%Kearny Mesa 0.10% 0.74% 5.38% 12.87% 4.10% 0.97% 7.18% 1.00% 1.56% 24.76% 1.94% 10.16% 0.11% 9.48% 19.66%Miramar 0.00% 0.00% 0.00% 0.00% 0.00% 0.00% 0.00% 0.00% 0.00% 0.00% 0.00% 2.33% 0.00% 26.25% 71.43%Peninsula 0.75% 0.66% 7.77% 12.62% 4.76% 0.72% 6.73% 0.50% 1.33% 30.09% 1.15% 9.50% 0.31% 4.51% 18.60%University 0.31% 0.82% 10.96% 5.75% 11.57% 2.26% 5.82% 0.24% 1.51% 25.98% 0.82% 6.95% 0.00% 8.80% 18.21%
North Coastal Region 0.35% 0.27% 6.88% 12.27% 6.76% 0.51% 7.51% 0.60% 2.12% 25.09% 1.80% 10.15% 0.41% 7.36% 17.91%Carlsbad 0.76% 0.42% 10.97% 10.55% 10.30% 0.96% 10.61% 1.31% 2.08% 27.22% 2.08% 7.07% 0.18% 4.69% 10.78%Oceanside 0.19% 0.16% 5.05% 12.92% 4.05% 0.29% 5.23% 0.29% 2.24% 23.76% 1.98% 12.86% 0.71% 10.88% 19.40%Pendleton 0.00% 0.00% 0.00% 0.00% 0.00% 0.00% 0.00% 0.00% 0.00% 0.00% 0.00% 13.96% 0.00% 0.52% 85.52%San Dieguito 0.48% 0.16% 8.75% 11.00% 12.59% 1.11% 12.45% 0.65% 1.94% 32.83% 1.44% 7.14% 0.13% 4.45% 4.88%Vista 0.26% 0.58% 6.89% 18.04% 6.05% 0.12% 7.32% 0.62% 2.72% 26.72% 1.87% 8.47% 0.33% 6.38% 13.63%
North Inland Region 0.07% 0.42% 6.56% 12.99% 6.96% 0.83% 7.49% 0.75% 1.66% 31.85% 2.07% 10.02% 0.46% 8.20% 9.66%Anza-Borrego Springs 0.00% 0.00% 24.13% 4.44% 15.87% 0.00% 17.14% 4.13% 0.00% 15.24% 0.00% 0.32% 5.71% 0.00% 13.02%Escondido 0.01% 0.55% 6.75% 14.59% 6.39% 0.43% 6.41% 1.13% 1.15% 30.30% 1.11% 11.51% 0.47% 7.82% 11.39%Fallbrook 0.00% 0.23% 8.27% 9.57% 9.05% 1.07% 9.60% 0.39% 2.07% 38.71% 0.93% 5.29% 0.21% 4.63% 9.98%North San Diego 0.35% 0.43% 4.61% 13.40% 6.95% 0.92% 7.48% 1.07% 0.69% 25.26% 4.06% 13.72% 0.34% 12.63% 8.09%Palomar-Julian 0.00% 0.00% 13.09% 11.39% 6.64% 0.00% 13.09% 0.00% 0.95% 43.45% 2.28% 2.09% 1.14% 1.52% 4.36%Pauma 0.00% 0.00% 9.70% 16.04% 0.00% 0.00% 1.49% 0.37% 3.36% 31.90% 0.00% 5.97% 0.00% 2.43% 28.73%Poway 0.00% 0.00% 6.13% 11.40% 4.08% 1.59% 5.56% 0.71% 4.11% 32.76% 2.58% 9.76% 0.62% 10.43% 10.26%Ramona 0.00% 0.20% 3.85% 15.07% 4.27% 0.49% 5.68% 0.33% 1.99% 42.99% 2.35% 6.59% 0.85% 4.34% 11.02%San Marcos 0.00% 0.96% 7.42% 12.29% 11.08% 0.75% 8.61% 0.39% 0.65% 30.68% 0.79% 9.54% 0.27% 8.94% 7.64%Valley Center 0.00% 0.66% 7.12% 16.08% 7.12% 0.66% 11.89% 0.22% 1.22% 32.43% 3.58% 11.23% 0.00% 2.58% 5.20%
South Region 0.06% 0.45% 4.95% 10.79% 3.00% 0.50% 4.56% 0.92% 2.58% 25.26% 2.97% 13.48% 0.67% 11.20% 18.63%Chula Vista 0.10% 0.94% 8.31% 12.29% 4.58% 1.29% 7.03% 1.26% 3.29% 25.91% 2.10% 11.45% 0.24% 4.67% 16.55%Coronado 0.21% 0.18% 6.31% 6.06% 3.81% 1.16% 6.38% 3.03% 3.74% 27.36% 4.48% 7.72% 2.89% 15.51% 11.14%National City 0.00% 0.00% 6.03% 12.61% 4.15% 1.08% 6.11% 1.32% 2.00% 26.31% 3.23% 15.65% 1.68% 8.30% 11.54%South Bay 0.04% 0.34% 3.58% 13.11% 2.08% 0.00% 2.94% 0.57% 3.48% 23.74% 3.60% 11.61% 0.24% 10.49% 24.20%Sweetwater 0.02% 0.41% 3.59% 8.86% 2.40% 0.17% 3.67% 0.41% 1.32% 25.37% 2.54% 17.02% 0.50% 15.03% 18.70%
San Diego County 0.16% 0.43% 5.80% 12.10% 5.04% 0.68% 6.21% 0.62% 1.69% 26.99% 2.25% 12.57% 0.46% 9.10% 15.89%
Veterans: Period of Service (Detailed)
Geography
Veteran Period of Service
Page 50