Samsung Electronics Co., Ltd. and Subsidiaries...
41
Samsung Electronics Co., Ltd. and Subsidiaries NOTES TO INTERIM CONSOLIDATED FINANCIAL STATEMENTS 14 1. General Information 1.1 Company Overview Samsung Electronics Co., Ltd. (“SEC”) was incorporated under the laws of the Republic of Korea in 1969 and listed its shares on the Korea Stock Exchange in 1975. SEC and its subsidiaries (collectively referred to as the “Group”) operate three business divisions: Consumer Electronics (“CE”), Information technology & Mobile communications (“IM”), and Device Solution (“DS”). The CE division includes digital TVs, monitors, printers, air conditioners and refrigerators and the IM division includes mobile phones, communication system, and computers. The DS division includes products such as memory and system LSI in the semiconductor business (“Semiconductor”), and LCD and OLED panels in the display business (“DP”). The Group is domiciled in the Republic of Korea and the address of its registered office is Suwon, the Republic of Korea. These interim consolidated financial statements have been prepared in accordance with Korean International Financial Reporting Standards (“K-IFRS”) 1110, Consolidated Financial Statements. SEC, as the controlling Company, consolidates its 161 subsidiaries including Samsung Display and Samsung Electronics America. The Group also applies the equity method of accounting to its 36 affiliates, including Samsung Electro-Mechanics. 1.2 Consolidated Subsidiaries (A) The consolidated subsidiaries as of March 31, 2015 are as follows: Area Subsidiaries Industry Percentage of ownership 1 Domestic High Pioneer Private Investment Trust #1 Technology business, Venture capital investments 100.0 Samsung Display (SDC) Manufacture and sale of display panels 84.8 SU Materials Manufacture of LCD components 50.0 STECO Manufacture of semiconductor components 70.0 SEMES Manufacture of semiconductor/FPD 91.5 Samsung Electronics Service Repair services for electronic devices 99.3 Samsung Electronics Sales Sale of electronic devices 100.0 Samsung Electronics Logitech General logistics agency 100.0 Samsung Medison Medical equipment 68.5 Samsung Venture Capital Union #6 Technology business, Venture capital investments 99.0 Samsung Venture Capital Union #14 Technology business, Venture capital investments 99.0 Samsung Venture Capital Union #20 Technology business, Venture capital investments 99.0 Samsung Venture Capital Union #21 Technology business, Venture capital investments 99.0 Samsung Venture Capital Union #22 Technology business, Venture capital investments 99.0 Samsung Venture Capital Union #23 Technology business, Venture capital investments 99.0 Samsung Venture Capital Union #26 Technology business, Venture capital investments 99.0 Samsung Venture Capital Union #27 Technology business, Venture capital investments 99.0 Samsung Venture Capital Union #28 Technology business, Venture capital investments 99.0
Transcript of Samsung Electronics Co., Ltd. and Subsidiaries...
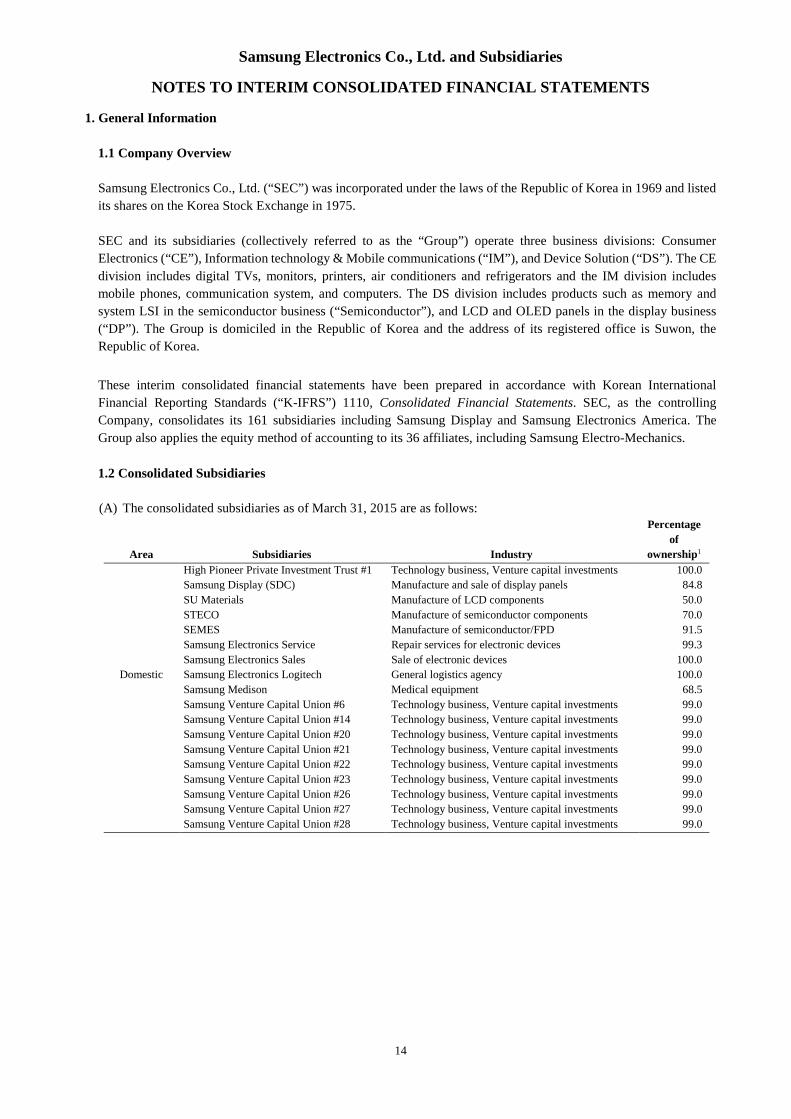
Samsung Electronics Co., Ltd. and Subsidiaries
NOTES TO INTERIM CONSOLIDATED FINANCIAL STATEMENTS
14
1. General Information
1.1 Company Overview
Samsung Electronics Co., Ltd. (“SEC”) was incorporated under the laws of the Republic of Korea in 1969 and listed
its shares on the Korea Stock Exchange in 1975.
SEC and its subsidiaries (collectively referred to as the “Group”) operate three business divisions: Consumer
Electronics (“CE”), Information technology & Mobile communications (“IM”), and Device Solution (“DS”). The CE
division includes digital TVs, monitors, printers, air conditioners and refrigerators and the IM division includes
mobile phones, communication system, and computers. The DS division includes products such as memory and
system LSI in the semiconductor business (“Semiconductor”), and LCD and OLED panels in the display business
(“DP”). The Group is domiciled in the Republic of Korea and the address of its registered office is Suwon, the
Republic of Korea.
These interim consolidated financial statements have been prepared in accordance with Korean International
Financial Reporting Standards (“K-IFRS”) 1110, Consolidated Financial Statements. SEC, as the controlling
Company, consolidates its 161 subsidiaries including Samsung Display and Samsung Electronics America. The
Group also applies the equity method of accounting to its 36 affiliates, including Samsung Electro-Mechanics.
1.2 Consolidated Subsidiaries
(A) The consolidated subsidiaries as of March 31, 2015 are as follows:
Area Subsidiaries Industry
Percentage
of
ownership1
Domestic
High Pioneer Private Investment Trust #1 Technology business, Venture capital investments 100.0
Samsung Display (SDC) Manufacture and sale of display panels 84.8
SU Materials Manufacture of LCD components 50.0
STECO Manufacture of semiconductor components 70.0
SEMES Manufacture of semiconductor/FPD 91.5
Samsung Electronics Service Repair services for electronic devices 99.3
Samsung Electronics Sales Sale of electronic devices 100.0
Samsung Electronics Logitech General logistics agency 100.0
Samsung Medison Medical equipment 68.5
Samsung Venture Capital Union #6 Technology business, Venture capital investments 99.0
Samsung Venture Capital Union #14 Technology business, Venture capital investments 99.0
Samsung Venture Capital Union #20 Technology business, Venture capital investments 99.0
Samsung Venture Capital Union #21 Technology business, Venture capital investments 99.0
Samsung Venture Capital Union #22 Technology business, Venture capital investments 99.0
Samsung Venture Capital Union #23 Technology business, Venture capital investments 99.0
Samsung Venture Capital Union #26 Technology business, Venture capital investments 99.0
Samsung Venture Capital Union #27 Technology business, Venture capital investments 99.0
Samsung Venture Capital Union #28 Technology business, Venture capital investments 99.0
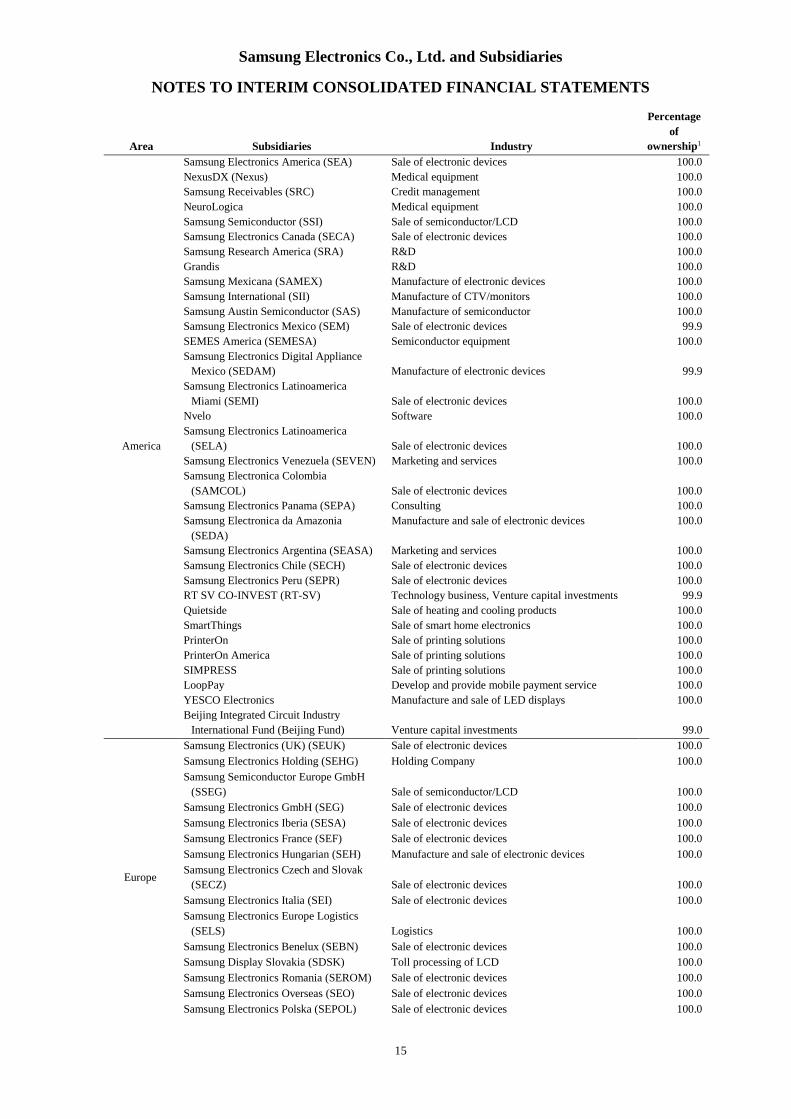
Samsung Electronics Co., Ltd. and Subsidiaries
NOTES TO INTERIM CONSOLIDATED FINANCIAL STATEMENTS
15
Area Subsidiaries Industry
Percentage
of
ownership1
America
Samsung Electronics America (SEA) Sale of electronic devices 100.0
NexusDX (Nexus) Medical equipment 100.0
Samsung Receivables (SRC) Credit management 100.0
NeuroLogica Medical equipment 100.0
Samsung Semiconductor (SSI) Sale of semiconductor/LCD 100.0
Samsung Electronics Canada (SECA) Sale of electronic devices 100.0
Samsung Research America (SRA) R&D 100.0
Grandis R&D 100.0
Samsung Mexicana (SAMEX) Manufacture of electronic devices 100.0
Samsung International (SII) Manufacture of CTV/monitors 100.0
Samsung Austin Semiconductor (SAS) Manufacture of semiconductor 100.0
Samsung Electronics Mexico (SEM) Sale of electronic devices 99.9
SEMES America (SEMESA) Semiconductor equipment 100.0
Samsung Electronics Digital Appliance
Mexico (SEDAM) Manufacture of electronic devices 99.9
Samsung Electronics Latinoamerica
Miami (SEMI) Sale of electronic devices 100.0
Nvelo Software 100.0
Samsung Electronics Latinoamerica
(SELA) Sale of electronic devices 100.0
Samsung Electronics Venezuela (SEVEN) Marketing and services 100.0
Samsung Electronica Colombia
(SAMCOL) Sale of electronic devices 100.0
Samsung Electronics Panama (SEPA) Consulting 100.0
Samsung Electronica da Amazonia
(SEDA)
Manufacture and sale of electronic devices 100.0
Samsung Electronics Argentina (SEASA) Marketing and services 100.0
Samsung Electronics Chile (SECH) Sale of electronic devices 100.0
Samsung Electronics Peru (SEPR) Sale of electronic devices 100.0
RT SV CO-INVEST (RT-SV) Technology business, Venture capital investments 99.9
Quietside Sale of heating and cooling products 100.0
SmartThings Sale of smart home electronics 100.0
PrinterOn Sale of printing solutions 100.0
PrinterOn America Sale of printing solutions 100.0
SIMPRESS Sale of printing solutions 100.0
LoopPay Develop and provide mobile payment service 100.0
YESCO Electronics Manufacture and sale of LED displays 100.0
Beijing Integrated Circuit Industry
International Fund (Beijing Fund) Venture capital investments 99.0
Europe
Samsung Electronics (UK) (SEUK) Sale of electronic devices 100.0
Samsung Electronics Holding (SEHG) Holding Company 100.0
Samsung Semiconductor Europe GmbH
(SSEG) Sale of semiconductor/LCD 100.0
Samsung Electronics GmbH (SEG) Sale of electronic devices 100.0
Samsung Electronics Iberia (SESA) Sale of electronic devices 100.0
Samsung Electronics France (SEF) Sale of electronic devices 100.0
Samsung Electronics Hungarian (SEH) Manufacture and sale of electronic devices 100.0
Samsung Electronics Czech and Slovak
(SECZ) Sale of electronic devices 100.0
Samsung Electronics Italia (SEI) Sale of electronic devices 100.0
Samsung Electronics Europe Logistics
(SELS) Logistics 100.0
Samsung Electronics Benelux (SEBN) Sale of electronic devices 100.0
Samsung Display Slovakia (SDSK) Toll processing of LCD 100.0
Samsung Electronics Romania (SEROM) Sale of electronic devices 100.0
Samsung Electronics Overseas (SEO) Sale of electronic devices 100.0
Samsung Electronics Polska (SEPOL) Sale of electronic devices 100.0

Samsung Electronics Co., Ltd. and Subsidiaries
NOTES TO INTERIM CONSOLIDATED FINANCIAL STATEMENTS
16
Area Subsidiaries Industry
Percentage
of
ownership1
Europe
(Cont.)
Samsung Electronics Portuguesa (SEP) Sale of electronic devices 100.0
Samsung Electronics Nordic (SENA) Sale of electronic devices 100.0
Samsung Semiconductor Europe (SSEL) Sale of semiconductor/LCD 100.0
Samsung Electronics Austria (SEAG) Sale of electronic devices 100.0
Samsung Electronics Slovakia (SESK) Manufacture of CTV/monitors 100.0
Samsung Electronics Europe Holding
(SEEH) Holding Company 100.0
Samsung Electronics Poland
Manufacturing (SEPM) Manufacture of home appliances 100.0
Samsung Electronics Greece (SEGR) Sale of electronic devices 100.0
Samsung Nanoradio Design Center
(SNDC) R&D 100.0
Nanoradio Hellas R&D 100.0
SonoAce Deutschland (SMDE) Medical equipment 100.0
Samsung Electronics Rus (SER) Marketing 100.0
Samsung Electronics Rus Company
(SERC) Sale of electronic devices 100.0
Samsung Electronics Ukraine (SEU) Marketing 100.0
Samsung Electronics Baltics (SEB) Sale of electronic devices 100.0
Samsung Electronics Ukraine Company
(SEUC) Sale of electronic devices 100.0
Samsung R&D Institute Rus (SRR) R&D 100.0
Samsung Electronics Kazakhstan (SEK) Marketing 100.0
Samsung Electronics Central Eurasia
(SECE) Sale of electronic devices 100.0
Samsung Electronics Rus Kaluga (SERK) Manufacture of CTV 100.0
Samsung Russia Service Centre (SRSC) Services 100.0
Samsung Electronics (London) Limited
(SEL) Holding Company 100.0
Samsung Denmark Research Center
(SDRC) R&D 100.0
Samsung France Research Center (SFRC) R&D 100.0
Samsung Cambridge Solution Centre
(SCSC) R&D 100.0
Samsung Electronics Switzerland GmbH
(SESG) Sale of electronic devices 100.0
PrinterOn Europe Sale of printing solutions 100.0
Samsung Electronics Caucasus (SECC) Marketing 100.0
Middle East
and Africa
Samsung Electronics West Africa
(SEWA)
Marketing 100.0
Samsung Electronics East Africa (SEEA) Marketing 100.0
Samsung Gulf Electronics (SGE) Sale of electronic devices 100.0
Samsung Electronics Egypt (SEEG) Manufacture of CTV/monitors 100.0
Samsung Electronics Israel (SEIL) Marketing 100.0
Samsung Electronics Tunisia (SETN) Marketing 100.0
Samsung Electronics Pakistan (SEPAK) Marketing 100.0
Samsung Electronics South Africa (SSA) Sale of electronic devices 100.0
Samsung Electronics Turkey (SETK) Sale of electronic devices 100.0
Samsung Semiconductor Israel R&D
Center (SIRC) R&D 100.0
Samsung Electronics Levant (SELV) Sale of electronic devices 100.0
Samsung Electronics Morocco (SEMRC) Sale of electronic devices 100.0
Samsung Electronics South Africa
Production (SSAP) Manufacture of CTV/monitors 100.0
Samsung Electronics Co., Ltd. and Subsidiaries
NOTES TO INTERIM CONSOLIDATED FINANCIAL STATEMENTS
17
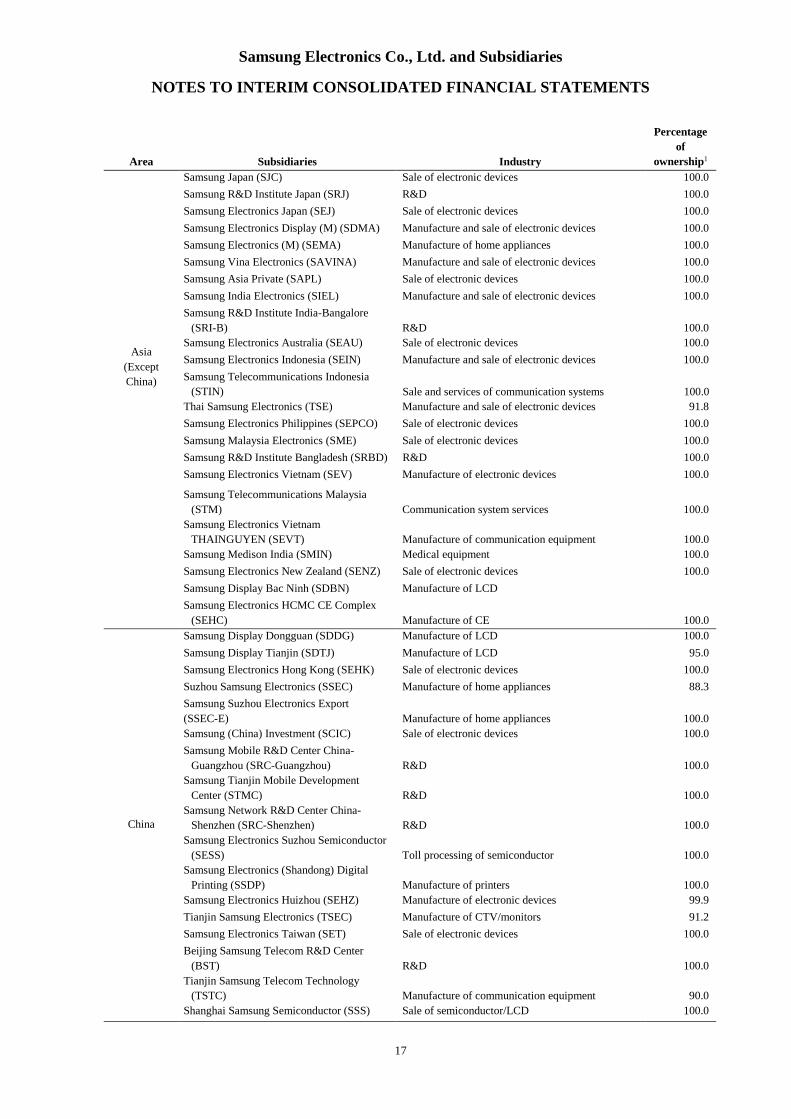
Area Subsidiaries Industry
Percentage
of
ownership1
Asia
(Except
China)
Samsung Japan (SJC) Sale of electronic devices 100.0
Samsung R&D Institute Japan (SRJ) R&D 100.0
Samsung Electronics Japan (SEJ) Sale of electronic devices 100.0
Samsung Electronics Display (M) (SDMA) Manufacture and sale of electronic devices 100.0
Samsung Electronics (M) (SEMA) Manufacture of home appliances 100.0
Samsung Vina Electronics (SAVINA) Manufacture and sale of electronic devices 100.0
Samsung Asia Private (SAPL) Sale of electronic devices 100.0
Samsung India Electronics (SIEL) Manufacture and sale of electronic devices 100.0
Samsung R&D Institute India-Bangalore
(SRI-B) R&D 100.0
Samsung Electronics Australia (SEAU) Sale of electronic devices 100.0
Samsung Electronics Indonesia (SEIN) Manufacture and sale of electronic devices 100.0
Samsung Telecommunications Indonesia
(STIN) Sale and services of communication systems 100.0
Thai Samsung Electronics (TSE) Manufacture and sale of electronic devices 91.8
Samsung Electronics Philippines (SEPCO) Sale of electronic devices 100.0
Samsung Malaysia Electronics (SME) Sale of electronic devices 100.0
Samsung R&D Institute Bangladesh (SRBD) R&D 100.0
Samsung Electronics Vietnam (SEV) Manufacture of electronic devices 100.0
Samsung Telecommunications Malaysia
(STM) Communication system services 100.0
Samsung Electronics Vietnam
THAINGUYEN (SEVT) Manufacture of communication equipment 100.0
Samsung Medison India (SMIN) Medical equipment 100.0
Samsung Electronics New Zealand (SENZ) Sale of electronic devices 100.0
Samsung Display Bac Ninh (SDBN) Manufacture of LCD
Samsung Electronics HCMC CE Complex
(SEHC) Manufacture of CE 100.0
China
Samsung Display Dongguan (SDDG) Manufacture of LCD 100.0
Samsung Display Tianjin (SDTJ) Manufacture of LCD 95.0
Samsung Electronics Hong Kong (SEHK) Sale of electronic devices 100.0
Suzhou Samsung Electronics (SSEC) Manufacture of home appliances 88.3
Samsung Suzhou Electronics Export
(SSEC-E) Manufacture of home appliances 100.0
Samsung (China) Investment (SCIC) Sale of electronic devices 100.0
Samsung Mobile R&D Center China-
Guangzhou (SRC-Guangzhou) R&D 100.0
Samsung Tianjin Mobile Development
Center (STMC) R&D 100.0
Samsung Network R&D Center China-
Shenzhen (SRC-Shenzhen) R&D 100.0
Samsung Electronics Suzhou Semiconductor
(SESS) Toll processing of semiconductor 100.0
Samsung Electronics (Shandong) Digital
Printing (SSDP) Manufacture of printers 100.0
Samsung Electronics Huizhou (SEHZ) Manufacture of electronic devices 99.9
Tianjin Samsung Electronics (TSEC) Manufacture of CTV/monitors 91.2
Samsung Electronics Taiwan (SET) Sale of electronic devices 100.0
Beijing Samsung Telecom R&D Center
(BST) R&D 100.0
Tianjin Samsung Telecom Technology
(TSTC) Manufacture of communication equipment 90.0
Shanghai Samsung Semiconductor (SSS) Sale of semiconductor/LCD 100.0

Samsung Electronics Co., Ltd. and Subsidiaries
NOTES TO INTERIM CONSOLIDATED FINANCIAL STATEMENTS
18
Area Subsidiaries Industry
Percentage
of
ownership1
China
(Cont.)
Samsung Electronics Suzhou Computer
(SESC) Manufacture of electronic devices 100.0
Samsung Display Suzhou (SDSZ) Toll processing of LCD 100.0
Samsung Suzhou LCD (SSL) Manufacture of LCD 60.0
Shenzhen Samsung Electronics
Telecommunication (SSET) Manufacture of communication equipment 95.0
Samsung Electronics Shanghai
Telecommunication (SSTC)
Sale of mobile communication and network
equipment
100.0
Samsung Semiconductor (China) R&D
(SSCR) R&D 100.0
Samsung Electronics China R&D Center
(SCRC) R&D 100.0
Samsung (China) Semiconductor (SCS) Manufacture of semiconductor 100.0
Samsung Electronics (Beijing) Service
(SBSC) Services 100.0
Samsung Medison Shanghai Medical
Instrument (SMS1) Medical equipment 100.0
Tianjin Samsung LED (TSLED) Manufacture of LED 100.0
Tianjin Samsung Opto-Electronics (TSOE) Manufacture of cameras/camcorders 90.0
Samsung R&D Institute China-Xian
(SRC-Xian) R&D 100.0
SEMES (Xian) Semiconductor equipment 100.0
1 Ownership represents the Group’s ownership of voting rights in each entity.

Samsung Electronics Co., Ltd. and Subsidiaries
NOTES TO INTERIM CONSOLIDATED FINANCIAL STATEMENTS
19
(B) A summary of financial data of major consolidated subsidiaries is as follows:
(1) 2015
As of March 31, 2015
For the three months ended
March 31, 2015
(In millions of Korean won) Assets Liabilities Sales
Net Income
(Loss)
Samsung Display (SDC) \ 37,657,400 \ 5,998,638 \ 6,654,684 \ 408,248Samsung Electronics America (SEA) 14,914,135 8,245,602 7,590,758 34,583
Samsung (China) Investment (SCIC) 10,461,232 8,542,937 3,138,366 131,675
Samsung Electronics Vietnam (SEV) 7,272,932 1,527,238 4,205,601 412,951
Samsung (China) Semiconductor (SCS) 7,252,950 4,334,724 535,522 44,943
Samsung Semiconductor (SSI) 6,844,574 3,115,524 4,651,184 15,705
Samsung Austin Semiconductor (SAS) 6,457,142 3,291,042 593,269 21,618
Samsung Electronics Europe Holding (SEEH) 6,444,170 4,629,832 - 2,138
Samsung Electronics Huizhou (SEHZ) 6,025,724 2,113,385 4,410,885 187,194
Samsung Electronics Vietnam THAINGUYEN
(SEVT) 5,373,679 4,169,645 4,343,342 281,898Samsung Electronica da Amazonia (SEDA) 3,884,426 1,591,848 1,741,065 208,375
Samsung India Electronics (SEIL) 3,524,090 2,287,050 1,947,753 41,062
Samsung Asia Private (SAPL) 3,373,403 789,308 391,784 13,493
Tianjin Samsung Telecom Technology (TSTC) 2,368,751 744,615 2,060,961 97,540
Shanghai Samsung Semiconductor (SSS) 2,325,486 1,851,511 2,588,725 30,669
Thai Samsung Electronics (TSE) 1,864,628 426,030 1,036,638 71,512
Samsung Suzhou LCD (SSL) 1,853,565 757,191 249,984 25,595
Samsung Electronics Europe Logistics (SELS) 1,834,889 1,538,819 3,104,293 215,808
Samsung Electronics Slovakia (SESK) 1,816,693 463,709 929,502 42,935
Samsung Electronics Taiwan (SET) 1,609,086 1,309,568 1,258,187 10,264
Samsung Electronics GmbH (SEG) 1,475,030 1,558,132 1,458,805 (149,360)
Samsung Electronics Hungarian (SEH) 1,210,857 289,293 687,322 14,368
Samsung Electronics Benelux (SEBN) 1,205,066 302,708 565,191 28,821
Samsung International (SII) 1,198,308 805,727 1,187,670 (18,609)
Samsung Display Dongguan (SDDG) 1,187,750 406,930 1,158,269 19,793

Samsung Electronics Co., Ltd. and Subsidiaries
NOTES TO INTERIM CONSOLIDATED FINANCIAL STATEMENTS
20
(2) 2014
As of December 31, 2014
For the three months ended
March 31, 2014
(In millions of Korean won) Assets Liabilities Sales
Net Income
(Loss)
Samsung Display (SDC) \ 37,939,965 \ 6,728,991 \ 5,947,527 \ 1,279,409Samsung Electronics America (SEA) 10,697,787 5,409,749 2,635,844 (33,028)
Samsung (China) Investment (SCIC) 9,603,679 7,830,941 6,154,186 20,116
Samsung Semiconductor (SSI) 7,577,935 3,883,673 4,376,811 16,344
Samsung Electronics Europe Holding (SEEH) 7,022,746 5,062,988 - 55,971
Samsung (China) Semiconductor (SCS) 6,765,278 3,911,166 - (24,989)
Samsung Electronics Vietnam (SEV) 6,553,628 1,251,667 6,155,893 792,168
Samsung Austin Semiconductor (SAS) 6,503,003 3,375,099 608,656 15,702
Samsung Telecommunications America (STA) 5,321,014 4,573,413 5,025,660 45,843
Samsung Electronics Huizhou (SEHZ) 4,966,486 1,258,635 4,886,210 146,518
Samsung Electronics Vietnam THAINGUYEN
(SEVT) 3,957,700 3,042,402 96,414 (14,176)Samsung Electronica da Amazonia (SEDA) 3,797,166 1,330,302 1,885,070 204,166
Samsung Asia Private (SAPL) 3,110,433 671,729 378,033 1,061,523
Samsung India Electronics (SIEL) 2,949,605 1,776,936 1,841,991 229,941
Shanghai Samsung Semiconductor (SSS) 2,560,852 2,120,738 3,052,001 33,620
Tianjin Samsung Telecom Technology (TSTC) 2,316,054 789,395 3,585,478 203,564
Samsung Electronics Slovakia (SESK) 1,869,697 405,089 965,110 32,007
Samsung Suzhou LCD (SSL) 1,831,794 768,230 63,667 (74,783)
Thai Samsung Electronics (TSE) 1,654,988 307,109 1,201,746 47,956
Samsung Electronics Europe Logistics (SELS) 1,621,583 1,524,468 3,669,060 302,234
Samsung Electronics Taiwan (SET) 1,583,027 1,299,330 959,236 12,058
Samsung Electronics Hungarian (SEH) 1,287,972 323,972 728,415 47,787
Samsung Electronics (UK) (SEUK) 1,235,239 964,058 1,308,909 (100,894)
Samsung Electronics Benelux (SEBN) 1,207,723 245,237 707,421 (34,626)
Samsung Electronics GmbH (SEG) 1,142,897 1,082,420 1,862,116 (153,191)
(C) Changes in scope of consolidation
(1) Subsidiaries newly included in the consolidation for the three months ended March 31, 2015:
Area Subsidiary Description
Domestic Samsung Venture Capital Union #28 Incorporation
America SIMPRESS Acquisition of shares
LoopPay Acquisition of shares
YESCO Electronics Acquisition of shares
Beijing Integrated Circuit Industry International Fund(Beijing Fund) Acquisition of shares
Paymate Global Acquisition of shares
Asia
(Except China)Samsung Electronics HCMC CE Complex (SEHC) Incorporation
Samsung Electronics Co., Ltd. and Subsidiaries
NOTES TO INTERIM CONSOLIDATED FINANCIAL STATEMENTS
21
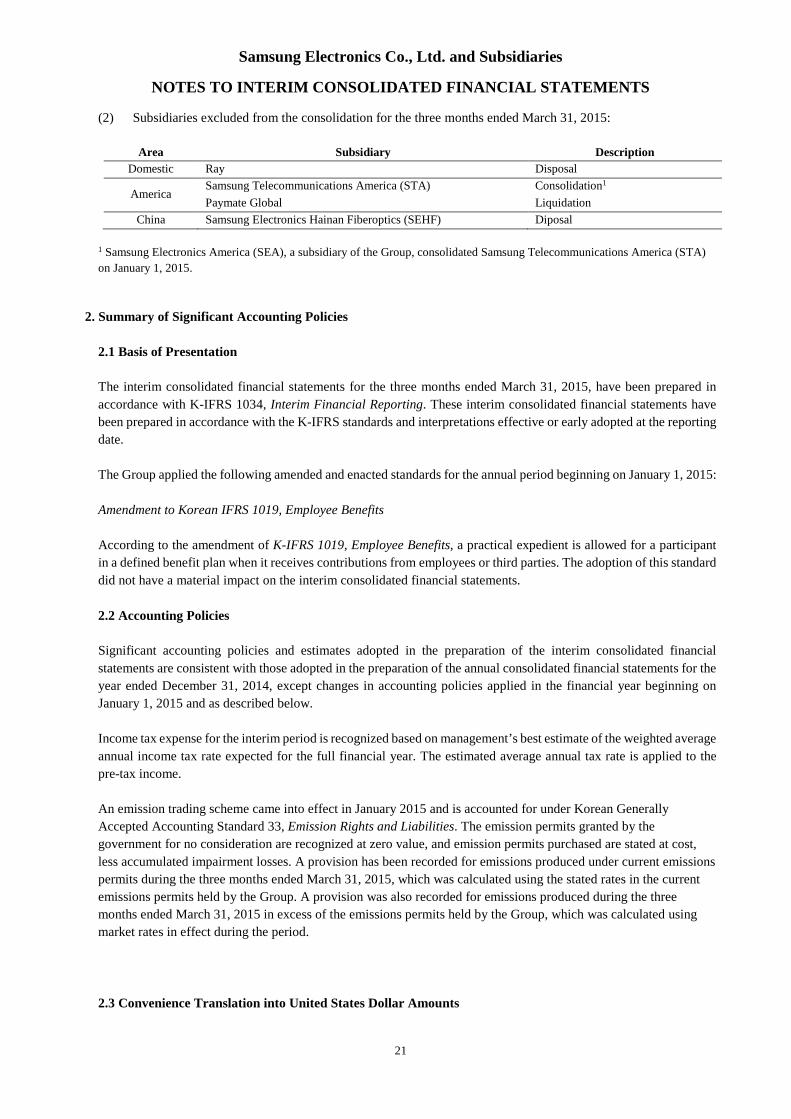
(2) Subsidiaries excluded from the consolidation for the three months ended March 31, 2015:
Area Subsidiary Description
Domestic Ray Disposal
AmericaSamsung Telecommunications America (STA) Consolidation1
Paymate Global Liquidation
China Samsung Electronics Hainan Fiberoptics (SEHF) Diposal
1 Samsung Electronics America (SEA), a subsidiary of the Group, consolidated Samsung Telecommunications America (STA)
on January 1, 2015.
2. Summary of Significant Accounting Policies
2.1 Basis of Presentation
The interim consolidated financial statements for the three months ended March 31, 2015, have been prepared in
accordance with K-IFRS 1034, Interim Financial Reporting. These interim consolidated financial statements have
been prepared in accordance with the K-IFRS standards and interpretations effective or early adopted at the reporting
date.
The Group applied the following amended and enacted standards for the annual period beginning on January 1, 2015:
Amendment to Korean IFRS 1019, Employee Benefits
According to the amendment of K-IFRS 1019, Employee Benefits, a practical expedient is allowed for a participant
in a defined benefit plan when it receives contributions from employees or third parties. The adoption of this standard
did not have a material impact on the interim consolidated financial statements.
2.2 Accounting Policies
Significant accounting policies and estimates adopted in the preparation of the interim consolidated financial
statements are consistent with those adopted in the preparation of the annual consolidated financial statements for the
year ended December 31, 2014, except changes in accounting policies applied in the financial year beginning on
January 1, 2015 and as described below.
Income tax expense for the interim period is recognized based on management’s best estimate of the weighted average
annual income tax rate expected for the full financial year. The estimated average annual tax rate is applied to the
pre-tax income.
An emission trading scheme came into effect in January 2015 and is accounted for under Korean Generally
Accepted Accounting Standard 33, Emission Rights and Liabilities. The emission permits granted by the
government for no consideration are recognized at zero value, and emission permits purchased are stated at cost,
less accumulated impairment losses. A provision has been recorded for emissions produced under current emissions
permits during the three months ended March 31, 2015, which was calculated using the stated rates in the current
emissions permits held by the Group. A provision was also recorded for emissions produced during the three
months ended March 31, 2015 in excess of the emissions permits held by the Group, which was calculated using
market rates in effect during the period.
2.3 Convenience Translation into United States Dollar Amounts
Samsung Electronics Co., Ltd. and Subsidiaries
NOTES TO INTERIM CONSOLIDATED FINANCIAL STATEMENTS
22
The Company operates primarily in Korean won and its official accounting records are maintained in Korean won.
The US dollar amounts provided in the financial statements represent supplementary information solely for the
convenience of the reader. All Korean won amounts are expressed in US dollars at the rate of₩1,100.16 to US $1,
the average exchange rate for the three month period ended in March 31, 2015. Such presentation is not in accordance
with generally accepted accounting principles, and should not be construed as a representation that the Korean won
amounts shown could be readily converted, realized or settled in U.S. dollars at this or at any other rate.
2.4 Critical Accounting Estimates and Assumptions
In preparing the interim consolidated financial statements, the management of the Group makes estimates and
assumptions on matters which affect the application of policies and reported amounts of assets, liabilities, income
and expenses. Estimates and assumptions are continually evaluated and are based on historical experience and other
factors, including expectations of future events that are believed to be reasonable under the circumstances. The
resulting accounting estimates, by definition, seldom equal the related actual results.
Critical accounting estimates and assumptions made in the preparation of the interim consolidated financial
statements are consistent with those made in the preparation of the annual consolidated financial statements for the
year ended December 31, 2014, except for the estimation methodologies applied in deriving corporate income tax,
emission rights, and emission liabilities.
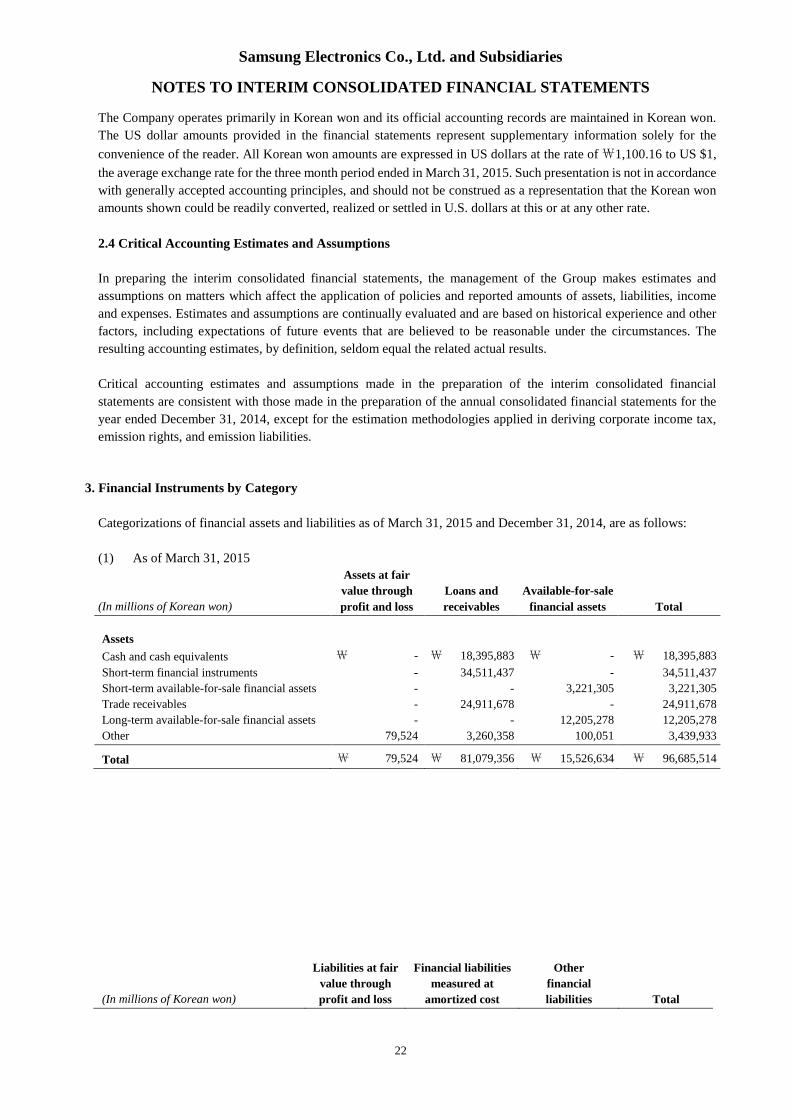
3. Financial Instruments by Category
Categorizations of financial assets and liabilities as of March 31, 2015 and December 31, 2014, are as follows:
(1) As of March 31, 2015
(In millions of Korean won)
Assets at fair
value through
profit and loss
Loans and
receivables
Available-for-sale
financial assets Total
Assets
Cash and cash equivalents ₩ - ₩ 18,395,883 ₩ - ₩ 18,395,883
Short-term financial instruments - 34,511,437 - 34,511,437
Short-term available-for-sale financial assets - - 3,221,305 3,221,305
Trade receivables - 24,911,678 - 24,911,678
Long-term available-for-sale financial assets - - 12,205,278 12,205,278
Other 79,524 3,260,358 100,051 3,439,933
Total ₩ 79,524 ₩ 81,079,356 ₩ 15,526,634 ₩ 96,685,514
(In millions of Korean won)
Liabilities at fair
value through
profit and loss
Financial liabilities
measured at
amortized cost
Other
financial
liabilities Total
Samsung Electronics Co., Ltd. and Subsidiaries
NOTES TO INTERIM CONSOLIDATED FINANCIAL STATEMENTS
23
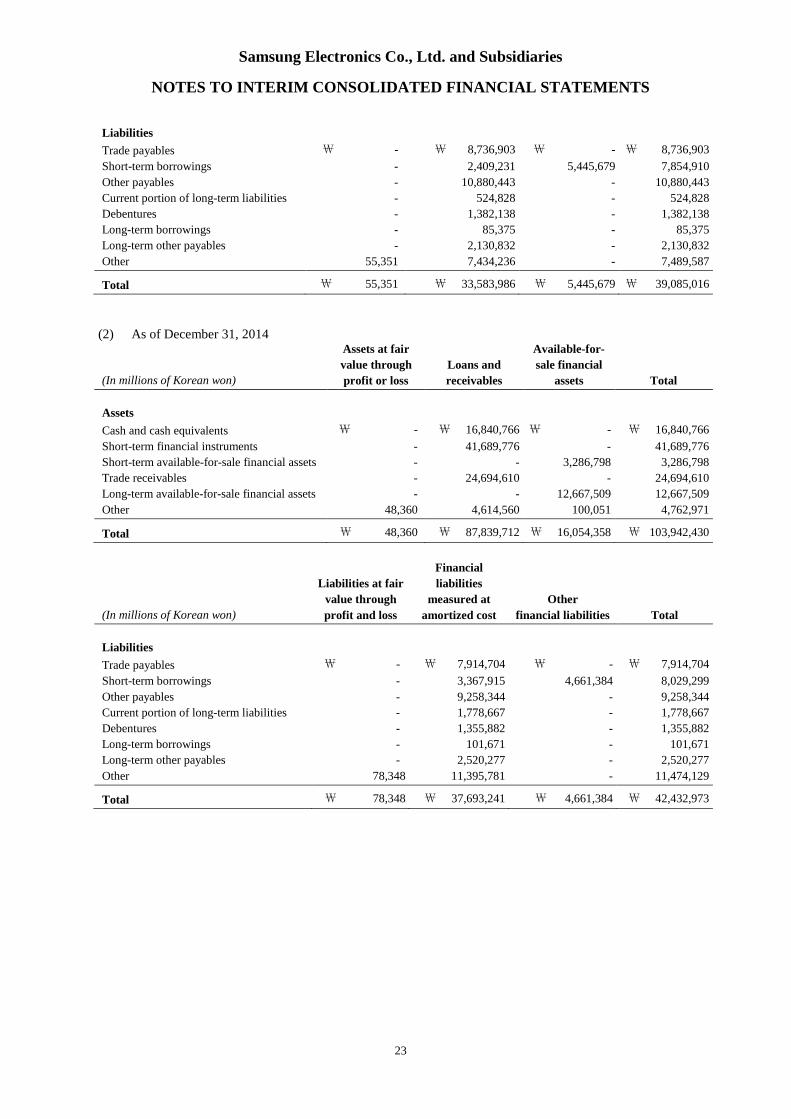
Liabilities
Trade payables ₩ - ₩ 8,736,903 ₩ - ₩ 8,736,903
Short-term borrowings - 2,409,231 5,445,679 7,854,910
Other payables - 10,880,443 - 10,880,443
Current portion of long-term liabilities - 524,828 - 524,828
Debentures - 1,382,138 - 1,382,138
Long-term borrowings - 85,375 - 85,375
Long-term other payables - 2,130,832 - 2,130,832
Other 55,351 7,434,236 - 7,489,587
Total ₩ 55,351 ₩ 33,583,986 ₩ 5,445,679 ₩ 39,085,016
(2) As of December 31, 2014
(In millions of Korean won)
Assets at fair
value through
profit or loss
Loans and
receivables
Available-for-
sale financial
assets Total
Assets
Cash and cash equivalents ₩ - ₩ 16,840,766 ₩ - ₩ 16,840,766
Short-term financial instruments - 41,689,776 - 41,689,776
Short-term available-for-sale financial assets - - 3,286,798 3,286,798
Trade receivables - 24,694,610 - 24,694,610
Long-term available-for-sale financial assets - - 12,667,509 12,667,509
Other 48,360 4,614,560 100,051 4,762,971
Total ₩ 48,360 ₩ 87,839,712 ₩ 16,054,358 ₩ 103,942,430
(In millions of Korean won)
Liabilities at fair
value through
profit and loss
Financial
liabilities
measured at
amortized cost
Other
financial liabilities Total
Liabilities
Trade payables ₩ - ₩ 7,914,704 ₩ - ₩ 7,914,704
Short-term borrowings - 3,367,915 4,661,384 8,029,299
Other payables - 9,258,344 - 9,258,344
Current portion of long-term liabilities - 1,778,667 - 1,778,667
Debentures - 1,355,882 - 1,355,882
Long-term borrowings - 101,671 - 101,671
Long-term other payables - 2,520,277 - 2,520,277
Other 78,348 11,395,781 - 11,474,129
Total ₩ 78,348 ₩ 37,693,241 ₩ 4,661,384 ₩ 42,432,973
Samsung Electronics Co., Ltd. and Subsidiaries
NOTES TO INTERIM CONSOLIDATED FINANCIAL STATEMENTS
24
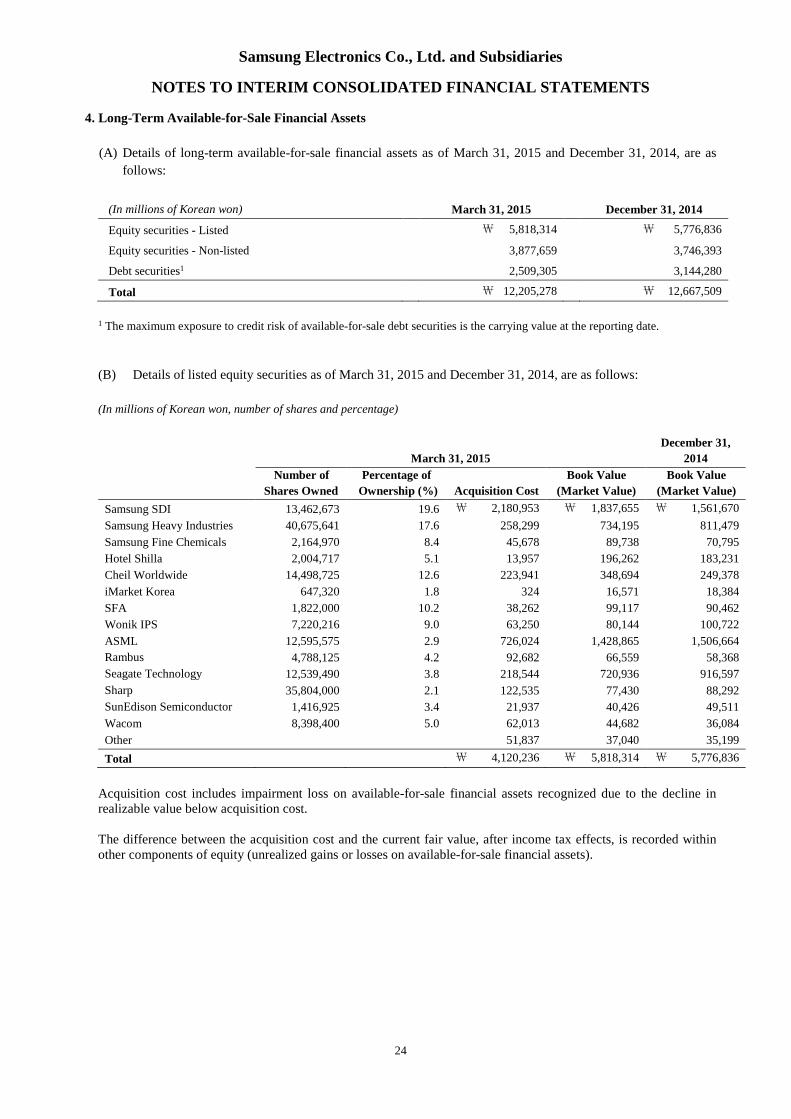
4. Long-Term Available-for-Sale Financial Assets
(A) Details of long-term available-for-sale financial assets as of March 31, 2015 and December 31, 2014, are as
follows:
(In millions of Korean won) March 31, 2015 December 31, 2014
Equity securities - Listed ₩ 5,818,314 ₩ 5,776,836
Equity securities - Non-listed 3,877,659 3,746,393
Debt securities1 2,509,305 3,144,280
Total ₩ 12,205,278 ₩ 12,667,509
1 The maximum exposure to credit risk of available-for-sale debt securities is the carrying value at the reporting date.
(B) Details of listed equity securities as of March 31, 2015 and December 31, 2014, are as follows:
(In millions of Korean won, number of shares and percentage)
March 31, 2015
December 31,
2014
Number of
Shares Owned
Percentage of
Ownership (%) Acquisition Cost
Book Value
(Market Value)
Book Value
(Market Value)
Samsung SDI 13,462,673 19.6 ₩ 2,180,953 ₩ 1,837,655 ₩ 1,561,670
Samsung Heavy Industries 40,675,641 17.6 258,299 734,195 811,479
Samsung Fine Chemicals 2,164,970 8.4 45,678 89,738 70,795
Hotel Shilla 2,004,717 5.1 13,957 196,262 183,231
Cheil Worldwide 14,498,725 12.6 223,941 348,694 249,378
iMarket Korea 647,320 1.8 324 16,571 18,384
SFA 1,822,000 10.2 38,262 99,117 90,462
Wonik IPS 7,220,216 9.0 63,250 80,144 100,722
ASML 12,595,575 2.9 726,024 1,428,865 1,506,664
Rambus 4,788,125 4.2 92,682 66,559 58,368
Seagate Technology 12,539,490 3.8 218,544 720,936 916,597
Sharp 35,804,000 2.1 122,535 77,430 88,292
SunEdison Semiconductor 1,416,925 3.4 21,937 40,426 49,511
Wacom 8,398,400 5.0 62,013 44,682 36,084
Other 51,837 37,040 35,199
Total ₩ 4,120,236 ₩ 5,818,314 ₩ 5,776,836
Acquisition cost includes impairment loss on available-for-sale financial assets recognized due to the decline inrealizable value below acquisition cost.
The difference between the acquisition cost and the current fair value, after income tax effects, is recorded withinother components of equity (unrealized gains or losses on available-for-sale financial assets).
Samsung Electronics Co., Ltd. and Subsidiaries
NOTES TO INTERIM CONSOLIDATED FINANCIAL STATEMENTS
25
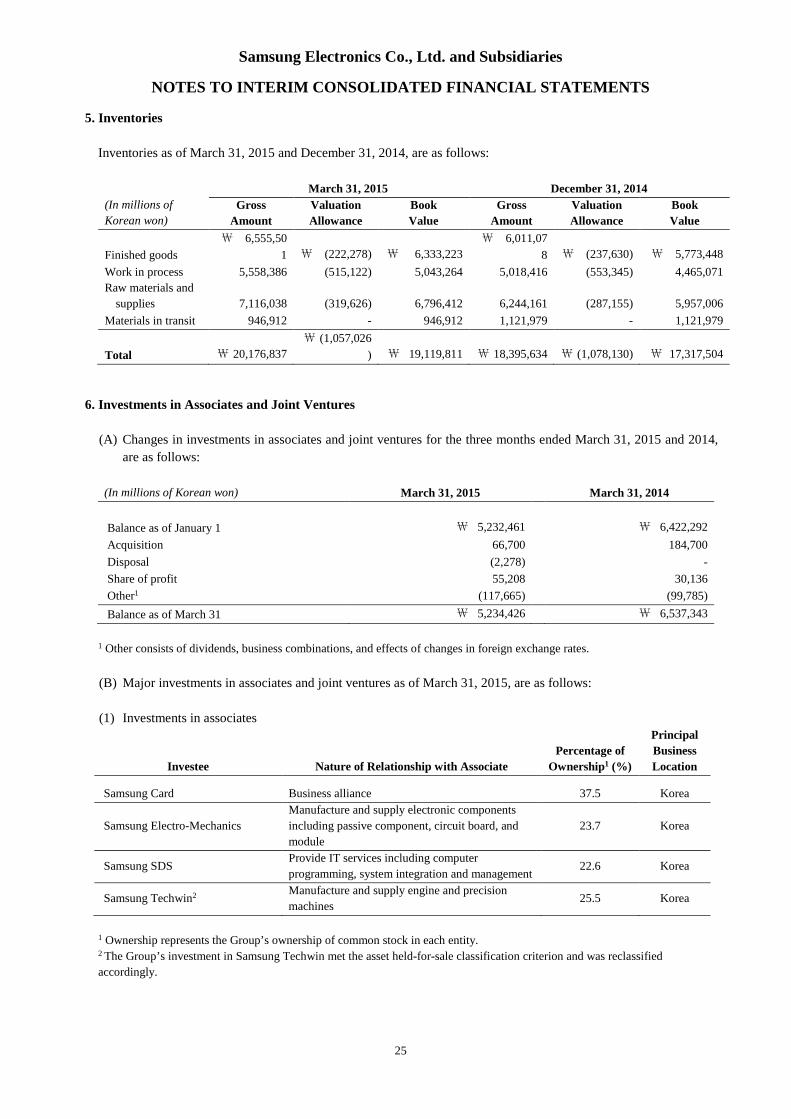
5. Inventories
Inventories as of March 31, 2015 and December 31, 2014, are as follows:
(In millions of
Korean won)
March 31, 2015 December 31, 2014
Gross
Amount
Valuation
Allowance
Book
Value
Gross
Amount
Valuation
Allowance
Book
Value
Finished goods
₩ 6,555,50
1 ₩ (222,278) ₩ 6,333,223
₩ 6,011,07
8 ₩ (237,630) ₩ 5,773,448
Work in process 5,558,386 (515,122) 5,043,264 5,018,416 (553,345) 4,465,071
Raw materials and
supplies 7,116,038 (319,626) 6,796,412 6,244,161 (287,155) 5,957,006
Materials in transit 946,912 - 946,912 1,121,979 - 1,121,979
Total ₩ 20,176,837
₩ (1,057,026
) ₩ 19,119,811 ₩ 18,395,634 ₩ (1,078,130) ₩ 17,317,504
6. Investments in Associates and Joint Ventures
(A) Changes in investments in associates and joint ventures for the three months ended March 31, 2015 and 2014,
are as follows:
(In millions of Korean won) March 31, 2015 March 31, 2014
Balance as of January 1 ₩ 5,232,461 ₩ 6,422,292
Acquisition 66,700 184,700
Disposal (2,278) -
Share of profit 55,208 30,136
Other1 (117,665) (99,785)
Balance as of March 31 ₩ 5,234,426 ₩ 6,537,343
1 Other consists of dividends, business combinations, and effects of changes in foreign exchange rates.
(B) Major investments in associates and joint ventures as of March 31, 2015, are as follows:
(1) Investments in associates
Investee Nature of Relationship with Associate
Percentage of
Ownership1 (%)
Principal
Business
Location
Samsung Card Business alliance 37.5 Korea
Samsung Electro-Mechanics
Manufacture and supply electronic components
including passive component, circuit board, and
module
23.7 Korea
Samsung SDSProvide IT services including computer
programming, system integration and management22.6 Korea
Samsung Techwin2 Manufacture and supply engine and precision
machines25.5 Korea
1 Ownership represents the Group’s ownership of common stock in each entity.2 The Group’s investment in Samsung Techwin met the asset held-for-sale classification criterion and was reclassified
accordingly.
Samsung Electronics Co., Ltd. and Subsidiaries
NOTES TO INTERIM CONSOLIDATED FINANCIAL STATEMENTS
26
Samsung Electronics Co., Ltd. and Subsidiaries
NOTES TO INTERIM CONSOLIDATED FINANCIAL STATEMENTS
27
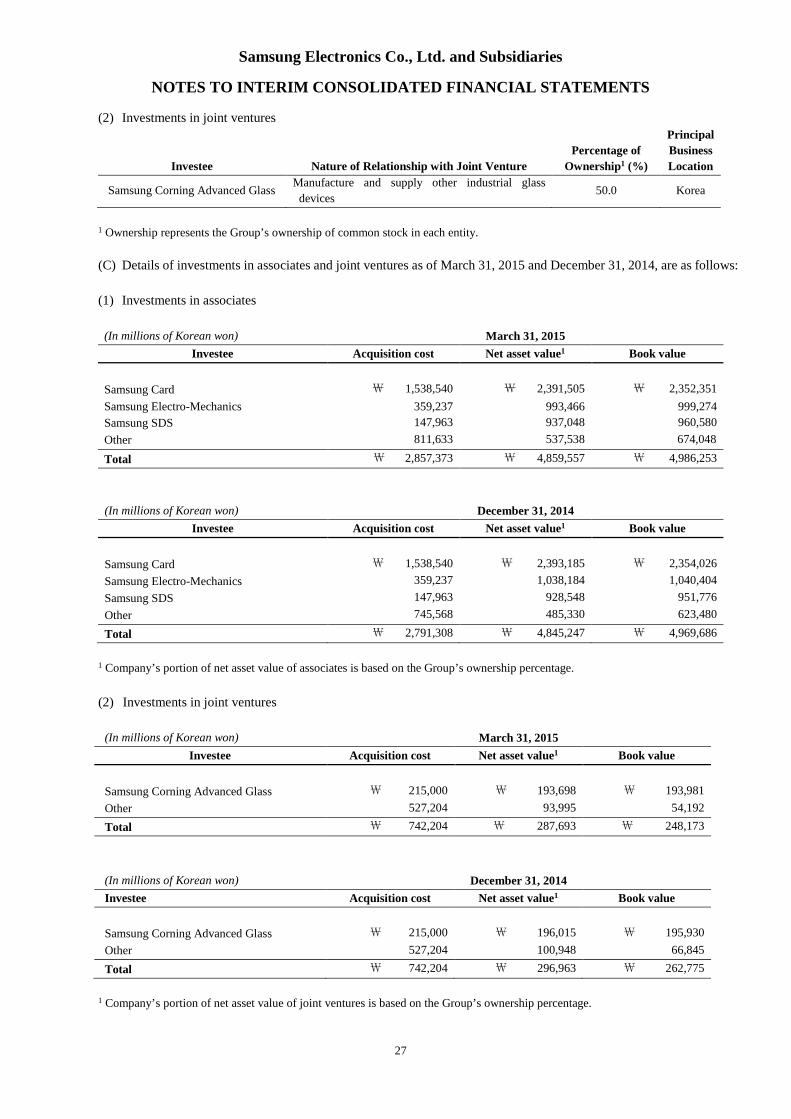
(2) Investments in joint ventures
Investee Nature of Relationship with Joint Venture
Percentage of
Ownership1 (%)
Principal
Business
Location
Samsung Corning Advanced GlassManufacture and supply other industrial glass
devices50.0 Korea
1 Ownership represents the Group’s ownership of common stock in each entity.
(C) Details of investments in associates and joint ventures as of March 31, 2015 and December 31, 2014, are as follows:
(1) Investments in associates
(In millions of Korean won) March 31, 2015
Investee Acquisition cost Net asset value1 Book value
Samsung Card ₩ 1,538,540 ₩ 2,391,505 ₩ 2,352,351
Samsung Electro-Mechanics 359,237 993,466 999,274
Samsung SDS 147,963 937,048 960,580
Other 811,633 537,538 674,048
Total ₩ 2,857,373 ₩ 4,859,557 ₩ 4,986,253
(In millions of Korean won) December 31, 2014
Investee Acquisition cost Net asset value1 Book value
Samsung Card ₩ 1,538,540 ₩ 2,393,185 ₩ 2,354,026
Samsung Electro-Mechanics 359,237 1,038,184 1,040,404
Samsung SDS 147,963 928,548 951,776
Other 745,568 485,330 623,480
Total ₩ 2,791,308 ₩ 4,845,247 ₩ 4,969,686
1 Company’s portion of net asset value of associates is based on the Group’s ownership percentage.
(2) Investments in joint ventures
(In millions of Korean won) March 31, 2015
Investee Acquisition cost Net asset value1 Book value
Samsung Corning Advanced Glass ₩ 215,000 ₩ 193,698 ₩ 193,981
Other 527,204 93,995 54,192
Total ₩ 742,204 ₩ 287,693 ₩ 248,173
(In millions of Korean won) December 31, 2014
Investee Acquisition cost Net asset value1 Book value
Samsung Corning Advanced Glass ₩ 215,000 ₩ 196,015 ₩ 195,930
Other 527,204 100,948 66,845
Total ₩ 742,204 ₩ 296,963 ₩ 262,775
1 Company’s portion of net asset value of joint ventures is based on the Group’s ownership percentage.
Samsung Electronics Co., Ltd. and Subsidiaries
NOTES TO INTERIM CONSOLIDATED FINANCIAL STATEMENTS
28
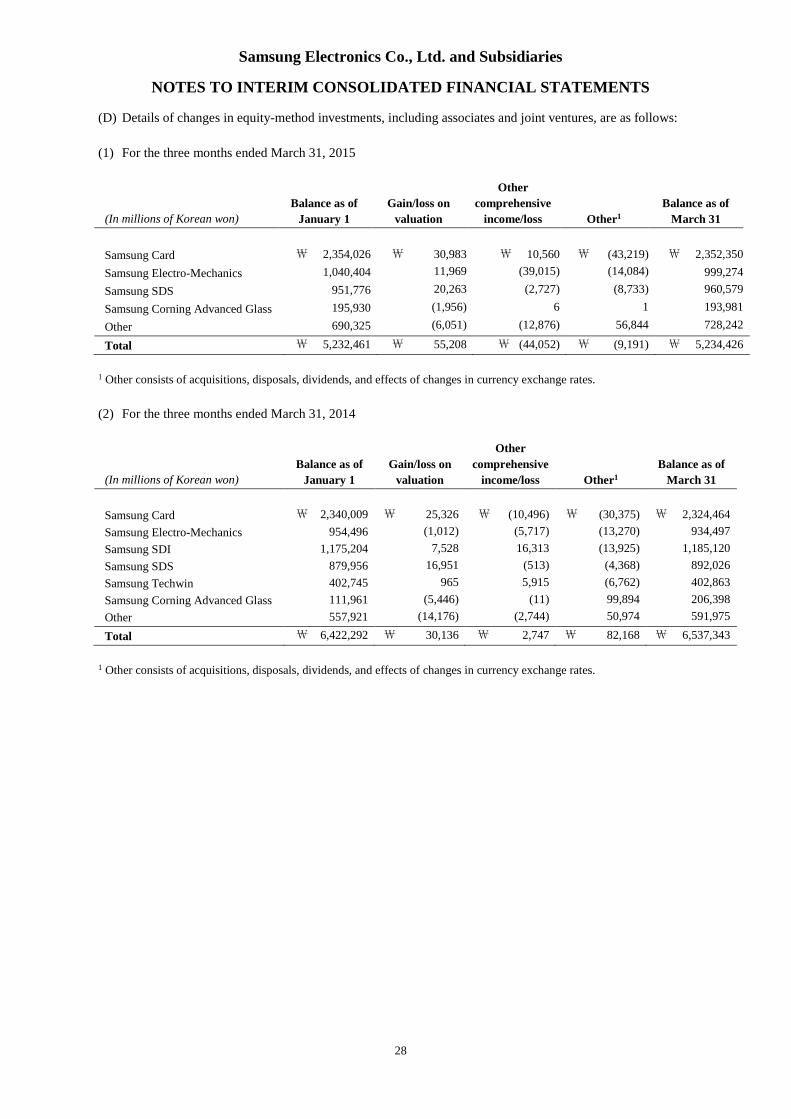
(D) Details of changes in equity-method investments, including associates and joint ventures, are as follows:
(1) For the three months ended March 31, 2015
(In millions of Korean won)
Balance as of
January 1
Gain/loss on
valuation
Other
comprehensive
income/loss Other1
Balance as of
March 31
Samsung Card ₩ 2,354,026 ₩ 30,983 ₩ 10,560 ₩ (43,219) ₩ 2,352,350
Samsung Electro-Mechanics 1,040,404 11,969 (39,015) (14,084) 999,274
Samsung SDS 951,776 20,263 (2,727) (8,733) 960,579
Samsung Corning Advanced Glass 195,930 (1,956) 6 1 193,981
Other 690,325 (6,051) (12,876) 56,844 728,242
Total ₩ 5,232,461 ₩ 55,208 ₩ (44,052) ₩ (9,191) ₩ 5,234,426
1 Other consists of acquisitions, disposals, dividends, and effects of changes in currency exchange rates.
(2) For the three months ended March 31, 2014
(In millions of Korean won)
Balance as of
January 1
Gain/loss on
valuation
Other
comprehensive
income/loss Other1
Balance as of
March 31
Samsung Card ₩ 2,340,009 ₩ 25,326 ₩ (10,496) ₩ (30,375) ₩ 2,324,464
Samsung Electro-Mechanics 954,496 (1,012) (5,717) (13,270) 934,497
Samsung SDI 1,175,204 7,528 16,313 (13,925) 1,185,120
Samsung SDS 879,956 16,951 (513) (4,368) 892,026
Samsung Techwin 402,745 965 5,915 (6,762) 402,863
Samsung Corning Advanced Glass 111,961 (5,446) (11) 99,894 206,398
Other 557,921 (14,176) (2,744) 50,974 591,975
Total ₩ 6,422,292 ₩ 30,136 ₩ 2,747 ₩ 82,168 ₩ 6,537,343
1 Other consists of acquisitions, disposals, dividends, and effects of changes in currency exchange rates.
Samsung Electronics Co., Ltd. and Subsidiaries
NOTES TO INTERIM CONSOLIDATED FINANCIAL STATEMENTS
29
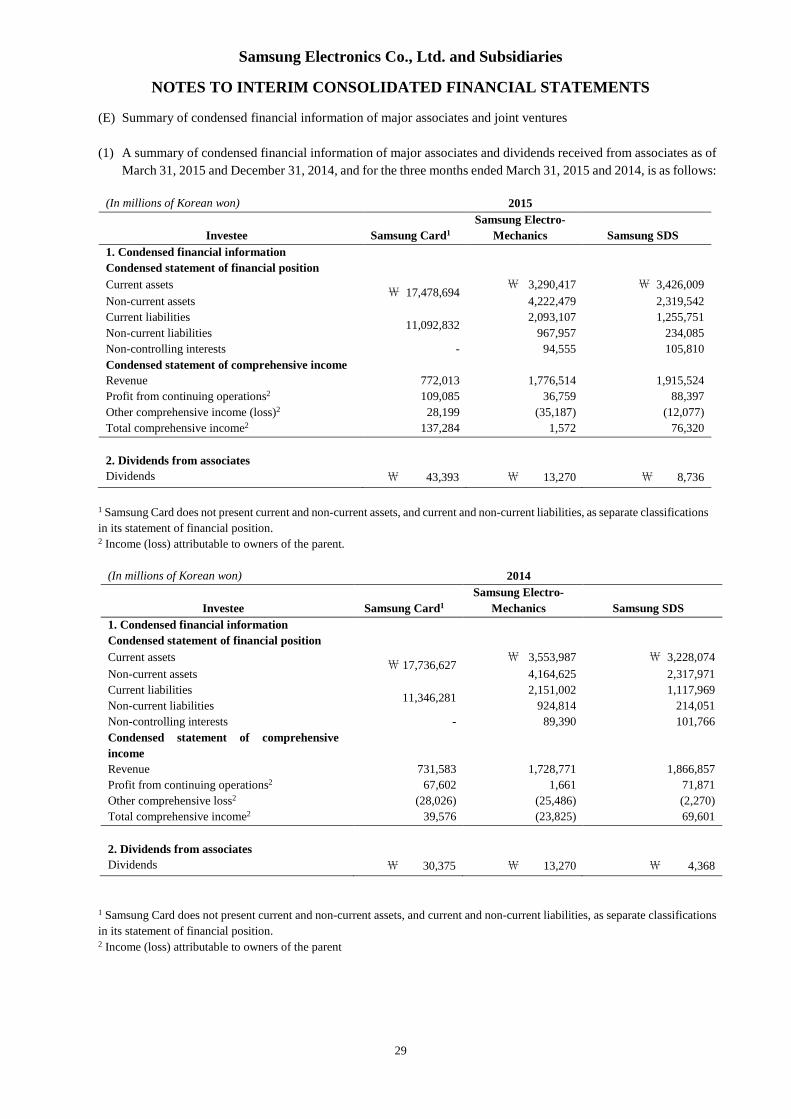
(E) Summary of condensed financial information of major associates and joint ventures
(1) A summary of condensed financial information of major associates and dividends received from associates as of
March 31, 2015 and December 31, 2014, and for the three months ended March 31, 2015 and 2014, is as follows:
(In millions of Korean won) 2015
Investee Samsung Card1
Samsung Electro-
Mechanics Samsung SDS
1. Condensed financial information
Condensed statement of financial position
Current assets₩ 17,478,694
₩ 3,290,417 ₩ 3,426,009
Non-current assets 4,222,479 2,319,542
Current liabilities11,092,832
2,093,107 1,255,751
Non-current liabilities 967,957 234,085
Non-controlling interests - 94,555 105,810
Condensed statement of comprehensive income
Revenue 772,013 1,776,514 1,915,524
Profit from continuing operations2 109,085 36,759 88,397
Other comprehensive income (loss)2 28,199 (35,187) (12,077)
Total comprehensive income2 137,284 1,572 76,320
2. Dividends from associates
Dividends ₩ 43,393 ₩ 13,270 ₩ 8,736
1 Samsung Card does not present current and non-current assets, and current and non-current liabilities, as separate classifications
in its statement of financial position.2 Income (loss) attributable to owners of the parent.
1 Samsung Card does not present current and non-current assets, and current and non-current liabilities, as separate classifications
in its statement of financial position.2 Income (loss) attributable to owners of the parent
(In millions of Korean won) 2014
Investee Samsung Card1
Samsung Electro-
Mechanics Samsung SDS
1. Condensed financial information
Condensed statement of financial position
Current assets₩ 17,736,627
₩ 3,553,987 ₩ 3,228,074
Non-current assets 4,164,625 2,317,971
Current liabilities11,346,281
2,151,002 1,117,969
Non-current liabilities 924,814 214,051
Non-controlling interests - 89,390 101,766
Condensed statement of comprehensive
income
Revenue 731,583 1,728,771 1,866,857
Profit from continuing operations2 67,602 1,661 71,871
Other comprehensive loss2 (28,026) (25,486) (2,270)
Total comprehensive income2 39,576 (23,825) 69,601
2. Dividends from associates
Dividends ₩ 30,375 ₩ 13,270 ₩ 4,368
Samsung Electronics Co., Ltd. and Subsidiaries
NOTES TO INTERIM CONSOLIDATED FINANCIAL STATEMENTS
30
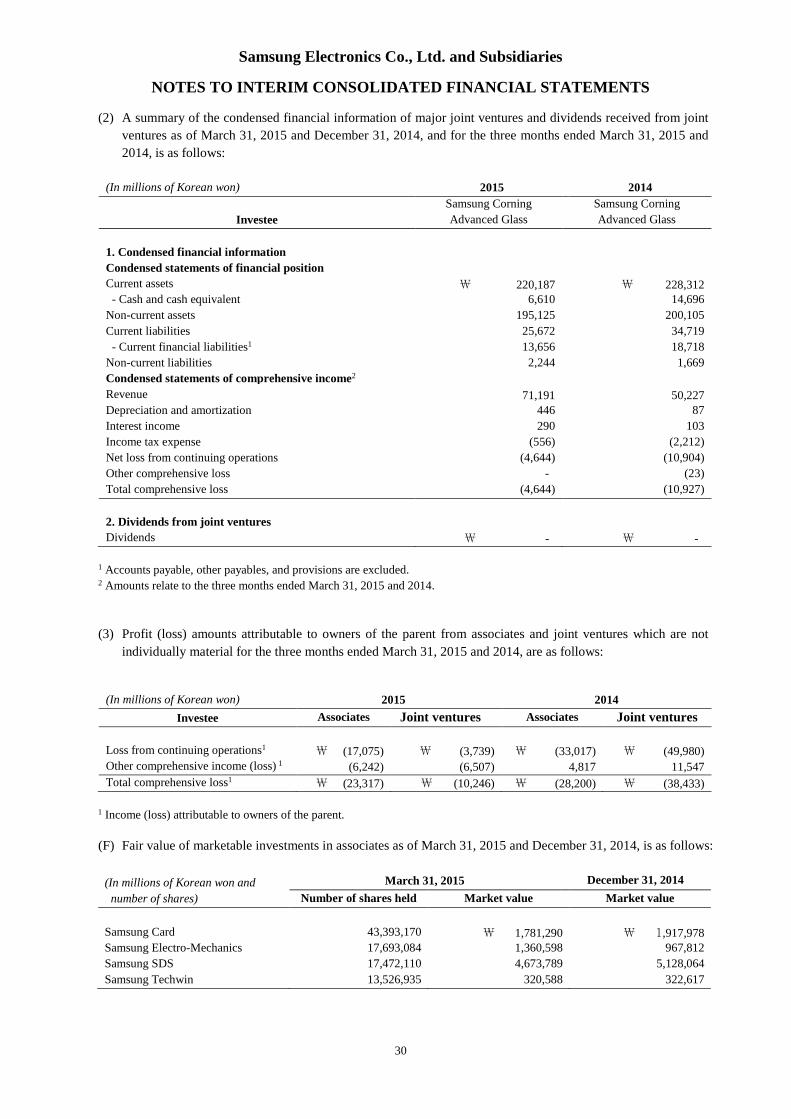
(2) A summary of the condensed financial information of major joint ventures and dividends received from joint
ventures as of March 31, 2015 and December 31, 2014, and for the three months ended March 31, 2015 and
2014, is as follows:
(In millions of Korean won) 2015 2014
Investee
Samsung Corning
Advanced Glass
Samsung Corning
Advanced Glass
1. Condensed financial information
Condensed statements of financial position
Current assets ₩ 220,187 ₩ 228,312- Cash and cash equivalent 6,610 14,696
Non-current assets 195,125 200,105
Current liabilities 25,672 34,719
- Current financial liabilities1 13,656 18,718
Non-current liabilities 2,244 1,669
Condensed statements of comprehensive income2
Revenue 71,191 50,227Depreciation and amortization 446 87
Interest income 290 103
Income tax expense (556) (2,212)
Net loss from continuing operations (4,644) (10,904)
Other comprehensive loss - (23)
Total comprehensive loss (4,644) (10,927)
2. Dividends from joint ventures
Dividends ₩ - ₩ -
1 Accounts payable, other payables, and provisions are excluded.2 Amounts relate to the three months ended March 31, 2015 and 2014.
(3) Profit (loss) amounts attributable to owners of the parent from associates and joint ventures which are not
individually material for the three months ended March 31, 2015 and 2014, are as follows:
(In millions of Korean won) 2015 2014
Investee Associates Joint ventures Associates Joint ventures
Loss from continuing operations1 ₩ (17,075) ₩ (3,739) ₩ (33,017) ₩ (49,980)Other comprehensive income (loss) 1 (6,242) (6,507) 4,817 11,547
Total comprehensive loss1 ₩ (23,317) ₩ (10,246) ₩ (28,200) ₩ (38,433)
1 Income (loss) attributable to owners of the parent.
(F) Fair value of marketable investments in associates as of March 31, 2015 and December 31, 2014, is as follows:
(In millions of Korean won and
number of shares)
March 31, 2015 December 31, 2014
Number of shares held Market value Market value
Samsung Card 43,393,170 ₩ 1,781,290 ₩ 1,917,978Samsung Electro-Mechanics 17,693,084 1,360,598 967,812
Samsung SDS 17,472,110 4,673,789 5,128,064
Samsung Techwin 13,526,935 320,588 322,617
Samsung Electronics Co., Ltd. and Subsidiaries
NOTES TO INTERIM CONSOLIDATED FINANCIAL STATEMENTS
31
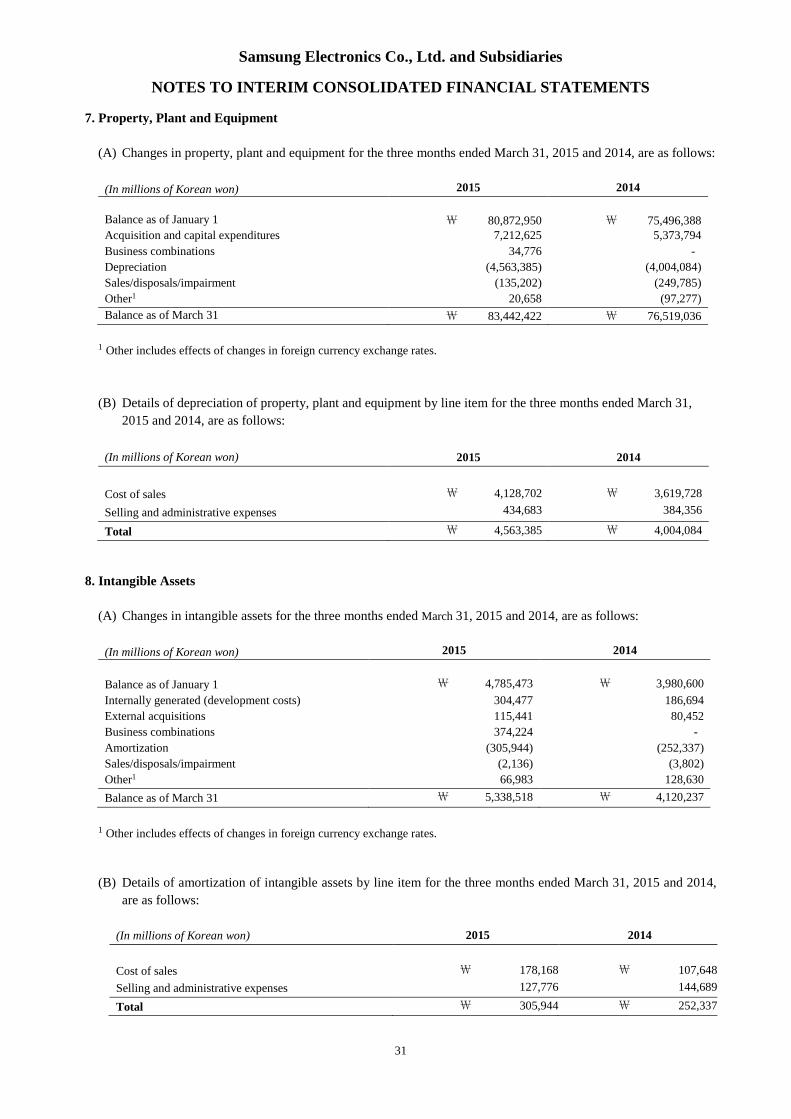
7. Property, Plant and Equipment
(A) Changes in property, plant and equipment for the three months ended March 31, 2015 and 2014, are as follows:
(In millions of Korean won) 2015 2014
Balance as of January 1 ₩ 80,872,950 ₩ 75,496,388Acquisition and capital expenditures 7,212,625 5,373,794
Business combinations 34,776 -
Depreciation (4,563,385) (4,004,084)
Sales/disposals/impairment (135,202) (249,785)
Other1 20,658 (97,277)
Balance as of March 31 ₩ 83,442,422 ₩ 76,519,036
1 Other includes effects of changes in foreign currency exchange rates.
(B) Details of depreciation of property, plant and equipment by line item for the three months ended March 31,
2015 and 2014, are as follows:
(In millions of Korean won) 2015 2014
Cost of sales ₩ 4,128,702 ₩ 3,619,728
Selling and administrative expenses 434,683 384,356
Total ₩ 4,563,385 ₩ 4,004,084
8. Intangible Assets
(A) Changes in intangible assets for the three months ended March 31, 2015 and 2014, are as follows:
(In millions of Korean won) 2015 2014
Balance as of January 1 ₩ 4,785,473 ₩ 3,980,600
Internally generated (development costs) 304,477 186,694
External acquisitions 115,441 80,452
Business combinations 374,224 -
Amortization (305,944) (252,337)
Sales/disposals/impairment (2,136) (3,802)
Other1 66,983 128,630
Balance as of March 31 ₩ 5,338,518 ₩ 4,120,237
1 Other includes effects of changes in foreign currency exchange rates.
(B) Details of amortization of intangible assets by line item for the three months ended March 31, 2015 and 2014,
are as follows:
(In millions of Korean won) 2015 2014
Cost of sales ₩ 178,168 ₩ 107,648
Selling and administrative expenses 127,776 144,689
Total ₩ 305,944 ₩ 252,337

Samsung Electronics Co., Ltd. and Subsidiaries
NOTES TO INTERIM CONSOLIDATED FINANCIAL STATEMENTS
32
9. Borrowings
Details of the carrying amounts of borrowings as of March 31, 2015 and December 31, 2014 are as follows:
(In millions of Korean won)
Financial
Institutions
Annual Interest Rates(%)
as of March 31, 2015
March 31,
2015
December 31,
2014
Short-term borrowings
Collateralized borrowings1 Woori Bank and others 0.4 ~ 11.2 ₩ 5,445,679 ₩ 4,661,384
Non-collateralized borrowings Citibank and others 0.4 ~ 11.8 2,409,231 3,367,915
Total ₩ 7,854,910 ₩ 8,029,299
Current portion of
long-term borrowings
Bank borrowings SMBC and others 0.5 ~ 14.9 ₩ 494,091 ₩ 1,758,556
Financial lease liabilities2 CSSD and others 1.1 ~ 15.7 14,985 14,807
Total ₩ 509,076 ₩ 1,773,363
Long-term borrowings
Bank borrowings SMBC and others 1.1 ~ 19.0 ₩ 8,948 ₩ 23,989
Financial lease liabilities2 CSSD and others 1.1 ~ 15.7 76,427 77,682
Total ₩ 85,375 ₩ 101,671
1 Collateralized borrowings are secured by trade receivables.2 Leased property, plant and equipment were pledged as collateral.
10. Debentures
Details of the carrying amount of debentures as of March 31, 2015 and December 31, 2014 are as follows:
(In millions of Korean won) March 31, 2015 December 31, 2014
Korean won denominated debentures (A) ₩ 199,594 ₩ 199,515
Foreign currency denominated debentures (B) 1,182,544 1,156,367
Total ₩ 1,382,138 ₩ 1,355,882
(A) Details of Korean won denominated debentures as of March 31, 2015 and December 31, 2014 are as follows:
(In millions of Korean
won) Issue Date Due Date
Annual Interest Rates
(%)
as of March 31, 2015 March 31, 2015 December 31, 2014
Unsecured debentures 2011.11.17 2016.11.17 4.2 ₩ 200,000 ₩ 200,000
Less: Current portion - -
Less: Discounts (406) (485)
Total ₩ 199,594 ₩ 199,515
All the above debentures have been issued by Samsung Display and will be repaid upon maturity.
Samsung Electronics Co., Ltd. and Subsidiaries
NOTES TO INTERIM CONSOLIDATED FINANCIAL STATEMENTS
33
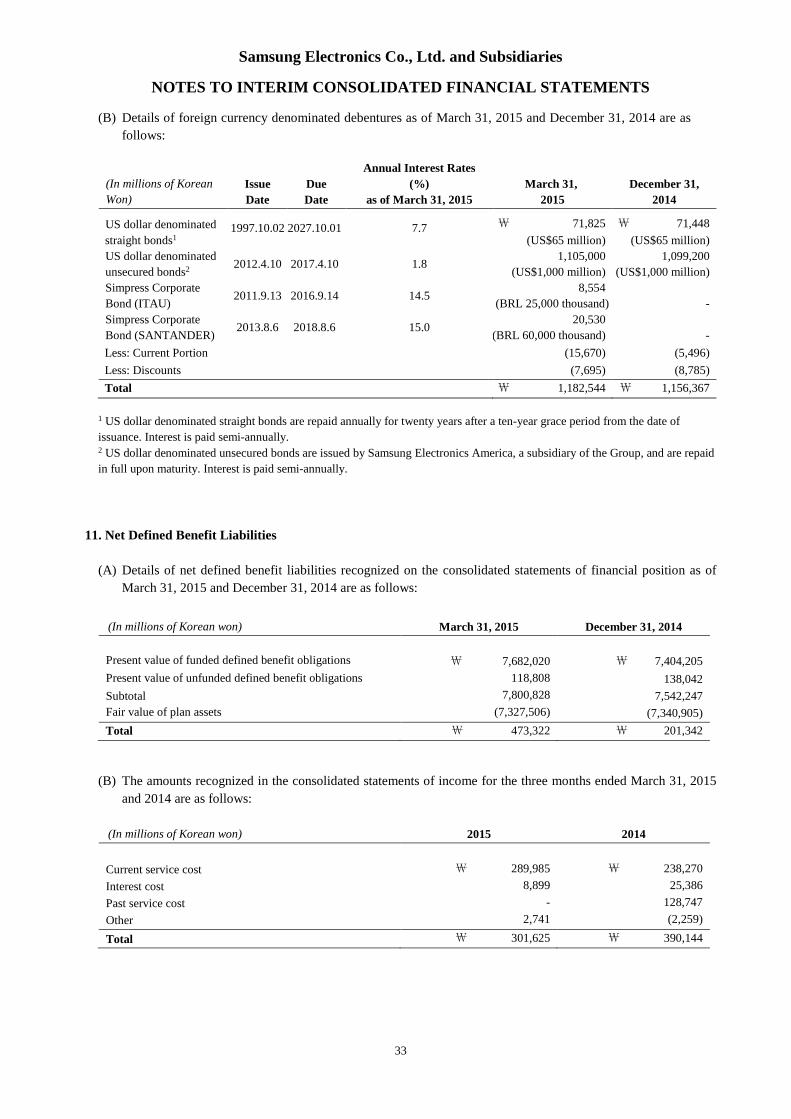
(B) Details of foreign currency denominated debentures as of March 31, 2015 and December 31, 2014 are as
follows:
(In millions of Korean
Won)
Issue
Date
Due
Date
Annual Interest Rates
(%)
as of March 31, 2015
March 31,
2015
December 31,
2014
US dollar denominated
straight bonds11997.10.02 2027.10.01 7.7 ₩ 71,825
(US$65 million)
₩ 71,448
(US$65 million)
US dollar denominated
unsecured bonds2 2012.4.10 2017.4.10 1.81,105,000
(US$1,000 million)
1,099,200
(US$1,000 million)
Simpress Corporate
Bond (ITAU)2011.9.13 2016.9.14 14.5
8,554
(BRL 25,000 thousand) -
Simpress Corporate
Bond (SANTANDER)2013.8.6 2018.8.6 15.0
20,530
(BRL 60,000 thousand) -
Less: Current Portion (15,670) (5,496)
Less: Discounts (7,695) (8,785)
Total ₩ 1,182,544 ₩ 1,156,367
1 US dollar denominated straight bonds are repaid annually for twenty years after a ten-year grace period from the date of
issuance. Interest is paid semi-annually.2 US dollar denominated unsecured bonds are issued by Samsung Electronics America, a subsidiary of the Group, and are repaid
in full upon maturity. Interest is paid semi-annually.
11. Net Defined Benefit Liabilities
(A) Details of net defined benefit liabilities recognized on the consolidated statements of financial position as of
March 31, 2015 and December 31, 2014 are as follows:
(In millions of Korean won) March 31, 2015 December 31, 2014
Present value of funded defined benefit obligations ₩ 7,682,020 ₩ 7,404,205
Present value of unfunded defined benefit obligations 118,808 138,042
Subtotal 7,800,828 7,542,247
Fair value of plan assets (7,327,506) (7,340,905)
Total ₩ 473,322 ₩ 201,342
(B) The amounts recognized in the consolidated statements of income for the three months ended March 31, 2015
and 2014 are as follows:
(In millions of Korean won) 2015 2014
Current service cost ₩ 289,985 ₩ 238,270
Interest cost 8,899 25,386
Past service cost - 128,747
Other 2,741 (2,259)
Total ₩ 301,625 ₩ 390,144
Samsung Electronics Co., Ltd. and Subsidiaries
NOTES TO INTERIM CONSOLIDATED FINANCIAL STATEMENTS
34
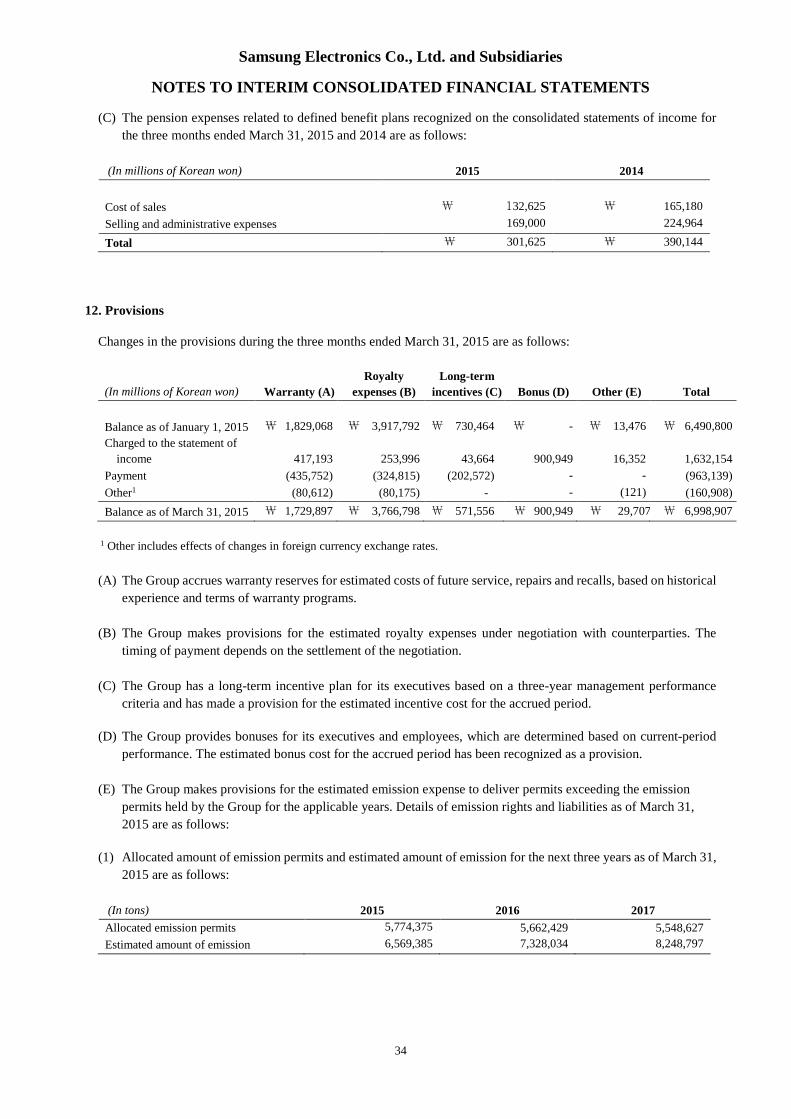
(C) The pension expenses related to defined benefit plans recognized on the consolidated statements of income for
the three months ended March 31, 2015 and 2014 are as follows:
(In millions of Korean won) 2015 2014
Cost of sales ₩ 132,625 ₩ 165,180
Selling and administrative expenses 169,000 224,964
Total ₩ 301,625 ₩ 390,144
12. Provisions
Changes in the provisions during the three months ended March 31, 2015 are as follows:
(In millions of Korean won) Warranty (A)
Royalty
expenses (B)
Long-term
incentives (C) Bonus (D) Other (E) Total
Balance as of January 1, 2015 ₩ 1,829,068 ₩ 3,917,792 ₩ 730,464 ₩ - ₩ 13,476 ₩ 6,490,800
Charged to the statement of
income 417,193 253,996 43,664 900,949 16,352 1,632,154
Payment (435,752) (324,815) (202,572) - - (963,139)
Other1 (80,612) (80,175) - - (121) (160,908)
Balance as of March 31, 2015 ₩ 1,729,897 ₩ 3,766,798 ₩ 571,556 ₩ 900,949 ₩ 29,707 ₩ 6,998,907
1 Other includes effects of changes in foreign currency exchange rates.
(A) The Group accrues warranty reserves for estimated costs of future service, repairs and recalls, based on historical
experience and terms of warranty programs.
(B) The Group makes provisions for the estimated royalty expenses under negotiation with counterparties. The
timing of payment depends on the settlement of the negotiation.
(C) The Group has a long-term incentive plan for its executives based on a three-year management performance
criteria and has made a provision for the estimated incentive cost for the accrued period.
(D) The Group provides bonuses for its executives and employees, which are determined based on current-period
performance. The estimated bonus cost for the accrued period has been recognized as a provision.
(E) The Group makes provisions for the estimated emission expense to deliver permits exceeding the emission
permits held by the Group for the applicable years. Details of emission rights and liabilities as of March 31,
2015 are as follows:
(1) Allocated amount of emission permits and estimated amount of emission for the next three years as of March 31,
2015 are as follows:
(In tons) 2015 2016 2017
Allocated emission permits 5,774,375 5,662,429 5,548,627
Estimated amount of emission 6,569,385 7,328,034 8,248,797

Samsung Electronics Co., Ltd. and Subsidiaries
NOTES TO INTERIM CONSOLIDATED FINANCIAL STATEMENTS
35
(2) Changes in the provisions for emissions as of March 31, 2015 are as follows:
(In millions of Korean won) 2015
Balance as of January 1 ₩ -
Emission costs 1,987
Balance as of March 31 ₩ 1,987
13. Commitments and Contingencies
(A) Guarantees
Details of guarantees of debt provided by the Group as of March 31, 2015 and December 31, 2014 are as follows:
(In millions of Korean won) March 31, 2015 December 31, 2014
Guarantees of debt for housing rental1 ₩ 70,247 ₩ 76,558
1 Represent the maximum amount of debt guarantee, which was provided for employees who took debt from financial
institutions in order to finance employee housing rental.
In addition to the guarantees described above, the Group provides guarantees for borrowings by Intellectual Keystone
Technology (IKT), the Group’s associate, to Citibank in the amount of₩33,150 million (USD 30 million).
As of March 31, 2015, the Group’s investments in Pusan Newport are pledged as collateral against the investee's
debt.
(B) Litigation
(1) The litigation with Apple Inc. (“Apple”) is ongoing in the United States as of the reporting date. Regarding the
ongoing lawsuit in the United States, on August 24, 2012, the jury determined that the Group partially infringed
Apple’s design and utility patent and should pay damages to Apple. On March 1, 2013, however, the Judge
ordered a new trial for a certain portion of the damages, ruling that it was originally miscalculated. On March 6,
2014, the Judge denied Apple’s bid for a permanent injunction against the Group and made a final judgment
restating the total damages amount determined by a jury verdict on November 21, 2013. The Group appealed the
decision on the damages amount on March 7, 2014, and a hearing on the appeal was held on December 4, 2014.
Additionally, on May 5, 2014, the jury in another ongoing lawsuit determined that the Group partially infringed
Apple’s utility patent and should pay damages to Apple. On November 25, 2014, the first trial judgment was
pronounced to confirm the jury’s verdict. The Group appealed the decision on the damages and the appeal is
currently on-going. The final conclusion and the effect of the patent lawsuits with Apple are uncertain as of the
reporting date.
In August 2014, the Group and Apple reached an agreement to withdraw from ongoing litigation in all regions
other than the United States, and the Group has withdrawn all non-United States based lawsuits.
(2) Including civil claims from some overseas buyers for price-fixing related to the sale of TFT-LCD raised before
the split, the Group is involved in claims, disputes, and investigations conducted by regulatory bodies at the
reporting date. Although the outflow of resources and timing of these matters are uncertain, the Group believes
the outcome will not have a material impact on the financial condition of the Group.
(3) In addition, during the normal course of business with numerous companies, the Group has been involved in
various claims, disputes, and investigations conducted by regulatory bodies. Although the outflow of resources
Samsung Electronics Co., Ltd. and Subsidiaries
NOTES TO INTERIM CONSOLIDATED FINANCIAL STATEMENTS
36
and timing of these matters are uncertain, the Group believes the outcome will not have a material impact on the
financial condition of the Group.
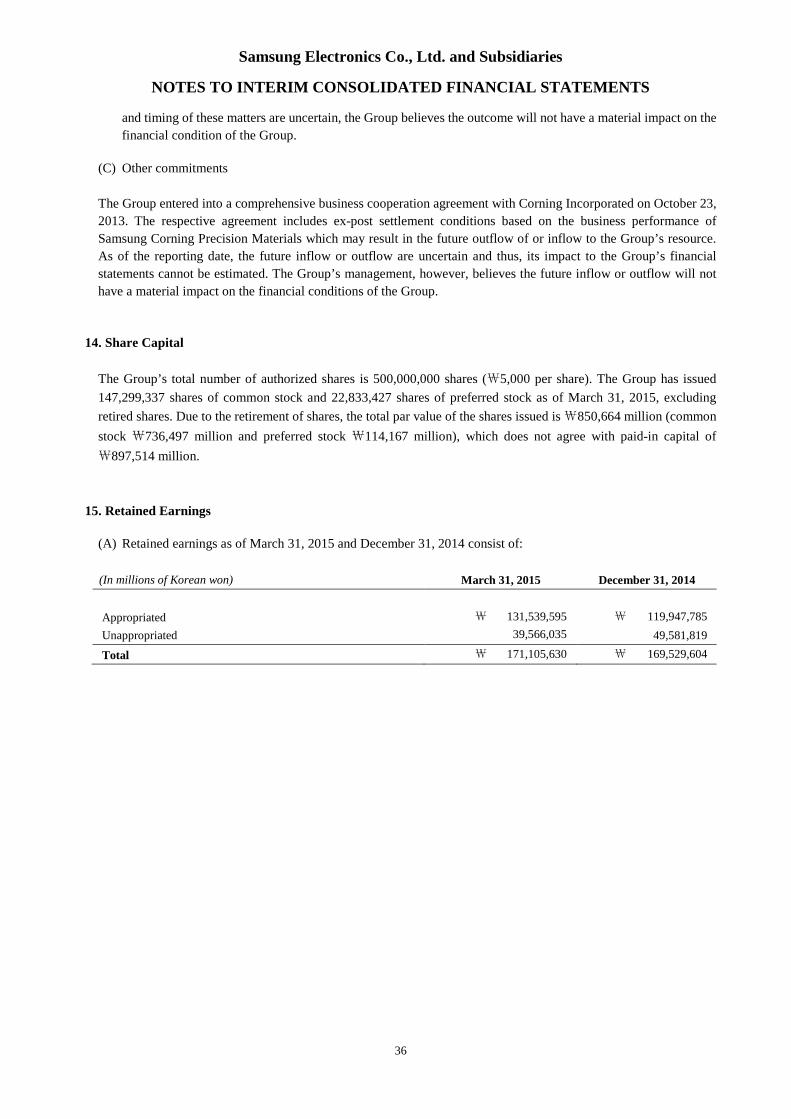
(C) Other commitments
The Group entered into a comprehensive business cooperation agreement with Corning Incorporated on October 23,
2013. The respective agreement includes ex-post settlement conditions based on the business performance of
Samsung Corning Precision Materials which may result in the future outflow of or inflow to the Group’s resource.
As of the reporting date, the future inflow or outflow are uncertain and thus, its impact to the Group’s financial
statements cannot be estimated. The Group’s management, however, believes the future inflow or outflow will not
have a material impact on the financial conditions of the Group.
14. Share Capital
The Group’s total number of authorized shares is 500,000,000 shares (₩5,000 per share). The Group has issued
147,299,337 shares of common stock and 22,833,427 shares of preferred stock as of March 31, 2015, excluding
retired shares. Due to the retirement of shares, the total par value of the shares issued is₩850,664 million (common
stock ₩736,497 million and preferred stock ₩114,167 million), which does not agree with paid-in capital of
₩897,514 million.
15. Retained Earnings
(A) Retained earnings as of March 31, 2015 and December 31, 2014 consist of:
(In millions of Korean won) March 31, 2015 December 31, 2014
Appropriated ₩ 131,539,595 ₩ 119,947,785
Unappropriated 39,566,035 49,581,819
Total ₩ 171,105,630 ₩ 169,529,604

Samsung Electronics Co., Ltd. and Subsidiaries
NOTES TO INTERIM CONSOLIDATED FINANCIAL STATEMENTS
37
16. Other Components of Equity
Other components of equity as of March 31, 2015 and December 31, 2014 consist of:
(In millions of Korean won) March 31, 2015 December 31, 2014
Treasury stock ₩ (9,752,372) ₩ (8,429,313)
Stock options 806 806
Unrealized gains on available-for-sale financial assets 2,108,056 1,850,195
Share of other comprehensive income of associates and joint ventures 515,273 559,280
Foreign currency translation (5,588,891) (4,566,887)
Remeasurement of net defined benefit liabilities (2,021,623) (1,996,792)
Other (151,205) (146,676)
Total ₩ (14,889,956) ₩ (12,729,387)
The Group repurchases registered common stock and non-voting preferred stock and recognizes the repurchase
amount in other components of equity. Such stock will be distributed upon exercise of stock options. Treasury stock
as of March 31, 2015 and December 31, 2014 consists of the following:
March 31, 2015 December 31, 2014
(In millions of Korean won and
number of shares) Preferred Stock Common Stock Preferred Stock Common Stock
Number of shares 3,229,693 shares 17,986,686 shares 3,110,943 shares 17,094,741 shares
Acquisition cost ₩ 878,817 ₩ 8,873,555 ₩ 755,764 ₩ 7,673,549
17. Expenses by Nature
Expenses by nature for the three months ended March 31, 2015 and 2014 consist of the following:
(In millions of Korean won) 2015 2014
Changes in finished goods and work in process ₩ (1,137,968) ₩ 354,019
Raw materials and goods 19,180,417 21,402,457
Wages and salaries 4,714,744 4,485,185
Pension 313,024 402,604
Depreciation 4,563,385 4,004,084
Amortization 305,944 252,337
Welfare 860,080 821,212
Commission and service charges 1,944,909 2,550,416
Other 10,394,016 10,914,213
Total1 ₩ 41,138,551 ₩ 45,186,527
1 Expenses above are equal to the sum of cost of sales and selling and administrative expenses on the interim consolidated
statements of income.

Samsung Electronics Co., Ltd. and Subsidiaries
NOTES TO INTERIM CONSOLIDATED FINANCIAL STATEMENTS
38
18. Selling and Administrative Expenses
Selling and administrative expenses for the three months ended March 31, 2015 and 2014 are as follows:
(In millions of Korean won) 2015 2014
1) Selling and administrative expenses
Wages and salaries ₩ 1,369,401 ₩ 1,338,623
Pension 68,701 87,310
Commission and service charges 1,944,909 2,550,416
Depreciation 172,334 164,075
Amortization 77,517 98,681
Advertising 653,799 677,862
Sales promotion 1,528,100 1,587,983
Transportation 798,985 839,661
Warranty 705,881 861,689
Other 1,372,296 1,239,868
2) Research and development expenses
Total expenses 3,795,718 3,877,538
Capitalized expenses (304,477) (186,694)
Total ₩ 12,183,164 ₩ 13,137,012
19. Other Non-Operating Income and Expense
Details of other non-operating income and expense for the three months ended March 31, 2015 and 2014 are as
follows:
(In millions of Korean won) 2015 2014
Non-operating income
Dividend income ₩ 61,066 ₩ 1,307,086Rental income 22,411 24,857
Gain on disposal of investments 33,786 74,095
Gain on disposal of property, plant and equipment 33,705 43,367
Other 215,164 462,191
Total ₩ 366,132 ₩ 1,911,596
(In millions of Korean won) 2015 2014
Non-operating expense
Loss on disposal of property, plant and equipment ₩ 33,074 ₩ 53,309
Donations 120,312 50,251
Loss on disposal of assets classified as held for sale - 723,869
Other 162,833 122,542
Total ₩ 316,219 ₩ 949,971

Samsung Electronics Co., Ltd. and Subsidiaries
NOTES TO INTERIM CONSOLIDATED FINANCIAL STATEMENTS
39
20. Finance Income and Expense
(A) Details of finance income and expense for the three months ended March 31, 2015 and 2014 are as follows:
(In millions of Korean won) 2015 2014
Finance income
Interest income: ₩ 442,274 ₩ 417,663
Interest income from loans and receivables 414,984 408,716
Interest income from available-for-sale
financial assets 27,290 8,947
Foreign exchange differences1 1,644,493 876,521
Gain on valuation of derivatives 312,885 156,107
Total ₩ 2,339,652 ₩ 1,450,291
(In millions of Korean won) 2015 2014
Finance expense
Interest expense: ₩ 166,918 ₩ 142,555
Interest expense from financial liabilities
measured at amortized cost 98,691 99,404
Other financial liabilities 68,227 43,151
Foreign exchange differences1 1,813,563 981,220
Loss on valuation of derivatives 285,016 158,106
Total ₩ 2,265,497 ₩ 1,281,881
1 The Group recognizes foreign exchange gains and losses arising from foreign currency transactions and translation as finance
income and expense.
21. Income Tax Expense
Income tax expense is recognized based on management’s best estimate of the average annual income tax rate
expected for the full financial year. The average annual tax rate expected as of March 31, 2015 to be effective for
the year ended December 31, 2015 is 25.6% (March 31, 2014: 21.5%).
Samsung Electronics Co., Ltd. and Subsidiaries
NOTES TO INTERIM CONSOLIDATED FINANCIAL STATEMENTS
40
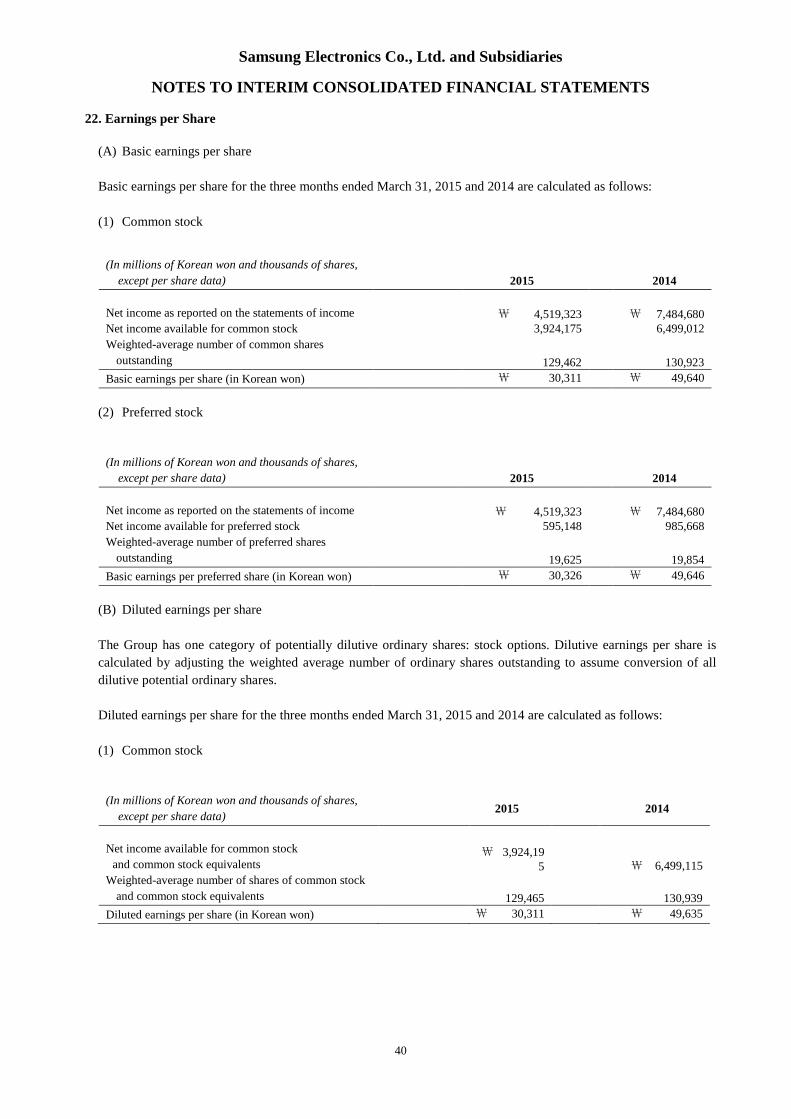
22. Earnings per Share
(A) Basic earnings per share
Basic earnings per share for the three months ended March 31, 2015 and 2014 are calculated as follows:
(1) Common stock
(In millions of Korean won and thousands of shares,
except per share data) 2015 2014
Net income as reported on the statements of income ₩ 4,519,323 ₩ 7,484,680Net income available for common stock 3,924,175 6,499,012
Weighted-average number of common shares
outstanding 129,462 130,923
Basic earnings per share (in Korean won) ₩ 30,311 ₩ 49,640
(2) Preferred stock
(In millions of Korean won and thousands of shares,
except per share data) 2015 2014
Net income as reported on the statements of income ₩ 4,519,323 ₩ 7,484,680Net income available for preferred stock 595,148 985,668
Weighted-average number of preferred shares
outstanding 19,625 19,854
Basic earnings per preferred share (in Korean won) ₩ 30,326 ₩ 49,646
(B) Diluted earnings per share
The Group has one category of potentially dilutive ordinary shares: stock options. Dilutive earnings per share is
calculated by adjusting the weighted average number of ordinary shares outstanding to assume conversion of all
dilutive potential ordinary shares.
Diluted earnings per share for the three months ended March 31, 2015 and 2014 are calculated as follows:
(1) Common stock
(In millions of Korean won and thousands of shares,
except per share data)2015 2014
Net income available for common stock
and common stock equivalents₩ 3,924,19
5 ₩ 6,499,115Weighted-average number of shares of common stock
and common stock equivalents 129,465 130,939
Diluted earnings per share (in Korean won) ₩ 30,311 ₩ 49,635

Samsung Electronics Co., Ltd. and Subsidiaries
NOTES TO INTERIM CONSOLIDATED FINANCIAL STATEMENTS
41
(2) Preferred stock
(In millions of Korean won and thousands of shares,
except per share data)2015 2014
Net income available for preferred stock
and preferred stock equivalents₩ 595,12
8 ₩ 985,565Weighted-average number of shares of preferred stock
and preferred stock equivalents 19,625 19,854
Diluted earnings per preferred share (in Korean won) ₩ 30,325 ₩ 49,961
23. Cash Flows Generated from Operating Activities
Adjustments and changes in assets and liabilities arising from operating activities for the three months ended March
31, 2015 and 2014 are as follows:
- Adjustments
(In millions of Korean won) 2015 2014
Adjustments for:
Income tax expense ₩ 1,592,828 ₩ 2,074,529
Finance income (1,373,566) (1,053,766)
Finance costs 974,622 624,053
Pension 313,024 402,604
Depreciation 4,563,385 4,004,084
Amortization 305,944 252,337
Bad debt expense 72,064 128,305
Gain on valuation of equity method (55,208) (30,136)
Gain on disposal of property, plant and equipment (33,705) (43,367)
Loss on disposal of property, plant and equipment 33,074 53,309
Obsolescence and scrapping of inventories 153,840 116,600
Loss on disposal of assets classified as held-for-sale - 723,869
Dividend income (61,066) (1,307,086)
Other (162,990) (328,120)
Adjustments, total ₩ 6,322,246 ₩ 5,617,215
Samsung Electronics Co., Ltd. and Subsidiaries
NOTES TO INTERIM CONSOLIDATED FINANCIAL STATEMENTS
42
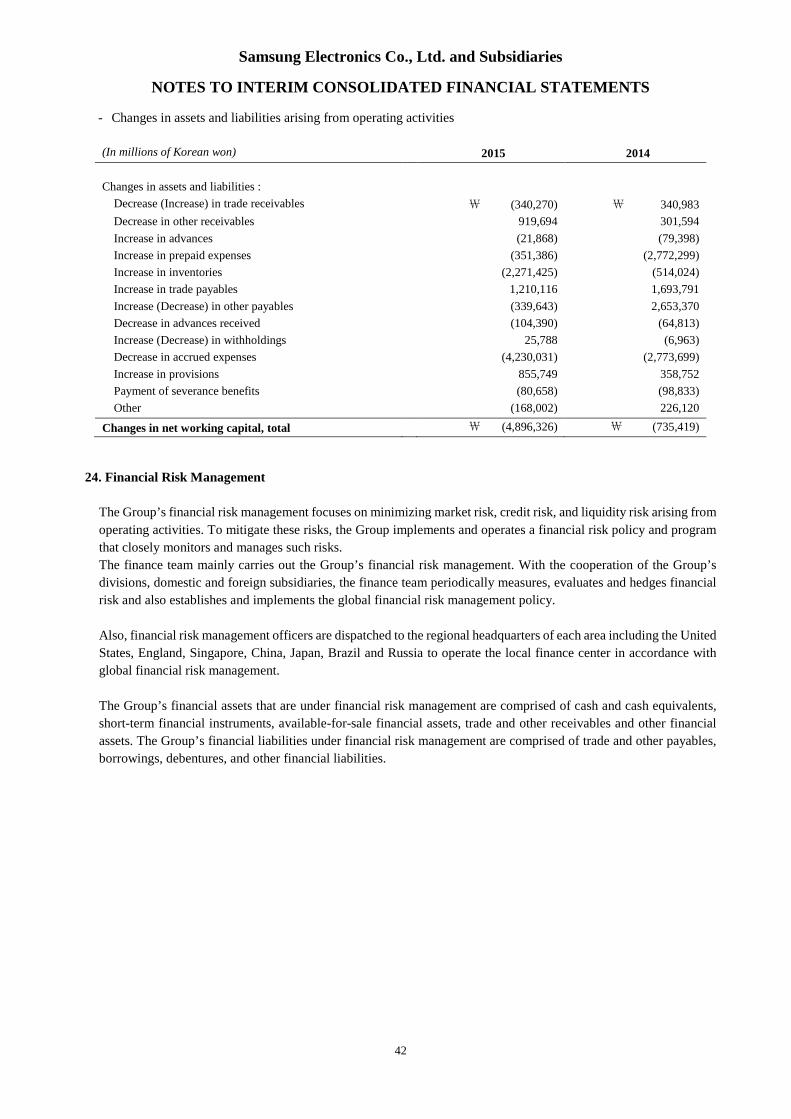
- Changes in assets and liabilities arising from operating activities
(In millions of Korean won) 2015 2014
Changes in assets and liabilities :
Decrease (Increase) in trade receivables ₩ (340,270) ₩ 340,983
Decrease in other receivables 919,694 301,594
Increase in advances (21,868) (79,398)
Increase in prepaid expenses (351,386) (2,772,299)
Increase in inventories (2,271,425) (514,024)
Increase in trade payables 1,210,116 1,693,791
Increase (Decrease) in other payables (339,643) 2,653,370
Decrease in advances received (104,390) (64,813)
Increase (Decrease) in withholdings 25,788 (6,963)
Decrease in accrued expenses (4,230,031) (2,773,699)
Increase in provisions 855,749 358,752
Payment of severance benefits (80,658) (98,833)
Other (168,002) 226,120
Changes in net working capital, total ₩ (4,896,326) ₩ (735,419)
24. Financial Risk Management
The Group’s financial risk management focuses on minimizing market risk, credit risk, and liquidity risk arising from
operating activities. To mitigate these risks, the Group implements and operates a financial risk policy and program
that closely monitors and manages such risks.
The finance team mainly carries out the Group’s financial risk management. With the cooperation of the Group’s
divisions, domestic and foreign subsidiaries, the finance team periodically measures, evaluates and hedges financial
risk and also establishes and implements the global financial risk management policy.
Also, financial risk management officers are dispatched to the regional headquarters of each area including the United
States, England, Singapore, China, Japan, Brazil and Russia to operate the local finance center in accordance with
global financial risk management.
The Group’s financial assets that are under financial risk management are comprised of cash and cash equivalents,
short-term financial instruments, available-for-sale financial assets, trade and other receivables and other financial
assets. The Group’s financial liabilities under financial risk management are comprised of trade and other payables,
borrowings, debentures, and other financial liabilities.
Samsung Electronics Co., Ltd. and Subsidiaries
NOTES TO INTERIM CONSOLIDATED FINANCIAL STATEMENTS
43
(A) Market risk
(1) Foreign exchange risk
The Group is exposed to foreign exchange risk arising from various currency exposures, primarily with respect to the
United States, European Union, South America, Japan and other Asian countries. Revenues and expenses arise from
foreign currency transactions and exchange positions, and the most widely used currencies are the US Dollar, EU’s
EURO, Japanese Yen and Chinese Yuan.
Foreign exchange risk management of the Group is carried out by both SEC and its subsidiaries. To minimize foreign
exchange risk arising from operating activities, the Group’s foreign exchange management policy requires normal
business transactions to be in local currency or for the cash-in currency to be matched up with the cash-out currency.
The Group’s foreign exchange risk management policy also defines foreign exchange risk, measuring period,
controlling responsibilities, management procedures, hedging period and hedge ratio.
The Group limits all speculative foreign exchange transactions and operates a system to manage receivables and
payables denominated in foreign currency. It evaluates, manages and reports foreign currency exposures to
receivables and payables.
(2) Price risk
The Group’s investment portfolio consists of direct and indirect investments in equity securities classified as
available-for-sale, which is in line with the Group’s strategy.
As of March 31, 2015 and December 31, 2014, a price fluctuation in relation to marketable equity securities by 1%
would result in changes in other comprehensive income (before income tax) of ₩58,183 million and ₩57,768
million, respectively.
(3) Interest rate risk
Risk of changes in interest rates for floating interest rate financial instruments is defined as the risk that the fair value
of components of the statement of financial position, and future cash flows of interest income (expenses) of a financial
instrument, will fluctuate because of changes in market interest rates. The Group is exposed to interest rate risk
mainly through interest bearing liabilities and assets. The Group’s position with regard to interest rate risk exposure
is mainly driven by its floating interest rate debt obligations and interest-bearing deposits. The Group implemented
policies and operates to minimize uncertainty arising from changes in interest rates and finance costs.
In order to avoid interest rate risk, the Group maintains minimum external borrowings by facilitating cash pooling
systems on a regional and global basis. The Group manages exposed interest rate risk via periodic monitoring and
handles risk factors on a timely basis.
Samsung Electronics Co., Ltd. and Subsidiaries
NOTES TO INTERIM CONSOLIDATED FINANCIAL STATEMENTS
44
(B) Credit risk
Credit risk arises during the normal course of transactions and investing activities where clients or other parties fail
to discharge an obligation. The Group monitors and sets the client’s and counterparty’s credit limit on a periodic
basis based on the client’s and counterparty’s financial conditions, default history and other important factors.
Credit risk can arise from transactions with financial institutions which include financial instrument transactions such
as cash and cash equivalents, savings, and derivative instruments. To minimize such risk, the Group transacts only
with banks which have strong international credit rating (S&P A and above), and all new transactions with financial
institutions with no prior transaction history are approved, managed and monitored by the Group’s finance team and
the local finance center. The Group requires separate approval for contracts with restrictions.
Most of the Group’s trade receivables are adequately insured to manage any risk, therefore, the Group estimates its
credit risk exposure to be limited. The Group estimates that its maximum exposure to credit risk is the carrying value
of its financial assets, net of impairment losses.
(C) Liquidity risk
Due to large investments made by the Group, maintaining adequate levels of liquidity risk is critical. The Group
strives to achieve this goal by periodically forecasting its capital balance, estimating required cash levels, and
managing income and expenses.
The Group manages its liquidity risk by periodically forecasting projected cash flows. If abnormal signs are identified,
the Group works with the local finance center and provides liquidity support by utilizing a globally integrated finance
structure, such as Cash Pooling. In addition, the Group maintains a liquidity management process which provides
additional financial support by the local finance center and the Group. The Cash Pooling program allows sharing of
surplus funds among entities and contributes to minimizing liquidity risk and strengthening the Group’s competitive
position by reducing capital operation expenses and financial expenses.
In addition, the Group mitigates liquidity risk by contracting with financial institutions with respect to bank overdraftsand foreign trade finance, and by providing payment guarantees to subsidiaries. For large scale facility investments,liquidity risk is minimized by utilizing internal reserves and long term borrowings according to the capital injectionschedule.
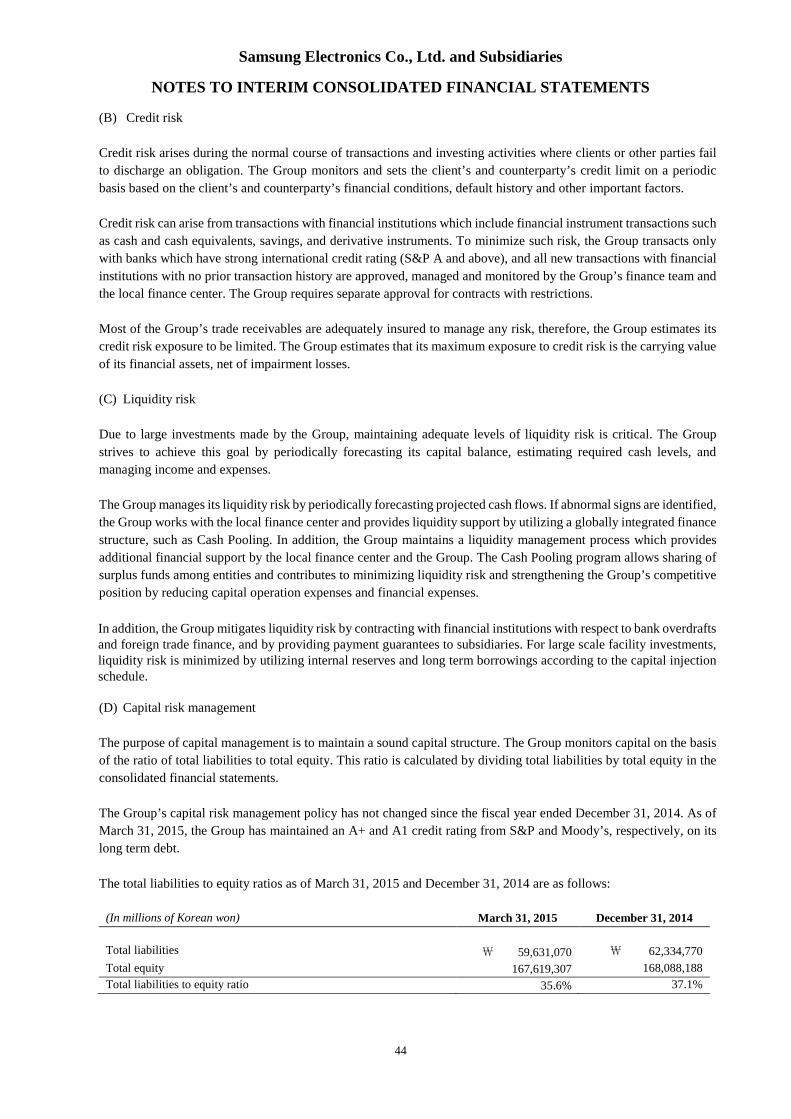
(D) Capital risk management
The purpose of capital management is to maintain a sound capital structure. The Group monitors capital on the basis
of the ratio of total liabilities to total equity. This ratio is calculated by dividing total liabilities by total equity in the
consolidated financial statements.
The Group’s capital risk management policy has not changed since the fiscal year ended December 31, 2014. As of
March 31, 2015, the Group has maintained an A+ and A1 credit rating from S&P and Moody’s, respectively, on its
long term debt.
The total liabilities to equity ratios as of March 31, 2015 and December 31, 2014 are as follows:
(In millions of Korean won) March 31, 2015 December 31, 2014
Total liabilities ₩ 59,631,070 ₩ 62,334,770
Total equity 167,619,307 168,088,188
Total liabilities to equity ratio 35.6% 37.1%
Samsung Electronics Co., Ltd. and Subsidiaries
NOTES TO INTERIM CONSOLIDATED FINANCIAL STATEMENTS
45
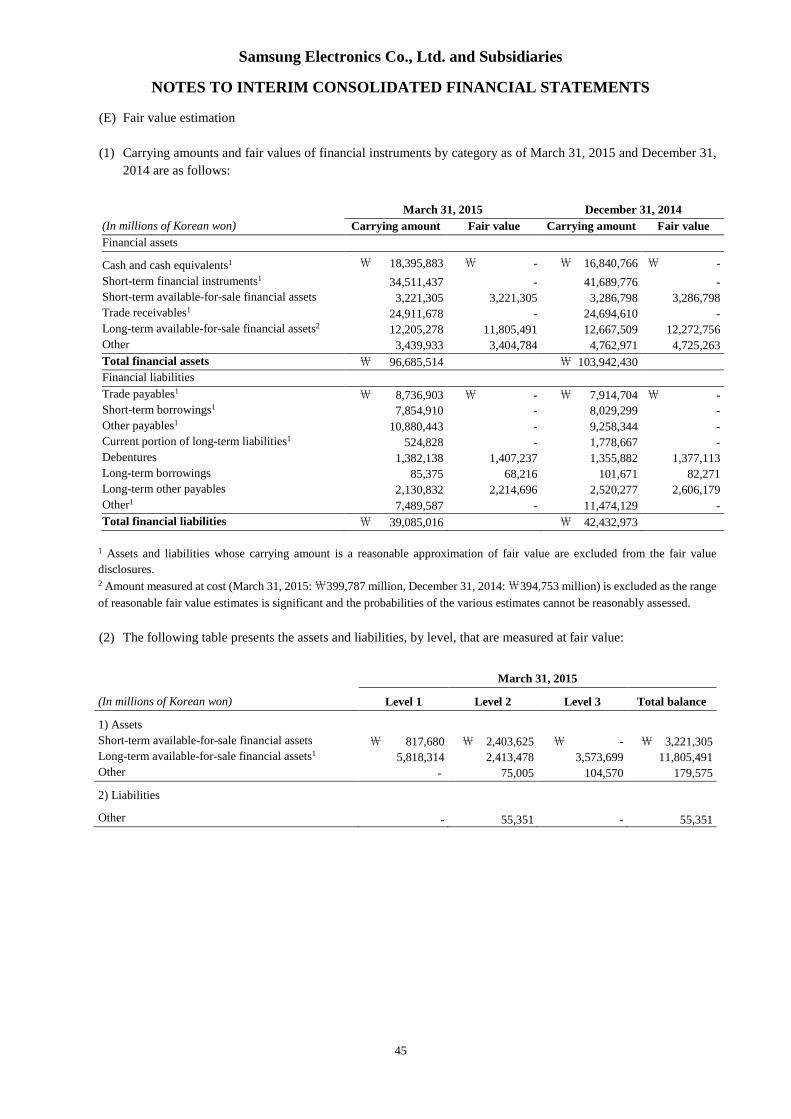
(E) Fair value estimation
(1) Carrying amounts and fair values of financial instruments by category as of March 31, 2015 and December 31,
2014 are as follows:
March 31, 2015 December 31, 2014
(In millions of Korean won) Carrying amount Fair value Carrying amount Fair value
Financial assets
Cash and cash equivalents1 ₩ 18,395,883 ₩ - ₩ 16,840,766 ₩ -
Short-term financial instruments1 34,511,437 - 41,689,776 -Short-term available-for-sale financial assets 3,221,305 3,221,305 3,286,798 3,286,798Trade receivables1 24,911,678 - 24,694,610 -Long-term available-for-sale financial assets2 12,205,278 11,805,491 12,667,509 12,272,756Other 3,439,933 3,404,784 4,762,971 4,725,263
Total financial assets ₩ 96,685,514 ₩ 103,942,430
Financial liabilities
Trade payables1 ₩ 8,736,903 ₩ - ₩ 7,914,704 ₩ -Short-term borrowings1 7,854,910 - 8,029,299 -Other payables1 10,880,443 - 9,258,344 -Current portion of long-term liabilities1 524,828 - 1,778,667 -Debentures 1,382,138 1,407,237 1,355,882 1,377,113Long-term borrowings 85,375 68,216 101,671 82,271Long-term other payables 2,130,832 2,214,696 2,520,277 2,606,179Other1 7,489,587 - 11,474,129 -
Total financial liabilities ₩ 39,085,016 ₩ 42,432,973
1 Assets and liabilities whose carrying amount is a reasonable approximation of fair value are excluded from the fair value
disclosures.2 Amount measured at cost (March 31, 2015:₩399,787 million, December 31, 2014:₩394,753 million) is excluded as the range
of reasonable fair value estimates is significant and the probabilities of the various estimates cannot be reasonably assessed.
(2) The following table presents the assets and liabilities, by level, that are measured at fair value:
March 31, 2015
(In millions of Korean won) Level 1 Level 2 Level 3 Total balance
1) Assets
Short-term available-for-sale financial assets ₩ 817,680 ₩ 2,403,625 ₩ - ₩ 3,221,305Long-term available-for-sale financial assets1 5,818,314 2,413,478 3,573,699 11,805,491Other - 75,005 104,570 179,575
2) Liabilities
Other - 55,351 - 55,351

Samsung Electronics Co., Ltd. and Subsidiaries
NOTES TO INTERIM CONSOLIDATED FINANCIAL STATEMENTS
46
December 31, 2014
(In millions of Korean won) Level 1 Level 2 Level 3 Total balance
1) Assets
Short-term available-for-sale financial assets ₩ 1,016,878 ₩ 2,269,920 ₩ - ₩ 3,286,798Long-term available-for-sale financial assets1 5,776,836 3,050,338 3,445,582 12,272,756
Other - 45,898 102,513 148,411
2) Liabilities
Other - 78,348 - 78,348
1 Amount measured at cost (March 31, 2015:₩399,787 million, December 31, 2014:₩394,753 million) is excluded as the range
of reasonable fair value estimates is significant and the probabilities of the various estimates cannot be reasonably assessed.
The levels of the fair value hierarchy and its application to financial assets and liabilities are described below.
ㆍ Level 1: Quoted prices (unadjusted) in active markets for identical assets or liabilities
ㆍ Level 2: Inputs other than quoted prices included within Level 1 that are observable for the asset or liability,
either directly or indirectly
ㆍ Level 3: Inputs for the asset or liability that are not based on observable market data (that is, unobservable inputs)
The fair value of financial instruments traded in active markets is based on quoted market prices at the statement of
financial position date. A market is regarded as active if quoted prices are readily and regularly available from an
exchange, dealer, broker, industry group, pricing service, or regulatory agency, and those prices represent actual and
regularly occurring market transactions on an arm’s length basis. The quoted market price used for financial assets
held by the Group is the current bid price. These instruments are included in Level 1. Instruments included in Level
1 are listed equity investments classified as trading securities or available-for-sale financial assets.
The fair value of financial instruments that are not traded in an active market (for example, over-the-counter
derivatives) is determined by using valuation techniques. These valuation techniques maximize the use of observable
market data where it is available and rely as little as possible on entity specific estimates. If all significant inputs
required to fair value an instrument are observable, the instrument is included in Level 2.
If one or more of the significant inputs are not based on observable market data, the instrument is included in Level
3.
The Group performs the fair value measurements required for financial reporting purposes, including Level 3 fair
values and discusses valuation processes and results at least once every quarter in line with the Group’s quarterly
reporting dates. The Group’s policy is to recognize transfers between levels at the end of the reporting period, if
corresponding events or changes in circumstances have occurred.
Specific valuation techniques used to value financial instruments include:
ㆍ Quoted market prices or dealer quotes for similar instruments
ㆍ The fair value of forward foreign exchange contracts is determined using forward exchange rates at the statement
of financial position date, with the resulting value discounted back to present value
Other techniques, such as discounted cash flow analysis, are used to determine fair value for the remaining financial
instruments. For trade and other receivables, the book value approximates a reasonable estimate of fair value.
(3) Valuation technique and the inputs
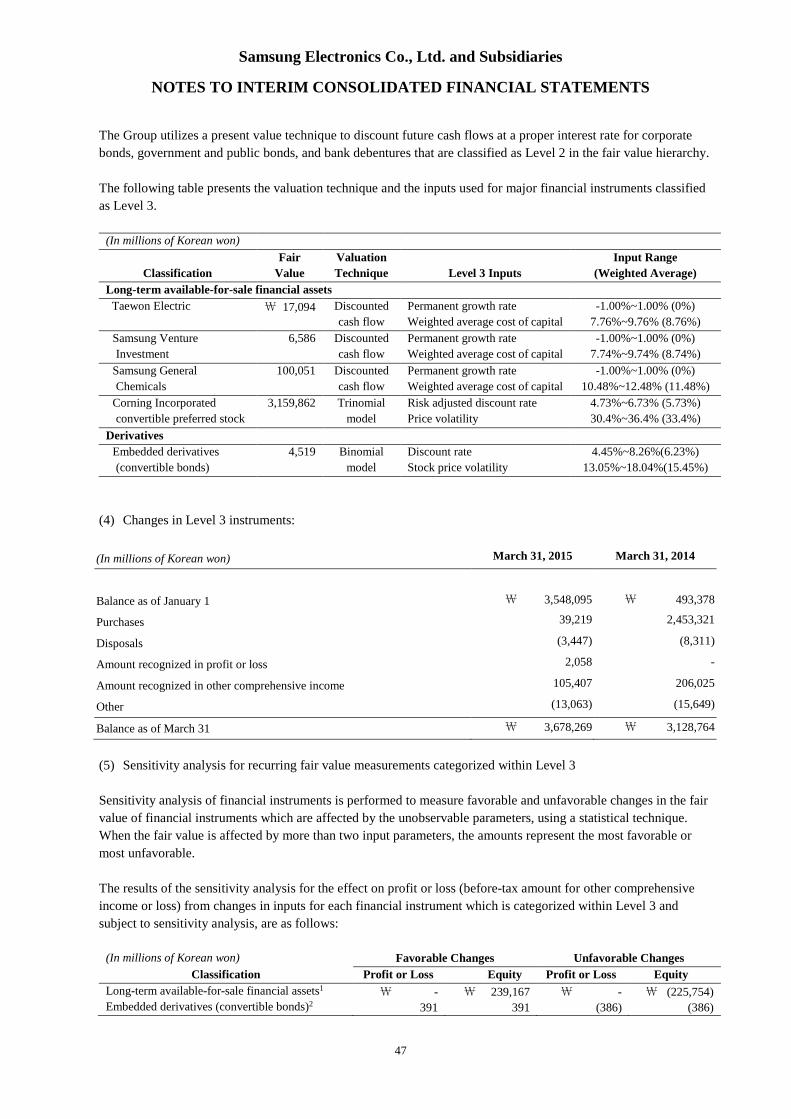
Samsung Electronics Co., Ltd. and Subsidiaries
NOTES TO INTERIM CONSOLIDATED FINANCIAL STATEMENTS
47
The Group utilizes a present value technique to discount future cash flows at a proper interest rate for corporate
bonds, government and public bonds, and bank debentures that are classified as Level 2 in the fair value hierarchy.
The following table presents the valuation technique and the inputs used for major financial instruments classified
as Level 3.
(In millions of Korean won)
Classification
Fair
Value
Valuation
Technique Level 3 Inputs
Input Range
(Weighted Average)
Long-term available-for-sale financial assets
Taewon Electric \ 17,094 Discounted
cash flow
Permanent growth rate -1.00%~1.00% (0%)
Weighted average cost of capital 7.76%~9.76% (8.76%)
Samsung Venture
Investment
6,586 Discounted
cash flow
Permanent growth rate -1.00%~1.00% (0%)
Weighted average cost of capital 7.74%~9.74% (8.74%)
Samsung General
Chemicals
100,051 Discounted
cash flow
Permanent growth rate -1.00%~1.00% (0%)
Weighted average cost of capital 10.48%~12.48% (11.48%)
Corning Incorporated
convertible preferred stock
3,159,862 Trinomial
model
Risk adjusted discount rate
Price volatility
4.73%~6.73% (5.73%)
30.4%~36.4% (33.4%)
Derivatives
Embedded derivatives
(convertible bonds)
4,519 Binomial
model
Discount rate 4.45%~8.26%(6.23%)
Stock price volatility 13.05%~18.04%(15.45%)
(4) Changes in Level 3 instruments:
(In millions of Korean won) March 31, 2015 March 31, 2014
Balance as of January 1 \ 3,548,095 \ 493,378
Purchases 39,219 2,453,321
Disposals (3,447) (8,311)
Amount recognized in profit or loss 2,058 -
Amount recognized in other comprehensive income 105,407 206,025
Other (13,063) (15,649)
Balance as of March 31 \ 3,678,269 \ 3,128,764
(5) Sensitivity analysis for recurring fair value measurements categorized within Level 3
Sensitivity analysis of financial instruments is performed to measure favorable and unfavorable changes in the fair
value of financial instruments which are affected by the unobservable parameters, using a statistical technique.
When the fair value is affected by more than two input parameters, the amounts represent the most favorable or
most unfavorable.
The results of the sensitivity analysis for the effect on profit or loss (before-tax amount for other comprehensive
income or loss) from changes in inputs for each financial instrument which is categorized within Level 3 and
subject to sensitivity analysis, are as follows:
(In millions of Korean won) Favorable Changes Unfavorable Changes
Classification Profit or Loss Equity Profit or Loss Equity
Long-term available-for-sale financial assets1 \ - \ 239,167 \ - \ (225,754)Embedded derivatives (convertible bonds)2 391 391 (386) (386)
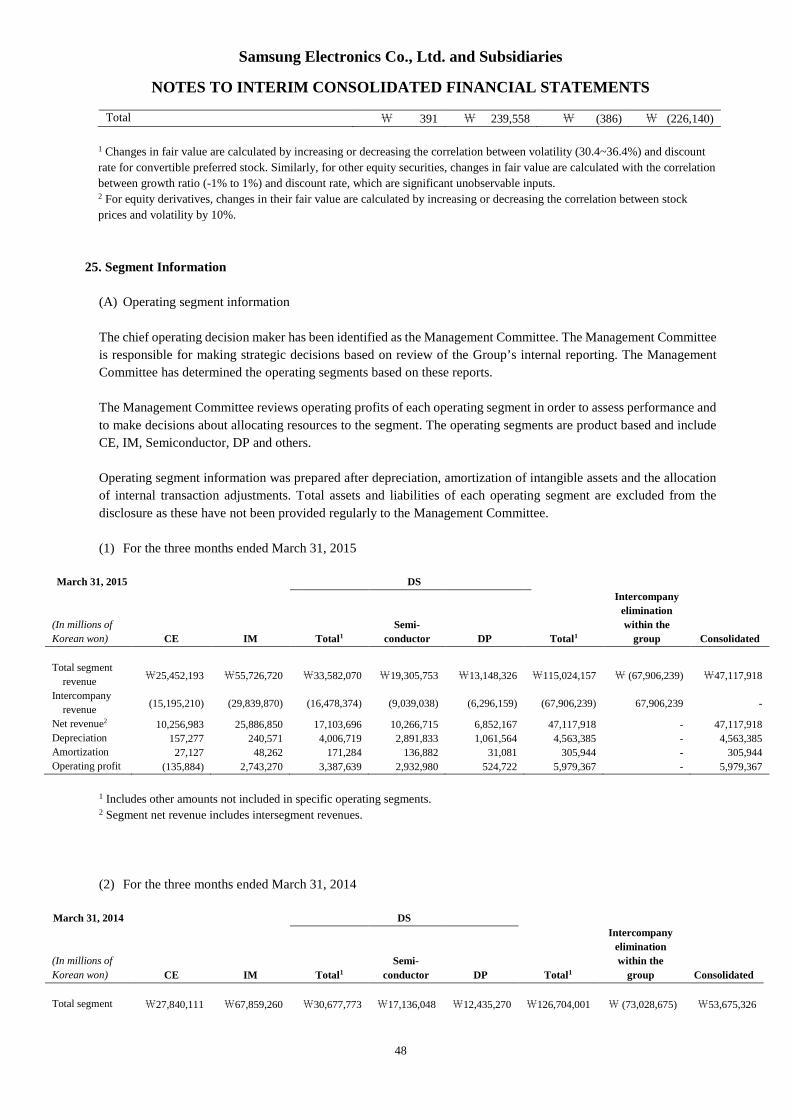
Samsung Electronics Co., Ltd. and Subsidiaries
NOTES TO INTERIM CONSOLIDATED FINANCIAL STATEMENTS
48
Total \ 391 \ 239,558 \ (386) \ (226,140)
1 Changes in fair value are calculated by increasing or decreasing the correlation between volatility (30.4~36.4%) and discount
rate for convertible preferred stock. Similarly, for other equity securities, changes in fair value are calculated with the correlation
between growth ratio (-1% to 1%) and discount rate, which are significant unobservable inputs.2 For equity derivatives, changes in their fair value are calculated by increasing or decreasing the correlation between stock
prices and volatility by 10%.
25. Segment Information
(A) Operating segment information
The chief operating decision maker has been identified as the Management Committee. The Management Committee
is responsible for making strategic decisions based on review of the Group’s internal reporting. The Management
Committee has determined the operating segments based on these reports.
The Management Committee reviews operating profits of each operating segment in order to assess performance and
to make decisions about allocating resources to the segment. The operating segments are product based and include
CE, IM, Semiconductor, DP and others.
Operating segment information was prepared after depreciation, amortization of intangible assets and the allocation
of internal transaction adjustments. Total assets and liabilities of each operating segment are excluded from the
disclosure as these have not been provided regularly to the Management Committee.
(1) For the three months ended March 31, 2015
March 31, 2015 DS
(In millions of
Korean won) CE IM Total1
Semi-
conductor DP Total1
Intercompany
elimination
within the
group Consolidated
Total segment
revenue\25,452,193 \55,726,720 \33,582,070 \19,305,753 \13,148,326 \115,024,157 \ (67,906,239) \47,117,918
Intercompany
revenue(15,195,210) (29,839,870) (16,478,374) (9,039,038) (6,296,159) (67,906,239) 67,906,239 -
Net revenue2 10,256,983 25,886,850 17,103,696 10,266,715 6,852,167 47,117,918 - 47,117,918
Depreciation 157,277 240,571 4,006,719 2,891,833 1,061,564 4,563,385 - 4,563,385
Amortization 27,127 48,262 171,284 136,882 31,081 305,944 - 305,944
Operating profit (135,884) 2,743,270 3,387,639 2,932,980 524,722 5,979,367 - 5,979,367
1 Includes other amounts not included in specific operating segments.2 Segment net revenue includes intersegment revenues.
(2) For the three months ended March 31, 2014
March 31, 2014 DS
(In millions of
Korean won) CE IM Total1
Semi-
conductor DP Total1
Intercompany
elimination
within the
group Consolidated
Total segment \27,840,111 \67,859,260 \30,677,773 \17,136,048 \12,435,270 \126,704,001 \ (73,028,675) \53,675,326
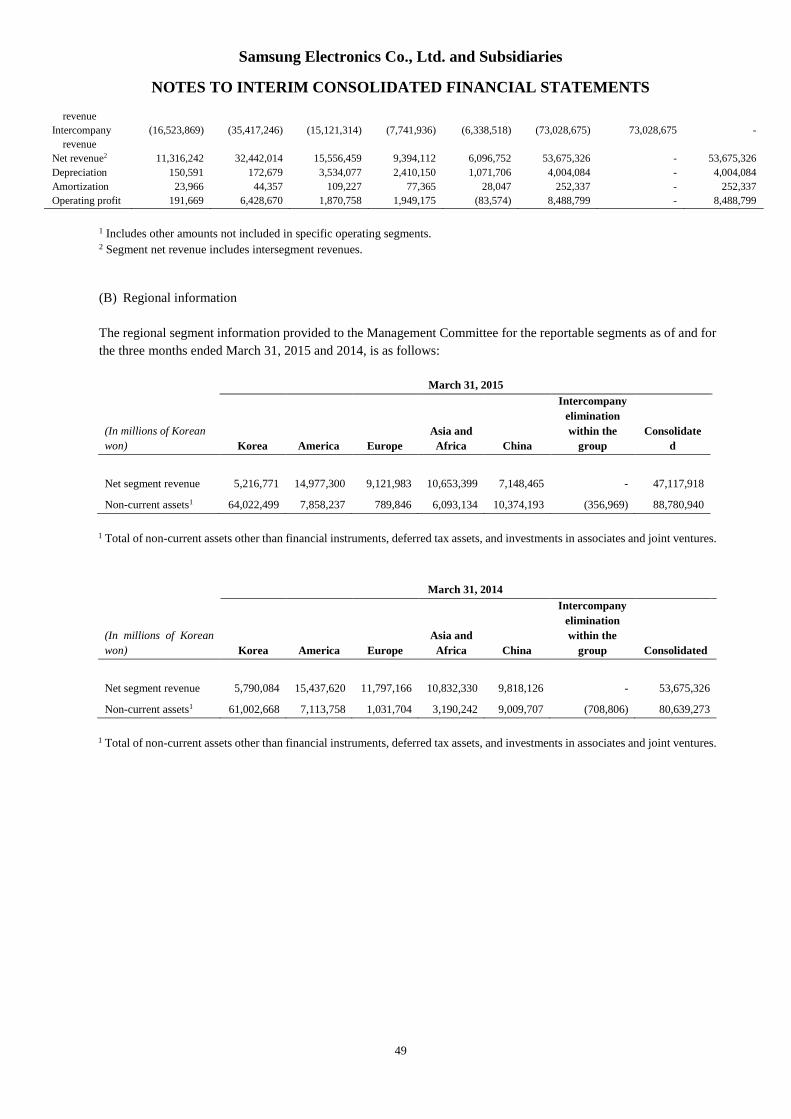
Samsung Electronics Co., Ltd. and Subsidiaries
NOTES TO INTERIM CONSOLIDATED FINANCIAL STATEMENTS
49
revenue
Intercompany
revenue
(16,523,869) (35,417,246) (15,121,314) (7,741,936) (6,338,518) (73,028,675) 73,028,675 -
Net revenue2 11,316,242 32,442,014 15,556,459 9,394,112 6,096,752 53,675,326 - 53,675,326
Depreciation 150,591 172,679 3,534,077 2,410,150 1,071,706 4,004,084 - 4,004,084
Amortization 23,966 44,357 109,227 77,365 28,047 252,337 - 252,337
Operating profit 191,669 6,428,670 1,870,758 1,949,175 (83,574) 8,488,799 - 8,488,799
1 Includes other amounts not included in specific operating segments.2 Segment net revenue includes intersegment revenues.
(B) Regional information
The regional segment information provided to the Management Committee for the reportable segments as of and for
the three months ended March 31, 2015 and 2014, is as follows:
March 31, 2015
(In millions of Korean
won) Korea America Europe
Asia and
Africa China
Intercompany
elimination
within the
group
Consolidate
d
Net segment revenue 5,216,771 14,977,300 9,121,983 10,653,399 7,148,465 - 47,117,918
Non-current assets1 64,022,499 7,858,237 789,846 6,093,134 10,374,193 (356,969) 88,780,940
1 Total of non-current assets other than financial instruments, deferred tax assets, and investments in associates and joint ventures.
March 31, 2014
(In millions of Korean
won) Korea America Europe
Asia and
Africa China
Intercompany
elimination
within the
group Consolidated
Net segment revenue 5,790,084 15,437,620 11,797,166 10,832,330 9,818,126 - 53,675,326
Non-current assets1 61,002,668 7,113,758 1,031,704 3,190,242 9,009,707 (708,806) 80,639,273
1 Total of non-current assets other than financial instruments, deferred tax assets, and investments in associates and joint ventures.

Samsung Electronics Co., Ltd. and Subsidiaries
NOTES TO INTERIM CONSOLIDATED FINANCIAL STATEMENTS
50
26. Related Party Transactions
(A) Sale and purchase transactions
Sales and purchases with related parties for the three months ended March 31, 2015 and 2014, are as follows:
March 31, 2015
(In millions of Korean
won) Name of Company1 Sales
Disposal of
fixed assets Purchases
Purchase of
fixed assets
Associates
Samsung SDS \ 8,435 \ - \ 400,191 \ 47,032
Samsung Electro-Mechanics 2,659 - 622,525 -
Samsung Techwin 1,812 - 3,488 29,537
Samsung Card 1,531 - 8,416 -
Other 60,168 3,524 1,307,081 57,944
Total (Associates) 74,605 3,524 2,341,701 134,513
Joint ventures
Siltronic Samsung Wafer - - 41,390 -
Other 1,970 - 49,379 -
Total (Joint ventures) 1,970 - 90,769 -
Other related parties
Cheil Industries Inc. 2 1,437 - 6,436 112,551
Samsung SDI 11,642 - 399,155 2,232
Other 27,741 - 270,828 85,220
Total (Other related parties) 40,820 - 676,419 200,003
1 Transactions with separate entities that are related parties of the Group.2 During the year ended December 31, 2014, Samsung Everland changed its name to Cheil Industries Inc.
March 31, 2014
(In millions of Korean won) Name of Company1 Sales
Disposal of
fixed assets Purchases
Purchase of
fixed assets
Associates
Samsung SDS \ 10,747 \ - \ 492,476 \ 83,139
Samsung Electro-Mechanics 9,020 1 620,036 -
Samsung Techwin 4,479 - 7,755 25,272
Samsung Card 1,392 - 9,024 -
Other 85,065 - 1,091,589 142,923
Total (Associates) 110,703 1 2,220,880 251,334
Joint ventures
Samsung Corning Precision Materials2 164 - 67,826 -
Siltronic Samsung Wafer - - 39,621 -
Other 891 575 35,181 -
Total (Joint ventures) 1,055 575 142,628 -
Other related parties
Cheil Industries Inc. 3 1,734 - 24,708 76,283
Samsung SDI 16,023 - 203,683 -
Other 70,543 - 563,470 51,193
Total (Other related parties) 88,300 - 791,861 127,476
1 Transactions with separate entities that are related parties of the Group2 During the year ended December 31, 2014, the Group completed the disposal of all shares of Samsung Corning Precision
Materials held by the Group.3 During the year ended December 31, 2014, Samsung Everland changed its name to Cheil Industries Inc.

Samsung Electronics Co., Ltd. and Subsidiaries
NOTES TO INTERIM CONSOLIDATED FINANCIAL STATEMENTS
51
(B) Balances of receivables and payables
Balances of receivables and payables arising from sales and purchases of goods and services as of March 31, 2015
and December 31, 2014, are as follows:
March 31, 2015
(In millions of Korean won) Name of Company1 Receivables Payables
Associates
Samsung SDS \ 6,337 \ 326,046
Samsung Electro-Mechanics 2,370 296,978
Samsung Techwin 9,157 36,625
Samsung Card 9,815 689,420
Other 68,756 453,663
Total (Associates) 96,435 1,802,732
Joint ventures
Siltronic Samsung Wafer 12,971 12,267
Other 1,051 35,737
Total (Joint ventures) 14,022 48,004
Other related parties
Cheil Industries Inc.2 186,665 162,741
Samsung SDI 3,150 137,251
Other 15,992 96,551
Total (Other related parties) 205,807 396,543
1 Balances due from and to separate entities that are related parties of the Group.2 During the year ended December 31, 2014, Samsung Everland changed its name to Cheil Industries Inc.
December 31, 2014
(In millions of Korean won) Name of Company1 Receivables Payables
Associates
Samsung SDS \ 3,353 \ 359,001
Samsung Electro-Mechanics 1,431 237,816
Samsung Techwin 1,353 18,977
Samsung Card 5,431 1,124,240
Other 61,903 393,963
Total (Associates) 73,471 2,133,997
Joint ventures
Siltronic Samsung Wafer 19,143 11,445
Other 474 39,262
Total (Joint ventures) 19,617 50,707
Other related parties
Cheil Industries Inc.2 187,108 288,984
Samsung SDI 4,771 122,936
Other 18,052 126,422
Total (Other related parties) 209,931 538,342
1 Balances due from and to separate entities that are related parties of the Group.2 During the year ended December 31, 2014, Samsung Everland changed its name to Cheil Industries Inc.
(C) Key management compensation
Key management includes directors (executive and non-executive) and members of the Executive Committee. The
compensation paid or payable for employee services for the three months ended March 31, 2015 and 2014 consists
of:
(In millions of Korean won) March 31, 2015 March 31, 2014
Salaries and other short-term employee benefits \ 2,361 \ 13,172
Termination benefits 140 243
Other long-term benefits 2,079 1,784
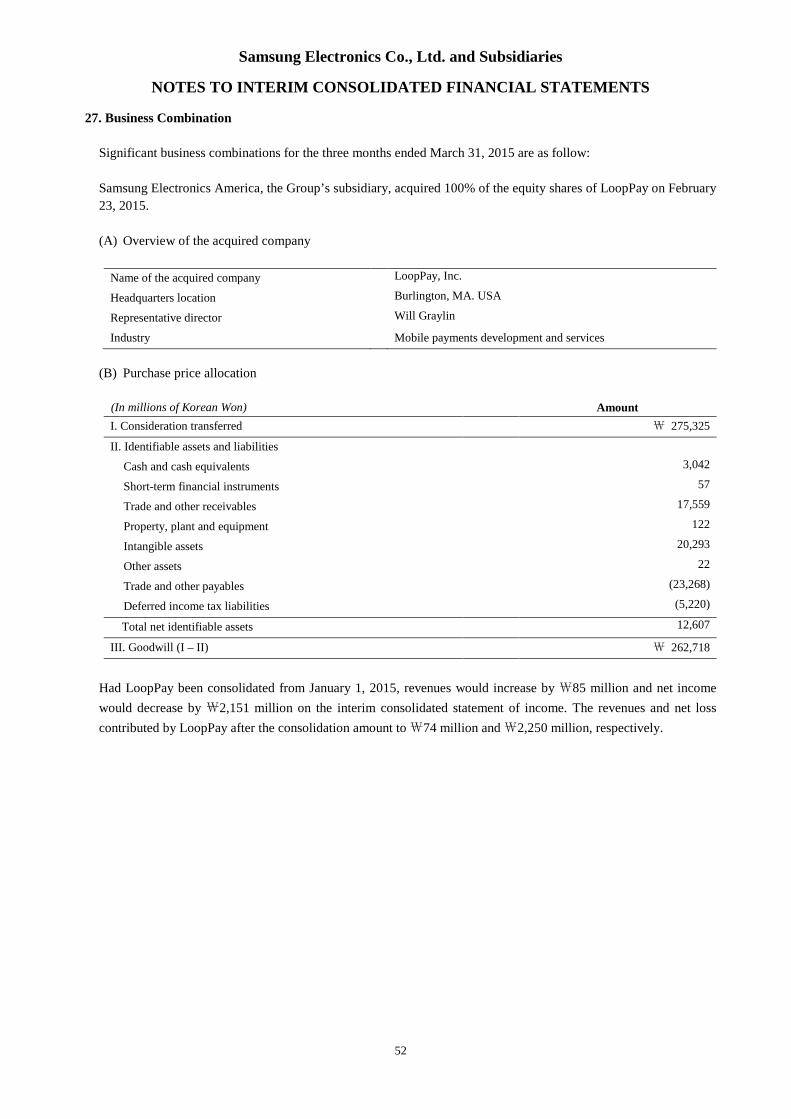
Samsung Electronics Co., Ltd. and Subsidiaries
NOTES TO INTERIM CONSOLIDATED FINANCIAL STATEMENTS
52
27. Business Combination
Significant business combinations for the three months ended March 31, 2015 are as follow:
Samsung Electronics America, the Group’s subsidiary, acquired 100% of the equity shares of LoopPay on February
23, 2015.
(A) Overview of the acquired company
Name of the acquired company LoopPay, Inc.
Headquarters location Burlington, MA. USA
Representative director Will Graylin
Industry Mobile payments development and services
(B) Purchase price allocation
(In millions of Korean Won) Amount
I. Consideration transferred ₩ 275,325
II. Identifiable assets and liabilities
Cash and cash equivalents 3,042
Short-term financial instruments 57
Trade and other receivables 17,559
Property, plant and equipment 122
Intangible assets 20,293
Other assets 22
Trade and other payables (23,268)
Deferred income tax liabilities (5,220)
Total net identifiable assets 12,607
III. Goodwill (I – II) ₩ 262,718
Had LoopPay been consolidated from January 1, 2015, revenues would increase by ₩85 million and net income
would decrease by ₩2,151 million on the interim consolidated statement of income. The revenues and net loss
contributed by LoopPay after the consolidation amount to₩74 million and₩2,250 million, respectively.

Samsung Electronics Co., Ltd. and Subsidiaries
NOTES TO INTERIM CONSOLIDATED FINANCIAL STATEMENTS
53
28. Non-current Assets Held-for-Sale (Assets of disposal group)
(A) Summary
(1) Sale of Samsung Techwin Co., Ltd.
During the year ended December 31, 2014, the management of the Group decided to sell all its shares of Samsung
Techwin Co., Ltd. to Hanwha Corporation. The contract was entered into on November 26, 2014, and the transaction
and associated due diligence will be completed by June 2015.
(2) Sale of Samsung General Chemicals Co., Ltd.
During the year ended December 31, 2014, the management of the Group decided to sell all its shares of Samsung
General Chemicals Co., Ltd. to Hanwha Chemical and Hanwha Energy Corporation, and the transaction was
completed in April 2015.
(3) Sale of Optical Materials business segment
During the year ended December 31, 2014, the management of the Group decided to sell the Optical Materials
business segment and accordingly, the related assets and liabilities are classified as held-for-sale. Since the business
does not represent a separate major line of the Group, related profit or loss was not presented as profit or loss of
discontinued operations. The contract was entered into on December 2, 2014, and the transaction was completed in
March 2015.
(B) Details of assets and liabilities reclassified as held-for-sale, as of March 31, 2015 and December 31, 2014 are as
follows:
(In millions of Korean Won) March 31, 2015 December 31, 2014
Assets held-for-sale
Trade receivables - ₩ 60,173
Inventories - 9,703
Other current assets - 22,523
Property, plant and equipment - 37,955
Investment 511,441 511,441
Other non-current assets - 3,696
Total 511,441 ₩ 645,491
Liabilities held-for-sale
Current liabilities - ₩ 25,939
Non-current liabilities - 2,377
Total - ₩ 28,316
Impairment loss recognized in 2014 from the reclassification of assets and liabilities held-for-sale amounts to
\ 31,219 million.

Samsung Electronics Co., Ltd. and Subsidiaries
NOTES TO INTERIM CONSOLIDATED FINANCIAL STATEMENTS
54
(C) Details of cumulative income or expense recognized in other comprehensive income relating to the disposal group
classified as held-for-sale as of March 31, 2015 and December 31, 2014 are as follows:
(In millions of Korean Won) March 31, 2015 December 31, 2014
Gain on valuation of available-for-sale securities ₩ 24,750 ₩ 24,750
Changes in equity under the equity-method 54,118 54,118
Foreign exchange translation adjustment - 1,233
Total ₩ 78,868 ₩ 80,101
29. Events after the Reporting Period
The Group sold all its shares of Samsung General Chemicals Co., Ltd. that were classified as asset held-for-sale, to
Hanwha Chemical and Hanwha Energy Corporation on April 30, 2015.