SOFTWARE DEVELOPMENT METHODS CPSC 215, Clemson University, Fall 2011.

Use of Sample Surveys
Sampling Theory and MethodsSpring 2008
C. L. Williams
Syllabus and Lecture 1 for Introduction to Sampling Methodsand Theory
Instructor: C. L. Williams MthSc 406

Use of Sample Surveys
Outline
1 Use of Sample Surveys
Instructor: C. L. Williams MthSc 406

Use of Sample Surveys
Why use surveys?
Information on characteristics of populations is constantly neededby politicians, marketing departments of companies, public officialsresponsible for planning health and social services, and others. Forreasons relating to timeliness and cost, this information is oftenobtained by use of sample surveys.
Instructor: C. L. Williams MthSc 406
Use of Sample Surveys
A Health Care Example
A health department in a large state is interested in determiningthe proportion of the state’s children of elementary school age whohave been immunized against the childhood infectious diseases(e.g., polio, diphtheria, tetanus, pertussis, etc.).
Instructor: C. L. Williams MthSc 406

Use of Sample Surveys
Our Goal in this course
Our goal in this course is to present a variety of methods forselecting a subset (a sample) from the original set of allmeasurements (the population) of interest to the researchers. It isthe members of the sample who will be interviewed, studied, ormeasured. For example, in the problem stated above, the neteffect of such methods will be that valid and reliable estimates ofthe proportion of children who have been immunized for thesediseases could be obtained in the time frame specified and at afraction of the cost that would have resulted if attempts weremade to obtain the information concerning every child ofelementary school age in the state.
Instructor: C. L. Williams MthSc 406

Use of Sample Surveys
We will considerSummary Statistics
More formally, a sample survey may be defined as a study involvinga subset (or sample) of individuals selected from a largerpopulation. Variables or characteristics of interest are observed ormeasured on each of the sampled individuals. These measurementsare then aggregated over all individuals in the sample to obtainsummary statistics (e.g., means, proportions, totals) for thesample. It is from these summary statistics that extrapolations canbe made concerning the entire population. The validity andreliability of these extrapolations depend on how well the samplewas chosen and how well the measurements were made.
Instructor: C. L. Williams MthSc 406

Use of Sample Surveys
Why not a Census?
When all the individuals in the population are selected formeasurement, the study is called a census. The summary statisticsobtained from a census are not extrapolations, since every memberof the population is measured. The validity of the resultingstatistics, however, depends on how well the measurements aremade. The main advantages of sample surveys over censuses lie inthe reduced costs and greater speed made possible by takingmeasurements on a subset rather than on an entire population. Inaddition, studies involving complex issues requiring elaboratemeasurement procedures are often feasible only if a sample of thepopulation is selected for measurement since limited resources canbe allocated to getting detailed measurements if the number ofindividuals to be measured is not too great.
Instructor: C. L. Williams MthSc 406

Use of Sample Surveys
Mandated to collect data
In the United States, some government agencies are mandated todevelop and maintain programs whereby sample surveys are usedto collect data on the economic, social, and health status of thepeople, and these data are used for research purposes as well as forpolicy decisions.
National Center for Health Statistics (NCHS), a center withinthe United States Department of Health and Human Services,is mandated by law to conduct a program of periodic andongoing sample surveys designed to obtain information aboutillness, disability, and the utilization of health care services inthe United States.
Instructor: C. L. Williams MthSc 406

Use of Sample Surveys
Other National Centers and Bureaus
Bureau of Labor Statistics within the Department of Labor
National Center for Educational Statistics within theDepartment of Education), which collect data relevant to themission of their departments through a program of samplesurveys.
U.S. Bureau of the Census
Centers for Disease Control.
Instructor: C. L. Williams MthSc 406
Use of Sample Surveys
Observational Studies
Sample surveys belong to a larger class of non-experimental studiesgenerally given the name “observational studies” in the health orsocial sciences literature. Most sample surveys can be put in theclass of observational studies known as “cross-sectional studies.”Other types of observational studies include cohort studies andcase-control studies. Cross-sectional studies are ”snapshots” of apopulation at a single point in time, having as objectives either theestimation of the prevalence or mean level of some characteristicsof the population or measurement of the relationship between twoor more variables measured at the same point in time. Cohort andcase-control studies are used for analytic rather than descriptivepurposes.
Instructor: C. L. Williams MthSc 406

Use of Sample Surveys
Example Epidemiological study
Case control studies are used in epidemiology to test hypothesesabout the association between exposure to suspected risk factorsand the incidence of specific diseases. These study designs arewidely used to gain insight into relationships.
Instructor: C. L. Williams MthSc 406

Use of Sample Surveys
Private sector or Business example
If you were to work for on of the large consumer data basecompanies you job may be to gather the delinquent accounts (e.g.,the “cases”) along with a sample of accounts that are notdelinquent (e.g., the “controls”), and then compare thecharacteristics of each group for purposes of determining thosefactors that are associated with delinquency.
Instructor: C. L. Williams MthSc 406
Use of Sample Surveys
Estimation of proportion vaccinated
For example, in the hypothetical example, presented at thebeginning of this chapter, the major objective is to estimate,through use of a sample, the proportion of all children ofelementary school age who have been immunized for childhooddiseases.
Instructor: C. L. Williams MthSc 406

Use of Sample Surveys
Descriptive surveys
In descriptive surveys, much attention is given to the selection ofthe sample since extrapolation is made from the sample to thepopulation. Although hypotheses can be tested based on datacollected from such descriptive surveys, this is generally asecondary objective in such surveys. Estimation is almost alwaysthe primary objective.
Instructor: C. L. Williams MthSc 406

Use of Sample Surveys
Four major components-Designed Sample Surveys
Sample design,
Survey measurements,
Survey operations,
Statistical analysis and report generation.
Instructor: C. L. Williams MthSc 406

Use of Sample Surveys
Sampling plan
In a sample survey, the major statistical components are referred toas the sample design and include both the sampling plan and theestimation procedures. The sampling plan is the methodology usedfor selecting the sample from the population. The estimationprocedures are the algorithms or formulas used for obtainingestimates of population values from the sample, data and forestimating the reliability of these population estimates.
Instructor: C. L. Williams MthSc 406

Use of Sample Surveys
Collaborative effort
The choice of a particular sample design should be a collaborativeeffort involving input from the statistician who will design thesurvey, the persons involved in executing the survey, and those whowill use the data from the survey. The data users should specifywhat variables should be measured, what estimates are required,what level of reliability and validity are needed for the estimates,and what restrictions are placed on the survey with respect totimeliness arid costs. Those individuals involved in executing thesurvey should furnish input about costs for personnel, time, andmaterials as well as input about the feasibility of alternativesampling and measurement procedures. Having received suchinput, the statistician can then propose a sample design that willmeet the required specifications of the users at the lowest possiblecost.
Instructor: C. L. Williams MthSc 406

Use of Sample Surveys
The Statistician’s roleWhat you will learn in the course
Just as sampling and estimation are the statistician’s responsibilityin the design of a sample survey, the choice of measurements to betaken and the procedures for taking these measurements are theresponsibility of those individuals who are experts in the subjectmatter of the survey and also of those individuals having expertisein the measurement sciences. The former (often called “subjectmatter persons”) give the primary input into specifying themeasurements that are needed in order to meet the objectives ofthe survey.
Instructor: C. L. Williams MthSc 406

Use of Sample Surveys
The psychologist’s or sociologist’s roleWhat you won’t learn in this course
Once these measurements are specified, the the measurementexperts -often psychologists or sociologists with special trainingand skills in survey research - begin designing the questionnaires orforms to be used in eliciting the data from the sample individuals.The design of a questionnaire or other survey instrument which issuitable for collecting valid and reliable data is often a very complextask; it requires considerable care and sometimes a preliminarystudy, especially if some of the variables to be measured have neverbeen measured before by the survey process. Once the surveyinstruments have been drafted, the statistician provides input withrespect to procedures to be used to evaluate and assure the quality
Instructor: C. L. Williams MthSc 406

Use of Sample Surveys
Pilot study“A dry run”
Once the sample has been chosen and the measurementinstruments or questionnaires drafted, pretested, and modified, thefield work of the survey - including data collection - can begin. Butbefore the data collection starts, there should be a dry run or pilotsurvey on a small sample, with the objective of testing themeasurement instruments and eliminating any discernibleimperfections in the survey procedures.
Instructor: C. L. Williams MthSc 406

Use of Sample Surveys
Valid and reliable resultsWhat must be done
In order for the estimates from the survey to be valid and reliable,it is important that the data be collected in accordance with thesurvey design, and it is the task of those individuals responsible forsurvey operations to oversee and supervise the data collectionprocedures. The nature of the survey operations staff depends onthe size and scope of the sample survey, the complexity of themeasurements, and the nature of the survey
Instructor: C. L. Williams MthSc 406

Use of Sample Surveys
Our main interestStatistical Analysis and Report Writing
After the data have been collected, coded, edited, and processed,the data can be analyzed statistically and the findings incorporatedinto a final report. As in all components of a sample survey,considerable care should be taken in the interpretation of thefindings of the survey. These findings are in the form of estimatedcharacteristics of the population from which the sample was taken.These estimates, however, are subject to both sampling andmeasurement errors, and any interpretation of the findings shouldtake these errors into consideration.
Instructor: C. L. Williams MthSc 406

Use of Sample Surveys
Requirements of a good sampleBasic definitions
Some definitions are needed to make the notion of a good samplemore precise.
Observation unit An object on which a measurement istaken. This is the basic unit of observation, sometimes calledan element. In studying human populations, observation unitsare often individuals.
Target population The complete collection of observationswe want to study. Defining the target population is animportant and often difficult part of the study. For example,in a political poll, should the target population be all adultseligible to vote? All registered voters? All persons who votedin the last election? The choice of target population willprofoundly affect the statistics that result.
Instructor: C. L. Williams MthSc 406
Use of Sample Surveys
Requirements of a good sampleBasic definitions, cont’d
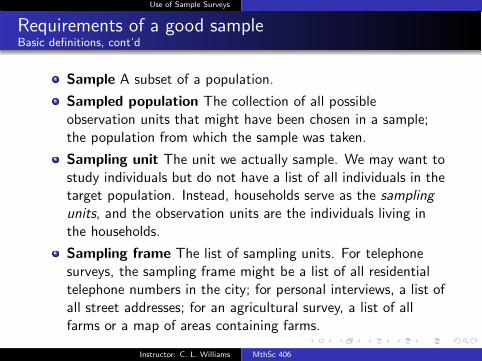
Sample A subset of a population.
Sampled population The collection of all possibleobservation units that might have been chosen in a sample;the population from which the sample was taken.
Sampling unit The unit we actually sample. We may want tostudy individuals but do not have a list of all individuals in thetarget population. Instead, households serve as the samplingunits, and the observation units are the individuals living inthe households.
Sampling frame The list of sampling units. For telephonesurveys, the sampling frame might be a list of all residentialtelephone numbers in the city; for personal interviews, a list ofall street addresses; for an agricultural survey, a list of allfarms or a map of areas containing farms.
Instructor: C. L. Williams MthSc 406

Use of Sample Surveys
Ideal Study
In an ideal survey, the sampled population will be identical to thetarget population, but this ideal is rarely met exactly. In surveys ofpeople, the sampled population is usually smaller than the targetpopulation.
Instructor: C. L. Williams MthSc 406
Use of Sample Surveys
The Population
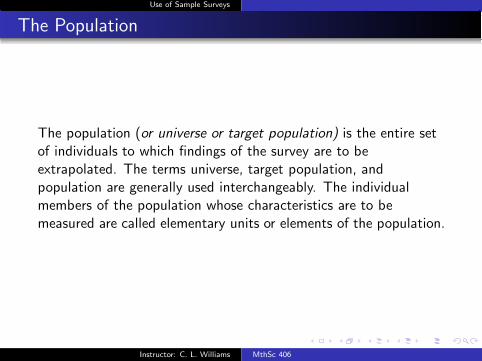
The population (or universe or target population) is the entire setof individuals to which findings of the survey are to beextrapolated. The terms universe, target population, andpopulation are generally used interchangeably. The individualmembers of the population whose characteristics are to bemeasured are called elementary units or elements of the population.
Instructor: C. L. Williams MthSc 406

Use of Sample Surveys
Enumeration Units or listing units
The individual members of the population whose characteristics areto be measured are called elementary units or elements of thepopulation. For example, if we are conducting a sample survey forpurposes of estimating the number of persons living in SouthCarolina who have never visited a dentist, the universe consists ofall persons living in South Carolina, and each person living inSouth Carolina is an elementary unit or element.
Instructor: C. L. Williams MthSc 406

Use of Sample Surveys
If we are conducting a sample survey of hospital medical recordsfor purposes of estimating the number of hospital discharges in agiven year having specified diagnoses, each hospital dischargeoccurring during the year is an element, and the totality of suchdischarges constitutes the universe or population.
Instructor: C. L. Williams MthSc 406

Use of Sample Surveys
An algorithmic approach
If a sample is to be drawn from a enumeration list (or list ofenumeration units, it is necessary to specify by some algorithm theelementary units that are to be associated with each enumerationunit. In order to get a representative set an enumeration orcounting rule must be used.
Instructor: C. L. Williams MthSc 406

Use of Sample Surveys
Primary purpose
The primary goal in conducting a survey is to estimate certainvalues relating to the distribution of characteristics of interest froma population. The most common of these are totals, means,aggregates (partial sums), proportions and or ratios. Measures ofrelative standing like percentiles, standard deviations or otherdistributional features could also be considered.
Instructor: C. L. Williams MthSc 406

Use of Sample Surveys
Some basic statistics-We all knowPopulation parameters
1 Population Total of a characteristic is generally denoted byT and is the sum of the values of the characteristic over allelements in the population. The population total is given by
XT =
n∑
i=1
Xi
2 Population Mean with respect to a characteristic is given by
µ = X =
∑ni=1 Xi
N3 Population proportion. When the characteristic being
measured represents the presence or absence of somedichotomous attribute, we want to consider the proportion ofunits in the population having the attribute.
π = PX =XT
NInstructor: C. L. Williams MthSc 406
Use of Sample Surveys
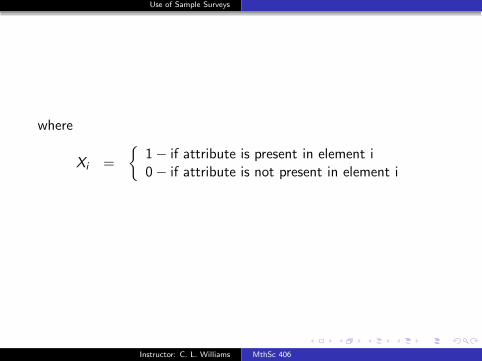
where
Xi =
{1 − if attribute is present in element i0 − if attribute is not present in element i
Instructor: C. L. Williams MthSc 406

Use of Sample Surveys
Population variance and standard deviation
. The variance and the standard deviation of the distribution of acharacteristic in a population are of interest because they measurethe spread of the distribution. The population variance of acharacteristic is denoted by σ2
X and is given by
σ2X =
∑Ni=1 (Xi − µX )2
N.
Instructor: C. L. Williams MthSc 406

Use of Sample Surveys
Standard deviation
The population standard deviation, denoted σX is simply thesquare root of the variance and is given by
σX =
√∑Ni=1 (Xi − µX )2
N.
If the characteristic of interest Y is a dichotomous random variabledenoting the existence or the non-existence of some attribute, thevariance is given by
σ2Y = PY (1 − PY ).
Instructor: C. L. Williams MthSc 406

Use of Sample Surveys
Population coefficient of variation
The population coefficient of variation is defined as the ratio of thestandard deviation to the mean. The coefficient of variationrepresents the spread of the distribution relative to the mean of thedistribution.
CVX =σX
µX
Instructor: C. L. Williams MthSc 406

Use of Sample Surveys
Illustrative Example from text.
Suppose we are interested in the distribution of household visitsmade by physicians in a community over a specified year. In thisinstance the elementary units are physicians and there are 25 ofthem. The 25 physicians in the community are labeled from 1 to25 and the number of visits made by each physician is shown inthe following table.
Instructor: C. L. Williams MthSc 406

Use of Sample Surveys
Table 2 Physicians visits in a year.
Physician No. of Visits Physician No. of visits
1 5 14 42 0 15 83 1 16 04 4 17 75 7 18 06 0 19 377 12 20 08 0 21 89 0 22 010 22 23 011 0 24 112 5 25 013 6
Instructor: C. L. Williams MthSc 406

Use of Sample Surveys
Population Characteristics - Parameters
In other words, N = 25. If we let X = the number of physicianvisits made by physician i, the population mean, total, variance,and standard deviation are given as:
µX = 5.08 (visits) σ2X = 67.91 (visits)2
XT = 127 (visits) σX = 8.24 (visits)
Instructor: C. L. Williams MthSc 406
Use of Sample Surveys
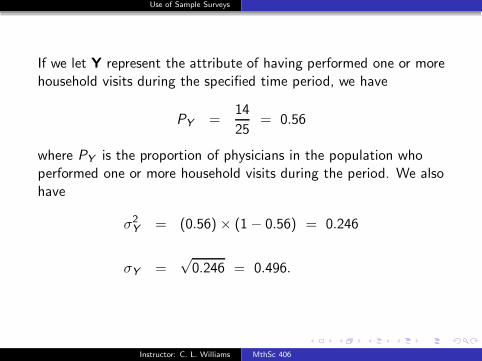
If we let Y represent the attribute of having performed one or morehousehold visits during the specified time period, we have
PY =14
25= 0.56
where PY is the proportion of physicians in the population whoperformed one or more household visits during the period. We alsohave
σ2Y = (0.56) × (1 − 0.56) = 0.246
σY =√
0.246 = 0.496.
Instructor: C. L. Williams MthSc 406

Use of Sample Surveys
Coefficient of variation
For the distribution of household visits in the example:
CVX =8.24
5.08= 1.62 and
CVY =0.496
0.56= 0.886
The square of the coefficient of variation, V 2X is known as the
relative variance or rel-variance and is a parameter that is widelyused in sampling methodology.
Instructor: C. L. Williams MthSc 406

Use of Sample Surveys
Illustrative Example.
Are cholesterol levels in a population are more variable thansystolic blood pressure variables in the same population?
mean systolic blood pressure level in the population is 130mmHg (millimeters of mercury) and the standard deviation is15mmHg.
mean cholesterol level is 200mg/100ml (milligrams per 100milliliters) and that the standard deviation is 40 mg/100 ml.
Standard deviations do not tell us in any meaningful way whichcharacteristic is more variable in the population because they aremeasured in different units (millimeters of mercury vs. milligramsper 100 milliliters in this instance).
Instructor: C. L. Williams MthSc 406

Use of Sample Surveys
Comparison of the two variables can be made, however, byexamination of the respective coefficients of variation; 15/130 or.115, for systolic blood pressure vs. 40/200 or .200 for cholesterol.The coefficients of variation can be compared because they aredimensionless numbers. Thus, since the coefficient of variation forcholesterol level is greater than that for systolic blood pressure, wewould conclude that cholesterol has more variability than systolicblood pressure in this population.
Instructor: C. L. Williams MthSc 406

Use of Sample Surveys
Illustrative Example.
Consider two variables that are measured in the same measurementunits, for example, systolic blood pressure and diastolic bloodpressure.
mean diastolic blood pressure in the population is 60mmHg,with a standard deviation equal to 8 mmHg, and
systolic blood pressure-has a mean and a standard deviationas given in the previous example (i.e., µX = 130 mmHg andσX = 15mmHg).
Systolic blood pressure is more variable than diastolic bloodpressure (σX = 15 mmHg vs. 8 mmHg ). In relative terms,
diastolic blood pressure has the greater variability, CV = 8/60or 0.133 vs.
systolic blood pressure CV = 15/130 or 0.115.
Relative variation is often of more concern in designed studiesthan absolute variation hence the importance of the coefficient ofvariation.
Instructor: C. L. Williams MthSc 406
Use of Sample Surveys
Sampling
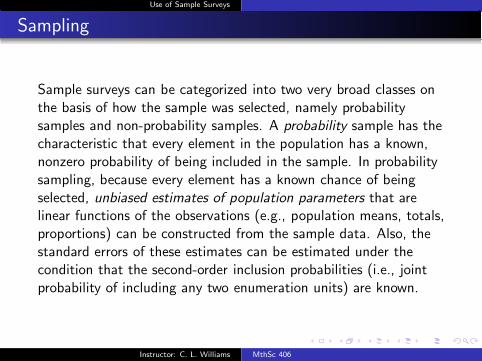
Sample surveys can be categorized into two very broad classes onthe basis of how the sample was selected, namely probabilitysamples and non-probability samples. A probability sample has thecharacteristic that every element in the population has a known,nonzero probability of being included in the sample. In probabilitysampling, because every element has a known chance of beingselected, unbiased estimates of population parameters that arelinear functions of the observations (e.g., population means, totals,proportions) can be constructed from the sample data. Also, thestandard errors of these estimates can be estimated under thecondition that the second-order inclusion probabilities (i.e., jointprobability of including any two enumeration units) are known.
Instructor: C. L. Williams MthSc 406

Use of Sample Surveys
Nonprobability Sampling
A nonprobability sample is one based on a sampling plan that doesnot have the features present in a probability sample.and the userhas no firm method of evaluating either the reliability or thevalidity of the resulting estimates. These issues and concepts willbe addressed later in Chapter 2. Nonprobability samples are usedquite frequently, especially in market research and public opinionsurveys. They are used because probability sampling is often atime-consuming and expensive procedure and, in fact, may not befeasible in many situations. An example of nonprobability samplingis the so-called quota survey in which interviewers are told tocontact and interview a certain number of individuals from certaindemographic subgroups.
Instructor: C. L. Williams MthSc 406
Use of Sample Surveys
Sampling Frame
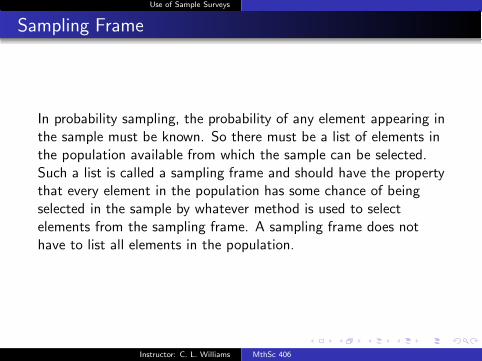
In probability sampling, the probability of any element appearing inthe sample must be known. So there must be a list of elements inthe population available from which the sample can be selected.Such a list is called a sampling frame and should have the propertythat every element in the population has some chance of beingselected in the sample by whatever method is used to selectelements from the sampling frame. A sampling frame does nothave to list all elements in the population.
Instructor: C. L. Williams MthSc 406

Use of Sample Surveys
Multistage sampling design
Often a particular sampling design specifies that the sampling beperformed in two or three stages; this design is called a multistagesampling design. For example, a household survey conducted in alarge state might have a sampling design specifying that a sampleof counties be drawn within the state; that within each countyselected in the sample, a sample of minor civil divisions (townships)be drawn; and that within each minor civil division a sample ofhouseholds be drawn. In multistage sampling, a different samplingframe is used at each stage of the sampling. The units listed in theframe are generally called sampling units. The sampling units forthe first stage are generally called primary sampling units (PSUs).The sampling units for the final stage of a multistage samplingdesign are called enumeration units or listing units.
Instructor: C. L. Williams MthSc 406

Use of Sample Surveys
Sample statisticsTotal, mean and proportion
Sample Total: The sample total is generally denoted by xT
and is the sum of the values over all elements in the sample:
xT =
n∑
i=1
xi
Sample Mean: The sample mean generally denoted by x andis the sum of the values in the sample divided by the samplesize:
x =
∑ni=1 xi
n
Sample Proportion: The sample proportion of adichotomous characteristic is generally denoted by px is givenby
px =xt
n
Instructor: C. L. Williams MthSc 406

Use of Sample Surveys
Sample statistics
Sample Variance and standard deviation: The samplevariance s2
x is given by:
s2x =
∑ni=1 (xi − x)2
n − 1
Dichotomous
s2x =
npx (1 − px)
n − 1
and for large sample sizes (> 20) an approximation can beused
s2x = px (1 − px)
Sample standard deviation
sx =√
px (1 − px)
Instructor: C. L. Williams MthSc 406

Use of Sample Surveys
Estimation of Population Characteristics
An estimate of the population total XT can be obtained from thesample total xT as given
x ′
T =
(N
n
)(x)
An estimate σ2x of the population variance σ2
x is given by
σ2x =
(N − 1
N
)(s2
x )
If the number of elements N in the population large, (N-1)/N:
σ2x ≈ s2
x
Instructor: C. L. Williams MthSc 406

Use of Sample Surveys
Table 2 Physicians visits in a year.
Physician No. of Visits Physician No. of visits
1 5 17 76 0 19 377 12 21 812 5 25 013 6
xT = 80; x = 8.89; s2x = 125.11.
Instructor: C. L. Williams MthSc 406

Use of Sample Surveys
Population Parameter Estimate from Sample
XT = 127 x ′
T = 259
(80) =222.22µ = X = 5.08 x = 8.89σ2
x = 67.91 σ2 = 2425
(125.22) = 120.11PY = 0.56 py = 7
9= 0.78
σ2y = 0.246 σ2 = 24
25(0.1944) = 0.1866
Instructor: C. L. Williams MthSc 406
Use of Sample Surveys
Sampling Distributions-Mean of the Distribution
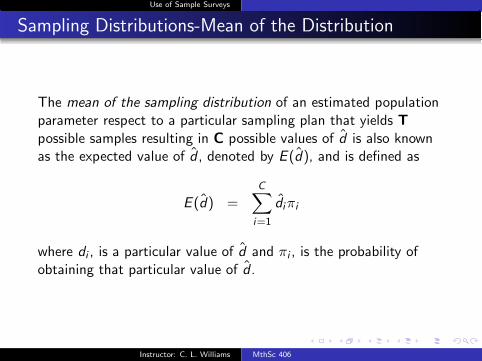
The mean of the sampling distribution of an estimated populationparameter respect to a particular sampling plan that yields T
possible samples resulting in C possible values of d is also knownas the expected value of d , denoted by E (d), and is defined as
E (d) =
C∑
i=1
diπi
where di , is a particular value of d and πi , is the probability ofobtaining that particular value of d .
Instructor: C. L. Williams MthSc 406

Use of Sample Surveys
Sampling Distributions-Mean of the Distribution
(Note that if each sample is equally likely, then πi = fiT
where fi is
the number of times that a particular value, di , of d occurs).
Instructor: C. L. Williams MthSc 406

Use of Sample Surveys
Sampling Distributions-Variance of the Distribution
The variance Var(d) of the sampling distribution of an estimatedparameter d with respect to a particular sampling plan is given by
Var(d) =
C∑
i=1
[di − E (d)]2πi
Instructor: C. L. Williams MthSc 406

Use of Sample Surveys
Sampling Distributions-Variance of the Distribution
The algebraic equivalent of this equation which can be used forcomputations is
Var(d) =
C∑
i=1
di2πi − [E (d)]2
Instructor: C. L. Williams MthSc 406

Use of Sample Surveys
Sampling Distributions-Standard Error of the Distribution
The standard deviation SE(d) of the sampling distribution of anestimated parameter d is more commonly known as the standarderror of d and is simply the square root of the variance Var(d) ofthe sampling distribution of d :
SE (d) = [Var(d)]1/2
Instructor: C. L. Williams MthSc 406
Use of Sample Surveys
Sampling Distributions-Non Immunized for Measles
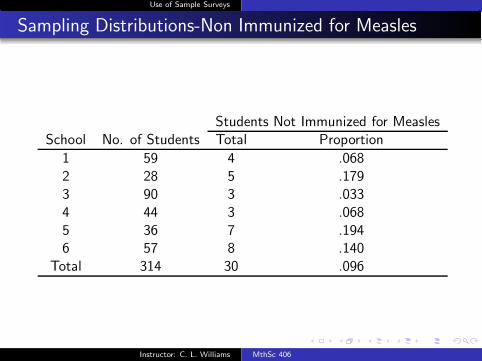
Students Not Immunized for MeaslesSchool No. of Students Total Proportion
1 59 4 .0682 28 5 .1793 90 3 .0334 44 3 .0685 36 7 .1946 57 8 .140
Total 314 30 .096
Instructor: C. L. Williams MthSc 406

Use of Sample Surveys
Sampling Distributions Possible Samples
Sample(i) Sample Schools Totali1 1,2 272 1,3 213 1,4 214 1,5 335 1,6 366 2,3 247 2,4 248 2,5 369 2,6 3910 3,4 1811 3,5 3012 3,6 3313 4,5 3014 4,6 3315 5,6 45
Instructor: C. L. Williams MthSc 406

Use of Sample Surveys
Sampling Distributions for Sample Totals
Sample Totali Frequency Relative frequency
18 1 1/1521 2 2/1524 2 2/1527 1 1/1530 2 2/1533 3 3/1536 2 2/1539 1 1/1545 1 1/15
Instructor: C. L. Williams MthSc 406

Use of Sample Surveys
Sampling Distributions-Non Immunized for Measles
E (d) =
alld∑di(f /15)
= 18(1/15) + 21(2/15) + 24(2/15) + 27(1/15)
+ 30(2/15) + 33(3/15) + 36(2/15) + 39(1/15)
+ 45(1/15)
= 30.
Instructor: C. L. Williams MthSc 406
Use of Sample Surveys
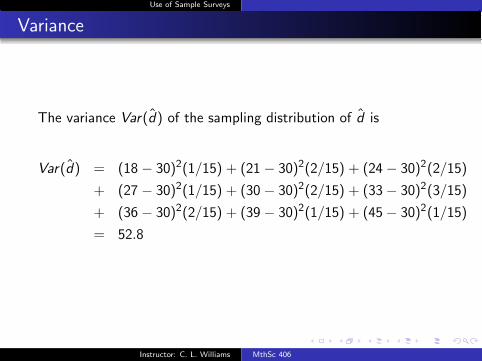
Variance
The variance Var(d) of the sampling distribution of d is
Var(d) = (18 − 30)2(1/15) + (21 − 30)2(2/15) + (24 − 30)2(2/15)
+ (27 − 30)2(1/15) + (30 − 30)2(2/15) + (33 − 30)2(3/15)
+ (36 − 30)2(2/15) + (39 − 30)2(1/15) + (45 − 30)2(1/15)
= 52.8
Instructor: C. L. Williams MthSc 406

Use of Sample Surveys
Sampling Distributions-Example with 1-10 Place Cards
Schools Chosen in Schools Chosen inNumber Sample Number SamplePicked Picked
1 1 and 2 6 2 and 32 1 and 3 7 2 and 43 1 and 4 8 2 and 54 1 and 5 9 2 and 65 1 and 6 10 3 and 4
Instructor: C. L. Williams MthSc 406

Use of Sample Surveys
Sampling Distributions-Example with 1-10 Place Cards,
cont’d
Sample(i) Sample Schools Sample Totali1 1,2 272 1,3 213 1,4 214 1,5 335 1,6 366 2,3 247 2,4 248 2,5 369 2,6 3910 3,4 18
Instructor: C. L. Williams MthSc 406

Use of Sample Surveys
Sampling Distributions-Example with 1-10 Place Cards,
cont’d
Sample Totali πi
18 1/1021 2/1024 2/1027 1/1033 1/1036 2/1039 1/10
Total 1
Instructor: C. L. Williams MthSc 406

Use of Sample Surveys
Sampling Distributions-Bias of the Estimate for a
parameter of the DistributionMean Square Error
The mean square error of population estimate d , denoted byMSE(d), is defined as the mean of the squared differences over allpossible samples between the values of the estimate and the truevalue d of the unknown parameter. In terms of the notationdeveloped in the last section, the mean square error of d is definedby the relation
MSE (d) =
C∑
i=1
(di − d
)2
πi
Instructor: C. L. Williams MthSc 406

Use of Sample Surveys
MSE (d) =
C∑
i=1
(di − d
)2
πi
Notice the difference between the mean square error of an estimateand the variance of an estimate. The mean square error of anestimate is the mean value of squared deviations about the truevalue of the parameter being estimated; the variance of anestimate is the mean value of the squared deviations about themean value of the sampling distribution of the estimate.
Instructor: C. L. Williams MthSc 406

Use of Sample Surveys
In general, the mean square error of the estimate is related to itsbias and variance by the following relation:
MSE (d) = Var(d)
+ Bias2(d)
In other words, the mean square error of a population estimate isequal to the variance of the estimate plus the square of its bias.
Instructor: C. L. Williams MthSc 406

Use of Sample Surveys
Illustrative Example.
In the example involving the six schools, the first sampling plandiscussed yielded an unbiased estimate of the population total.The mean square error of this estimate is given by
MSE (x ′
t) = 52.8 + 02 = 52.8
In other words, the MSE is equal to the variance of the estimate.In the example involving the same six schools and the samplingplan that yielded a biased estimate x ′
t of XT . the variance of x ′
t is(from Equation (2.24))
Var(x ′
t) = (18 − 27.9)2(1/10) + (21 − 27.9)2(2/10)
+(24 − 27.9)2(2/10) + (27 − 27.9)2(1/10)
+(33 − 27.9)2(1/10) + (36 − 27.9)2(2/10)
+(39 − 27.9)2(1/10) = 50.49
Thus, the MSE for x ′
t is MSE(x ′
t) = 50.49 + (30 - 27.9)2 = 54.9Instructor: C. L. Williams MthSc 406

Use of Sample Surveys
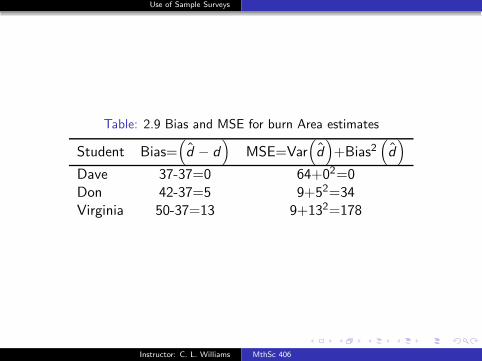
Another illustrative exampleAssessment of Burn victims
Three students being trained to assess the severity of burnvictims.
Assess patients by viewing photographs of ten (10) burnvictims each with “full-thickness” burns of 37%.
Recall
MSE (d) = Var(d)
+ Bias2(d)
Table: 2.9 Data for burn Area estimates
Student d=mean(%) Variance(%)2 = Var(d)
Dave 37 64Don 42 9Virginia 50 9
Instructor: C. L. Williams MthSc 406
Use of Sample Surveys
Table: 2.9 Bias and MSE for burn Area estimates
Student Bias=(d − d
)MSE=Var
(d)+Bias2
(d)
Dave 37-37=0 64+02=0Don 42-37=5 9+52=34Virginia 50-37=13 9+132=178
Instructor: C. L. Williams MthSc 406

Use of Sample Surveys
Validity, Reliability, and AccuracyDesirable Samples
Sample designs should yield reliable and valid estimates.However, we have never defined just what the terms “reliable”and “valid” mean in terms of characteristics of estimates. Wenow have developed enough concepts and notation concerningestimates to be able to define these two terms as well as athird term, the “accuracy” of an estimate, which we will see isderived from the validity and reliability.
Instructor: C. L. Williams MthSc 406
Use of Sample Surveys
Reliability
The reliability of an estimated population characteristic refers tohow reproducible the estimator is over repetitions of the processyielding the estimator. If we assume that there is no measurementerror in the survey, then the reliability of an estimator can bestated in terms of its sampling variance or, equivalently, itsstandard error. The smaller the standard error of an estimator,
the greater is its reliability.
Instructor: C. L. Williams MthSc 406

Use of Sample Surveys
Validity
The validity of an estimated population characteristic refers to howthe mean of the estimator over repetitions of the process yieldingthe estimate, differs from the true value of the parameter beingestimated. Again, if we assume that there is no measurementerror, the validity of an estimator can be evaluated by examiningthe bias of the estimator. The smaller the bias, the greater is
the validity.
Instructor: C. L. Williams MthSc 406
Use of Sample Surveys
Accuracy
The accuracy, of an estimator refers to how far away a particularvalue of the estimate is, on average, from the true value of theparameter being measured. The accuracy of an estimator isgenerally evaluated on the basis of its MSE or, equivalently, on thebasis of the square root of its MSE (denoted by RMSE and called”root mean square error”). The smaller the MSE of an
estimate, the greater is its accuracy.
Instructor: C. L. Williams MthSc 406

Use of Sample Surveys
Simple Random Sample(SRS)-Total ways
T =25!
(5!) (25 − 5!)
Instructor: C. L. Williams MthSc 406

Use of Sample Surveys
SRS-Probabilty not being included
Probabilty not being included =
(N − 1
n
)
(Nn
)
Instructor: C. L. Williams MthSc 406

Use of Sample Surveys
SRS-Probabilty being included
= 1 −(
N − n
N
)
=( n
N
)
Instructor: C. L. Williams MthSc 406
Use of Sample Surveys
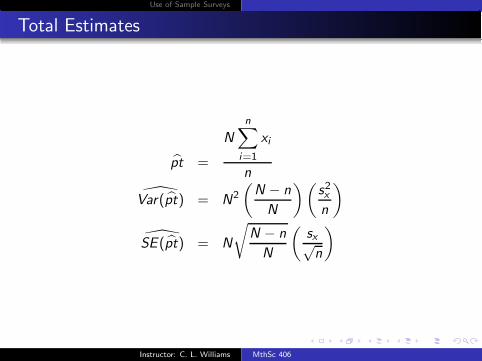
Total Estimates
pt =
N
n∑
i=1
xi
n
Var(pt) = N2
(N − n
N
)(s2x
n
)
SE (pt) = N
√N − n
N
(sx√n
)
Instructor: C. L. Williams MthSc 406

Use of Sample Surveys
Mean Estimates
x =
n∑
i=1
xi
n
Var(x) =
(N − n
N
)(s2x
n
)
SE (x) =
√N − n
N
(sx√n
)
Instructor: C. L. Williams MthSc 406

Use of Sample Surveys
Proportion Estimates
py =
n∑
i=1
yi
n
Var (py ) =
(N − n
N
)py (1 − py )
n − 1
SE (py ) =
√(N − n
N
)√py (1 − py )
n − 1
Instructor: C. L. Williams MthSc 406

Use of Sample Surveys
Simple Random Sampling
Schools in Sample Totali Schools in Sample Totali1,2,3 24 2,3,4 221,2,4 24 2,3,5 301,2,5 32 2,3,6 321,2,6 34 2,4,5 301.3,4 20 2,4,6 321,3,5 28 2,5,6 401,3.6 30 3,4,5 261,4,5 28 3,4,6 281,4.6 30 3,5,6 361,5,6 38 4,5,6 36
Instructor: C. L. Williams MthSc 406

Use of Sample Surveys
Totali fi πi = fiT
20 1 .0522 1 .0524 2 .1026 1 .0528 3 .1530 4 .2032 3 .1534 1 .0536 2 .1038 1 .0540 1 .05
Total 20 1.00
Instructor: C. L. Williams MthSc 406
Use of Sample Surveys
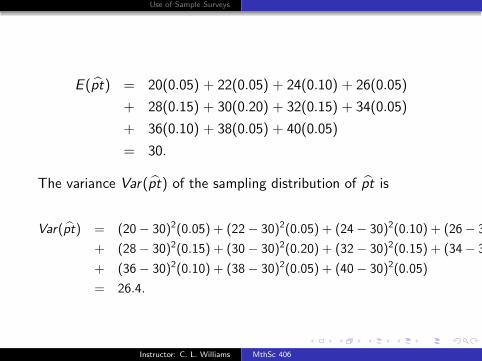
E (pt) = 20(0.05) + 22(0.05) + 24(0.10) + 26(0.05)
+ 28(0.15) + 30(0.20) + 32(0.15) + 34(0.05)
+ 36(0.10) + 38(0.05) + 40(0.05)
= 30.
The variance Var(pt) of the sampling distribution of pt is
Var(pt) = (20 − 30)2(0.05) + (22 − 30)2(0.05) + (24 − 30)2(0.10) + (26 − 30)
+ (28 − 30)2(0.15) + (30 − 30)2(0.20) + (32 − 30)2(0.15) + (34 − 30)
+ (36 − 30)2(0.10) + (38 − 30)2(0.05) + (40 − 30)2(0.05)
= 26.4.
Instructor: C. L. Williams MthSc 406

Use of Sample Surveys
Thus, we see that for simple random sampling, the estimatedpopulation total, pt, is an unbiased estimate of the populationtotal pt. The standard error of pt given by the equation above isdirectly proportional to σpt , the standard deviation of thedistribution of PT the population total, in the population, andinversely proportional to the square root of the sample size, n.
Instructor: C. L. Williams MthSc 406
Use of Sample Surveys
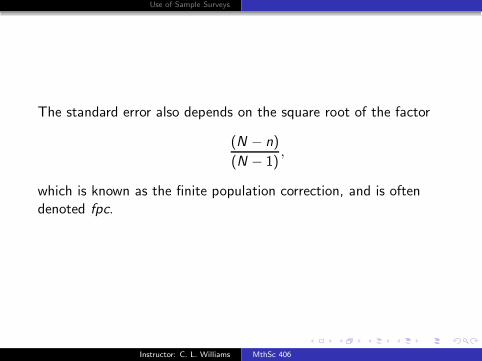
The standard error also depends on the square root of the factor
(N − n)
(N − 1),
which is known as the finite population correction, and is oftendenoted fpc.
Instructor: C. L. Williams MthSc 406

Use of Sample Surveys
We can obtain some insight into the role played by the fpc byexamining its value for a hypothetical population containing N =10,000 elements and for sample sizes as given in Table 3.3. Fromthis table we see that if the sample size, n, is very much less thanthe population size, N, then the fpc is very close to unity and thuswill have very little influence on the numerical value of thestandard error SE(pt) of the estimated total, pt. On the otherhand, as n gets closer to N, the fpc decreases in magnitude andthus will cause a reduction in the value of SE(pt)
Instructor: C. L. Williams MthSc 406

Use of Sample Surveys
fpc
can be re-written as
√fpc =
√N − n
N − 1
=
√N
N − 1×√
1 −n
N
so for increasing sample sizes. . .
Sample Size,n fpc =√
N−nN−1
1 1.000010 .9995100 .9950500 .97471000 .94875000 .70719000 .3162
Instructor: C. L. Williams MthSc 406

Use of Sample Surveys
Total Estimates
pt =
Nn∑
i=1
pti
n
Var(pt) = N2
(N − n
N − 1
)(σ2
pt
n
)
SE (pt) = N
√N − n
N − 1
(σx√
n
)
Instructor: C. L. Williams MthSc 406
Use of Sample Surveys
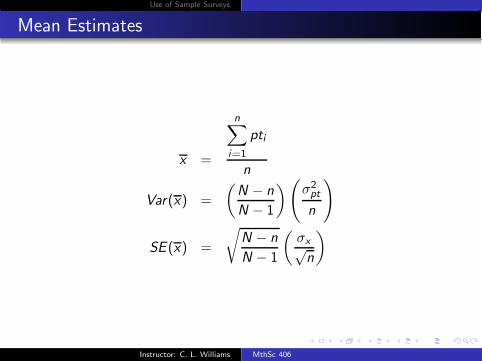
Mean Estimates
x =
n∑
i=1
pti
n
Var(x) =
(N − n
N − 1
)(σ2
pt
n
)
SE (x) =
√N − n
N − 1
(σx√
n
)
Instructor: C. L. Williams MthSc 406

Use of Sample Surveys
Proportion Estimates
py =
n∑
i=1
yi
n
Var (py ) =
(N − n
N
)Py (1 − Py )
n − 1
SE (py ) =
√(N − n
N − 1
)√Py (1 − Py )
n
Instructor: C. L. Williams MthSc 406
Use of Sample Surveys
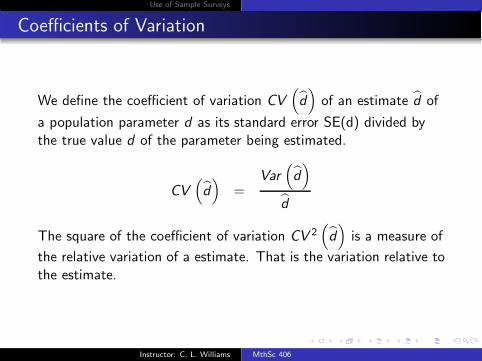
Coefficients of Variation
We define the coefficient of variation CV(d)
of an estimate d of
a population parameter d as its standard error SE(d) divided bythe true value d of the parameter being estimated.
CV(d)
=Var
(d)
d
The square of the coefficient of variation CV 2(d)
is a measure of
the relative variation of a estimate. That is the variation relative tothe estimate.
Instructor: C. L. Williams MthSc 406

Use of Sample Surveys
Define
CV (PT ) =σPT
X
then
CV (pt) =
(CV (PT )√
n
)√N − n
N − 1
CV (x) =
(CV (PT )√
n
)√N − n
N − 1
CV (py ) =
(1 − Py√
nPy
)√N − n
N − 1
Instructor: C. L. Williams MthSc 406

Use of Sample Surveys
reliability of Estimates
The standard error of an estimate is a measure of the samplingvariability of the estimate over all possible samples. Under theassumption that measurement error is nonexistent or negligible, thereliability of an estimate can be judged by the size of the standarderror; the larger the standard error, the lower is the reliability ofthe estimate (see Section 2.4). for reasonably large values of n(say, greater than 20), distributions that are close to the normal orGaussian distribution, then we can use normal theory to obtainapproximate confidence intervals for the unknown populationparameters being estimated. For example, approximate 100(1 -α)% confidence intervals for the population total are given by
pt ± zα/2(N)
√N − n
N
(spt√
n
)
x ± zα/2
√N − n
N
(spt√
n
)
√ ( )Instructor: C. L. Williams MthSc 406

Use of Sample Surveys
Text Example
sample total = 44
spt = 3.48
pt =
(25
9
)(44)
= 122.22
so that the confidence interval is given by:
122.22 ± 1.96(25)
√25 − 9
25
(3.48√
9
)
→ 122.22 ± 45.47
→ (76.75, 167.69)
Instructor: C. L. Williams MthSc 406

Use of Sample Surveys
Note that the true population total, PT = 127, is covered by thisconfidence interval. These 95% confidence intervals have thefollowing usual interpretation: if we were to repeatedly sample nelements from this population according to the same samplingplan, and if, for each sample, confidence intervals were calculated,95% of such confidence intervals would include the true unknownpopulation parameter.
Instructor: C. L. Williams MthSc 406

Use of Sample Surveys
If the variable has a nearly symmetric distribution and the samplesize is not small, then the confidence coefficients expressed in theconfidence intervals will be approximately correct. If the data arebadly skewed, however, and the sample size is small, theconfidence coefficients may be misleading (Exercise 3.1 illustratesthe situation using the data in Table 2.1).
Instructor: C. L. Williams MthSc 406
Use of Sample Surveys
Indicator functions
Y =
{10
Instructor: C. L. Williams MthSc 406
Use of Sample Surveys
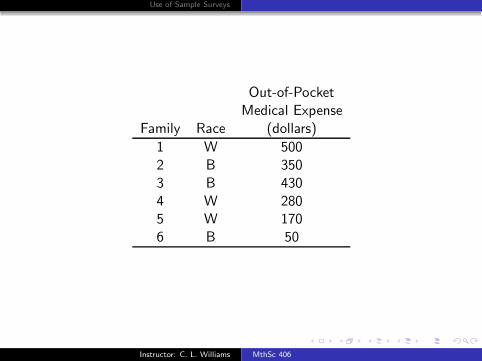
Out-of-PocketMedical Expense
Family Race (dollars)
1 W 5002 B 3503 B 4304 W 2805 W 1706 B 50
Instructor: C. L. Williams MthSc 406

Use of Sample Surveys
Population characteristics for Z/Y
Z
Y=
$830
3
Instructor: C. L. Williams MthSc 406

Use of Sample Surveys
Out-of-PocketMedical Expense
Family Race (dollars Xi ) Yi Zi
1 W 500 0 02 B 350 1 3503 B 430 1 4304 W 280 0 05 W 170 0 06 B 50 1 50
Yi =
{1 African american family0 Caucasian family
Instructor: C. L. Williams MthSc 406

Use of Sample Surveys
Given the sampling distibution
Sample Elements z y z/y∗
1,2,3,4 780 2 3901,2,3,5 780 2 3901,2,3,6 830 3 276.671,2,4,5 350 1 3501,2,4,6 400 2 2001,2,5,6 400 2 2001,3,4,5 430 1 4301,3,4,6 480 2 2401,3.5,6 480 2 2401.4,5,6 50 1 502,3,4,5 780 2 3902,3,4,6 830 3 276.672,3,5,6 830 3 276.672,4,5,6 400 2 2003,4,5,6 480 2 240
Instructor: C. L. Williams MthSc 406

Use of Sample Surveys
Using complementary indicator function
Out-of-PocketMedical Expense
Family Race (dollars Xi ) Yi Zi
1 W 500 1 5002 B 350 0 03 B 430 0 04 W 280 1 2805 W 170 1 1706 B 50 0 0
Yi =
{1 Caucasian family0 African american family
Instructor: C. L. Williams MthSc 406

Use of Sample Surveys
SE
(z
y
)=
[σz√E (y)
]×√
Y − E (y)
Y − 1
where
σz =
√√√√√√√√√√
Y∑
i=1
(Zi − Z
)2
Y
Instructor: C. L. Williams MthSc 406

Use of Sample Surveys
Standard Error Estimate
SE
(z
y
)=
[σz√pty
]×
√pty − pty
pty − 1
Instructor: C. L. Williams MthSc 406

Use of Sample Surveys
Text Example For example, suppose that from a hospital admitting20,000 patients annually, a survey of hospital patients is to betaken for the purpose of determining the proportion of the 20,000patients that received optimal care as defined by specifiedstandards. The quality care review committee planning the surveymay feel that some remedial action should be taken if fewer than80% of the patients are receiving optimal care. In this instance,the committee would be concerned about overestimates of the trueproportion, but would probably not be too concerned if theestimated proportion were 80% when the true propor- tion were75%. The statistician might formulate this by saying that the userwould like to be ”virtually certain” that the estimated proportiondiffers from the true proportion by no more than l00[80-75)/75]%or 6.67% of the true proportion.
Instructor: C. L. Williams MthSc 406

Use of Sample Surveys
3 × SE (py ) = 3 ×√
Py (1 − Py )
n
√N − n
N − 1
→ 3 × SE (py ) ≤ 0.0667Py
→ 3 ×√
Py (1 − Py )
n
√N − n
N − 1≤ 0.0667Py
or
n ≥9NPy (1 − Py )
(N − 1) (0.667)2P2y + 9Py (1 − Py )
Instructor: C. L. Williams MthSc 406

Use of Sample Surveys
So setting Py=0.80 and N=20,000
n ≥9(20, 000)(0.80) (0.20)
(19, 999) (0.0667)2(0.80)2 + 9(0.80) (0.20)
n ≥ 493.295or 494.
See Box 3.5 for the Exact and approximate Sample size Requiredunder simple random sampling
Instructor: C. L. Williams MthSc 406
Use of Sample Surveys
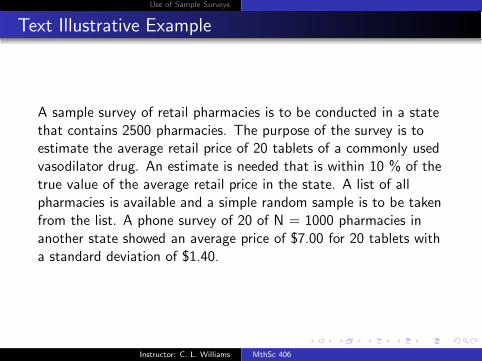
Text Illustrative Example
A sample survey of retail pharmacies is to be conducted in a statethat contains 2500 pharmacies. The purpose of the survey is toestimate the average retail price of 20 tablets of a commonly usedvasodilator drug. An estimate is needed that is within 10 % of thetrue value of the average retail price in the state. A list of allpharmacies is available and a simple random sample is to be takenfrom the list. A phone survey of 20 of N = 1000 pharmacies inanother state showed an average price of $7.00 for 20 tablets witha standard deviation of $1.40.
Instructor: C. L. Williams MthSc 406

Use of Sample Surveys
CV (x)2 =[(N − 1)/N]s2
x
x2
=[999/1000](1.4)2
(7.00)2
= 0.04
Instructor: C. L. Williams MthSc 406

Use of Sample Surveys
with a tiny ǫ = 0.1 and N=2500. Using the exact formula fromBox 3.5
n =9(2500)(0.04)
9(0.04) + 2499(0.1)2
= 35.6
≈ 36.
Instructor: C. L. Williams MthSc 406