SAMPLING: THE IMPACT ON COSTS AND DECISION MAKING … · SAMPLING: THE IMPACT ON COSTS AND DECISION...
17
The Southern Ajl-ican Insritute of Mining and lvfetallurgy Analytical Challenges in lv!etallurgy Prof ReA lv!innitt SAMPLING: THE IMPACT ON COSTS AND DECISION MAKING Professor ReA Minnitt School of Mining Engineering, University of the Witwatersrand, Private Bag 3, WITS. 2050. Telephone: 011 7177416, Fax 082 481 2357, e-mail: [email protected] SAMPLING: THE IMPACT ON COSTS AND DECISION MAKING 1. INTRODUCTION For years those in the minerals industry have been taking samples to assist them in making decisions; whether they be about investing billions of rand in a new mining operation, or simply whether a truck load of mineralised material should go to the mill or the waste dump, - we need a sample to help us make our decisions. This paper emphasises the impOliance and significance of sampling as a process, some of the associated technical problems and some of the advantages, especially in the light of traditional approaches that has usually left mine sampling to the least educated and lowest paid individuals on the mine. Figure 1: The hierarchy of the mineral development process Page 1
Transcript of SAMPLING: THE IMPACT ON COSTS AND DECISION MAKING … · SAMPLING: THE IMPACT ON COSTS AND DECISION...
The Southern Ajl-ican Insritute of Mining and lvfetallurgy Analytical Challenges in lv!etallurgy Prof ReA lv!innitt
SAMPLING: THE IMPACT ON COSTS AND DECISION MAKING
Professor ReA Minnitt School of Mining Engineering, University of the Witwatersrand,
Private Bag 3, WITS. 2050. Telephone: 011 7177416, Fax 082 481 2357, e-mail: [email protected]
SAMPLING: THE IMPACT ON COSTS AND DECISION MAKING
1. INTRODUCTION
For years those in the minerals industry have been taking samples to assist them in making decisions; whether they be about investing billions of rand in a new mining operation, or simply whether a truck load of mineralised material should go to the mill or the waste dump, -we need a sample to help us make our decisions. This paper emphasises the impOliance and significance of sampling as a process, some of the associated technical problems and some of the advantages, especially in the light of traditional approaches that has usually left mine sampling to the least educated and lowest paid individuals on the mine.
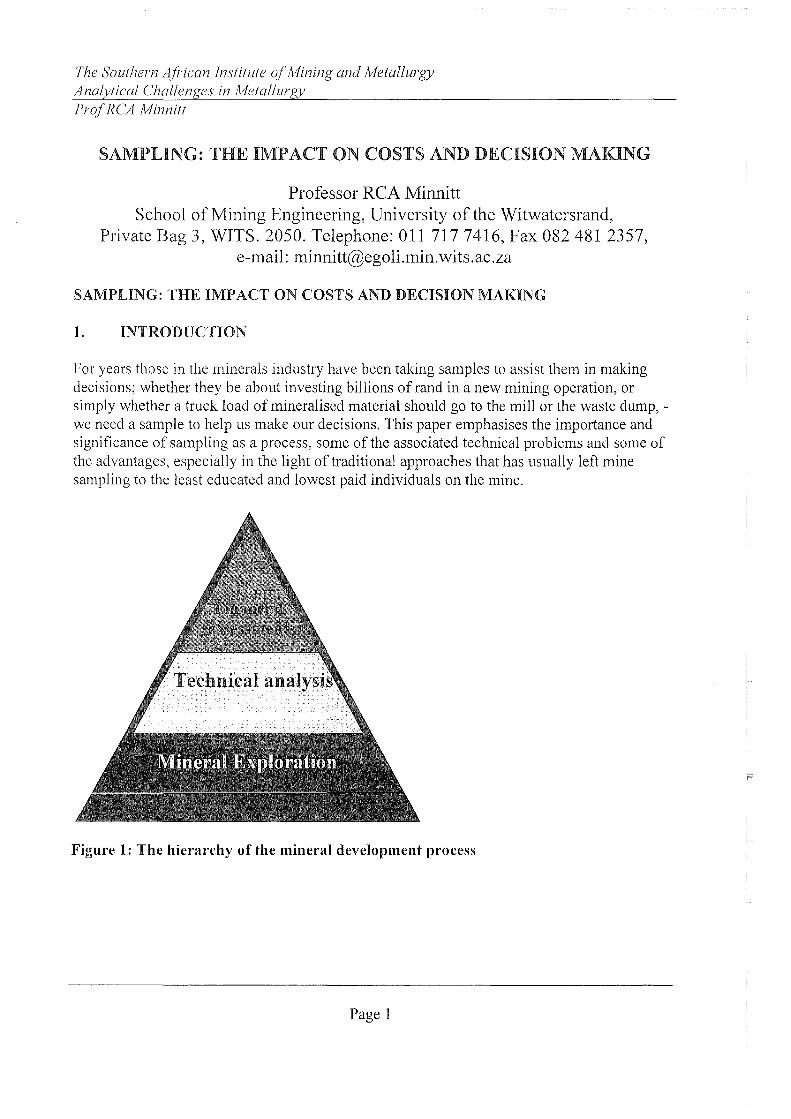
Figure 1: The hierarchy of the mineral development process
Page 1
The Southern African Institute of Mining and Metallurgy Ana~vtical Challenges in Metallurgy Prof RCA Minnitt
Perhaps the most important aspect that requires attention is the variability, usually measured in terms of precision, that tends to infect the sampling procedures. Francis Pitard 12 has stated: "There is no such thing as reliable feasibility studies, unbiased ore grade control, accurate environmental assessments or effective process control, if you cannot identifj! and minimize the seven (ten) major sources of sampling variability. " It is these ten sources of sampling variability and the way they arise that are briefly investigated. Variability is measured in tern1S ofvariances and rather than being self-compensating, there is good evidence to indicate that they are in fact additive at every step in the sampling and analytical process.
2. MINERAL DEVELPOMENT PROCESS
The three main processes in mineral development that include exploration, followed by technical analysis, and the financial assessment and valuation of the returns that such an investment might yield are shown in Figure 1. The processes are stacked in a triangle which is aimed at suggesting that studies at the base of the triangle should receive proportionally more time, effort and cost than the steps that follow. Some have tenned this early expenditure of time and effort 'front end loading' and have shown that the greater the expenditure of resources at this stage, the more likely a successful project is to deliver bonanza-type returns. However it is essential to remember that uncertainties embedded in the outputs of each stage of the process are transmitted through the process, which outputs become the inputs for the next step in the hierarchy. However, like "Men in Black" the simple act of passing infonnation to the next level erases all memory of the uncertainty that accompanied the production ofthat output.
This does not mean that the uncertainty no longer exists. It has somehow wonned its way into the belly-button of our output and is no longer identifiable, but lurks within waiting for an opportune time, usually the first year of production, to manifest itself. Perhaps our biggest challenge is not getting each step right, but having the courage to attach a label to each output saying "This product if flawed".
I Pitard, F.F. 1993. Pierre Gy's Sampling Theory and Sampling Practice. Textbook published by CRC Press, Inc., 2000
Corporate Blvd., N. W. Boca Ratan, Florida 33431. Second edition, July 1993.
e.o. Ingamells and F.F. Pitard. "Applied Geochemical Analysis" Volume 88. Chemical Analysis A series of monographs
on Analytical Chemistry and its applications. A Wiley-Interscience Publication. John Wiley & Sons. 1986.
2 Pitard, F.F. 2002. Practical and theoretical difficulties when sampling gold. SME, M ineral Processing Plant Design, Practice,
and Control proceedings. Volume I. October 2002.
Page 2

The Southern African Institute of Mining and Metallurgy Analytical Challenges in Metallurgy ProfRCA Minnitt
The fault also lies with the recipients of our product who eagerly await the next stage of the process. They gladly receive the output and are only too happy to use it as pristine and flawless infonnation. Besides which, there is no clear instruction about how this embedded uncertainty in the information they receive should be accommodated or incorporated in their analyses.
When failure does occur, as it is bound to at some stage, we send auditors in whom we believe will be able, on the basis of their inspection, to introduce quality into the process. This is a futile exercise. As Deming has shown in his famous red-bead experiment, it is impossible to inspect quality into a process. The premise that inspection will improve a production process is flawed. Only by ensuring that a processes is robust, will production improve. What an honest auditor should say is that the system you have in place is perfectly designed to give the results you are achieving.
3. SAMPLING IN THE TECHNICAL ANALYSIS
Details of Pierre Gy's34 theory is only now being taught at undergraduate level at Universities and most of the baby-boomers and even the X-generation would not have a good grasp ofthe concepts, theory, notation and tenninology of Gy' s approach to sampling.
Sampling variability is a function of the sampling characteristics of the ore, the spatial distribution of the samples and the geologicaVstructural setting of the ore body. In addition there is a range of different types of samples used at different points in the mining operation, such as drillhole, stope face, go-belt or grade control. In each case we must know why the sample is being collected. What the specific characteristics and behaviors of the sample is that is being collected, and what kinds of infonnation can be derived from the data.
There are many questions needing answers concerning the sampling procedures and processes. For example, How good a sample is 1 kg ofrock with 1 cm top-size fragments? lfthe lab crushes my gold ore sample to 10 mesh (1.7 mm) and takes a 500 g split, is this always OK? How would the lab know? How much money should be spent on sampling and sampling equipment? And What is the impact oflousy sampling and assaying on the annual profit of a mine? For a typical sampling event on a mine the question might be "How do we go from a 50t truck load of ore to a 50g aliquot for a fire assay, without losing precision". This will probably involve seven or eight steps along the way and each step must aim to preserve the integrity of the sample.
In order to replace these questions with confident answers about the sampling procedure a
}Gy, P.M. 1992. Sampling of Heterogeneous and Dynamic Material Systems: Theories of Heterogeneity, Sampling and
Homogenizing. Amsterdam, Elsevier, 1992.
4 Gy, P.M. 1983 Sampling of Particulate Materials - Theory and Practice. Elsevier Scientific Publishing Company. Developments in Geomathematics 4. 1983.
Page 3

The Southern African Institute of Mining and Metallurgy Analytical Challenges in Metallurgy Prof RCA Minnitt
sampling nomogram is required that describes and summarizes the relationship between the fragment size, the mass of the sample relative to the mass ofthe lot and the relative variance that can be anticipated. An example of such a nomogram is shown in Figure 2.
Heterogeneity Test: Sampling of blastholes at the quarry (% 5102) om ,....",.--.;---~---.:-t---.;;:-----r<;:--"::"---,::---'~--.----r------,
i 1 ,Qe.4 +<-.....::..c-~-p...;---~-~.........;:,";:"--tc------''''::-t_--' ,~ III ~ UJ bl. NI 1 .Oe·5 +----~-'>.~~..p.,;:__..>..,;---:-~"II_"'_.:_---'~__lII__'~t_---"',C_____1~r_-__"I (j)
0,'1 '10 100 1000
M_s(grams)
lambda ~ 2.5 d" 1.05 P ~ 50 f ~ O.S dpo~ = O.S K "0.93 N" 100 xbar" 8.236e-2 ,,_21< '" 2.4614
1 ,Oe4 1,Oe:5 1,Oeo
Safety line 2.5e.3
- Dlist
_ InputPsth
Figure 2: Sampling nomogram for %Si02 showing the relationship between variance and sample mass
The most important objective in the sampling process is to obtain a representative sample, something we can only achieve through random sampling. The random sample must be one that is unbiased. However while it is easy it is to demonstrate that a bias exists, it is theoretically impossible to demonstrate its absence. Poor sampling protocols lead to the introduction of random errors and biases, and try as you may, what we normally get will probably be inaccurate and imprecise. Figure 3 illustrates the idealised concepts relating to accuracy and precision, the ideal sample being one that is both accurate and precise. In reality this rarely happens.
It cannot be overemphasised that what we want is statistically random sampling: This means that "every particle ill the lot has the same challce as every other particle ill the lot of being ill the sample", but the application of this principle is more difficult to implement than it appears.
The SAMREC Code requires that the CP be fully aware ofthe sampling errors and that he is
Page 4

The Southern A/ham Institute a/Mining and Jvfetallurgy Analytical Challenges in Jvfetallurgy Pro/RCA A1innitt
satisfied that they have been identified and mitigated. Not only that, but he will have to ensure that QA/QC verification has been undetiaken for all assays and analyses. As our appreciation of the problems associated with sampling deepens, it is becoming evident that this is a realm of enormous uncertainty in many mining operations.
Accurate & Imprecise
Accuracy (Mean close
to true value, unbiased)
+
What you get: Real Life l
Biased, inaccurate, variable
Inaccurate & Imprecise
Inaccurate & Precise
Reproducibility (Variance, biased)
Figure 3: Concepts relating accuracy and precision
Accurate & Precise
What you want: Representativeness; Unbiased, accurate
4. THE SAMPLING PROTOCOL IN TECHNICAL EVALUATION
A significant problem faced by the mining industry is the aspect ofreconciliation, which is measured in different ways at the various points along the mining-beneficiation route. Examples of reconciliation points include the Mine Call Factor, the balance between residues, tails and the metallic product, the audit of product versus customer specifications, and the overall reconciliation, mass balance and metal accounting thorough the plant. This can often lead to endless meetings to solve puzzles, arguments and finger pointing, correcting factors are applied until data fit normality, geologists and geostatisticians cannot do their work, miners and metallurgists are at war, the company's performance deteriorates, management is not happy and to cap it all the market share value goes down. But this unhappy process can be reversed through education and training in the theory and methods of sampling for those involved and affected by the sampling outputs. This would include management, board members, shareholders, geologists, drillers, miners, metallurgists, analytical chemists,
Page 5

The Southern African Institute of Mining and Metallurgy Analytical Challenges in Metallurgy Prof RCA Minnitt
statisticians, and dare I say it, even the sales staff. Detailed understanding may not be necessary for everyone, but a good look at correct sampling protocols together with data verification can lead to improved metal recovery, closer reconciliation between mineral inventory estimates and metal output, which in turn lead to better cash flows, enhanced profits and added share value.
Generally sampling conducted on mining operations is a highly structured procedure or protocol, with the sampler knowing exactly what is required of him. He identifies the reef, the footwall and hanging wall and using either a diamond saw or a chisel he then cuts a channel, ensuring that exactly two cm of material are collected in the waste rock on either side of the reef. Depending on the difference in hardness and friability across the reef he will take either more or less of certain parts ofthe reef, and fill a bag with about 200 - 300g of reef material.
While this part of the protocol is rigid and fixed in most samplers' minds, it is unlikely that he knows that the aim and object of the exercise is to collect a truly representative sample, to minimise bias, and to minimise the variance. Beyond this point the sampler is probably oblivious of what takes place in the laboratory and how important his first steps in simply collecting the reef sample are to a meaningful outcome of the sampling process. This of course is just one sampling position and many different types of samples, including solids and liquids occur at many different localities in a mining and milling operation.
A relatively important aspect to the sampling protocol is that those involved understand the need for and the importance of the sampling nomogram. This statement is the optimal balance between the mass of the sample, the degree of comminution, the effort expended on splitting and division and ultimately arriving at a sampling aliquot that has followed a route that minimizes the variance. But all this takes time, and time is money.
Any sampling protocol should seek to optimise the processes of sample delineation, sample extraction, sample preparation and sample analysis, providing exact information about the mass of material required for the sample, the degree of comminution, the degree of division, and ultimately the mass of the aliquot of material for final analysis. Those taking the samples need to be aware of the total procedure if their sampling is to be guided in an educated manner. However it is essential that the sampling parameters that characterise the reefbe fully understood.
5. THE SCALE OF VARIABILITY
The quote from Francis Pitard highlights the importance of understanding variability. Understanding the total variability requires that we split the variance up into its component parts and evaluate each one individually. Pierre Gy initially identified that there is a smallscale component and a large-scale component of variability. The small scale component is related to the nature of the ores and specifically what we refer to as the constitutional and the distributional heterogeneity ofthe ores. It is these characteristics that give rise to the Fundamental Error (FE), the Nugget Effect (NE) and the Grouping-Segregation Errors (GE). Understanding of these types of variability enables us to both compile and implement
Page 6

The Southern African Institute of Mining and Metallurgy Analytical Challenges in Metallurgy Prof RCA NJinnitt
optimised sampling protocols. The important issue in regard to small scale variability is that having once established an optimal sampling protocol, the protocol must be implemented; in other words its no good just hearing about this good news, you must do it as well!
While large scale variability is closely linked to the sampling characteristics of the ore, it also involves local and regional trends and structures in exploration, patterns of variation in longterm mine and mill related processes of materials balance, reconciliation and metal accounting, and statistical process control related to product specifications and trade in commodities. The importance of the large scale variability in understanding metallurgical plant behaviour and metallurgical balances is starting to be appreciated through the application of the semi-variogram to the analysis of problems in the process plant. The range and types of errors that have been identified in the sampling procedure are shown in Figure 4.
1. The Nugget Effect (NE)
2. Fundamental error (FSE)
3. Grouping/segregation Error (GSE)
4. Delimitation Error (DE)
5. Extraction Error (EE)
6. Weighting Error (WE)
7. Preparation Error (PE)
8. Analytical Error (AE)
9. Non-periodic process variation (QEl)
10. Periodic process variation (QE2)
Figure 4: The ten sampling errors of Pierre Gy, their source and area s of influence
In diagrammatic fashion (Figure 5) Francis Pitard5 (2005) has shown how these errors relate to one another. These are accumulated variances at different levels with heterogeneity (a combination of the fundamental error, the grouping and segregation error, and the nugget effect due to coarse-grained gold), being the core variance. The delimitation and extraction
5 F.F. Pitard 1993. Exploration of the "Nugget Effect", Geostatistics for the Next Century, An International Forum in Honor of
Michel David's Contribution to Geostatistics, Montreal, 1993. Edited by Roussos Dimitrakopoulos, McGill University.
Kluwer Academic Publishers, Boston.
Page 7

The Southern African Institute of Mining and Metallurgy Analytical Challenges in lvfetallurgy Prof ReA Minnitt
errors, the weighting and preparation errors, as well as the analytical error are also contributors.
Of special note here is the term V[O] which Pitard (2005) identified, as being the receptacle for all ear-marked sampling errors as well as all random, stray, unidentified, and unaccounted for errors that arise during the sampling process.
11 n
Francis Pitard's drawing protected by copyright law, 2004
n
n
17
11
Figure 5: Relationship between the eight small-scale errors of Pierre Gy. Source: Pitard, 20066
The term commonly referred to as the nugget effect in geostatistics is therefore more than simply "inherent random variation"; it includes the components of sampling elTor and specifically - a high nugget effect may be telling you that your sampling elTors are significant. According to Pitard (226) the In-situ Nugget Effect therefore includes the inherent random variability, correctly identified by geostatisticians as the Nugget Effect, a variance associated with the specific ore type, but he also identified the fact that it becomes a dumping ground and receptacle for all other types of errors, some of which may be large.
The formula that Pierre Gy is famous for relates the variance of the Fundamental Error to the product of a series of sampling constants (clfg) and the nominal fragment size, divided by the mass of the sample. So the variance is directly proportional to the size of the fragments and inversely proporiional to the mass of the sample as shown in the equation below.
(, Pitard, FF. 2006. Sampling Theory and Methods, A short Course presented at the University of the Witwatersrand, 2006.
Page 8

The Southern African Institute of Mining and Metallurgy Analytical Challenges in Metallurgy Prof RCA Minnitt
A sampling nomograph allows one to present and interpret the relationships among the three main variables namely the relative variance, the fragment size, and the mass of the sample on a two dimensional chart. Some ofthe constants used in Gis Formula are sample specific and can be determined by performing what is known as the 'Heterogeneity Test', a gold deportment study, and some basic mineralogy. With theses kinds of information it is possible to compile a sampling nomogram, shown in Figure 2, that provides detailed step-by-step protocol of how the sample should be crushed and split in order to preserve integrity and ensure representivity. The nomogram in Figure 2, provides a specific "recipe", if we can call it that, for crushing and grinding so that the error variance is minimised.
The kind of information that can be derived from the analyses performed during a Heterogeneity Test includes a measure of the variance of fragments at lcm diameter. This allows Gy's formula to be simplified and together with appropriate mineralogical work, it is possible to compile nomograms that specifies the relationship between the nominal fragment size and the mass of material required for the sample as well as indicating the mass of material required to keep the sampling variance below an acceptable threshold as shown in Figure 6.
0.1
~ 0.D1
~ .~
2.. 0.001 w LL :1
1.oe-4
1.oe-5
10e-6
Nomograph
I· ",
'~;:" I~~~" "''..''''
1',,-, "-"
. ' ...... ···f·······, .......... · ,.. . ........ f·······
"
I"" ".
:""
r·
,'''.'' . ".'"
., ...••. ,".. ." ... ,.,,".
"
"' ...... , ... ".".,
1 [I 1 00 1000 1 'oe4 1 .Oe5 1 .Oe6 1 .Oe 7 1 .Oe8 1 .Oe9 1 'oel0
M_s(grams) f = 0.5 lambda = 2.6 g = 0.25 a_Le = 0.05
Figure 6: Relationship between sample variance and sample mass
Smety Line 0.0225
dJLc 0.3 cm
d 2.5 cm
Ms 100 9
Rec. wt. 253.77 9
The careful diligent work ofthe Sampling team, the assay lab, and Assay Lab Manager, who is consistently monitoring the QAlQC audits and processes, cannot be replaced. As a group this segment of the mineral development team provides the base data on which all future decisions are made. If we don't get it right here we don't get it right anywhere.
Having once established the protocol it is essential that it be implemented in an appropriate manner so that we take "The Representative Sample". Implementing the protocol is underlain by the statistical requirement that "any fragment in the lot to be sampled has an equal opportunity to be selected in the sampling event as any other fragment". Furthermore it means
Page 9

The Southern African Institute of Mining and Metallurgy Analytical Challenges in Metallurgy Prof RCA Minnitt
that sample definition (delimitation), extraction, preparation and analysis must follow a rigorous routine that is applied equally to all sample.
6. THE HIDDEN COSTS OF SAMPLING ERRORS
a. The size of samples
Consider the basis on which some ofthe largest capital commitments in the world, that is in the mining industry, are made. A decision to develop a new mining venture would probably cost in the order of R20Bn today, but consider the kinds of information that such decisions are based on .
. . . -l3orehole Locati~ GASP. data ~-t -~~~1
• ~or810jeposrtion
81lUl
7lJOUl
i : -
750Ul 1---~--'+"----~~-'--~-4--""-'
17UlO 10000 21)00 23000
Distance (m)
Figure 7: Layout of borehole positions and boundaries for the GASA set of data
The spread of data shown in Figure 7 is known as the GASA data set, introduced in 1983 as a freely available, three-parameter Jognormally distributed data set of 27 borehole intersections from which geostatisticians could both compare and reproduce one another's results. The area covered by the 27 boreholes has not been calculated in detail, but represents about 24sqkm and let's assume that the reef intersections are Im thick, and that the bulk density of the reefis 2. 78t/m3. The total amount ofreef buried at depth would be about 67Mt.
Assume further that the core is standard NQ type with a diameter of 46mm, meaning that each one meter intersection would weigh about 4.26kg and that in total we would recover about 125kg of reef from the in situ mass of 67Mt. This represents o. six zeros 2% ofthe mass. It's
Page 10

The Southern African Institute of Mining and Metallurgy Analytical Challenges in Metallurgy Prof RCA Minnitt
difficult for us to conceive of just how small that number is so I measured the average auditorium and estimated the volume to be about 9000 cubic meters, that is about 9000 billion cubic cm. A cube with a side of 12cm would give you an idea of just how much material has been extracted to represent the volume ofthis room.
However that's not all. At the end of a very careful preparation protocol the analyst will extract exactly a 30 gram aliquot of material from the finely milled powder for fire assay. 27 such assays would amount to just 810 grams of rock powder. One tonne is equivalent to 1000000g, so 810g is 0.00081t to evaluate 67Mt of rock! Putting that in context means that we are trying to represent the 9000Bn cm3 in this room using a volume about the size of a pinhead!
We may think this is exaggerating, but a bad protocol, incorrectly implemented in regard to blast hole sampling, cost a mine US$ 134,000,000 over a 10-year period, and in another case incorrect sampling ofthe tailings in a floatation plant cost a mine US$ 2,000,000,000 over a 20-year period (Carrasco7
, 2003, WCSBl, Denmark)
b. Imposing a cut-off grade
Imposing a cut-off grade on an ore body means that the Smallest Mining Units (SMU)'s that make up the ore body will be classified as ore or waste. The effect ofmisclassification of SMU's as either ore or waste can have a major impact on recovery, metal produced, and consequently profit. To improve selectivity means defining smaller SMU's or smaller faces. Mines become more expensive to operate, but if if dilution is to be controlled, better quality data are needed.
SMU's are sorted on the basis of their estimated values, but the corresponding true grades are what is actually sent to the mill and whether above cut-off or below cut-off will contribute to the profit. The fact that misclassification is unavoidable, and managements desire to prevent it, may explain the current trend towards massive bulk mining in large open pit mining operations.
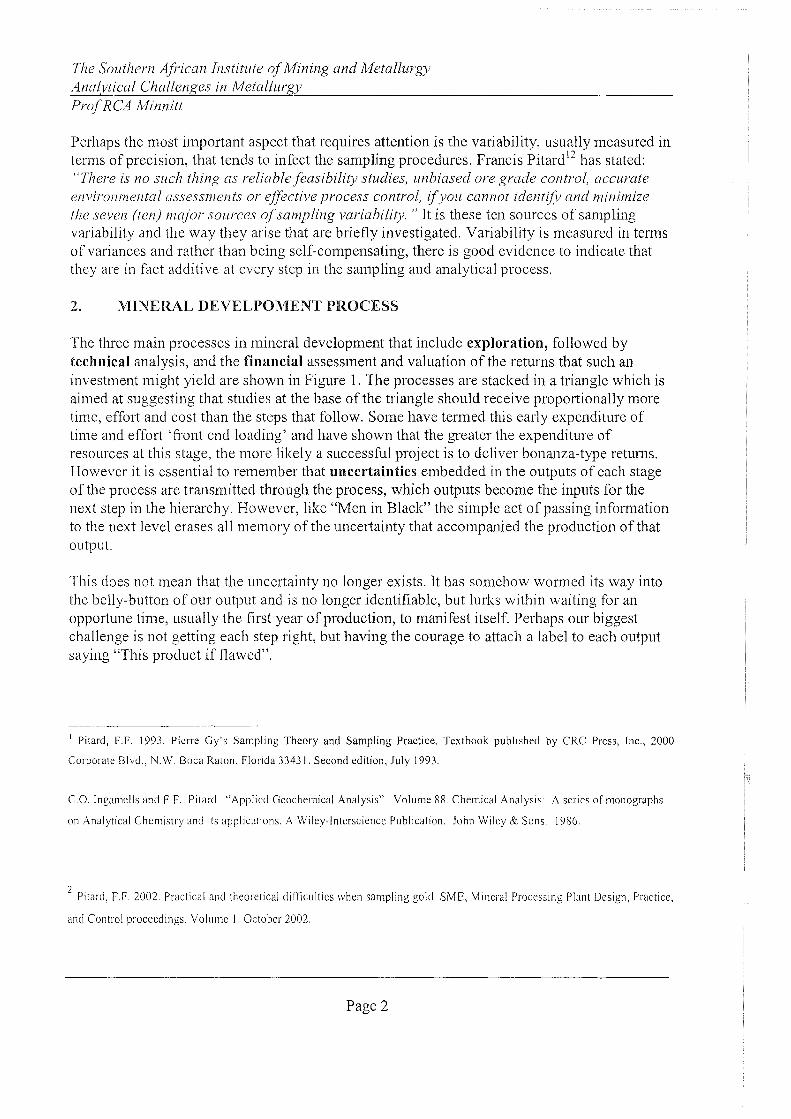
The ellipse shown in Figure 8 encloses duplicate sampling results from a copper mining operation and it illustrates the problem ofmisclassification well (Pitard, 2006). For very rich gold mines, where the average grade is very high, imposing a CIO is entirely unnecessary, but the application of cut-off grades can make the difference between success and failure for some mining operations. However, we would do well to consider the implications and the outcomes of such an action. The effect of imposing a cut-off grade means that the grade distribution of
7 Carrasco Moraga, P.A. 2003 Characterization of the Constitution Heterogeneity of copper in porphyry copper deposits.
Northern Catholic University in Chile. Faculty of engineering and geological sciences. Department of geological sciences.
2003.
Page 11
The Southern African Institute of Mining and Metallurgy Analytical Challenges in Metallurgy Prof RCA Minnitt
mineralised rock is truncated.
Choosing a cut-off grade can be complex problem that involves technical and economic considerations, the mining method, the scale of the mining operation, the size of equipment used in mining selection, the ability to define the cut off boundaries, and physical constraints on access.
S D
El
Pairs Data
Cost of sampling precision = ~444l029l3 Pairs relative standard deviation = 0.5906
Multiple = 2
----
Sample Pairs
SD_A ,,"eroge 1.7665
SD_B overoge 1.5816
PC 1.55
Surf ore 9.8823
Surf misclasslfied 4.3887
Figure 8: Ellipse of variability showing misclassification of ore and waste by imposing a cut-off grade
Selectivity is a function of variability. The greater the variability the greater selectivity required and greater selectivity usually means greater mining costs. It should also mean that higher grade ore is delivered to the mill which translates into greater revenues. While selectivity is a function of mining method and economics, optimal mining means we must find the balance between geological, technical and economic factors of selection.
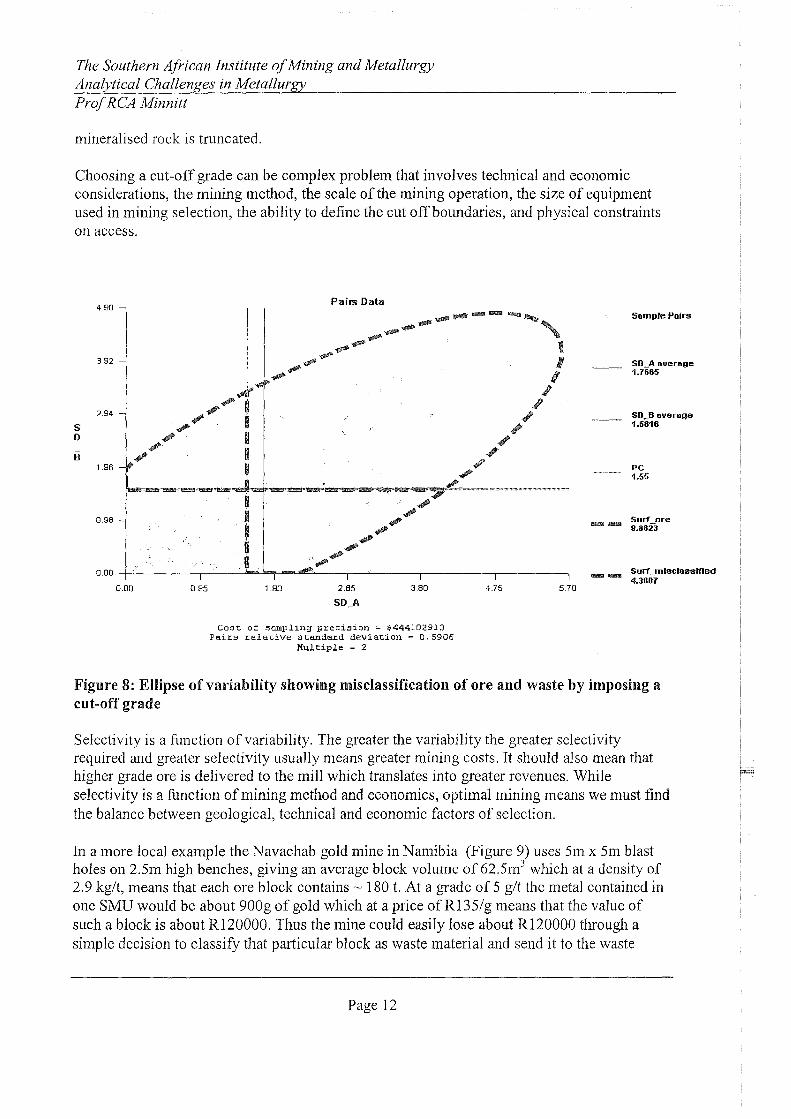
In a more local example the Navachab gold mine in Namibia (Figure 9) uses 5m x 5m blast holes on 2.5m high benches, giving an average block volume of 62.5m3 which at a density of 2.9 kg/t, means that each ore block contains ~ 180 t. At a grade of 5 g/t the metal contained in one SMU would be about 900g of gold which at a price ofR135/g means that the value of such a block is about R120000. Thus the mine could easily lose about Rl20000 through a simple decision to classify that particular block as waste material and send it to the waste
Page 12
The Southern African Institute of Mining and Metallurgy Analytical Challenges in Metallurgy Pro! RCA Minnitt
dump rather than the gold being recovered in the mill. Thus, the cost associated with poor sampling protocols and their implementation can be enormous!
Figure 9: A blast at the Navachab gold mine, Namibia
Poor precision in samples generates huge ore grade misclassification. This is compounded by the desire of management to apply over-selective ore grade cut-offs and feed the mill with ore at an average grade that was determined during the feasibility study. The effects of random variability are such that misc1assification of ore will occur, the higher the cut-off grade the greater is the opportunity for misclassification. When the expected grade is not obtained, management may be tempted to increase the gold grade cut-off. Such reactive decisions drastically reduces the ore reserves and generates much more waste than anticipated.
Page 13
The Southern African Institute of Mining and Metallurgy Analytical Challenges in Metallurgy Prof RCA Minnitt
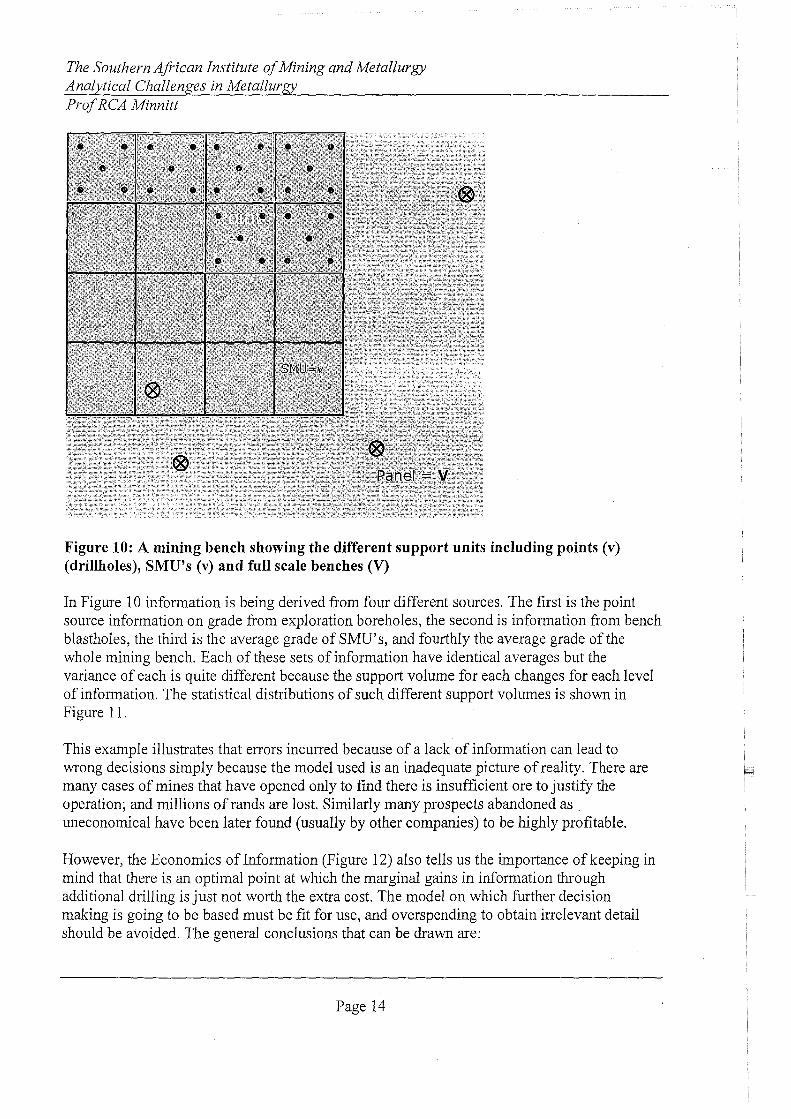
Figure 10: A mining bench showing the different support units including points (v) (drillholes), SMU's (v) and full scale benches (V)
In Figure 10 information is being derived from four different sources. The first is the point source information on grade from exploration boreholes, the second is information from bench blastholes, the third is the average grade of SMU' s, and fourthly the average grade of the whole mining bench. Each of these sets of information have identical averages but the variance of each is quite different because the support volume for each changes for each level of information. The statistical distributions of such different support volumes is shown in Figure 11.
This example illustrates that errors incurred because of a lack of information can lead to wrong decisions simply because the model used is an inadequate picture of reality. There are many cases of mines that have opened only to find there is insufficient ore to justify the operation; and millions of rands are lost. Similarly many prospects abandoned as . uneconomical have been later found (usually by other companies) to be highly profitable.
However, the Economics of Information (Figure 12) also tells us the importance of keeping in mind that there is an optimal point at which the marginal gains in information through additional drilling is just not worth the extra cost. The model on which further decision making is going to be based must be fit for use, and overspending to obtain irrelevant detail should be avoided. The general conclusions that can be drawn are:
Page 14

The Southern African Institute of Mining and Metallurgy Analytical Challenges in Metallurgy Pro! RCA Minnitt
1. Estimations based on sparse sampling yield images, which are significantly different from reality.
2. Estimated images are smoothed versions of reality; the degree of smoothing decrease as the number of samples increases.
3. Estimated images cannot provide the same level of detail as exists in the true image. 4. The consequences of making engineering and economic decisions on the basis of poorly
estimated images of a mineral deposit can be disastrous.
,----0.6 0.5 0.4 0.3 0.2 0.1
o o 2
Figure 11 : Different support volumes with the same mean grade but very different variability
Page 15

The Southern African Institute of Mining and Metallurgy Analytical Challenges in Metallurgy Prof RCA Minnitt
Err or (co st)
Optimum cost
Number of Drillholes
Total cost
Drilling cost
Cost of misinformation
Figure 12: The cost of drilling intersects the cost of misinformation at the optimal number of drill holes
5. CONCLUSIONS
The implementation of the sampling protocol at appropriate points in the mineral operations chain remains a challenge throughout the industry. With a growing understanding and deepening appreciation of Sampling Theory and Methods we stand on the threshold of a new era for implementing and understanding appropriate sampling procedures and protocols (Figure 13). Pitard (2006) has suggested that standardisation through the identification of structural problems and continuous improvement of mining processes be instituted at a national level as shown in Figure 13. This would ensure that standards for best practice, training of personnel at the highest levels and a strongly developed sense of accountability will mean that the nations mineral wealth is optimally developed and exploited.
Page 16

The Southern African Institute of Mining and Metallurgy Analytical Challenges in Metallurgy Prof ReA Minnitt
Director of Standards of Mining Process: The Synergy Necessary for Mining Process Efficiency
\11
/11 Selection of Standards useful to a /11 Selection and offering I: Guidelines of besl mining company of short courses, practices
III Implementation of company's workshops, and training Selection of world experts guidelines
t ,/ ~ -Cdentification of Structural "'
Problems and Continuous Improvement
of Mining Process
t \
Compulsory I ~ccountability actions
-
Communication with Communication with top QA/QC and Laboratory management at a
Managers ""- company's operations
Francis Pitard's drawing protected by copyright law, 2004
Figure 13: Implementation of National standards for mining process efficiency
Page 17