SAMPLING TECHNIQUES Mrs.S. Valarmathi. M.sc., Mphil., Research Officer, Department of Epidemiology...
88
SAMPLING TECHNIQUES Mrs.S. Valarmathi. M.sc., Mphil., Research Officer, Department of Epidemiology The Tamil Nadu Dr. MGR Medical University
-
Upload
kory-heath -
Category
Documents
-
view
218 -
download
5
Transcript of SAMPLING TECHNIQUES Mrs.S. Valarmathi. M.sc., Mphil., Research Officer, Department of Epidemiology...

SAMPLING TECHNIQUES
Mrs.S. Valarmathi. M.sc., Mphil.,Research Officer,Department of Epidemiology The Tamil Nadu Dr. MGR Medical University


Is it possible to taste the whole sambar and add salt
NO
Is it possible to work out what 50 million people think by asking only 1000?
YES

What exactly IS a Population ? The entire group under study as defined by research objectives. Sometimes called the “universe.”
The totality or aggregate of all individuals with the specified characteristics is a population

TYPES OF POPULATION • Finite
• Infinite• Hypothetical

What exactly IS a “sample”?

What exactly IS a “sample”?
A subset of the population.
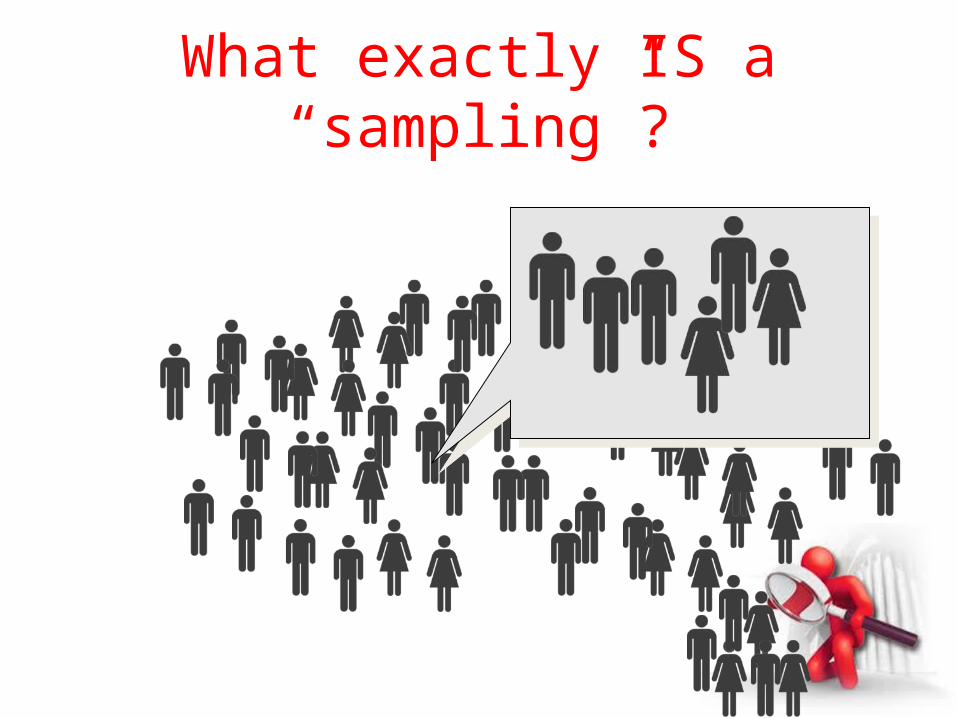
What exactly IS a “sampling”?

What exactly IS a “sampling”?
Selecting and studying a small number of subjects from a
specified population in order to draw inferences about the
whole population

Sampling TerminologyWho do you want to generalize to
THEORETICAL POPULATION

Sampling TerminologyWhat population can you get access to ?
STUDYPOPULATION

Sampling TerminologyWho do you want
to generalize toWhat population can you get access to ?
THEORETICAL POPULATION STUDYPOPULATION

Sampling TerminologyHow Can you get access to them?
SAMPLING FRAME

Sampling TerminologyWho do you want
to generalize toWhat population can you get access to ?
How Can you get access to them?
SAMPLING FRAMETHEORETICAL POPULATION STUDYPOPULATIONTHEORETICAL
POPULATION

Sampling TerminologyWho is in your study?
THE SAMPLE

Sampling TerminologyWho do you
want to generalize to
What population can you get access to ?
How Can you get access to them?
Who is in your study?
THE SAMPLETHEORETICAL POPULATION
STUDYPOPULATION
SAMPLING FRAME
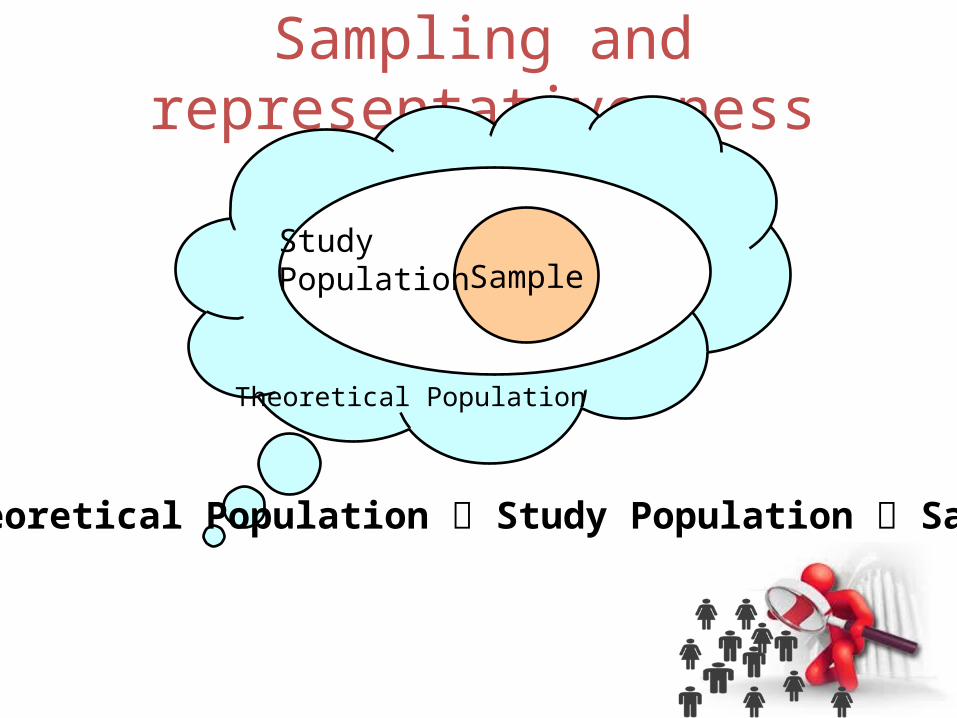
Sampling and representative ness
Sample
Theoretical Population
StudyPopulation
Theoretical Population Study Population Sample

Sampling Fraction
n
N

Sample
• Representativeness express the degree to which the sample data precisely characterize the population.
• Sample should reflect the study character of the population .
• Strength of statistical inference also depends on representativeness.
• Confidence level 95%, 99% for population

Errors
Survey Errors
Random / Sampling Errors
Systematic / Non-sampling Errors
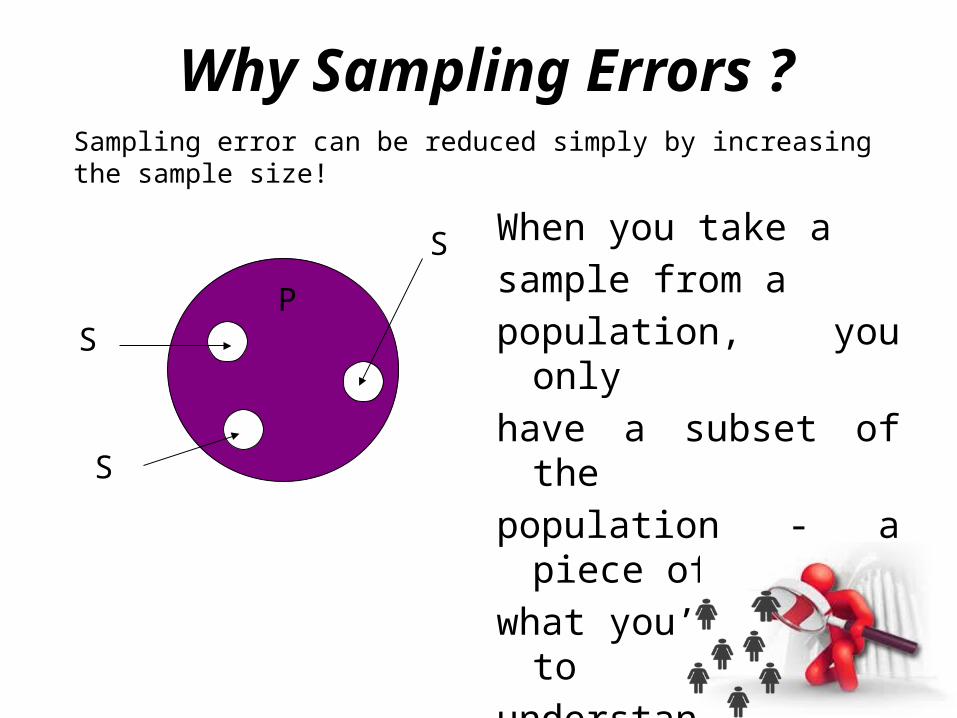
When you take a sample from a population, you only have a subset of the population - a piece of what you’re trying to understand.
S
S
S
P
Why Sampling Errors ?Sampling error can be reduced simply by increasing the sample size!

Standard Error
I Mean
IV Mean
III Mean
II Mean
V Mean
Population Mean

The sampling distribution
• The distribution of an infinite number of samples of the same size as the sample in your study is known as the sampling distribution.

Standard Error
• The standard deviation of the sampling distribution.
• It tells us something about how different samples would be distributed
• A measure of samplingvariability

Systematic / Non-sampling Errors
• Occurs whether a census or a sample is being used.
• Results solely from the manner in which the observations are made.
• Cannot be measured.

Types of Non-sampling Errors
• Coverage error
• Non response error
• Measurement error
Excluded from frame.
Follow up on non responses.
Bad Question!


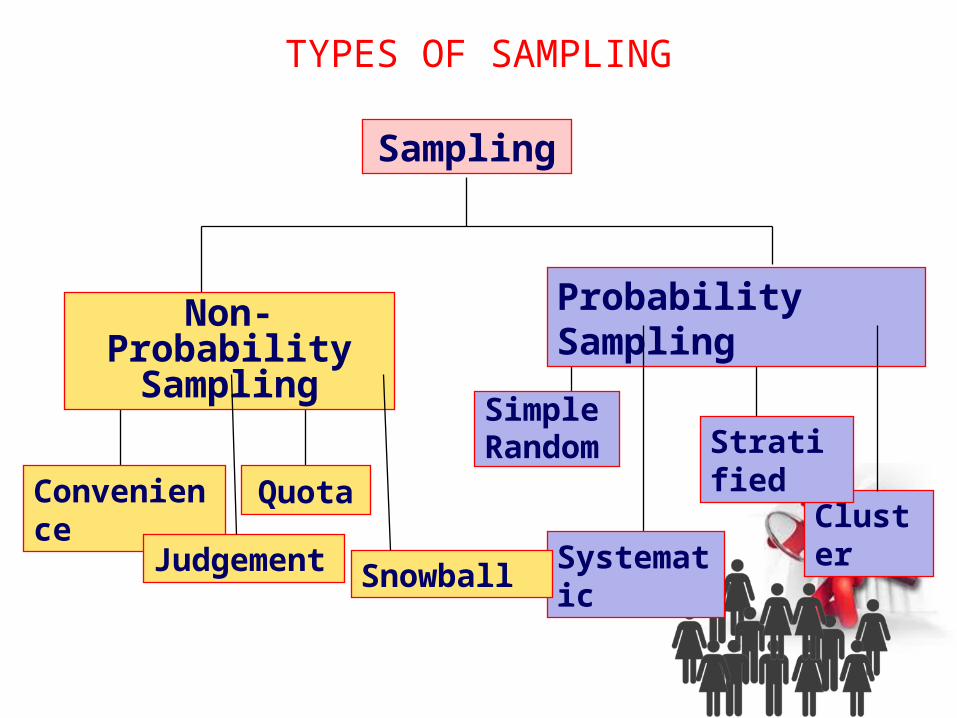
TYPES OF SAMPLING
Sampling
Non-Probability Sampling
Probability Sampling

TYPES OF SAMPLING
•Non-Probability Sampling•Probability Sampling
TYPES OF SAMPLING
Cluster
Sampling
Non-Probability Sampling
Convenience
Probability Sampling
Simple Random
Systematic
Stratified
Quota
Judgement Snowball

Convenience Sampling
The sample is identified primarily by convenience.Examples:
“Man on the street”Medical student in the libraryVolunteer samplesPatient coming to OP
Problem : No evidence for representativeness.
HAPZHARD SAMPLE
Judgment Sampling
The sampling procedure in which an experienced research selects the sample
based on some appropriate characteristic of sample members… to serve a purpose (Purposive sampling, Deliberate sampling)

Quota Sampling
Attempt to be representative by selecting sample elements in proportion to their
known incidence in the population

Snowball samplingTypically used in qualitative researchWhen members of a population are difficult to locate, hidden activity groups, non-cooperative groupsRecruit one respondent, who identifies others, who identify others,….Primarily used for exploratory purposes

Respondent Driven Sampling
• Applicable for Hidden, Hard to reach populations – MSM, IDU
• A systematic form of snowball sampling with unique identification procedure.
• Depends social network of target population• Under certain assumptions may be treated as
a Random sample

Steps involved in RDS
• Begin with a small set of identified seeds.• Seeds recruit peers, who recruit their peers,
etc., continued till required sample size is achieved.
• Recruits are linked by coupons with unique identifying numbers.
• Incentives provided for participation and each successful recruit.

Wave 1 Wave 2 Wave 3 Wave 4 Wave 5
Seed

Wave 1 Wave 2 Wave 3 Wave 4 Wave 5
Seed

Wave 1 Wave 2 Wave 3 Wave 4 Wave 5
Seed

Wave 1 Wave 2 Wave 3 Wave 4 Wave 5
Seed

Wave 1 Wave 2 Wave 3 Wave 4 Wave 5
Seed

Wave 1 Wave 2 Wave 3 Wave 4 Wave 5
Seed

RDS: Advantages
No need of sampling frame / mapping
Ease of field operations - Target members recruit samples for you.
Reach less visible segment of population

CCPUR IDU Network HIV – ve
HIV +ve

Non Probability Sampling Methods
Convenience sampling relies upon convenience and access
Judgment sampling relies upon belief that participants fit characteristics
Quota sampling emphasizes representation of specific characteristics
Snowball sampling relies upon respondent referrals of others with like characteristics

Probability samples A sampling that selects subjects with a known, non zero, probability.
Removes possibility of bias in selection of subjects.
Allows application of statistical theory to results.
Important when one wishes to generalize the findings of the sample to the larger population from which samples are selected.

Simple random sampling
Applicable when population is small, homogeneous & readily available
Required number of units are selected randomly.
Each unit of the frame has an equal non zero probability of selection.
Simple random samplingMerits
• Easy to implement if list frame available or small population
• Approximately satisfies the sampling model on which conventional statistics is based, so we can carry out complex analyses
Demerits•Need complete list of units
•Units may be scattered

SRS METHODS
1. LOTTERY METHOD2. RANDOM NUMBERS TABLE3. Computer Generated Random numbers
Simple random sampling
Example: evaluate the prevalence of hypertension among the 1200 children attending schoolin the age group 14 to 17 years.
List of children attending the schoolChildren numerated from 1 to 1200Sample size = 100 childrenRandom sampling of 100 numbers between 1 and 1200

Simple random sampling

57172 42088 70098 11333 26902 29959 43909 4960733883 87680 28923 15659 09839 45817 89405 7074377950 67344 10609 87119 15859 74577 42791 7588911607 11596 01796 24498 17009 67119 00614 4952956149 55678 38169 47228 49931 94303 67448 3128680719 65101 77729 83949 83358 75230 56624 2754993809 19505 82000 79068 45552 86776 48980 5668440950 86216 48161 17646 24164 35513 94057 5183412182 59744 65695 83710 41125 14291 74773 6639113382 48076 73151 48724 35670 38453 63154 5811638629 94576 48859 75654 17152 66516 78796 7309960728 32063 12431 23898 23683 10853 04038 7524601881 99056 46747 08846 01331 88163 74462 1455123094 29831 95387 23917 07421 97869 88092 7220115243 21100 48125 05243 16181 39641 36970 9952253501 58431 68149 25405 23463 49168 02048 3152207698 24181 01161 01527 17046 31460 91507 1605022921 25930 79579 43488 13211 71120 91715 4988168127 00501 37484 99278 28751 80855 02035 1091055309 10713 36439 65660 72554 77021 46279 2270592034 90892 69853 06175 61221 76825 18239 4768750612 84077 41387 54107 09190 74305 68196 7563481415 98504 32168 17822 49946 37545 47201 8522438461 44528 30953 08633 08049 68698 08759 4561107556 24587 88753 71626 64864 54986 38964 8353460557 50031 75829 05622 30237 77795 41870 26300
Table of random numbers

Generating Random Numbers
•This is a better and perhaps more efficient for selecting a simple random sample. •Computers and even your calculators can be used to generate random digits. The randomly produced digits can be used to pick your samples. •However, a complete listing of the members of the population is needed in this type of random selection.

Excel:Enter the function = RNDBETWEEN () on any blank cellF9 refreshes the random numbers

Through Calculator
Press
SHIFT · RAN#
=

Systematic random sampling
The defined target population is ordered and the sample is selected according to position using a skip interval

Systematic random sampling
Systematically spreads sample through a list of population membersIn nearly all practical examples, the procedure results in a sample equivalent to SRSINTERVAL SAMPLING

Systematic random samplingN = 1200, and n = 60
sampling interval = 1200/60 = 20
List persons from 1 to 1200Randomly select a number between 1 and 20 (ex : 8)
1st person selected = the 8th on the list 2nd person = 8 + 20 = the 28th
etc .....

Systematic sampling

1. Careful that there is no systematic rhythm to the flow or list of people.
2. If every Kth person on the list is, say, “rich” or “senior” or some other consistent pattern, avoid this method

Stratified Random Sampling
A method of probability sampling in which the population is divided
into different subgroups and samplesare selected from each

Stratified Random Sampling Methods
1. Proportional Allocation Method
2. Equal Allocation Method
Proportional Allocation Method
Epidemiological profile of tuberculosis under 12 years of age. Sample size is 120 centre 1 - 56% -67centre 2– 24% - 29Centre 3 – 20% - 24
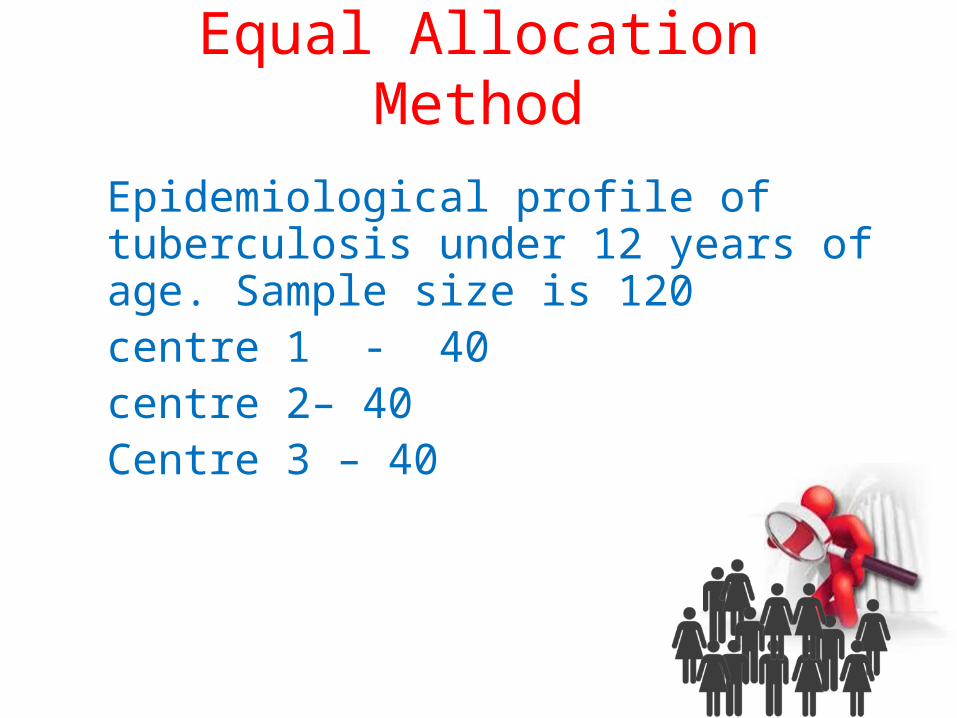
Equal Allocation Method
Epidemiological profile of tuberculosis under 12 years of age. Sample size is 120 centre 1 - 40centre 2– 40Centre 3 – 40

CHENNAI
NORTH CENTRAL EAST
GOVT.
5 SCHOOLS
SOUTH
PRIVATE GOVT. PRIVATE GOVT. PRIVATE GOVT. PRIVATE
5 SCHOOLS
EACH10
STUDENTS
5 GIRLS
5 BOYS
EACH10
STUDENTS
5 GIRLS
5 BOYS

Cluster Sampling
• Population by it self is divided into number of natural groups known as clusters (geographic or organizational) .
• The units are heterogeneous within cluster but homogeneous between clusters.
• Cluster sample is obtained by selecting the clusters by simple random sampling and all the units in the sampled clusters are included in the sample

Cluster Sampling
• Advantages– Sampling frame is not required– Simple and Easy– Less resources required
• Disadvantages– Imprecise if units within clusters are
homogeneous

Cluster Sampling
Randomly select Clusters and select all subjects
Randomly select Clusters and select subjects randomly

Cluster Sampling
Especially useful for door-to-door personal surveys (significantly reduces costs)
However, clustering increases sampling errors (people who live close together tend to be more similar)

Drawing the clusters
You need :Map of the regionDistribution of population (by Taluks or area)Age distribution (population 5-12:3%)

1600220
3200400800200
1200200
1600
530007300
1060001300026500
660040000
660053000
MetturSankariSalem
EdapadiOmalurYercaud
VazhappadiAttur
Gangavalli
5-12Pop.Taluks

1600220
3200400800200
1200200
1600
MetturSankariSalem
EdapadiOmalurYercaud
VazhappadiAttur
Gangavalli
5-12Taluks
Total = 9420

1600220
3200400800200
1200200
1600
MetturSankariSalem
EdapadiOmalurYercaud
VazhappadiAttur
Gangavalli
5-12Taluks
Total = 9420
Then compute sampling fraction :K = 9420/30 = 314
51
10121415

Drawing households and childrenOn the spot
Go to the center of the Taluk , choose direction (random)
Number the houses in this direction Ex: 21
Draw random number (between 1 and 21) to identify the first house to visit
From this house progress until finding the 7 children ( itinerary rules fixed beforehand)

Multistage Sampling
• Selection of subjects is done in stage by stage
• Any one of the sampling schemes can be applied during each stage
• Multistage sampling generally ends with unequal probability to sampling unit
• Analysis procedure becomes more complex.

Multistage Sampling
• Advantages
– No sampling frame of population required
– Most feasible approach for large populations
• Disadvantages
– Several sampling lists
– Needs more man power

Multi Stage Sampling
• District Level Household & Facility Survey– Stage – 1 Selection of District– Stage – 2 Selection of Villages– Stage – 3 Selection of Households
• Immunization coverage in a state– Stage – 1 Selection of District– Stage – 2 Selection of PHCs– Stage – 3 Selection of Subcenters

Probability Sampling Methods
Simple random sampling relies upon simple randomization
Systematic sampling relies upon on the sampling interval
Stratified sampling emphasizes dividing into groups and subgroups
Cluster sampling relies upon geographical or organizational groupsCluster sampling relies upon geographical or organizational groupsCluster sampling relies upon geographical or organizational groups

Factors Affecting Choice of Sampling Design
Sampling Frame: Existence and Size
Costs
Precision Desired
Sub-Population Comparisons

TO SUMMARIZE
•Population•Sample•Standard Error•Types Of Sampling•Non Probability sampling•Probability Sampling

Social actors are not predictable like objects.
Randomized events are irrelevant to social life.
Probability sampling is expensive and inefficient.
Therefore…
Non-probability sampling is the best approach.

We want to generalize to the population.
Random events are predictable.
Therefore…We can compare random events to our results.
Probability sampling is the best approach.

Conclusions
Probability samples are the best Beware of …
•refusals•absentees•“do not know”
Ensure •Validity•Precision …..within available constraints
Conclusions
If in doubt…
Call an Experienced Person !!!!Or
Call a statistician !!!!


Professor: Hope u understand the sampling techniquesStudent: It is impossible to draw conclusion for the whole population by drawing samplesProfessor explained the whole thing againStudent: I am not convinced

Professor: Well, so next time when you go for a blood test ask them to extract all the blood from your body

THANK YOU