samples: theoretical calculations, photophysical and ...
23
1 Electronic supplementary information The “turn-on” small molecule fluorescent sensor for determination of Al 3+ ion in real samples: theoretical calculations, photophysical and electrochemical properties Süreyya Oğuz Tümay* a , Ahmet Şenocak a , Arif Mermer b a Department of Chemistry, Gebze Technical University, Gebze 41400, Kocaeli, Turkey b University of Health Sciences Turkey, Experimental Medicine Research and Application Center, Uskudar, 34662, Istanbul, Turkey ∗ Corresponding author: Dr. Süreyya Oğuz TÜMAY, Department of Chemistry, Gebze Technical University, P.O. Box: 141, Gebze 41400, Kocaeli, Turkey Tel: 00 90 262 6053106 Fax: 00 90 262 6053105 e-mail: [email protected] Electronic Supplementary Material (ESI) for New Journal of Chemistry. This journal is © The Royal Society of Chemistry and the Centre National de la Recherche Scientifique 2021
Transcript of samples: theoretical calculations, photophysical and ...

1
Electronic supplementary information
The “turn-on” small molecule fluorescent sensor for determination of Al3+ ion in real
samples: theoretical calculations, photophysical and electrochemical properties
Süreyya Oğuz Tümay*a, Ahmet Şenocaka, Arif Mermerb
aDepartment of Chemistry, Gebze Technical University, Gebze 41400, Kocaeli, TurkeybUniversity of Health Sciences Turkey, Experimental Medicine Research and Application
Center, Uskudar, 34662, Istanbul, Turkey
∗ Corresponding author:
Dr. Süreyya Oğuz TÜMAY, Department of Chemistry, Gebze Technical University, P.O. Box:
141, Gebze 41400, Kocaeli, Turkey
Tel: 00 90 262 6053106
Fax: 00 90 262 6053105
e-mail: [email protected]
Electronic Supplementary Material (ESI) for New Journal of Chemistry.This journal is © The Royal Society of Chemistry and the Centre National de la Recherche Scientifique 2021

2
Content:
Experimental
Fig. S1. 1H NMR spectrum of compound 1.
Fig. S2. 13C NMR spectrum of compound 1.
Fig. S3. 1H NMR spectrum of compound 2.
Fig. S4. 13C NMR spectrum of compound 2.
Fig. S5. 1H NMR spectrum of compound 3.
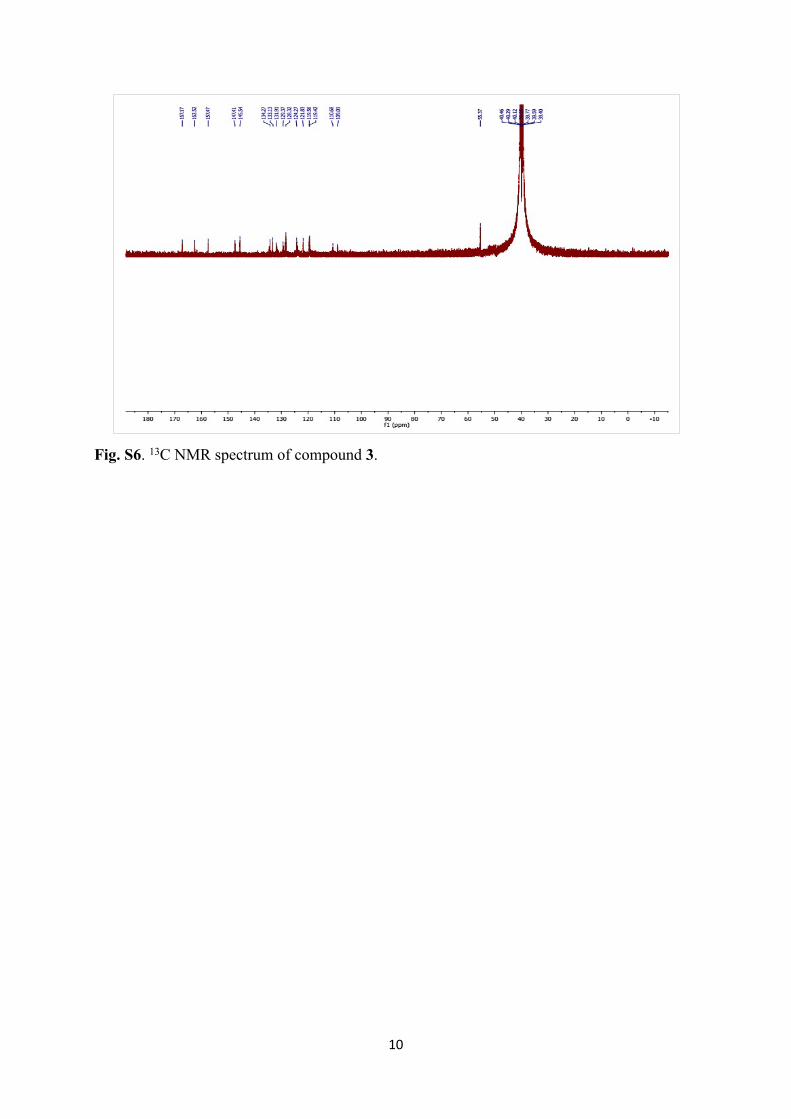
Fig. S6. 13C NMR spectrum of compound 3.
Fig. S7. HR-MS spectrum of compound 3.
Fig. S8. UV-Vis spectra of 3 in various solvent systems: water (a), DMF (b), DMSO (c),
ethanol (d), ACN (e), dichloromethane (f), THF (g), hexane (h) and normalized absorption (i)
spectra of 3 in various solvents.
Fig. S9. Fluorescence spectra of 3 in various solvent systems: water (a), DMF (b), DMSO (c),
ethanol (d), ACN (e), dichloromethane (f), THF (g) and hexane (h).
Fig. S10. Optimized structure (a), HOMO (b) and LUMO (c) orbitals of 3
Fig. S11. Identification of optimal pH (a), initial sensor concentration (b), interaction time (c),
and photostability (d) in water:EtOH (1:4 v/v, pH: 6.0, λex: 365).
Fig. S12. UV-Vis spectra of compound 3 (a) and fluorescence signal change of 3 + Al3+ (b) at
different water:EtOH ratios.
Fig. S13. Job’s plot (a), Benesi-Hildebrand analysis (b), MALDI-TOF spectrum (c) of 3 after
treatment with Al3+ ions in water:EtOH (1:4 v/v, pH:6.0, ex= 365 nm) and 1H NMR spectra (d)
of 3 with Al3+ ion in DMSO-d6.
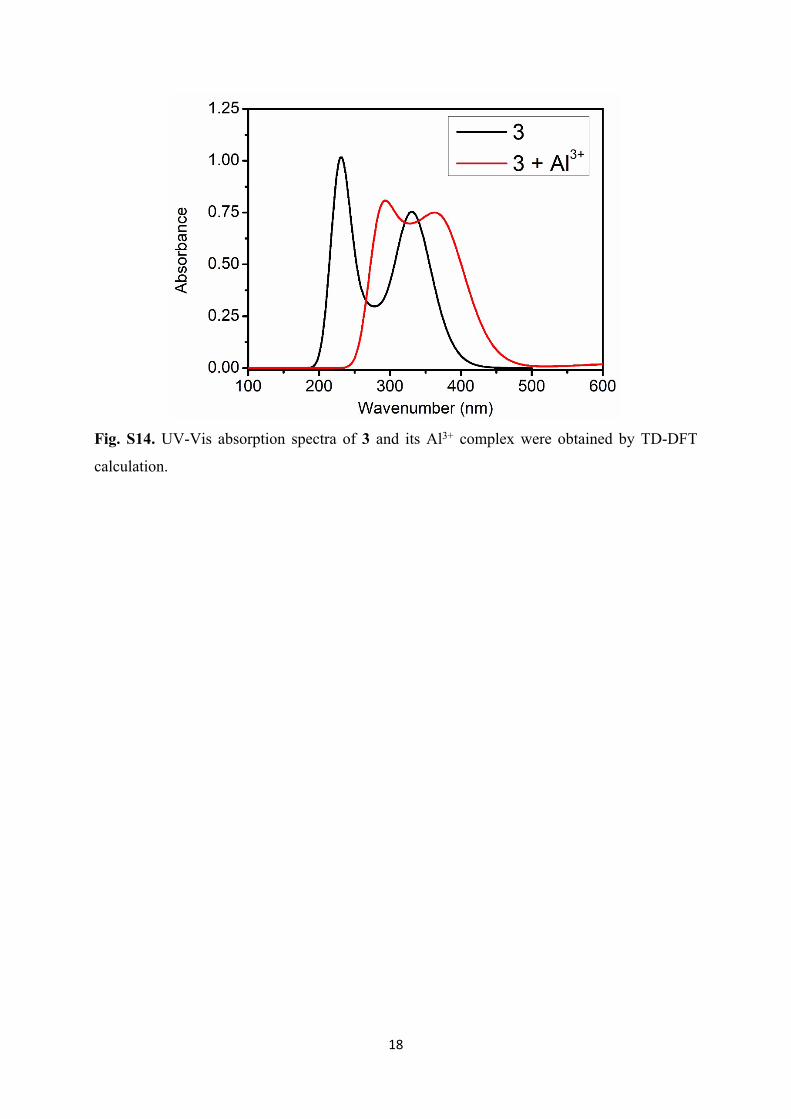
Fig. S14. UV-Vis absorption spectra of 3 and its Al3+ complex were obtained by TD-DFT
calculation.
Table S1. The comparison of known and novel methods.
Table S2: Photophysical properties of 3.
Table S3. Optimum conditions and analytical parameters for determination of Al3+ with 3.
Table S4: Application of the presented spectrofluorimetric method to the certified reference
material (N = 3).
Table S5: Statistical Evaluation of accuracy by Student t-test.

3
Experimental Material and Apparatus
Ethyl bromoacetate (99 %), tetrahydrofuran (anhydrous, ≥99.9%) trimethylamine (99%), absolute ethanol, hydrazine hydrate monohydrate (99%), 2-hydroxy-1-naphthaldehyde (99%), deuterated dimethyl sulfoxide (DMSO-d6), tri-, di- and monovalent metal ions (as their nitrate salts), anions (as their sodium salts), other solvents (analytical grade) were purchased from Sigma-Aldrich (USA). The steady-state fluorescence measurements, real samples analysis, and absorption measurements were carried out with Varian Cary Eclipse spectrofluorometer (USA) and Shimadzu 2101-UV spectrophotometer (Japan). Agilent 6530 Q-TOF LC/MS mass (USA) and Microflex spectrometers (Bruker Daltonics, USA) were performed to high resolution (HR-MS) and mass (MALDI-TOF) spectra of compound 3 and its complex. NMR (1H, 13C) was recorded with INOVA 500 MHz spectrometer (Varian, USA). The spectroscopic quartz cuvette which has 10 mm pathlength was used for all molecular spectroscopic measurements where 5 nm was selected as slit width. The Horiba Jobin Yvon SPEX Fluorolog 3-2iHR (France) which has a charge-coupled device (CCD) and photomultiplier tube (R928) detectors were used for recording EEM analysis, 3D-fluorescence, and time-resolved fluorescence measurements. The signal acquisition was conducted by Single Photon Counting Controller (TCSPC, Fluoro Hub-B, France). The source of excitation for time-resolved fluorescence measurements was NanoLED (France) which excited samples at 390 nm. An electrochemical analyzer (USA, CH Instruments 842B) was used to perform CV and SWV voltammetries, which consisted of glassy carbon (GCE), counter electrode (Pt wire), and reference electrodes (Ag/AgCl). Tetrabutylammonium hexafluorophosphate (TBAPF6, 0.10 mol dm-3) was used as the supporting electrolyte in voltammetric measurements which were performed in high purity of dimethylformamide (DMF) and nitrogen to deoxygenate the solution at least 10 minutes prior to each run at room temperature.
2.2. Photophysical calculations
The 3D-fluorescence and EEM analyses of 3 and 3 + Al3+ were measured in water:EtOH (1:4 v/v) at pH 6.0 via Horiba-Jobin-Yvon-SPEX with CCD detector. The time-resolved fluorescence measurements of 3 and 3 + Al3+ were recorded with TCSPC module (PMT detector) and the fluorescence lifetimes of samples were calculated directly via appropriate exponential calculations. The average lifetime of the charge carriers is estimated by using equation S1.1
(Eq. S1)
𝜏𝑎 = ∑𝑎𝑖𝜏𝑖
2
∑𝑎𝑖𝜏𝑖
where ti demonstrates decay time constant andi is the pre-exponential factor corresponding to the ith. The quinine sulfate dissolved in 0.1 M H2SO4 and used as a standard (∅Fstd=0.54) for calculation of fluorescence quantum yields of 3 and 3 + Al3+ via equation S2.2, 3
(Eq. S2)
∅𝐹 = ∅𝐹𝑆𝑡𝑑
𝐹.𝐴𝑆𝑡𝑑.𝑛2
𝐹𝑆𝑡𝑑.𝐴.𝑛 2𝑆𝑡𝑑
where F, FStd, A, AStd are fluorescence bands areas, absorbance values at the excitation wavelength of sample and standard, respectively while n represented refractive indices of solvents. The radiative rate constant (Kr) and non-radiative rate constants (Knr) were determined by using equations S3 and S4.1
(Eq. S3)𝐾𝑟 = Φ𝑓 /𝜏
(Eq. S4)𝜏 ‒ 1 = 𝐾𝑟 + 𝐾𝑛𝑟
2.3. Theoretical calculationsDFT computations were carried with Gaussian 09 package to obtain the optimized structure of 3 and its Al3+ complex.4 Optimized geometries of 3 and its complex with Al3+ were obtained by Becke, 3-parameter, Lee-Yang-Parr (B3LYP)5 with a basis set of 6-31G (d, p) for describing the complex formation and support the sensing

4
mechanism. The energy values of LUMO and HOMO were calculated by the single point time-dependent DFT (TD-DFT) method at similar levels by performing the B3LYP/6-31G (d, p).
Preparation of target fluorescent sensor (3)
To access the target ligand, 1H-benzotriazol-I-acetic acid hydrazide (2) was synthesized by previously described methods.6 The fluorescent sensor (3) was also a known compound that was synthesized via conventional method before by Youhong and co-workers.7 However, in this presented study, it was synthesized using ultrasound sonication as a green method to both reduce the reaction time and increase the yield. For this purpose, the solution of compound 2 (10.00 mmol) and 2-hydroxy-1-naphthaldehyde (10.00 mmol) in ethanol (5 mL) was sonicated at 50 oC with the addition of 1-2 drops of acetic acid (glacial) at 40 kHz for 35 min (The reaction progress was followed by TLC). After evaporating the solvent under reduced pressure, a yellow solid was obtained, and it was recrystallized from methanol to afford the desired compound (Scheme 1). The results demonstrated that approximately 11-fold reduction in reaction time and a modest increase in reaction yield (Table S1). All synthesized compounds (1-3) were characterized by 1H NMR and 13C NMR spectroscopic techniques. Further, the target compound (3) was also confirmed through the HR-MS technique. All spectroscopic results were found to be compatible with the literature (Fig. S1-S7).
The general spectrofluorimetric procedure for determination of Al3+ ions
The stock solution of 3 (25.00 mmol.L-1), metal ions (from their nitrate salts, 1.00 mmol.L-1), anions (from their sodium salts, 1.00 mmol.L-1), and single molecules (oleic, ascorbic, gallic, caffeic, citric acids, glucose, fructose, sucrose) were prepared with absolute ethanol or double deionized water. The relative fluorescence signal response of 3 at 454 nm was selected for the spectrofluorimetric determination of Al3+ ion content in real samples. The waters samples were collected from Istanbul and urine sample was collected from volunteer adult. sample was Briefly, 2.00 mL of 3, 0.8 mL real sample, and 0.2 mL buffer at pH 6.0 were added to 5.00 mL volumetric flask. After, the final volume of the flask was adjusted to 5.00 mL with absolute ethanol, and prior to determination processes obtained mixture was strongly stirred for 20 seconds. As can be seen from Scheme 1, although 3 has a naphthalene moiety, the faint fluorescence signal of 3 can be attributed to PET and ESIPT mechanism between imine (-C=N-) bond, naphthalene, and phenolic –OH. After treatment with real samples, obtained “turn-on” fluorescence response at 454 nm was used for spectrofluorimetric determination. The fluorescence “turn-on” response of 3 was proportionally increased between 1.00-20.00 µmol.L-1 with a LOD of 0.34 µmol.L-1 which pointed out that the trace level of Al3+ can be determined with “turn-on” response change of 3 in real samples. The accuracy of the novel determination method was carried out with the spike/recovery test and the analysis of certificated reference material (CRM-TMDW-500). Finally, paper-based analysis kits were developed and applied for the recognition of Al3+
ions as easily and rapid in-field applications.

5
Fig. S1. 1H NMR spectrum of compound 1.

6
Fig. S2. 13C NMR spectrum of compound 1.

7
Fig. S3. 1H NMR spectrum of compound 2.

8
Fig. S4. 13C NMR spectrum of compound 2.

9
Fig. S5. 1H NMR spectrum of compound 3.
10
Fig. S6. 13C NMR spectrum of compound 3.

11
Fig. S7. HR-MS spectrum of compound 3.

12
Fig. S8. UV-Vis spectra of 3 in various solvent systems: water (a), DMF (b), DMSO (c),
ethanol (d), ACN (e), dichloromethane (f), THF (g), hexane (h) and normalized absorption (i)
spectra of 3 in various solvents.

13
Fig. S9. Fluorescence spectra of 3 in various solvent systems: water (a), DMF (b), DMSO (c),
ethanol (d), ACN (e), dichloromethane (f), THF (g) and hexane (h).

14
Fig. S10. Optimized structure (a), HOMO (b) and LUMO (c) orbitals of 3

15
Fig. S11. Identification of optimal pH (a), initial sensor concentration (b), interaction time (c),
and photostability (d) in water:EtOH (1:4 v/v, pH: 6.0, λex: 365).

16
Fig. S12. UV-Vis spectra of compound 3 (a) and fluorescence signal change of 3 + Al3+ (b) at
different water:EtOH ratios.

17
Fig. S13. Job’s plot (a), Benesi-Hildebrand analysis (b), MALDI-TOF spectrum (c) of 3 after
treatment with Al3+ ions in water:EtOH (1:4 v/v, pH:6.0, ex= 365 nm) and 1H NMR spectra (d)
of 3 with Al3+ ion in DMSO-d6.
18
Fig. S14. UV-Vis absorption spectra of 3 and its Al3+ complex were obtained by TD-DFT
calculation.

19
Table S1. The comparison of known and novel methods.
Comp.
Name
Method Time
(min)
Yield
(%)
Temp.
(oC)
m.p.
(oC)
Ref
HNBTH Conventional 300 92 Reflux 228-230 [36]
3 Ultrasonication 35 97 50 229-230 TW*
*This Work

20
Table S2: Photophysical properties of 3.
e (L.mol−1.cm−1) x103
λabs
(nm)
λems
(nm
)
*Wate
r
DMS
O
DM
F
EtOH AC
N
DC
M
TH
F
Hxn ΦF τa (ns)
371,
359,
323,
310
- 0.84 19.7 12.5 14.4 17.8 12.9 14.0 1.7 0.00
9
3.74±0.0
3
* DMF; dimethylformamide, DMSO; dimethyl sulfoxide, EtOH, ACN, acetonitrile; DCM,
dichloromethane; THF, Dxn, 1,4-dioxane; tetrahydrofuran; ethanol; Hxn, n-hexane;

21
Table S3. Optimum conditions and analytical parameters for determination of Al3+ with 3.
Parameter Value
pH 6.0
Sensor concentration (µmol.L-1) 50
Measurement volume (mL) 5
Working solvent water:EtOH
Interaction time (second) 20
Linear range (µmol.L-1) 1.00-20.00
Limit of detection (LOD) (µmol.L-1) 0.34 (9.17 µg.L-1)
Limit of quantification (LOQ) (µmol.L-1) 1.02 (27.51 µg.L-1)
Precision (RSD%) 2.98
Correlation coefficient (R2) 0.9945
Excitation wavelength (nm) 365
Emission wavelength (nm) 454

22
Table S4: Application of the presented spectrofluorimetric method to the certified reference
material (N = 3).
CRM TMDW-500 Drinking Water
Analyte Certificated value (μg.L-1) Found value (μg.L-1) Recovery (%)
Al3+ 120.0±0.6 117.8±3.2 98.17

23
Table S5: Statistical Evaluation of accuracy by Student t-test.
s XR texp.= tref. Results
Al3+ 3.2 120.0 117.8 1.19 4.30.19<4.3
(acceptable)
References
1. S. Prabakaran, K. D. Nisha, S. Harish, J. Archana and M. Navaneethan, J. Alloys Compd., 2021, 885, 160936.
2. S. Fery-Forgues and D. Lavabre, J. Chem. Educ. 1999, 76, 1260.3. W. H. Melhuish, J. Phys. Chem., 1961, 65, 229-235.4. M. J. Frisch, G. W. Trucks, H. B. Schlegel, G. E. Scuseria, M. A. Robb, J. R. Cheeseman, G.
Scalmani, V. Barone, B. Mennucci, G. A. Petersson, H. Nakatsuji, M. Caricato, X. Li, H. P. Hratchian, A. F. Izmaylov, J. Bloino, G. Zheng, J. L. Sonnenberg, M. Hada, M. Ehara, K. Toyota, R. Fukuda, J. Hasegawa, M. Ishida, T. Nakajima, Y. Honda, O. Kitao, H. Nakai, T. Vreven, J. A. Montgomery, J. E. Peralta, F. Ogliaro, M. Bearpark, J. J. Heyd, E. Brothers, K. N. Kudin, V. N. Staroverov, R. Kobayashi, J. Normand, K. Raghavachari, A. Rendell, J. C. Burant, S. S. Iyengar, J. Tomasi, M. Cossi, N. Rega, J. M. Millam, M. Klene, J. E. Knox, J. B. Cross, V. Bakken, C. Adamo, J. Jaramillo, R. Gomperts, R. E. Stratmann, O. Yazyev, A. J. Austin, R. Cammi, C. Pomelli, J. W. Ochterski, R. L. Martin, K. Morokuma, V. G. Zakrzewski, G. A. Voth, P. Salvador, J. J. Dannenberg, S. Dapprich, A. D. Daniels, Farkas, J. B. Foresman, J. V. Ortiz, J. Cioslowski and D. J. Fox, Journal, 2009, DOI: citeulike-article-id:9096580.
5. J.-D. Chai and M. Head-Gordon, Phys. Chem. Chem. Phys., 2008, 10, 6615-6620.6. S. M. El-Khawass and N. S. Habib, J. Heterocycl. Chem., 1989, 26, 177-181.7. H. Youhong, Z. Yulan and W. Shaozu, Synth. React. Inorg. Met. Org. Chem., 1995, 25, 451-461.