
SAMPLE_BUSINESS_PLAN
34
1
-
Upload
matt-marshall -
Category
Documents
-
view
20 -
download
0
Transcript of SAMPLE_BUSINESS_PLAN

1
2
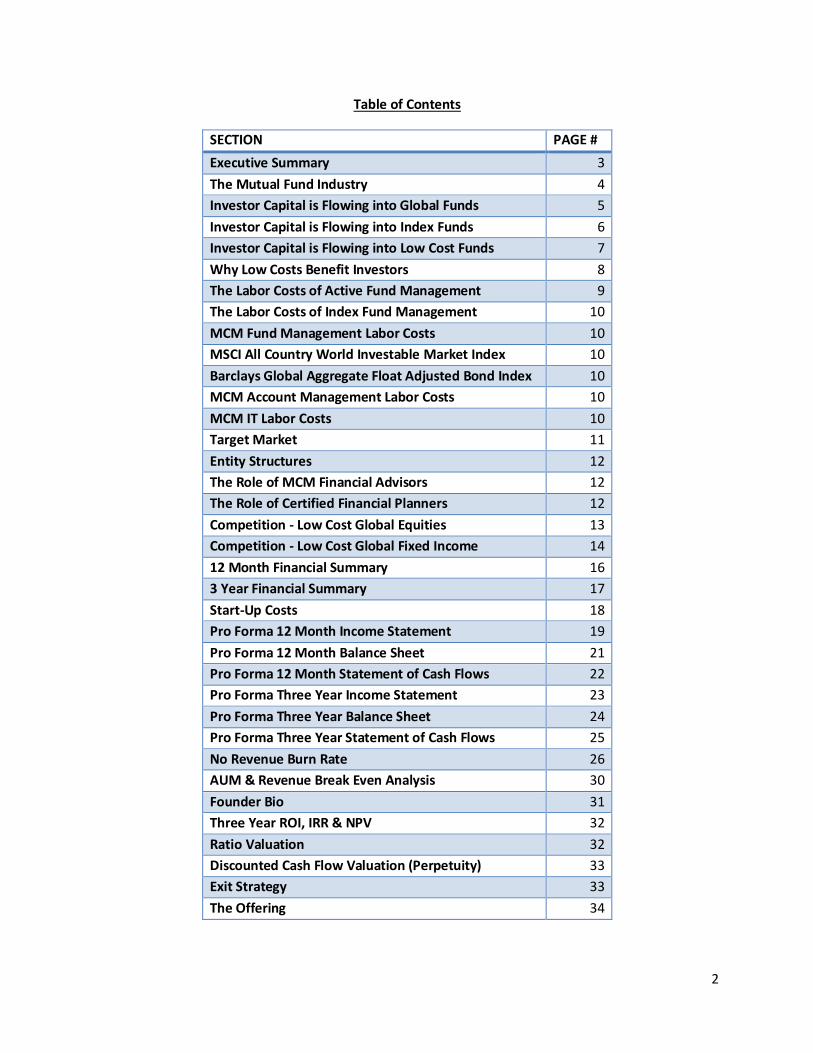
Table of Contents
SECTION PAGE #
Executive Summary 3
The Mutual Fund Industry 4
Investor Capital is Flowing into Global Funds 5
Investor Capital is Flowing into Index Funds 6
Investor Capital is Flowing into Low Cost Funds 7
Why Low Costs Benefit Investors 8
The Labor Costs of Active Fund Management 9
The Labor Costs of Index Fund Management 10
MCM Fund Management Labor Costs 10
MSCI All Country World Investable Market Index 10
Barclays Global Aggregate Float Adjusted Bond Index 10
MCM Account Management Labor Costs 10
MCM IT Labor Costs 10
Target Market 11
Entity Structures 12
The Role of MCM Financial Advisors 12
The Role of Certified Financial Planners 12
Competition - Low Cost Global Equities 13
Competition - Low Cost Global Fixed Income 14
12 Month Financial Summary 16
3 Year Financial Summary 17
Start-Up Costs 18
Pro Forma 12 Month Income Statement 19
Pro Forma 12 Month Balance Sheet 21
Pro Forma 12 Month Statement of Cash Flows 22
Pro Forma Three Year Income Statement 23
Pro Forma Three Year Balance Sheet 24
Pro Forma Three Year Statement of Cash Flows 25
No Revenue Burn Rate 26
AUM & Revenue Break Even Analysis 30
Founder Bio 31
Three Year ROI, IRR & NPV 32
Ratio Valuation 32
Discounted Cash Flow Valuation (Perpetuity) 33
Exit Strategy 33
The Offering 34

3
1. Executive Summary
A fund earns its revenues by taking a percentage of the assets it manages. Therefore, the most
important factor when starting a fund is maximizing assets under management (AUM). A fund is most
likely to attract investor capital by positioning itself where investor capital is flowing. Currently, investor
capital is flowing into global funds and low cost index funds.
Investors are increasingly viewing the investable marketplace globally as opposed to domestically. From
2003 to 2009 international mutual fund total net assets have increased 79%, global mutual fund total
net assets have increased 64%, and domestic mutual fund net assets have increased 50%. This is likely
due to the practice of global diversification. The purpose of diversification is to reduce risk by not
subjecting a portfolio to individual economic factors (technology bubble, housing bubble, etc).
Diversification has expanded from the traditional diversification across asset classes (stocks, bonds, etc),
sectors (financials, information technology, etc.), and industries (investment banks, software, etc) to
include different economies. Risks specific to a single country are mitigated when investing globally.
From 1993 to 2009 US index fund net assets increased 3,046% as opposed to non-indexed mutual funds
increasing 504%. This is likely due to the significantly lower cost of index funds.
Marshall Capital Management (MCM) will manage the lowest cost global index funds in the industry. Its
key revenue driver is the flow of investor capital into global funds. It will manage a The Global Stock
Fund and The Global Bond Fund. MCM will charge 0.25% annually to manage The Global Stock Fund and
0.25% to manage The Global Bond Fund. The Global Stock Fund will track the MSCI All Country World
Investable Market Index. This Index tracks all investable stocks in the world weighted to their
percentage of the global stock market. The Global Bond Fund will track the Barclays Global Aggregate
Float Adjusted Bond Index. This index tracks all investment grade bonds in the world weighted to their
percentage of the global bond market.
MCM will be capable of managing the funds at industry low costs due to outsourced labor to India and
economies of scale. Except for sales, all MCM labor will be conducted out of an Indian Office. This labor
includes portfolio management, account management, and information technology. India offers the
lowest cost of labor in the world that is capable of managing index funds. India’s cost of labor will be
roughly one-fourth of the same labor in the US. Economies of scale exist to a large extent in the fund
management industry. MCM only manages two funds. All assets will be pooled into these two funds.
Therefore, MCM only has to employ two portfolio managers regardless of the size of AUM. Through the
use of Indian labor and the management of only two funds, no competing firm should be able to match
or beat MCM’s expense ratios. These measures give MCM its competitive advantage.
As of 2009, the average US fund size was 1.5 billion while the average international fund size was 350
million. Because MCM’s main goal is to maximizing AUM, sales will be conducted in the US. For 401(k)’s,
institutional investors, and high net worth individuals, MCM will use in-house financial advisors. For
IRA’s, college savings, and low net-worth individuals, certified financial planners (CFPs) will be used.
CFPs’ are independent financial advisors who charge their clients directly. MCM will have a CFP relation
department and list CFPs’ recommending its funds on the MCM website.
4
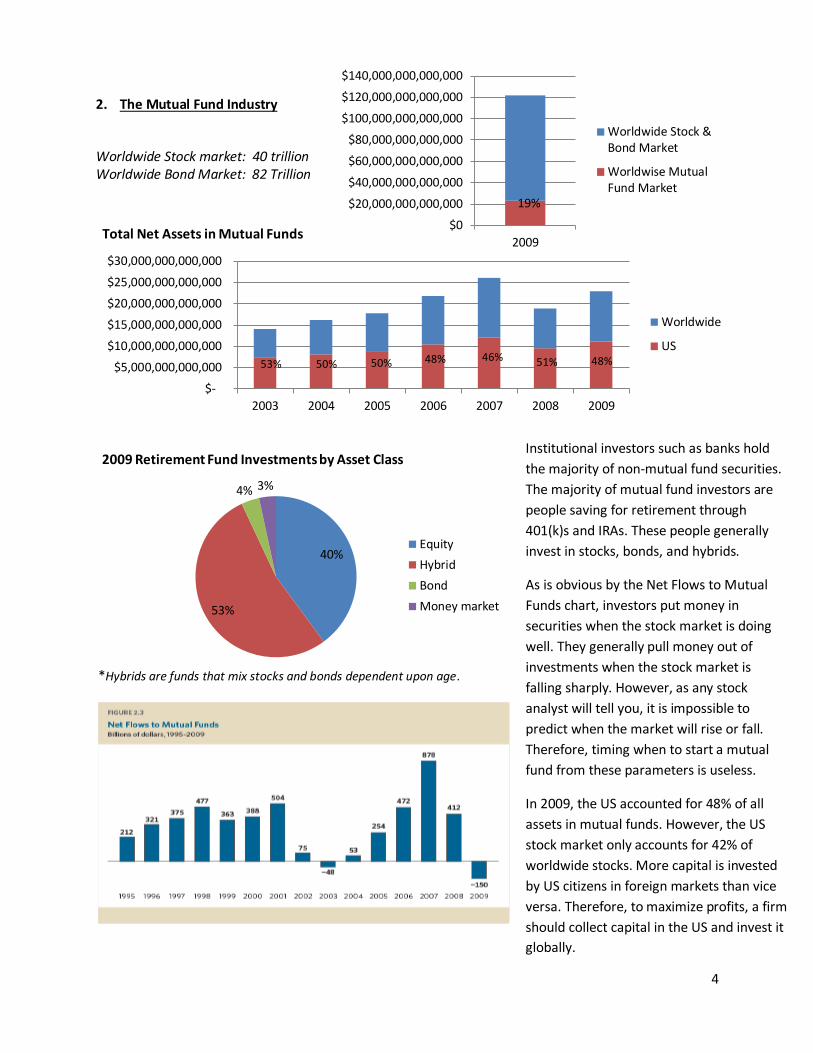
2. The Mutual Fund Industry
Worldwide Stock market: 40 trillion Worldwide Bond Market: 82 Trillion
$-
$5,000,000,000,000
$10,000,000,000,000
$15,000,000,000,000
$20,000,000,000,000
$25,000,000,000,000
$30,000,000,000,000
2003 2004 2005 2006 2007 2008 2009
Total Net Assets in Mutual Funds
Worldwide
US
53% 50% 50% 48% 46% 51% 48%
40%
53%
4% 3%
2009 Retirement Fund Investments by Asset Class
Equity
Hybrid
Bond
Money market
$0
$20,000,000,000,000
$40,000,000,000,000
$60,000,000,000,000
$80,000,000,000,000
$100,000,000,000,000
$120,000,000,000,000
$140,000,000,000,000
2009
Worldwide Stock &Bond Market
Worldwise MutualFund Market
19%
*Hybrids are funds that mix stocks and bonds dependent upon age.
Institutional investors such as banks hold
the majority of non-mutual fund securities.
The majority of mutual fund investors are
people saving for retirement through
401(k)s and IRAs. These people generally
invest in stocks, bonds, and hybrids.
As is obvious by the Net Flows to Mutual
Funds chart, investors put money in
securities when the stock market is doing
well. They generally pull money out of
investments when the stock market is
falling sharply. However, as any stock
analyst will tell you, it is impossible to
predict when the market will rise or fall.
Therefore, timing when to start a mutual
fund from these parameters is useless.
In 2009, the US accounted for 48% of all
assets in mutual funds. However, the US
stock market only accounts for 42% of
worldwide stocks. More capital is invested
by US citizens in foreign markets than vice
versa. Therefore, to maximize profits, a firm
should collect capital in the US and invest it
globally.

5
3. Investor Capital is Flowing into Global Funds
MCM’s success is not reliant on a global bull market. It is reliant on investors’ continuing to move their
capital into global economies. As the manager of the lowest cost global funds, MCM caters to investors’
seeking all levels of global diversification.
Historically, the safest economies in which to invest capital are the US and Europe. However, the current
global economic environment is one in which it makes more sense to look to the future than the past.
With US national debt reaching 100% of GDP and European Countries collapsing one after the other, it
makes no sense to concentrate a portfolio in one of these economies. The US is vulnerable to China and
Japan stopping purchasing its debt and/or inflation caused by the monetization of its debt. Europe is
vulnerable to countries inability to print their own money (its currency system is tied to a number of
countries) and the likelihood of countries with better economic conditions (such as Germany)
discontinuing the Euro. Diversifying globally mitigates all of these risks by taking currency exchange rates
out of the equation. If US inflation occurs, investors’ benefit from an increase in the value of foreign
currency in relation to the US dollar. If the Euro is eliminated, investors’ are automatically invested in
Europe’s new currencies.
Year International % Annual Change in Total Net Assets of Mutual Funds
Worldwide % Annual Change in Total Net Assets of Mutual Funds
US % Annual Change in Total Net Assets of Mutual Funds
2004 21% 15% 9%
2005 10% 10% 10%
2006 29% 23% 17%
2007 24% 20% 15%
2008 -34% -28% -20%
2009 27% 21% 16%
TOTAL 79% 64% 50%
AVERAGE 13% 10% 8%
-40%
-30%
-20%
-10%
0%
10%
20%
30%
40%
2004 2005 2006 2007 2008 2009
International % AnnualChange in Total NetAssets of Mutual Funds
Worldwide % AnnualChange in Total NetAssets of Mutual Funds
US % Annual Change inTotal Net Assets ofMutual Funds
Due to the inherent risks in
single economies, it makes
sense to diversify globally.
The global nature of MCM is
what differentiates it from
other low cost index funds.
The data shows, in the past,
changes in domestic mutual
funds’ total net assets have
been magnified by changes in
international and global
mutual funds’ total net
assets.

6
4. Investor Capital is Flowing into Index Funds
The following charts and table provide ample proof investor capital is flowing into index funds.
-40%
-20%
0%
20%
40%
60%
80%
1994
1995
1996
1997
1998
1999
2000
2001
2002
2003
2004
2005
2006
2007
2008
2009
US Index Funds % Annual Changein Total Assets
US Mutual Funds % AnnualChange in Total Assets
Year US Index Funds % Change in Total Assets
US Mutual Fund % Change in Total Assets
1994 17% 4%
1995 76% 30%
1996 72% 25%
1997 75% 27%
1998 56% 24%
1999 46% 24%
2000 -1% 2%
2001 -3% 0%
2002 -12% -8%
2003 39% 16%
2004 22% 9%
2005 12% 10%
2006 21% 17%
2007 14% 15%
2008 -30% -20%
2009 39% 16%
TOTAL 3,046% 504%
AVERAGE 28% 12%
It should be noted that an index fund is a
kind of mutual fund. Therefore, the chart
and table comparing the two include index
funds in the mutual fund calculations. If
available data allowed for the calculation of
index vs. actively managed funds, it would
display more favorable results than shown
pertaining to the recent growth of index
funds.

7
5. Investor Capital is Flowing into Low Cost Funds
The sum of all funds trading in US stocks is inherently equal to the US stock market. Therefore, for every
dollar that is gained by a US fund over the US stock market a dollar is lost by another US fund.
The ability of index funds to lower costs to investors’ is why they work. Wall Street portfolio managers
and analysts are the most expensive part of any fund. Essentially, a handful of Harvard and Wharton
MBAs’ compete with each other over the same money year after year. They get six figure salaries the
years they don’t beat their indexes and bonuses of millions in the years that they beat their indexes.
Only one thing is certain, the portfolio managers and analysts will end up with a lot of the investors’
money and the investors’ will end up paying billions of dollars for a service that could have been done by
one portfolio manager.
Actively managed funds are more
expensive than index funds
because of the extra costs of
labor of the portfolio managers
and all of their analysts. (See
section 7 - The Labor Costs of
Active Fund Management)
Picking an actively managed fund
is a bet that its portfolio
managers and their analysts are
talented enough to take money
away from other portfolio
managers and their analysts.
Although, this does happen
regularly, it does not happen
consistently.
A study by Vanguard found that
85% of funds underperform their
benchmark in a given year (due to
extra labor costs). The same study
concluded that of those actively
managed funds that beat their
benchmark, only 42% were able
to do so two years in a row and
10% were able to do so three
years in a row
8
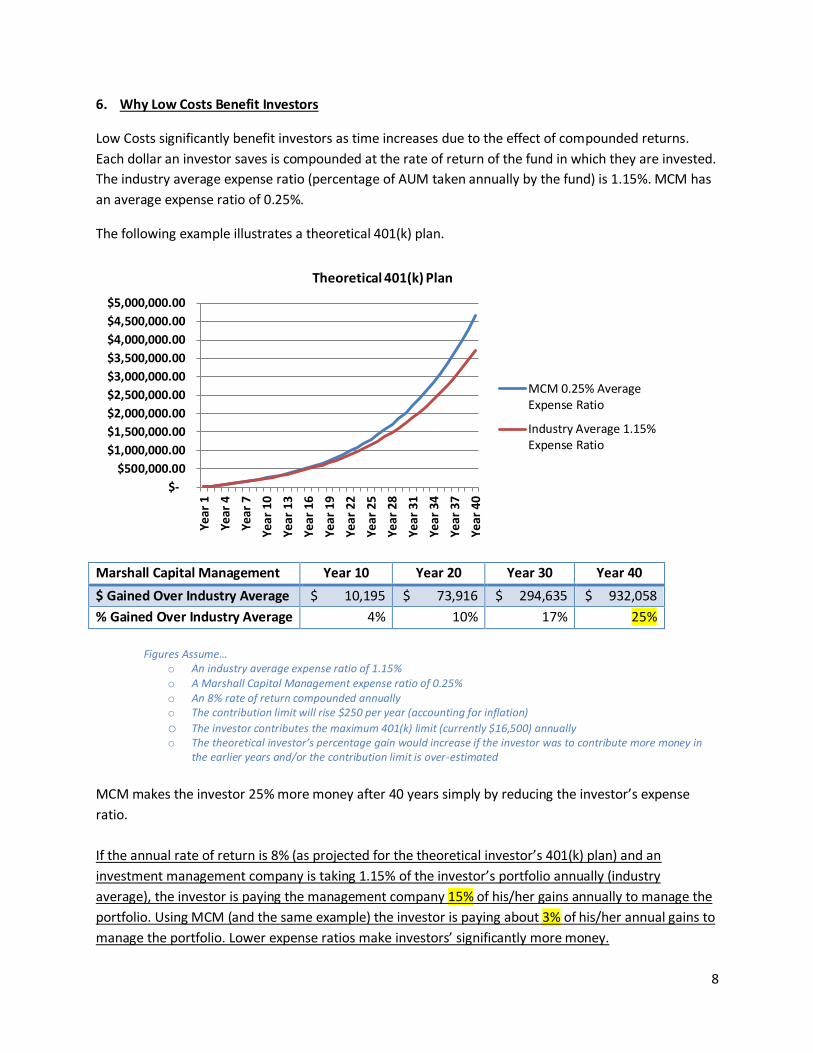
6. Why Low Costs Benefit Investors
Low Costs significantly benefit investors as time increases due to the effect of compounded returns.
Each dollar an investor saves is compounded at the rate of return of the fund in which they are invested.
The industry average expense ratio (percentage of AUM taken annually by the fund) is 1.15%. MCM has
an average expense ratio of 0.25%.
The following example illustrates a theoretical 401(k) plan.
Marshall Capital Management Year 10 Year 20 Year 30 Year 40
$ Gained Over Industry Average $ 10,195 $ 73,916 $ 294,635 $ 932,058
% Gained Over Industry Average 4% 10% 17% 25%
Figures Assume…
o An industry average expense ratio of 1.15% o A Marshall Capital Management expense ratio of 0.25% o An 8% rate of return compounded annually o The contribution limit will rise $250 per year (accounting for inflation)
o The investor contributes the maximum 401(k) limit (currently $16,500) annually o The theoretical investor’s percentage gain would increase if the investor was to contribute more money in
the earlier years and/or the contribution limit is over-estimated
MCM makes the investor 25% more money after 40 years simply by reducing the investor’s expense
ratio.
If the annual rate of return is 8% (as projected for the theoretical investor’s 401(k) plan) and an
investment management company is taking 1.15% of the investor’s portfolio annually (industry
average), the investor is paying the management company 15% of his/her gains annually to manage the
portfolio. Using MCM (and the same example) the investor is paying about 3% of his/her annual gains to
manage the portfolio. Lower expense ratios make investors’ significantly more money.
$-
$500,000.00
$1,000,000.00
$1,500,000.00
$2,000,000.00
$2,500,000.00
$3,000,000.00
$3,500,000.00
$4,000,000.00
$4,500,000.00
$5,000,000.00
Year
1
Year
4
Year
7
Ye
ar
10
Ye
ar
13
Ye
ar 1
6
Ye
ar
19
Ye
ar
22
Ye
ar
25
Ye
ar 2
8
Ye
ar
31
Ye
ar
34
Ye
ar
37
Ye
ar 4
0
Theoretical 401(k) Plan
MCM 0.25% AverageExpense Ratio
Industry Average 1.15%Expense Ratio

9
7. The Labor Costs of Active Fund Management
Chief Investment Officer
Portfolio Manager
Large-Cap Growth
Portfolio Manager
Mid-Cap Growth
Portfolio Manager
Small-Cap Growth
Portfolio Manager
Large-Cap Value
Portfolio Manager
Mid-Cap Value
Portfolio Manager
Small-Cap Value
Portfolio Manager
Information Technology Analyst
Financials Analyst Energy Analyst Health Care Analyst Industrials AnalystConsumer Industrials
AnalystConsumer Staples
AnalystMaterials Analyst Utilities Analyst
Telecommunication Services Analyst
There are over 63,000 Stocks in the World
Stocks are Generally Sorted using Six Combinations of Size and Style
There are 10 Sectors in the Stock Market
Each Portfolio Manager Requires an Analyst for Each Sector
*Investors are Paying 60 to 70 People to Make Investment Decisions*

10
8. The Labor Costs of Index Fund Management
*Investors are Paying One Person to Make Investment Decisions*
9. MCM Fund Management Labor Costs
10. MSCI All Country World Investable Market Index - Please visit
http://www.mscibarra.com/products/indices/global_equity_indices/acwi-
imi/MSCI_ACWI_IMI_Factsheet.pdf for the full two page fact sheet.
11. Barclays Global Aggregate Float Adjusted Bond Index – No fact sheet exists, however, section 19:–
Competition - Low Cost Global Fixed Income gives all relevant data pertaining to the index.
12. MCM Account Management Labor Costs
Account managers will handle accounting, taxation, and investor communication for all accounts.
Outsourced to India, a generous salary for account manager is $20,000 annually. Each account manager
can handle about 500 accounts. The average US account size is about $40,000 (see section 14 – Target
Market). Therefore, the average account manager can handle 20m is AUM. This assumes account
managers will spend an average of four hours per year or 20 minutes per month handling each account.
13. MCM IT Labor Costs
MCM will require an estimated one IT employee for every 50 total employees. Outsourced to India, a
generous salary for an IT employee is $12,000. Assuming an average account size of $40,000, MCM will
require one IT employee for about every 1b in AUM.
Stock Portfolio Manager
Bond Portfolio Manager
Outsourced to India, a generous
salary for an experienced portfolio
manager is $50,000 annually.
Labor costs for both a stock and
bond portfolio manager will be
less than $100,000 annually.
Index funds track an index such as the S&P 500 or MSCI All
Country World Investable Market Index. All of the securities
that make up the index are already chosen. Because no-one is
needed to make investment decisions, index funds only need
one portfolio manager to purchase securities.

11
14. Target Market
$-
$200,000,000
$400,000,000
$600,000,000
$800,000,000
$1,000,000,000
$1,200,000,000
$1,400,000,000
$1,600,000,000
2003 2004 2005 2006 2007 2008 2009
US Mutual Fund Average Size
Worldwide Mutual Fund AverageSize
$-
$5,000
$10,000
$15,000
$20,000
$25,000
$30,000
$35,000
$40,000
$45,000
1970
1973
1976
1979
1982
1985
1988
1991
1994
1997
2000
2003
2006
2009
Average US Account Size
MCM’s primary goal is to maximize AUM. This
will control the company’s revenues. Both funds
(stock and bond) are positioned in the fastest
growing segments of the mutual fund industry
(global and low cost index).
As the top chart displays, the average US fund is
three to four times the size of the average
worldwide fund (including the US). To maximize
AUM and revenues, MCM must target the US
market.
As the middle chart displays, the US mutual
fund market makes up almost half of the
worldwide market. Again, to maximize AUM
and revenues, the US must target the US
market.
The US has the largest average account size.
Fewer accounts equate to lower account
management costs. Lower costs mean higher
profit margins.
Because the US has the largest average fund
size, most AUM, and the largest average
account size, MCM’s target market will be US
investors.

12
15. Entity Structures
Both the MCM Equity Fund and MCM Fixed Income Fund will be c-corporation regulated investment
companies (RICs) set forth in subchapter M of the Internal Revenue Code. Subchapter M allows for tax-
exempt entities. However, the investors are taxed on capital gains and dividends. For example, if the
MCM Equity Fund has capital gains of 8% and dividends of 3% in a given year, it is not itself taxed.
Investors in the funds are taxed on capital gains when they take their capital out of MCM Equity Fund
and taxed on dividends quarterly. A RIC is the legal structure used by almost all mutual funds.
The MCM Equity Fund and MCM Fixed Income Fund will both be managed by a limited liability company
(LLC) named Marshall Capital Management (MCM). The RIC c-corporations (MCM Equity and Fixed
Income Funds) will both pay 0.25% of AUM to MCM annually. Because, MCM is a LLC it will not be
subject to double taxation as if it were a c-corporation. The LLC is a pass through entity. Therefore,
profits are passed on to the shareholders who are taxed at their ordinary income levels.
If MCM is sold, gains will be taxed at the capital gains rate (currently 15%).
16. The Role of MCM Financial Advisors
MCM Financial Advisors will be the only salespeople employed by MCM. They will be paid 0.05% (5 bps
(basis points)) of all investments they sell. They will receive commissions on a reoccurring basis. For
example, if a MCM Financial Advisor sells 1m in investments, they will receive $500 immediately and
every year the investments stay with MCM.
MCM Financial Advisors will sell in bulk. They will primarily sell 401(k) plans. 401(k) plans are pooled
investments offered from employers to employees. MCM Financial Advisors will also sell investment
services to institutional investors (such as banks, insurance companies, pension funds and endowments)
and high net worth individuals.
Because MCM Financial Advisors are paid 5 bps, they will not sell to individual investors. Individual
investor accounts such as individual retirement arrangements (IRAs) and college savings accounts (529
Plans) will not be sold by MCM Financial Advisors. IRA’s have a maximum annual contribution limit of
$5,000. A MCM Financial Advisor would earn $2.50 annually per fully funded IRA. This would obviously
not be worth their time.
17. The Role of Certified Financial Planners
Certified Financial Advisors (CFAs) are financial planning professionals paid directly by their clients.
Because, MCM does not have to pay CFAs, they can be utilized for smaller accounts such as IRAs, 529
Plans, and low net-worth individuals. CFAs will have the option of investing their clients’ capital with
MCM. MCM will have a CFA relations department. CFAs will have the ability to list themselves on the
MCM webpage. Therefore, interested individual investors will have the ability to select a CFA from the
MCM webpage and invest their capital with MCM.

13
18. Competition – Low Cost Global Equities
Currently, the lowest cost global equity fund is the iShares MSCI ACWI Index Fund. It is an exchange
traded fund (ETF) with an expense ratio of 0.35%. MCM’s Equity Fund expense ratio is 0.25%. The
following are taken from the fund’s factsheet (the entire factsheet can be found at
http://us.ishares.com/product_info/fund/overview/ACWI.htm).
14
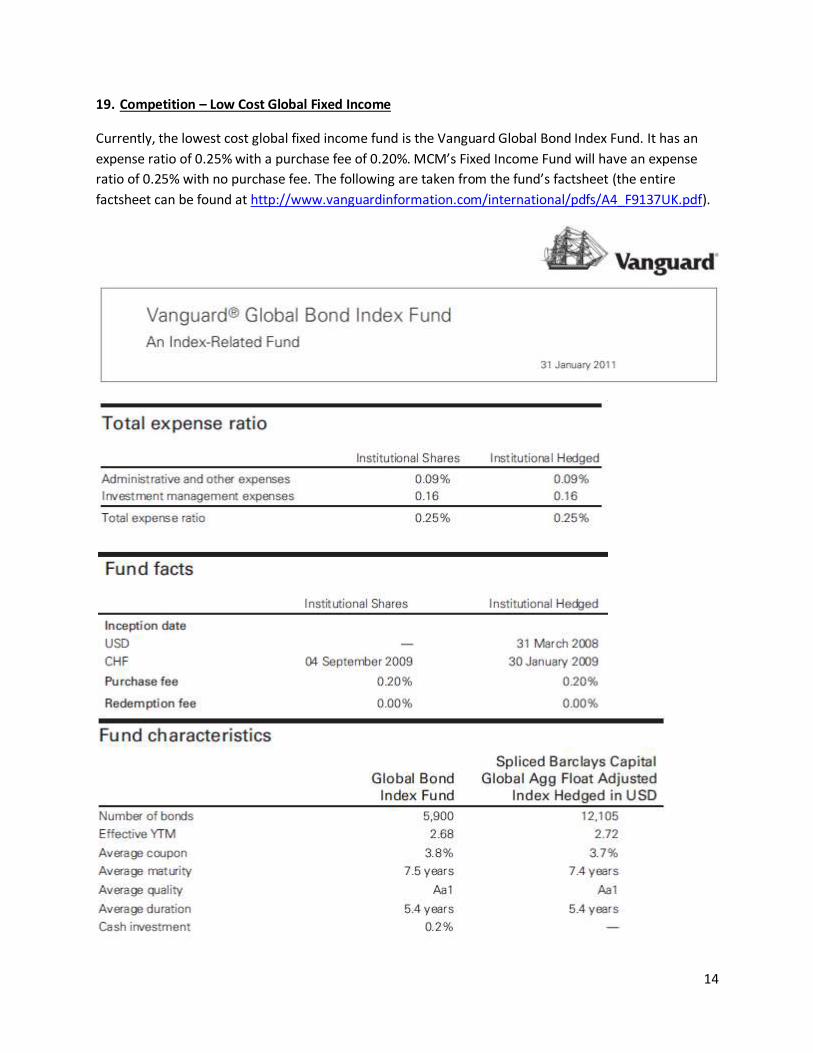
19. Competition – Low Cost Global Fixed Income
Currently, the lowest cost global fixed income fund is the Vanguard Global Bond Index Fund. It has an
expense ratio of 0.25% with a purchase fee of 0.20%. MCM’s Fixed Income Fund will have an expense
ratio of 0.25% with no purchase fee. The following are taken from the fund’s factsheet (the entire
factsheet can be found at http://www.vanguardinformation.com/international/pdfs/A4_F9137UK.pdf).

15
16
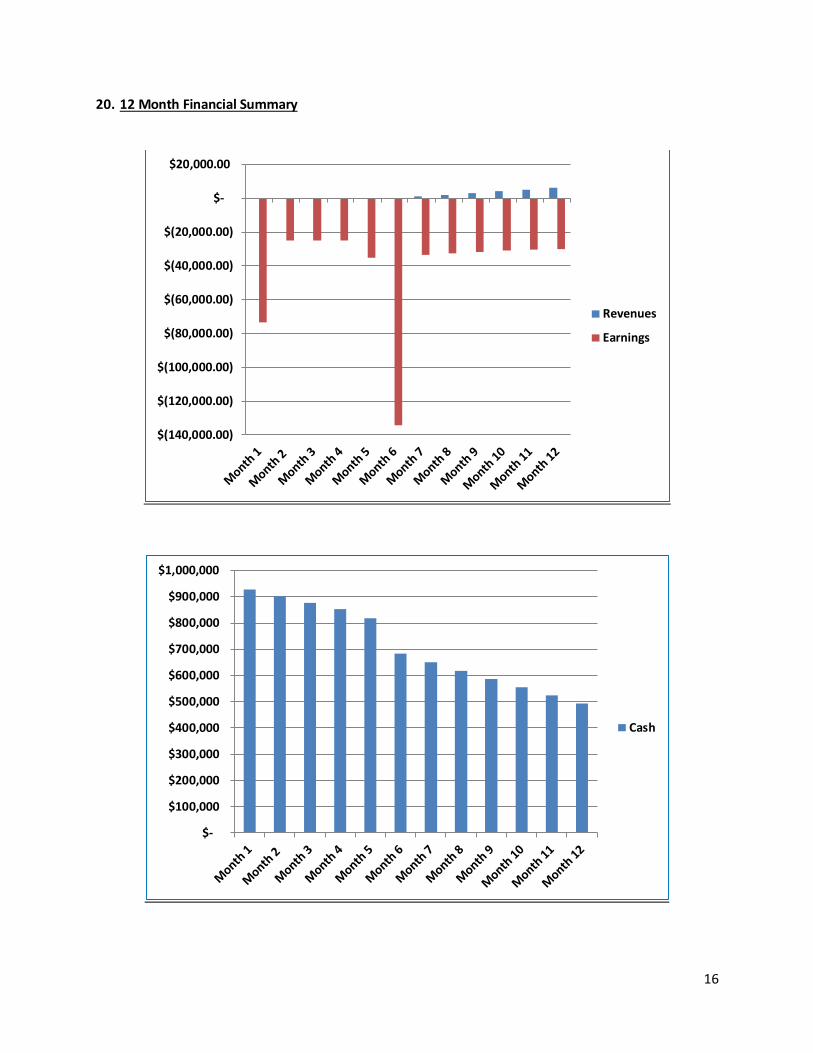
20. 12 Month Financial Summary
$(140,000.00)
$(120,000.00)
$(100,000.00)
$(80,000.00)
$(60,000.00)
$(40,000.00)
$(20,000.00)
$-
$20,000.00
Revenues
Earnings
$-
$100,000
$200,000
$300,000
$400,000
$500,000
$600,000
$700,000
$800,000
$900,000
$1,000,000
Cash

17
21. Six Year Financial Summary
$(1,000,000)
$-
$1,000,000
$2,000,000
$3,000,000
$4,000,000
$5,000,000
$6,000,000
$7,000,000
Year 1 Year 2 Year 3 Year 4 Year 5 Year 6
Revenues
Earnings
$-
$500,000
$1,000,000
$1,500,000
$2,000,000
$2,500,000
$3,000,000
$3,500,000
$4,000,000
$4,500,000
Year 1 Year 2 Year 3 Year 4 Year 5 Year 6
Cash

18
22. Start Up Costs & Capital Needs
# Start-Up Expenses - In Order Of Execution & Capital Needs Cost Side-Notes Estimated Schedule
1 Equities Mutual Fund Corporation $ 100 One-Time 1st Month
2 Fixed Income Mutual Fund Corporation $ 100 One-Time 1st Month
3 Mutual Funds Management LLC $ 250 One-Time 1st Month
4 Management LLC President/Manager $ 100,000 Per Year 1st Month
5 Contracts $ 50,000 One-Time 6th Month
6 Trademarks $ 1,000 One-Time 1st Month
7 Domain Name $ 5,000 One-Time 1st Month
8 Travel to India $ 20,000 Per Year 1st Month
9 Office $ 25,000 Per Year 2nd Month
10 IT Employee/Webpage $ 12,000 Per Year 3rd Month
11 Equities Portfolio Manager $ 50,000 Per Year 5th Month
12 Fixed Income Portfolio Manager $ 50,000 Per Year 5th Month
13 Account Manager $ 20,000 Per Year 5th Month
14 MSCI All Country World Investable Market Index Software $ 70,000 Per Year - All Due Upfront 5th Month
15 Barclays Capital Global Aggregate Bond Index Software $ 30,000 Per Year - All Due Upfront 5th Month
16 CFP Sales Manager $ 50,000 Per Year 6th Month
17 Various $ 100,000 Per Year 1st Month
TOTAL START-UP EXPENSES $ 583,450 - -
18 Cash Burn Rate Until Profitable $ 117,083 18.1 Months -
19 Cushion $ 299,467 23.0 Months -
TOTAL $ 1,000,000 - -
20 Hire 401(k)/Institutional Investor Salespeople Commission 5 bps (0.05%) reoccurring -

19
23. Pro Forma 12 Month Income Statement
12 MONTH INCOME STATEMENT Month 1 Month 2 Month 3 Month 4 Month 5 Month 6
AUM $ - $ - $ - $ - $ - $ -
Revenues $ - $ - $ - $ - $ - $ -
Expenses
Equities Mutual Fund Corporation $ 100 $ - $ - $ - $ - $ -
Fixed Income Mutual Fund Corporation $ 100 $ - $ - $ - $ - $ -
Mutual Funds Management LLC $ 250 $ - $ - $ - $ - $ -
Management LLC President/Manager $ 8,400 $ 8,400 $ 8,400 $ 8,400 $ 8,400 $ 8,400
Contracts $ 50,000 $ - $ - $ - $ - $ -
Trademarks $ 1,000 $ - $ - $ - $ - $ -
Domain Name $ 5,000 $ - $ - $ - $ - $ -
Travel to India $ - $ 5,000 $ 5,000 $ 5,000 $ 5,000 $ -
Office $ - $ 2,100 $ 2,100 $ 2,100 $ 2,100 $ 2,100
IT Employee/Webpage $ - $ 1,000 $ 1,000 $ 1,000 $ 1,000 $ 1,000
Equities Portfolio Manager $ - $ - $ - $ - $ 4,200 $ 4,200
Fixed Income Portfolio Manager $ - $ - $ - $ - $ 4,200 $ 4,200
Account Manager $ - $ - $ - $ - $ 1,700 $ 1,700
MSCI Software $ - $ - $ - $ - $ - $ 70,000
Barclays Capital Software $ - $ - $ - $ - $ - $ 30,000
CFP Sales Manager $ - $ - $ - $ - $ - $ 4,200
Financial Advisors $ - $ - $ - $ - $ - $ -
Various $ 8,400 $ 8,400 $ 8,400 $ 8,400 $ 8,400 $ 8,400
Total Expenses $ 73,250 $ 24,900 $ 24,900 $ 24,900 $ 35,000 $ 134,200
EBT $ (73,250) $ (24,900) $ (24,900) $ (24,900) $ (35,000) $ (134,200)
Taxes $ - $ - $ - $ - $ - $ -
Net income $ (73,250) $ (24,900) $ (24,900) $ (24,900) $ (35,000) $ (134,200)

20
12 MONTH INCOME STATEMENT Month 7 Month 8 Month 9 Month 10 Month 11 Month 12
AUM $ 5,000,000 $ 10,000,000 $ 15,000,000 $ 20,000,000 $ 25,000,000 $ 30,000,000
Revenues $ 1,042 $ 2,083 $ 3,125 $ 4,167 $ 5,208 $ 6,250
Expenses
Equities Mutual Fund Corporation $ - $ - $ - $ - $ - $ -
Fixed Income Mutual Fund Corporation $ - $ - $ - $ - $ - $ -
Mutual Funds Management LLC $ - $ - $ - $ - $ - $ -
Management LLC President/Manager $ 8,400 $ 8,400 $ 8,400 $ 8,400 $ 8,400 $ 8,400
Contracts $ - $ - $ - $ - $ - $ -
Trademarks $ - $ - $ - $ - $ - $ -
Domain Name $ - $ - $ - $ - $ - $ -
Travel to India $ - $ - $ - $ - $ - $ -
Office $ 2,100 $ 2,100 $ 2,100 $ 2,100 $ 2,100 $ 2,100
IT Employee/Webpage $ 1,000 $ 1,000 $ 1,000 $ 1,000 $ 1,000 $ 1,000
Equities Portfolio Manager $ 4,200 $ 4,200 $ 4,200 $ 4,200 $ 4,200 $ 4,200
Fixed Income Portfolio Manager $ 4,200 $ 4,200 $ 4,200 $ 4,200 $ 4,200 $ 4,200
Account Manager $ 1,700 $ 1,700 $ 1,700 $ 1,700 $ 2,083 $ 2,500
MSCI Software $ - $ - $ - $ - $ - $ -
Barclays Capital Software $ - $ - $ - $ - $ - $ -
CFP Sales Manager $ 4,200 $ 4,200 $ 4,200 $ 4,200 $ 4,200 $ 4,200
Financial Advisors $ 208 $ 417 $ 625 $ 833 $ 1,042 $ 1,250
Various $ 8,400 $ 8,400 $ 8,400 $ 8,400 $ 8,400 $ 8,400
Total Expenses $ 34,408 $ 34,617 $ 34,825 $ 35,033 $ 35,625 $ 36,250
EBT $ (33,367) $ (32,533) $ (31,700) $ (30,867) $ (30,417) $ (30,000)
Taxes $ - $ - $ - $ - $ - $ -
Net income $ (33,367) $ (32,533) $ (31,700) $ (30,867) $ (30,417) $ (30,000)

21
24. Pro Forma 12 Month Balance Sheet
12 MONTH BALANCE SHEET Month 1 Month 2 Month 3 Month 4 Month 5 Month 6
ASSETS
CASH & SHORT-TERM INVESTMENTS $ 926,750 $ 901,850 $ 876,950 $ 852,050 $ 817,050 $ 682,850
LIABILITIES
NO MAJOR LIABILITIES
Some A/P Not Listed $ - $ - $ - $ - $ - $ -
Some Payroll Burden Not Listed $ - $ - $ - $ - $ - $ -
SHAREHOLDER'S EQUITY
Paid-In Capital $ 1,000,000 $ 1,000,000 $ 1,000,000 $ 1,000,000 $ 1,000,000 $ 1,000,000
RETAINED EARNINGS $ (73,250) $ (98,150) $ (123,050) $ (147,950) $ (182,950) $ (317,150)
TOTAL LIABILITIES & SHAREHOLDER'S EQUITY $ 926,750 $ 901,850 $ 876,950 $ 852,050 $ 817,050 $ 682,850
12 MONTH BALANCE SHEET Month 7 Month 8 Month 9 Month 10 Month 11 Month 12
ASSETS
CASH & SHORT-TERM INVESTMENTS $ 649,483 $ 616,950 $ 585,250 $ 554,383 $ 523,967 $ 493,967
LIABILITIES
NO MAJOR LIABILITIES
Some A/P Not Listed $ - $ - $ - $ - $ - $ -
Some Payroll Burden Not Listed $ - $ - $ - $ - $ - $ -
SHAREHOLDER'S EQUITY
Paid-In Capital $ 1,000,000 $ 1,000,000 $ 1,000,000 $ 1,000,000 $ 1,000,000 $ 1,000,000
RETAINED EARNINGS $ (350,517) $ (383,050) $ (414,750) $ (445,617) $ (476,033) $ (506,033)
TOTAL LIABILITIES & SHAREHOLDER'S EQUITY $ 649,483 $ 616,950 $ 585,250 $ 554,383 $ 523,967 $ 493,967

22
25. Pro Forma 12 Month Statement of Cash Flows
12 MONTH STATEMENT OF CASH FLOWS Month 1 Month 2 Month 3 Month 4 Month 5 Month 6
OPERATING ACTIVITIES
Net Income $ (73,250) $ (24,900) $ (24,900) $ (24,900) $ (35,000) $ (134,200)
Cash from Operating Activities $ (73,250) $ (24,900) $ (24,900) $ (24,900) $ (35,000) $ (134,200)
INVESTING ACTIVITIES
NONE $ - $ - $ - $ - $ - $ -
Cash from Investing Activities $ - $ - $ - $ - $ - $ -
FINANCING ACTIVITIES
DIVIDENDS $ - $ - $ - $ - $ - $ -
Cash from Financing Activities $ - $ - $ - $ - $ - $ -
Change in Cash $ (73,250) $ (24,900) $ (24,900) $ (24,900) $ (35,000) $ (134,200)
Cash - Beginning Balance $ 1,000,000 $ 926,750 $ 901,850 $ 876,950 $ 852,050 $ 817,050
Cash - Ending Balance $ 926,750 $ 901,850 $ 876,950 $ 852,050 $ 817,050 $ 682,850
12 MONTH STATEMENT OF CASH FLOWS Month 7 Month 8 Month 9 Month 10 Month 11 Month 12
OPERATING ACTIVITIES
Net Income $ (33,367) $ (32,533) $ (31,700) $ (30,867) $ (30,417) $ (30,000)
Cash from Operating Activities $ (33,367) $ (32,533) $ (31,700) $ (30,867) $ (30,417) $ (30,000)
INVESTING ACTIVITIES
NONE $ - $ - $ - $ - $ - $ -
Cash from Investing Activities $ - $ - $ - $ - $ - $ -
FINANCING ACTIVITIES
DIVIDENDS $ - $ - $ - $ - $ - $ -
Cash from Financing Activities $ - $ - $ - $ - $ - $ -
Change in Cash $ (33,367) $ (32,533) $ (31,700) $ (30,867) $ (30,417) $ (30,000)
Cash - Beginning Balance $ 682,850 $ 649,483 $ 616,950 $ 585,250 $ 554,383 $ 523,967
Cash - Ending Balance $ 649,483 $ 616,950 $ 585,250 $ 554,383 $ 523,967 $ 493,967

23
26. Pro Forma Six Year Income Statement
6 YEAR INCOME STATEMENT Year 1 Year 2 Year 3 Year 4 Year 5 Year 6
AUM $ 30,000,000 $ 624,000,000 $ 1,218,000,000 $ 1,812,000,000 $ 2,406,000,000 $ 3,000,000,000
Revenues $ 21,875 $ 879,375 $ 2,364,375 $ 3,849,375 $ 5,334,375 $ 6,819,375
Expenses
Equities Mutual Fund Corporation $ 100 $ - $ - $ - $ - $ -
Fixed Income Mutual Fund Corporation $ 100 $ - $ - $ - $ - $ -
Mutual Funds Management LLC $ 250 $ - $ - $ - $ - $ -
Management LLC President/Manager $ 100,800 $ 100,800 $ 100,800 $ 100,800 $ 100,800 $ 100,800
Contracts $ 50,000 $ - $ - $ - $ - $ -
Trademarks $ 1,000 $ - $ - $ - $ - $ -
Domain Name $ 5,000 $ - $ - $ - $ - $ -
Travel to India $ 20,000 $ - $ - $ - $ - $ -
Office $ 23,100 $ 25,200 $ 25,200 $ 25,200 $ 25,200 $ 25,200
IT Employee/Webpage $ 11,000 $ 12,000 $ 12,000 $ 12,000 $ 12,000 $ 12,000
Equities Portfolio Manager $ 33,600 $ 50,400 $ 50,400 $ 50,400 $ 50,400 $ 50,400
Fixed Income Portfolio Manager $ 33,600 $ 50,400 $ 50,400 $ 50,400 $ 50,400 $ 50,400
Account Managers $ 14,783 $ 351,750 $ 945,750 $ 1,539,750 $ 2,133,750 $ 2,727,750
MSCI Software $ 70,000 $ 70,000 $ - $ - $ - $ -
Barclays Capital Software $ 30,000 $ 30,000 $ - $ - $ - $ -
CFP Sales Managers $ 29,400 $ 50,400 $ 50,400 $ 50,400 $ 50,400 $ 50,400
Financial Advisor Commissions $ 4,375 $ 175,875 $ 472,875 $ 769,875 $ 1,066,875 $ 1,363,875
Various $ 100,800 $ 100,800 $ 100,878 $ 101,022 $ 101,166 $ 101,310
Total Expenses $ 527,908 $ 1,017,625 $ 1,808,703 $ 2,699,847 $ 3,590,991 $ 4,482,135
EBT $ (506,033) $ (138,250) $ 555,672 $ 1,149,528 $ 1,743,384 $ 2,337,240
Taxes $ - $ 19,688 $ 194,485 $ 402,335 $ 610,184 $ 818,034
Net income $ (506,033) $ (157,938) $ 361,187 $ 747,193 $ 1,133,200 $ 1,519,206
% -2313% -18% 15% 19% 21% 22%

24
27. Pro Forma Six Year Balance Sheet
6 YEAR BALANCE SHEET Year 1 Year 2 Year 3 Year 4 Year 5 Year 6
ASSETS
CASH & SHORT-TERM INVESTMENTS $ 493,967 $ 336,029 $ 697,216 $ 1,444,409 $ 2,577,609 $ 4,096,815
LIABILITIES
NO MAJOR LIABILITIES
Some A/P Not Listed $ - $ - $ - $ - $ - $ -
Some Payroll Burden Not Listed $ - $ - $ - $ - $ - $ -
SHAREHOLDER'S EQUITY
Paid-In Capital $ 1,000,000 $ 1,000,000 $ 1,000,000 $ 1,000,000 $ 1,000,000 $ 1,000,000
RETAINED EARNINGS $ (506,033) $ (663,971) $ (302,784) $ 444,409 $ 1,577,609 $ 3,096,815
TOTAL LIABILITIES & SHAREHOLDER'S EQUITY $ 493,967 $ 336,029 $ 697,216 $ 1,444,409 $ 2,577,609 $ 4,096,815

25
28. Pro Forma Six Year Statement of Cash Flows
3 YEAR STATEMENT OF CASH FLOWS Year 1 Year 2 Year 3 Year 4 Year 5 Year 6
OPERATING ACTIVITIES
Net Income $ (506,033) $ (157,938) $ 361,187 $ 747,193 $ 1,133,200 $ 1,519,206
Cash from Operating Activities $ (506,033) $ (157,938) $ 361,187 $ 747,193 $ 1,133,200 $ 1,519,206
INVESTING ACTIVITIES
NONE $ - $ - $ - $ - $ - $ -
Cash from Investing Activities $ - $ - $ - $ - $ - $ -
FINANCING ACTIVITIES
DIVIDENDS $ - $ - $ - $ - $ - $ -
Cash fron Financing Activities $ - $ - $ - $ - $ - $ -
Change in Cash $ (506,033) $ (157,938) $ 361,187 $ 747,193 $ 1,133,200 $ 1,519,206
Cash - Beginning Balance $ 1,000,000 $ 493,967 $ 336,029 $ 697,216 $ 1,444,409 $ 2,577,609
Cash - Ending Balance $ 493,967 $ 336,029 $ 697,216 $ 1,444,409 $ 2,577,609 $ 4,096,815
26
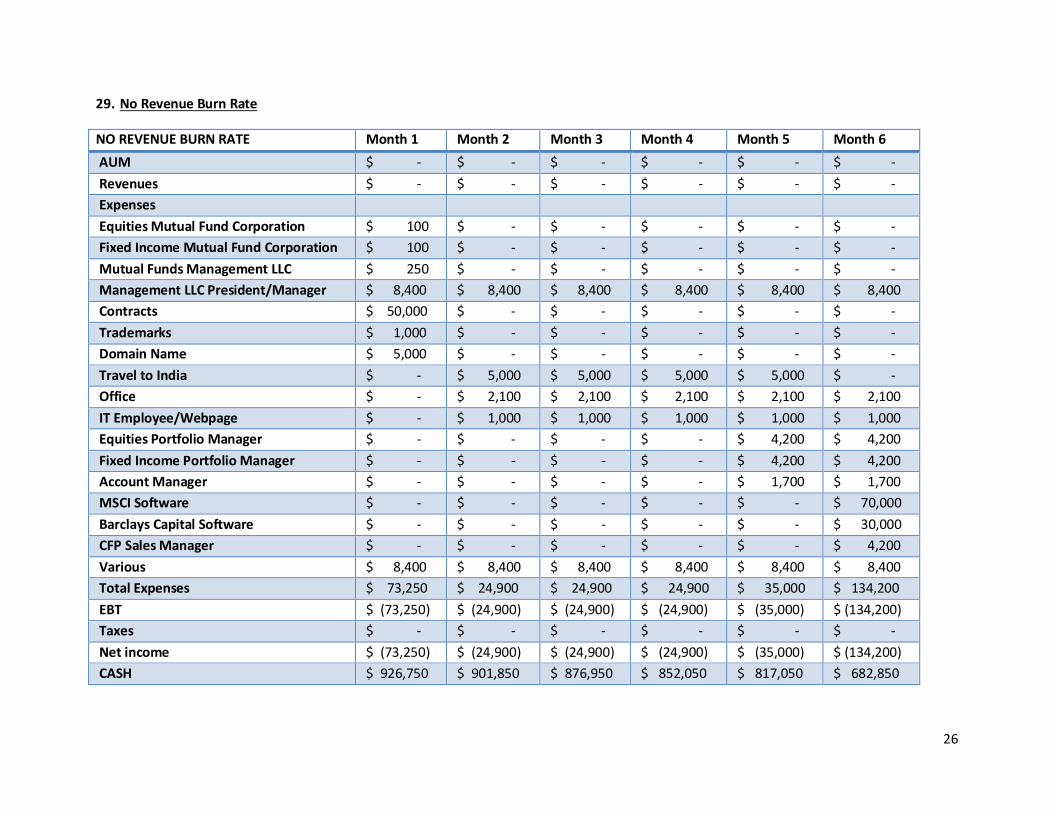
29. No Revenue Burn Rate
NO REVENUE BURN RATE Month 1 Month 2 Month 3 Month 4 Month 5 Month 6
AUM $ - $ - $ - $ - $ - $ -
Revenues $ - $ - $ - $ - $ - $ -
Expenses
Equities Mutual Fund Corporation $ 100 $ - $ - $ - $ - $ -
Fixed Income Mutual Fund Corporation $ 100 $ - $ - $ - $ - $ -
Mutual Funds Management LLC $ 250 $ - $ - $ - $ - $ -
Management LLC President/Manager $ 8,400 $ 8,400 $ 8,400 $ 8,400 $ 8,400 $ 8,400
Contracts $ 50,000 $ - $ - $ - $ - $ -
Trademarks $ 1,000 $ - $ - $ - $ - $ -
Domain Name $ 5,000 $ - $ - $ - $ - $ -
Travel to India $ - $ 5,000 $ 5,000 $ 5,000 $ 5,000 $ -
Office $ - $ 2,100 $ 2,100 $ 2,100 $ 2,100 $ 2,100
IT Employee/Webpage $ - $ 1,000 $ 1,000 $ 1,000 $ 1,000 $ 1,000
Equities Portfolio Manager $ - $ - $ - $ - $ 4,200 $ 4,200
Fixed Income Portfolio Manager $ - $ - $ - $ - $ 4,200 $ 4,200
Account Manager $ - $ - $ - $ - $ 1,700 $ 1,700
MSCI Software $ - $ - $ - $ - $ - $ 70,000
Barclays Capital Software $ - $ - $ - $ - $ - $ 30,000
CFP Sales Manager $ - $ - $ - $ - $ - $ 4,200
Various $ 8,400 $ 8,400 $ 8,400 $ 8,400 $ 8,400 $ 8,400
Total Expenses $ 73,250 $ 24,900 $ 24,900 $ 24,900 $ 35,000 $ 134,200
EBT $ (73,250) $ (24,900) $ (24,900) $ (24,900) $ (35,000) $ (134,200)
Taxes $ - $ - $ - $ - $ - $ -
Net income $ (73,250) $ (24,900) $ (24,900) $ (24,900) $ (35,000) $ (134,200)
CASH $ 926,750 $ 901,850 $ 876,950 $ 852,050 $ 817,050 $ 682,850

27
NO REVENUE BURN RATE Month 7 Month 8 Month 9 Month 10 Month 11 Month 12
AUM $ - $ - $ - $ - $ - $ -
Revenues $ - $ - $ - $ - $ - $ -
Expenses
Equities Mutual Fund Corporation $ - $ - $ - $ - $ - $ -
Fixed Income Mutual Fund Corporation $ - $ - $ - $ - $ - $ -
Mutual Funds Management LLC $ - $ - $ - $ - $ - $ -
Management LLC President/Manager $ 8,400 $ 8,400 $ 8,400 $ 8,400 $ 8,400 $ 8,400
Contracts $ - $ - $ - $ - $ - $ -
Trademarks $ - $ - $ - $ - $ - $ -
Domain Name $ - $ - $ - $ - $ - $ -
Travel to India $ - $ - $ - $ - $ - $ -
Office $ 2,100 $ 2,100 $ 2,100 $ 2,100 $ 2,100 $ 2,100
IT Employee/Webpage $ 1,000 $ 1,000 $ 1,000 $ 1,000 $ 1,000 $ 1,000
Equities Portfolio Manager $ 4,200 $ 4,200 $ 4,200 $ 4,200 $ 4,200 $ 4,200
Fixed Income Portfolio Manager $ 4,200 $ 4,200 $ 4,200 $ 4,200 $ 4,200 $ 4,200
Account Manager $ 1,700 $ 1,700 $ 1,700 $ 1,700 $ 1,700 $ 1,700
MSCI Software $ - $ - $ - $ - $ - $ -
Barclays Capital Software $ - $ - $ - $ - $ - $ -
CFP Sales Manager $ 4,200 $ 4,200 $ 4,200 $ 4,200 $ 4,200 $ 4,200
Various $ 8,400 $ 8,400 $ 8,400 $ 8,400 $ 8,400 $ 8,400
Total Expenses $ 34,200 $ 34,200 $ 34,200 $ 34,200 $ 34,200 $ 34,200
EBT $ (34,200) $ (34,200) $ (34,200) $ (34,200) $ (34,200) $ (34,200)
Taxes $ - $ - $ - $ - $ - $ -
Net income $ (34,200) $ (34,200) $ (34,200) $ (34,200) $ (34,200) $ (34,200)
CASH $ 448,650 $ 414,450 $ 380,250 $ 346,050 $ 311,850 $ 277,650

28
NO REVENUE BURN RATE Month 13 Month 14 Month 15 Month 16 Month 17 Month 18
AUM $ - $ - $ - $ - $ - $ -
Revenues $ - $ - $ - $ - $ - $ -
Expenses
Equities Mutual Fund Corporation $ - $ - $ - $ - $ - $ -
Fixed Income Mutual Fund Corporation $ - $ - $ - $ - $ - $ -
Mutual Funds Management LLC $ - $ - $ - $ - $ - $ -
Management LLC President/Manager $ 8,400 $ 8,400 $ 8,400 $ 8,400 $ 8,400 $ 8,400
Contracts $ - $ - $ - $ - $ - $ -
Trademarks $ - $ - $ - $ - $ - $ -
Domain Name $ - $ - $ - $ - $ - $ -
Travel to India $ - $ - $ - $ - $ - $ -
Office $ 2,100 $ 2,100 $ 2,100 $ 2,100 $ 2,100 $ 2,100
IT Employee/Webpage $ 1,000 $ 1,000 $ 1,000 $ 1,000 $ 1,000 $ 1,000
Equities Portfolio Manager $ 4,200 $ 4,200 $ 4,200 $ 4,200 $ 4,200 $ 4,200
Fixed Income Portfolio Manager $ 4,200 $ 4,200 $ 4,200 $ 4,200 $ 4,200 $ 4,200
Account Manager $ 1,700 $ 1,700 $ 1,700 $ 1,700 $ 1,700 $ 1,700
MSCI Software $ - $ - $ - $ - $ - $ 70,000
Barclays Capital Software $ - $ - $ - $ - $ - $ 30,000
CFP Sales Manager $ 4,200 $ 4,200 $ 4,200 $ 4,200 $ 4,200 $ 4,200
Various $ 8,400 $ 8,400 $ 8,400 $ 8,400 $ 8,400 $ 8,400
Total Expenses $ 34,200 $ 34,200 $ 34,200 $ 34,200 $ 34,200 $ 134,200
EBT $ (34,200) $ (34,200) $ (34,200) $ (34,200) $ (34,200) $ (134,200)
Taxes $ - $ - $ 1 $ 2 $ 3 $ 4
Net income $ (34,200) $ (34,200) $ (34,201) $ (34,202) $ (34,203) $ (134,204)
CASH $ 243,450 $ 209,250 $ 175,049 $ 140,847 $ 106,644 $ (27,560)

29
NO REVENUE BURN RATE Month 19 Month 20 Month 21 Month 22 Month 23 Month 24
AUM $ - $ - $ - $ - $ - $ -
Revenues $ - $ - $ - $ - $ - $ -
Expenses
Equities Mutual Fund Corporation $ - $ - $ - $ - $ - $ -
Fixed Income Mutual Fund Corporation $ - $ - $ - $ - $ - $ -
Mutual Funds Management LLC $ - $ - $ - $ - $ - $ -
Management LLC President/Manager $ 8,400 $ 8,400 $ 8,400 $ 8,400 $ 8,400 $ 8,400
Contracts $ - $ - $ - $ - $ - $ -
Trademarks $ - $ - $ - $ - $ - $ -
Domain Name $ - $ - $ - $ - $ - $ -
Travel to India $ - $ - $ - $ - $ - $ -
Office $ 2,100 $ 2,100 $ 2,100 $ 2,100 $ 2,100 $ 2,100
IT Employee/Webpage $ 1,000 $ 1,000 $ 1,000 $ 1,000 $ 1,000 $ 1,000
Equities Portfolio Manager $ 4,200 $ 4,200 $ 4,200 $ 4,200 $ 4,200 $ 4,200
Fixed Income Portfolio Manager $ 4,200 $ 4,200 $ 4,200 $ 4,200 $ 4,200 $ 4,200
Account Manager $ 1,700 $ 1,700 $ 1,700 $ 1,700 $ 1,700 $ 1,700
MSCI Software $ - $ - $ - $ - $ - $ -
Barclays Capital Software $ - $ - $ - $ - $ - $ -
CFP Sales Manager $ 4,200 $ 4,200 $ 4,200 $ 4,200 $ 4,200 $ 4,200
Various $ 8,400 $ 8,400 $ 8,400 $ 8,400 $ 8,400 $ 8,400
Total Expenses $ 34,200 $ 34,200 $ 34,200 $ 34,200 $ 34,200 $ 34,200
EBT $ (34,200) $ (34,200) $ (34,200) $ (34,200) $ (34,200) $ (34,200)
Taxes $ - $ - $ - $ - $ - $ -
Net income $ (34,200) $ (34,200) $ (34,200) $ (34,200) $ (34,200) $ (34,200)
CASH $ 138,250 $ 104,050 $ 69,850 $ 35,650 $ 1,450 $ (32,750)

30
30. AUM & Revenue Break Even Analysis
AUM & REVENUE BREAK EVEN Year X
AUM $ 331,725,000
Revenues $ 829,313
Expenses
Equities Mutual Fund Corporation $ 100
Fixed Income Mutual Fund Corporation $ 100
Mutual Funds Management LLC $ 250
Management LLC President/Manager $ 100,000
Contracts $ 50,000
Trademarks $ 1,000
Domain Name $ 5,000
Travel to India $ 20,000
Office $ 25,000
IT Employee/Webpage $ 12,000
Equities Portfolio Manager $ 50,000
Fixed Income Portfolio Manager $ 50,000
Account Managers $ 100,000
MSCI Software $ 70,000
Barclays Capital Software $ 30,000
CFP Sales Managers $ 50,000
Financial Advisor Commissions $ 165,862
Various $ 100,000
Total Expenses $ 829,312
EBT $ -
Projected B/E (Time) 18.1 Months
$-
$100,000,000
$200,000,000
$300,000,000
$400,000,000
$500,000,000
$600,000,000
$700,000,000
Projected AUM
AUM Break Even

31
31. Founder Bio

32
32. Six Year ROI, IRR & NPV
ROI Time 0 Year 1 Year 2 Year 3 Year 4 Year 5 Year 6
3.8 $ (1,000,000) $ (506,033) $ (157,938) $ 361,187 $ 747,193 $ 1,133,200 $ 1,519,206
IRR Time 0 Year 1 Year 2 Year 3 Year 4 Year 5 Year 6
20% $ (1,000,000) $ (506,033) $ (157,938) $ 361,187 $ 747,193 $ 1,133,200 $ 1,519,206
33. Ratio Valuation
ROI Time 0 Year 1 Year 2 Year 3 Year 4 Year 5 Year 6 (Sale) Returns to Investors (51%)
10.6 $ (1,000,000) $ - $ - $ - $ - $ - $ 10,634,442 $ 5,423,565
IRR Time 0 Year 1 Year 2 Year 3 Year 4 Year 5 Year 6 (Sale) Returns to Investors (51%)
48% $ (1,000,000) $ - $ - $ - $ - $ - $ 10,634,442 $ 5,423,565
NPV Year 1 Year 2 Year 3 Year 4 Year 5 Year 6 (Sale) Returns to Investors (51%)
$2,534,500 $ - $ - $ - $ - $ - $ 10,634,442 $ 5,423,565
Figures Assume
NPV is discounted at 27% (the average return to angel investors)
Year 6 AUM of 3 trillion (average US fund size is 1.5 trillion & there are two funds)
MCM is sold for 7x earnings (½ the stock market average P/E ratio)
MCM is sold in six years (the average sale time of an angel investor home run)
Earnings are $1,519,206 in year six

33
34. Discounted Cash Flow Valuation (Perpetuity)
Entire Business Returns to Investors (51%)
$15,192,060 $7,747,951
ROI Time 0 Year 1 Year 2 Year 3 Year 4 Year 5 Year 6 (Sale) Returns to Investors (51%)
15.2 $ (1,000,000) $ - $ - $ - $ - $ - $ 15,192,060 $ 7,747,951
IRR Time 0 Year 1 Year 2 Year 3 Year 4 Year 5 Year 6 (Sale) Returns to Investors (51%)
57% $ (1,000,000) $ - $ - $ - $ - $ - $ 15,192,060 $ 7,747,951
NPV Year 1 Year 2 Year 3 Year 4 Year 5 Year 6 (Sale) Returns to Investors (51%)
$3,620,715 $ - $ - $ - $ - $ - $ 15,192,060 $ 7,747,951
Figures Assume
MCM will earn $1,519,206 in perpetuity (the figures are calculated for 200 years from time of sale)
Net profits equate to cash flows due to no increases in fixed assets or accounts receivable
Other assumptions (discount rate, AUM, sale time) are the same as section 33 – Ratio Valuation
35. Exit Strategy
Upon reaching 3b or more in AUM, MCM would like to sell itself to Vanguard. Vanguard manages over one trillion in assets. It is the low cost
leader in mutual and index funds. MCM feels Vanguard would be interested in purchasing the company due to a working business model that
outsources portfolio and account management to India. These measures could further decrease Vanguard’s overall expense ratio.
10% (2x the stock market WACC) is used as the discount rate of the
entire business.

34
36. The Offering
Although the NPV of MCM is between $2,534,500 and $3,620,715, the founder is willing to sell a controlling interest (51%) in the company for $1,000,000. 51% equity in MCM equates to a NPV of between $1,292,595 and $1,846,565. The founder realizes that entrepreneurs often want to keep a company instead of sell it against better judgment. Because of this factor, the founder would like the decision to sell or keep the company in the hands of Investors. The founder believes this will maximize his gains as well as those of angel investors.
Equity Investment
51% $ 1,000,000
Returns to Investors – Ratio Valuation
ROI Time 0 Year 1 Year 2 Year 3 Year 4 Year 5 Year 6 (Sale)
5.4 $ (1,000,000) $ - $ - $ - $ - $ - $ 5,423,565
IRR Time 0 Year 1 Year 2 Year 3 Year 4 Year 5 Year 6 (Sale)
33% $ (1,000,000) $ - $ - $ - $ - $ - $ 5,423,565
NPV Year 1 Year 2 Year 3 Year 4 Year 5 Year 6 (Sale)
$1,292,595 $ - $ - $ - $ - $ - $ 5,423,565
Returns to Investors – DCF Valuation
ROI Time 0 Year 1 Year 2 Year 3 Year 4 Year 5 Year 6 (Sale)
7.7 $ (1,000,000) $ - $ - $ - $ - $ - $ 7,747,951
IRR Time 0 Year 1 Year 2 Year 3 Year 4 Year 5 Year 6 (Sale)
41% $ (1,000,000) $ - $ - $ - $ - $ - $ 7,747,951
NPV Year 1 Year 2 Year 3 Year 4 Year 5 Year 6 (Sale)
$1,846,565 $ - $ - $ - $ - $ - $ 7,747,951
$(1,000,000)
$1,000,000
$3,000,000
$5,000,000
$7,000,000
$9,000,000
Time 0 Year 1 Year 2 Year 3 Year 4 Year 5 Year 6(Sale)
Investor Returns (Ratio)
Investor Returns (DCF)


