
Understanding the difficulty of training deep feedforward neural
Upload
truongduongCategory
view
227download
5
Sample Size Requirements For Feedforward Neural Networks
Michael J. Turmon Cornell U niv. Electrical Engineering
Ithaca, NY 14853 [email protected]
Terrence L. Fine Cornell Univ. Electrical Engineering
Ithaca, NY 14853 [email protected]
Abstract
We estimate the number of training samples required to ensure that the performance of a neural network on its training data matches that obtained when fresh data is applied to the network. Existing estimates are higher by orders of magnitude than practice indicates. This work seeks to narrow the gap between theory and practice by transforming the problem into determining the distribution of the supremum of a random field in the space of weight vectors, which in turn is attacked by application of a recent technique called the Poisson clumping heuristic.
1 INTRODUCTION AND KNOWN RESULTS
We investigate the tradeofi"s among network complexity, training set size, and statistical performance of feedforward neural networks so as to allow a reasoned choice of network architecture in the face of limited training data. Nets are functions 7](x; w), parameterized by their weight vector w E W ~ Rd , which take as input points x E Rk. For classifiers, network output is restricted to {a, 1} while for forecasting it may be any real number. The architecture of all nets under consideration is N, whose complexity may be gauged by its Vapnik-Chervonenkis (VC) dimension v, the size of the largest set of inputs the architecture can classify in any desired way ('shatter'). Nets 7] EN are chosen on the basis of a training set T = {(Xi, YiHr=l. These n samples are i.i.d. according to an unknown probability law P. Performance of a network is measured by the mean-squared error
E(w) E(7](x; w) - y)2 (1) = P(7](x;w);/; y) (for classifiers) (2)

328 Michael Turman, Terrence L. Fine
and a good (perhaps not unique) net in the architecture is WO = argmiIlwew £(w). To select a net using the training set we employ the empirical error
1 n VT(W) = - I)11(Xi; w) - Yi)2 (3)
n i=l
sustained by 11(·; w) on the training set T. A good choice for a classifier is then w· = argmiIlwew VT(W). In these terms, the issue raised in the first sentence ofthe section can be restated as, "How large must n be in order to ensure £(w·)-£(WO) $ i with high probability?"
For purposes of analysis we can avoid dealing directly with the stochastically chosen network w· by noting
£(w·) - £(WO) $ IVT(W·) - £(w·)1 + IVT(WO) - £(wo)1 $ 2 sup IVT(W) - £(w)1 wEW
A bound on the last quantity is also useful in its own right.
The best-known result is in (Vapnik, 1982), introduced to the neural network community by (Baum & Haussler, 1989):
(2n)V ~ P( sup IVT(W) - £(w)1 ~ i) $ 6-,-e-n ( /2 (4)
wEW v. This remarkable bound not only involves no unknown constant factors, but holds independent of the data distribution P . Analysis shows that sample sizes of about
nc = (4V/i2) log 3/i (5) are enough to force the bound below unity, after which it drops exponentially to zero. Taking i = .1, v = 50 yields nc = 68000, which disagrees by orders of magnitude with the experience of practitioners who train such simple networks.
More recently, Talagrand (1994) has obtained the bound
( K2ni2)v ~ P( sup IVT(W) - £(w)1 ~ i) $ Kl e-2n ( ,
wew V (6)
yielding a sufficient condition of order V/i2, but the values of Kl and K2 are inaccessible so the result is of no practical use.
Formulations with finer resolution near £(w) = 0 are used. Vapnik (1982) bounds P(suPwew IVT(W) - £(w)I/£(w)1/2 ~ i)-note £(w)1/2 ~ Var(vT(w»1/2 when £(w) ~ O-while Blumer et al. (1989) and Anthony and Biggs (1992) work with P(suPWEW IVT(W) - £(w)ll{o}(VT(W» ~ i). The latter obtain the sufficient condition
nc = (5.8v/i) log 12/i (7) for nets, if any, having VT( w) = o. If one is guaranteed to do reasonably well on the training set, a smaller order of dependence results.
Results (Turmon & Fine, 1993) for perceptrons and P a Gaussian mixture imply that at least v/280i2 samples are needed to force £(w·) - £(WO) < 2i with high probability. (Here w· is the best linear discriminant with weights estimated from the data.) Combining with Talagrand's result, we see that the general (not assuming small VT(W» functional dependence is V/i2.

Sample Size Requirements for Feedforward Neural Networks 329
2 APPLYING THE POISSON CLUMPING HEURISTIC
We adopt a new approach to the problem. For the moderately large values of n we anticipate, the central limit theorem informs us that Vn[lIT(W) - E(w)] has nearly the distribution of a zero-mean Gaussian random variable. It is therefore reasonable l to suppose that
P( sup IlIT(W) - E(w)1 ~ f) ~ P( sup IZ(w)1 ~ fJ1i) ~ 2P( sup Z(w) ~ fVn) wEW wEW wEW
where Z( w) is a Gaussian process with mean zero and covariance
R(w, v) = EZ(w)Z(v) = Cov(y -1J(x; w»2, (y -1J(x; V»2) The problem about extrema of the original empirical process is equivalent to one about extrema of a corresponding Gaussian process.
The Poisson clumping heuristic (PCR), introduced in the remarkable (Aldous, 1989), provides a general tool for estimating such exceedance probabilities. Consider the excursions above level b(= fVn ~ 1) by a stochastic process Z(w). At left below, the set {w : Z( w) ~ b} is seen as a group of "clumps" scattered in weight space W. The PCR says that, provided Z has no long-range dependence and the level b is large, the centers of the clumps fall according to the points of a Poisson process on W, and the clump shapes are independent. The vertical arrows (below right) illustrate two clump centers (points of the Poisson process); the clumps are the bars centered about the arrows.
w w
In fact, with PheW) = P(Z(w) ~ b), Ch(W) the size of a clump located at w, and Ah (w) the rate of occurrence of clump centers, the fundamental equation is
(8)
The number of clumps in W is a Poisson random variable Nh with parameter 1, Ah( w) dw. The probability of a clump is P(Nb > 0) = 1- exp( - fwAh( w) dW) =::: fw Ah(W) dw where the approximation holds because our goal is to operate in a regime where this probability is near zero. Letting ~(b) = P(N(0, 1) > b) and (T2(w) = R(w, w), we have PheW) = ~(b/(T(w». The fundamental equation becomes
P( sup Z(w) ~ b) ~ r ~(b/(T(w» dw (9) wEW Jw ECh(W)
It remains only to find the mean clump size ECh( w) in terms of the network architecture and the statistics of (x, y).
lSee ch. 7 of (Pollard, 1984) for treatment of some technical details in this limit.

330 Michael Tunnon, Terrence L. Fine
3 POISSON CLUMPING FOR SMOOTH PROCESSES
Assume Z(w) has two mean-square derivatives in w. (If the network activation functions have two derivatives in w, for example, Z( w) will have two almost sure derivatives.) Z then has a parabolic approximation about some Wo via its gradient G = 'VZ(w) and Hessian matrix H = 'V'VZ(w) at woo Provided Zo ~ b, that is that there is a clump at Wo, simple computations reveal
(2(Zo - b) - cP'H- 1G)d/2 (10) Cb( wo) ~ Kd IHI I / 2
where Kd is the volume of the unit ball in Rd and I· 1 is the determinant. The mean clump size is the expectation of this conditioned on Z(wo) ~ b.
The same argument used to show that Z(w) is approximately normal shows that G and H are approximately normal too. In fact,
z E[HIZ(wo) = z] 2( )A(wo) (F Wo
A(wo) -EZ(wo)H = -'Vw 'VwR(wo, w)lw=wo so that, since b (and hence z) is large, the second term in the numerator of (10) may be neglected. The expectation is then easily computed, resulting in
Lemma 1 (Smooth process clump size) Let the network activation functions be twice continuously differentiable, and let b » (F( w). Then
ECb(W) ~ (21r)d/21 ~~~) 1-112
((F(:») d
Substituting into (9) yields
P( sup Z(w) ~ b) ~ (21r)-~ ( 1 A(w) 11/2 (_b_) d-~_b~/2q~(W) dw, (11) wEW iw (F2(w) (F(w)
where use of the asymptotic expansion ~(z) ~ (zv'21r)-l exp( _Z2 /2) is justified since ('v'w)b » (F( w) is necessary to have the individual P( Z( w) ~ b) low-let alone the supremum. To go farther, we need information about the variance (F2 (w) of (y - 11( x; w»2. In general this must come from the problem at hand, but suppose for example the process has a unique variance maximum 0'2 at w. Then, since the level b is large, we can use Laplace's method to approximate the d-dimensional integral.
Laplace's method finds asymptotic expansions for integrals
fw g(w) exp( - f(w)2 /2) dw
when few) is C2 with a unique positive minimum at Wo in the interior of W ~ Rd ,
and g( w) is positive and continuous. Suppose I( wo) » 1 so that the exponential factor is decreasing much faster than the slowly varying g. Expanding f to second order about Wo, substituting into the exponential, and performing the integral shows that
iw g( w) exp( - f(w)2 /2) dw ~ (21r)d/2If( wo)KI- 1/ 2g( wo) exp( - f( wo)2 /2)
Sample Size Requirements for Feedforward Neural Networks 331
where K = V'V'f(w)lwo, the Hessian of f. See (Wong, 1989) for a proof. Applying this to (11) and using the asymptotic expansion for ~ in reverse yields
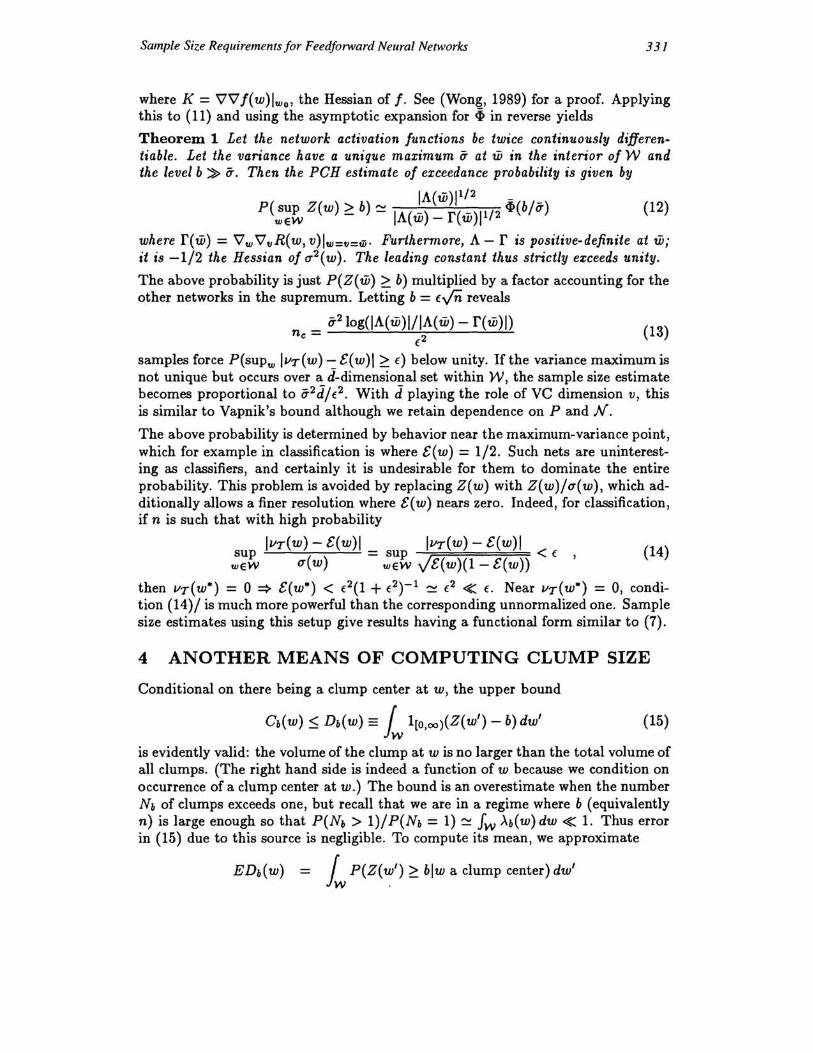
Theorem 1 Let the network activation functions be twice continuously differentiable. Let the variance have a unique maximum u at w in the interior of Wand the level b ~ u. Then the peH estimate of exceedance probability is given by
IA(w)1 1/ 2 _
P(:~fv Z(w) ~ b) ~ IA(w) _ r(w)1 1/ 2 ~(b/u) (12)
where r(w) = V'wV'tlR(w,v)lw=tI=w. Furthermore, A- r is positive-definite at w; it is -1/2 the Hessian of cr2 (w). The leading constant thus strictly e:cceeds unity.
The above probability is just P(Z(w) ~ b) multiplied by a factor accounting for the other networks in the supremum. Letting b = f...;n reveals
u2 10g(IA(w)I/IA(w) - r(w)!) nc = 2 f. (13)
samples force P(supw IlIT(W) - &(w)\ ~ {) below unity. If the variance maximum is not unique but occurs over a d-dimensional set within W, the sample size estimate becomes proportional to u2d/{2. With d playing the role of VC dimension v, this is similar to Vapnik's bound although we retain dependence on P and N. The above probability is determined by behavior near the maximum-variance point, which for example in classification is where &(w) = 1/2. Such nets are uninteresting as classifiers, and certainly it is undesirable for them to dominate the entire probability. This problem is avoided by replacing Z(w) with Z(w)/cr(w), which additionally allows a finer resolution where &(w) nears zero. Indeed, for classification, if n is such that with high probability
IlIT(W) - &(w)1 IlIT(W) - &(w)1 (14) sup = sup < { , weW cr(w) wew J&(W)(I- &(w»
then lIT(W·) = 0 ::} &(w·) < {2(1 + (2)-1 ~ {2 <t:: {. Near lIT(W·) = 0, condition (14)/ is much more powerful than the corresponding unnormalized one. Sample size estimates using this setup give results having a functional form similar to (7).
4 ANOTHER MEANS OF COMPUTING CLUMP SIZE
Conditional on there being a clump center at w, the upper bound
Cb(W) ~ Db(W) == iw l[o,oo)(Z(w') - b) dw' (15)
is evidently valid: the volume of the clump at w is no larger than the total volume of all clumps. (The right hand side is indeed a function of w because we condition on occurrence of a clump center at w.) The bound is an overestimate when the number Nb of clumps exceeds one, but recall that we are in a regime where b (equivalently n) is large enough so that P( Nb > 1)/ P( Nb = 1) ~ fw ).b (w) dw <t:: 1. Thus error in (15) due to this source is negligible. To compute its mean, we approximate
EDb(W) = iw P(Z(~f) ~ blw a clump center)dw'

332 Michael Turmon, Terrence L. Fine
(16)
The point is that occurrence of a clump center at Wo is a smaller class of events than merely Z( wo) ~ b: the latter can arise from a clump center at a nearby w E W capturing woo Since Z(w) and Z(w') are jointly normal, abbreviate u = u(w), u' = u(w'), p = p(w,w') = R(w,w')/(uu'), and let
(=(w,w') (UIU,)I;r;!; (17) 1- p2
(1- p)/(1 + p»)1/2 (constant variance case) (18)
Evaluating the conditional probabilities of (16) presents no problem, and we obtain
Lemma 2 (Clump size estimate) For b ~ u the mean clump size is
ECb(W) ~ EDb(W) ~ /w cf>«blu)() dw' (19)
Remark 1. This integral will be used in (9) to find
( cf>(blu) P(s~pZ(w) > b) ~ Jw fw~«blu)() dw,dw (20)
Since b is large, the main contribution to the outer integral occurs for w near a variance maximum, i.e. for u' I u ~ 1. If the variance is constant then all w E W contribute. In either case ( is nonnegative. By lemma 1 we expect (19) to be, as a function of b, of the form (const ulb)P for, say, p = d. In particular, we do not anticipate the exponentially small clump sizes resulting if (Vw')( w, w') ~ M ~ O. Therefore ( should approach zero over some range of w', which happens only when p ~ 1, that is, for w' near w. The behavior of pew, w') for w' ~ w is the key to finding the clump size.
Remark 2. There is a simple interpretation of the clump size; it represents the volume of w' E W for which Z(w') is highly correlated with Z(w) . The exceedance probability is a sum of the point exceedance probabilities (the numerator of (20», each weighted according to how many other points are correlated with it. In effect, the space W is partitioned into regions that tend to "have exceedances together," with a large clump size ECb( w) indicating a large region. The overall probability can be viewed as a sum over all these regions of the corresponding point exceedance probability. This has a similarity to the Vapnik argument which lumps networks together according to their nV Iv! possible actions on n items in the training set . In this sense the mean clump size is a fundamental quantity expressing the ability of an architecture to generalize.
5 EMPIRICAL ESTIMATES OF CLUMP SIZE
The clump size estimate of lemma 2 is useful in its own right if one has information about the covariance of Z. Other known techniques of finding ECb( w) exploit special features of the process at hand (e.g. smoothness or similarity to other wellstudied processes); the above expression is valid for any covariance structure. In

Sample Size Requirements for Feedf01ward Neural Networks 333
this section we show how one may estimate the clump size using the training set, and thus obtain probability approximations in the absence of analytical information about the unknown P and the potentially complex network architecture N. Here is a practical way to approximate the integral giving EDb{W). For'Y < 1 define a set of significant w'
S-y{W) = {w' E W: (w,w') $ 'Y} V-y{W) = vol{S-y(w)) (21)
then monotonicity of ~ yields EDb{W) ~ Is ~((b/(1X) dw' ~ V-y(W) ~((b/uh) . .., This apparently crude lower bound for ~ is accurate enough near the origin to give satisfactory results in the cases we have studied. For example, we can characterize the covariance R( w, w') of the smooth process oflemma 1 and thus find its ( function. The bound above is then easily calculated and differs by only small constant factors from the clump size in the lemma.
The lower bound for EDb(W) yields the upper bound
1 ~(b/(1-) P(s~p Z(w) ~ b) $ w V-y(w) ~«b/uh) dw (22)
We call V-y(w) the correlation volume, as it represents those weight vectors w' whose errors Z(w') are highly correlated with Z(w); one simple way to estimate the correlation volume is as follows . Select a weight w' and using the training set compute
(Yl - 17( Xl; w))2, ... , (Yn - 17( Xn; w)? & (Yl - 17( Xl; w'))2 , ... , (Yn - 17( Xn; w'))2 .
It is then easy to estimate u2, u,2, and p, and finally (w ,w'), which is compared to the chosen 'Y to decide if w' E S-y ( w) .
The difficulty is that for large d, S-y (w) is far smaller than any approximatelyenclosing set. Simple Monte Carlo sampling and even importance sampling methods fail to estimate the volume of such high-dimensional convex bodies because so few hits occur in probing the space (Lovasz, 1991). The simplest way to concentrate the search is to let w' = w except in one coordinate and probe along each coordinate axis. The correlation volume is approximated as the product of the one-dimensional measurements.
Simulation studies of the above approach have been performed for a perceptron architecture in input uniform over [-1, l]d. The integral (22) is computed by Monte Carlo sampling, and based ona training set of size lOOd, V-y (w) is computed at each point via the above method. The result is that an estimated sample size of 5.4d/f2
is enough to ensure (14) with high probability. For nets, if any, having VT(W) = 0, sample sizes larger than 5.4d/f will ensure reliable generalization, which compares favorably with (7) .
6 SUMMARY AND CONCLUSIONS
To find realistic estimates of sample size we transform the original problem into one of finding the distribution of the supremum of a derived Gaussian random field, which is defined over the weight space of the network architecture. The latter problem is amenable to solution via the Poisson clumping heuristic. In terms of the PCH the question becomes one of estimating the mean clump size, that
334 Michael Turman, Terrence L. Fine
is, the typical volume of an excursion above a given level by the random field. In the "smooth" case we directly find the clump volume and obtain estimates of sample size that are (correctly) of order v/€2. The leading constant, while explicit, depends on properties of the architecture and the data-which has the advantage of being tailored to the given problem but the potential disadvantage of our having to compute them.
We also obtain a useful estimate for the clump size of a general process in terms of the correlation volume V-y(w). For normalized error, (22) becomes approximately
p (sup lIr(w) - £(w) > €) ~ E [vol(W)] e-(1--y2)nf2/2 weW u(w) - V-y(w)
where the expectation is taken with respect to a uniform distribution on W. The probability of reliable generalization is roughly given by an exponentially decreasing factor (the exceedance probability for a single point) times a number representing degrees of freedom. The latter is the mean size of an equivalence class of "similarlyacting" networks. The parallel with the Vapnik approach, in which a worst-case exceedance probability is multiplied by a growth function bounding the number of classes of networks in N that can act differently on n pieces of data, is striking. In this fashion the correlation volume is an analog of the VC dimension, but one that depends on the interaction of the data and the architecture.
Lastly, we have proposed practical methods of estimating the correlation volume empirically from the training data. Initial simulation studies based on a perceptron with input uniform on a region in Rd show that these approximations can indeed yield informative estimates of sample complexity.
References
Aldous, D. 1989. Probability Approximations via the Poisson Clumping Heuristic. Springer.
Anthony, M., & Biggs, N. 1992. Computational Learning Theory. Cambridge Univ.
Baum, E., & Haussler, D. 1989. What size net gives valid generalization? Pages 81-90 of' Touretzky, D. S. (ed), NIPS 1.
Blumer, A., Ehrenfeucht, A., Haussler, D., & Warmuth, M. K. 1989. Learnability and the Vapnik-Chervonenkis dimension. Jour. Assoc. Compo Mach., 36,929-965.
LovMz, L. 1991. Geometric Algorithms and Algorithmic Geometry. In: Proc. Internat. Congr. Mathematicians. The Math. Soc. of Japan.
Pollard, D. 1984. Convergence of Stochastic Processes. Springer.
Talagrand, M. 1994. Sharper bounds for Gaussian and empirical processes. Ann. Probab., 22, 28-76.
Turmon, M. J., & Fine, T. L. 1993. Sample Size Requirements of Feedforward Neural Network Classifiers. In: IEEE 1993 Intern. Sympos. Inform. Theory.
Vapnik, V. 1982. Estimation of Dependences Based on Empirical Data. Springer.
Wong, R. 1989. Asymptotic Approximations of Integrals. Academic.


