Sample Size Considerations for Answering Quantitative Research Questions
25
Sample Size Considerations for Answering Quantitative Research Questions Lunch & Learn May 15, 2013 M Boyle
-
Upload
daphne-burris -
Category
Documents
-
view
39 -
download
1
description
Sample Size Considerations for Answering Quantitative Research Questions. Lunch & Learn May 15, 2013 M Boyle. National Children’s Study in the US Proposed Birth Cohort 100,000 to age 21. Planning Costs 2000-2006: $54.7M Implementation Costs 2007-2011: $744.6. Sample Size Justification: ?. - PowerPoint PPT Presentation
Transcript of Sample Size Considerations for Answering Quantitative Research Questions

Sample Size Considerations for Answering Quantitative
Research Questions
Lunch & Learn May 15, 2013 M Boyle
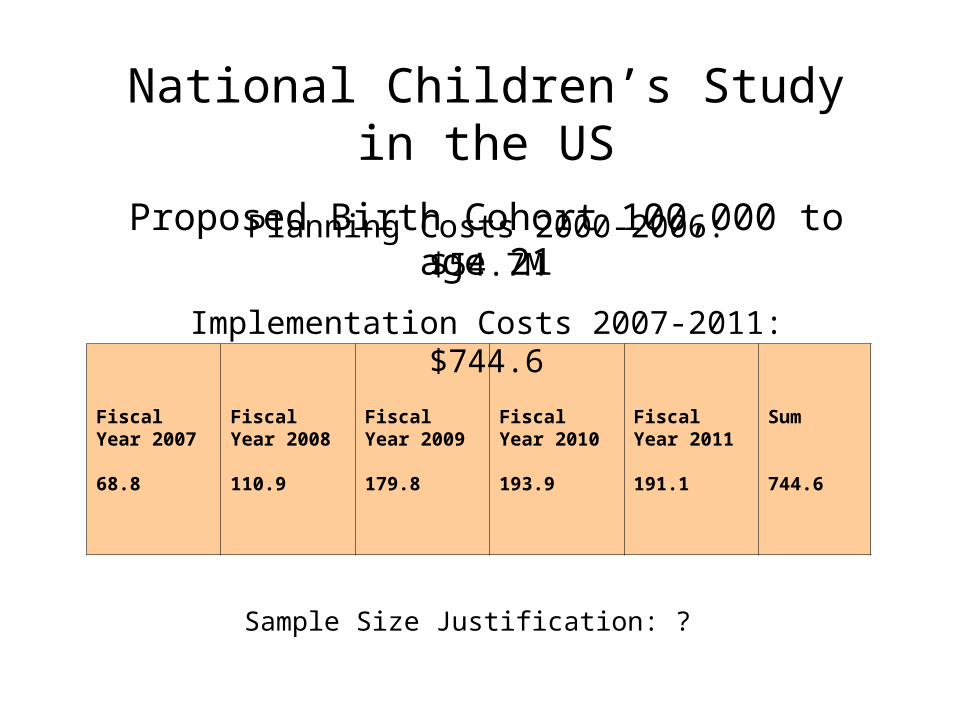
Fiscal Year 2007
68.8
Fiscal Year 2008
110.9
Fiscal Year 2009
179.8
Fiscal Year 2010
193.9
Fiscal Year 2011
191.1
Sum
744.6
National Children’s Study in the US
Proposed Birth Cohort 100,000 to age 21Planning Costs 2000-2006: $54.7M
Implementation Costs 2007-2011: $744.6
Sample Size Justification: ?

What is Statistical Power?
• The statistical power of a test is the probability of correctly rejecting H0 when it is false. In other words, power is the likelihood that you will identify a statistically significant effect when one exists

Types of Power Analysis
A priori: Used to plan a study (Question: What sample size is needed to obtain a certain level of power)?
Post hoc: Used to evaluate a study faced with a constrained sample size (Question: Do you have a large enough sample to detect a meaningful effect)?
[Types of constraints: (1) a completed study; (2) a proposed study with limited number of eligible subjects; (3) a proposed study faced with limited resources]

Elements of Power Calculations
• Effect size ∆• Measurement variability SD • Type I error Alpha (α)
typically specified at p=0.05, 2-tailed • Type II error Beta (β) typically specified at p=0.20 • Power = 1-β; typically 0.80 • Sample Size

Hypothesized distributions, effect sizes and error rates
0
0.1
0.2
0.3
-3 -2 -1 0 1 2 3 4 5
critical t = 1.97897
α2β
Effect Size ∆
Type IType II
Measurement Variability +/- 1 SD

Decisions
Medical Diagnosis
Hypothesis Testing
Disease StatusPresent Absent
Population Status H0 false
H0 true [H1 true]
+ve
Test Result
-ve
Accept H0
Decision
Reject H0
[Accept H1]
correct false +ve
false -ve correct
correct Type II 1-α β
Type I correct α 1-β (power)
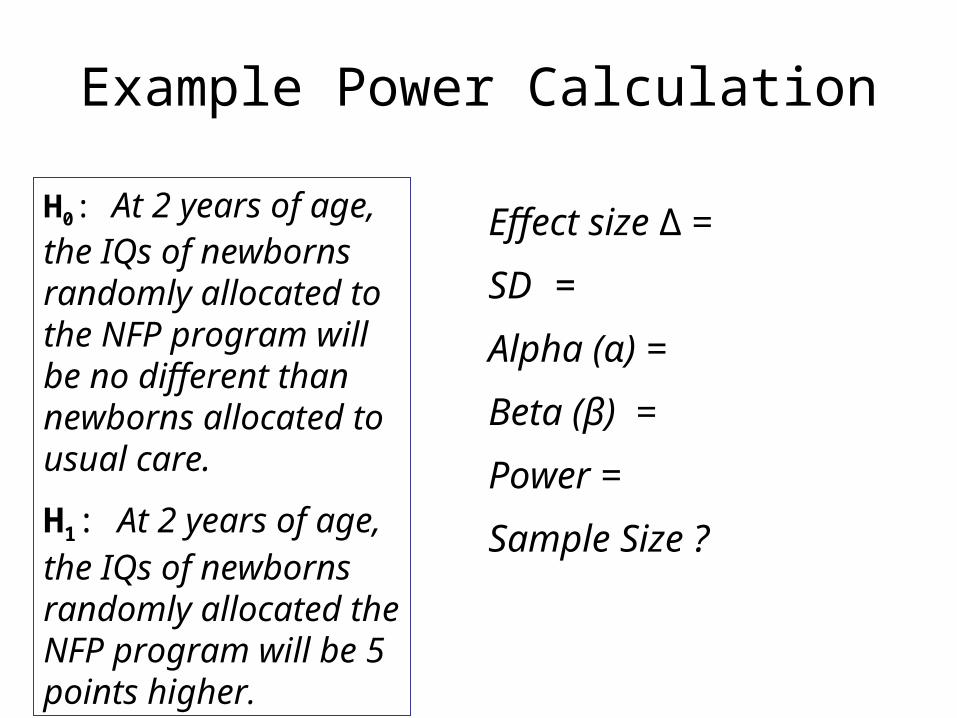
Example Power Calculation
H0: At 2 years of age, the IQs of newborns randomly allocated to the NFP program will be no different than newborns allocated to usual care.
H1: At 2 years of age, the IQs of newborns randomly allocated the NFP program will be 5 points higher.
Effect size ∆ =
SD =
Alpha (α) =
Beta (β) =
Power =
Sample Size ?
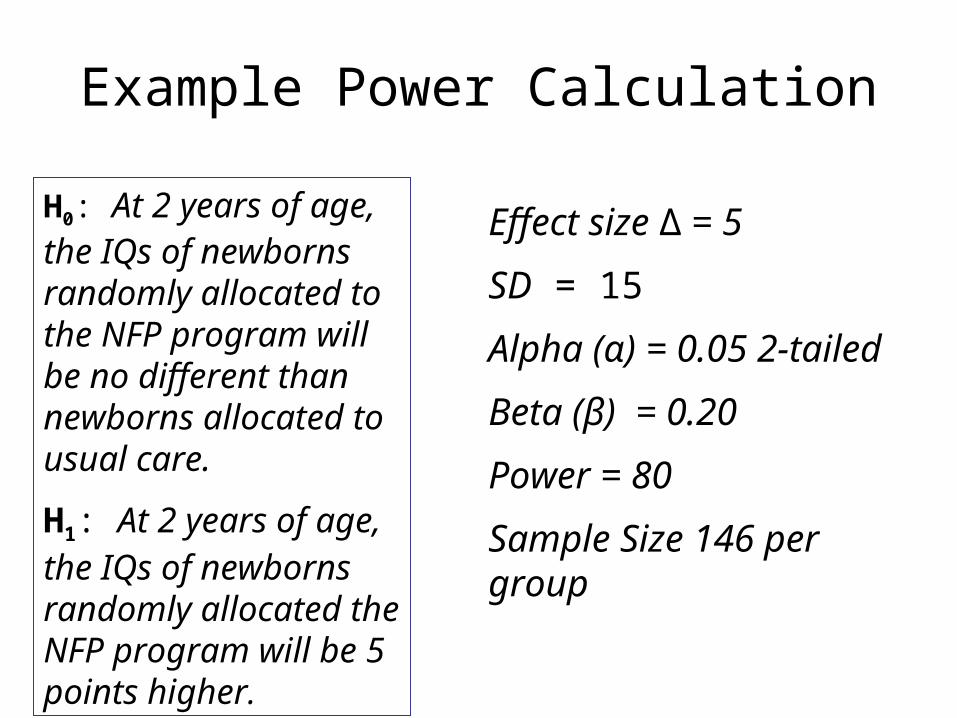
Example Power Calculation
H0: At 2 years of age, the IQs of newborns randomly allocated to the NFP program will be no different than newborns allocated to usual care.
H1: At 2 years of age, the IQs of newborns randomly allocated the NFP program will be 5 points higher.
Effect size ∆ = 5
SD = 15
Alpha (α) = 0.05 2-tailed
Beta (β) = 0.20
Power = 80
Sample Size 146 per group
Effect size d
Tota
l sam
ple
siz
e
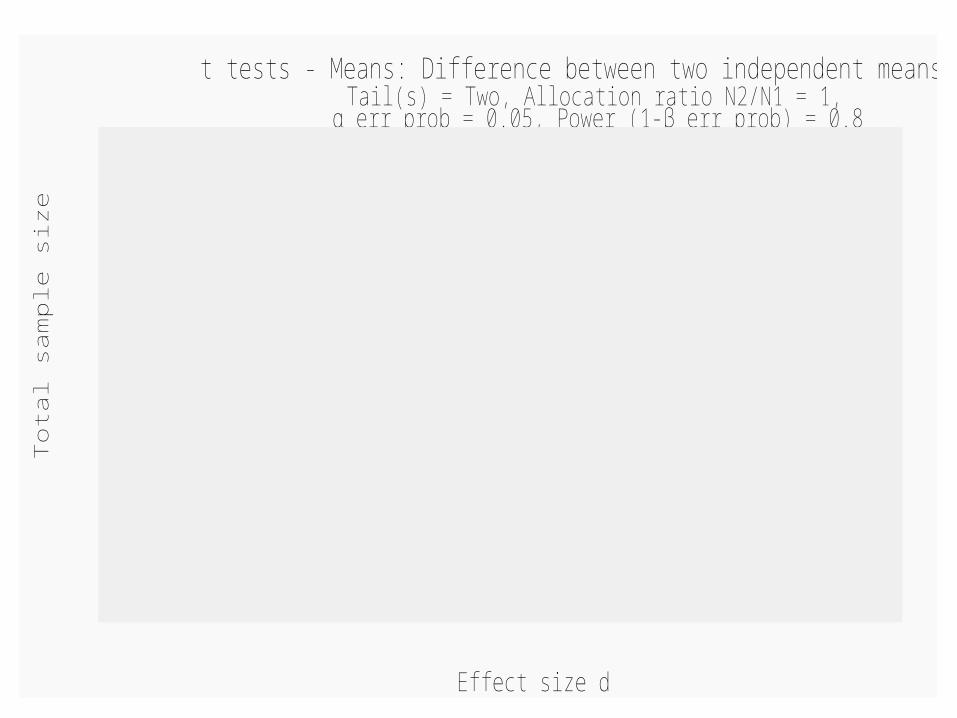
t tests - Means: Difference between two independent means (two groups)Tail(s) = Two, Allocation ratio N2/N1 = 1,
α err prob = 0.05, Power (1-β err prob) = 0.8
0
500
1000
1500
2000
2500
3000
0.1 0.15 0.2 0.25 0.3 0.35 0.4 0.45 0.5
n=292

FACTORS THAT INFLUENCE SAMPLE SIZE PLANNING AND STATISTICAL POWER

Sample Size Planning and Power
1. Error rates Type I (α) -smaller α requires larger sample sizes -2-sided tests requires larger sample sizes
Type II (β) Statistical power: -smaller β (more power) requires larger sample sizes
[Use conventional levels & worry about the trade- offs between effect size and sample size]

Sample Size Planning and Power
2. Effect Size ∆
“What is the minimally important effect based on clinical, biological or social implications of the findings?”

Sample Size Planning and Power
1. Effect size ∆
• What do you know about the nature of the effect – its scale of measurement and its perceived importance to practice, policy, resource allocation (e.g., infant mortality; dollars; self-esteem)?
• What do previous empirical studies tell you about achievable effects?

Sample Size Planning and Power
1. Effect Size ∆
• Can you generate a consensus among your investigative team on a minimally important effect?
• Is it reasonable to use conventional estimates of small, medium and large?
• Are you limited by the dollar amount you can request?
Sample Size Planning and Power
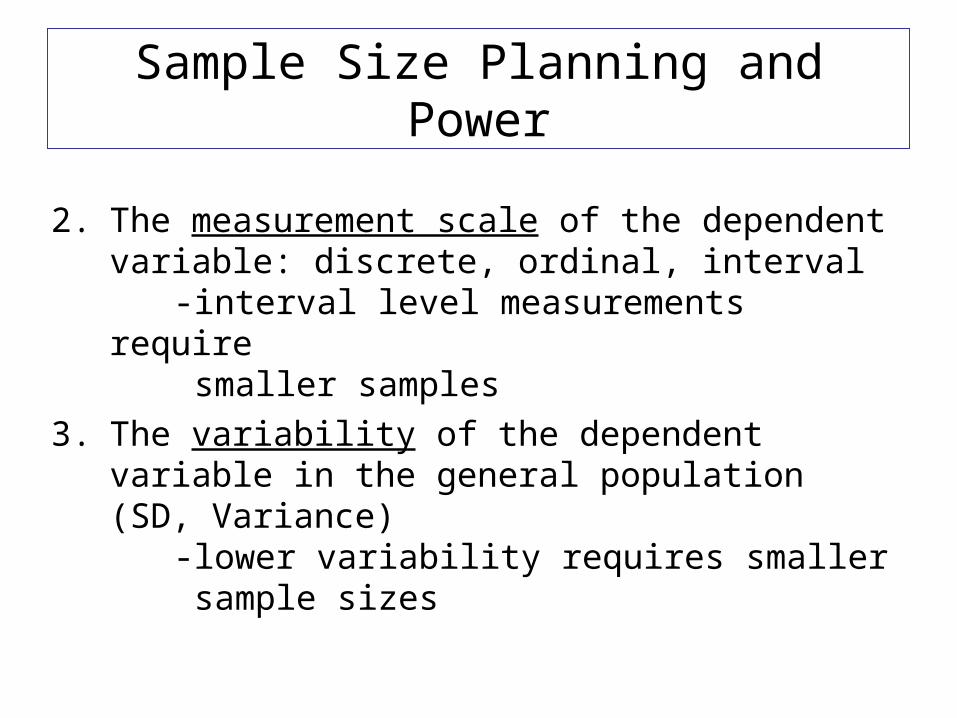
2. The measurement scale of the dependent variable: discrete, ordinal, interval
-interval level measurements require smaller samples3. The variability of the dependent variable
in the general population (SD, Variance) -lower variability requires smaller sample sizes

Sample Size Planning and Power
4. The statistical test -simple estimation; differences between
groups; correlation and prediction. The test must be appropriate for the question and data. A key element in sample size planning
5. Sample distribution, for example, exposed versus not exposed)
-balanced is the most powerful
Sample Size Planning and Power
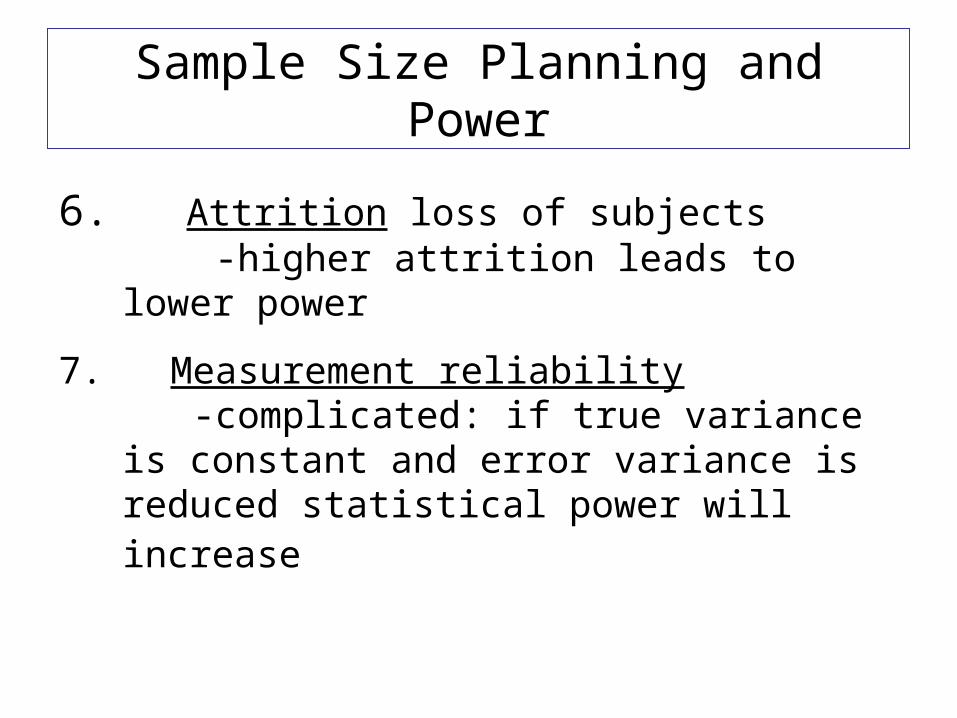
6. Attrition loss of subjects -higher attrition leads to lower power
7. Measurement reliability -complicated: if true variance is constant
and error variance is reduced statistical power will increase

Sample Size Planning and Power
8. Study costs – what the market will bear
9. Analytical complexity – what to do when your models require much more information than you can get?
Adding Complexity
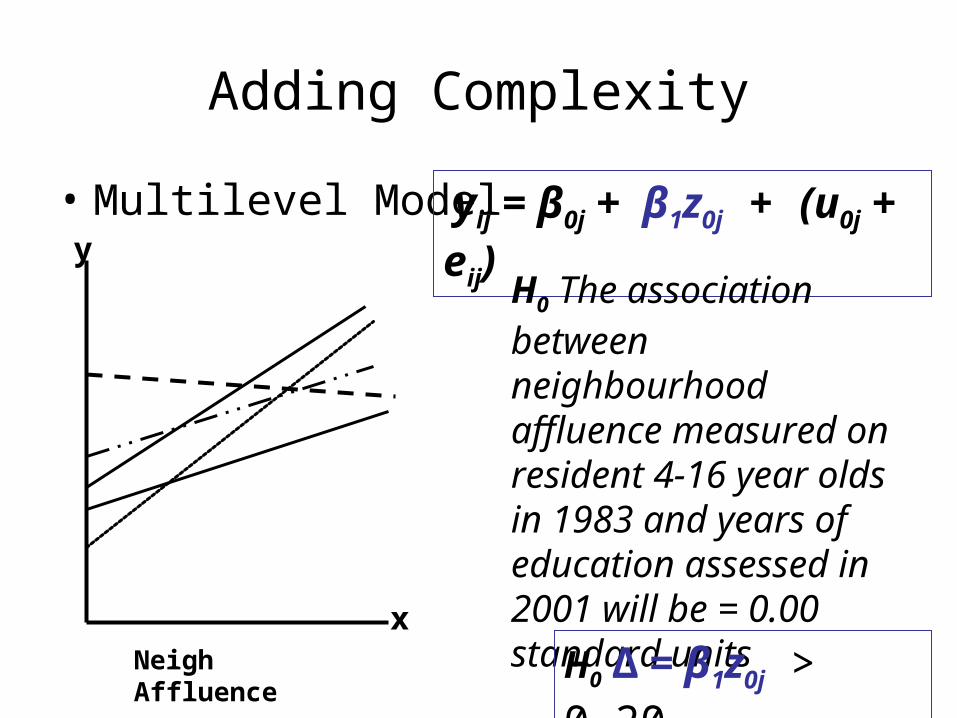
• Multilevel Model yij = β0j + β1z0j + (u0j + eij)
H0 The association between neighbourhood affluence measured on resident 4-16 year olds in 1983 and years of education assessed in 2001 will be = 0.00 standard units
Neigh Affluence
x
y
H0 ∆ = β1z0j > 0.20

Estimates
• 2-level balanced data, nested model• Significance level = 0.025 (to get 0.05 2-
tailed)• Number of simulations per setting = 100• Response variable = normal• Estimation method = IGLS• Fixed intercept = yes• Random intercept = yes• Number of explanatory variables = 1• Type of predictor = continuous

Estimates
• Mean of the predictor = 0.0• Variance of the predictor at level 1 = 0.0• Variance of the predictor at level 2 = 1.0• Smallest/Largest # units at L1 (increment)• Smallest/Largest # units at L2 (increment)• Estimate β0 = 0• Estimate β1 = 0.15• Estimate L2 variance 0.05• Estimate L1 variance 0.95

Comments• Ask specific, quantifiable research questions • Consult with colleagues about clinical,
biological and social importance of your outcomes
• Move from simple to complex hypotheses. Complex models – SEM, Multilevel – can require you to provide an enormous number of parameters.
• When estimating sample size requirements for complex models, you will inevitably use standardized variables

Comments• Estimating sample size requirements is part
game, subject to practical constraints (limited resources and subjects) and convincing reviewers that you know what your doing
• Take a ‘reasoned’ approach – most reviewers will have no clue what you are going on about
• The hardest part of the process is acquiring the information you need.