Sample SBA Valuationsbavaluations.biz/Sample SBA Valuation Report.pdf · Sample Bank (“the...
52
Business Valuation Specified Assets of Sample Company Inc. as of December 31, 2010
Transcript of Sample SBA Valuationsbavaluations.biz/Sample SBA Valuation Report.pdf · Sample Bank (“the...
Business
Valuation
Specified Assets of
Sample Company Inc. as of
December 31, 2010
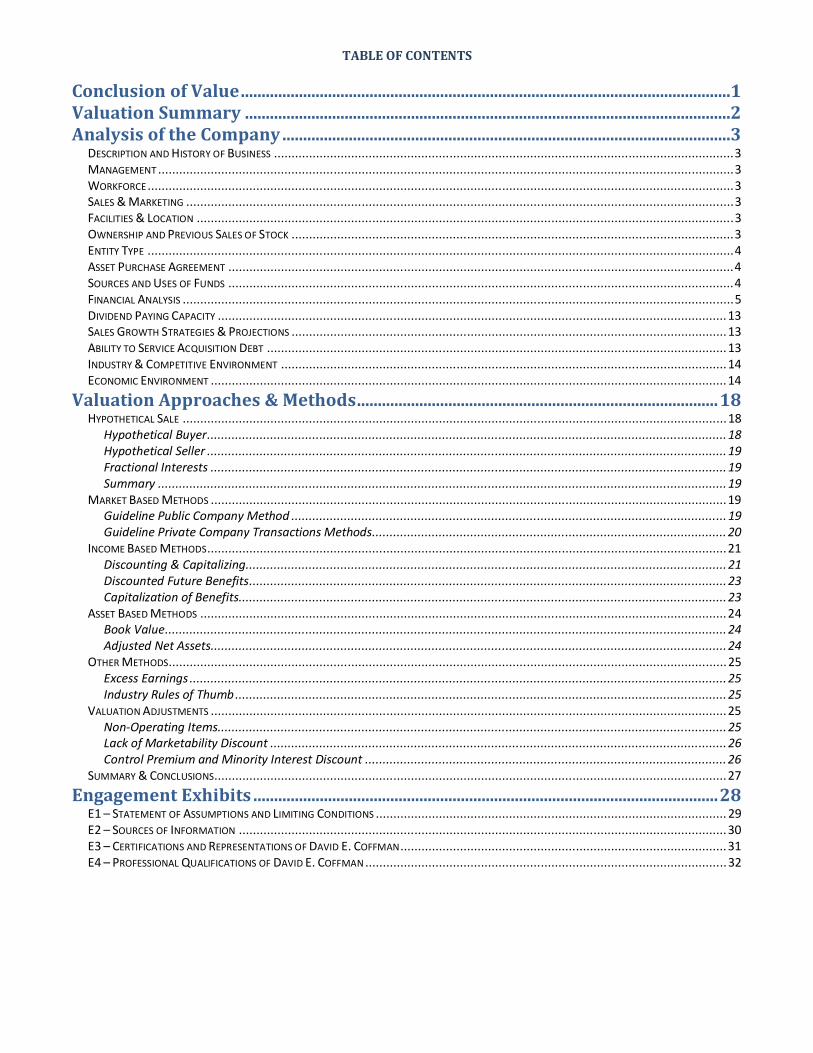
TABLE OF CONTENTS
Conclusion of Value ......................................................................................................................1
Valuation Summary .....................................................................................................................2
Analysis of the Company ............................................................................................................3
DESCRIPTION AND HISTORY OF BUSINESS ................................................................................................................................... 3 MANAGEMENT .................................................................................................................................................................... 3 WORKFORCE ....................................................................................................................................................................... 3 SALES & MARKETING ............................................................................................................................................................ 3 FACILITIES & LOCATION ......................................................................................................................................................... 3 OWNERSHIP AND PREVIOUS SALES OF STOCK .............................................................................................................................. 3 ENTITY TYPE ....................................................................................................................................................................... 4 ASSET PURCHASE AGREEMENT ................................................................................................................................................ 4 SOURCES AND USES OF FUNDS ................................................................................................................................................ 4 FINANCIAL ANALYSIS ............................................................................................................................................................. 5 DIVIDEND PAYING CAPACITY ................................................................................................................................................. 13 SALES GROWTH STRATEGIES & PROJECTIONS ............................................................................................................................ 13 ABILITY TO SERVICE ACQUISITION DEBT ................................................................................................................................... 13 INDUSTRY & COMPETITIVE ENVIRONMENT ............................................................................................................................... 14 ECONOMIC ENVIRONMENT ................................................................................................................................................... 14
Valuation Approaches & Methods ....................................................................................... 18 HYPOTHETICAL SALE ........................................................................................................................................................... 18
Hypothetical Buyer .................................................................................................................................................... 18 Hypothetical Seller .................................................................................................................................................... 19 Fractional Interests ................................................................................................................................................... 19 Summary .................................................................................................................................................................. 19
MARKET BASED METHODS ................................................................................................................................................... 19 Guideline Public Company Method ............................................................................................................................ 19 Guideline Private Company Transactions Methods ..................................................................................................... 20
INCOME BASED METHODS .................................................................................................................................................... 21 Discounting & Capitalizing ......................................................................................................................................... 21 Discounted Future Benefits ........................................................................................................................................ 23 Capitalization of Benefits ........................................................................................................................................... 23
ASSET BASED METHODS ...................................................................................................................................................... 24 Book Value ................................................................................................................................................................ 24 Adjusted Net Assets................................................................................................................................................... 24
OTHER METHODS............................................................................................................................................................... 25 Excess Earnings ......................................................................................................................................................... 25 Industry Rules of Thumb ............................................................................................................................................ 25
VALUATION ADJUSTMENTS ................................................................................................................................................... 25 Non-Operating Items ................................................................................................................................................. 25 Lack of Marketability Discount .................................................................................................................................. 26 Control Premium and Minority Interest Discount ....................................................................................................... 26
SUMMARY & CONCLUSIONS.................................................................................................................................................. 27
Engagement Exhibits ................................................................................................................ 28 E1 – STATEMENT OF ASSUMPTIONS AND LIMITING CONDITIONS .................................................................................................... 29 E2 – SOURCES OF INFORMATION ........................................................................................................................................... 30 E3 – CERTIFICATIONS AND REPRESENTATIONS OF DAVID E. COFFMAN ............................................................................................. 31 E4 – PROFESSIONAL QUALIFICATIONS OF DAVID E. COFFMAN ....................................................................................................... 32
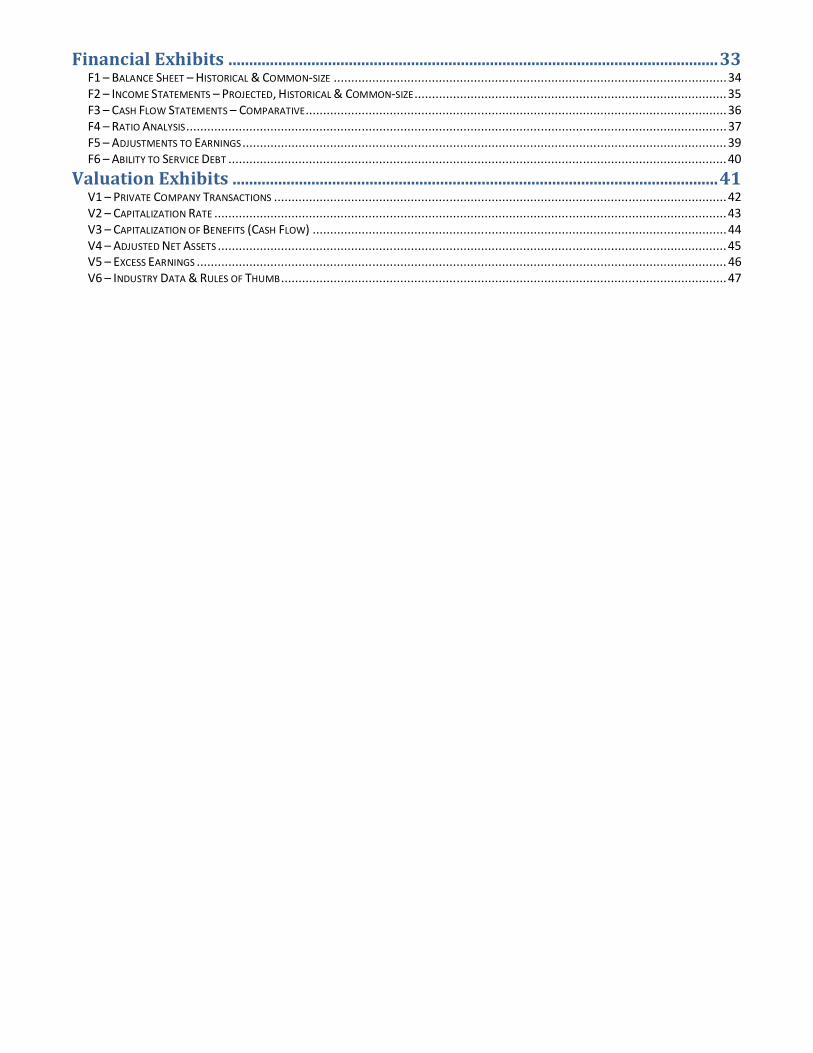
Financial Exhibits ...................................................................................................................... 33 F1 – BALANCE SHEET – HISTORICAL & COMMON-SIZE ................................................................................................................ 34 F2 – INCOME STATEMENTS – PROJECTED, HISTORICAL & COMMON-SIZE ......................................................................................... 35 F3 – CASH FLOW STATEMENTS – COMPARATIVE ........................................................................................................................ 36 F4 – RATIO ANALYSIS .......................................................................................................................................................... 37 F5 – ADJUSTMENTS TO EARNINGS .......................................................................................................................................... 39 F6 – ABILITY TO SERVICE DEBT .............................................................................................................................................. 40
Valuation Exhibits ..................................................................................................................... 41 V1 – PRIVATE COMPANY TRANSACTIONS ................................................................................................................................. 42 V2 – CAPITALIZATION RATE .................................................................................................................................................. 43 V3 – CAPITALIZATION OF BENEFITS (CASH FLOW) ...................................................................................................................... 44 V4 – ADJUSTED NET ASSETS ................................................................................................................................................. 45 V5 – EXCESS EARNINGS ....................................................................................................................................................... 46 V6 – INDUSTRY DATA & RULES OF THUMB ............................................................................................................................... 47

1
Conclusion of Value
February 15, 2011
Sample Bank (“the Lender”)
1234 Main St.
Anytown, PA 12345
We have performed a valuation engagement, as that term is defined in the Statement on Standards for Valuation Services
(SSVS) of the American Institute of Certified Public Accountants, of the assets specified (‘the Specified Assets”) in the
proposed asset purchase agreement between Sample Company Inc. (“the Seller”) and Joe Buyer LLC (“the Buyer”) as of
December 31, 2010. This valuation was performed solely for the Lender to ascertain whether the acquisition price of the
Specified Assets is reasonable, and to evaluate the ability of the Buyer to service the proposed debt; the resulting estimate
of value should not be used for any other purpose or by any other party for any purpose. This valuation engagement was
conducted in accordance with the SSVS and the Uniform Standards of Professional Appraisal practice (USPAP. The estimate
of value that results from a valuation engagement is expressed as a conclusion of value.
The standard of value used in this valuation is Fair Market Value. Fair market value is the price, in terms of cash equivalents,
at which property would change hands between a hypothetical willing and able buyer and a hypothetical willing and able
seller, acting at arm’s length in an open and unrestricted market, when neither is under compulsion to buy or sell and when
both have reasonable knowledge of the relevant facts.
The Specified Assets are valued as a group under the premise that they collectively comprise an ongoing operating business
enterprise that is expected to continue to operate into the future. Although our valuation is intended to estimate fair
market value, we assume no responsibility for the inability of a seller or buyer to obtain a sale or purchase contract at that
price.
Based on our analysis, as described in this valuation report, the estimate of value of the Specified Assets as of December
31, 2010:
$ 825,000
This conclusion is subject to the Statement of Assumptions and Limiting Conditions found in Exhibit E1. We have no
obligation to update this report or our conclusion of value for information that comes to our attention after the date of this
report.
David E. Coffman CPA/ABV/CFF, CVA
President & CEO
Business Valuations & Strategies PC

2
Valuation Summary
Date of valuation: December 31, 2010
Date of report: February 15, 2011
Property: The assets specified (‘the Specified Assets”) in the proposed asset purchase agreement between Sample
Company Inc. (“the Seller”) and Joe Buyer LLC (“the Buyer”)
Ownership interest valued: 100% equity interest
Purpose of valuation: For the Lender to ascertain whether the acquisition price of the Specified Assets is reasonable, and to
evaluate the ability of the Buyer to service the proposed debt
Standard of value: Fair market value
Premise of value: Going concern
Type of report: Detailed
Scope limitations: None
Significant assumptions and limitations: See Exhibit E1
Valuation methods considered: Private company transactions, capitalization of cash flow, adjusted net assets, and excess
earnings
Selected valuation method: Excess earnings
Valuation conclusion:
Inventory (resale) 41,416
Rental equipment 588,754
Non-rental equipment 110,800
Intangible assets 84,030
Total 825,000
SBA Change of Ownership Guidance
# Description Location (Page #)
1 Explanation of transaction 4
2 Purchase price & breakdown of source of funds 4
3 Allocation of purchase price 4
4 Book value of acquired assets 24, 45
6 Analysis of seller financing N/A
7 Role/compensation of seller 3
8 Role/compensation of buyer 3
13 Justification of assumed growth rate 13
14 Business appraisal complaint with USPAP and SOP50-10(5)(A) 1, 31
15 Business appraiser support for cash flow 23, 39
15 Business appraiser support for cap rate 21-23, 43

3
Analysis of the Company
Description and History of Business The business was started in 19XX as a tool rental company known as Sample Avenue Rentals. Harry Sample purchased the
business in 19XX. In 19XX the business moved to its current location in a larger, remodeled warehouse, and changed its
name to Sample Rentals. In 20XX, Sample incorporated the business as Sample Company, Inc. The Company currently
operates under the trade name of the XXXXXX.
The Company rents tools and equipment to homeowners, small contractors, local government agencies, and industrial
companies in the greater Anytown, PA area. It has a rental inventory of 500 to 700 items.
Management Current
Harry Sample serves as president and general manager. He receives a minimal annual salary.
Proposed
Joe Buyer will serve as president and general manager. He expects to take a minimal salary.
Workforce Current & Proposed
The Company employs: 2 mechanics, 1 shop person, 2 customer service agents, and a part-time bookkeeper. The Buyer
expects to retain current staff.
Sales & Marketing The Company’s primary market is a 20 mile radius from Anytown, PA which covers much of XXXXXXX. It is well-established
and maintains a customer list of over 18,000. The Company does not have a formal sales or marketing program, and no
dedicated sales staff. It gets new business primarily from referrals, word-of-mouth, its website, directory listings, and
traditional advertising methods.
Facilities & Location The Company operates from facilities located at 123 Market Street, Anytown, Any County, PA. The buildings contain a mix
of office, shop, and warehouse space. The property is leased from an unrelated third party. The current lease expires in
20XX with a 5 year extension. The current annual rent is $57,000. The agreement of sale is contingent on the landlord
assigning the lease to the Buyer.
Since 20XX, the Company has made a number of site improvements including: 1) expanding the courtyard area, 1) creating
an off-street loading and unloading area for customers with trucks and trailers, 3) creating an indoor unloading and
unloading area, and 4) leasing a warehouse to store larger equipment.
The equipment consists of items available for rent, yard & shop equipment, and office equipment & furniture. The
Company also owns 3 service/delivery trucks and a number of trailers. Over the past several years the Company has made
significant investments in replacing and expanding its inventory of rental equipment.
The Company is located just south of downtown Anytown, off of South Any Street (Routes 123 & 456). Route 123 is a major
highway carrying traffic to and from the city of Anytown.
Ownership and Previous Sales of Stock Current
The Company is owned 50/50 by Harry & Ester Sample. They acquired the business in 19XX and incorporated in 20XX. No
shares of the Company have been sold or transferred since it was incorporated. The acquisition of the business in 19XX
occurred so long ago that it does not provide evidence relevant to the current value of the Company.
Proposed
The new company will be owned by Joe Buyer.

4
Entity Type The Company operates as an S corporation which is different from a regular C Corporation in the following ways:
• C corporations pay a corporate income tax on reported income. The income of S corporations is passed through to
the shareholders, who pay personal income tax on it.
• C corporation shareholders pay tax on dividends from the corporation at the dividend tax rate that is currently less
than most personal income tax rates. Distributions from an S corporation are generally not taxed as dividends.
• S corporation shareholders have to pay personal income tax on the corporation’s income regardless of whether
the income distributed. If the S corporation does not distribute the income, shareholders have to pay tax out of
their own pockets.
• The basis of S corporation shareholders’ stock is increased for any income that is not distributed to the
shareholders.
Small, closely-held C corporations generally seek to minimize taxable corporate income by distributing income to the
shareholders in the form of salaries and wages. Small S corporations seek to maximize distributions of income to their
shareholders. Under these circumstances there is little difference between C and S corporations, and the pre-tax earnings.
Most small, closely-held companies are sold as asset sales. Asset sales are where the primary operating assets (inventory,
fixed assets, and intangible assets) are sold by the corporation to the buyer. The buyer is free to choose the type of business
entity for the new company. Under these circumstances, the existing S corporation status of a company has no value to the
buyer. Upon the sale, the corporation receives the proceeds of the sale and distributes them to the shareholders. In an S
corporation the gain or loss on the sale is passed through to the shareholders and the distributions are generally tax-free. In
a C corporation, the corporation must report gain or loss on the sale and pay corporate tax on it. Distributions to the C
corporation shareholders are generally taxed as dividends. Therefore, S corporations avoid double taxation upon sale of the
business for the current owners. Since a hypothetical buyer is not likely to buy the corporation (stock sale), the Company’s
status as an S corporation was considered to have no value.
Asset Purchase Agreement The draft asset purchase agreement between Sample Company, Inc. (“the Seller”) and Joe Buyer LLC (“the Buyer”) provides
for the sale of the Seller’s inventory, equipment, and all intangible assets connected to operations. The total purchase price
is $770,000 and is allocated as follows:
Rental inventory & equipment $ 570,000
Intangible assets 200,000
Total $ 770,000
The agreement is contingent on the Buyer obtaining a Small Business Administration loan of $615,000 from Sample Bank.
The agreement contains a covenant restricting the Seller and its shareholders from competing against the Buyer within Any
County for a 3 year period. The agreement also assigns the rights to use the XXXXX fictitious name to the Buyer.
Sources and Uses of Funds The proposed sources of funds are:
Bank term loan $ 616,000 10 yr. - Prime + 2.75%
Buyers equity 154,000
Total $ 770,000
The proposed uses of funds are:
Rental inventory & equipment $ 570,000
Intangible assets 200,000
Total $ 770,000
Sample Bank issued a commitment letter dated January 19, 2011 with the terms listed above.

5
Financial Analysis This analysis includes an evaluation of the Company's common-size, income statement and balance sheet for 2010 and the
federal income tax returns for 2009 and 2008.
In order to portray the relative size of financial statement items for comparison over time, each line item in the common-
size financial statements is expressed as a percentage of total assets or total revenue. The historical balance sheets,
projected and historical income statements and historical cash flow statements are summarized in Exhibits F1 through F3.
We analyzed only the historical financial data.
Our analysis also includes an evaluation of commonly used financial ratios. These ratios fall within the following categories:
• Liquidity ratios measure the ability to meet short-term obligations,
• Leverage ratios (borrowing) measure reliance on debt and overall vulnerability to business downturns,
• Activity or operating ratios (assets) measure how effectively assets are used to produce revenue, and
• Profitability ratios measure overall performance.
The Company's common-size financial statements and ratios have been compared to composite, industry common-size
financial statements and ratios from the Construction Equipment Rental & Leasing (NAICS 532412).The ratio comparisons
are presented in Exhibit F4. Each section of the ratio analysis (Liquidity, Profits & Profit Margin, etc.) contains a numerical
score/grade, which is a rough measure of overall performance in the area. Each grade represents a score from 1 to 100,
with 1 being the lowest score and 100 being the highest. Generally, a score above 50 would be a "good" score and a score
below 50 would be a "poor" score. The scores are derived by evaluating the company's trends, either positive or negative,
over time and by comparing the company to industry averages for different metrics.
Although industry statistics are a useful source of general analytical data, there can be significant variation in the reporting
practices and operational methods of companies within a given industry. Therefore, industry statistics as used throughout
this report should not be regarded as absolute norms or standards.
SALES
A measure of how sales are growing and whether the
sales are satisfactory for the company. 78 OUT OF 100
Most managers are fairly aware of sales trends -- they generally know whether sales are increasing or decreasing at a given point in time. This company's sales are higher this period, which is clearly a good result. The company increased its fixed asset base this period as well. Managers may want to investigate whether this fixed asset purchase drove the sales increase, or if other factors were at work here.

6
PROFITS & PROFIT MARGIN
A measure of whether the trends in profit are
favorable for the company. 87 OUT OF 100
This company appears to have achieved strong net profitability results this period by growing and becoming more efficient concurrently. The company's sales have increased this period, and the company's net profit margin (the cents earned in net profit for each dollar earned in sales) has risen by 406.78%. As a result, net profits (in dollars) have increased significantly since the previous period and the net profit margin is strong when compared to what similar companies are earning. Trends are sometimes more important than actual numbers in the profitability area, and this company's trends are favorable. When it is possible to run more sales through a company and manage sales dollars better, the company will almost always have good long-run health. The company should also be able to generate strong long-run returns on assets and equity.
Perhaps the best part of these results is that profits grew at a faster rate than sales. Sometimes even the best companies will allow sales to increase faster than profits, but this can put downward pressure on net profits over time. Is it possible the company is growing into an optimal operating range? It looks that way, at least for now.
Since revenues and net profits are higher, now might be a good time to build long-run profitability. This is especially true given that the net margins are higher than what similar companies are generating. Managers might want to invest the extra earnings into "growth factors" -- the areas that will help drive in higher long-term profits. The benefit of being stronger than the competition comes from taking strategic advantage of this fact.
This number indicates the percentage of sales revenue that is not paid out in direct costs (costs of sales).
It is an important statistic that can be used in business planning because it indicates how many cents of
gross profit can be generated by each dollar of future sales. Higher is normally better (the company is
more efficient).

7
This is an important metric. In fact, over time, it is one of the more important barometers that we look at.
It measures how many cents of profit the company is generating for every dollar it sells. Track it carefully
against industry competitors. This is a very important number in preparing forecasts. The higher the
better.
This metric shows advertising expense for the company as a percentage of sales.
This metric shows rent expense for the company as a percentage of sales.
This metric shows G & A payroll expense for the company as a percentage of sales.
8
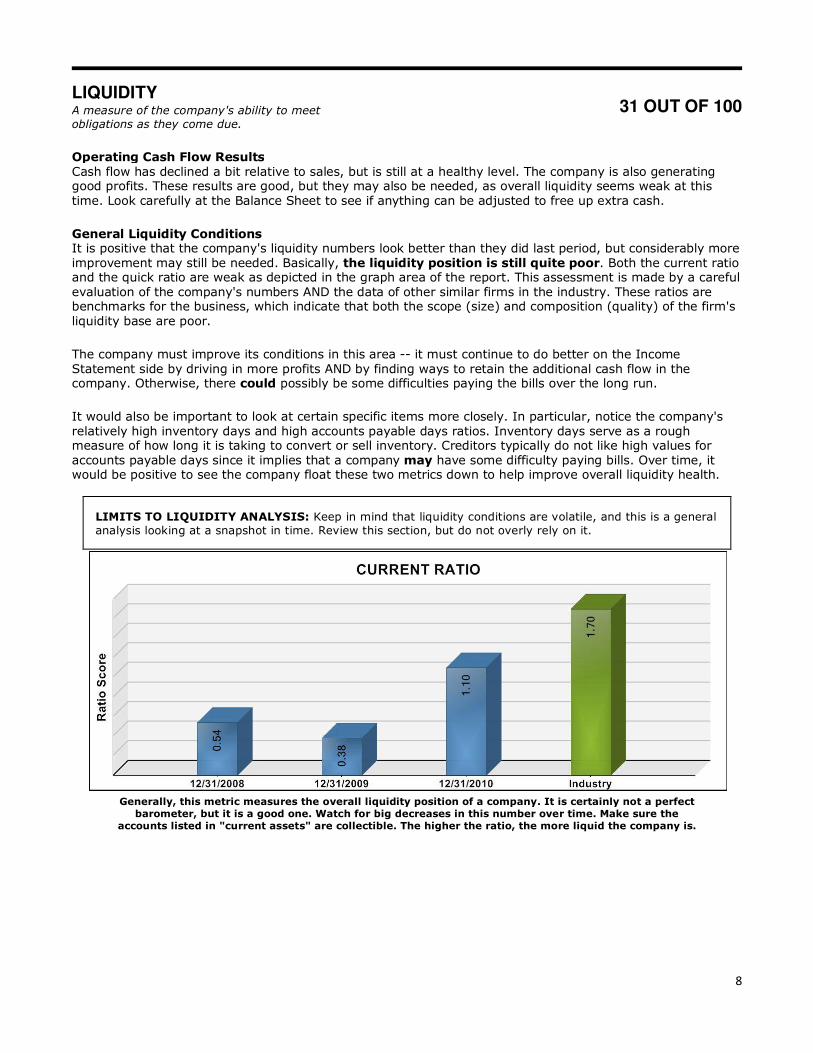
LIQUIDITY
A measure of the company's ability to meet
obligations as they come due. 31 OUT OF 100
Operating Cash Flow Results Cash flow has declined a bit relative to sales, but is still at a healthy level. The company is also generating good profits. These results are good, but they may also be needed, as overall liquidity seems weak at this time. Look carefully at the Balance Sheet to see if anything can be adjusted to free up extra cash.
General Liquidity Conditions It is positive that the company's liquidity numbers look better than they did last period, but considerably more improvement may still be needed. Basically, the liquidity position is still quite poor. Both the current ratio and the quick ratio are weak as depicted in the graph area of the report. This assessment is made by a careful evaluation of the company's numbers AND the data of other similar firms in the industry. These ratios are benchmarks for the business, which indicate that both the scope (size) and composition (quality) of the firm's liquidity base are poor.
The company must improve its conditions in this area -- it must continue to do better on the Income Statement side by driving in more profits AND by finding ways to retain the additional cash flow in the company. Otherwise, there could possibly be some difficulties paying the bills over the long run.
It would also be important to look at certain specific items more closely. In particular, notice the company's relatively high inventory days and high accounts payable days ratios. Inventory days serve as a rough measure of how long it is taking to convert or sell inventory. Creditors typically do not like high values for accounts payable days since it implies that a company may have some difficulty paying bills. Over time, it would be positive to see the company float these two metrics down to help improve overall liquidity health.
LIMITS TO LIQUIDITY ANALYSIS: Keep in mind that liquidity conditions are volatile, and this is a general
analysis looking at a snapshot in time. Review this section, but do not overly rely on it.
Generally, this metric measures the overall liquidity position of a company. It is certainly not a perfect
barometer, but it is a good one. Watch for big decreases in this number over time. Make sure the
accounts listed in "current assets" are collectible. The higher the ratio, the more liquid the company is.

9
This is another good indicator of liquidity, although by itself, it is not a perfect one. If there are receivable
accounts included in the numerator, they should be collectible. Look at the length of time the company
has to pay the amount listed in the denominator (current liabilities). The higher the number, the stronger
the company.
This metric shows how much inventory (in days) is on hand. It indicates how quickly a company can
respond to market and/or product changes. Not all companies have inventory for this metric. The lower
the better.
This number reflects the average length of time between credit sales and payment receipts. It is crucial
to maintaining positive liquidity. The lower the better.

10
This ratio shows the average number of days that lapse between the purchase of material and labor, and
payment for them. It is a rough measure of how timely a company is in meeting payment obligations.
Lower is normally better.
ASSETS
A measure of how effectively the company is utilizing
its gross fixed assets. 90 OUT OF 100
The company performed well here. There were additions to fixed assets and profitability improved by even more. If profitability can consistently improve more quickly than assets, the company should see a strong long-run return on assets. It is unusual and positive that net margins and overall liquidity have improved as the company has added assets. Yet increasing assets further could be problematic because the rise in net profitability and overall liquidity compared with the increase in assets could be coincidental, not bearing any significant relationship.
Other positive points include the above average return on assets and return on equity that the company earned this period. If profits are moving positively against fixed assets and the company is generating good returns on those assets, this area will continue to score very well, as has been the case this period.
This measure shows how much profit is being returned on the shareholders' equity each year. It is a vital
statistic from the perspective of equity holders in a company. The higher the better.

11
This calculation measures the company's ability to use its assets to create profits. Basically, ROA
indicates how many cents of profit each dollar of asset is producing per year. It is quite important since
managers can only be evaluated by looking at how they use the assets available to them. The higher the
better.
This asset management ratio shows the multiple of annualized sales that each dollar of gross fixed assets
is producing. This indicator measures how well fixed assets are "throwing off" sales and is very important
to businesses that require significant investments in such assets. Readers should not emphasize this
metric when looking at companies that do not possess or require significant gross fixed assets. The
higher the more effective the company's investments in Net Property, Plant, and Equipment are.
BORROWING
A measure of how responsibly the company is
borrowing and how effectively it is managing debt. 71 OUT OF 100
Net profitability improved by 451.18% while debt was lowered. In other words, a reduction in total debt coincided with improved profitability, at least for this period. Not only this, but the net profit margins and overall liquidity actually improved. This is a very good situation -- profitability was able to expand without additional debt. This dynamic should help long-term profitability, especially if it can be continued over multiple periods.
While the overall trend in this area seems to be positive, the following areas may merit further attention. When compared to its industry peers, the company has generated an average amount of earnings (before interest and non-cash expenses) to cover its debt obligations. It also seems to have a relatively high level of debt compared to equity. Therefore, small changes in earnings could have a significant impact on the company’s ability to meet interest obligations.

12
Capacity planning is a challenge here. This involves simply thinking out into the future: how long can profitability improve without increasing borrowing? Analyzing the relationship between investments in resources (such as assets) and profitability improvement, as well as effectively forecasting sales and cash flow, can help answer this question and lead to the best borrowing policies for the near future.
This ratio measures a company's ability to service debt payments from operating cash flow (EBITDA). An
increasing ratio is a good indicator of improving credit quality. The higher the better.
This Balance Sheet leverage ratio indicates the composition of a company’s total capitalization -- the
balance between money or assets owed versus the money or assets owned. Generally, creditors prefer a
lower ratio to decrease financial risk while investors prefer a higher ratio to realize the return benefits of
financial leverage.
This ratio measures a company's ability to repay debt obligations from annualized operating cash flow
(EBITDA).

13
Summary
The results of the financial analysis are summarized below. As described above, our financial analysis was limited to income
statement related data.
Generally, a score above 50 is considered a "good" score and a score below 50 is a "poor" score.
Category Score
Earning Capacity
Sales 78
Profits & Profit Margins 87
Financial Condition
Liquidity 31
Assets 90
Borrowing 71
Sales and profits improved in 2010 so the Company scored well in the earning capacity categories. The Company historically
maintains a minimal cash balance and has few trade receivables so the Company scored poorly in liquidity. It scored well in
the efficient use of assets and effective borrowing because the Company invests heavily in rental equipment and is thinly
capitalized. The Company’s overall earning capacity and financial condition is generally very good. Because it is not very
liquid and is thinly capitalized it is vulnerable to an extended period of significant declining revenue.
The results of the financial analysis influence the valuation conclusion in several ways. The discount and capitalization rates
used in several methods are adjusted for the results of the financial analysis within the specific company risks component.
The Company’s earning capacity directly impacts income-based methods. The Company’s financial condition directly affects
asset-based methods.
Dividend Paying Capacity Dividend paying capacity can be important when valuing a company if data from comparable public companies is available
or if minority interests are being valued. The dividend paying capacity of a company often represents the company’s net
cash flow that is not needed for future growth. Dividends actually paid in the past may have no relation to a company’s
dividend paying capacity because payment of dividends is discretionary.
Small, closely held companies typically do not pay dividends for a number of reasons. Stockholders/employees frequently
withdraw excess cash flow in the form of salaries and bonuses, avoiding the double taxation of dividends. Many small
businesses are undercapitalized with limited borrowing capacity so they need to retain more cash to fund operations and
growth.
For these reasons dividend-paying capacity is a less reliable factor when valuing a controlling interest in a small, closely held
company. Therefore, in this case, dividend-paying capacity was not taken into consideration.
Sales Growth Strategies & Projections The Buyer projects sales and most expenses to remain at 2010 levels. Maintaining the current sales level seems
conservative based on historical trends and the improving economy. The projected increases in payroll, employee benefits
and interest expense appear in line with the Buyer’s intentions. Overall the projections appear reasonable and attainable.
Ability to Service Acquisition Debt The Buyer will incur $616,000 of new debt to complete the proposed acquisition. Commercial financing consists of a term
loan of $616,000 payable over ten years at an initial interest rate of 6.0% requiring annual payments of $82,068. There is no
Seller financing. The total annual debt service will be $82,068. This amount was compared to the projected cash flow
excluding interest expense for 2011. The debt service coverage ratio is 2.3. Due to the reasonableness of the projections
and an adequate debt service coverage ratio, the Buyer appears able to service the proposed debt. The analysis of the
ability to service acquisition debt is presented in detail in Exhibit F6.

14
Industry & Competitive Environment Overall
According to the American Rental Association, the combination of rebounding construction activity, continued strong
growth of corporate profits, and increased consumer spending will drive growth in rental revenue. The overall rental
industry is expected to increase 4.6% in 2011, with the construction and industrial segment growing 6.0%, general tool
rental up 1.3%, and party and event rental increasing 3.7%. The growth will increase each quarter from 1.6% in the first
quarter to 7.9% in the fourth. Growth is expected to continue, topping 2007’s market peak in 2014.
In addition to improving economic conditions, more contractors are expected rent instead of own equipment. Many
contractors were forced to sell or delay replacing existing equipment during the recession. As construction activity
increases these contractors may be unable or reluctant to purchase new equipment and opt to rent. Continued uncertainty
about the economic conditions and construction activity should sustain the increase in renting. These conditions suggest
that rental should continue to gain market share over the next few years.
The industry is populated primarily by small, independent companies that serve their local markets.
Local & Regional
There are 72 listings in YellowBook.com under Equipment Rental for Anytown, PA. Only a few of these listings are for
general rental centers that offer a full line of power equipment and tools.
Company
The Company is well established with a convenient location along a major route to and from downtown Anytown.
Despite the severe recession and the lack of a formal sales and marketing program, the Company only experienced a 6%
sales decline in 2009. Sales recovered in 2010 and exceeded the 2008 level. Due to the site improvements, rental
equipment inventory replacement and expansion, and an improving economy the Company should be able to maintain
modest sales and earnings growth.
The industry and competitive environment directly impacts the operations of the Company in many ways such as: rate of
sales growth, available cash flow, and specific company risk factors. These elements are already incorporated into the
valuation methods used in this engagement, so no specific adjustment for the industry and competitive environment is
necessary.
Economic Environment We analyzed the following indicators to assess the economic environment as of the 3rd quarter of 2010.
Overall
Growth
• Indicator – Change in Gross Domestic Product (GDP) which
measures the total economic output of the U.S.
• Source – Bureau of Economic Analysis
• Current – GDP growth was 2.0% in the third quarter and 1.7% in
the second quarter of 2010.
• Forecast – GDP growth is expected to range between 3.0% and
4.0% in 2011.
Leading
• Indicator – Leading Index is a composite of 10 forward-looking
economic indicators.
• Source – The Conference Board
• Current – The index increased slightly for the third consecutive month in September 2010 to 110.4.
• Trend – The index is indicating modest economic growth through 2011.

15
Manufacturing
Industrial Production
• Indicator – Industrial production index
• Source – Federal Reserve
• Current – The index rose to 93.2 in September 2010. Overall
production rose 5.4% from September 2009.
• Trend – Industrial production is expected to improve
slightly.
ISM Survey
• Indicator – Survey of Manufacturing Activity
• Source – Institute of Supply Management (ISM)
• Current – The index fell 1.8 points to 54.4 in September 2010. A score of 50 or more indicates growth in manufacturing
activity. A score in excess of 41.2 percent, over a period of time, generally indicates an expansion of the overall
economy. Whether the score is rising or falling is also important.
• Trend – The index is expected to remain flat for several months.
Services • Indicator –Survey of Non- Manufacturing Activity
• Source – Institute of Supply Management (ISM)
• Current – The index declined 0.6 points to 53.2 in September 2010. The index has remained flat for most of 2010. A
score of 50 or more indicates growth. Whether the score is rising or falling is also important.
• Trend – The index is expected to remain flat for several months.
Retail
• Indicator – Advance monthly sales for retail and food services
• Source – Census Bureau
• Current – Retail sales for the third quarter of 2010 were up
5.7% from the same period a year ago.
• Trend – Retail sales are expected to improve slowly through
most of 2011.
Housing
Real Estate
• Indicator – New home sales
• Source – Census Bureau
• Current – Home sales were down 21.5% in September 2010
from the same period last year.
• Trend – Home sales are expected to remain flat through
most of 2011.

16
Construction
• Indicator – Housing starts
• Source – Census Bureau
• Current – Housing starts were up 4.1% in September 2010 from the same period last year.
• Trend – Housing starts are expected to remain flat through most of 2011.
Consumer
Spending
• Indicator – Personal consumption expenditures (PCE)
• Source – Bureau of Economic Analysis
• Current – Consumer spending rose 2.6% in the third quarter
of 2010.
• Trend – Consumer spending is expected rise modestly
through most of 2011.
Confidence
• Indicator – Consumer sentiment
• Source – University of Michigan
• Current – The index fell 0.1 points to 67.7 as of October 1,
2010.
• Trend – Consumer confidence is expected to remain low until
the job market improves significantly.
Prices/Inflation
Consumer
• Indicator – Consumer price index (CPI)
• Source – Bureau of Labor Statistics
• Current – The index rose at a 1.1% rate for the twelve months
ended September 2010.
• Trend – Consumer prices are expected to increase modestly
through 2011.
Producer
• Indicator – Producer price index (PPI)
• Source – Bureau of Labor Statistics
• Current – The index rose 4.0% during the twelve months ended
September 2010.
• Trend – Producer prices are expected to increase modestly
through 2011.

17
Employment
• Indicator – Unemployment rate
• Source – Bureau of Labor Statistics
• Current – The unemployment rate rose slightly from 9.5% in June to 9.6% in
September 2010.
• Trend – The unemployment rate is expected to decline very slowly through
2011.
Interest Rates
• Indicator – Short-term rates are strongly influenced by the Federal
Reserve, while long-term rates are more market-based.
• Source – Wall Street Journal
• Current – Short term rates are stable at near zero. Long term rates are
falling.
• Trend – Rates are expected to remain low, but start to rise gradually in
2011.
Corporate Profits
• Indicator – Corporate profits
• Source – Bureau of Economic Analysis
• Current – Corporate profits rose 39.2% in the second
quarter of 2010 when compared to the same period last
year.
• Trend – Corporate profits are expected to continue
improving, but at a slower rate, due to cost cutting and
delayed rehiring.
Pennsylvania & Regional
The amount and availability of regional and state level economic data is limited. The data that is available suggests that the
conditions within Pennsylvania are closely related to national economic conditions. The unemployment rate for
Pennsylvania was 9.0% in September 2010 down slightly from 9.2% in June. The unemployment rates for the Anyburg
(7.5%) Anytown (7.0%), Anyville (6.9%), and Anywhere (8.2%) areas for September 2010 were down significantly from the
previous quarter, and remain below the state and national rates.
Summary
The economic recession has ended but the housing and financial markets are healing very slowly. Consumer spending, one
of the main drivers of the economy, will remain sluggish until consumers regain some confidence through an improving job
market, which is not expected until 2012.
The economic environment directly impacts the operations of the Company in many ways such as: rate of sales growth,
available cash flow, and risk factors. These elements are already incorporated into the valuation methods used in this
engagement, so no specific adjustment for the economic environment is necessary.

18
Valuation Approaches & Methods Hypothetical Sale The valuation approaches and methods used in this report are based on the hypothetical sale of the Company between a
hypothetical willing and able buyer and a hypothetical willing and able seller, acting at arm’s length in an open and
unrestricted market, when neither is under compulsion to buy or sell and when both have reasonable knowledge of the
relevant facts.
The vast majority of small, privately-held companies are sold on an asset-sale basis. Virtually all sales to third parties are
asset sales. A typical asset sale includes the operating assets of a business – inventory; furniture, fixtures and equipment
(FF&E); and all intangible assets (goodwill). Real estate may also be included if it is owned by the company. These assets are
sold free and clear of all debt, so the proceeds from the sale of assets are used to satisfy any outstanding debts connected
to the assets. Then the business entity winds up its affairs by collecting any receivables, liquidating or transferring any
assets that were not included in the sale, paying any payables, and satisfying any other obligations. Any remaining cash or
other assets are distributed to the owners generally on a pro-rata basis.
The capital stock of a corporation or interest in a partnership may also be sold to transfer ownership (stock sale). Stock
sales are more common when a business (or fractional interest) is sold to a related party. In a 100% stock sale, all of the
assets and liabilities within the corporation are included in the sale. Because it occurs outside the business entity, the sale
generally has no impact on the accounting records of the business entity.
Hypothetical Buyer
There are two basic types of buyers of small businesses. The most common type is an owner-operator. An owner-operator
is an individual (or small group of individuals) who intends to personally operate the business on a daily basis. The earnings
of the business are expected to: 1) pay the owner-operator reasonable compensation for the services he/she provides to
the business, and 2) generate business profits that will be used to service debt, reinvest in the business (buy equipment,
etc.) , and provide a return on the investment required to acquire the business. This type of buyer typically will continue to
operate the business, more or less, in its current form and is most interested in the cash flow (before owner’s
compensation) the business is currently generating. Owner-operators often do not have previous experience owning a
business and/or in the industry, and will require some training during a transition period. Due partly to their lack of business
experience owner-operators often focus on their personal compensation rather business profits. Several surveys have
shown that business owners are generally willing to make less money because they value the intangible benefits of owning
their own business.
The second type of buyer is an absentee owner. An absentee owner can be an individual, group of individuals or another
company that intends to hire managers to run the daily operations. This type of buyer may also be called an investor or a
strategic buyer. The earnings of the business are expected to: 1) pay reasonable compensation to the manager(s), and 2)
generate business profits that will be used to service debt, reinvest in the business (buy equipment, etc.) , and provide a
return on the investment required to acquire the business.
Because this type of buyer often has previous business experience in the industry, they may intend to operate the business
differently. Therefore they are more interested in the sales and gross margins that the business generates. They will
estimate operating expenses based on their own experience and any planned changes to the operations. This type of buyer
is most concerned about earning a return on their investment. An absentee owner must hire managers in the job market at
competitive rates. Generally, only businesses that generate enough earnings (currently or projected) to cover a manager’s
compensation, and still produce adequate net profits is attractive to absentee owners.
Buyers can also be categorized by their relationship to the seller. Most small businesses are sold to unrelated third parties.
Unrelated third parties typically act through intermediaries like business brokers or attorneys. This type of buyer looks for
businesses for sale based on their own personal criteria including: type of business, location, price range, cash flow, etc.
They usually need to provide a down payment of at least 15% and require bank or seller financing to complete the
transaction. If commercial financing is used, the buyer will have to show that the business will generate enough earnings to
meet projected operating expenses (including compensation for the active owners), and cover the new debt service plus a
cushion of at least 25%. Emotions are a major factor in the buying process, but the earnings of the business have to justify
the purchase price, especially when commercial financing is involved. First-timers often have difficulty making the decision
to buy based on the many uncertainties connected to owning and operating a business. The buyer’s ability to secure
financing and deal with the uncertainty are critical factors in completing the sale.

19
Individuals who have existing relationships with the business such as family members of an owner or key employees are the
next most common type of business buyer. Related buyers often have minimal financial resources and rely heavily on seller
financing or incremental purchases. Sales to related parties are generally not considered to be arms-length transactions and
the buyer may not be well-informed about business and financial matters, so determining an objective, fair and reasonable
price is a critical factor. Since the seller is likely to have a continuing stake in the business, the ability of the buyer to
successfully operate the business is a major concern of the seller.
Hypothetical Seller
As with buyers, there are two basic types of sellers (owners) of small businesses. By far the most common type is an owner-
operator who personally operates the business on a daily basis. This type of seller is driven primarily by personal factors.
The reason for selling and the timing of the sale are based on the owner(s) personal situation. This type of seller often
attempts to set a price for the business at a level that meets their personal requirements, often seeking to satisfy their
debts and fund their retirement. Owner-operators end up selling their businesses at fair and reasonable prices because
they have little choice. If they hold fast to unrealistic ideas of value, they will be forced to either continue operating the
business, or close it down.
Absentee owners generally seek to achieve a specific return on investment. A major portion of the expected return is the
sale of the business. This type of seller typically monitors the value of the business using industry multiples or some other
in-house method. The business is offered for sale when the seller expects the proceeds to meet their required rate of
return. This type of seller is likely to withdraw the business from the market if the required return cannot be obtained, and
continue operating it. An investor may also seek to sell when the performance of the business is no longer meeting their
expectations.
Fractional Interests
Small businesses are difficult to sell in their entirety, and virtually impossible to sell on a piecemeal basis. Few buyers are
willing to buy a partial interest, even if it is a controlling one, in a small business. They want 100% control. Therefore, partial
interests in small businesses are typically sold as part of a sale of the entire business, and the owners split the proceeds on a
pro-rata basis.
Fractional interests may also be sold or transferred to a related party. Transfers of fractional interests are often part of a
gifting program to gradually shift ownership to family members. Fractional interests may also be used to sell a business
gradually over time to family members or key employees. This method allows the seller to maintain control while the buyer
earns ownership and control one step at a time.
Summary
The Company is well-established and profitable, but much of its value comes from its equipment. The industry is dominated
by small, independent companies that would be unlikely to pay significant goodwill to buy another company’s equipment.
It is also unlikely that a related party would have the financial resources needed to acquire the Company.
Under these circumstances the Company is most likely to be sold as an asset sale to a third party. The most likely type of
buyer would be either an owner-operator or absentee owner. The most likely type of seller would be an owner-operator
looking to sell for personal reasons. The valuation methods used in this report are designed to produce the value of only the
assets included in a typical asset sale.
Market Based Methods A fundamental method for estimating the value of an ownership interest in a closely held business is an analysis of prices
paid by investors in the private or the public markets for ownership interests in other companies in the same or similar lines
of business.
Guideline Public Company Method The premise of this method is that prices of publicly traded stocks in the same or a similar industry provide objective
evidence as to the values at which investors are willing to buy and sell interests in companies in that industry. The
application of this method depends on the selection of guideline publicly traded companies that are similar enough to the
Company to provide a meaningful comparison.

20
Large, publicly traded companies have many stockholders who elect a board of directors. The board hires the corporate
officers who then hire key management. In many small, privately held companies all of these groups consist of the same
people. In our opinion, this lack of separation between ownership and management is an important issue to consider. It
makes comparing public to private companies inappropriate in many cases. Once the separation issue is addressed, then
other factors like: product lines, sales volume, employment levels, territory of operations, market share, etc. should be
considered.
For any public companies in this industry the sales volume, position within the supply chain, employment levels, and
territories of operations are not comparable to the Company. Therefore, we did not consider this method.
Guideline Private Company Transactions Methods This method is based on analyzing sales of interests in privately held businesses in the same industry. Since these
transactions are at arm’s length, they provide objective evidence as to the values at which investors are willing to buy and
sell interests in companies in that industry. The application of this method depends on the selection of sales transactions of
privately held companies that are similar enough to the Company to provide a meaningful comparison.
The BizComps database contains data from over 10,000 transactions, involving the sale of privately owned businesses in the
U.S. This data is not publicly reported so it is obtained from business brokers and transaction intermediaries. These sources
are considered to be reliable.
Database transactions are structured as or converted to asset sales. The Sale Price contains only 2 components – furniture,
fixtures and equipment (FF&E) and goodwill. Therefore the results from these methods must be adjusted for any other
assets included in the Specified Assets.
We searched the database using the following criteria: 1) SIC Code 5324, 2) annual sales less than $1 million, and 3)
keyword: equipment. This search produced 13 matches. The search results are summarized in Exhibit V1. The number of
matches and their comparability is limited so this data is most appropriate for use in secondary valuation methods that are
only used to support conclusions produced by more appropriate methods.
The Percentage of Annual Revenue method applies the average Sale Price to Annual Revenue ratio to the Company’s most
recent annual sales. This method ignores differences in gross margins and operating expenses (profitability). Therefore, this
method often produces the highest or top-line value of a business.
The Percentage of Annual Revenue method produced a value of $742,846 and is presented in detail in Exhibit V1. Because
this method is based on limited data and does not consider profitability, it was not selected.
The Multiple of Seller’s Discretionary Earnings (SDE) method applies the Sale Price to SDE ratio to the Company’s most
recent annual or average SDE. SDE is equal to a company’s earnings before: income taxes, non-recurring income and
expenses, depreciation and amortization, interest income or expense, non-operating (discretionary) items, and owners’
total compensation for services (including payroll taxes and benefits). In this case, we did not add-back owners’
compensation because there are no other employees and the owners perform all of the duties necessary for daily
operations. The calculation of the Company’s SDE is presented in detail in Exhibit F5 – Adjustments to Earnings.
This method is best suited to valuing a controlling interest in a business where the salary and perquisites of an owner
represent a significant portion of the total benefits generated by the business and/or an owner/operator typically runs the
business. Buyers and sellers of small businesses tend to think in terms of their potential personal compensation rather than
business profits. They look at the total discretionary earnings to see if it is sufficient to carry the debt structure necessary to
buy and/or operate the business, and provide them with adequate compensation.
The Multiple of SDE method produced a value of $316,458 and is presented in detail in Exhibit V1. Because this method is
based on limited data and produced a value less than the adjusted net assets, it was not selected.
21
Income Based Methods The income approach serves to estimate value by considering the income (benefits) generated by an asset (business) over a
period of time. This approach is based on the fundamental valuation principle that the value of a business is equal to the
present worth of the future benefits of ownership. The term income does not necessarily refer to income in the accounting
sense but to future benefits accruing to the owner. Cash flow is commonly used to reflect the benefits of ownership. It is
considered a more pure form of earnings and management has direct control of how it is used.
The Company’s cash flows are utilized to meet the specific priorities of the owner(s). These priorities may contradict the
commonly held theory that management’s main objective is to build shareholder value. Some benefits are non-monetary in
nature like: controlling your own destiny, being your own boss, and building a legacy. Due to the difficulty of quantifying
any non-monetary benefits, they have not been considered in this valuation.
Income-based methods produce results that value the entire company including fixed assets. They do not account for the
differing levels of fixed assets that may be required to produce the earnings. For this reason, income-based methods often
undervalue fixed asset intensive businesses, and may not be appropriate in these cases.
Discounting & Capitalizing
Converting the anticipated future benefits of ownership into value is the core of business valuation. The conversion process
involves either the discounting or capitalizing of some form of future benefits (economic income).
Discounting is a procedure that converts a series or stream of expected future benefits to a present value using a discount
rate. The discount rate is the compounded total rate of return assumed necessary to adequately compensate the investors
(owners) for all of the risks associated with owning the investment (business). This required total rate of return is also
referred to as the cost of capital. The expected future benefits consist of two components – income & appreciation or
depreciation. Income is the benefits received while holding the investment (owning the business). The amount received
upon liquidation will be either more (appreciation) or less (depreciation) than the original investment.
Capitalizing is a procedure that converts a single economic benefit into value. The single economic benefit can be for one
period or the average of multiple periods. It can be based on historical, current or expected future results. The
capitalization rate is the total rate of return assumed necessary to adequately compensate the investors (owners) for all of
the risks associated with owning the investment (business). Since only a single benefit is being converted, the total rate of
return is not compounded for growth. That is the difference between a discount rate and a capitalization rate. Deducting a
long-term sustainable growth rate from a discount rate converts it to a capitalization rate.
The cost of equity capital is not directly observable in the marketplace so it must be estimated. The Pepperdine private cost
of capital survey (PCOC) is the first comprehensive and simultaneous investigation of the behavior of the major private
capital market segments. The survey deployed in October/November 2009, specifically examined the behavior of senior
lenders, asset-based lenders, mezzanine funds, private equity groups, venture capital firms, and privately-held businesses.
The Pepperdine PCOC survey investigated, for each private capital market segment, the important benchmarks that must
be met in order to qualify for capital, how much capital is typically accessible, what the required returns are for extending
capital in today’s economic environment, and outlooks on demand for various capital types, interest rates, and the
economy in general.
The Fall 2010 findings indicate that required returns on new investments vary significantly by capital type and risk assumed.
This relationship is depicted in the Pepperdine Private Cost of Capital Market Line, which appears below.

22
Private equity groups typically invest in large, non-public companies with earnings of $1 million or greater. They typically
hold their investments for a period of 3 to 7 years with the intent of exiting through an initial public offering, sale, merger or
recapitalization. Private equity groups tend to focus on mature businesses, often contributing both equity and debt in
amounts ranging from $2 million to $10 million. According to the survey, the required rate of return for the private equity
groups investing in companies with earnings of $1 million ranged from 25% to 30.8%. The difference in rates is due
primarily to the structure of the investment and the risks associated with the specific company.
Venture capital funds generally invest in startup firms with products still in the development stage and little if any revenue.
These companies have exceptional growth potential where both the risk of loss and the potential for profit are
considerable. These funds typically hold their investments for a period of 5 to 10 years with the intent of exiting through an
initial public offering, sale, or merger. According to the survey, the median required rate of return for venture capital firms
investing in startups was 40.0%.
The risk level associated with owning a small business is generally assumed to be higher than a large, mature private
company, and lower than that of a startup company. Therefore, the required rate of return for a small business should
range from 25% to 40%. To estimate the cost of equity for a specific company we start with the required rate of return for
private equity groups and add a specific company risk factor.
23
Specific Company Risk
The risks of owning and operating this business are primarily influenced by factors within the Company and the industry in
which it operates. Risk premiums were determined by analyzing a number of factors within four categories – market &
customer base, financial performance, operations & management, location & facilities, and macro conditions. This analysis
is summarized below and presented in detail in Exhibit V2.
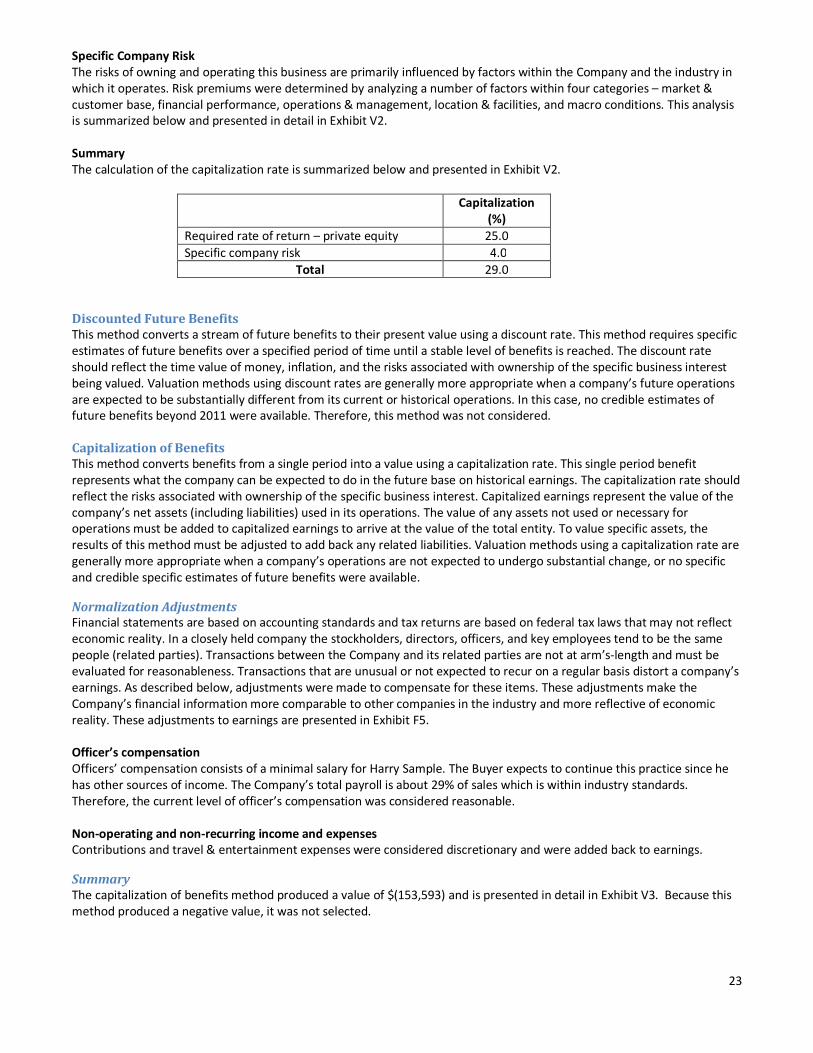
Summary
The calculation of the capitalization rate is summarized below and presented in Exhibit V2.
Capitalization
(%)
Required rate of return – private equity 25.0
Specific company risk 4.0
Total 29.0
Discounted Future Benefits
This method converts a stream of future benefits to their present value using a discount rate. This method requires specific
estimates of future benefits over a specified period of time until a stable level of benefits is reached. The discount rate
should reflect the time value of money, inflation, and the risks associated with ownership of the specific business interest
being valued. Valuation methods using discount rates are generally more appropriate when a company’s future operations
are expected to be substantially different from its current or historical operations. In this case, no credible estimates of
future benefits beyond 2011 were available. Therefore, this method was not considered.
Capitalization of Benefits
This method converts benefits from a single period into a value using a capitalization rate. This single period benefit
represents what the company can be expected to do in the future base on historical earnings. The capitalization rate should
reflect the risks associated with ownership of the specific business interest. Capitalized earnings represent the value of the
company’s net assets (including liabilities) used in its operations. The value of any assets not used or necessary for
operations must be added to capitalized earnings to arrive at the value of the total entity. To value specific assets, the
results of this method must be adjusted to add back any related liabilities. Valuation methods using a capitalization rate are
generally more appropriate when a company’s operations are not expected to undergo substantial change, or no specific
and credible specific estimates of future benefits were available.
Normalization Adjustments Financial statements are based on accounting standards and tax returns are based on federal tax laws that may not reflect
economic reality. In a closely held company the stockholders, directors, officers, and key employees tend to be the same
people (related parties). Transactions between the Company and its related parties are not at arm’s-length and must be
evaluated for reasonableness. Transactions that are unusual or not expected to recur on a regular basis distort a company’s
earnings. As described below, adjustments were made to compensate for these items. These adjustments make the
Company’s financial information more comparable to other companies in the industry and more reflective of economic
reality. These adjustments to earnings are presented in Exhibit F5.
Officer’s compensation
Officers’ compensation consists of a minimal salary for Harry Sample. The Buyer expects to continue this practice since he
has other sources of income. The Company’s total payroll is about 29% of sales which is within industry standards.
Therefore, the current level of officer’s compensation was considered reasonable.
Non-operating and non-recurring income and expenses
Contributions and travel & entertainment expenses were considered discretionary and were added back to earnings.
Summary
The capitalization of benefits method produced a value of $(153,593) and is presented in detail in Exhibit V3. Because this
method produced a negative value, it was not selected.

24
Asset Based Methods In the asset-based approach, primary emphasis is placed on the fair market value of the assets and liabilities of a business.
As a result, this approach uses various methods that consider the value of individual assets and liabilities including
intangible assets. Estimating the value of individual intangible assets using the asset-based approach is difficult, highly
theoretical, and often produces unrealistic values. Therefore, this approach is most appropriate when a company has little
or no intangible assets. This situation is often due to companies that are under performing the industry, unprofitable, or
have volatile earnings histories.
Book Value The most well known method using this approach relies on reported balance sheet assets and liabilities generally termed as
book value. It should be recognized that book value is comprised of assets and liabilities reported in accordance with
various accounting conventions that may or may not accurately reflect fair market value. As of December 31, 2010 the book
value of the Specified Assets was $402,671 and is presented in Exhibit V4.
Adjusted Net Assets Another asset-based method is the adjusted net assets method. This method adjusts the book value of individual assets and
liabilities, where necessary, to their fair market value. The adjustments made in this case are described below. The excess of
the adjusted assets over the adjusted liabilities is called the adjusted net assets. This method is often used as the base value
of a business. The adjusted net asset values of the Specified Assets as of December 31, 2010 were $740,970 and are
described in detail in Exhibit V4.
Market Value Adjustments Rental equipment
The Seller provided estimates of the fair market value for the rental equipment. We compared the values for the rental
equipment to their original cost and age, and found them to be reasonable.
Shop & yard equipment
The Seller provided estimated replacement costs for various shop equipment. We estimated their current value to be 50%
of replacement value. The Seller provided estimated fair market values for 2 forklifts and a truck used for yard work. We
compared the forklift values to the prices of similar equipment listed for sale on MachineryTrader.com and found them to
be reasonable.
Vehicles
The Seller provided estimates of fair market value for the 3 service trucks and a number of trailers. We tested the vehicle
and trailer values by comparing them to prices for similar equipment listed for sale on TruckPaper.com and found them to
be reasonable.
Furniture & fixtures
The Seller provided estimated replacement costs for various office equipment. We estimated their current value to be 25%
of replacement value.
Leasehold improvements
The book value of leasehold improvements was minimal. We assumed any current value would revert to the landlord, and
considered them to have no value.
Summary
Since the Company has an established earnings history, we did not select an asset-based method. The adjusted net assets
value was used as a component of the Excess Earnings Method as described below.

25
Other Methods Excess Earnings
Usually, intangible assets are not reported on the balance sheet unless purchased. One commonly used method to
determine the existence and the estimated value of intangible assets is called the excess earnings method. The excess
earnings method was developed by the U.S. Treasury Department in 1920 in Appeals and Review Memorandum 34 (ARM
34). Its current version is found in Revenue Ruling 68-609. The excess earnings method is commonly used in valuing small
businesses and professional practices. The Internal Revenue Service suggests that it is to be used only when no better basis
exists for separately estimating the value of the intangible assets. The excess earnings method is a hybrid of income and
asset based approaches.
The model for the excess earnings method computes the company’s equity value based on the “appraised” value of
tangible assets plus an additional amount for intangible assets. In this case, the tangible assets of the Company are valued
at the Adjusted Net Asset Value, which is assumed to be a reasonable estimate of their “appraised” value. A company’s
tangible assets should provide a current return to the owner. Since there are risks associated with owning the company’s
assets, the rate of return on those assets should be commensurate with the risks involved. Typically, that rate is the
prevailing industry rate of return on assets (pre-tax income/total assets). Any returns produced by the company above the
rate on tangible assets are considered to arise from intangible assets. These “excess earnings” are capitalized to estimate
the value of the intangible assets.
The capitalization rate used in the excess earnings method is derived from the capitalization rate used in the capitalization
of benefits method by adjusting the rate for the different earnings base (pre-tax income vs. cash flow). The excess earnings
capitalization rate equals pre-tax earnings divided by cash flow, then multiplied by the capitalized earnings method
capitalization method. In this case, the adjusted rate was negative, so we used the cash flow rate as the default rate.
Summary
The excess earnings method produced a value of $824,584 and is presented in detail in Exhibit V5. Because this method
provides a logical and reasonable way to determine the value of a company’s intangible assets and it is based on earnings,
the primary driver of business value, it was selected as the most appropriate one.
Industry Rules of Thumb
Some industries have formulas or rules of thumb about how businesses in their industry are valued. Most rules of thumb
are market-driven because they are based on actual sales of businesses within a specific industry. We use the rules of
thumb published in the Business Reference Guide from Business Brokerage Press.
Rules of thumb reportedly come from industry experts and business intermediaries, but there is no credible evidence to
support the source and quality of the data used. Also, the rules do not give adequate consideration to the unique factors
that affect the value of a specific business.
Rules of thumb generally come in two formats. The most commonly used formula is a percentage of most recent annual
sales. The other common formula uses a multiple of sellers’ discretionary earnings (SDE). SDE is described in the Guideline
Private Company Transactions Method section.
Due to the limitations of the data available, we only use industry rules of thumb formulas when no better data is available.
The industry data and rules of thumb are presented in Exhibit V6 for information purposes only.
Valuation Adjustments
Non-Operating Items
Certain items that are not necessary to the ongoing operations of the business enterprise may require special treatment.
Non-operating items include non-operating assets or liabilities, and excess or deficient operating assets.
Income approach
• Controlling interest - the value of any non-operating items should be excluded from the computation of the
value of operating entity then added or deleted to determine the value of the entire entity.

26
• Non-controlling interest – the value of any non-operating items may or may not be used to adjust the value of
the entire entity depending on the influence exercisable by the non-controlling interest.
Asset-based or cost approach
• Separate consideration of non-operating items is usually not necessary.
Non-operating items, if any, are addressed in the applicable section of the report.
Lack of Marketability Discount
Marketability deals with the liquidity of an ownership interest -- how quickly and easily it can be converted to cash (sold).
Ownership interests in closely held companies are typically not readily marketable when compared to stocks of publicly
held companies. Therefore, a share of stock in a privately held company is usually worth less than a comparable publicly
held stock. If the value of a closely held interest is determined using guideline public company data, that value must be
discounted for the lack of marketability. Capitalization rates derived from public company data can be adjusted to reflect
lack of marketability through the use of specific company risk factors, making the application of a separate discount
unnecessary. In this case, a discount for lack of marketability is not applicable because the guideline public company
method was not used, and the capitalization rate was adjusted for specific company risk factors.
Control Premium and Minority Interest Discount
Having control of a company involves the ability to: appoint management, set management compensation, determine
strategy and policies, acquire or sell assets, acquire other companies, liquidate or recapitalize the company, buy or sell
treasury stock, declare and pay dividends, and amend articles of incorporation and bylaws.
Non-controlling or minority interests are worth less than a controlling interest because they do not have these abilities. In
companies where there are separate non-controlling interests and a controlling interest, the value of the entity is not
allocated proportionately based on ownership interest percentages. For example, a 51 percent controlling interest in a
company valued at $100,000 is worth more than $51,000 ($100,000 x 51%). Conversely, a 49 percent minority interest in
the same company is worth less than $49,000 ($100,000 x 49%).
In privately held companies, control of the company’s earnings or cash flow is the main concern of the owners. Controlling
owners can allocate more cash flow to themselves through compensation and other discretionary spending. In cases where
cash flow is allocated to the owners based on adequate and reasonable compensation for their services and
proportionately based on their ownership percentage, there is little benefit to controlling owner.
In this case, a control premium or minority interest discount is not applicable because a 100% equity interest is being
valued.

27
Summary & Conclusions The objective of this valuation is to estimate the value of a 100% equity interest in the assets specified (‘the Specified
Assets”) in the proposed asset purchase agreement between Sample Company Inc. (“the Seller”) and Joe Buyer LLC (“the
Buyer”) as of December 31, 2010, for the purpose stated. In reaching our conclusion, we considered the approaches and
methods discussed in this report. For the reasons described in that section, we found the excess earnings method to be the
most appropriate one.
Excess Earnings $ 824,584
Conclusion of Value (Rounded) $825,000
Inventory (resale) 41,416
Rental equipment 588,754
Non-rental equipment 110,800
Intangible assets 84,030
Total 825,000

28
Engagement Exhibits
E1 – Statement of Assumptions and Limiting Conditions
E2 – Sources of Information
E3 – Certifications and Representations of David E. Coffman
E4 – Professional Qualifications of David E. Coffman

29
E1 – Statement of Assumptions and Limiting Conditions
This valuation is subject to the following assumptions and limiting conditions:
1. The conclusion of value arrived at herein is valid only for the stated purpose as of the date of the valuation.
2. Tax returns, financial statements and other related information provided by the Company or its representatives, in
the course of this engagement, have been accepted without any verification as fully and correctly reflecting the
enterprise’s business conditions and operating results for the respective periods, except as specifically noted
herein. We have not audited, reviewed, or compiled the financial information provided to me and accordingly, we
express no audit opinion or any other of assurance on this information.
3. Public information, and industry and statistical information have been obtained from sources considered to be
reliable. However, we make no representation as to the accuracy or completeness of such information and have
performed no procedures to corroborate the information.
4. The conclusion of value arrived at herein is based on the assumption that the current level of management
expertise and effectiveness would continue to be maintained, and that the character and integrity of the
enterprise through any sale, reorganization, exchange, or diminution of the owners’ participation would not be
materially or significantly changed.
5. This report and the conclusion of value arrived at herein are for the exclusive use of our client for the sole and
specific purposes as noted herein. They may not be used for any other purpose or by any other party for any
purpose. Furthermore the report and conclusion of value are not intended by the author and should not be
construed by the reader to be investment advice in any manner whatsoever. The conclusion of value represents
our considered opinion based on information furnished to me by the Company and other sources.
6. Neither all nor any part of the contents of this report (especially the conclusion of value, the identity of any
valuation specialist(s), or the firm with which such valuation specials are connected or any reference to any of their
professional designations) should be disseminated to the public through advertising media, public relations, news
media, sales media, mail, direct transmittal, or any other means of communication without our prior written
consent and approval.
7. Future services regarding the subject matter of this report, including, but not limited to testimony or attendance in
court, shall not be required of me unless previous arrangements have been made in writing.
8. We have not made a specific compliance survey or analysis of the subject property to determine whether it is
subject to, or in compliance with the American Disabilities Act, and this valuation does not consider the effect, if
any, of noncompliance.
9. No change of any item in this report shall be made by anyone other than us, and we shall have no responsibility for
any such unauthorized change.
10. Unless otherwise stated, no effort has been made to determine the possible effect, if any, on the subject business
due to future Federal, state, or local legislation, including any environmental or ecological matters or
interpretations thereof.
11. We communicated with the Buyer who is familiar with Company operations.
12. We did not visit or inspect the Company’s facilities.
13. Except as noted, we have relied on the representations of the owners, management, and other third parties
concerning the value and useful condition of all equipment, real estate, investments used in the business, and any
other assets or liabilities, except as specifically stated to the contrary in this report. We have not attempted to
confirm whether or not all assets of the business are free and clear of liens and encumbrances or that the entity
has good title to all assets.
14. This valuation reflects facts and conditions existing at the valuation date. Subsequent events have not been
considered, and I have no obligation to update our report for such events and conditions.
15. David E. Coffman prepared this report. He has no present or contemplated future interest in the Company, no
personal interest with respect to the parties involved, nor any other interest that might prevent us from
performing an unbiased valuation. Our compensation is not contingent on an action or event resulting from the
analyses, opinions, or conclusions in, or use of, this report.

30
E2 – Sources of Information
The following sources of information were used in performing the valuation engagement.
Financial & Tax Information:
• Federal 1120S tax returns for 2009 & 2008
• Internal profit & loss statement for 2010
• RentalZone @ Fairview rental inventory items schedule
• Non-rental equipment list dated 1/17/2011
• 2011 Budget (projection)
Industry Data
• Sageworks Industry Data
• Business Reference Guide, Business Brokerage Press, Inc.
• “Retail Industry Outlook – Accentuating the Positive”, Rental Management, 12/2010
• “Retail Industry Outlook – Better Days Ahead”, Rental Management, 12/2010
• “State of the ARA”, American Rental Association, 1/31/2011
Market Data
• BIZCOMPS
• Truckpaper.com
• MachineryTrader.com
Economic –Demographic Data
• Bureau of Economic Analysis
• Bureau of Labor Statistics
• Census Bureau
• Institute for Supply Management
• National Economic Trends – Federal Reserve of St. Louis
Rate of Return Data
• The Pepperdine private cost of capital survey (PCOC), Fall 2010
Other
• Draft asset purchase agreement between Sample Company Inc. and Joe Buyer LLC
• Sample Bank loan approval letter dated 1/19/201110
• Lease & addendum between Sample Company Inc. and Any Landlord Inc.

31
E3 – Certifications and Representations of David E. Coffman
I certify that to the best of my knowledge and belief:
1. The analyses, opinions, and conclusion of value included in the valuation report are subject to the reported scope
limitations, and the assumptions and limiting conditions specified in Exhibit E1, and they are the personal analyses,
opinions, and conclusion of value of the valuation analyst.
2. The economic and industry data included in the valuation report have been obtained from various printed or
electronic reference sources that the valuation analyst believes to be reliable. The valuation analyst has not
performed any corroborating procedures to substantiate that data.
3. The valuation engagement was performed in accordance with the American Institute of Certified Public
Accountants Statement on Standards for Valuation Services, the Professional Standards of the National Association
of Certified Valuation Analysts, and the Uniform Standards of Professional Appraisal Practice.
4. The parties to which the information and use of the valuation report is restricted are identified; the valuation
report is not intended to be and should not be used by anyone other than such parties.
5. The analyst’s compensation is fee-based and is not contingent on the outcome of the valuation.
6. I am in compliance with the American Institute of Certified Public Accountants Accredited in Business Valuation
(ABV) and National Association of Certified Valuation Analysts (CVA) re-certification requirements.
7. I do not have any direct or indirect, present or contemplated future interest in the Company.
8. Disclosure of the contents of this report is subject to the requirements of the National Association of Certified
Valuation Analysts, and other professional organizations of which I am a member, related to review by their duly
authorized representatives.
David E. Coffman

32
E4 – Professional Qualifications of David E. Coffman
Academic and Professional Credentials
• Certified Public Accountant (CPA) since 1978. Licensed in PA and NJ.
• Certified Valuation Analyst (CVA) since 1997.
• Accredited in Business Valuation (ABV) since 2001.
• Certified in Financial Forensics (CFF) since 2008.
• Bachelor of Science, Business Administration, Bloomsburg University, May 1976.
Position and Experience
• President & CEO of Business Valuations & Strategies PC, Harrisburg, PA. Founded in 1997.
• President & CEO of NJ Business Valuations PC, Seaside Park, NJ. Founded in July 2008.
• Specializing exclusively in business valuation services since 1997.
• Has valued hundreds of small businesses.
• Over 30 years of experience advising, owning and operating small businesses.
Professional Affiliations
• American Institute of Certified Public Accountants
• Pennsylvania Institute of Certified Public Accountants, past president of the North and South Central Chapters
• New Jersey Society of Certified Public Accountants
• National Association of Certified Valuation Analysts

33
Financial Exhibits Historical Financial Data:
F1 – Balance Sheet – Historical & Common-size
F2 – Income Statements – Projected, Historical & Common-size
F3 – Cash Flow Statements – Comparative
F4 – Ratio Analysis
F5 – Adjustments to Earnings
F6 – Ability to Service Debt

Exhibit F1
Sample Company Inc.Balance Sheets - Historical & Common-Size
$ % $ % $ %
Assets
Current assets
Cash 3,555 0.8% 3,778 1.0% 1,948 0.5%
Trade receivables 35,590 7.9% 30,827 7.8% 55,165 13.3%Inventory 41,416 41,613 37,560
Total current assets 80,561 8.7% 76,218 8.8% 94,673 13.8%
Property & equipment - net 368,479 82.1% 319,072 80.7% 321,224 77.2%
Other assets 0 0.0% 0 0.0% 0 0.0%
Total assets 449,040 90.8% 395,290 89.5% 415,897 91.0%
Liabilities
Current liabilities
Accounts payable 23,601 5.3% 8,216 2.1% 13,973 3.4%
Note payable - short-term 36,735 8.2% 185,832 47.0% 148,855 35.8%
Payroll taxes payable 6,218 1.4% 3,555 0.9% 5,677 1.4%
Sales tax payable 2,252 0.5% 1,824 0.5% 2,095 0.5%Accrued expenses 4,563 0.0% 0 0.0% 4,576 1.1%
Total current liabilities 73,369 15.4% 199,427 50.5% 175,176 42.2%
Long-term liabilities 153,272 34.1% 112,623 28.5% 193,816 46.6%
Due to related parties 120,164 26.8% 107,115 27.1% 93,619 22.5%
Total liabilities 346,805 76.3% 419,165 106.1% 462,611 111.3%
Equity
Common stock 200 0.0% 200 0.1% 200 0.0%
Paid-in capital 0 0.0% 0 0.0% 0 0.0%
Retained earnings
Beginning (24,075) -5.4% (46,914) -11.9% (12,838) -3.1%
Net income (loss) 126,110 28.1% 22,880 5.8% (34,076) -8.2%Contributions (distributions) 0 0.0% (41) 0.0% 0 0.0%
Total 102,035 22.7% (24,075) -6.1% (46,914) -11.3%
Total equity 102,235 22.7% (23,875) -6.0% (46,714) -11.3%
Total liabilities & equity 449,040 99.0% 395,290 100.1% 415,897 100.0%
12/31/2009 12/31/200812/31/2010
34
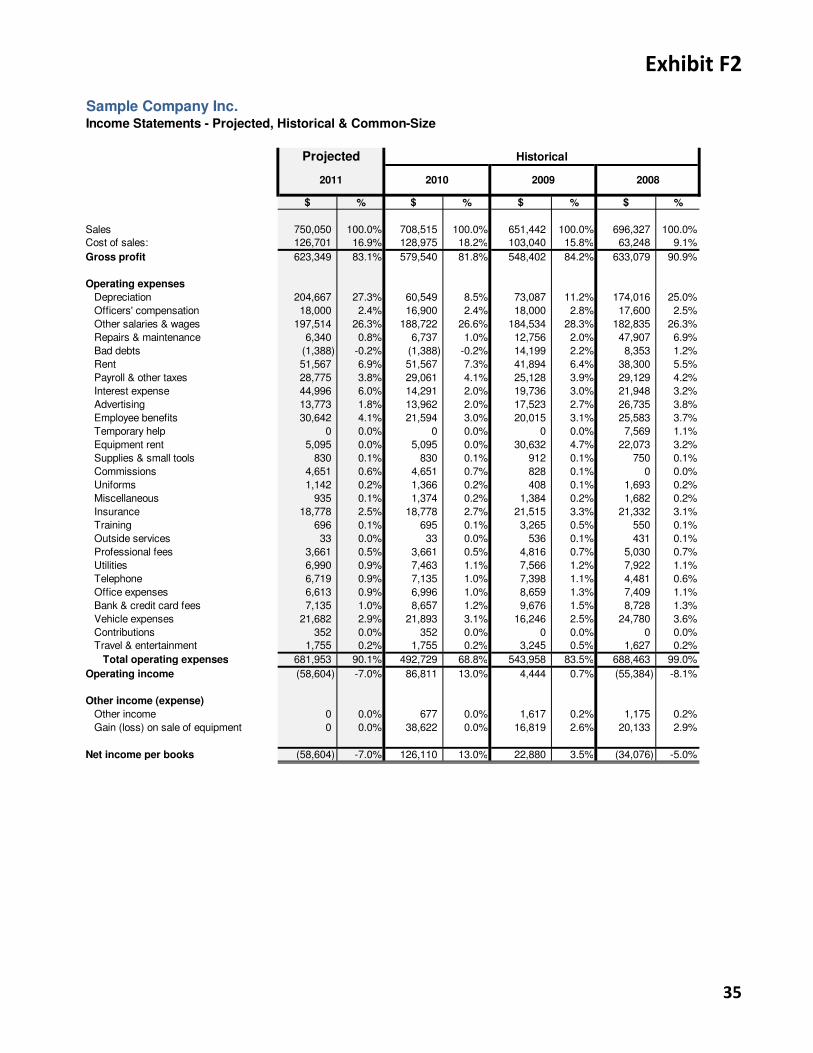
Exhibit F2
Sample Company Inc.Income Statements - Projected, Historical & Common-Size
$ % $ % $ % $ %
Sales 750,050 100.0% 708,515 100.0% 651,442 100.0% 696,327 100.0%
Cost of sales: 126,701 16.9% 128,975 18.2% 103,040 15.8% 63,248 9.1%
Gross profit 623,349 83.1% 579,540 81.8% 548,402 84.2% 633,079 90.9%
Operating expenses
Depreciation 204,667 27.3% 60,549 8.5% 73,087 11.2% 174,016 25.0%
Officers' compensation 18,000 2.4% 16,900 2.4% 18,000 2.8% 17,600 2.5%
Other salaries & wages 197,514 26.3% 188,722 26.6% 184,534 28.3% 182,835 26.3%
Repairs & maintenance 6,340 0.8% 6,737 1.0% 12,756 2.0% 47,907 6.9%
Bad debts (1,388) -0.2% (1,388) -0.2% 14,199 2.2% 8,353 1.2%
Rent 51,567 6.9% 51,567 7.3% 41,894 6.4% 38,300 5.5%
Payroll & other taxes 28,775 3.8% 29,061 4.1% 25,128 3.9% 29,129 4.2%
Interest expense 44,996 6.0% 14,291 2.0% 19,736 3.0% 21,948 3.2%
Advertising 13,773 1.8% 13,962 2.0% 17,523 2.7% 26,735 3.8%
Employee benefits 30,642 4.1% 21,594 3.0% 20,015 3.1% 25,583 3.7%
Temporary help 0 0.0% 0 0.0% 0 0.0% 7,569 1.1%
Equipment rent 5,095 0.0% 5,095 0.0% 30,632 4.7% 22,073 3.2%
Supplies & small tools 830 0.1% 830 0.1% 912 0.1% 750 0.1%
Commissions 4,651 0.6% 4,651 0.7% 828 0.1% 0 0.0%
Uniforms 1,142 0.2% 1,366 0.2% 408 0.1% 1,693 0.2%
Miscellaneous 935 0.1% 1,374 0.2% 1,384 0.2% 1,682 0.2%
Insurance 18,778 2.5% 18,778 2.7% 21,515 3.3% 21,332 3.1%
Training 696 0.1% 695 0.1% 3,265 0.5% 550 0.1%
Outside services 33 0.0% 33 0.0% 536 0.1% 431 0.1%
Professional fees 3,661 0.5% 3,661 0.5% 4,816 0.7% 5,030 0.7%
Utilities 6,990 0.9% 7,463 1.1% 7,566 1.2% 7,922 1.1%
Telephone 6,719 0.9% 7,135 1.0% 7,398 1.1% 4,481 0.6%
Office expenses 6,613 0.9% 6,996 1.0% 8,659 1.3% 7,409 1.1%
Bank & credit card fees 7,135 1.0% 8,657 1.2% 9,676 1.5% 8,728 1.3%
Vehicle expenses 21,682 2.9% 21,893 3.1% 16,246 2.5% 24,780 3.6%
Contributions 352 0.0% 352 0.0% 0 0.0% 0 0.0%
Travel & entertainment 1,755 0.2% 1,755 0.2% 3,245 0.5% 1,627 0.2%
Total operating expenses 681,953 90.1% 492,729 68.8% 543,958 83.5% 688,463 99.0%
Operating income (58,604) -7.0% 86,811 13.0% 4,444 0.7% (55,384) -8.1%
Other income (expense)
Other income 0 0.0% 677 0.0% 1,617 0.2% 1,175 0.2%
Gain (loss) on sale of equipment 0 0.0% 38,622 0.0% 16,819 2.6% 20,133 2.9%
Net income per books (58,604) -7.0% 126,110 13.0% 22,880 3.5% (34,076) -5.0%
2009
Historical
2010 20082011
Projected
35

Exhibit F3
Sample Company Inc.Cash Flow Statements - Comparative Historical
Net income 126,110 22,880 (34,076)
Non-cash items
Depreciation 60,549 73,087 174,016
Change in:
Trade receivables (4,763) 24,338 (12,736)
Inventory 197 (4,053) (4,113)
Accounts payable 15,385 (5,757) 857
Payroll taxes payable 2,663 (2,122) 1,784
Notes payable - short-term (149,097) 36,977 (44,971)
Sales tax payable 428 (271) (162)Accrued expenses 4,563 (4,576) 4,576
Operating cash flow 56,035 140,503 85,175
Net change in LT debt 40,649 (81,193) 6,212
Capital expenditures - net (109,956) (70,935) (207,096)
Net cash flow to equity (pre-tax) (13,272) (11,625) (115,709)
2009 20082010
36

37
F4 – Ratio Analysis
INDUSTRY SCORECARD
Financial Indicator Current Period Industry Range
Distance from
Industry
Current Ratio 1.10 1.20 to 2.20 -8.33%
= Total Current Assets / Total Current Liabilities
Explanation: Generally, this metric measures the overall liquidity position of a company. It is certainly not a
perfect barometer, but it is a good one. Watch for big decreases in this number over time. Make sure the
accounts listed in "current assets" are collectible. The higher the ratio, the more liquid the company is.
Quick Ratio 0.53 0.90 to 1.80 -41.11%
= (Cash + Accounts Receivable) / Total Current Liabilities
Explanation: This is another good indicator of liquidity, although by itself, it is not a perfect one. If there are
receivable accounts included in the numerator, they should be collectible. Look at the length of time the
company has to pay the amount listed in the denominator (current liabilities). The higher the number, the
stronger the company.
Inventory Days 117.21 Days 1.00 to 10.00 Days -1,072.10%
= (Inventory / COGS) * 365
Explanation: This metric shows how much inventory (in days) is on hand. It indicates how quickly a company
can respond to market and/or product changes. Not all companies have inventory for this metric. The lower the
better.
Accounts Receivable Days 18.33 Days 10.00 to 30.00 Days 0.00%
= (Accounts Receivable / Sales) * 365
Explanation: This number reflects the average length of time between credit sales and payment receipts. It is
crucial to maintaining positive liquidity. The lower the better.
Accounts Payable Days 66.79 Days 5.00 to 20.00 Days -233.95%
= (Accounts Payable / COGS) * 365
Explanation: This ratio shows the average number of days that lapse between the purchase of material and
labor, and payment for them. It is a rough measure of how timely a company is in meeting payment obligations.
Lower is normally better.
Gross Profit Margin 81.80% 75.00% to 88.00% 0.00%
= Gross Profit / Sales
Explanation: This number indicates the percentage of sales revenue that is not paid out in direct costs (costs
of sales). It is an important statistic that can be used in business planning because it indicates how many cents
of gross profit can be generated by each dollar of future sales. Higher is normally better (the company is more
efficient).
Net Profit Margin 17.80% 4.00% to 12.00% +48.33%
= Adjusted Net Profit before Taxes / Sales
Explanation: This is an important metric. In fact, over time, it is one of the more important barometers that
we look at. It measures how many cents of profit the company is generating for every dollar it sells. Track it
carefully against industry competitors. This is a very important number in preparing forecasts. The higher the
better.
Advertising to Sales 1.97% 0.75% to 2.00% 0.00%
= Advertising / Sales
Explanation: This metric shows advertising expense for the company as a percentage of sales.

38
INDUSTRY SCORECARD
Financial Indicator Current Period Industry Range
Distance from
Industry
Rent to Sales 7.28% 1.00% to 4.00% -82.00%
= Rent / Sales
Explanation: This metric shows rent expense for the company as a percentage of sales.
G & A Payroll to Sales 29.02% 24.00% to 40.00% 0.00%
= G & A Payroll Expense / Sales
Explanation: This metric shows G & A payroll expense for the company as a percentage of sales.
Interest Coverage Ratio 14.06 5.00 to 15.00 0.00%
= EBITDA / Interest Expense
Explanation: This ratio measures a company's ability to service debt payments from operating cash flow
(EBITDA). An increasing ratio is a good indicator of improving credit quality. The higher the better.
Debt-to-Equity Ratio 3.39 1.50 to 3.00 -13.00%
= Total Liabilities / Total Equity
Explanation: This Balance Sheet leverage ratio indicates the composition of a company’s total capitalization --
the balance between money or assets owed versus the money or assets owned. Generally, creditors prefer a
lower ratio to decrease financial risk while investors prefer a higher ratio to realize the return benefits of
financial leverage.
Debt Leverage Ratio 1.73 N/A N/A
= Total Liabilities / EBITDA
Explanation: This ratio measures a company's ability to repay debt obligations from annualized operating cash
flow (EBITDA).
Return on Equity 123.35% 8.00% to 20.00% +516.75%
= Net Income / Total Equity
Explanation: This measure shows how much profit is being returned on the shareholders' equity each year. It
is a vital statistic from the perspective of equity holders in a company. The higher the better.
Return on Assets 28.08% 6.00% to 10.00% +180.80%
= Net Income / Total Assets
Explanation: This calculation measures the company's ability to use its assets to create profits. Basically, ROA
indicates how many cents of profit each dollar of asset is producing per year. It is quite important since
managers can only be evaluated by looking at how they use the assets available to them. The higher the better.
Fixed Asset Turnover 0.72 0.50 to 2.00 0.00%
= Sales / Gross Fixed Assets
Explanation: This asset management ratio shows the multiple of annualized sales that each dollar of gross
fixed assets is producing. This indicator measures how well fixed assets are "throwing off" sales and is very
important to businesses that require significant investments in such assets. Readers should not emphasize this
metric when looking at companies that do not possess or require significant gross fixed assets. The higher the
more effective the company's investments in Net Property, Plant, and Equipment are.
NOTE: Exceptions are sometimes applied when calculating the Financial Indicators. Generally, this occurs
when the inputs used to calculate the ratios are zero and/or negative.

Exhibit F5
Sample Company Inc.Adjustments to Earnings
Adjusted Pre-Tax Earnings
Net income 126,110 22,880 (34,076)
Non-recurring items
0 0 0
Non-operating (discretionary) items:
Contributions 352 0 0
Travel & entertainment 1,755 3,245 1,627
Adjusted pre-tax earnings 128,217 26,125 (32,449)
Adjusted Cash Flow to Equity
Cash flow to equity (13,272) (11,625) (115,709)
Non-recurring items
0 0 0
Non-operating (discretionary) items
Contributions 352 0 0
Travel & entertainment 1,755 3,245 1,627
Adjusted cash flow (11,165) (8,380) (114,082)
Seller's Discretionary Earnings
Net income 126,110 22,880 (34,076)
Depreciation 60,549 73,087 174,016
Capital expenditures (109,956) (70,935) (207,096)
Interest expense 14,291 19,736 21,948
Officers' compensation 16,900 18,000 17,600
Payroll taxes on officer's compensation (estimate) 1,352 1,440 1,408
Non-recurring items
0 0 0
Non-operating (discretionary) items
Contributions 352 0 0
Travel & entertainment 1,755 3,245 1,627
Sellers' discretionary earnings (SDE) 111,353 67,453 (24,573)
2009
2009
2009
2010 2008
2010 2008
2010 2008
39

Exhibit F6
Sample Company Inc.Ability to Service Acquisiton Debt
Acquisiton Debt Service
Bank loan Seller Equity Total
Amount 616,000 0 154,000 770,000
Term (Years) 10
Interest rate* 6.00%Monthly payment (P&I) 6,839
Annual debt service (P&I) 82,068 0 0 82,068
Cash Flow Available
2011 Projected net income (58,604)
Add back:
Depreciation 204,667
Interest expense 44,996
Cash flow available for debt service 191,059
Debt Service Coverage
Cash flow available 191,059
Annual debt service 82,068
Debt service coverage ratio 2.3
Notes
Bank term - Current Wall Street Journal prime rate of 3.25% plus 2.75%
40

41
Valuation Exhibits
V1 – Private Company Transactions
Search Summary
Percentage of Annual Revenue
Multiple of Seller’s Discretionary Earnings
V2 – Capitalization Rate
V3 – Capitalization of Benefits (Cash Flow)
V4 – Adjusted Net Assets
V5 – Excess Earnings
V6 – Industry Data & Rules of Thumb

Exhibit V1
Sample Company Inc.Private Company Transactions
BizComps
NAICS Code 5324
Additional search criteria:
Annual sales less than $1 million
Keywood: Equipment
Search results
Number of trnsactions 13
Averages:
Annual revenue (AR) 386,846
Seller's discretionary earnings/cash flow 155,385
Sales price (SP) 384,308
Ratios:
SP to AR 0.99
SP to SDE 2.47
Percentage of Annual Revenue
Company sales - 2010 708,515
Sales Price to Annual Revenue Ratio 0.99
Value of FF&E and Goodwill 701,430
Add (deduct):
Inventory 41,416
Value of Specified Assets 742,846
Multiple of SDE
Company SDE - 2010 111,353
Sales Price to SDE Ratio 2.47
Value of FF&E and Goodwill 275,042
Add (deduct):
Inventory 41,416
Value of Specified Assets 316,458
42

Exhibit V2
Sample Company Inc.Capitalization Rate
Specific Company Risk Premium
Notes
Market & Customer Base
Market & industry trends 4 1 4 Positive, modest growth
Sales & marketing strategy 4 1 4 Referral, location & inventory
Number & concentration of customers 3 1 3 Very diverse
Ability of customer to switch 5 1 5 Moderate ease based on equipment type
Customer retention/relations 4 1 4 Reputation & service
Reliance on relationships with key people 3 1 3 Not significant
Ease of getting new customers 5 1 5 Requires marketing
Competition 5 1 5 Moderate
Selling proposition 4 1 4 Location & inventory
Ability to expand 4 1 4 Good - physical & market
Years in business 3 1 3 Well established
Total 44 11 44
Weighted average 4.0
Financial Performance
Liquidity 7 1 7 Poor
Efficient use of assets 3 1 3 Very good
Efficient use of debt 3 1 3 Very good
Sales trend 4 1 4 Good
Profit trend 4 1 4 Good
Total 21 5 21
Weighted average 4.2
Operations & Management
Quality & availablility of information 4 1 4 Good
Operating systems & procedures 4 1 4 Good
Reliance on key people 4 1 4 Not significant
Management capabilities 4 1 4 Good
Staff turnover 3 1 3 Minimal
Working conditions 4 1 4 Good
Ability to hire new staff 4 1 4 Not significant
Supplier relations 4 1 4 Good
Environmental impact 4 1 4 Not significant
Total 35 9 35
Weighted average 3.9
Location & Facilities
Equipment condition 4 1 4 Good
Building condition 4 1 4 Good
Available capacity 4 1 4 Good
Geographic location 4 1 4 Good
Total 16 4 16
Weighted average 4.0
Macro
Economic conditions & outlook 6 1 6 Uncertain but improving
Regulatory environment 4 1 4 Not significant
Exposure to liability 4 1 4 Moderate
Total 14 3 14
Weighted average 4.7
Total 116 29 116
Weighted average 4.0
* Risk factor
2 = very low, 3 = low, 4 = below average, 5 = average, 6 = above average, 7 = high, 8 = very high
Summary
Required rate of return - private equity** 25.0%
Specific company risk premuim 4.0%
Capitalization rate 29.0%
** The Pepperdine private cost of capital survey, Fall 2010
Risk
factor* Weight
Weighted
risk
43

Exhibit V3
Sample Company Inc.Capitalization of Benefits (Cash Flow) Method
Adjusted Cash Flow to Equity
2010 (11,165)
2009 (8,380) 2008 (114,082)
Total (133,627)
Average (44,542)
Capitalization Rate ÷ 29.0%
Value of operating assets (net) = (153,593)
Add: Non-operating assets 0
Value of Specified Assets (153,593)
44

Exhibit V4
Sample Company Inc.Adjusted Net Assets
12/31/2010
Assets
Current assets
Cash 3,555 (3,555) 0 0Trade receivables 35,590 (35,590) 0 0Inventory 41,416 41,416 41,416
Total current assets 80,561 (39,145) 41,416 0 41,416
Property & equipment - net
Rental equipment 303,180 303,180 a 285,574 588,754Shop & yard equipment 2,702 2,702 b 11,198 13,900Vehicles 50,587 50,587 c 43,813 94,400Furniture & fixtures 4,786 4,786 d (2,286) 2,500Leasehold improvements 7,224 (7,224) 0 0
Total 368,479 (7,224) 361,255 338,299 699,554
Other assets 0 0 0
Total assets 449,040 (46,369) 402,671 338,299 740,970
Notes
a - Adjust rental equipment to estimated market values provided by Sellerb - Adjust shop equipment to 50% of replacement value & yard equipment to market value provided by Sellerc - Adjust vehicles & trailers to market values provided by Sellerd - Adjust office equipment & furniture to 25% of replacement value provided by Seller
Specified Assets
Fair market
value
Market value
adjustmentsBook value
Items not
includedBook value
45

Exhibit V5
Sample Company Inc.
Components
Total Assets
2010 449,040
2009 395,2902008 415,897
Total 1,260,227
Average 420,076
Industry Return on Assets Sageworks, NAICS 53249
Sales < $1 million, all years 3.93%
Adjusted Pre-Tax Earnings
2010 128,217
2009 26,125 2008 (32,449)
Total 121,893
Average 40,631
Capitalization Rate ConversionCapitalization rate - Cash flow 29.0%
Cash flow ÷ (44,542) Pre-tax earnings x 40,631
Capitalization rate - Excess earnings rate = 0.0%
CalculationTotal assets 420,076Industry return x 3.9%
Expected earnings = 16,383Pre-tax earnings 40,631
Excess earnings (pre-tax less expected) 24,248Capitalization rate (cash flow rate by default) ÷ 29.0%
Value of intangible assets = 83,614
Plus: Value of tangible net assets + 740,970
Value of total entity = 824,584
Excess Earnings Method
46
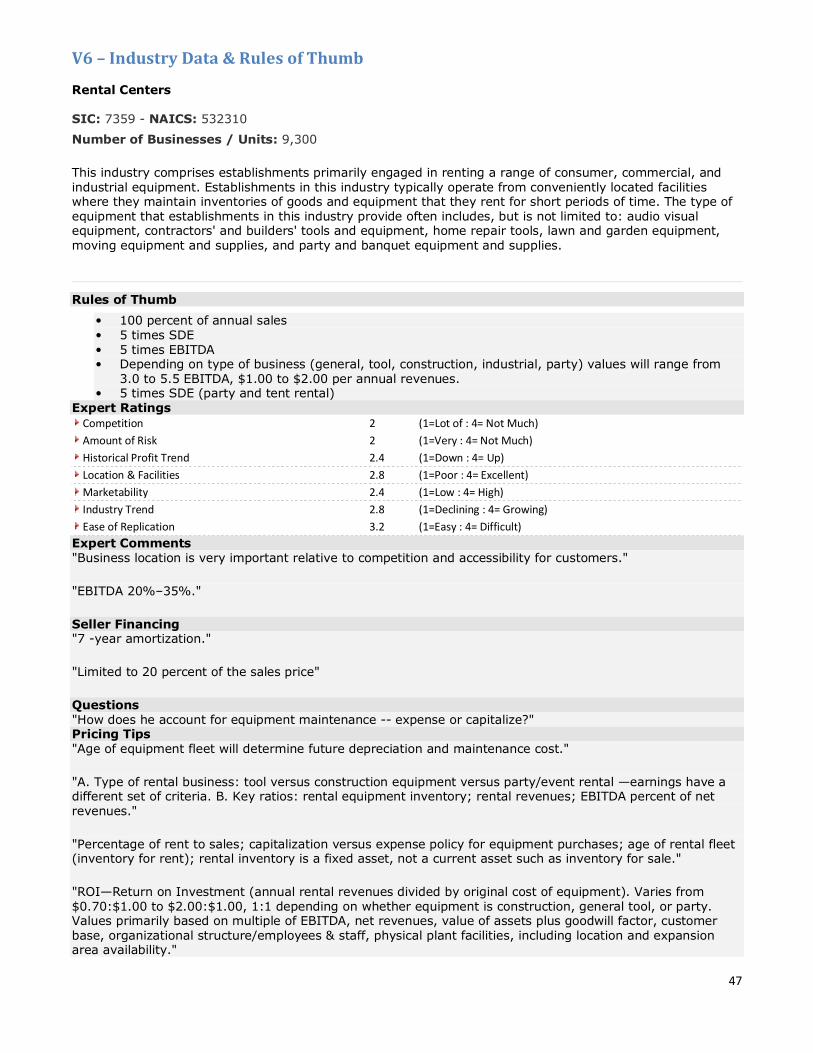
47
V6 – Industry Data & Rules of Thumb Rental Centers SIC: 7359 - NAICS: 532310
Number of Businesses / Units: 9,300
This industry comprises establishments primarily engaged in renting a range of consumer, commercial, and industrial equipment. Establishments in this industry typically operate from conveniently located facilities where they maintain inventories of goods and equipment that they rent for short periods of time. The type of equipment that establishments in this industry provide often includes, but is not limited to: audio visual equipment, contractors' and builders' tools and equipment, home repair tools, lawn and garden equipment, moving equipment and supplies, and party and banquet equipment and supplies.
Rules of Thumb
• 100 percent of annual sales • 5 times SDE • 5 times EBITDA • Depending on type of business (general, tool, construction, industrial, party) values will range from
3.0 to 5.5 EBITDA, $1.00 to $2.00 per annual revenues. • 5 times SDE (party and tent rental)
Expert Ratings
Competition 2 (1=Lot of : 4= Not Much)
Amount of Risk 2 (1=Very : 4= Not Much)
Historical Profit Trend 2.4 (1=Down : 4= Up)
Location & Facilities 2.8 (1=Poor : 4= Excellent)
Marketability 2.4 (1=Low : 4= High)
Industry Trend 2.8 (1=Declining : 4= Growing)
Ease of Replication 3.2 (1=Easy : 4= Difficult)
Expert Comments "Business location is very important relative to competition and accessibility for customers."
"EBITDA 20%–35%."
Seller Financing "7 -year amortization."
"Limited to 20 percent of the sales price"
Questions "How does he account for equipment maintenance -- expense or capitalize?" Pricing Tips "Age of equipment fleet will determine future depreciation and maintenance cost."
"A. Type of rental business: tool versus construction equipment versus party/event rental —earnings have a different set of criteria. B. Key ratios: rental equipment inventory; rental revenues; EBITDA percent of net revenues."
"Percentage of rent to sales; capitalization versus expense policy for equipment purchases; age of rental fleet (inventory for rent); rental inventory is a fixed asset, not a current asset such as inventory for sale."
"ROI—Return on Investment (annual rental revenues divided by original cost of equipment). Varies from $0.70:$1.00 to $2.00:$1.00, 1:1 depending on whether equipment is construction, general tool, or party. Values primarily based on multiple of EBITDA, net revenues, value of assets plus goodwill factor, customer base, organizational structure/employees & staff, physical plant facilities, including location and expansion area availability."

48
"Areas to look at: Rental equipment inventory mix, type, unit investment, ROI, revenues, net earnings, EBITDA, customer (type) base, location, physical plant facilities, organization structure, market position, and overall thrust of the business."
"To be successful, a general equipment rental store should be doing a minimum of $800,000 gross sales per year."
Benchmarks Tools, Equipment and other Rental Centers
Statistics
Number of Enterprises 4,540
Average Wages per Employee $29,889
Average Profit Margin 6.0%
Average Revenue of Enterprise $1,079,802
Source: IBISWorld, June 2009
Product/Services Share
Contractor equipment 27.4%
Building tools and equipment 22.5%
Aerial lifts 12.4%
Garden tools and equipment 7.6%
Other miscellaneous rental items 6.7%
Sale and repair of merchandise 6.1%
Consumer electronics 5.4%
Consumer appliances 5.1%
Furniture 4.2%
Party supplies 2.6%
Source: IBISWorld, June 2009
Market Segment Share
Construction firms 24.8%
Industrial firms 21.2%
Independent builders and contractors 19.6%
Private households 18.1%
Other 8.9%
Government 7.4%
Source: IBISWorld, June 2009
Item Cost
Purchases 37.8%
Wages 25.1%
Depreciation 15.5%
Rent 3.0%
Utilities 4.0%
Other 8.6%
Profit 6.0%
Source: IBISWorld, June 2009
"The U.S. construction and industrial equipment segment is expected to account for the largest share of the total U.S. rental revenue at 66.2 percent of the total. General tool follows with rental revenue of U.S. $8.0

49
billion in 2009, accounting for 26.4 percent of total U.S. rental revenue, while at U.S. $2.2 billion the party and event segment has the smallest share of the total U.S. market with 7.4 percent. Although the relative size of the construction and industrial equipment rental industry is impressive, its share has declined substantially from the mid-1990s when it was close to 80 percent."
Source: “State of the Equipment Rental Industry Outlook 2009-2014,” Rental Management Magazine
"Revenues of $100,000 per employee"
"A well-run store will have approximately $100,000 in net revenues per full-time equivalent employee."
"Rental revenues should be $0.70 to $2.00 the value of inventory at cost and be in reasonable rental condition."
Expenses as a Percentage of Sales
Cost Of Goods N/A
Payroll/Labor Costs 30% to 40%
Occupancy Costs 4% to 7%
Profit (pretax) 20% to 35%
Industry Trend "Growing industry with growth areas. Dependent on construction cycle." Advantages
• "Great cash flow and tax advantages of depreciation of equipment. Very bankable type of business because of cashflow and good asset types."
• "Excellent potential cash flow—20 to 25 times EBITDA is common. However, substantial portion thereof must be reinvested in new rental equipment inventory"
• "Thrives under an entrepreneurial principal"
Disadvantages
• "Can use financial leverage to grow business but can also be a killer in down cycle."
• "Does not operate well in an absentee owner situation"
• "Do not overpay; off-season sales can be 50% of high season. Be prepared to carry your key people through the period."
• "Very capital intensive"
Additional Resources
Trade Publications
• Rental Management
Associations
• American Rental Association ©2011 Business Brokerage Press, Inc.