SAMPLE REPORT - Amazon Web Services€¦ · (sample report only ... Technician Job Satisfaction vs....
117
1 | Page ©MetricNet, LLC www.metricnet.com SAMPLE REPORT DATA IS NOT ACCURATE! Desktop Support Benchmark In-house/Insourced Desktop Support Report Number: DS-SAMPLE-IN-0617 | Updated: June 2017 MetricNet Performance Benchmarking www.metricnet.com MetricNet’s instantly downloadable Desktop Support benchmarks provide valuable industry data that your organization can use to begin improving performance right away!
-
Upload
nguyenliem -
Category
Documents
-
view
222 -
download
0
Transcript of SAMPLE REPORT - Amazon Web Services€¦ · (sample report only ... Technician Job Satisfaction vs....
SAMPLE Insourced Desktop Support Benchmark (sample report only—data is not accurate!)
1 | P a g e © M e t r i c N e t , L L C w w w . m e t r i c n e t . c o m
SAMPLE REPORT DATA IS NOT ACCURATE! Desktop Support Benchmark In-house/Insourced Desktop Support Report Number: DS-SAMPLE-IN-0617 | Updated: June 2017
MetricNet Performance Benchmarking www.metricnet.com
MetricNet’s instantly downloadable Desktop Support benchmarks provide valuable industry data that your organization can use to begin improving performance right away!
MetricNet Performance Benchmarking
www.metricnet.com
SAMPLE Insourced Desktop Support Benchmark (sample report only—data is not accurate!)
1 | P a g e © M e t r i c N e t , L L C w w w . m e t r i c n e t . c o m
Contents
Benchmarking Overview......................................................................................5
The Basic Benchmarking Approach ............................................................................ 5
Achieving World-Class Performance .......................................................................... 7
Cost vs. Quality for Desktop Support Organizations .............................................. 9
How to Use this Benchmark Report .................................................................. 12
Step 1: Collect your organization’s performance data. ........................................12
Step 2: Compare your performance to others. .......................................................13
Step 3: Develop strategies for improved performance. .......................................14
Step 4: Implement, and monitor results. ................................................................15
KPI Statistics: Summary and Quartiles ............................................................. 18
Benchmarking Performance Summary .....................................................................18
Quartile Rankings for Each KPI ................................................................................20
Benchmarking Scorecard and Rankings ............................................................ 24
The Desktop Support Scorecard: An Overview.......................................................24
Tracking Your Balanced Score ..................................................................................25
Benchmarking the Balanced Score ...........................................................................26
Detailed Benchmarking Data ........................................................................... 36
Cost Metrics ..................................................................................................................36
Cost per Ticket .........................................................................................................36
Cost per Incident ......................................................................................................39
Cost per Service Request ........................................................................................41
Productivity Metrics ....................................................................................................43
Technician Utilization .............................................................................................43
Tickets per Technician per Month ........................................................................46
Incidents per Technician per Month .....................................................................48
Service Requests per Technician per Month .......................................................50
SAMPLE Insourced Desktop Support Benchmark (sample report only—data is not accurate!)
2 | P a g e © M e t r i c N e t , L L C w w w . m e t r i c n e t . c o m
Technicians as a % of Total Headcount ...............................................................52
Service Level Metrics..................................................................................................54
Mean Time to Resolve Incidents ...........................................................................54
% of Incidents Resolved in 8 Business Hours .....................................................56
Mean Time to Fulfill Service Requests ................................................................58
% of Service Requests Fulfilled in 24 Business Hours .....................................60
Quality Metrics ............................................................................................................62
Customer Satisfaction .............................................................................................62
Incident First Visit Resolution Rate .....................................................................64
% Resolved Level 1 Capable ..................................................................................66
Technician Metrics ......................................................................................................68
Annual Technician Turnover ..................................................................................68
Daily Technician Absenteeism ...............................................................................70
New Technician Training Hours ............................................................................72
Annual Technician Training Hours .......................................................................74
Technician Tenure ...................................................................................................76
Technician Job Satisfaction ...................................................................................78
Ticket Handling Metrics .............................................................................................80
Average Incident Work Time ..................................................................................80
Average Service Request Work Time ....................................................................82
Average Travel Time per Ticket ............................................................................84
Workload Metrics .........................................................................................................86
Tickets per Seat per Month ....................................................................................86
Incidents per Seat per Month ................................................................................88
Service Requests per Seat per Month ..................................................................90
Incidents as a % of Total Ticket Volume .............................................................92
Important KPI Correlations .............................................................................. 95
Average Incident Work Time Plus Travel Time vs. Cost per Incident ............95
SAMPLE Insourced Desktop Support Benchmark (sample report only—data is not accurate!)
3 | P a g e © M e t r i c N e t , L L C w w w . m e t r i c n e t . c o m
Average Service Request Work Time Plus Travel Time vs. Cost per Service Request ......................................................................................................................96
Technician Utilization vs. Cost per Ticket ..........................................................97
Technician Utilization vs. Tickets per Technician per Month .........................98
Technician Utilization vs. Mean Time to Resolve Incidents (business hours).....................................................................................................................................99
Technician Utilization vs. Mean Time to Fulfill Service Requests (business days) ........................................................................................................................ 100
Incident First Visit Resolution Rate vs. Customer Satisfaction .................... 101
New Technician Training Hours vs. Incident First Visit Resolution Rate ... 102
Annual Technician Training Hours vs. Incident First Visit Resolution Rate.................................................................................................................................. 103
New Technician Training Hours vs. Customer Satisfaction .......................... 104
Annual Technician Training Hours vs. Customer Satisfaction ...................... 105
Technician Job Satisfaction vs. Cost per Ticket .............................................. 106
Technician Job Satisfaction vs. Customer Satisfaction .................................. 107
Technician Job Satisfaction vs. Annual Technician Turnover ....................... 108
Technician Job Satisfaction vs. Daily Technician Absenteeism ................... 109
New Technician Training Hours vs. Technician Job Satisfaction ................. 110
Annual Technician Training Hours vs. Technician Job Satisfaction ............ 111
Annual Technician Turnover vs. Daily Technician Absenteeism .................. 112
Annual Technician Turnover vs. Technician Tenure (months) ..................... 113
Technician Tenure (months) vs. Incident First Visit Resolution Rate ......... 114
Technician Tenure (months) vs. Customer Satisfaction ................................. 115
About MetricNet ............................................................................................ 116
Free Resources ...................................................................................................... 116

SAMPLE Insourced Desktop Support Benchmark (sample report only—data is not accurate!)
4 | P a g e © M e t r i c N e t , L L C w w w . m e t r i c n e t . c o m
BENCHMARKING OVERVIEW
SAMPLE Insourced Desktop Support Benchmark (sample report only—data is not accurate!)
5 | P a g e © M e t r i c N e t , L L C w w w . m e t r i c n e t . c o m
Benchmarking Overview
Benchmarking is a well-established tool for measuring and improving Desktop Support performance. Effective benchmarking enables you to quantify your Desktop Support organization ’s performance , compare your organization to others in your industry, identify negative performance gaps, and define the actions necessary to close the gaps.
The power of benchmarking is that it enables your organization to save enormous amounts of time and energy by building upon the know-how of peers, competitors, and world-class companies. Desktop Support organizations that focus exclusively on their internal operations tend to make progress at an evolutionary pace. But benchmarking forces an organization to look externally—at the competition. By studying the competition, and selectively adopting practices from the best of the best, Desktop Support organizations that successfully employ benchmarking can improve their performance at a revolutionary pace.
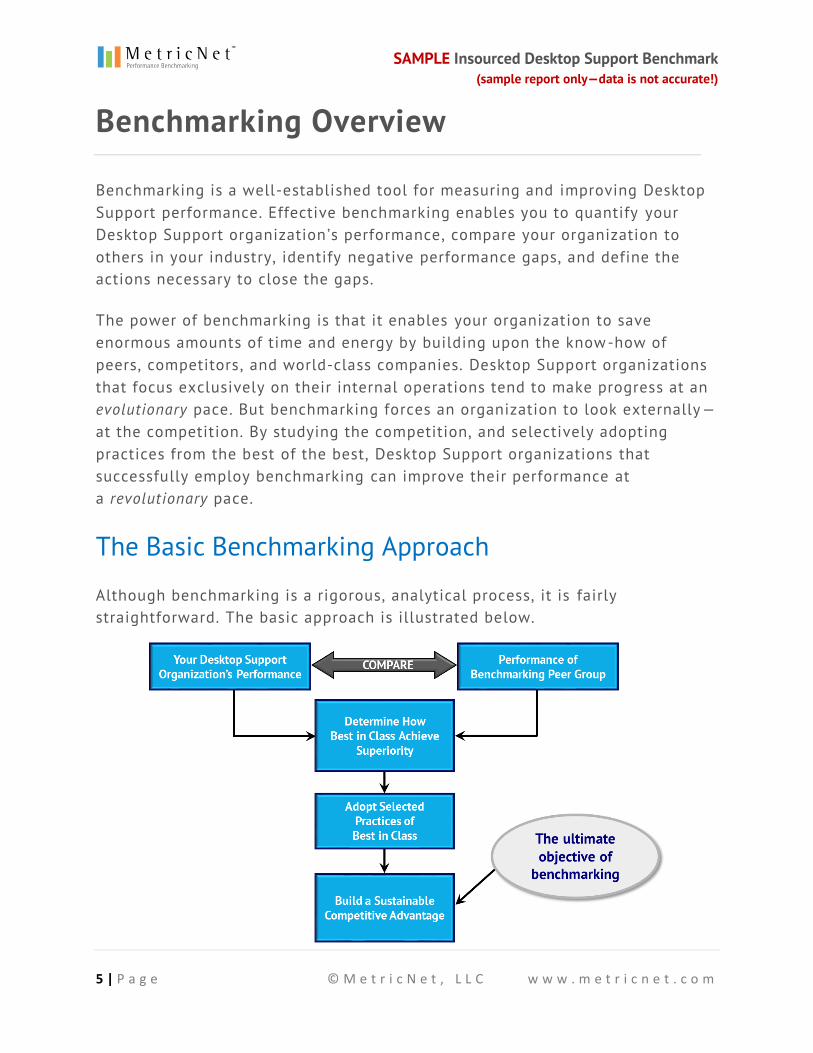
The Basic Benchmarking Approach
Although benchmarking is a rigorous, analytical process, it is fairly straightforward. The basic approach is illustrated below.
SAMPLE Insourced Desktop Support Benchmark (sample report only—data is not accurate!)
6 | P a g e © M e t r i c N e t , L L C w w w . m e t r i c n e t . c o m
The first critical step in benchmarking is to measure your Desktop Support organization ’s performance. The important metrics, or Key Performance Indicators (KPIs), for your Desktop Support organization fall into seven categories:
1) Cost metrics, such as Cost per Ticket
2) Productivity metrics, such as Technician Utilization
3) Service Level metrics, such as Mean Time to Resolve
4) Quality metrics, such as Customer Satisfaction
5) Technician metrics, such as Technician Job Satisfaction
6) Ticket Handling metrics, such as Average Work Time
7) Workload metrics, such as Tickets per Seat
This benchmark report explains each KPI, how to measure it, and how it is connected with other KPIs.
But the true potential of KPIs can be unlocked only when they are used holistically, not just to measure your performance, but also to:
Track and trend your performance over time
Benchmark your performance vs. industry peers
Identify strengths and weaknesses in your Desktop Support organization
Diagnose the underlying drivers of performance gaps
Prescribe actions to improve your performance
Establish performance goals for both individuals and your Desktop
Support organization overall
In other words, once you’ve measured your performance, benchmarking involves comparing your performance to others and asking questions such as, “How did they achieve a higher level of customer satisfaction? How did they get to a lower cost per ticket? How did they drive customer loyalty by virtue of the Desktop Support function?”
Once you’ve answered those questions, you can adopt selected industry best practices to remedy your performance gaps on the critical KPIs that will help you to achieve superior performance.
SAMPLE Insourced Desktop Support Benchmark (sample report only—data is not accurate!)
7 | P a g e © M e t r i c N e t , L L C w w w . m e t r i c n e t . c o m
Achieving World-Class Performance
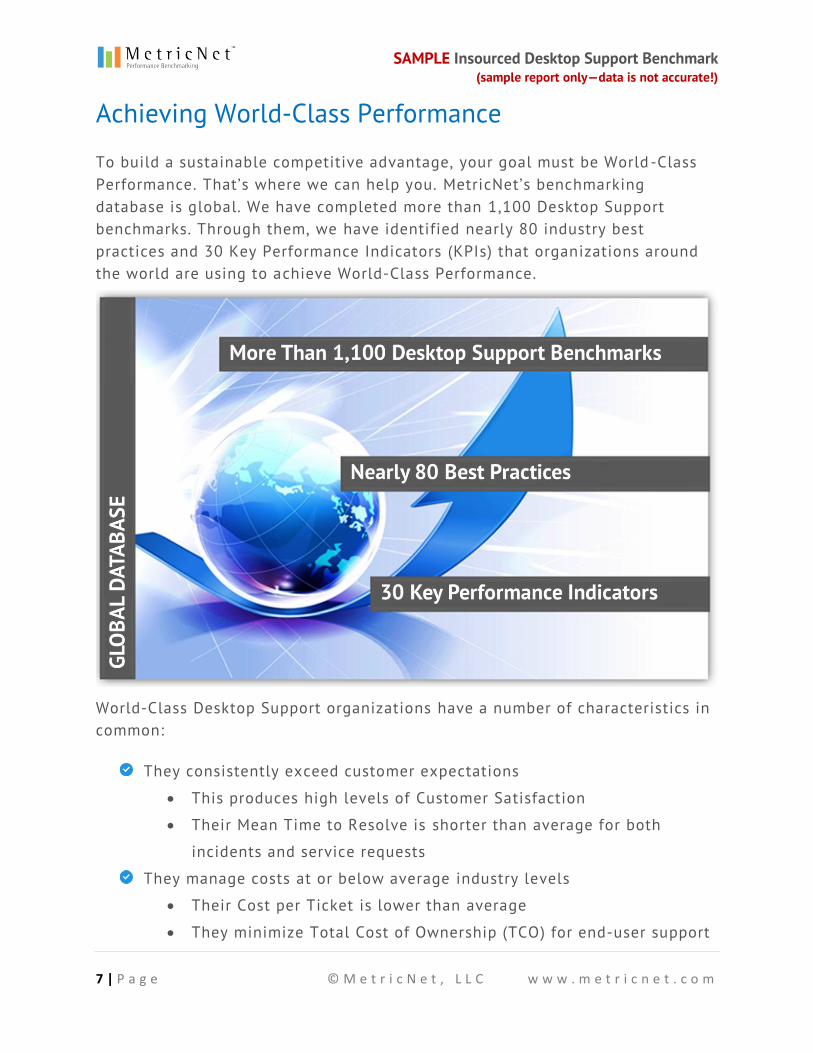
To build a sustainable competitive advantage, your goal must be World -Class Performance. That’s where we can help you. MetricNet’s benchmarking database is global. We have completed more than 1,100 Desktop Support benchmarks. Through them, we have identified nearly 80 industry best practices and 30 Key Performance Indicators (KPIs) that organizations around the world are using to achieve World-Class Performance.
World-Class Desktop Support organizations have a number of characteristics in common:
They consistently exceed customer expectations
• This produces high levels of Customer Satisfaction
• Their Mean Time to Resolve is shorter than average for both
incidents and service requests
They manage costs at or below average industry levels
• Their Cost per Ticket is lower than average
• They minimize Total Cost of Ownership (TCO) for end-user support
SAMPLE Insourced Desktop Support Benchmark (sample report only—data is not accurate!)
8 | P a g e © M e t r i c N e t , L L C w w w . m e t r i c n e t . c o m
They follow industry best practices
• Industry best practices are defined and documented
• They effectively apply those best practices
They add value with every transaction
• They produce a positive customer experience
• They drive a positive view of IT overall
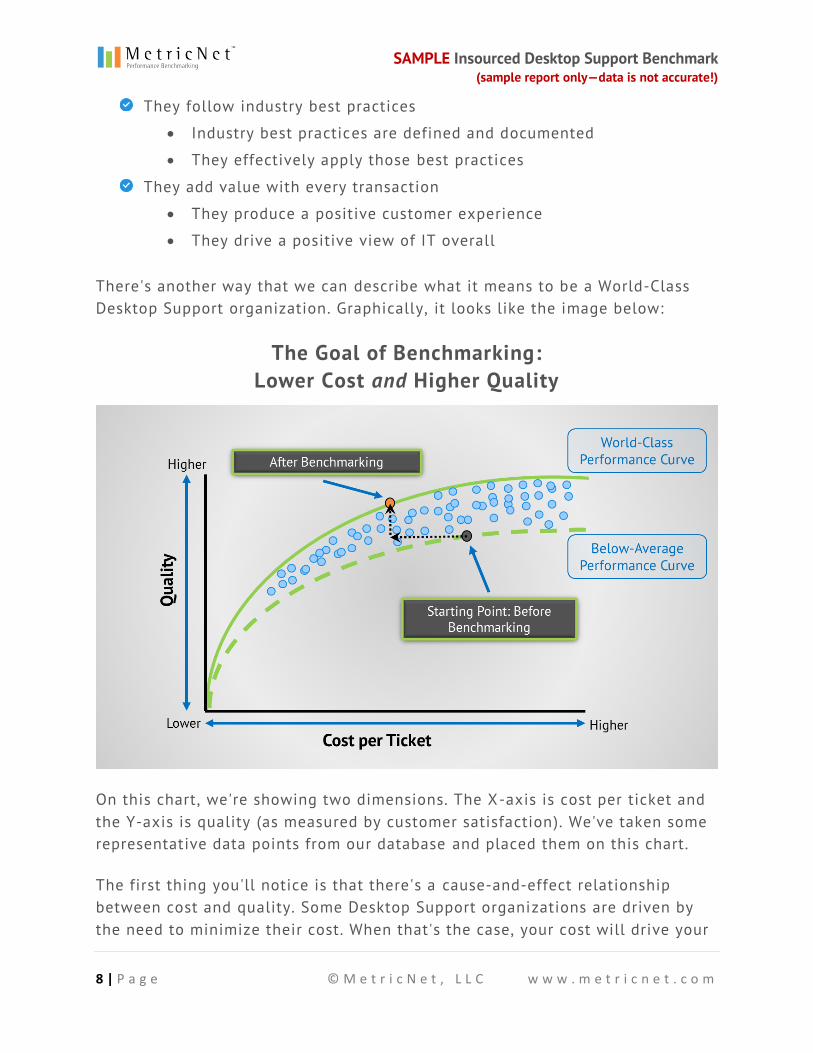
There's another way that we can describe what it means to be a World-Class Desktop Support organization. Graphically, it looks like the image below:
The Goal of Benchmarking: Lower Cost and Higher Quality
On this chart, we're showing two dimensions. The X-axis is cost per ticket and the Y-axis is quality (as measured by customer satisfaction). We've taken some representative data points from our database and placed them on this chart.
The first thing you'll notice is that there's a cause-and-effect relationship between cost and quality. Some Desktop Support organizations are driven by the need to minimize their cost. When that's the case, your cost will drive your
SAMPLE Insourced Desktop Support Benchmark (sample report only—data is not accurate!)
9 | P a g e © M e t r i c N e t , L L C w w w . m e t r i c n e t . c o m
quality. Other Desktop Support organizations are driven by quality. In that case, your quality will drive your cost.
The second thing you'll notice is that it's a non-linear relationship—as quality increases, your cost will increase disproportionately. At some point, it probably doesn't make sense to pursue any further quality because quality is not free!
The point of this chart is to reinforce what it means to be World-Class. It means that you take the limited resources you have and deploy them in the most effective way. If you do that, you will land on the upper curve, the World-Class curve. If your Desktop Support organization performs below average, you'll be on the lower curve.
Being World-Class is a relative concept. It's not about hitting a particular target on any one metric. It is about deploying your resources as effectively as you possibly can.
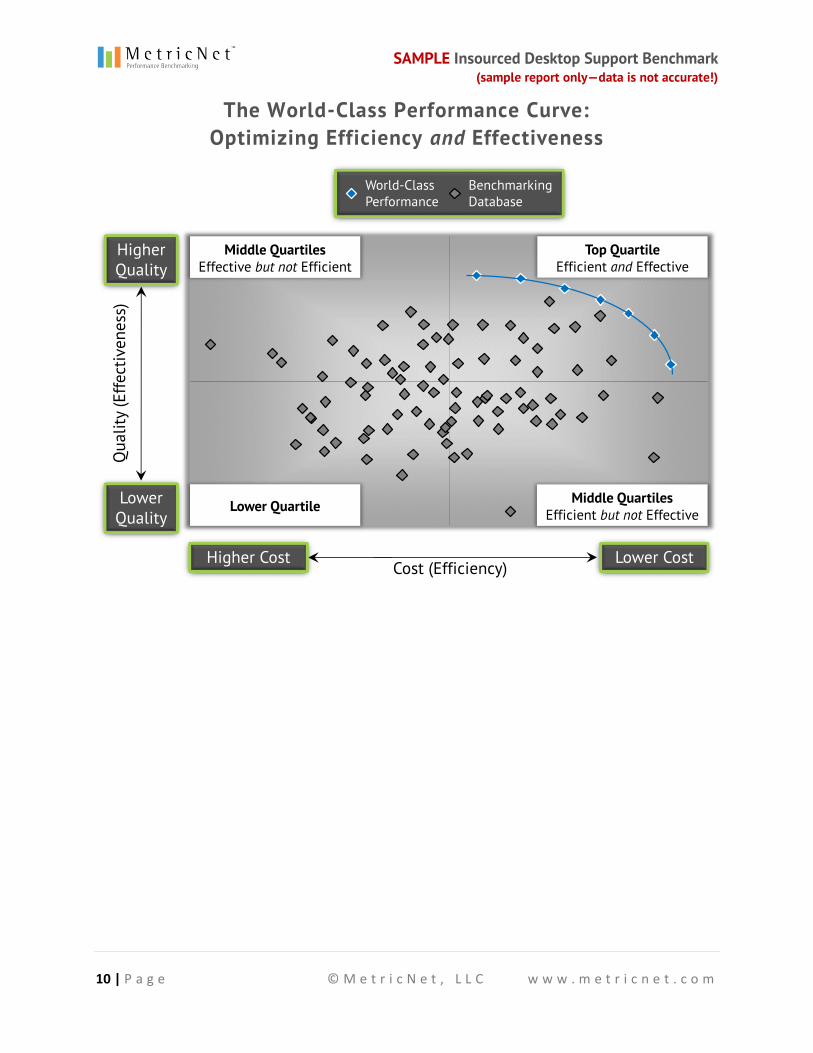
Cost vs. Quality for Desktop Support Organizations
Think about it this way. On the two-dimensional chart below, we again show cost per ticket on the X-axis (except that low cost is now on the right, instead of the left) and customer satisfaction (quality) on the Y-axis. Where you want to be is on the upper-right World-Class Performance curve shown by the blue diamonds.
The blue diamonds represent those Desktop Support organizations that have optimized their performance. As you can see in the chart , some of them have optimized at a very low cost and a slightly above-average customer-satisfaction level. Others have optimized at a slightly better-than-average cost and a very high customer-satisfaction level. The goal is to be in the upper-right-hand quadrant where you are both efficient (low cost) and effective (high quality).
SAMPLE Insourced Desktop Support Benchmark (sample report only—data is not accurate!)
10 | P a g e © M e t r i c N e t , L L C w w w . m e t r i c n e t . c o m
The World-Class Performance Curve: Optimizing Efficiency and Effectiveness
World-ClassPerformance
BenchmarkingDatabase
Lower CostCost (Efficiency)
Higher Cost
Qua
lity
(Effe
ctiv
enes
s)
Lower Quality
Higher Quality
Top QuartileEfficient and Effective
Lower Quartile
Middle QuartilesEffective but not Efficient
Middle QuartilesEfficient but not Effective

SAMPLE Insourced Desktop Support Benchmark (sample report only—data is not accurate!)
11 | P a g e © M e t r i c N e t , L L C w w w . m e t r i c n e t . c o m
HOW TO USE THIS BENCHMARK
REPORT
SAMPLE Insourced Desktop Support Benchmark (sample report only—data is not accurate!)
12 | P a g e © M e t r i c N e t , L L C w w w . m e t r i c n e t . c o m
How to Use this Benchmark Report
Here is the four-step benchmarking process to improve your Desktop Support organization ’s performance with this report:
Step 1: Collect your organization’s performance data.
Thorough, accurate data collection is the cornerstone of successful benchmarking. This is also the most time-consuming step in benchmarking. But you need accurate data in order to identify the performance gaps in your own organization.
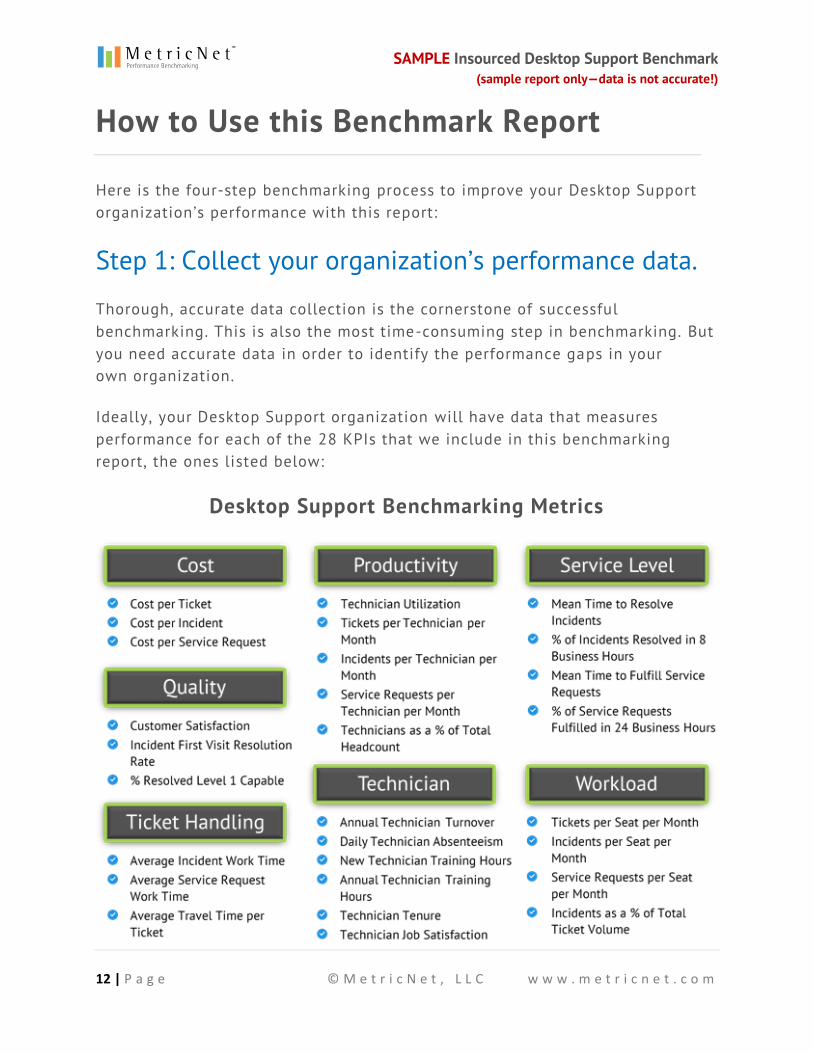
Ideally, your Desktop Support organization will have data that measures performance for each of the 28 KPIs that we include in this benchmarking report, the ones listed below:
Desktop Support Benchmarking Metrics
SAMPLE Insourced Desktop Support Benchmark (sample report only—data is not accurate!)
13 | P a g e © M e t r i c N e t , L L C w w w . m e t r i c n e t . c o m
If your Desktop Support organization does not yet measure all 28 KPIs, you can still benefit from benchmarking the KPIs for which you do have data. At a minimum, you’ll want to benchmark eight of the most important metrics, the ones we use in our Desktop Support Scorecard (see page 24 below), or some similar substitutes. And for the KPIs that you haven’t begun measuring, you can still use this report to establish performance goals based on the benchmarking data from other Desktop Support organizations (see Step 3).
We have defined each KPI in the Detailed Benchmarking Data section below (starting at page 36). You can refer to these definitions as you collect your data to ensure an apples-to-apples benchmarking comparison in Step 2.
You may also find it helpful to review your collected data with other key personnel who understand your Desktop Support organization ’s operations. They can often provide context for the data and spot potential anomalies or inaccuracies.
Step 2: Compare your performance to others.
We provide several methods to compare your performance data with industry peers. The four primary methods are these:
1) A Benchmarking KPI Performance Summary (page 18), which lists the
industry peer group’s average , minimum, median, and maximum
performance levels for each KPI.
2) Quartile Rankings (page 20), so you can map which quartile your Desktop
Support organization performs in for each KPI.
3) A Desktop Support Scorecard (page 24), which provides a more holistic,
balanced measure of your Desktop Support organization ’s overall
performance compared to the industry peer group.
4) Detailed Benchmarking Data (starting on page 36), which shows bar
charts of the performance level for each Desktop Support organization in
the peer group, for each individual KPI.
SAMPLE Insourced Desktop Support Benchmark (sample report only—data is not accurate!)
14 | P a g e © M e t r i c N e t , L L C w w w . m e t r i c n e t . c o m
Step 3: Develop strategies for improved performance.
Without an action plan to improve performance, benchmarking is a pointless exercise. Ironically, this is one of the simplest steps in the benchmarking process, but it adds the most value.
The true potential of measuring and benchmarking your KPIs can be unlocked only when you use them to diagnose and understand the underlying drivers of your Desktop Support organization ’s performance. Then you can use that diagnosis to strategically adopt the specific industry best practi ces that will boost your organization to World-Class Performance.
The key to using KPIs diagnostically is to understand their cause-and-effect relationships. You can think of these relationships as a linkage where all of the KPIs are interconnected. When one KPI moves up or down, other KPIs move with it. Understanding this linkage is enormously powerful because it shows you the levers you can pull to increase performance.
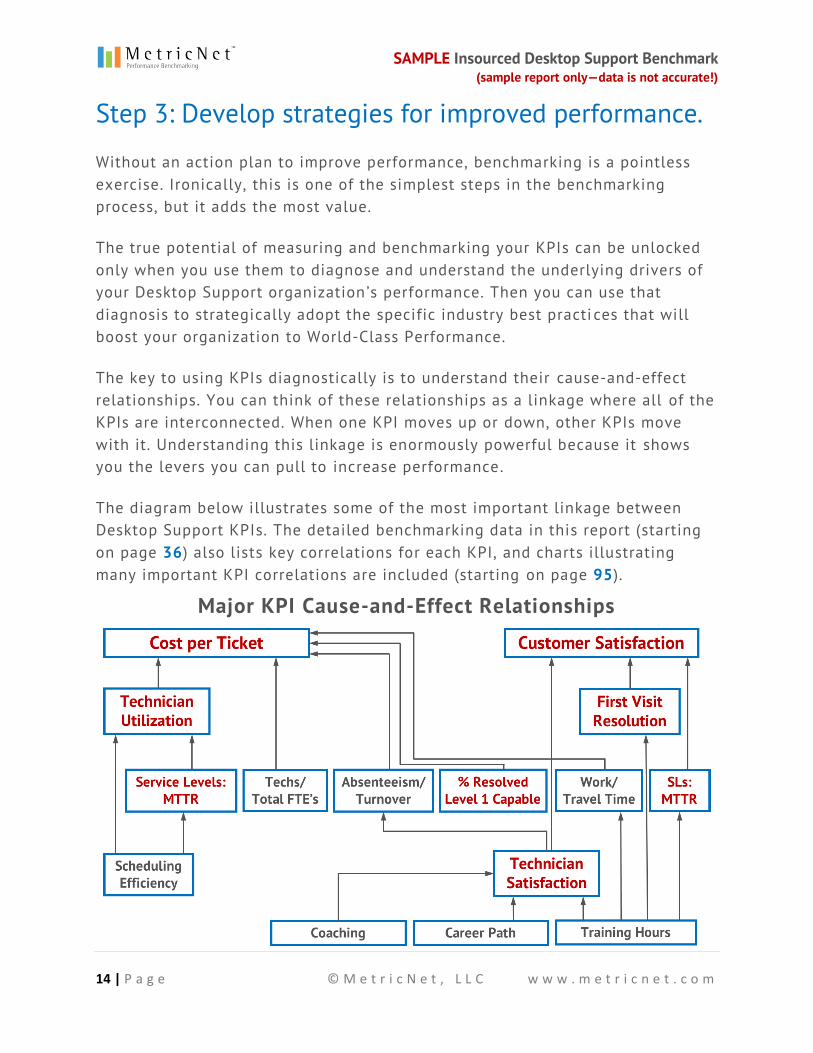
The diagram below illustrates some of the most important linkage between Desktop Support KPIs. The detailed benchmarking data in this report (starting on page 36) also lists key correlations for each KPI, and charts illustrating many important KPI correlations are included (starting on page 95).
Major KPI Cause-and-Effect Relationships
SAMPLE Insourced Desktop Support Benchmark (sample report only—data is not accurate!)
15 | P a g e © M e t r i c N e t , L L C w w w . m e t r i c n e t . c o m
We call Cost per Ticket and Customer Satisfaction the foundation metrics. Nearly everything a Desktop Support organization does can be viewed through the lens of cost and quality. Will this new technology reduce my costs? Will this new process improve customer satisfaction? This insight is crucial because it greatly simplifies decision-making for your Desktop Support organization. Any practice that does not have the long-term effect of improving customer satisfaction, reducing costs, or both, is simply not worth doing.
The foundation metrics, however, cannot be directly controlled. Instead, they are controlled by other KPIs, the ones we call under lying drivers. As you can see from the diagram above, some top examples of underlying drivers are Technician Utilization, First Visit Resolution Rate, and Technician Job Satisfaction. These underlying drivers directly impact the foundation metrics —any improvement on the driver metrics will cause corresponding improvements in cost, quality, or both.
By understanding the underlying drivers for cost and quality, you can use your benchmarked KPIs diagnostically. If your Customer Satisfaction is low, for example, simply isolate the primary underlying drivers of Customer Satisfaction on which your performance was low compared to the benchmark. Then map out an action plan to improve your performance for those crucial metrics.
To help choose the specific steps in your action plan, identify the industry best practices that will improve your performance for the crucial metrics that you isolated. MetricNet has identified nearly 80 industry best practices for Desktop Support organizations.
You should also set specific performance targets, both for individual technicians and for the Desktop Support organization overall. To ensure that you are improving holistically, and not just fixating on some of your weakest metrics, emphasize performance targets for your organization ’s balanced score (see page 24).
Step 4: Implement, and monitor results.
Once you’ve identified your strategies for improved performance, you are in a position to implement your action plan. This is where the payoff comes, so don’t neglect this step!
SAMPLE Insourced Desktop Support Benchmark (sample report only—data is not accurate!)
16 | P a g e © M e t r i c N e t , L L C w w w . m e t r i c n e t . c o m
As you implement your action plan, regularly monitor your performance for changes. One of the easiest and best ways of monitoring is to update your Desktop Support scorecard (see page 24) every month or every quarter, and trend the changes in your score over time.
If you have implemented your action plan but over time your performance does not improve as expected, return to Step 3. Reevaluate which strategies have worked, which have not, and whether you should attack different or additional drivers of your performance gaps.
Do you want your Desktop Support organization to achieve continuous improvement? Consider repeating this four-step benchmarking process periodically with the most up-to-date benchmarking data from industry peers, so you can build and maintain your competitive advantage .

SAMPLE Insourced Desktop Support Benchmark (sample report only—data is not accurate!)
17 | P a g e © M e t r i c N e t , L L C w w w . m e t r i c n e t . c o m
KPI STATISTICS: SUMMARY AND
QUARTILES
SAMPLE Insourced Desktop Support Benchmark (sample report only—data is not accurate!)
18 | P a g e © M e t r i c N e t , L L C w w w . m e t r i c n e t . c o m
KPI Statistics: Summary and Quartiles
Benchmarking Performance Summary
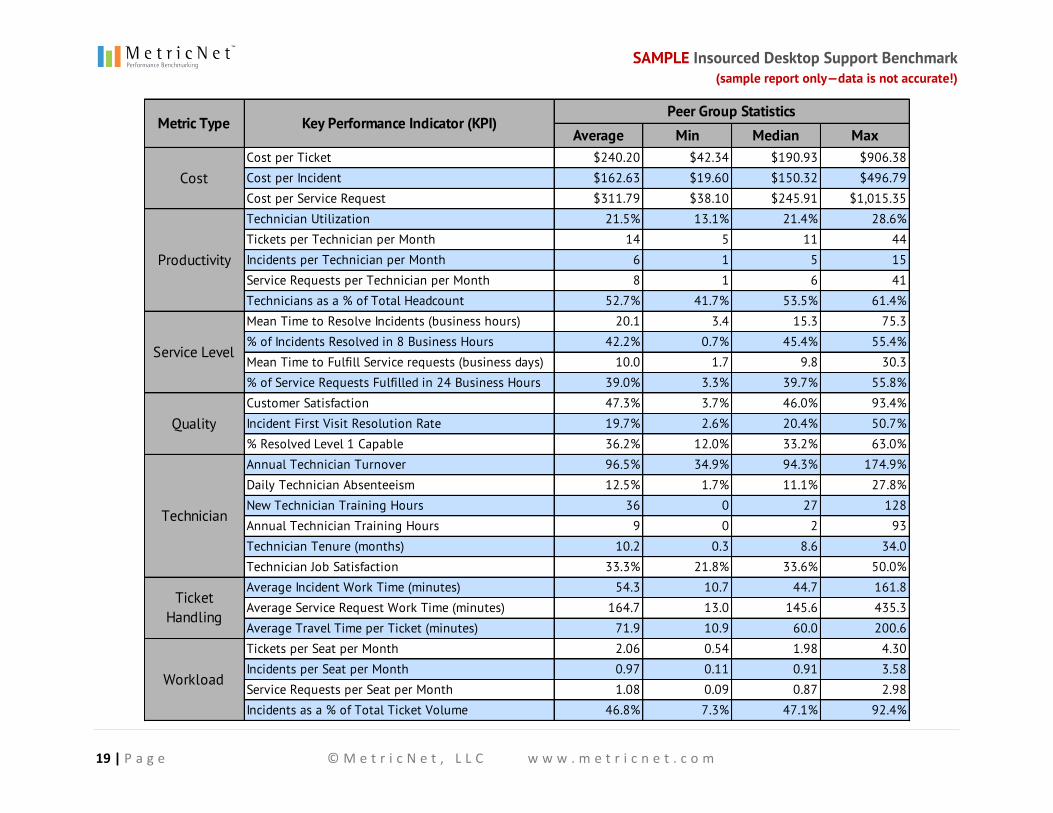
The table on the next page summarizes this report’s benchmarking data. It shows the benchmarking peer group’s average, minimum, median, and maximum performance levels for each Key Performance Indicator (KPI).
On the left of the table you see the seven categories of metrics, followed by 28 KPIs that you can use to benchmark your Desktop Support organization. To compare your Desktop Support organization ’s performance with that of this peer group, simply copy the table into a spreadsheet and add a column with your data for each KPI that you measure.
It’s important to look at this data holistically. No single metric comes even close to telling the whole story. For example , if your cost is high, that's not necessarily a bad thing—particularly if it comes with good quality and service levels. By contrast, if your cost is low, that may not be a good thing if it comes with low Customer Satisfaction, low First Visit Resolution Rate, and the like.
SAMPLE Insourced Desktop Support Benchmark (sample report only—data is not accurate!)
19 | P a g e © M e t r i c N e t , L L C w w w . m e t r i c n e t . c o m
Average Min Median MaxCost per Ticket $240.20 $42.34 $190.93 $906.38Cost per Incident $162.63 $19.60 $150.32 $496.79Cost per Service Request $311.79 $38.10 $245.91 $1,015.35Technician Utilization 21.5% 13.1% 21.4% 28.6%Tickets per Technician per Month 14 5 11 44Incidents per Technician per Month 6 1 5 15Service Requests per Technician per Month 8 1 6 41Technicians as a % of Total Headcount 52.7% 41.7% 53.5% 61.4%Mean Time to Resolve Incidents (business hours) 20.1 3.4 15.3 75.3% of Incidents Resolved in 8 Business Hours 42.2% 0.7% 45.4% 55.4%Mean Time to Fulfill Service requests (business days) 10.0 1.7 9.8 30.3% of Service Requests Fulfilled in 24 Business Hours 39.0% 3.3% 39.7% 55.8%Customer Satisfaction 47.3% 3.7% 46.0% 93.4%Incident First Visit Resolution Rate 19.7% 2.6% 20.4% 50.7%% Resolved Level 1 Capable 36.2% 12.0% 33.2% 63.0%Annual Technician Turnover 96.5% 34.9% 94.3% 174.9%Daily Technician Absenteeism 12.5% 1.7% 11.1% 27.8%New Technician Training Hours 36 0 27 128Annual Technician Training Hours 9 0 2 93Technician Tenure (months) 10.2 0.3 8.6 34.0Technician Job Satisfaction 33.3% 21.8% 33.6% 50.0%Average Incident Work Time (minutes) 54.3 10.7 44.7 161.8Average Service Request Work Time (minutes) 164.7 13.0 145.6 435.3Average Travel Time per Ticket (minutes) 71.9 10.9 60.0 200.6Tickets per Seat per Month 2.06 0.54 1.98 4.30Incidents per Seat per Month 0.97 0.11 0.91 3.58Service Requests per Seat per Month 1.08 0.09 0.87 2.98Incidents as a % of Total Ticket Volume 46.8% 7.3% 47.1% 92.4%
Metric Type Key Performance Indicator (KPI)Peer Group Statistics
Cost
Productivity
Service Level
Technician
Ticket Handling
Workload
Quality
SAMPLE Insourced Desktop Support Benchmark (sample report only—data is not accurate!)
20 | P a g e © M e t r i c N e t , L L C w w w . m e t r i c n e t . c o m
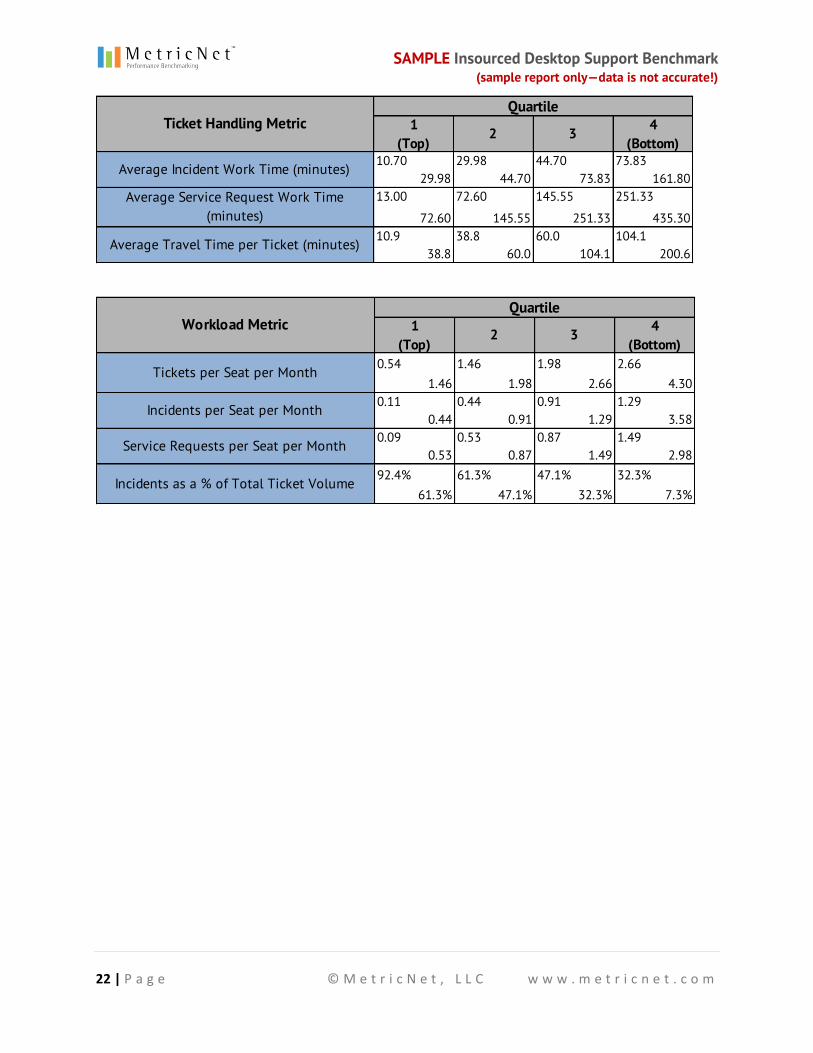
Quartile Rankings for Each KPI
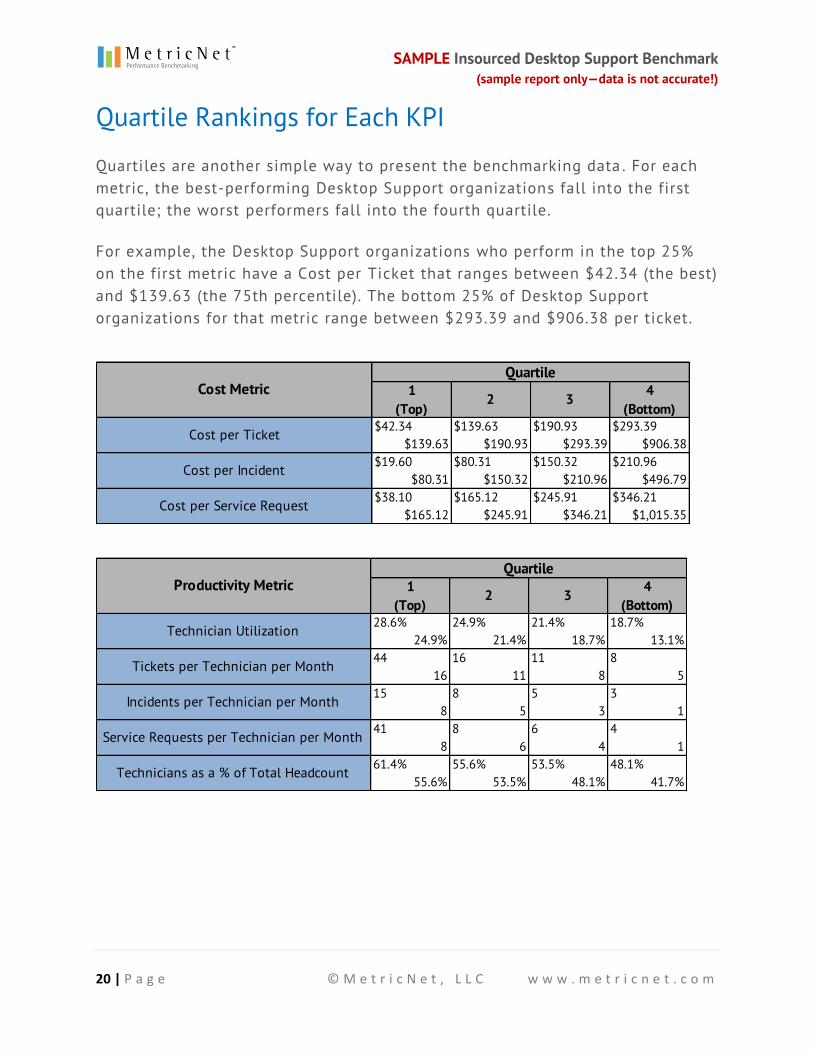
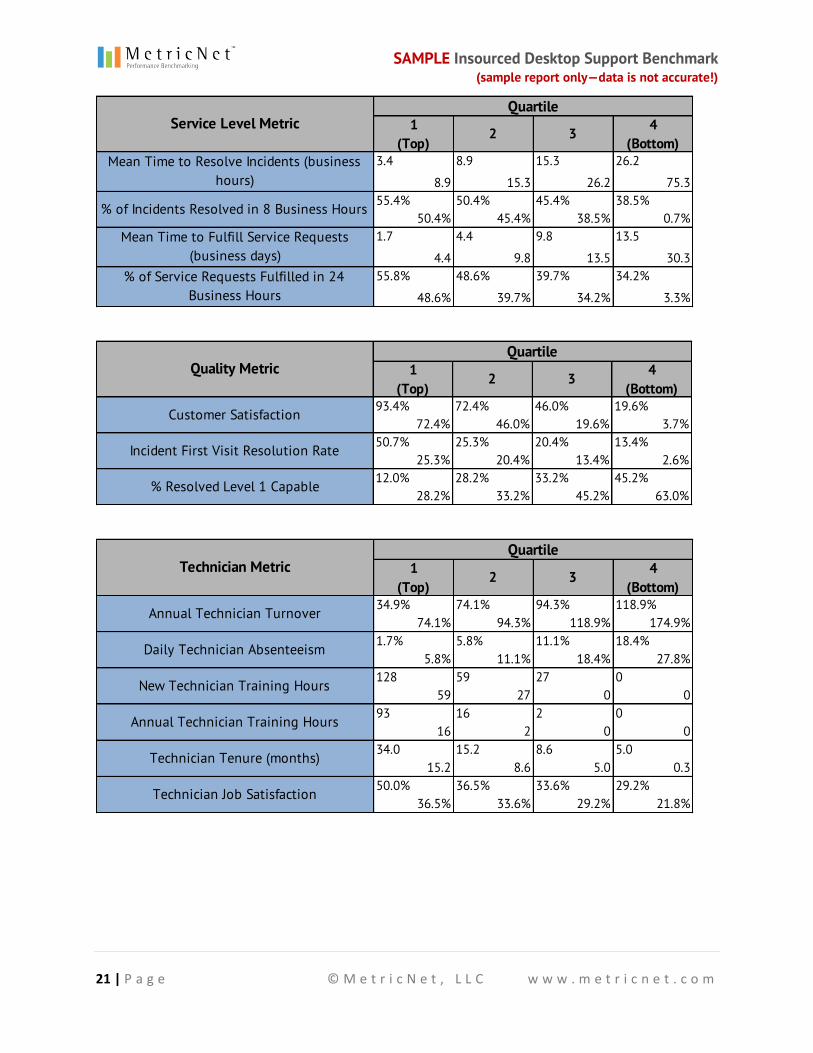
Quartiles are another simple way to present the benchmarking data . For each metric, the best-performing Desktop Support organizations fall into the first quartile; the worst performers fall into the fourth quartile.
For example, the Desktop Support organizations who perform in the top 25% on the first metric have a Cost per Ticket that ranges between $42.34 (the best) and $139.63 (the 75th percentile). The bottom 25% of Desktop Support organizations for that metric range between $293.39 and $906.38 per ticket.
Cost MetricQuartile
1(Top)
2 3 4(Bottom)
$139.63 $190.93 $293.39 $906.38Cost per Ticket $42.34 $139.63 $190.93 $293.39
$210.96$496.79
Cost per Incident $19.60 $80.31 $150.32
Cost per Service Request $38.10 $165.12 $245.91$80.31 $150.32 $210.96
$165.12 $245.91 $346.21 $1,015.35$346.21
Technician Utilization 28.6% 24.9% 21.4% 18.7%
Productivity MetricQuartile
1 (Top)
2 3 4 (Bottom)
Tickets per Technician per Month 44 16 1124.9% 21.4% 18.7% 13.1%
16 11 8 58
3Incidents per Technician per Month 15 8 5
Service Requests per Technician per Month 41 8 68 5 3 1
8 6 4 14
Technicians as a % of Total Headcount 61.4% 55.6% 53.5% 48.1%55.6% 53.5% 48.1% 41.7%
SAMPLE Insourced Desktop Support Benchmark (sample report only—data is not accurate!)
21 | P a g e © M e t r i c N e t , L L C w w w . m e t r i c n e t . c o m
% of Service Requests Fulfilled in 24 Business Hours
55.8% 48.6% 39.7% 34.2%
48.6% 39.7% 34.2% 3.3%
Service Level MetricQuartile
1 (Top)
2 3 4 (Bottom)
8.9 15.3 26.2 75.3Mean Time to Resolve Incidents (business
hours)3.4 8.9 15.3 26.2
38.5%0.7%
% of Incidents Resolved in 8 Business Hours 55.4% 50.4% 45.4%
Mean Time to Fulfill Service Requests (business days)
1.7 4.4 9.850.4% 45.4% 38.5%
4.4 9.8 13.5 30.3
13.5
Quality MetricQuartile
1 (Top)
2 3 4 (Bottom)
72.4% 46.0% 19.6% 3.7%Customer Satisfaction 93.4% 72.4% 46.0% 19.6%
13.4%2.6%
Incident First Visit Resolution Rate 50.7% 25.3% 20.4%
% Resolved Level 1 Capable 12.0% 28.2% 33.2%25.3% 20.4% 13.4%
28.2% 33.2% 45.2% 63.0%45.2%
Quartile1
(Top)2 3 4
(Bottom)
Annual Technician Turnover 34.9% 74.1% 94.3% 118.9%74.1% 94.3% 118.9% 174.9%
Technician Metric
5.8% 11.1% 18.4% 27.8%18.4%Daily Technician Absenteeism 1.7% 5.8% 11.1%
59 27 0 00128 59 27
16 2 0 0093 16
Technician Job Satisfaction 50.0% 36.5% 33.6%
New Technician Training Hours
Annual Technician Training Hours 2
Technician Tenure (months) 34.0 15.2 8.615.2 8.6 5.0 0.3
5.0
36.5% 33.6% 29.2% 21.8%29.2%
SAMPLE Insourced Desktop Support Benchmark (sample report only—data is not accurate!)
22 | P a g e © M e t r i c N e t , L L C w w w . m e t r i c n e t . c o m
Ticket Handling MetricQuartile
1 (Top)
2 3 4 (Bottom)
Average Incident Work Time (minutes) 10.70 29.98 44.70 73.8329.98 44.70 73.83 161.80
104.1200.6
435.30
251.33
Average Travel Time per Ticket (minutes) 10.9 38.8 60.0
Average Service Request Work Time (minutes)
13.00 72.60 145.55
38.8 60.0 104.1
72.60 145.55 251.33
61.3% 47.1% 32.3% 7.3%Incidents as a % of Total Ticket Volume 92.4% 61.3% 47.1% 32.3%
0.53 0.87 1.49 2.98Service Requests per Seat per Month 0.09 0.53 0.87 1.49
1.46 1.98 2.66 4.30
Incidents per Seat per Month 0.11 0.44 0.91 1.290.44 0.91 1.29 3.58
Tickets per Seat per Month 0.54 1.46 1.98 2.66
Workload MetricQuartile
1 (Top)
2 3 4 (Bottom)

SAMPLE Insourced Desktop Support Benchmark (sample report only—data is not accurate!)
23 | P a g e © M e t r i c N e t , L L C w w w . m e t r i c n e t . c o m
BENCHMARKING SCORECARD AND
RANKINGS
SAMPLE Insourced Desktop Support Benchmark (sample report only—data is not accurate!)
24 | P a g e © M e t r i c N e t , L L C w w w . m e t r i c n e t . c o m
Benchmarking Scorecard and Rankings
The Desktop Support Scorecard: An Overview
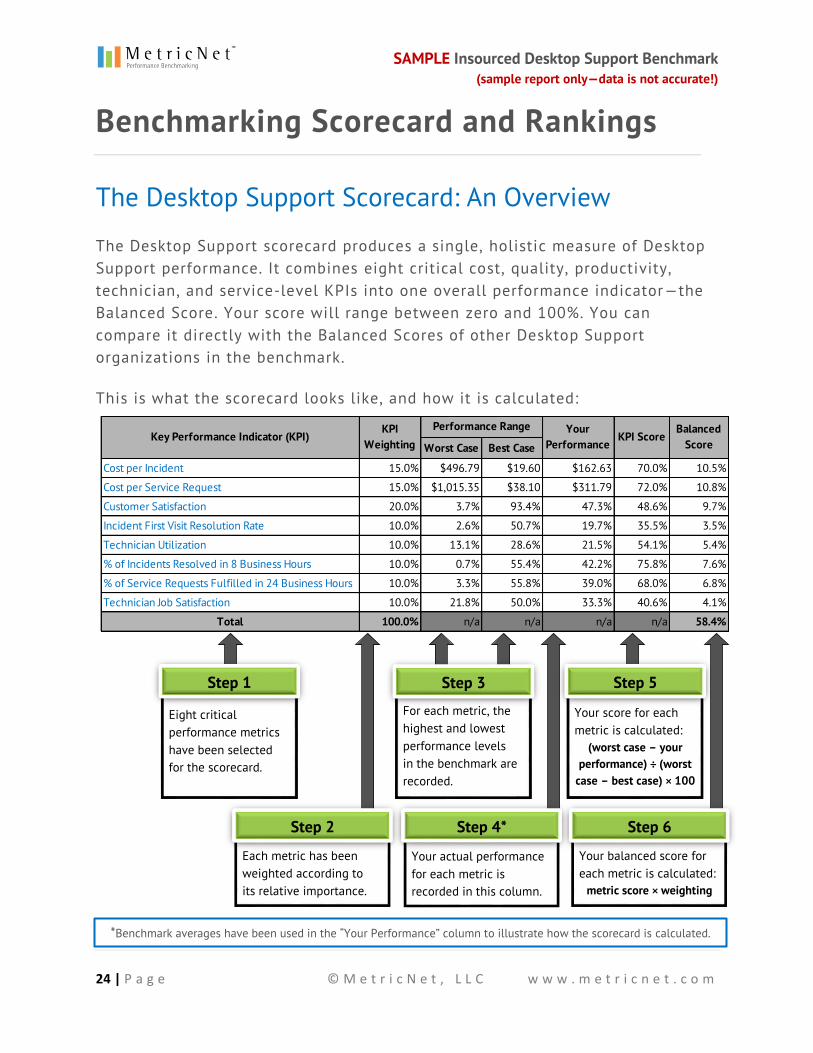
The Desktop Support scorecard produces a single, holistic measure of Desktop Support performance. It combines eight critical cost, quality, productivity, technician, and service-level KPIs into one overall performance indicator—the Balanced Score. Your score will range between zero and 100%. You can compare it directly with the Balanced Scores of other Desktop Support organizations in the benchmark.
This is what the scorecard looks like, and how it is calculated:
Worst Case Best Case
Cost per Incident 15.0% $496.79 $19.60 $162.63 70.0% 10.5%
Cost per Service Request 15.0% $1,015.35 $38.10 $311.79 72.0% 10.8%
Customer Satisfaction 20.0% 3.7% 93.4% 47.3% 48.6% 9.7%
Incident First Visit Resolution Rate 10.0% 2.6% 50.7% 19.7% 35.5% 3.5%
Technician Utilization 10.0% 13.1% 28.6% 21.5% 54.1% 5.4%
% of Incidents Resolved in 8 Business Hours 10.0% 0.7% 55.4% 42.2% 75.8% 7.6%
% of Service Requests Fulfilled in 24 Business Hours 10.0% 3.3% 55.8% 39.0% 68.0% 6.8%
Technician Job Satisfaction 10.0% 21.8% 50.0% 33.3% 40.6% 4.1%
Total 100.0% n/a n/a n/a n/a 58.4%
Balanced Score
Key Performance Indicator (KPI)KPI
WeightingPerformance Range Your
PerformanceKPI Score
*Benchmark averages have been used in the “Your Performance” column to illustrate how the scorecard is calculated.
Eight critical performance metrics have been selected for the scorecard.
Step 1
Each metric has been weighted according to its relative importance.
Step 2
For each metric, the highest and lowest performance levels in the benchmark are recorded.
Step 3
Your actual performance for each metric is recorded in this column.
Step 4*
Your balanced score for each metric is calculated:
metric score × weighting
Step 6
Your score for each metric is calculated:
(worst case – your performance) ÷ (worst
case – best case) × 100
Step 5
SAMPLE Insourced Desktop Support Benchmark (sample report only—data is not accurate!)
25 | P a g e © M e t r i c N e t , L L C w w w . m e t r i c n e t . c o m
The eight KPIs we selected for the scorecard are the metrics that are of highest importance for most Desktop Support organizations:
Cost per Incident (a component of Cost per Ticket, which is one of the
two foundation metrics)
Cost per Service Request (the other component of cost)
Customer Satisfaction (the second foundation metric)
Incident First Visit Resolution Rate (the primary driver of Customer
Satisfaction)
Technician Utilization (the primary driver of cost)
% of Incidents Resolved in 8 Business Hours (a key service-level metric)
% of Service Requests Fulfilled in 24 Business Hours (another key
service-level metric)
Technician Job Satisfaction (a key secondary driver of both cost and
quality)
The weighting percentage we assigned to each KPI is based on that KPI’s relative importance in the scorecard. For example, you can see that we gave the greatest weight to the two cost metrics and to Customer Satisfaction, since those are the foundation metrics.
A Desktop Support organization ’s Balanced Score will always range between 0% and 100%. If your performance is the worst on each of the eight KPIs, compared to the industry peer group for this benchmark report, your score will be 0%. If your performance is the best on each KPI, your score will be 100%.
When we run this algorithm for literally hundreds of Desktop Support organizations worldwide, the average Balanced Score is approximately 63%. If your score is above about 70%, you’re in the top quartile. Between about 64% and 70%, you're in the second quartile; between about 57% and 64%, in the third; and below 57%, in the bottom quarti le.
Tracking Your Balanced Score
By calculating your overall score for every month or every quarter , you can track and trend its performance over time. Charting and tracking your Balanced
SAMPLE Insourced Desktop Support Benchmark (sample report only—data is not accurate!)
26 | P a g e © M e t r i c N e t , L L C w w w . m e t r i c n e t . c o m
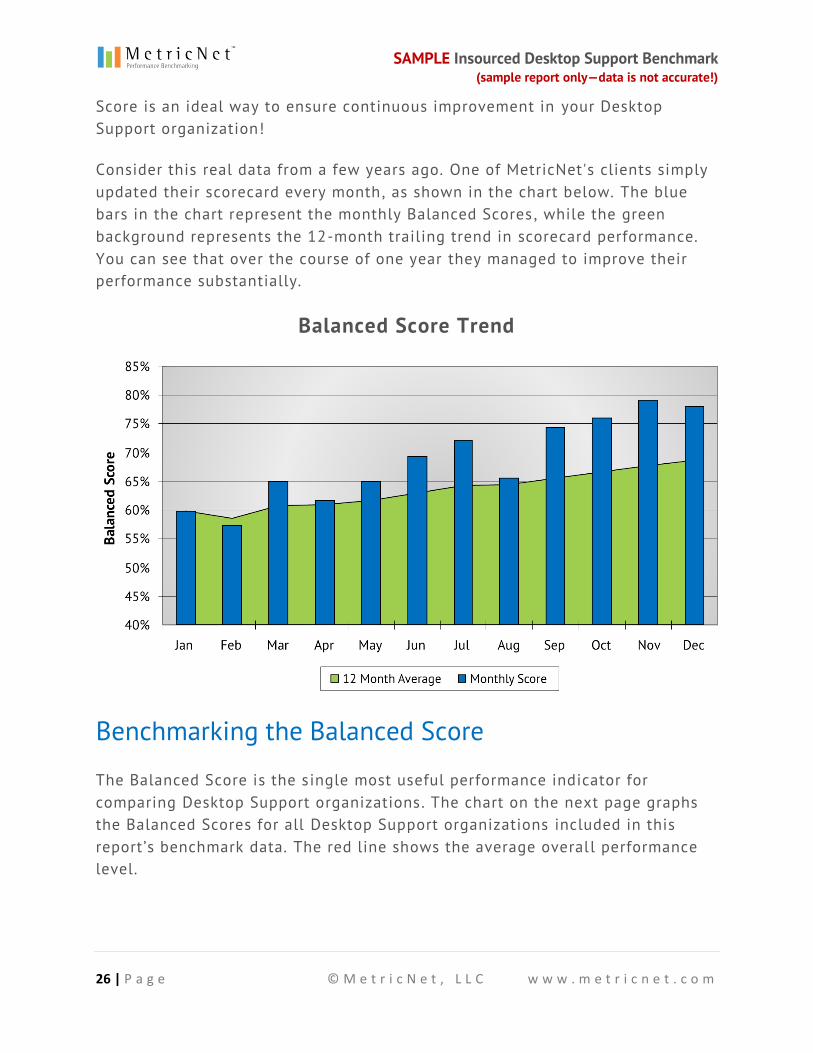
Score is an ideal way to ensure continuous improvement in your Desktop Support organization!
Consider this real data from a few years ago. One of MetricNet's clients simply updated their scorecard every month, as shown in the chart below. The blue bars in the chart represent the monthly Balanced Scores , while the green background represents the 12-month trailing trend in scorecard performance. You can see that over the course of one year they managed to improve their performance substantially.
Balanced Score Trend
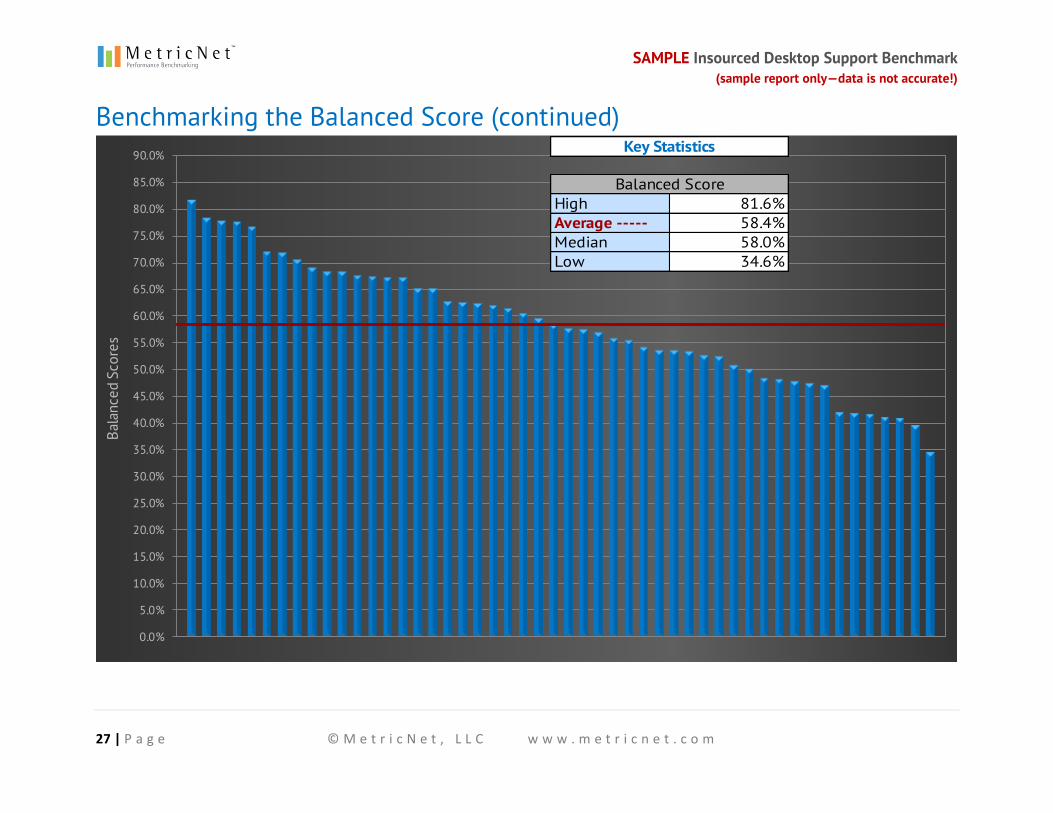
Benchmarking the Balanced Score
The Balanced Score is the single most useful performance indicator for comparing Desktop Support organizations. The chart on the next page graphs the Balanced Scores for all Desktop Support organizations included in this report’s benchmark data. The red line shows the average overall performance level.
SAMPLE Insourced Desktop Support Benchmark (sample report only—data is not accurate!)
27 | P a g e © M e t r i c N e t , L L C w w w . m e t r i c n e t . c o m
Benchmarking the Balanced Score (continued)
0.0%
5.0%
10.0%
15.0%
20.0%
25.0%
30.0%
35.0%
40.0%
45.0%
50.0%
55.0%
60.0%
65.0%
70.0%
75.0%
80.0%
85.0%
90.0%
Bala
nced
Sco
res
High 81.6%Average ----- 58.4%Median 58.0%Low 34.6%
Key Statistics
Balanced Score
SAMPLE Insourced Desktop Support Benchmark (sample report only—data is not accurate!)
28 | P a g e © M e t r i c N e t , L L C w w w . m e t r i c n e t . c o m
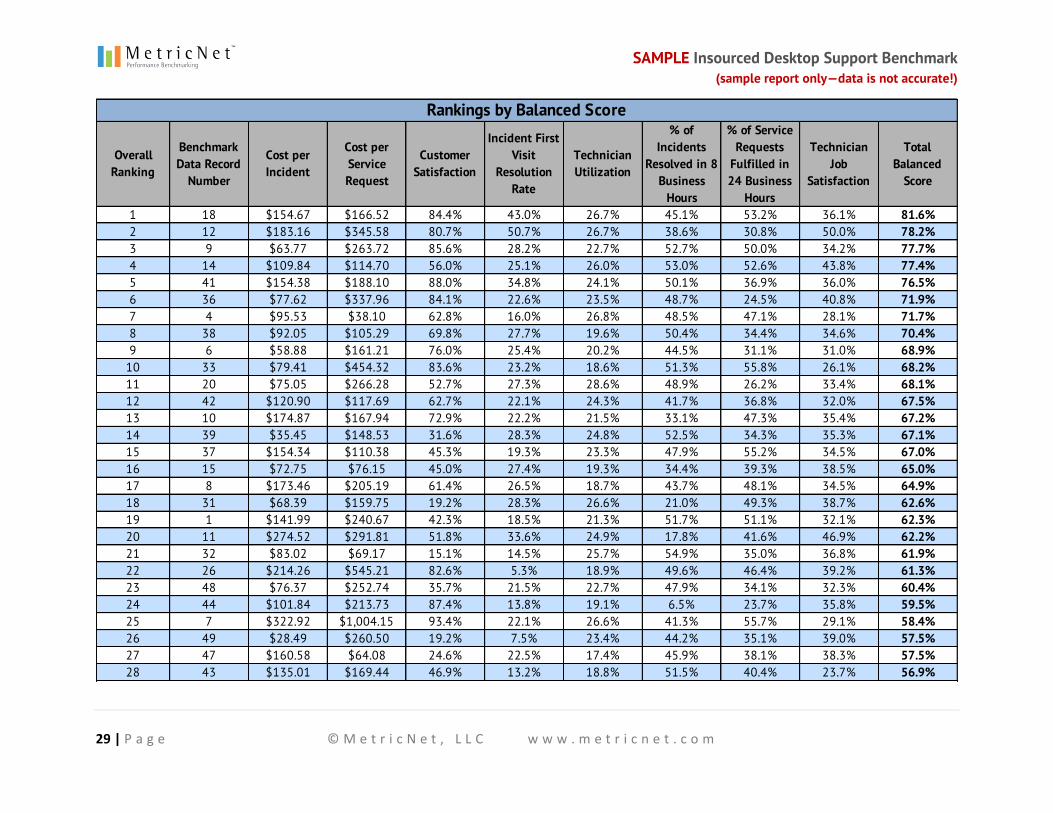
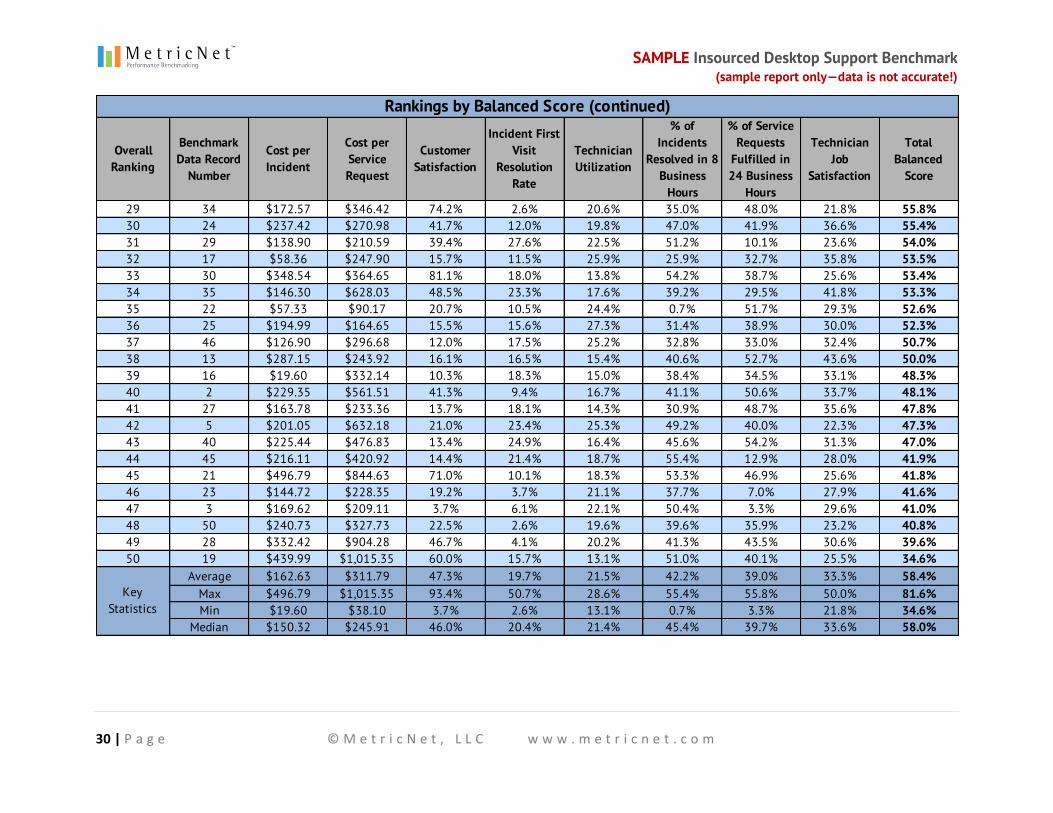
Benchmarking the Balanced Score (continued)
The next two pages list the Balanced Score for each Desktop Support organization in the benchmark. They also list each organization ’s performance for each of the eight KPIs used to calculate the Balanced Score. The data records are listed in rank order, from the best Balanced Score (record #18) to the worst (record #19). If you want to see what any other Desktop Support organization ’s score looks like compared to yours, you can use this list .
SAMPLE Insourced Desktop Support Benchmark (sample report only—data is not accurate!)
29 | P a g e © M e t r i c N e t , L L C w w w . m e t r i c n e t . c o m
Overall Ranking
Benchmark Data Record
Number
Cost per Incident
Cost per Service Request
Customer Satisfaction
Incident First Visit
Resolution Rate
Technician Utilization
% of Incidents
Resolved in 8 Business
Hours
% of Service Requests
Fulfilled in 24 Business
Hours
Technician Job
Satisfaction
Total Balanced
Score
1 18 $154.67 $166.52 84.4% 43.0% 26.7% 45.1% 53.2% 36.1% 81.6%2 12 $183.16 $345.58 80.7% 50.7% 26.7% 38.6% 30.8% 50.0% 78.2%3 9 $63.77 $263.72 85.6% 28.2% 22.7% 52.7% 50.0% 34.2% 77.7%4 14 $109.84 $114.70 56.0% 25.1% 26.0% 53.0% 52.6% 43.8% 77.4%5 41 $154.38 $188.10 88.0% 34.8% 24.1% 50.1% 36.9% 36.0% 76.5%6 36 $77.62 $337.96 84.1% 22.6% 23.5% 48.7% 24.5% 40.8% 71.9%7 4 $95.53 $38.10 62.8% 16.0% 26.8% 48.5% 47.1% 28.1% 71.7%8 38 $92.05 $105.29 69.8% 27.7% 19.6% 50.4% 34.4% 34.6% 70.4%9 6 $58.88 $161.21 76.0% 25.4% 20.2% 44.5% 31.1% 31.0% 68.9%
10 33 $79.41 $454.32 83.6% 23.2% 18.6% 51.3% 55.8% 26.1% 68.2%11 20 $75.05 $266.28 52.7% 27.3% 28.6% 48.9% 26.2% 33.4% 68.1%12 42 $120.90 $117.69 62.7% 22.1% 24.3% 41.7% 36.8% 32.0% 67.5%13 10 $174.87 $167.94 72.9% 22.2% 21.5% 33.1% 47.3% 35.4% 67.2%14 39 $35.45 $148.53 31.6% 28.3% 24.8% 52.5% 34.3% 35.3% 67.1%15 37 $154.34 $110.38 45.3% 19.3% 23.3% 47.9% 55.2% 34.5% 67.0%16 15 $72.75 $76.15 45.0% 27.4% 19.3% 34.4% 39.3% 38.5% 65.0%17 8 $173.46 $205.19 61.4% 26.5% 18.7% 43.7% 48.1% 34.5% 64.9%18 31 $68.39 $159.75 19.2% 28.3% 26.6% 21.0% 49.3% 38.7% 62.6%19 1 $141.99 $240.67 42.3% 18.5% 21.3% 51.7% 51.1% 32.1% 62.3%20 11 $274.52 $291.81 51.8% 33.6% 24.9% 17.8% 41.6% 46.9% 62.2%21 32 $83.02 $69.17 15.1% 14.5% 25.7% 54.9% 35.0% 36.8% 61.9%22 26 $214.26 $545.21 82.6% 5.3% 18.9% 49.6% 46.4% 39.2% 61.3%23 48 $76.37 $252.74 35.7% 21.5% 22.7% 47.9% 34.1% 32.3% 60.4%24 44 $101.84 $213.73 87.4% 13.8% 19.1% 6.5% 23.7% 35.8% 59.5%25 7 $322.92 $1,004.15 93.4% 22.1% 26.6% 41.3% 55.7% 29.1% 58.4%26 49 $28.49 $260.50 19.2% 7.5% 23.4% 44.2% 35.1% 39.0% 57.5%27 47 $160.58 $64.08 24.6% 22.5% 17.4% 45.9% 38.1% 38.3% 57.5%28 43 $135.01 $169.44 46.9% 13.2% 18.8% 51.5% 40.4% 23.7% 56.9%
Rankings by Balanced Score
SAMPLE Insourced Desktop Support Benchmark (sample report only—data is not accurate!)
30 | P a g e © M e t r i c N e t , L L C w w w . m e t r i c n e t . c o m
Overall Ranking
Benchmark Data Record
Number
Cost per Incident
Cost per Service Request
Customer Satisfaction
Incident First Visit
Resolution Rate
Technician Utilization
% of Incidents
Resolved in 8 Business
Hours
% of Service Requests
Fulfilled in 24 Business
Hours
Technician Job
Satisfaction
Total Balanced
Score
29 34 $172.57 $346.42 74.2% 2.6% 20.6% 35.0% 48.0% 21.8% 55.8%30 24 $237.42 $270.98 41.7% 12.0% 19.8% 47.0% 41.9% 36.6% 55.4%31 29 $138.90 $210.59 39.4% 27.6% 22.5% 51.2% 10.1% 23.6% 54.0%32 17 $58.36 $247.90 15.7% 11.5% 25.9% 25.9% 32.7% 35.8% 53.5%33 30 $348.54 $364.65 81.1% 18.0% 13.8% 54.2% 38.7% 25.6% 53.4%34 35 $146.30 $628.03 48.5% 23.3% 17.6% 39.2% 29.5% 41.8% 53.3%35 22 $57.33 $90.17 20.7% 10.5% 24.4% 0.7% 51.7% 29.3% 52.6%36 25 $194.99 $164.65 15.5% 15.6% 27.3% 31.4% 38.9% 30.0% 52.3%37 46 $126.90 $296.68 12.0% 17.5% 25.2% 32.8% 33.0% 32.4% 50.7%38 13 $287.15 $243.92 16.1% 16.5% 15.4% 40.6% 52.7% 43.6% 50.0%39 16 $19.60 $332.14 10.3% 18.3% 15.0% 38.4% 34.5% 33.1% 48.3%40 2 $229.35 $561.51 41.3% 9.4% 16.7% 41.1% 50.6% 33.7% 48.1%41 27 $163.78 $233.36 13.7% 18.1% 14.3% 30.9% 48.7% 35.6% 47.8%42 5 $201.05 $632.18 21.0% 23.4% 25.3% 49.2% 40.0% 22.3% 47.3%43 40 $225.44 $476.83 13.4% 24.9% 16.4% 45.6% 54.2% 31.3% 47.0%44 45 $216.11 $420.92 14.4% 21.4% 18.7% 55.4% 12.9% 28.0% 41.9%45 21 $496.79 $844.63 71.0% 10.1% 18.3% 53.3% 46.9% 25.6% 41.8%46 23 $144.72 $228.35 19.2% 3.7% 21.1% 37.7% 7.0% 27.9% 41.6%47 3 $169.62 $209.11 3.7% 6.1% 22.1% 50.4% 3.3% 29.6% 41.0%48 50 $240.73 $327.73 22.5% 2.6% 19.6% 39.6% 35.9% 23.2% 40.8%49 28 $332.42 $904.28 46.7% 4.1% 20.2% 41.3% 43.5% 30.6% 39.6%50 19 $439.99 $1,015.35 60.0% 15.7% 13.1% 51.0% 40.1% 25.5% 34.6%
Average $162.63 $311.79 47.3% 19.7% 21.5% 42.2% 39.0% 33.3% 58.4%Max $496.79 $1,015.35 93.4% 50.7% 28.6% 55.4% 55.8% 50.0% 81.6%Min $19.60 $38.10 3.7% 2.6% 13.1% 0.7% 3.3% 21.8% 34.6%
Median $150.32 $245.91 46.0% 20.4% 21.4% 45.4% 39.7% 33.6% 58.0%
Key Statistics
Rankings by Balanced Score (continued)
SAMPLE Insourced Desktop Support Benchmark (sample report only—data is not accurate!)
31 | P a g e © M e t r i c N e t , L L C w w w . m e t r i c n e t . c o m
Benchmarking the Balanced Score (continued)
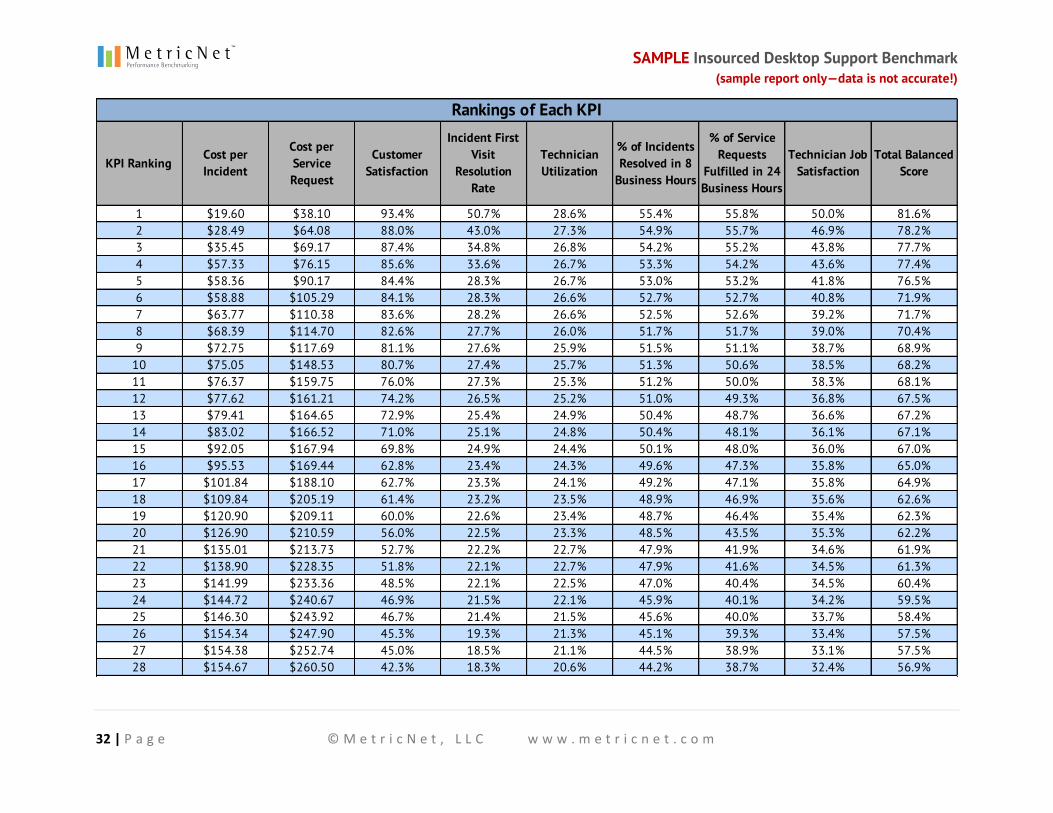
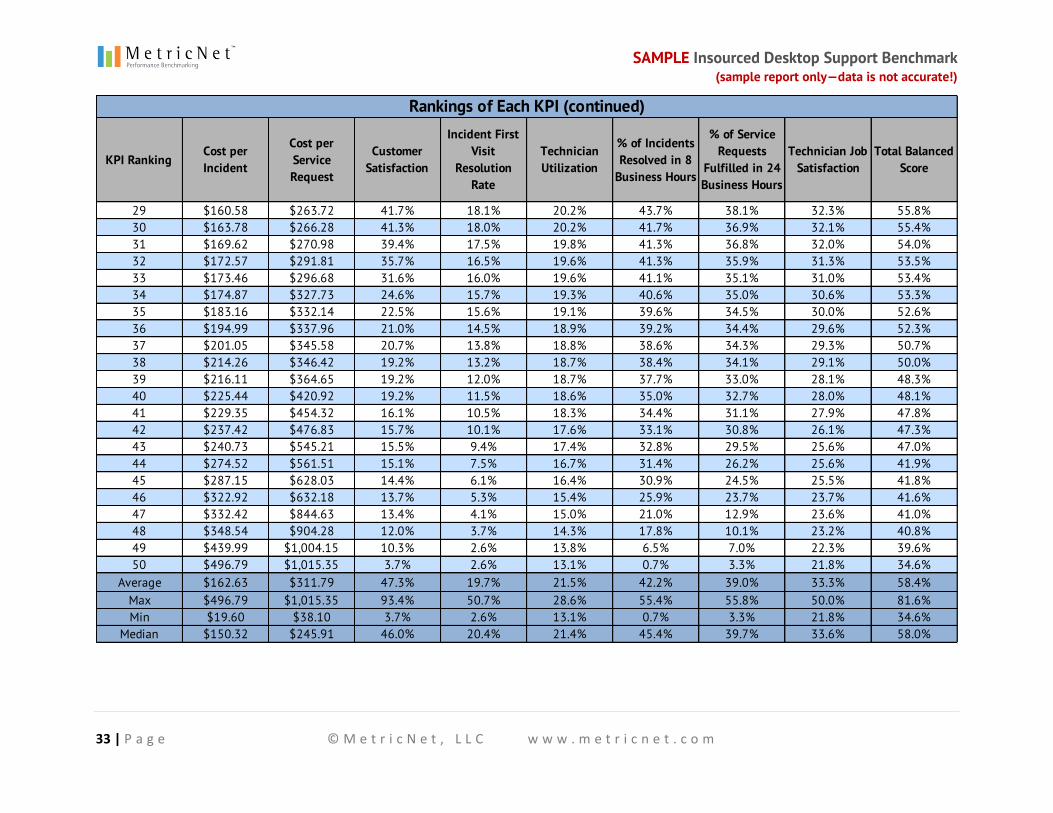
The next two pages show the rankings for each KPI in the scorecard. The column for each KPI has the performance levels listed in rank order, from best (top row) to worst (bottom row). This is the same data you saw in the previous list. But in this list it is not tied together by individual organizations ’ data records. Instead, each KPI is ranked on its own. This allows you to look at your performance for any given metric on the scorecard and see how you stack up against other in-house/insourced Desktop Support organizations in your geographical region.
SAMPLE Insourced Desktop Support Benchmark (sample report only—data is not accurate!)
32 | P a g e © M e t r i c N e t , L L C w w w . m e t r i c n e t . c o m
KPI RankingCost per Incident
Cost per Service Request
Customer Satisfaction
Incident First Visit
Resolution Rate
Technician Utilization
% of Incidents Resolved in 8
Business Hours
% of Service Requests
Fulfilled in 24 Business Hours
Technician Job Satisfaction
Total Balanced Score
1 $19.60 $38.10 93.4% 50.7% 28.6% 55.4% 55.8% 50.0% 81.6%2 $28.49 $64.08 88.0% 43.0% 27.3% 54.9% 55.7% 46.9% 78.2%3 $35.45 $69.17 87.4% 34.8% 26.8% 54.2% 55.2% 43.8% 77.7%4 $57.33 $76.15 85.6% 33.6% 26.7% 53.3% 54.2% 43.6% 77.4%5 $58.36 $90.17 84.4% 28.3% 26.7% 53.0% 53.2% 41.8% 76.5%6 $58.88 $105.29 84.1% 28.3% 26.6% 52.7% 52.7% 40.8% 71.9%7 $63.77 $110.38 83.6% 28.2% 26.6% 52.5% 52.6% 39.2% 71.7%8 $68.39 $114.70 82.6% 27.7% 26.0% 51.7% 51.7% 39.0% 70.4%9 $72.75 $117.69 81.1% 27.6% 25.9% 51.5% 51.1% 38.7% 68.9%
10 $75.05 $148.53 80.7% 27.4% 25.7% 51.3% 50.6% 38.5% 68.2%11 $76.37 $159.75 76.0% 27.3% 25.3% 51.2% 50.0% 38.3% 68.1%12 $77.62 $161.21 74.2% 26.5% 25.2% 51.0% 49.3% 36.8% 67.5%13 $79.41 $164.65 72.9% 25.4% 24.9% 50.4% 48.7% 36.6% 67.2%14 $83.02 $166.52 71.0% 25.1% 24.8% 50.4% 48.1% 36.1% 67.1%15 $92.05 $167.94 69.8% 24.9% 24.4% 50.1% 48.0% 36.0% 67.0%16 $95.53 $169.44 62.8% 23.4% 24.3% 49.6% 47.3% 35.8% 65.0%17 $101.84 $188.10 62.7% 23.3% 24.1% 49.2% 47.1% 35.8% 64.9%18 $109.84 $205.19 61.4% 23.2% 23.5% 48.9% 46.9% 35.6% 62.6%19 $120.90 $209.11 60.0% 22.6% 23.4% 48.7% 46.4% 35.4% 62.3%20 $126.90 $210.59 56.0% 22.5% 23.3% 48.5% 43.5% 35.3% 62.2%21 $135.01 $213.73 52.7% 22.2% 22.7% 47.9% 41.9% 34.6% 61.9%22 $138.90 $228.35 51.8% 22.1% 22.7% 47.9% 41.6% 34.5% 61.3%23 $141.99 $233.36 48.5% 22.1% 22.5% 47.0% 40.4% 34.5% 60.4%24 $144.72 $240.67 46.9% 21.5% 22.1% 45.9% 40.1% 34.2% 59.5%25 $146.30 $243.92 46.7% 21.4% 21.5% 45.6% 40.0% 33.7% 58.4%26 $154.34 $247.90 45.3% 19.3% 21.3% 45.1% 39.3% 33.4% 57.5%27 $154.38 $252.74 45.0% 18.5% 21.1% 44.5% 38.9% 33.1% 57.5%28 $154.67 $260.50 42.3% 18.3% 20.6% 44.2% 38.7% 32.4% 56.9%
Rankings of Each KPI
SAMPLE Insourced Desktop Support Benchmark (sample report only—data is not accurate!)
33 | P a g e © M e t r i c N e t , L L C w w w . m e t r i c n e t . c o m
KPI RankingCost per Incident
Cost per Service Request
Customer Satisfaction
Incident First Visit
Resolution Rate
Technician Utilization
% of Incidents Resolved in 8
Business Hours
% of Service Requests
Fulfilled in 24 Business Hours
Technician Job Satisfaction
Total Balanced Score
29 $160.58 $263.72 41.7% 18.1% 20.2% 43.7% 38.1% 32.3% 55.8%30 $163.78 $266.28 41.3% 18.0% 20.2% 41.7% 36.9% 32.1% 55.4%31 $169.62 $270.98 39.4% 17.5% 19.8% 41.3% 36.8% 32.0% 54.0%32 $172.57 $291.81 35.7% 16.5% 19.6% 41.3% 35.9% 31.3% 53.5%33 $173.46 $296.68 31.6% 16.0% 19.6% 41.1% 35.1% 31.0% 53.4%34 $174.87 $327.73 24.6% 15.7% 19.3% 40.6% 35.0% 30.6% 53.3%35 $183.16 $332.14 22.5% 15.6% 19.1% 39.6% 34.5% 30.0% 52.6%36 $194.99 $337.96 21.0% 14.5% 18.9% 39.2% 34.4% 29.6% 52.3%37 $201.05 $345.58 20.7% 13.8% 18.8% 38.6% 34.3% 29.3% 50.7%38 $214.26 $346.42 19.2% 13.2% 18.7% 38.4% 34.1% 29.1% 50.0%39 $216.11 $364.65 19.2% 12.0% 18.7% 37.7% 33.0% 28.1% 48.3%40 $225.44 $420.92 19.2% 11.5% 18.6% 35.0% 32.7% 28.0% 48.1%41 $229.35 $454.32 16.1% 10.5% 18.3% 34.4% 31.1% 27.9% 47.8%42 $237.42 $476.83 15.7% 10.1% 17.6% 33.1% 30.8% 26.1% 47.3%43 $240.73 $545.21 15.5% 9.4% 17.4% 32.8% 29.5% 25.6% 47.0%44 $274.52 $561.51 15.1% 7.5% 16.7% 31.4% 26.2% 25.6% 41.9%45 $287.15 $628.03 14.4% 6.1% 16.4% 30.9% 24.5% 25.5% 41.8%46 $322.92 $632.18 13.7% 5.3% 15.4% 25.9% 23.7% 23.7% 41.6%47 $332.42 $844.63 13.4% 4.1% 15.0% 21.0% 12.9% 23.6% 41.0%48 $348.54 $904.28 12.0% 3.7% 14.3% 17.8% 10.1% 23.2% 40.8%49 $439.99 $1,004.15 10.3% 2.6% 13.8% 6.5% 7.0% 22.3% 39.6%50 $496.79 $1,015.35 3.7% 2.6% 13.1% 0.7% 3.3% 21.8% 34.6%
Average $162.63 $311.79 47.3% 19.7% 21.5% 42.2% 39.0% 33.3% 58.4%Max $496.79 $1,015.35 93.4% 50.7% 28.6% 55.4% 55.8% 50.0% 81.6%Min $19.60 $38.10 3.7% 2.6% 13.1% 0.7% 3.3% 21.8% 34.6%
Median $150.32 $245.91 46.0% 20.4% 21.4% 45.4% 39.7% 33.6% 58.0%
Rankings of Each KPI (continued)
SAMPLE Insourced Desktop Support Benchmark (sample report only—data is not accurate!)
34 | P a g e © M e t r i c N e t , L L C w w w . m e t r i c n e t . c o m
Benchmarking the Balanced Score (continued)
For a graphical benchmark of each individual metric in the scorecard, see the following section of this report. It contains charts for all 28 KPIs, including the eight scorecard KPIs. The red line in each chart represents the average performance within the benchmark peer group, for you to compare against your own organization’s performance. You can jump to the charts for the eight scorecard KPIs using these links (each of those charts has links above it that you can use to return to this page or to jump to the next scorecard-KPI chart):
Cost per Incident
Cost per Service Request
Customer Satisfaction
Incident First Visit Resolution Rate
Technician Utilization
% of Incidents Resolved in 8 Business Hours
% of Service Requests Fulfi lled in 24 Business Hours
Technician Job Satisfaction
We always organize these charts from left to right so that good performance is on the left and bad performance is on the right. In some cases, such as cost, you'll notice an ascending distribution because lower numbers are better. In other cases, such as customer satisfaction, you will see a descending distribution because higher numbers are better.

SAMPLE Insourced Desktop Support Benchmark (sample report only—data is not accurate!)
35 | P a g e © M e t r i c N e t , L L C w w w . m e t r i c n e t . c o m
DETAILED BENCHMARKING
DATA
SAMPLE Insourced Desktop Support Benchmark (sample report only—data is not accurate!)
36 | P a g e © M e t r i c N e t , L L C w w w . m e t r i c n e t . c o m
Detailed Benchmarking Data
Cost Metrics
Cost per Ticket
Definition: Cost per Ticket is the total annual operating expense of Desktop Support divided by the annual number of tickets handled by Desktop Support. Operating expense includes all employee salaries, overtime pay, benefits, and incentive compensation, plus all contractor, facilities, telecom, desktop computing, software licensing, training, travel, office suppli es, and miscellaneous expenses.
Why it’s important: Cost per Ticket is one of the most important Desktop Support metrics. It is a measure of how efficiently your organization conducts its business. A higher-than-average Cost per Ticket is not necessarily a bad thing, particularly if accompanied by higher-than-average quality levels. Conversely, a low Cost per Ticket is not necessarily good, particularly if low cost is achieved by sacrificing quality or service levels. Every Desktop Support organization should track and trend Cost per Ticket on a monthly basis.
Key correlations: Cost per Ticket is strongly correlated with the following metrics:
Cost per Incident
Cost per Service Request
Technician Utilization
Incident First Visit Resolution Rate
Average Incident Work Time
Average Service Request Work Time
Average Travel Time per Ticket
𝑪𝒐𝒔𝒕 𝒑𝒆𝒓 𝑻𝒊𝒄𝒌𝒆𝒕 =𝑻𝒐𝒕𝒂𝒍 𝑨𝒏𝒏𝒖𝒂𝒍 𝑶𝒑𝒆𝒓𝒂𝒕𝒊𝒏𝒈 𝑬𝒙𝒑𝒆𝒏𝒔𝒆
𝑨𝒏𝒏𝒖𝒂𝒍 𝑻𝒊𝒄𝒌𝒆𝒕 𝑽𝒐𝒍𝒖𝒎𝒆
SAMPLE Insourced Desktop Support Benchmark (sample report only—data is not accurate!)
37 | P a g e © M e t r i c N e t , L L C w w w . m e t r i c n e t . c o m
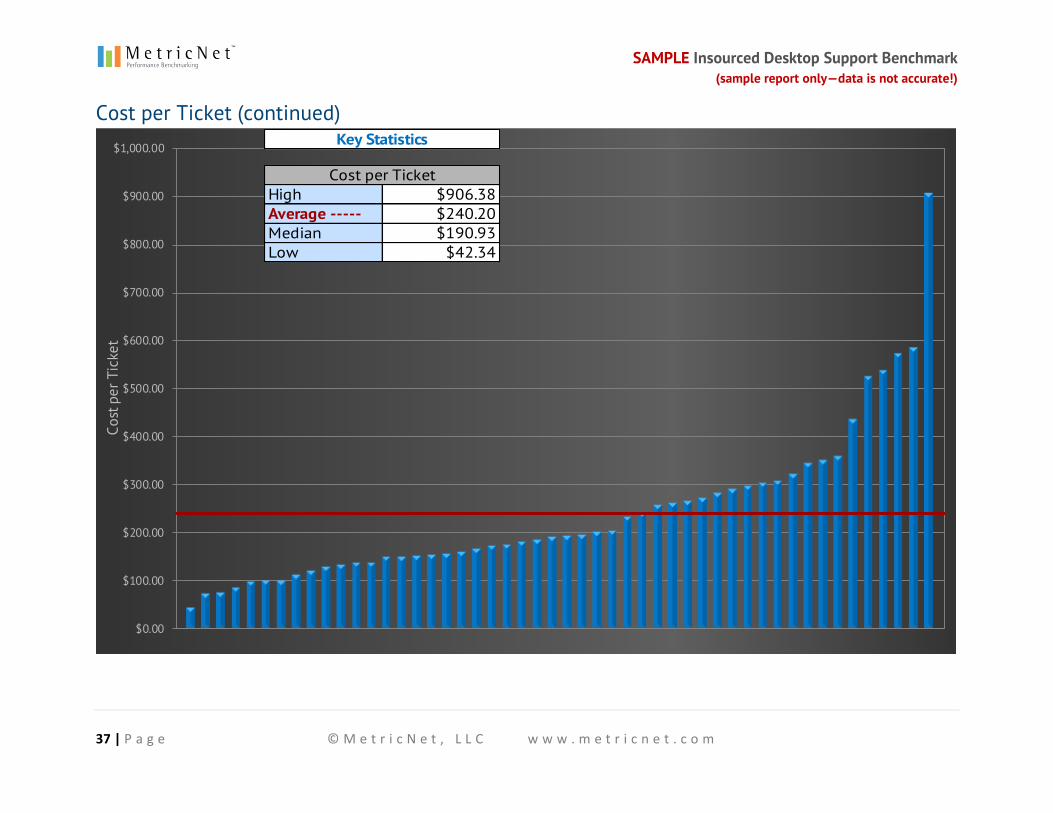
Cost per Ticket (continued)
$0.00
$100.00
$200.00
$300.00
$400.00
$500.00
$600.00
$700.00
$800.00
$900.00
$1,000.00
Cost
per
Tic
ket
High $906.38Average ----- $240.20Median $190.93Low $42.34
Key Statistics
Cost per Ticket
SAMPLE Insourced Desktop Support Benchmark (sample report only—data is not accurate!)
38 | P a g e © M e t r i c N e t , L L C w w w . m e t r i c n e t . c o m
Cost Metrics (continued)
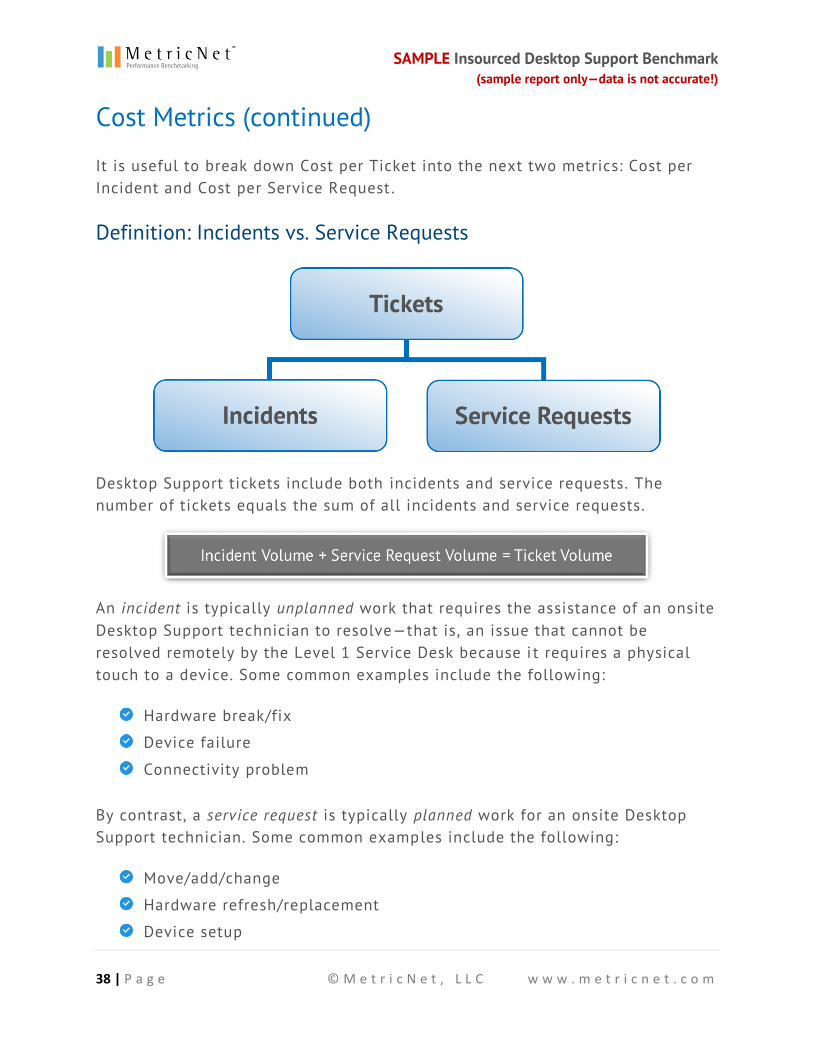
It is useful to break down Cost per Ticket into the next two metrics: Cost per Incident and Cost per Service Request .
Definition: Incidents vs. Service Requests
Desktop Support tickets include both incidents and service requests. The number of tickets equals the sum of all incidents and service requests.
An incident is typically unplanned work that requires the assistance of an onsite Desktop Support technician to resolve—that is, an issue that cannot be resolved remotely by the Level 1 Service Desk because i t requires a physical touch to a device. Some common examples include the following:
Hardware break/fix
Device failure
Connectivity problem
By contrast, a service request is typically planned work for an onsite Desktop Support technician. Some common examples include the following:
Move/add/change
Hardware refresh/replacement
Device setup
SAMPLE Insourced Desktop Support Benchmark (sample report only—data is not accurate!)
39 | P a g e © M e t r i c N e t , L L C w w w . m e t r i c n e t . c o m
Cost Metrics (continued)
Cost per Incident
Definition: Cost per Incident is the total annual operating expense of Desktop Support, multiplied by the incident workload as a percentage of total workload, then divided by the annual incident volume. Incident workload equals the annual incident volume multiplied by Average Incident Work Time (in other words, the total time spent handling incidents in a year). Likewise, t otal workload equals the annual ticket volume multiplied by the average ticket handle time. Operating expense includes all employee salaries, overtime pay, benefits, and incentive compensation, plus all contractor, facilities, telecom, desktop computing, software licensing, training, travel, office supplies, and miscellaneous expenses.
Why it’s Important: Cost per Incident is one of the most important Desktop Support metrics. It is one of the key components of Cost per Ticket (the other being Cost per Service Request). A higher-than-average Cost per Incident is not necessarily a bad thing, particularly if accompanied by higher -than-average quality levels. Conversely, a low Cost per Incident is not necessarily good, particularly if low cost is achieved by sacrificing quality or service levels. Every Desktop Support organization should track and trend Cost per Incident on a monthly basis.
Key correlations: Cost per Incident is strongly correlated with the following metrics:
Cost per Ticket
Cost per Service Request
Technician Utilization
Incident First Visit Resolution Rate
Average Incident Work Time
Average Travel Time per Ticket
Incidents as a % of Total Ticket Volume
𝑪𝒐𝒔𝒕 𝒑𝒆𝒓 𝑰𝒏𝒄𝒊𝒅𝒆𝒏𝒕 = 𝑶𝒑𝒆𝒓𝒂𝒕𝒊𝒏𝒈 𝑬𝒙𝒑𝒆𝒏𝒔𝒆×𝑰𝒏𝒄𝒊𝒅𝒆𝒏𝒕 𝑾𝒐𝒓𝒌𝒍𝒐𝒂𝒅
𝑻𝒐𝒕𝒂𝒍 𝑾𝒐𝒓𝒌𝒍𝒐𝒂𝒅÷ 𝑰𝒏𝒄𝒊𝒅𝒆𝒏𝒕 𝑽𝒐𝒍𝒖𝒎𝒆

SAMPLE Insourced Desktop Support Benchmark (sample report only—data is not accurate!)
40 | P a g e © M e t r i c N e t , L L C w w w . m e t r i c n e t . c o m
Cost per Incident (continued) return to page 34 | next scorecard KPI
$0.00
$50.00
$100.00
$150.00
$200.00
$250.00
$300.00
$350.00
$400.00
$450.00
$500.00
$550.00
Cost
per
Inci
dent
High $496.79Average ----- $162.63Median $150.32Low $19.60
Key Statistics
Cost per Incident
SAMPLE Insourced Desktop Support Benchmark (sample report only—data is not accurate!)
41 | P a g e © M e t r i c N e t , L L C w w w . m e t r i c n e t . c o m
Cost Metrics (continued)
Cost per Service Request
Definition : Cost per Service Request is the total annual operating expense of Desktop Support, multiplied by the service-request workload as a percentage of total workload, then divided by the annual service-request volume. Service-request workload equals the annual service-request volume multiplied by Average Service Request Work Time (in other words, the total time spent handling service requests in a year). Likewise, total workload equals the annual ticket volume multiplied by the average ticket handle time. Operating expense includes all employee salaries, overtime pay, benefits, and incentive compensation, plus all contractor, facilities, telecom, desktop computing, software licensing, training, travel, office supplies, and miscellaneous expenses.
Why it’s important: Cost per Service Request is one of the most important Desktop Support metrics. It is one of the key components of Cost per Ticket (the other being Cost per Incident). A higher-than-average Cost per Service Request is not necessarily a bad thing, particularly if accompanied by higher -than-average quality levels. Conversely, a low Cost per Service Request is not necessarily good, particularly if low cost is achieved by sacrificing quality or service levels. Every Desktop Support organization should track and trend Cost per Service Request on a monthly basis.
Key correlations: Cost per Service Request is strongly correlated with the following metrics:
Cost per Ticket
Cost per Incident
Technician Utilization
Average Service Request Work Time
Average Travel Time per Ticket
Incidents as a % of Total Ticket Volume
𝑪𝒐𝒔𝒕 𝒑𝒆𝒓 𝑺𝒗𝒄. 𝑹𝒆𝒒𝒖𝒆𝒔𝒕 = 𝑶𝒑𝒆𝒓𝒂𝒕𝒊𝒏𝒈 𝑬𝒙𝒑𝒆𝒏𝒔𝒆×𝑺𝒗𝒄. 𝑹𝒆𝒒𝒖𝒆𝒔𝒕 𝑾𝒐𝒓𝒌𝒍𝒐𝒂𝒅
𝑻𝒐𝒕𝒂𝒍 𝑾𝒐𝒓𝒌𝒍𝒐𝒂𝒅÷ 𝑺𝒗𝒄. 𝑹𝒆𝒒𝒖𝒆𝒔𝒕 𝑽𝒐𝒍𝒖𝒎𝒆
SAMPLE Insourced Desktop Support Benchmark (sample report only—data is not accurate!)
42 | P a g e © M e t r i c N e t , L L C w w w . m e t r i c n e t . c o m
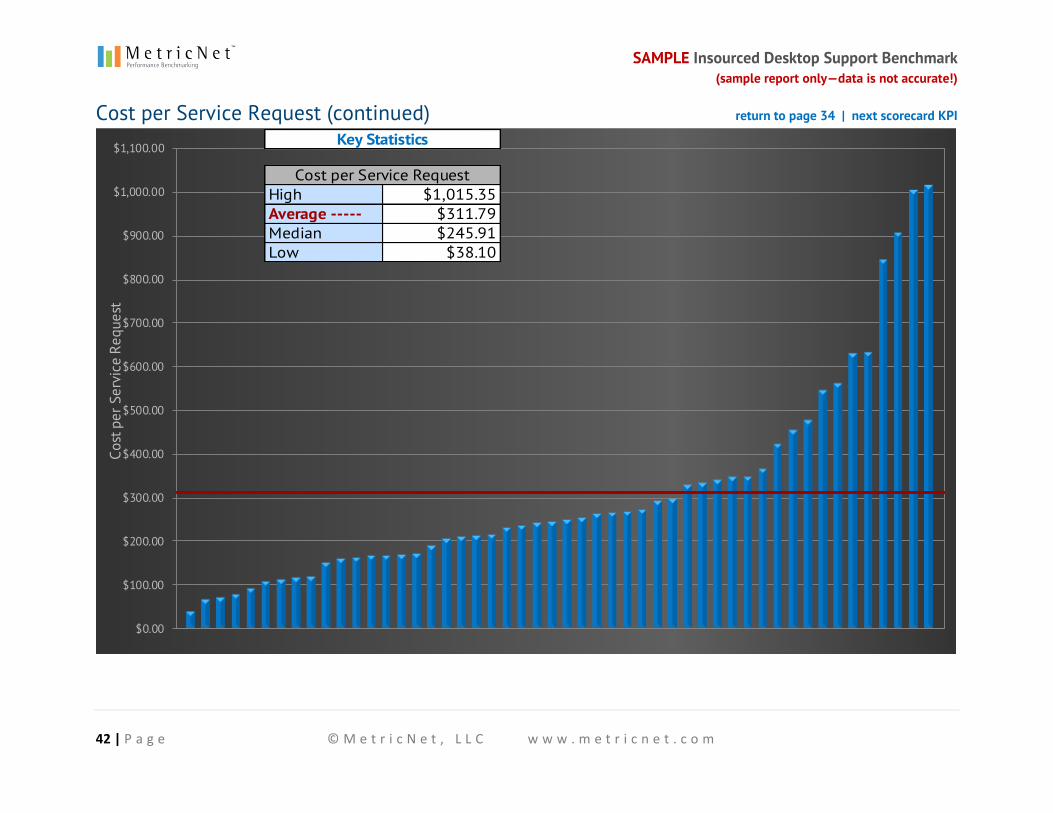
Cost per Service Request (continued) return to page 34 | next scorecard KPI
$0.00
$100.00
$200.00
$300.00
$400.00
$500.00
$600.00
$700.00
$800.00
$900.00
$1,000.00
$1,100.00
Cost
per
Ser
vice
Req
uest
High $1,015.35Average ----- $311.79Median $245.91Low $38.10
Key Statistics
Cost per Service Request
SAMPLE Insourced Desktop Support Benchmark (sample report only—data is not accurate!)
43 | P a g e © M e t r i c N e t , L L C w w w . m e t r i c n e t . c o m
Productivity Metrics
Technician Utilization
Definition: Technician Utilization is the average time that a technician spends handling both incidents and service requests per month, divided by the number of on-the-job hours in a given month. (See the more thorough definition on page 45.)
Why it’s important: Technician Utilization is the single most important indicator of technician productivity. It measures the percentage of time that the average technician is in “work mode,” and is independent of ticket work time or complexity.
Key correlations: Technician Utilization is strongly correlated with the following metrics:
Tickets per Technician per Month
Incidents per Technician per Month
Service Requests per Technician per Month
Cost per Ticket
Cost per Incident
Cost per Service Request
𝑻𝒆𝒄𝒉𝒏𝒊𝒄𝒊𝒂𝒏 𝑼𝒕𝒊𝒍𝒊𝒛𝒂𝒕𝒊𝒐𝒏 =𝑻𝒐𝒕𝒂𝒍 𝒕𝒊𝒄𝒌𝒆𝒕 𝒉𝒂𝒏𝒅𝒍𝒊𝒏𝒈 𝒕𝒊𝒎𝒆 𝒑𝒆𝒓 𝒎𝒐𝒏𝒕𝒉
𝑵𝒖𝒎𝒃𝒆𝒓 𝒐𝒇 𝒘𝒐𝒓𝒌 𝒉𝒐𝒖𝒓𝒔 𝒑𝒆𝒓 𝒎𝒐𝒏𝒕𝒉
SAMPLE Insourced Desktop Support Benchmark (sample report only—data is not accurate!)
44 | P a g e © M e t r i c N e t , L L C w w w . m e t r i c n e t . c o m
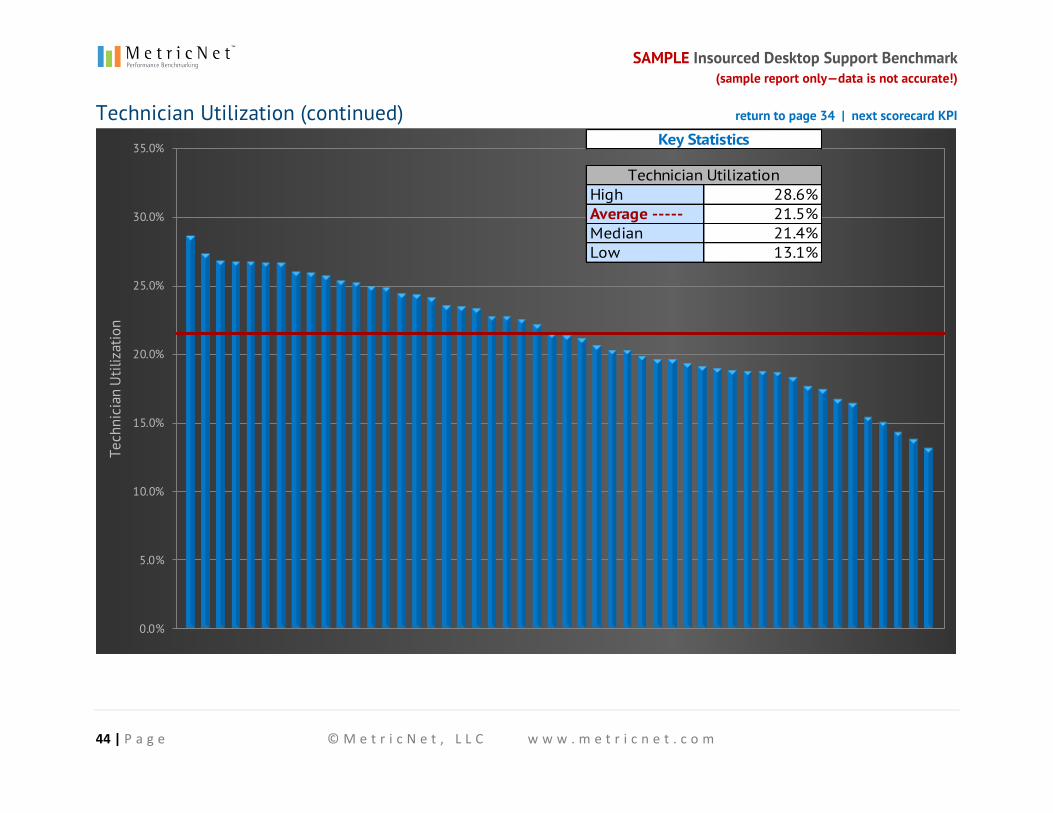
Technician Utilization (continued) return to page 34 | next scorecard KPI
0.0%
5.0%
10.0%
15.0%
20.0%
25.0%
30.0%
35.0%
Tech
nici
an U
tiliz
atio
n
High 28.6%Average ----- 21.5%Median 21.4%Low 13.1%
Key Statistics
Technician Utilization
SAMPLE Insourced Desktop Support Benchmark (sample report only—data is not accurate!)
45 | P a g e © M e t r i c N e t , L L C w w w . m e t r i c n e t . c o m
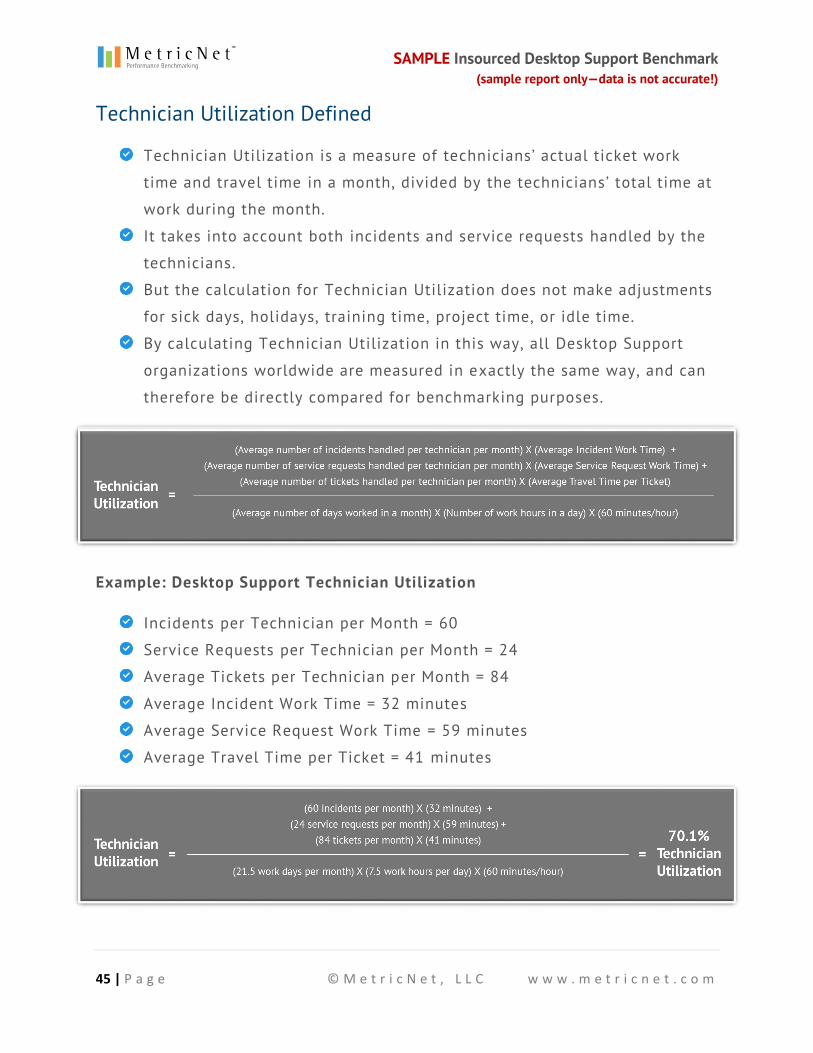
Technician Utilization Defined
Technician Utilization is a measure of technicians’ actual ticket work
time and travel time in a month, divided by the technicians’ total time at
work during the month.
It takes into account both incidents and service requests handled by the
technicians.
But the calculation for Technician Utilization does not make adjustments
for sick days, holidays, training time, project time, or idle time.
By calculating Technician Utilization in this way, all Desktop Support
organizations worldwide are measured in exactly the same way, and can
therefore be directly compared for benchmarking purposes.
Example: Desktop Support Technician Utilization
Incidents per Technician per Month = 60
Service Requests per Technician per Month = 24
Average Tickets per Technician per Month = 84
Average Incident Work Time = 32 minutes
Average Service Request Work Time = 59 minutes
Average Travel Time per Ticket = 41 minutes
SAMPLE Insourced Desktop Support Benchmark (sample report only—data is not accurate!)
46 | P a g e © M e t r i c N e t , L L C w w w . m e t r i c n e t . c o m
Productivity Metrics (continued)
Tickets per Technician per Month
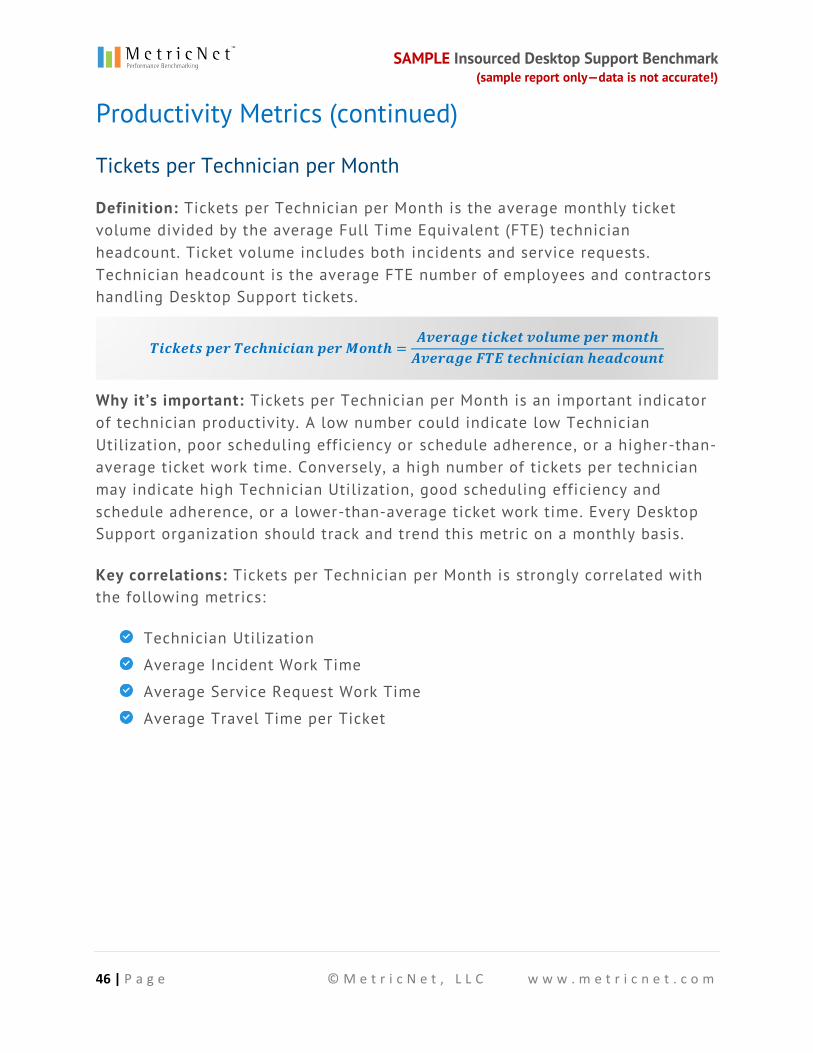
Definition: Tickets per Technician per Month is the average monthly ticket volume divided by the average Full Time Equivalent (FTE) technician headcount. Ticket volume includes both incidents and service requests. Technician headcount is the average FTE number of employees and contractors handling Desktop Support tickets.
Why it’s important: Tickets per Technician per Month is an important indicator of technician productivity. A low number could indicate low Technician Utilization, poor scheduling efficiency or schedule adherence, or a higher-than-average ticket work time. Conversely, a high number of tickets per technician may indicate high Technician Utilization, good scheduling efficiency and schedule adherence, or a lower-than-average ticket work time. Every Desktop Support organization should track and trend this metric on a monthly basis.
Key correlations: Tickets per Technician per Month is strongly correlated with the following metrics:
Technician Utilization
Average Incident Work Time
Average Service Request Work Time
Average Travel Time per Ticket
𝑻𝒊𝒄𝒌𝒆𝒕𝒔 𝒑𝒆𝒓 𝑻𝒆𝒄𝒉𝒏𝒊𝒄𝒊𝒂𝒏 𝒑𝒆𝒓 𝑴𝒐𝒏𝒕𝒉 =𝑨𝒗𝒆𝒓𝒂𝒈𝒆 𝒕𝒊𝒄𝒌𝒆𝒕 𝒗𝒐𝒍𝒖𝒎𝒆 𝒑𝒆𝒓 𝒎𝒐𝒏𝒕𝒉
𝑨𝒗𝒆𝒓𝒂𝒈𝒆 𝑭𝑻𝑬 𝒕𝒆𝒄𝒉𝒏𝒊𝒄𝒊𝒂𝒏 𝒉𝒆𝒂𝒅𝒄𝒐𝒖𝒏𝒕

SAMPLE Insourced Desktop Support Benchmark (sample report only—data is not accurate!)
47 | P a g e © M e t r i c N e t , L L C w w w . m e t r i c n e t . c o m
Tickets per Technician per Month (continued)
0
5
10
15
20
25
30
35
40
45
50
Tick
ets p
er T
echn
icia
n pe
r Mon
th
High 44Average ----- 14Median 11Low 5
Key Statistics
Tickets per Technician per Month
SAMPLE Insourced Desktop Support Benchmark (sample report only—data is not accurate!)
48 | P a g e © M e t r i c N e t , L L C w w w . m e t r i c n e t . c o m
Productivity Metrics (continued)
Incidents per Technician per Month
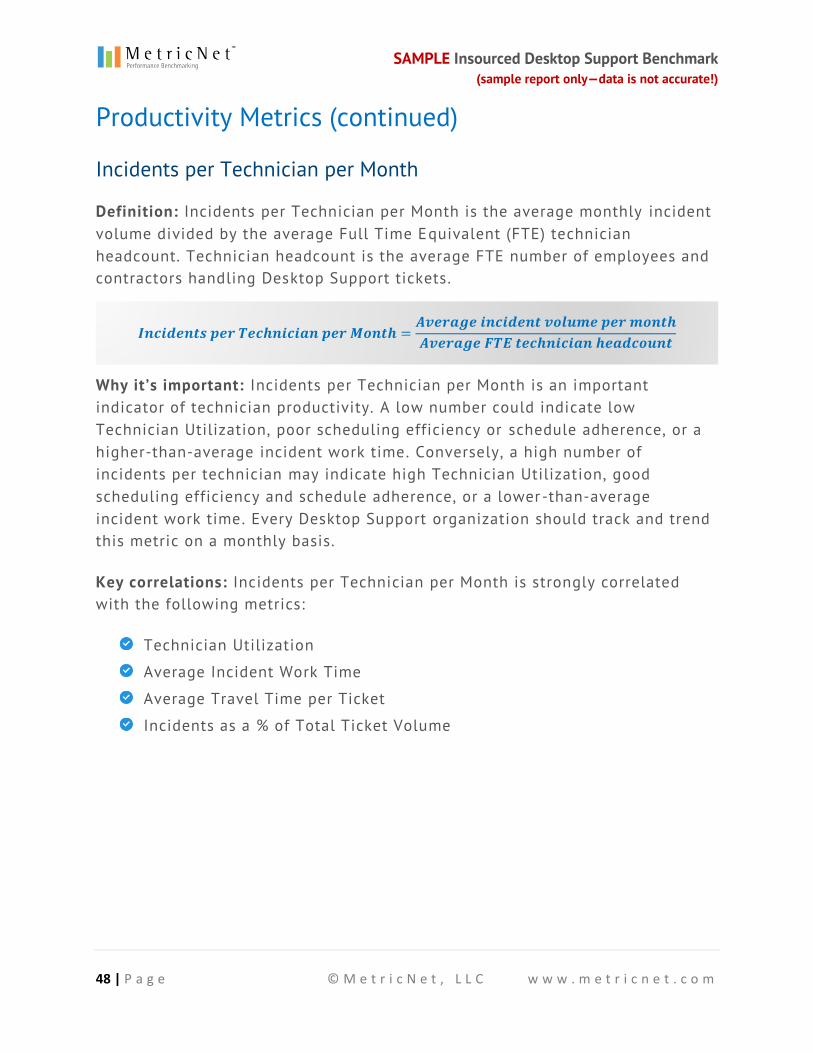
Definition: Incidents per Technician per Month is the average monthly incident volume divided by the average Full Time Equivalent (FTE) technician headcount. Technician headcount is the average FTE number of employees and contractors handling Desktop Support tickets.
Why it’s important: Incidents per Technician per Month is an important indicator of technician productivity. A low number could indicate low Technician Utilization, poor scheduling efficiency or schedule adherence, or a higher-than-average incident work time. Conversely, a high number of incidents per technician may indicate high Technician Utilization, good scheduling efficiency and schedule adherence, or a lower-than-average incident work time. Every Desktop Support organization should track and trend this metric on a monthly basis.
Key correlations: Incidents per Technician per Month is strongly correlated with the following metrics:
Technician Utilization
Average Incident Work Time
Average Travel Time per Ticket
Incidents as a % of Total Ticket Volume
𝑰𝒏𝒄𝒊𝒅𝒆𝒏𝒕𝒔 𝒑𝒆𝒓 𝑻𝒆𝒄𝒉𝒏𝒊𝒄𝒊𝒂𝒏 𝒑𝒆𝒓 𝑴𝒐𝒏𝒕𝒉 =𝑨𝒗𝒆𝒓𝒂𝒈𝒆 𝒊𝒏𝒄𝒊𝒅𝒆𝒏𝒕 𝒗𝒐𝒍𝒖𝒎𝒆 𝒑𝒆𝒓 𝒎𝒐𝒏𝒕𝒉
𝑨𝒗𝒆𝒓𝒂𝒈𝒆 𝑭𝑻𝑬 𝒕𝒆𝒄𝒉𝒏𝒊𝒄𝒊𝒂𝒏 𝒉𝒆𝒂𝒅𝒄𝒐𝒖𝒏𝒕
SAMPLE Insourced Desktop Support Benchmark (sample report only—data is not accurate!)
49 | P a g e © M e t r i c N e t , L L C w w w . m e t r i c n e t . c o m
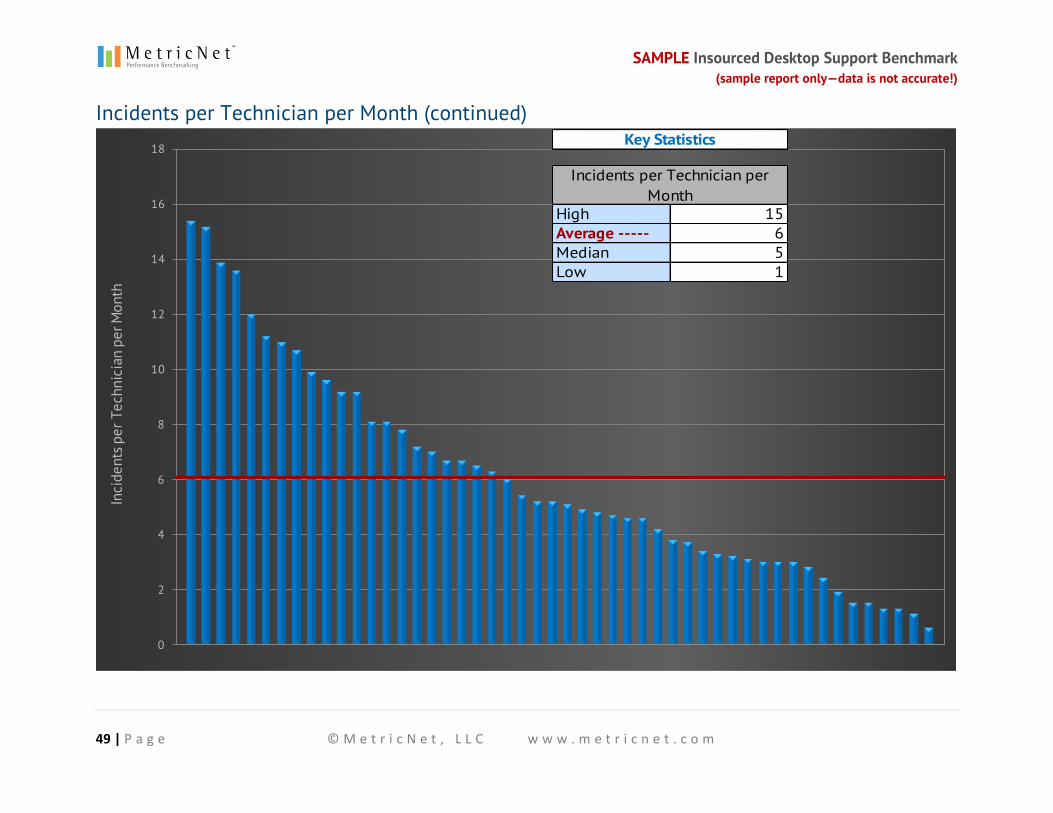
Incidents per Technician per Month (continued)
0
2
4
6
8
10
12
14
16
18
Inci
dent
s per
Tec
hnic
ian
per M
onth
High 15Average ----- 6Median 5Low 1
Key Statistics
Incidents per Technician per Month
SAMPLE Insourced Desktop Support Benchmark (sample report only—data is not accurate!)
50 | P a g e © M e t r i c N e t , L L C w w w . m e t r i c n e t . c o m
Productivity Metrics (continued)
Service Requests per Technician per Month
Definition: Service Requests per Technician per Month is the average monthly service request volume divided by the average Full Time Equivalent (FTE) technician headcount. Technician headcount is the average FTE number of employees and contractors handling Desktop Support tickets.
Why it’s important: Service Requests per Technician per Month is an important indicator of technician productivity. A low number could indicate low Technician Utilization, poor scheduling efficiency or schedule adherence, or a higher-than-average service request work time. Conversely, a high number of service requests per technician may indicate high Technician Utilization, good scheduling efficiency and schedule adherence, or a lower-than-average service request work time. Every Desktop Support organization should track and trend this metric on a monthly basis.
Key correlations: Service Requests per Technician per Month is strongly correlated with the following metrics:
Technician Utilization
Average Service Request Work Time
Average Travel Time per Ticket
Incidents as a % of Total Ticket Volume
𝑺𝒆𝒓𝒗𝒊𝒄𝒆 𝑹𝒆𝒒𝒖𝒆𝒔𝒕𝒔 𝒑𝒆𝒓 𝑻𝒆𝒄𝒉𝒏𝒊𝒄𝒊𝒂𝒏 𝒑𝒆𝒓 𝑴𝒐𝒏𝒕𝒉 =𝑨𝒗𝒈. 𝒔𝒆𝒓𝒗𝒊𝒄𝒆 𝒓𝒆𝒒𝒖𝒆𝒔𝒕 𝒗𝒐𝒍𝒖𝒎𝒆/𝒎𝒐𝒏𝒕𝒉
𝑨𝒗𝒈. 𝑭𝑻𝑬 𝒕𝒆𝒄𝒉𝒏𝒊𝒄𝒊𝒂𝒏 𝒉𝒆𝒂𝒅𝒄𝒐𝒖𝒏𝒕
SAMPLE Insourced Desktop Support Benchmark (sample report only—data is not accurate!)
51 | P a g e © M e t r i c N e t , L L C w w w . m e t r i c n e t . c o m
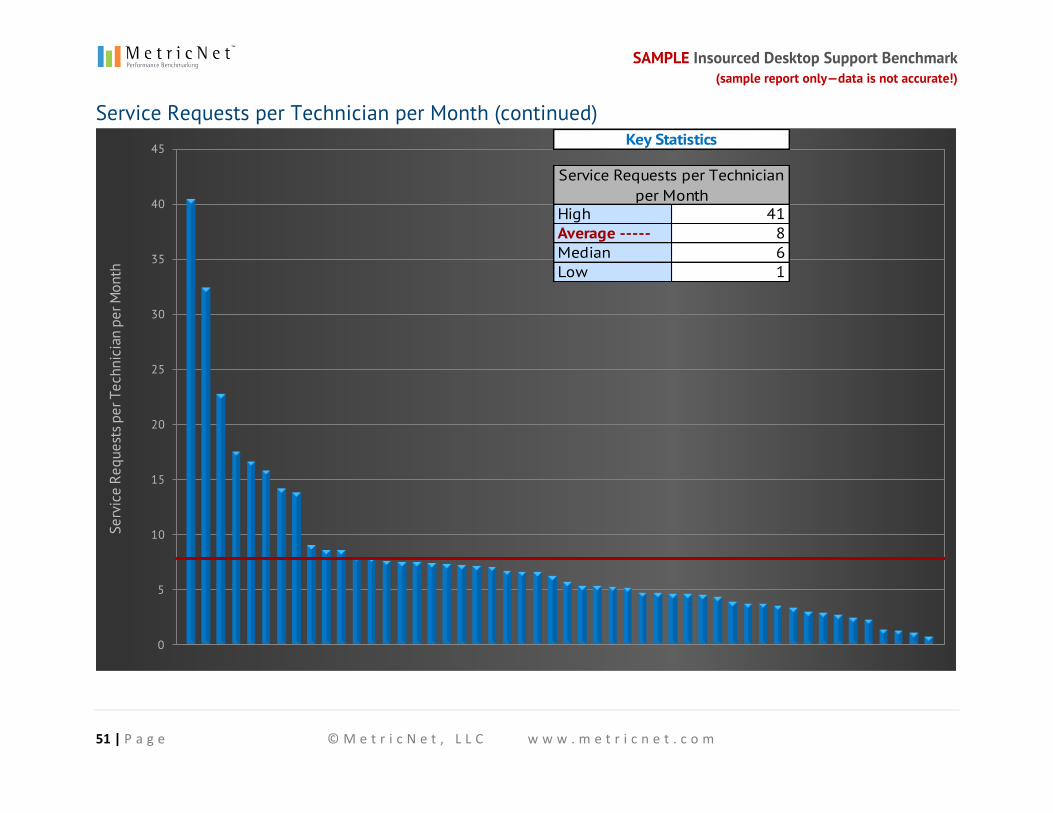
Service Requests per Technician per Month (continued)
0
5
10
15
20
25
30
35
40
45
Serv
ice
Requ
ests
per
Tec
hnic
ian
per M
onth
High 41Average ----- 8Median 6Low 1
Key Statistics
Service Requests per Technician per Month
SAMPLE Insourced Desktop Support Benchmark (sample report only—data is not accurate!)
52 | P a g e © M e t r i c N e t , L L C w w w . m e t r i c n e t . c o m
Productivity Metrics (continued)
Technicians as a % of Total Headcount
Definition: This metric is the average Full Time Equivalent (FTE) technician headcount divided by the average total Desktop Support headcount. It is expressed as a percentage, and represents the percentage of total Desktop Support personnel who are engaged in direct customer-support activities. Headcount includes both employees and contractors.
Why it’s important: The technician headcount as a percentage of total Desktop Support headcount is an important measure of management and overhead efficiency. Since non-technicians include both management and non-management personnel (such as supervisors and team leads, QA/QC, trainers, etc.), this metric is not a pure measure of management span of control. But it is a more useful metric than management span of control because the denominator of this ratio takes into account all personnel that are not directly engaged in customer-support activities.
Key correlations: Technicians as a % of Total Headcount is strongly correlated with the following metrics:
Cost per Ticket
Cost per Incident
Cost per Service Request
𝑻𝒆𝒄𝒉𝒏𝒊𝒄𝒊𝒂𝒏𝒔 𝒂𝒔 𝒂 % 𝒐𝒇 𝑻𝒐𝒕𝒂𝒍 𝑯𝒆𝒂𝒅𝒄𝒐𝒖𝒏𝒕 =𝑨𝒗𝒈. 𝑭𝑻𝑬 𝒕𝒆𝒄𝒉𝒏𝒊𝒄𝒊𝒂𝒏 𝒉𝒆𝒂𝒅𝒄𝒐𝒖𝒏𝒕
𝑨𝒗𝒈. 𝒕𝒐𝒕𝒂𝒍 𝑫𝒆𝒔𝒌𝒕𝒐𝒑 𝑺𝒖𝒑𝒑𝒐𝒓𝒕 𝒉𝒆𝒂𝒅𝒄𝒐𝒖𝒏𝒕
SAMPLE Insourced Desktop Support Benchmark (sample report only—data is not accurate!)
53 | P a g e © M e t r i c N e t , L L C w w w . m e t r i c n e t . c o m
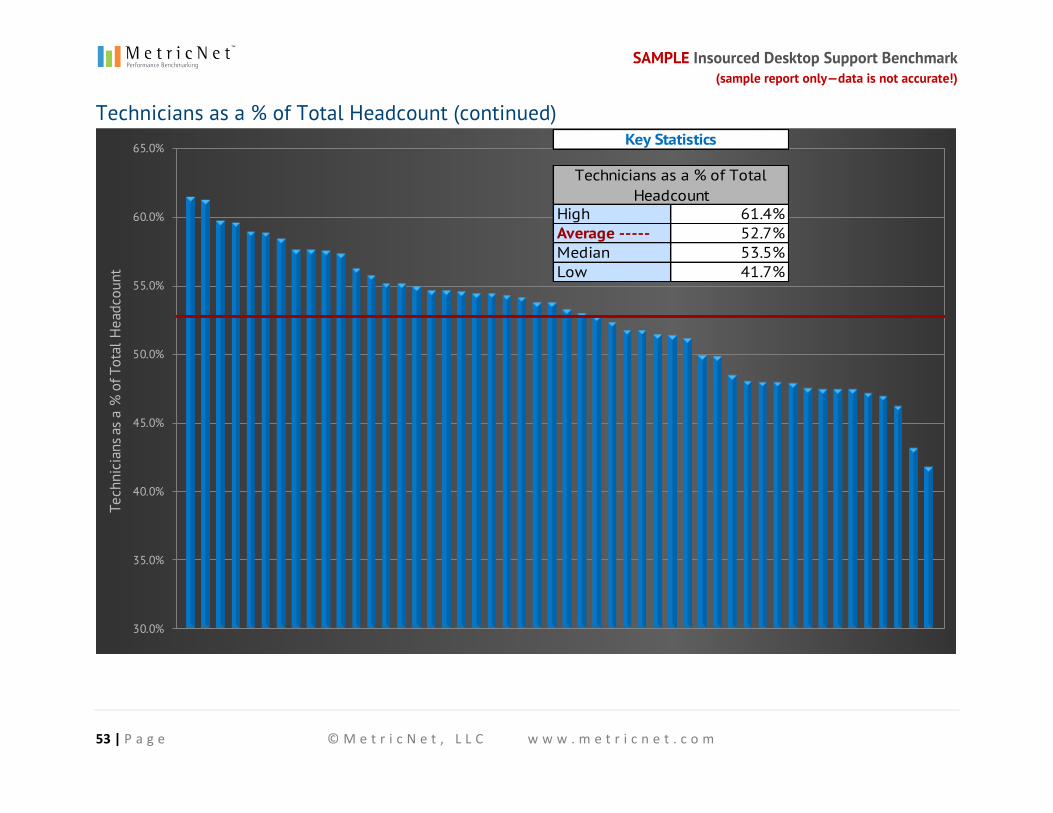
Technicians as a % of Total Headcount (continued)
30.0%
35.0%
40.0%
45.0%
50.0%
55.0%
60.0%
65.0%
Tech
nici
ans a
s a
% o
f Tot
al H
eadc
ount
High 61.4%Average ----- 52.7%Median 53.5%Low 41.7%
Key Statistics
Technicians as a % of Total Headcount
SAMPLE Insourced Desktop Support Benchmark (sample report only—data is not accurate!)
54 | P a g e © M e t r i c N e t , L L C w w w . m e t r i c n e t . c o m
Service Level Metrics
Mean Time to Resolve Incidents
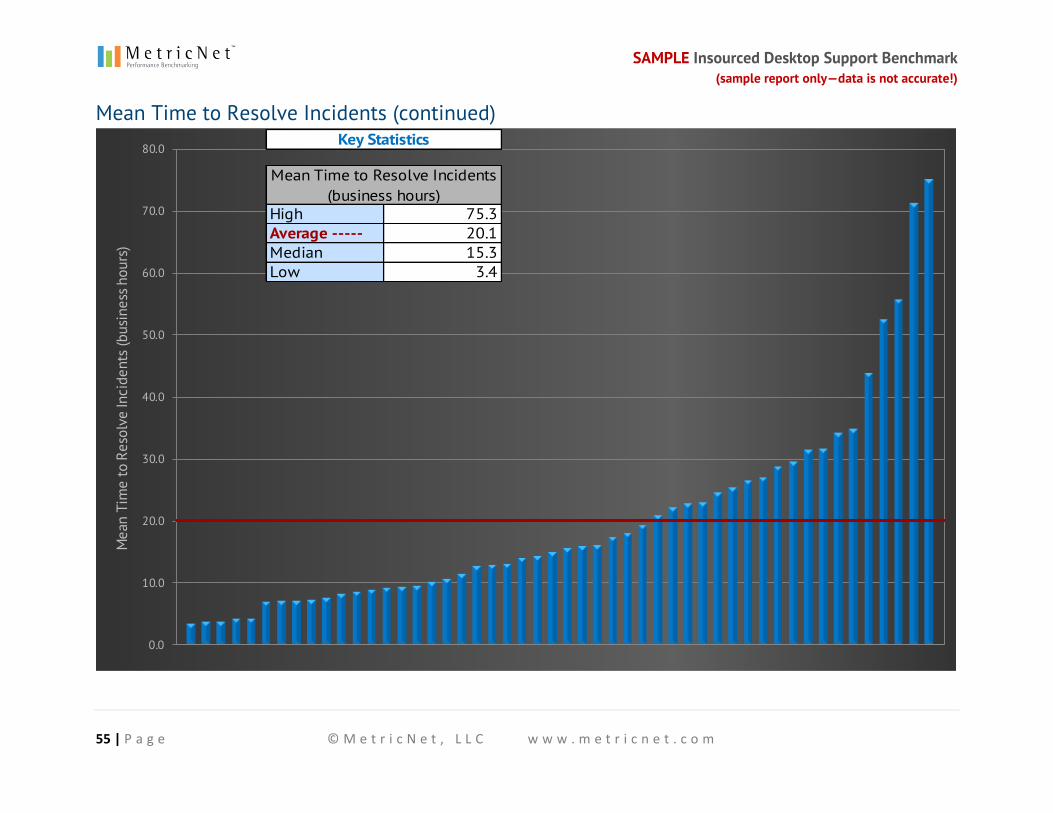
Definition: Mean Time to Resolve Incidents is the average number of business hours that elapse from the time an incident is reported until the time the incident is closed. Non-business hours are excluded from the calculation. For example, if an incident is reported at 3:00 p.m. on Tuesday, and the ticket is closed at 3:00 p.m. on Wednesday, the mean time to resolve (MTTR) will be 8 hours, not 24 hours.
Why it’s important: Service levels, including the MTTR for incidents, are a key driver of Customer Satisfaction with Desktop Support.
Key correlations: Mean Time to Resolve Incidents is strongly correlated with the following metrics:
Customer Satisfaction
Average Incident Work Time
Average Travel Time per Ticket
% of Incidents Resolved in 8 Business Hours
𝑴𝒆𝒂𝒏 𝑻𝒊𝒎𝒆 𝒕𝒐 𝑹𝒆𝒔𝒐𝒍𝒗𝒆 𝑰𝒏𝒄𝒊𝒅𝒆𝒏𝒕𝒔 = 𝑨𝒗𝒆𝒓𝒂𝒈𝒆 𝒏𝒖𝒎𝒃𝒆𝒓 𝒐𝒇 𝒃𝒖𝒔𝒊𝒏𝒆𝒔𝒔 𝒉𝒐𝒖𝒓𝒔
𝒃𝒆𝒕𝒘𝒆𝒆𝒏 𝒕𝒉𝒆 𝒕𝒊𝒎𝒆 𝒂𝒏 𝒊𝒏𝒄𝒊𝒅𝒆𝒏𝒕 𝒊𝒔 𝒓𝒆𝒑𝒐𝒓𝒕𝒆𝒅 𝒂𝒏𝒅 𝒕𝒉𝒆 𝒕𝒊𝒎𝒆 𝒊𝒕 𝒊𝒔 𝒄𝒍𝒐𝒔𝒆𝒅
SAMPLE Insourced Desktop Support Benchmark (sample report only—data is not accurate!)
55 | P a g e © M e t r i c N e t , L L C w w w . m e t r i c n e t . c o m
Mean Time to Resolve Incidents (continued)
0.0
10.0
20.0
30.0
40.0
50.0
60.0
70.0
80.0
Mea
n Ti
me
to R
esol
ve In
cide
nts
(bus
ines
s hou
rs)
High 75.3Average ----- 20.1Median 15.3Low 3.4
Key Statistics
Mean Time to Resolve Incidents (business hours)
SAMPLE Insourced Desktop Support Benchmark (sample report only—data is not accurate!)
56 | P a g e © M e t r i c N e t , L L C w w w . m e t r i c n e t . c o m
Service Level Metrics (continued)
% of Incidents Resolved in 8 Business Hours
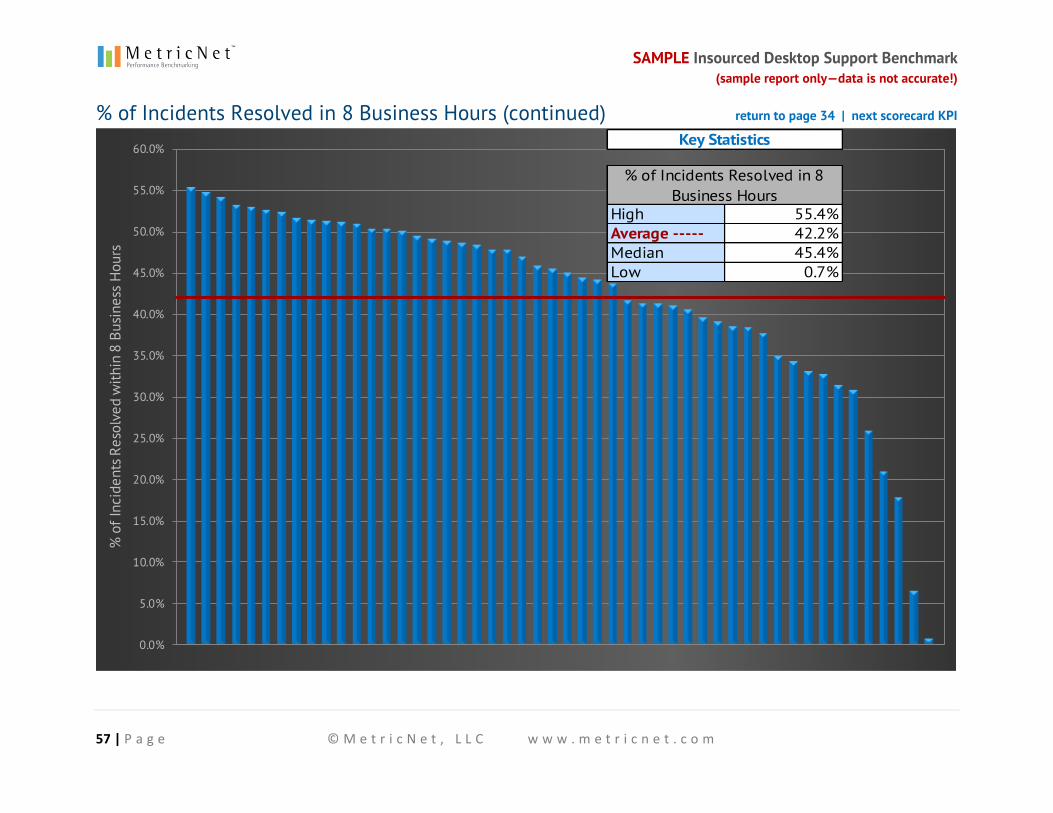
Definition: The % of Incidents Resolved in 8 Business Hours is fairly self-explanatory. For example, an incident that is reported at 1:00 p.m. on Friday will be resolved in 8 business hours if the ticket is closed by 1:00 p.m. on the following Monday.
Why it’s important: Service levels, including the % of Incidents Resolved in 8 Business Hours, are a key driver of Customer Satisfaction with Desktop Support.
Key correlations: % of Incidents Resolved in 8 Business Hours is strongly correlated with the following metrics:
Customer Satisfaction
Average Incident Work Time
Average Travel Time per Ticket
Mean Time to Resolve Incidents
% 𝒐𝒇 𝑰𝒏𝒄𝒊𝒅𝒆𝒏𝒕𝒔 𝑹𝒆𝒔𝒐𝒍𝒗𝒆𝒅 𝒊𝒏 𝟖 𝑩𝒖𝒔𝒊𝒏𝒆𝒔𝒔 𝑯𝒐𝒖𝒓𝒔 = 𝑻𝒉𝒆 𝒑𝒆𝒓𝒄𝒆𝒏𝒕𝒂𝒈𝒆 𝒐𝒇 𝒊𝒏𝒄𝒊𝒅𝒆𝒏𝒕𝒔
𝒕𝒉𝒂𝒕 𝒂𝒓𝒆 𝒄𝒍𝒐𝒔𝒆𝒅 𝒘𝒊𝒕𝒉𝒊𝒏 𝟖 𝒃𝒖𝒔𝒊𝒏𝒆𝒔𝒔 𝒉𝒐𝒖𝒓𝒔 𝒐𝒇 𝒃𝒆𝒊𝒏𝒈 𝒓𝒆𝒑𝒐𝒓𝒕𝒆𝒅.
SAMPLE Insourced Desktop Support Benchmark (sample report only—data is not accurate!)
57 | P a g e © M e t r i c N e t , L L C w w w . m e t r i c n e t . c o m
% of Incidents Resolved in 8 Business Hours (continued) return to page 34 | next scorecard KPI
0.0%
5.0%
10.0%
15.0%
20.0%
25.0%
30.0%
35.0%
40.0%
45.0%
50.0%
55.0%
60.0%
% o
f Inc
iden
ts R
esol
ved
with
in 8
Bus
ines
s H
ours
High 55.4%Average ----- 42.2%Median 45.4%Low 0.7%
Key Statistics
% of Incidents Resolved in 8 Business Hours
SAMPLE Insourced Desktop Support Benchmark (sample report only—data is not accurate!)
58 | P a g e © M e t r i c N e t , L L C w w w . m e t r i c n e t . c o m
Service Level Metrics (continued)
Mean Time to Fulfill Service Requests
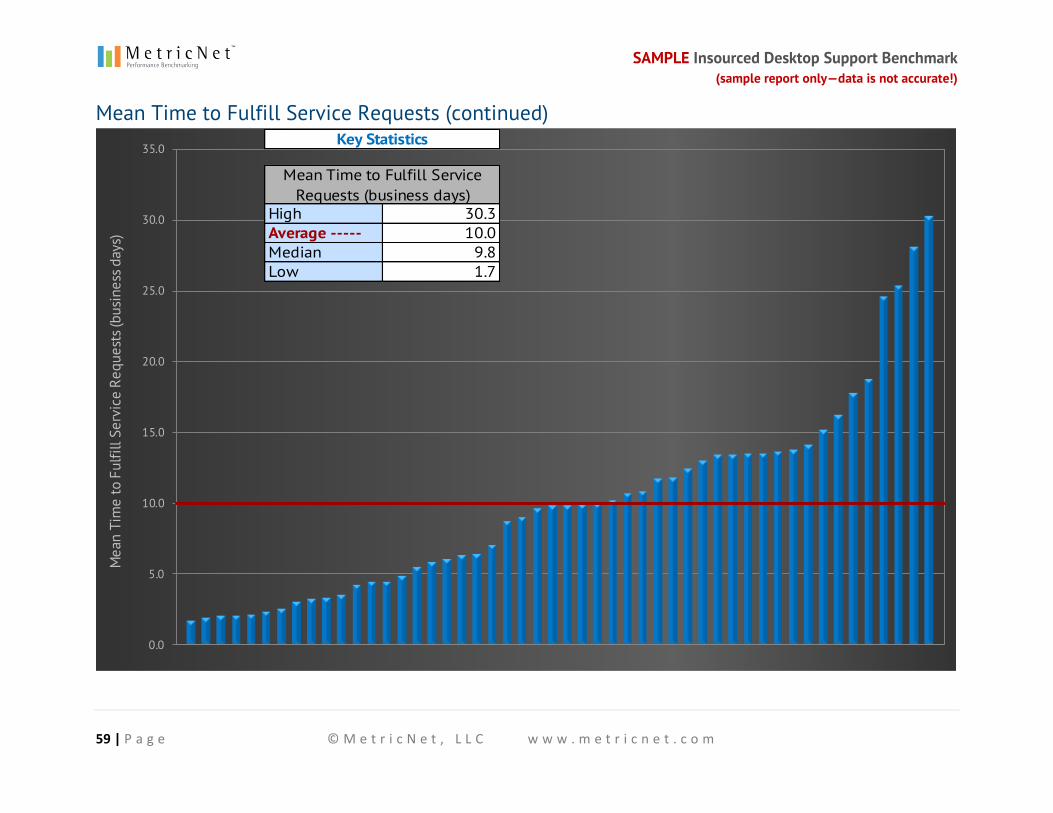
Definition: Mean Time to Fulfill Service Requests is the average number of business days that elapse from the time a service request is logged until the time the service request is completed. Non-business days are excluded from the calculation. For example, if a service request is logged at 3:00 p.m. on Friday, and the ticket is closed at 3:00 pm on the following Tuesday, the mean time to fulfill (MTTF) will be 2 days, not 4 days.
Why it’s important: Service levels, including the MTTF for service requests, are a key driver of Customer Satisfaction with Desktop Support.
Key correlations: Mean Time to Fulfill Service Requests is strongly correlated with the following metrics:
Customer Satisfaction
Average Service Request Work Time
Average Travel Time per Ticket
% of Service Requests Resolved in 24 Business Hours
𝑴𝒆𝒂𝒏 𝑻𝒊𝒎𝒆 𝒕𝒐 𝑭𝒖𝒍𝒇𝒊𝒍𝒍 𝑺𝒆𝒓𝒗𝒊𝒄𝒆 𝑹𝒆𝒒𝒖𝒆𝒔𝒕𝒔 = 𝑨𝒗𝒆𝒓𝒂𝒈𝒆 𝒏𝒖𝒎𝒃𝒆𝒓 𝒐𝒇 𝒃𝒖𝒔𝒊𝒏𝒆𝒔𝒔 𝒅𝒂𝒚𝒔
𝒃𝒆𝒕𝒘𝒆𝒆𝒏 𝒕𝒉𝒆 𝒕𝒊𝒎𝒆 𝒂 𝒔𝒆𝒓𝒗𝒊𝒄𝒆 𝒓𝒆𝒒𝒖𝒆𝒔𝒕 𝒊𝒔 𝒍𝒐𝒈𝒈𝒆𝒅 𝒂𝒏𝒅 𝒕𝒉𝒆 𝒕𝒊𝒎𝒆 𝒊𝒕 𝒊𝒔 𝒄𝒐𝒎𝒑𝒍𝒆𝒕𝒆𝒅.
SAMPLE Insourced Desktop Support Benchmark (sample report only—data is not accurate!)
59 | P a g e © M e t r i c N e t , L L C w w w . m e t r i c n e t . c o m
Mean Time to Fulfill Service Requests (continued)
0.0
5.0
10.0
15.0
20.0
25.0
30.0
35.0
Mea
n Ti
me
to F
ulfil
l Ser
vice
Req
uest
s (bu
sine
ss d
ays)
High 30.3Average ----- 10.0Median 9.8Low 1.7
Key Statistics
Mean Time to Fulfill Service Requests (business days)
SAMPLE Insourced Desktop Support Benchmark (sample report only—data is not accurate!)
60 | P a g e © M e t r i c N e t , L L C w w w . m e t r i c n e t . c o m
Service Level Metrics (continued)
% of Service Requests Fulfilled in 24 Business Hours
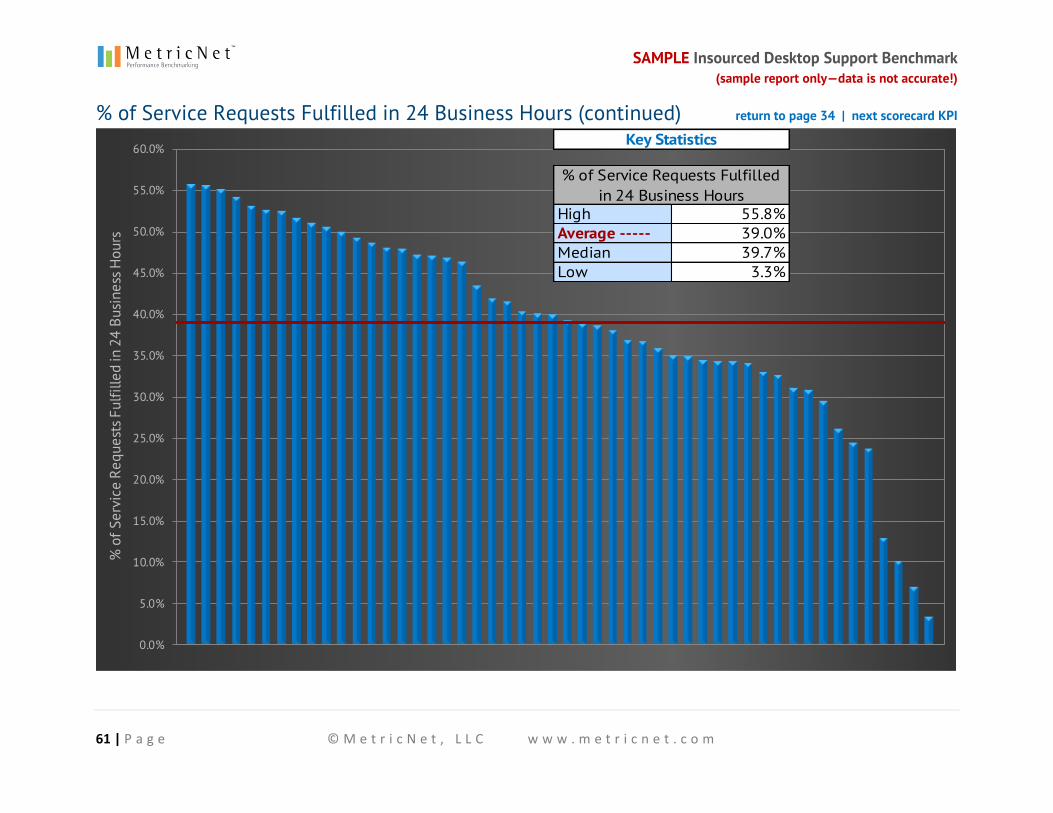
Definition: The % of Service Requests Fulfilled in 24 Business Hours is fairly self-explanatory. For example, a service request that is logged at 1:00 p.m. on Friday will be fulfilled in 24 business hours if the ticket is closed by 1:00 p.m. on the following Wednesday.
Why it’s important: Service levels, including the % of Service Requests Fulfilled in 24 Business Hours, are a key driver of Customer Satisfaction with Desktop Support.
Key correlations: % of Service Requests Fulfilled in 24 Business Hours is strongly correlated with the following metrics:
Customer Satisfaction
Average Service Request Work Time
Average Travel Time per Ticket
Mean Time to Fulfill Service Requests
% 𝒐𝒇 𝑺𝒆𝒓𝒗𝒊𝒄𝒆 𝑹𝒆𝒒𝒖𝒆𝒔𝒕𝒔 𝑭𝒖𝒍𝒇𝒊𝒍𝒍𝒆𝒅 𝒊𝒏 𝟐𝟒 𝑩𝒖𝒔𝒊𝒏𝒆𝒔𝒔 𝑯𝒐𝒖𝒓𝒔 = 𝑻𝒉𝒆 𝒑𝒆𝒓𝒄𝒆𝒏𝒕𝒂𝒈𝒆 𝒐𝒇
𝒔𝒆𝒓𝒗𝒊𝒄𝒆 𝒓𝒆𝒒𝒖𝒆𝒔𝒕𝒔 𝒕𝒉𝒂𝒕 𝒂𝒓𝒆 𝒄𝒍𝒐𝒔𝒆𝒅 𝒘𝒊𝒕𝒉𝒊𝒏 𝟐𝟒 𝒃𝒖𝒔𝒊𝒏𝒆𝒔𝒔 𝒉𝒐𝒖𝒓𝒔 𝒐𝒇 𝒃𝒆𝒊𝒏𝒈 𝒍𝒐𝒈𝒈𝒆𝒅.
SAMPLE Insourced Desktop Support Benchmark (sample report only—data is not accurate!)
61 | P a g e © M e t r i c N e t , L L C w w w . m e t r i c n e t . c o m
% of Service Requests Fulfilled in 24 Business Hours (continued) return to page 34 | next scorecard KPI
0.0%
5.0%
10.0%
15.0%
20.0%
25.0%
30.0%
35.0%
40.0%
45.0%
50.0%
55.0%
60.0%
% o
f Ser
vice
Req
uest
s Ful
fille
d in
24
Busi
ness
Hou
rs
High 55.8%Average ----- 39.0%Median 39.7%Low 3.3%
Key Statistics
% of Service Requests Fulfilled in 24 Business Hours
SAMPLE Insourced Desktop Support Benchmark (sample report only—data is not accurate!)
62 | P a g e © M e t r i c N e t , L L C w w w . m e t r i c n e t . c o m
Quality Metrics
Customer Satisfaction
Definition: Customer Satisfaction is the percentage of customers who are either satisfied or very satisfied with their Desktop Support experience. This metric can be captured in a number of ways, including follow-up calls, email surveys that are automatically sent out by the trouble ticket system, postal surveys, etc.
Why it’s important: Customer Satisfaction is the single most important measure of Desktop Support quality. Any successful Desktop Support organization will have consistently high Customer Satisfaction ratings. Some Desktop Support managers are under the impression that a low Cost per Ticket may justify a lower level of Customer Satisfaction. Bu t this is not true. MetricNet’s research shows that even Desktop Support organizations with a very low Cost per Ticket can achieve consistently high Customer Satisfaction ratings.
Key correlations: Customer Satisfaction is strongly correlated with the following metrics:
Incident First Visit Resolution Rate
Mean Time to Resolve Incidents
Mean Time to Fulfill Service Requests
𝑪𝒖𝒔𝒕𝒐𝒎𝒆𝒓 𝑺𝒂𝒕𝒊𝒔𝒇𝒂𝒄𝒕𝒊𝒐𝒏 =𝑵𝒖𝒎𝒃𝒆𝒓 𝒐𝒇 𝒔𝒂𝒕𝒊𝒔𝒇𝒊𝒆𝒅 𝒐𝒓 𝒗𝒆𝒓𝒚 𝒔𝒂𝒕𝒊𝒔𝒇𝒊𝒆𝒅 𝒄𝒖𝒔𝒕𝒐𝒎𝒆𝒓𝒔
𝑵𝒖𝒎𝒃𝒆𝒓 𝒐𝒇 𝒄𝒖𝒔𝒕𝒐𝒎𝒆𝒓𝒔 𝒔𝒖𝒓𝒗𝒆𝒚𝒆𝒅
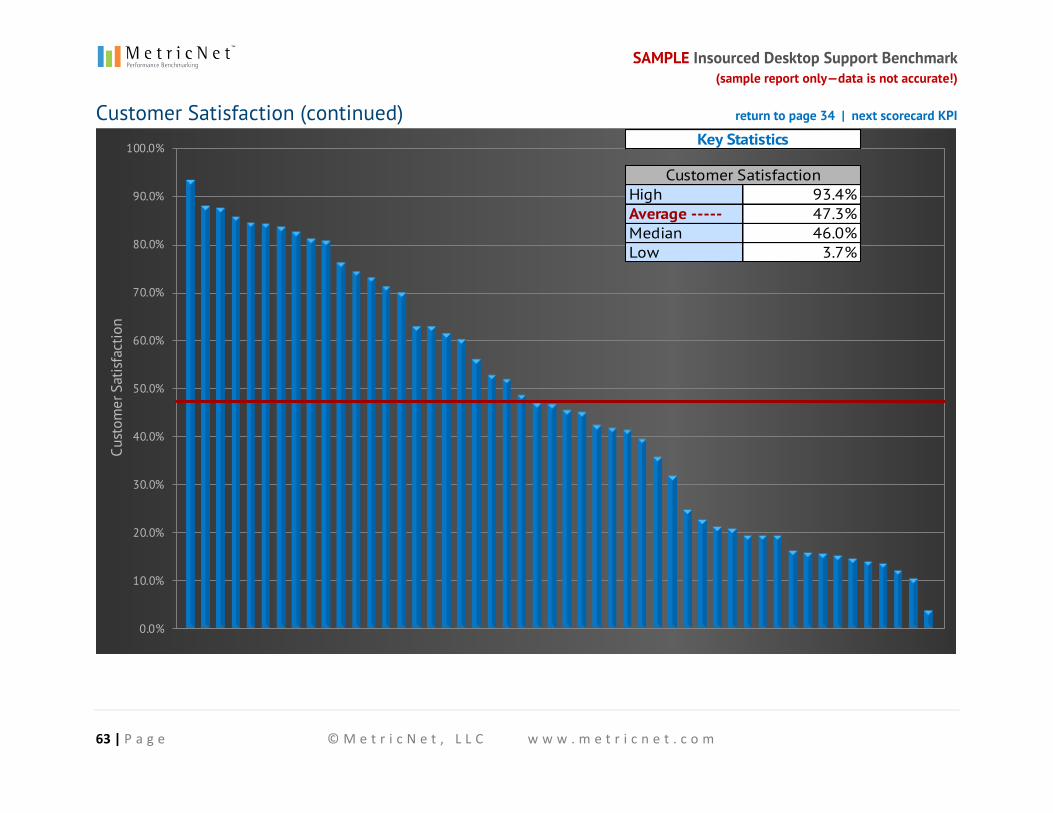
SAMPLE Insourced Desktop Support Benchmark (sample report only—data is not accurate!)
63 | P a g e © M e t r i c N e t , L L C w w w . m e t r i c n e t . c o m
Customer Satisfaction (continued) return to page 34 | next scorecard KPI
0.0%
10.0%
20.0%
30.0%
40.0%
50.0%
60.0%
70.0%
80.0%
90.0%
100.0%
Cust
omer
Sat
isfa
ctio
n
High 93.4%Average ----- 47.3%Median 46.0%Low 3.7%
Key Statistics
Customer Satisfaction
SAMPLE Insourced Desktop Support Benchmark (sample report only—data is not accurate!)
64 | P a g e © M e t r i c N e t , L L C w w w . m e t r i c n e t . c o m
Quality Metrics (continued)
Incident First Visit Resolution Rate
Definition: Incident First Visit Resolution Rate is the percentage of incidents that are resolved on the first visit to the customer. Incidents that require a second visit, or are otherwise unresolved on the first visit for any reason, do not qualify for Incident First Visit Resolution.
Why it’s important: Incident First Visit Resolution Rate is one of the biggest drivers of Customer Satisfaction. A high Incident First Visit Resolution Rate is almost always associated with high levels of Customer Satisfaction. Desktop Support groups that emphasize training (i.e., high training hours for new and veteran technicians) and have good technology tools generally enjoy a higher-than-average Incident First Visit Resolution Rate.
Key correlations: Incident First Visit Resolution Rate is strongly correlated with the following metrics:
Customer Satisfaction
New Technician Training Hours
Annual Technician Training Hours
Average Incident Work Time
𝑰𝒏𝒄𝒊𝒅𝒆𝒏𝒕 𝑭𝒊𝒓𝒔𝒕 𝑽𝒊𝒔𝒊𝒕 𝑹𝒆𝒔𝒐𝒍𝒖𝒕𝒊𝒐𝒏 𝑹𝒂𝒕𝒆 =𝑰𝒏𝒄𝒊𝒅𝒆𝒏𝒕𝒔 𝒓𝒆𝒔𝒐𝒍𝒗𝒆𝒅 𝒐𝒏 𝒇𝒊𝒓𝒔𝒕 𝒗𝒊𝒔𝒊𝒕
𝑻𝒐𝒕𝒂𝒍 𝒊𝒏𝒄𝒊𝒅𝒆𝒏𝒕 𝒗𝒐𝒍𝒖𝒎𝒆
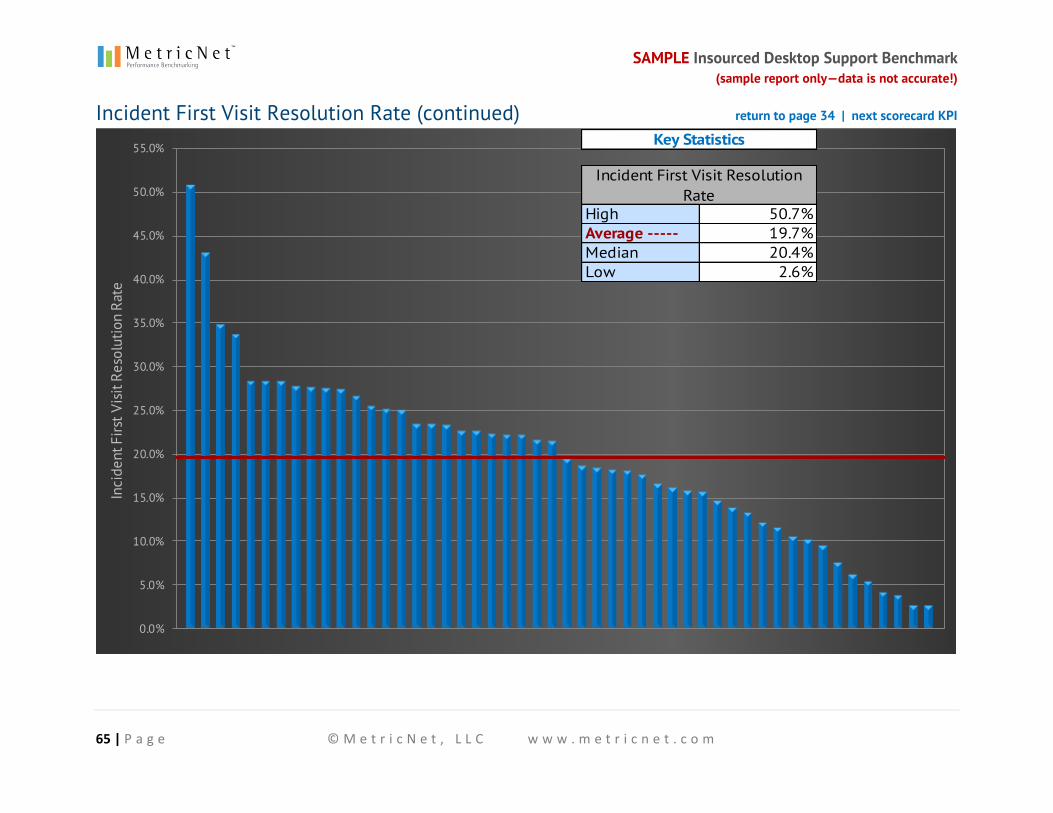
SAMPLE Insourced Desktop Support Benchmark (sample report only—data is not accurate!)
65 | P a g e © M e t r i c N e t , L L C w w w . m e t r i c n e t . c o m
Incident First Visit Resolution Rate (continued) return to page 34 | next scorecard KPI
0.0%
5.0%
10.0%
15.0%
20.0%
25.0%
30.0%
35.0%
40.0%
45.0%
50.0%
55.0%
Inci
dent
Firs
t Vis
it Re
solu
tion
Rate
High 50.7%Average ----- 19.7%Median 20.4%Low 2.6%
Key Statistics
Incident First Visit Resolution Rate
SAMPLE Insourced Desktop Support Benchmark (sample report only—data is not accurate!)
66 | P a g e © M e t r i c N e t , L L C w w w . m e t r i c n e t . c o m
Quality Metrics (continued)
% Resolved Level 1 Capable
Definition: % Resolved Level 1 Capable is the percentage of tickets resolved by Desktop Support that could have been resolved by the Level 1 Service Desk. This metric is generally tracked by sampling tickets after the fact to determine the percentage that could have been resolved at Level 1, or by having the Desktop Support technician check a box when closing a ticket, to indicate that the ticket could have been resolved at Level 1.
Why it’s important: Tickets resolved by Desktop Support that could have been resolved by the Level 1 Service Desk represent defects. Since the cost of resolution is typically much higher at Desktop Support than it is for Level 1 support, every ticket that is unnecessarily escalated by Level 1 to Desktop Support incurs unnecessary costs. To minimize Total Cost of Ownership (TCO) for end-user support, the % Resolved Level 1 Capable should be as low as possible.
Key correlations: % Resolved Level 1 Capable is strongly correlated with the following metrics:
Average Incident Work Time
Tickets per Seat per Month
Incidents per Seat per Month
% 𝑹𝒆𝒔𝒐𝒍𝒗𝒆𝒅 𝑳𝒆𝒗𝒆𝒍 𝟏 𝑪𝒂𝒑𝒂𝒃𝒍𝒆 =𝑫𝒆𝒔𝒌𝒕𝒐𝒑 𝑺𝒖𝒑𝒑𝒐𝒓𝒕 𝒕𝒊𝒄𝒌𝒆𝒕𝒔 𝑳𝒆𝒗𝒆𝒍 𝟏 𝒄𝒐𝒖𝒍𝒅 𝒉𝒂𝒗𝒆 𝒓𝒆𝒔𝒐𝒍𝒗𝒆𝒅
𝑻𝒐𝒕𝒂𝒍 𝑫𝒆𝒔𝒌𝒕𝒐𝒑 𝑺𝒖𝒑𝒑𝒐𝒓𝒕 𝒕𝒊𝒄𝒌𝒆𝒕 𝒗𝒐𝒍𝒖𝒎𝒆
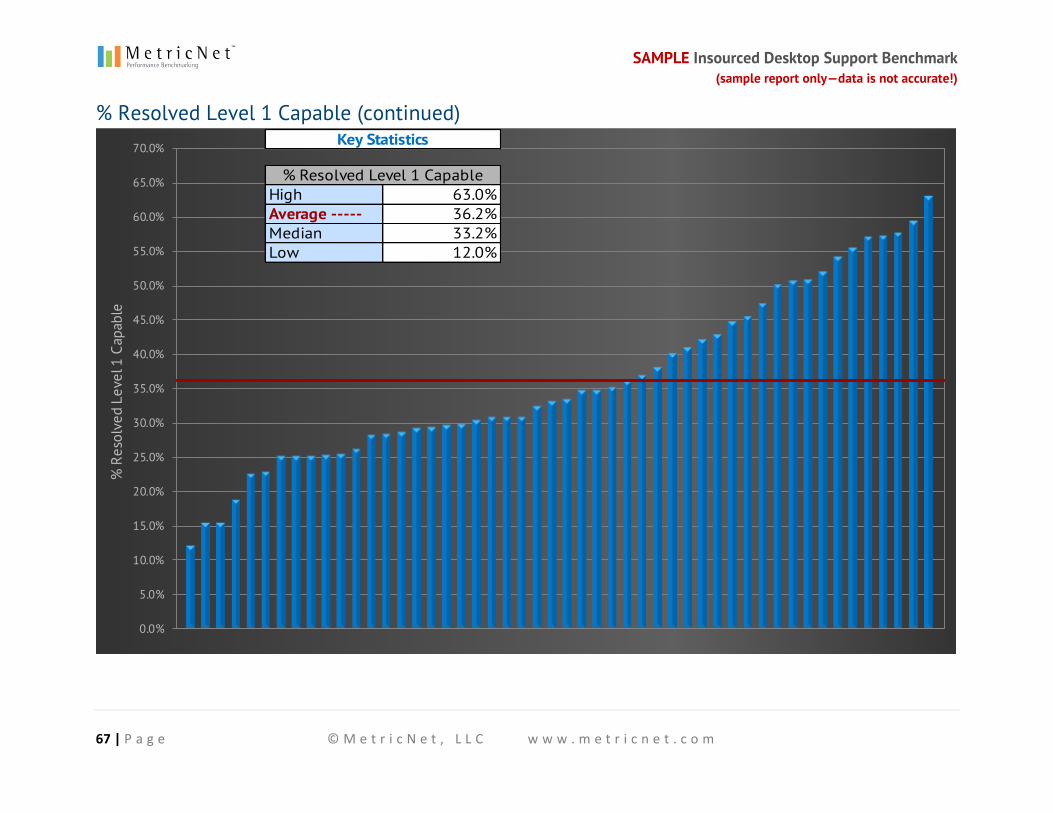
SAMPLE Insourced Desktop Support Benchmark (sample report only—data is not accurate!)
67 | P a g e © M e t r i c N e t , L L C w w w . m e t r i c n e t . c o m
% Resolved Level 1 Capable (continued)
0.0%
5.0%
10.0%
15.0%
20.0%
25.0%
30.0%
35.0%
40.0%
45.0%
50.0%
55.0%
60.0%
65.0%
70.0%
% R
esol
ved
Leve
l 1 C
apab
le
High 63.0%Average ----- 36.2%Median 33.2%Low 12.0%
Key Statistics
% Resolved Level 1 Capable
SAMPLE Insourced Desktop Support Benchmark (sample report only—data is not accurate!)
68 | P a g e © M e t r i c N e t , L L C w w w . m e t r i c n e t . c o m
Technician Metrics
Annual Technician Turnover
Definition: Annual Technician Turnover is the average percentage of technicians that leave Desktop Support, for any reason (voluntarily or involuntarily), in a year.
Why it’s important: Technician turnover is costly. Each time a technician leaves the organization, a new technician needs to be hired to replace the outgoing technician. This results in costly recruiting, hiring, and training expenses. Additionally, it is typically several weeks or even months before a technician is fully productive, so there is lost productivity associated with technician turnover as well. High technician turnover is generally associated with low technician morale in a Desktop Support organization.
Key correlations: Annual Technician Turnover is strongly correlated with the following metrics:
Daily Technician Absenteeism
Annual Technician Training Hours
Customer Satisfaction
Incident First Visit Resolution Rate
Cost per Ticket
Technician Job Satisfaction
𝑨𝒏𝒏𝒖𝒂𝒍 𝑻𝒆𝒄𝒉𝒏𝒊𝒄𝒊𝒂𝒏 𝑻𝒖𝒓𝒏𝒐𝒗𝒆𝒓 =𝑨𝒗𝒈. 𝒏𝒖𝒎𝒃𝒆𝒓 𝒐𝒇 𝒕𝒆𝒄𝒉𝒏𝒊𝒄𝒊𝒂𝒏𝒔 𝒕𝒉𝒂𝒕 𝒍𝒆𝒂𝒗𝒆 𝒑𝒆𝒓 𝒚𝒆𝒂𝒓
𝑨𝒗𝒈. 𝒕𝒐𝒕𝒂𝒍 𝒕𝒆𝒄𝒉𝒏𝒊𝒄𝒊𝒂𝒏 𝒉𝒆𝒂𝒅𝒄𝒐𝒖𝒏𝒕

SAMPLE Insourced Desktop Support Benchmark (sample report only—data is not accurate!)
69 | P a g e © M e t r i c N e t , L L C w w w . m e t r i c n e t . c o m
Annual Technician Turnover (continued)
0.0%
20.0%
40.0%
60.0%
80.0%
100.0%
120.0%
140.0%
160.0%
180.0%
200.0%
Annu
al T
echn
icia
n Tu
rnov
er
High 174.9%Average ----- 96.5%Median 94.3%Low 34.9%
Key Statistics
Annual Technician Turnover
SAMPLE Insourced Desktop Support Benchmark (sample report only—data is not accurate!)
70 | P a g e © M e t r i c N e t , L L C w w w . m e t r i c n e t . c o m
Technician Metrics (continued)
Daily Technician Absenteeism
Definition: Daily Technician Absenteeism is the average percentage of technicians with an unexcused absence on any given day. It is calculated by dividing the average number of unexcused absent technicians per day by the average total number of technicians per day that are scheduled to be at work.
Why it’s important: High Technician Absenteeism is problematic because it makes it difficult for a Desktop Support organization to schedule resources efficiently. High absenteeism can severely harm Desktop Support ’s operating performance and increase the likelihood that service-level targets will be missed. Mean Time to Resolve Incidents and Mean Time to Fulfill Service Requests will typically suffer when absenteeism is high. Also, chronically high absenteeism is often a sign of low technician morale.
Key correlations: Daily Technician Absenteeism is strongly correlated with the following metrics:
Annual Technician Turnover
Technician Job Satisfaction
Technician Utilization
Cost per Ticket
Tickets per Technician per Month
𝑫𝒂𝒊𝒍𝒚 𝑻𝒆𝒄𝒉𝒏𝒊𝒄𝒊𝒂𝒏 𝑨𝒃𝒔𝒆𝒏𝒕𝒆𝒆𝒊𝒔𝒎 =𝑨𝒗𝒈. 𝒖𝒏𝒆𝒙𝒄𝒖𝒔𝒆𝒅 𝒂𝒃𝒔𝒆𝒏𝒕 𝒕𝒆𝒄𝒉𝒏𝒊𝒄𝒊𝒂𝒏𝒔 𝒑𝒆𝒓 𝒅𝒂𝒚
𝑨𝒗𝒈. 𝒕𝒆𝒄𝒉𝒏𝒊𝒄𝒊𝒂𝒏𝒔 𝒔𝒄𝒉𝒆𝒅𝒖𝒍𝒆𝒅 𝒕𝒐 𝒘𝒐𝒓𝒌 𝒑𝒆𝒓 𝒅𝒂𝒚
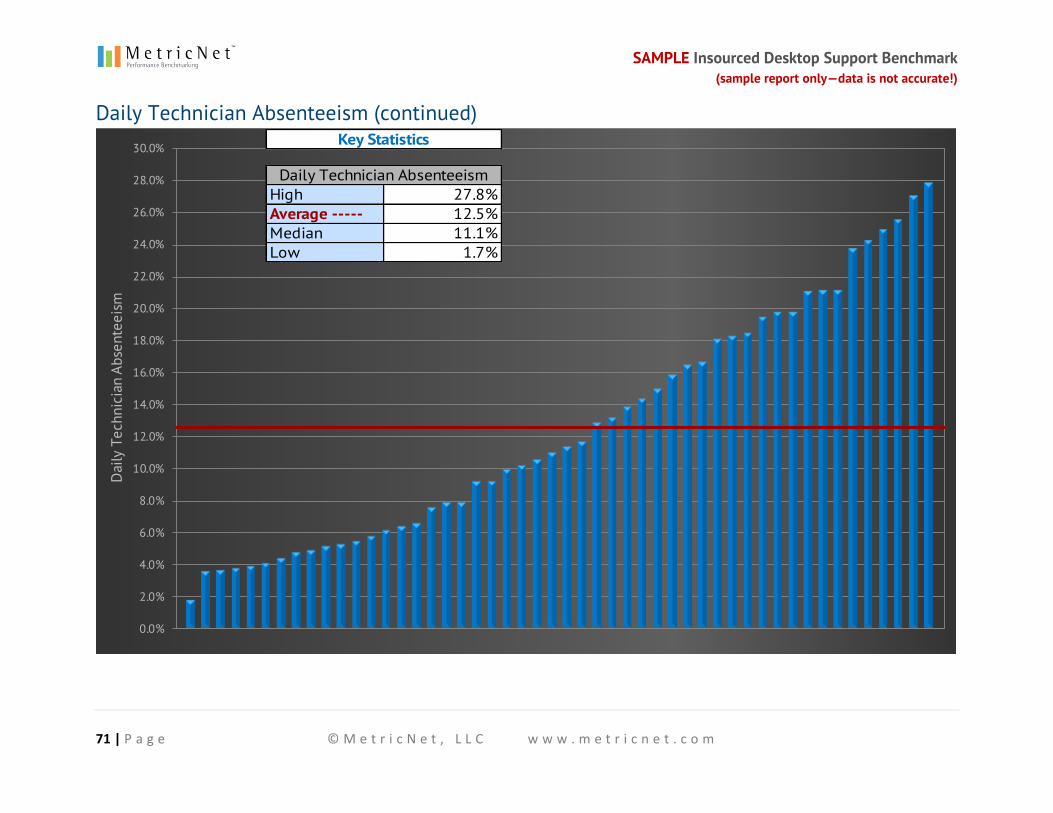
SAMPLE Insourced Desktop Support Benchmark (sample report only—data is not accurate!)
71 | P a g e © M e t r i c N e t , L L C w w w . m e t r i c n e t . c o m
Daily Technician Absenteeism (continued)
0.0%
2.0%
4.0%
6.0%
8.0%
10.0%
12.0%
14.0%
16.0%
18.0%
20.0%
22.0%
24.0%
26.0%
28.0%
30.0%
Dai
ly T
echn
icia
n Ab
sent
eeis
m
High 27.8%Average ----- 12.5%Median 11.1%Low 1.7%
Key Statistics
Daily Technician Absenteeism
SAMPLE Insourced Desktop Support Benchmark (sample report only—data is not accurate!)
72 | P a g e © M e t r i c N e t , L L C w w w . m e t r i c n e t . c o m
Technician Metrics (continued)
New Technician Training Hours
Definition: The name of this metric is somewhat self-explanatory. New Technician Training Hours is the number of training hours (including classroom, computer-based training, self-study, shadowing, being coached, and on-the-job training) that a new technician receives before he or she is allowed to handle Desktop Support tickets independently.
Why it’s important: New Technician Training Hours are strongly correlated with Customer Satisfaction and Incident First Visit Resolution Rate, especially during a technician ’s first few months on the job. The more training that new technicians receive, the higher that Customer Satisfaction and Incident First Visit Resolution will typically be. This, in turn, has a positive effect on other performance metrics. Perhaps most importantly, training levels strongly impact technician morale—technicians who receive more training typically have higher levels of job satisfaction.
Key correlations: New Technician Training Hours are strongly correlated with the following metrics:
Incident First Visit Resolution Rate
Customer Satisfaction
Average Incident Work Time
Average Service Request Work Time
Technician Job Satisfaction
𝑵𝒆𝒘 𝑻𝒆𝒄𝒉𝒏𝒊𝒄𝒊𝒂𝒏 𝑻𝒓𝒂𝒊𝒏𝒊𝒏𝒈 𝑯𝒐𝒖𝒓𝒔 = 𝑨𝒗𝒆𝒓𝒂𝒈𝒆 𝒏𝒖𝒎𝒃𝒆𝒓 𝒐𝒇 𝒕𝒓𝒂𝒊𝒏𝒊𝒏𝒈 𝒉𝒐𝒖𝒓𝒔
𝒓𝒆𝒒𝒖𝒊𝒓𝒆𝒅 𝒃𝒆𝒇𝒐𝒓𝒆 𝒂 𝒏𝒆𝒘 𝒕𝒆𝒄𝒉𝒏𝒊𝒄𝒊𝒂𝒏 𝒎𝒂𝒚 𝒉𝒂𝒏𝒅𝒍𝒆 𝒕𝒊𝒄𝒌𝒆𝒕𝒔 𝒊𝒏𝒅𝒆𝒑𝒆𝒏𝒅𝒆𝒏𝒕𝒍𝒚

SAMPLE Insourced Desktop Support Benchmark (sample report only—data is not accurate!)
73 | P a g e © M e t r i c N e t , L L C w w w . m e t r i c n e t . c o m
New Technician Training Hours (continued)
0
10
20
30
40
50
60
70
80
90
100
110
120
130
140
New
Tec
hnic
ian
Trai
ning
Hou
rs
High 128Average ----- 36Median 27Low 0
Key Statistics
New Technician Training Hours
SAMPLE Insourced Desktop Support Benchmark (sample report only—data is not accurate!)
74 | P a g e © M e t r i c N e t , L L C w w w . m e t r i c n e t . c o m
Technician Metrics (continued)
Annual Technician Training Hours
Definition: Annual Technician Training Hours is the average number of training hours (including classroom, computer-based training, self-study, shadowing, etc.) that a technician receives on an annual basis. This number includes any training hours that a technician receives that are not part of the technician ’s initial (new-technician) training. But it does not include routine team meetings, shift handoffs, or other activities that do not involve formal training.
Why it’s important: Annual Technician Training Hours are strongly correlated with Incident First Visit Resolution Rate and Customer Satisfaction. Perhaps most importantly, training levels strongly impact technician morale—technicians who receive more training typically have higher levels of job satisfaction.
Key correlations: Annual Technician Training Hours are strongly correlated with the following metrics:
Incident First Visit Resolution Rate
Customer Satisfaction
Average Incident Work Time
Average Service Request Work Time
Technician Job Satisfaction
𝑨𝒏𝒏𝒖𝒂𝒍 𝑻𝒆𝒄𝒉𝒏𝒊𝒄𝒊𝒂𝒏 𝑻𝒓𝒂𝒊𝒏𝒊𝒏𝒈 𝑯𝒐𝒖𝒓𝒔 = 𝑨𝒗𝒆𝒓𝒂𝒈𝒆 𝒏𝒖𝒎𝒃𝒆𝒓 𝒐𝒇 𝒇𝒐𝒓𝒎𝒂𝒍 𝒕𝒓𝒂𝒊𝒏𝒊𝒏𝒈
𝒉𝒐𝒖𝒓𝒔 𝒑𝒆𝒓 𝒕𝒆𝒄𝒉𝒏𝒊𝒄𝒊𝒂𝒏 𝒑𝒆𝒓 𝒚𝒆𝒂𝒓, 𝒆𝒙𝒄𝒍𝒖𝒅𝒊𝒏𝒈 𝒏𝒆𝒘– 𝒕𝒆𝒄𝒉𝒏𝒊𝒄𝒊𝒂𝒏 𝒕𝒓𝒂𝒊𝒏𝒊𝒏𝒈
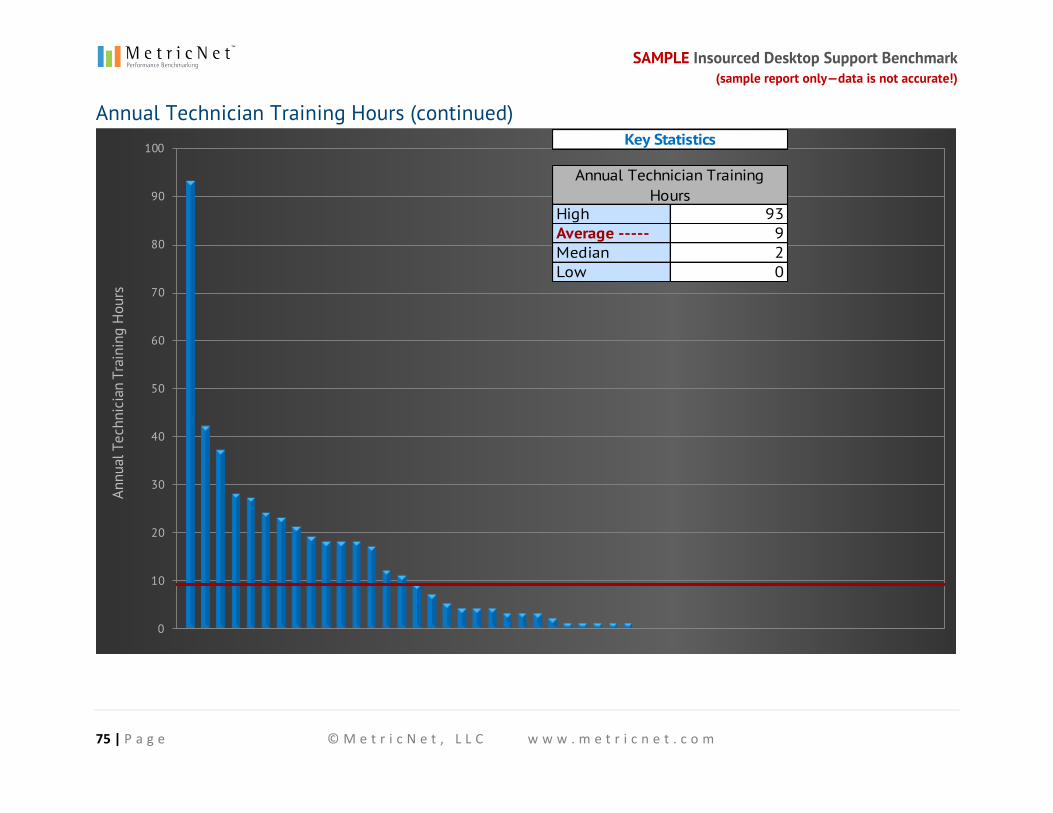
SAMPLE Insourced Desktop Support Benchmark (sample report only—data is not accurate!)
75 | P a g e © M e t r i c N e t , L L C w w w . m e t r i c n e t . c o m
Annual Technician Training Hours (continued)
0
10
20
30
40
50
60
70
80
90
100
Annu
al T
echn
icia
n Tr
aini
ng H
ours
High 93Average ----- 9Median 2Low 0
Key Statistics
Annual Technician Training Hours
SAMPLE Insourced Desktop Support Benchmark (sample report only—data is not accurate!)
76 | P a g e © M e t r i c N e t , L L C w w w . m e t r i c n e t . c o m
Technician Metrics (continued)
Technician Tenure
Definition: Technician Tenure is the average number of months that each technician has worked in a particular Desktop Support organization.
Why it’s important: Technician Tenure is a measure of technician experience. Almost every metric related to Desktop Support cost and quality is impacted by the level of experience the technicians have.
Key correlations: Technician Tenure is strongly correlated with the following metrics:
Cost per Ticket
Customer Satisfaction
Incident First Visit Resolution Rate
Annual Technician Turnover
Technician Training Hours
Technician Coaching Hours
Average Incident Work Time
Average Service Request Work Time
Technician Job Satisfaction
𝑻𝒆𝒄𝒉𝒏𝒊𝒄𝒊𝒂𝒏 𝑻𝒆𝒏𝒖𝒓𝒆 = 𝑨𝒗𝒆𝒓𝒂𝒈𝒆 𝒏𝒖𝒎𝒃𝒆𝒓 𝒐𝒇 𝒎𝒐𝒏𝒕𝒉𝒔 𝒕𝒉𝒂𝒕 𝒆𝒂𝒄𝒉
𝒕𝒆𝒄𝒉𝒏𝒊𝒄𝒊𝒂𝒏 𝒉𝒂𝒔 𝒘𝒐𝒓𝒌𝒆𝒅 𝒊𝒏 𝒚𝒐𝒖𝒓 𝑫𝒆𝒔𝒌𝒕𝒐𝒑 𝑺𝒖𝒑𝒑𝒐𝒓𝒕 𝒐𝒓𝒈𝒂𝒏𝒊𝒛𝒂𝒕𝒊𝒐𝒏
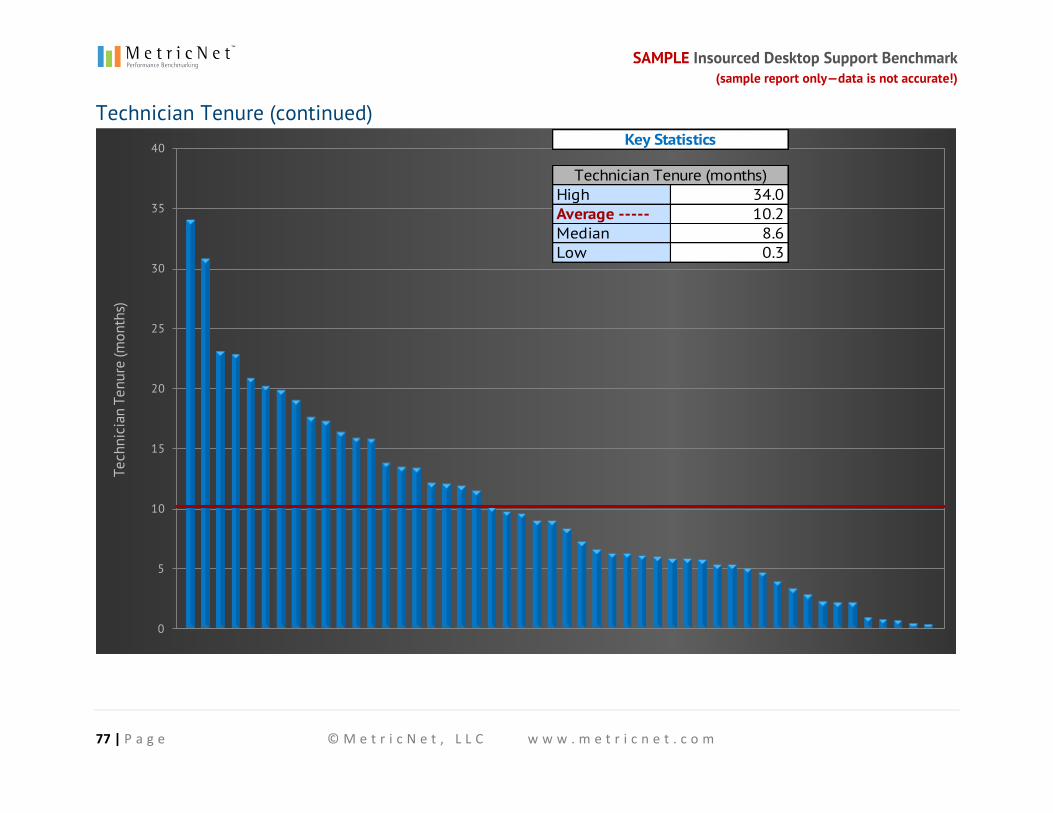
SAMPLE Insourced Desktop Support Benchmark (sample report only—data is not accurate!)
77 | P a g e © M e t r i c N e t , L L C w w w . m e t r i c n e t . c o m
Technician Tenure (continued)
0
5
10
15
20
25
30
35
40
Tech
nici
an T
enur
e (m
onth
s)
High 34.0Average ----- 10.2Median 8.6Low 0.3
Key Statistics
Technician Tenure (months)
SAMPLE Insourced Desktop Support Benchmark (sample report only—data is not accurate!)
78 | P a g e © M e t r i c N e t , L L C w w w . m e t r i c n e t . c o m
Technician Metrics (continued)
Technician Job Satisfaction
Definition: Technician Job Satisfaction is the percentage of technicians in a Desktop Support organization who are either satisfied or very satisfied with their jobs.
Why it’s important: Technician Job Satisfaction is a proxy for technician morale. And morale, while difficult to measure, affects performance on almost every metric in Desktop Support. High-performance Desktop Support organizations almost always have high levels of Technician Job Satisfaction. A Desktop Support organization can control and improve its performance on this metric through training, coaching, and career pathing.
Key correlations: Technician Job Satisfaction is strongly correlated with the following metrics:
Annual Technician Turnover
Daily Technician Absenteeism
Technician Training Hours
Technician Coaching Hours
Customer Satisfaction
Incident First Visit Resolution Rate
Average Incident Work Time
Average Service Request Work Time
Cost per Ticket
𝑻𝒆𝒄𝒉𝒏𝒊𝒄𝒊𝒂𝒏 𝑱𝒐𝒃 𝑺𝒂𝒕𝒊𝒔𝒇𝒂𝒄𝒕𝒊𝒐𝒏 =𝑵𝒖𝒎𝒃𝒆𝒓 𝒐𝒇 𝒔𝒂𝒕𝒊𝒔𝒇𝒊𝒆𝒅 𝒐𝒓 𝒗𝒆𝒓𝒚 𝒔𝒂𝒕𝒊𝒔𝒇𝒊𝒆𝒅 𝒕𝒆𝒄𝒉𝒔
𝑻𝒐𝒕𝒂𝒍 𝒏𝒖𝒎𝒃𝒆𝒓 𝒐𝒇 𝒕𝒆𝒄𝒉𝒔
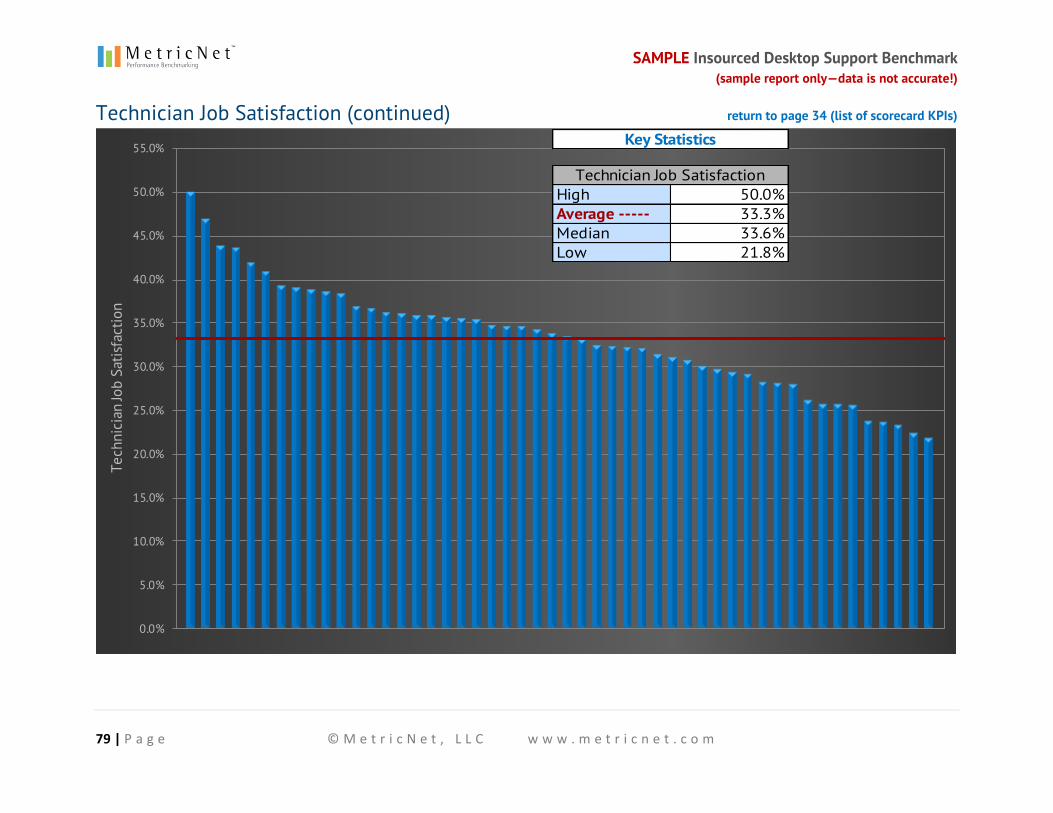
SAMPLE Insourced Desktop Support Benchmark (sample report only—data is not accurate!)
79 | P a g e © M e t r i c N e t , L L C w w w . m e t r i c n e t . c o m
Technician Job Satisfaction (continued) return to page 34 (list of scorecard KPIs)
0.0%
5.0%
10.0%
15.0%
20.0%
25.0%
30.0%
35.0%
40.0%
45.0%
50.0%
55.0%
Tech
nici
an Jo
b Sa
tisfa
ctio
n
High 50.0%Average ----- 33.3%Median 33.6%Low 21.8%
Key Statistics
Technician Job Satisfaction
SAMPLE Insourced Desktop Support Benchmark (sample report only—data is not accurate!)
80 | P a g e © M e t r i c N e t , L L C w w w . m e t r i c n e t . c o m
Ticket Handling Metrics
Average Incident Work Time
Definition: Average Incident Work Time is the average time (in minutes) that a technician spends to resolve an incident. This does not include travel time to and from the customer, or time between visits if multiple visits are required to the user’s desktop to resolve an incident. It includes only the time that a technician spends actually working on an incident.
Why it’s important: Incident Work Time is one of the basic units of work in Desktop Support. Average Incident Work Time, therefore, represents the amount of labor required to complete one unit of work.
Key correlations: Average Incident Work Time is strongly correlated with the following metrics:
Cost per Incident
Incidents per Technician per Month
Incident First Visit Resolution Rate
𝑨𝒗𝒆𝒓𝒂𝒈𝒆 𝑰𝒏𝒄𝒊𝒅𝒆𝒏𝒕 𝑾𝒐𝒓𝒌 𝑻𝒊𝒎𝒆 =𝑻𝒐𝒕𝒂𝒍 𝒎𝒊𝒏𝒖𝒕𝒆𝒔 𝒔𝒑𝒆𝒏𝒕 𝒘𝒐𝒓𝒌𝒊𝒏𝒈 𝒐𝒏 𝒊𝒏𝒄𝒊𝒅𝒆𝒏𝒕𝒔
𝑻𝒐𝒕𝒂𝒍 𝒊𝒏𝒄𝒊𝒅𝒆𝒏𝒕 𝒗𝒐𝒍𝒖𝒎𝒆
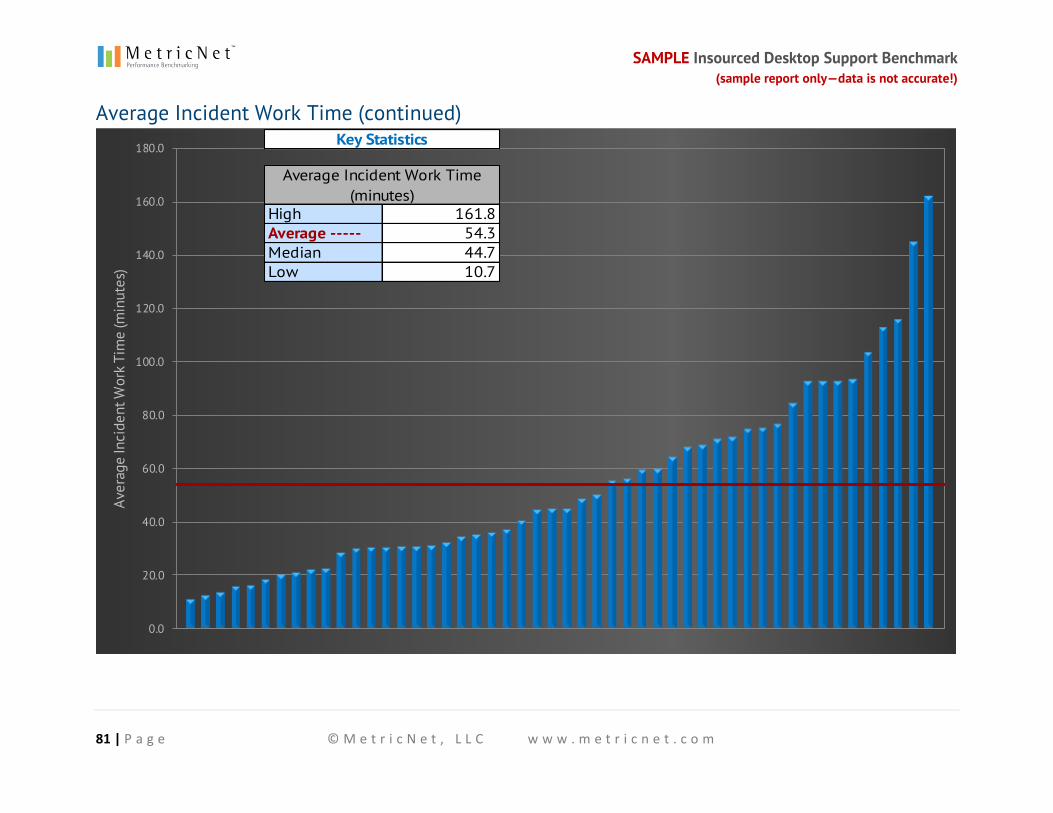
SAMPLE Insourced Desktop Support Benchmark (sample report only—data is not accurate!)
81 | P a g e © M e t r i c N e t , L L C w w w . m e t r i c n e t . c o m
Average Incident Work Time (continued)
0.0
20.0
40.0
60.0
80.0
100.0
120.0
140.0
160.0
180.0
Aver
age
Inci
dent
Wor
k Ti
me
(min
utes
)
High 161.8Average ----- 54.3Median 44.7Low 10.7
Key Statistics
Average Incident Work Time (minutes)
SAMPLE Insourced Desktop Support Benchmark (sample report only—data is not accurate!)
82 | P a g e © M e t r i c N e t , L L C w w w . m e t r i c n e t . c o m
Ticket Handling Metrics (continued)
Average Service Request Work Time
Definition: Average Service Request Work Time is the average time (in minutes) that a technician spends to fulfill a service request. This does not include travel time to and from the customer, or time between visits if multiple visits are required to fulfill a service request. It includes only the time that a technician spends actually fulfilling a service request.
Why it’s important: Service Request Work Time is one of the basic units of work in Desktop Support. Average Service Request Work Time, therefore, represents the amount of labor required to complete one unit of work.
Key correlations: Average Service Request Work Time is strongly correlated with the following metrics:
Cost per Service Request
Service Requests per Technician per Month
𝑨𝒗𝒈. 𝑺𝒆𝒓𝒗𝒊𝒄𝒆 𝑹𝒆𝒒𝒖𝒆𝒔𝒕 𝑾𝒐𝒓𝒌 𝑻𝒊𝒎𝒆 =𝑻𝒐𝒕𝒂𝒍 𝒎𝒊𝒏𝒖𝒕𝒆𝒔 𝒔𝒑𝒆𝒏𝒕 𝒇𝒖𝒍𝒇𝒊𝒍𝒍𝒊𝒏𝒈 𝒔𝒗𝒄. 𝒓𝒆𝒒𝒖𝒆𝒔𝒕𝒔
𝑻𝒐𝒕𝒂𝒍 𝒔𝒗𝒄. 𝒓𝒆𝒒𝒖𝒆𝒔𝒕 𝒗𝒐𝒍𝒖𝒎𝒆
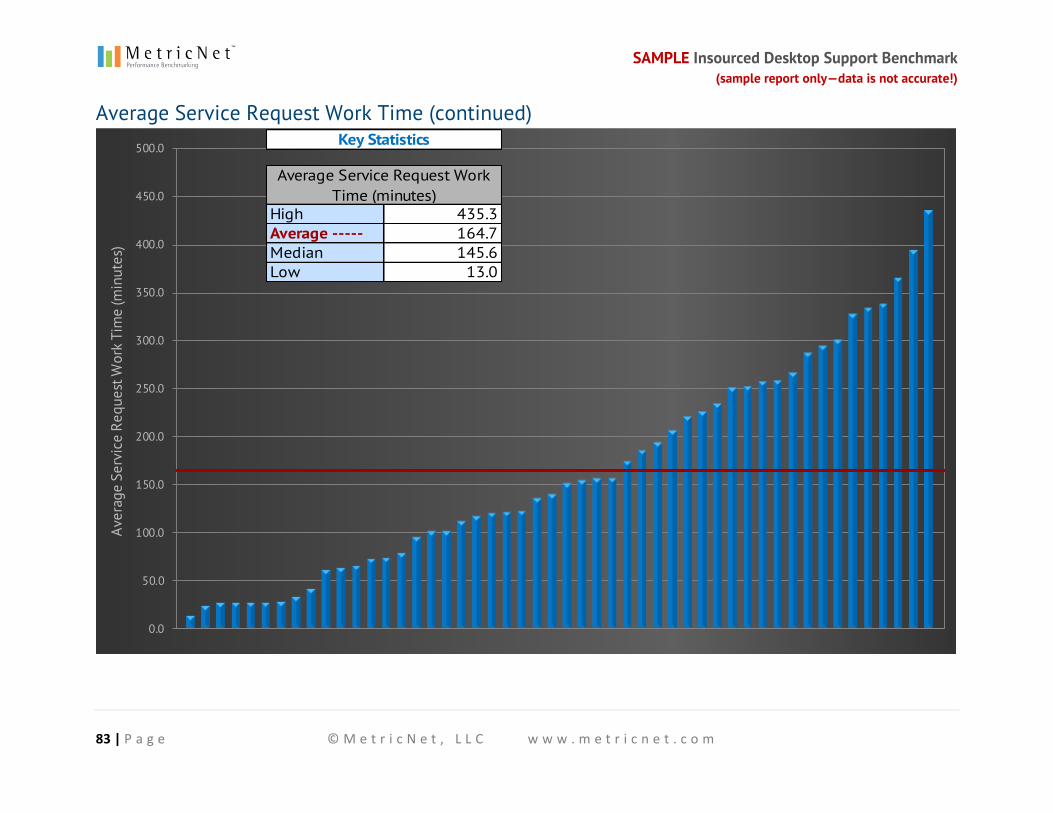
SAMPLE Insourced Desktop Support Benchmark (sample report only—data is not accurate!)
83 | P a g e © M e t r i c N e t , L L C w w w . m e t r i c n e t . c o m
Average Service Request Work Time (continued)
0.0
50.0
100.0
150.0
200.0
250.0
300.0
350.0
400.0
450.0
500.0
Aver
age
Serv
ice
Requ
est W
ork
Tim
e (m
inut
es)
High 435.3Average ----- 164.7Median 145.6Low 13.0
Key Statistics
Average Service Request Work Time (minutes)
SAMPLE Insourced Desktop Support Benchmark (sample report only—data is not accurate!)
84 | P a g e © M e t r i c N e t , L L C w w w . m e t r i c n e t . c o m
Ticket Handling Metrics (continued)
Average Travel Time per Ticket
Definition: Average Travel Time per Ticket is the average round-trip travel time to get to and from the site of a user or device being serviced. In a high-density user environment (e.g., a high-rise office building) the Average Travel Time per Ticket will typically be less than 20 minutes. By contrast, in a more distributed user environment (e.g., field or campus locations), the Average Travel Time per Ticket will be correspondingly longer.
Why it’s important: Unlike the Level 1 Service Desk, where support is provided remotely, Desktop Support, by definition, requires onsite support. Getting to and from the site of a ticket can be very time consuming and will affect the number of tickets that a technician can handle in a day or a month. This, in turn, affects the staffing level required in the Desktop Support organization.
Key correlations: Average Travel Time per Ticket is strongly correlated with the following metrics:
Cost per Ticket
Incidents per Technician per Month
Service Requests per Technician per Month
𝑨𝒗𝒈. 𝑻𝒓𝒂𝒗𝒆𝒍 𝑻𝒊𝒎𝒆 𝒑𝒆𝒓 𝑻𝒊𝒄𝒌𝒆𝒕 =𝑻𝒐𝒕𝒂𝒍 𝒎𝒊𝒏𝒖𝒕𝒆𝒔 𝒕𝒓𝒂𝒗𝒆𝒍𝒊𝒏𝒈 𝒕𝒐/𝒇𝒓𝒐𝒎 𝒕𝒊𝒄𝒌𝒆𝒕 𝒘𝒐𝒓𝒌𝒔𝒊𝒕𝒆𝒔
𝑻𝒐𝒕𝒂𝒍 𝒕𝒊𝒄𝒌𝒆𝒕 𝒗𝒐𝒍𝒖𝒎𝒆
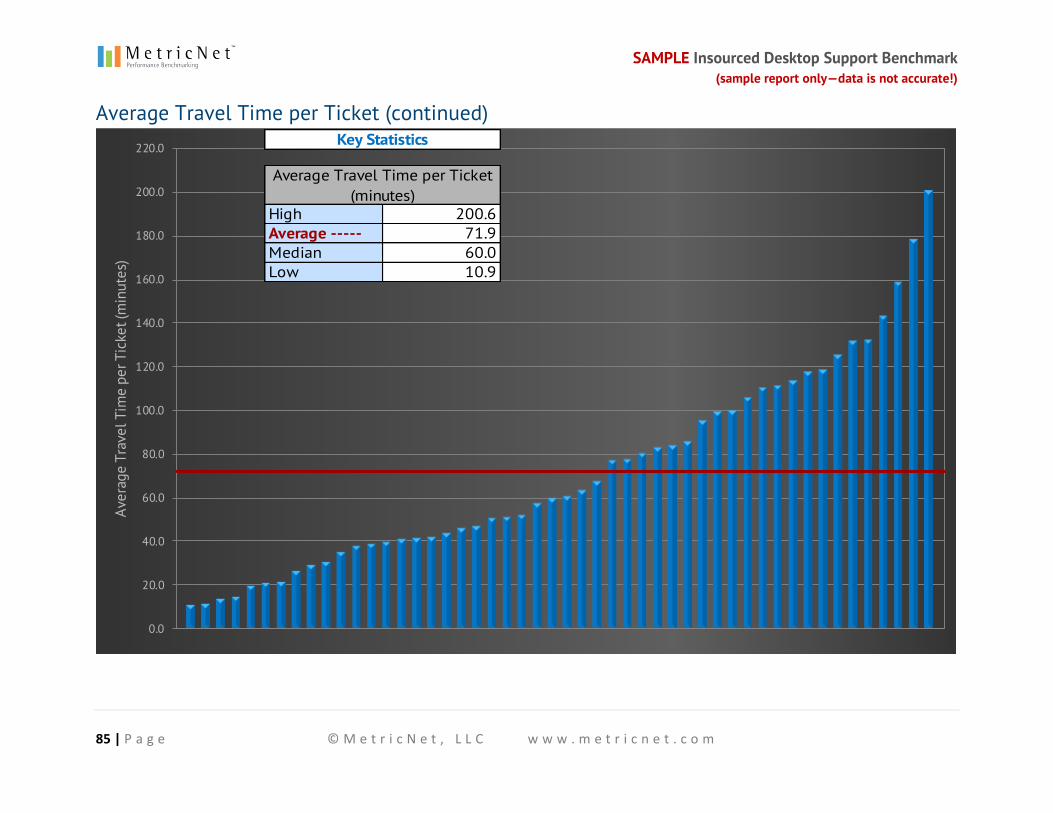
SAMPLE Insourced Desktop Support Benchmark (sample report only—data is not accurate!)
85 | P a g e © M e t r i c N e t , L L C w w w . m e t r i c n e t . c o m
Average Travel Time per Ticket (continued)
0.0
20.0
40.0
60.0
80.0
100.0
120.0
140.0
160.0
180.0
200.0
220.0
Aver
age
Trav
el T
ime
per T
icke
t (m
inut
es)
High 200.6Average ----- 71.9Median 60.0Low 10.9
Key Statistics
Average Travel Time per Ticket (minutes)
SAMPLE Insourced Desktop Support Benchmark (sample report only—data is not accurate!)
86 | P a g e © M e t r i c N e t , L L C w w w . m e t r i c n e t . c o m
Workload Metrics
Tickets per Seat per Month
Definition: Tickets per Seat per Month measures the volume of Desktop Support work generated by a given user population. The number of Tickets per Seat per Month can vary dramatically from one organization to another, driven by factors such as the age of devices being supported, the number of laptop computers, the number of other mobile devices, the location of users (office, home, field), and myriad other factors.
Why it’s important: The number of Tickets per Seat per Month will drive the workload, and hence the staffing for a Desktop Support organization. Desktop Support staffing decisions should be based on this metric, rather than on the number of users being supported.
Key correlations: Tickets per Seat per Month is strongly correlated with the following metrics:
Incidents per Seat per Month
Service Requests per Seat per Month
𝑻𝒊𝒄𝒌𝒆𝒕𝒔 𝒑𝒆𝒓 𝑺𝒆𝒂𝒕 𝒑𝒆𝒓 𝑴𝒐𝒏𝒕𝒉 =𝑨𝒗𝒈. 𝒕𝒐𝒕𝒂𝒍 𝒎𝒐𝒏𝒕𝒉𝒍𝒚 𝒕𝒊𝒄𝒌𝒆𝒕 𝒗𝒐𝒍𝒖𝒎𝒆
𝑨𝒗𝒈. 𝒕𝒐𝒕𝒂𝒍 𝒏𝒖𝒎𝒃𝒆𝒓 𝒐𝒇 𝒔𝒆𝒂𝒕𝒔 𝒔𝒖𝒑𝒑𝒐𝒓𝒕𝒆𝒅
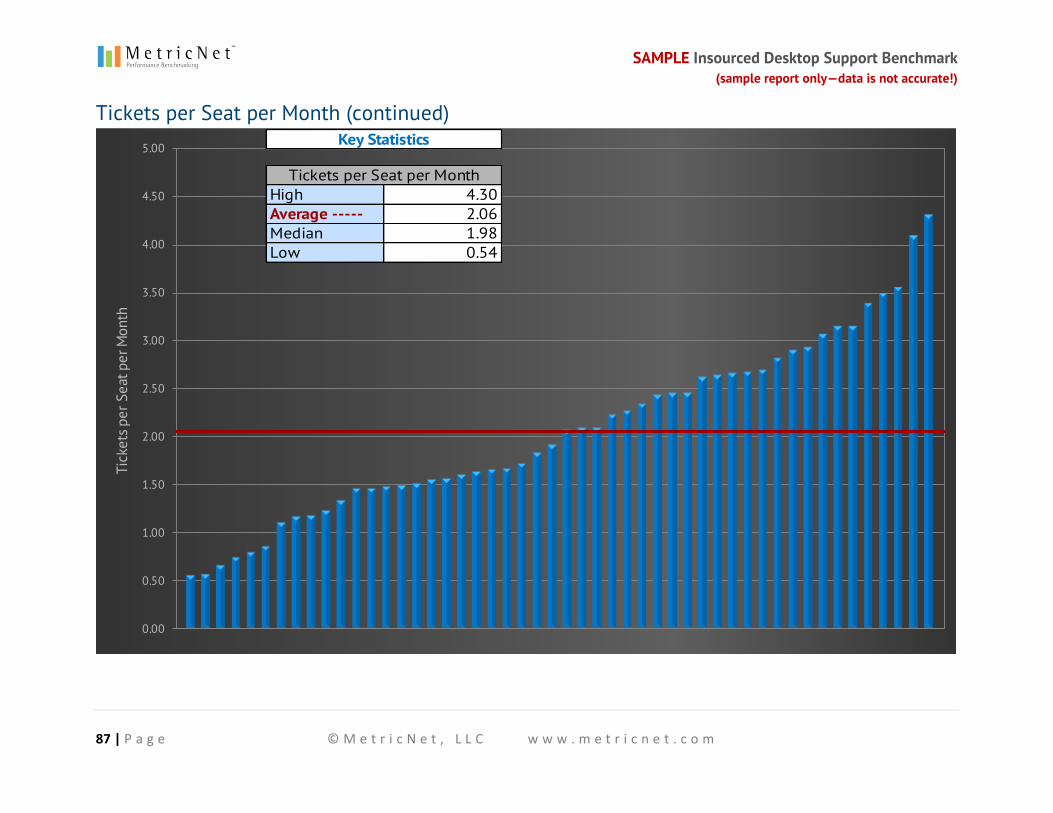
SAMPLE Insourced Desktop Support Benchmark (sample report only—data is not accurate!)
87 | P a g e © M e t r i c N e t , L L C w w w . m e t r i c n e t . c o m
Tickets per Seat per Month (continued)
0.00
0.50
1.00
1.50
2.00
2.50
3.00
3.50
4.00
4.50
5.00
Tick
ets p
er S
eat p
er M
onth
High 4.30Average ----- 2.06Median 1.98Low 0.54
Key Statistics
Tickets per Seat per Month
SAMPLE Insourced Desktop Support Benchmark (sample report only—data is not accurate!)
88 | P a g e © M e t r i c N e t , L L C w w w . m e t r i c n e t . c o m
Workload Metrics (continued)
Incidents per Seat per Month
Definition: Incidents per Seat per Month is a key measure of the volume of Desktop Support work generated by a given user population. The number of Incidents per Seat per Month can vary dramatically from one organization to another, driven by factors such as the age of devices being supported, the number of laptop computers, the number of other mobile devices, the location of users (office, home, field), and myriad other factors.
Why it’s important: The number of Incidents per Seat per Month is a major workload driver, and will therefore have a strong impact on staffing decisions for Desktop Support.
Key correlations: Incidents per Seat per Month is strongly correlated with the following metrics:
Tickets per Seat per Month
𝑰𝒏𝒄𝒊𝒅𝒆𝒏𝒕𝒔 𝒑𝒆𝒓 𝑺𝒆𝒂𝒕 𝒑𝒆𝒓 𝑴𝒐𝒏𝒕𝒉 =𝑨𝒗𝒈. 𝒕𝒐𝒕𝒂𝒍 𝒎𝒐𝒏𝒕𝒉𝒍𝒚 𝒊𝒏𝒄𝒊𝒅𝒆𝒏𝒕 𝒗𝒐𝒍𝒖𝒎𝒆
𝑨𝒗𝒈. 𝒕𝒐𝒕𝒂𝒍 𝒏𝒖𝒎𝒃𝒆𝒓 𝒐𝒇 𝒔𝒆𝒂𝒕𝒔 𝒔𝒖𝒑𝒑𝒐𝒓𝒕𝒆𝒅
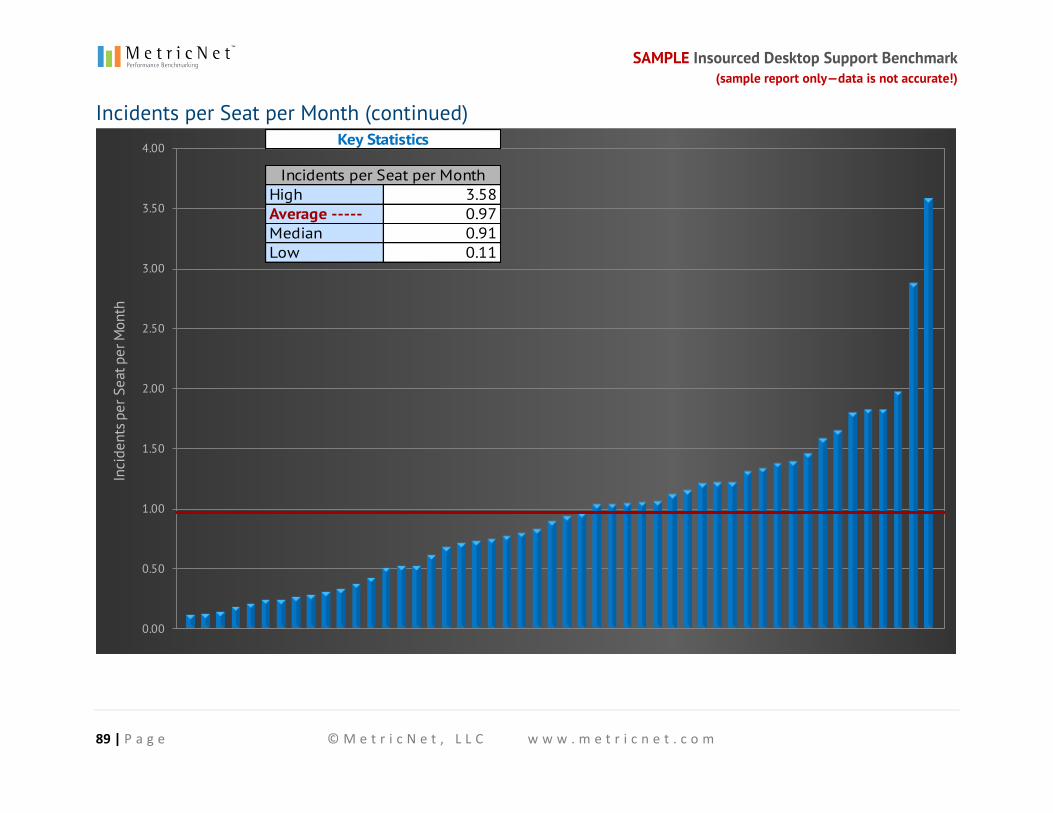
SAMPLE Insourced Desktop Support Benchmark (sample report only—data is not accurate!)
89 | P a g e © M e t r i c N e t , L L C w w w . m e t r i c n e t . c o m
Incidents per Seat per Month (continued)
0.00
0.50
1.00
1.50
2.00
2.50
3.00
3.50
4.00
Inci
dent
s per
Sea
t per
Mon
th
High 3.58Average ----- 0.97Median 0.91Low 0.11
Key Statistics
Incidents per Seat per Month
SAMPLE Insourced Desktop Support Benchmark (sample report only—data is not accurate!)
90 | P a g e © M e t r i c N e t , L L C w w w . m e t r i c n e t . c o m
Workload Metrics (continued)
Service Requests per Seat per Month
Definition: Service Requests per Seat per Month is a key measure of the volume of Desktop Support work generated by a given user population. The number of Service Requests per Seat per Month can vary dramatically from one organization to another, driven by factors such as the number of move/add/change requests, the age of devices being supported, the frequency of device refreshes, the location of users (office, home, field), and myriad other factors.
Why it’s important: The number of Service Requests per Seat per Month is a major workload driver, and will therefore have a strong impact on staffing decisions for Desktop Support.
Key correlations: Service Requests per Seat per Month is strongly correlated with the following metrics:
Tickets per Seat per Month
𝑺𝒆𝒓𝒗𝒊𝒄𝒆 𝑹𝒆𝒒𝒖𝒆𝒔𝒕𝒔 𝒑𝒆𝒓 𝑺𝒆𝒂𝒕 𝒑𝒆𝒓 𝑴𝒐𝒏𝒕𝒉 =𝑨𝒗𝒈. 𝒕𝒐𝒕𝒂𝒍 𝒎𝒐𝒏𝒕𝒉𝒍𝒚 𝒔𝒗𝒄. 𝒓𝒆𝒒𝒖𝒆𝒔𝒕 𝒗𝒐𝒍𝒖𝒎𝒆
𝑨𝒗𝒈. 𝒕𝒐𝒕𝒂𝒍 𝒏𝒖𝒎𝒃𝒆𝒓 𝒐𝒇 𝒔𝒆𝒂𝒕𝒔 𝒔𝒖𝒑𝒑𝒐𝒓𝒕𝒆𝒅

SAMPLE Insourced Desktop Support Benchmark (sample report only—data is not accurate!)
91 | P a g e © M e t r i c N e t , L L C w w w . m e t r i c n e t . c o m
Service Requests per Seat per Month (continued)
0.00
0.50
1.00
1.50
2.00
2.50
3.00
3.50
Serv
ice
Requ
ests
per
Sea
t per
Mon
th
High 2.98Average ----- 1.08Median 0.87Low 0.09
Key Statistics
Service Requests per Seat per Month
SAMPLE Insourced Desktop Support Benchmark (sample report only—data is not accurate!)
92 | P a g e © M e t r i c N e t , L L C w w w . m e t r i c n e t . c o m
Workload Metrics (continued)
Incidents as a % of Total Ticket Volume
Definition: Incidents as a % of Total Ticket Volume is a fairly self-explanatory metric. It indicates the mix of work (incidents vs. service requests) handled by a Desktop Support organization. Most Desktop Support organizations receive more incidents than service requests. Since incidents are generally less costly to resolve than service requests, the higher that Incidents as a % of Total Ticket Volume is, the lower the Cost per Ticket will be.
Why it’s important: Incidents are generally unplanned work (e.g., device break/fix), while the majority of service requests are planned work (e.g., move/add/change). Incidents as a % of Total Ticket Volume therefore measures the percentage of Desktop Support work that is made up of unplanned work (incidents).
Key correlations: Incidents as a % of Total Ticket Volume is strongly correlated with the following metrics:
Cost per Ticket
Tickets per Technician per Month
𝑰𝒏𝒄𝒊𝒅𝒆𝒏𝒕𝒔 𝒂𝒔 𝒂 % 𝒐𝒇 𝑻𝒐𝒕𝒂𝒍 𝑻𝒊𝒄𝒌𝒆𝒕 𝑽𝒐𝒍𝒖𝒎𝒆 =𝑻𝒐𝒕𝒂𝒍 𝒊𝒏𝒄𝒊𝒅𝒆𝒏𝒕 𝒗𝒐𝒍𝒖𝒎𝒆
𝑻𝒐𝒕𝒂𝒍 𝒕𝒊𝒄𝒌𝒆𝒕 𝒗𝒐𝒍𝒖𝒎𝒆
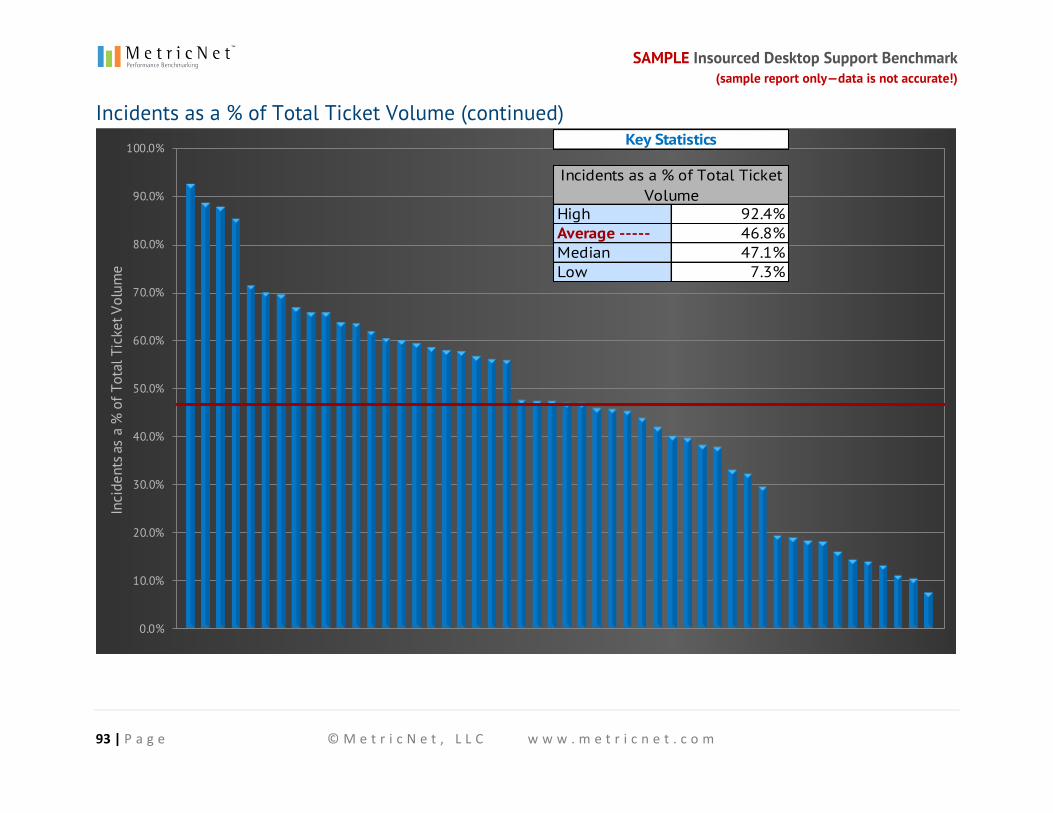
SAMPLE Insourced Desktop Support Benchmark (sample report only—data is not accurate!)
93 | P a g e © M e t r i c N e t , L L C w w w . m e t r i c n e t . c o m
Incidents as a % of Total Ticket Volume (continued)
0.0%
10.0%
20.0%
30.0%
40.0%
50.0%
60.0%
70.0%
80.0%
90.0%
100.0%
Inci
dent
s as
a %
of T
otal
Tic
ket V
olum
e
High 92.4%Average ----- 46.8%Median 47.1%Low 7.3%
Key Statistics
Incidents as a % of Total Ticket Volume

SAMPLE Insourced Desktop Support Benchmark (sample report only—data is not accurate!)
94 | P a g e © M e t r i c N e t , L L C w w w . m e t r i c n e t . c o m
IMPORTANT KPI CORRELATIONS
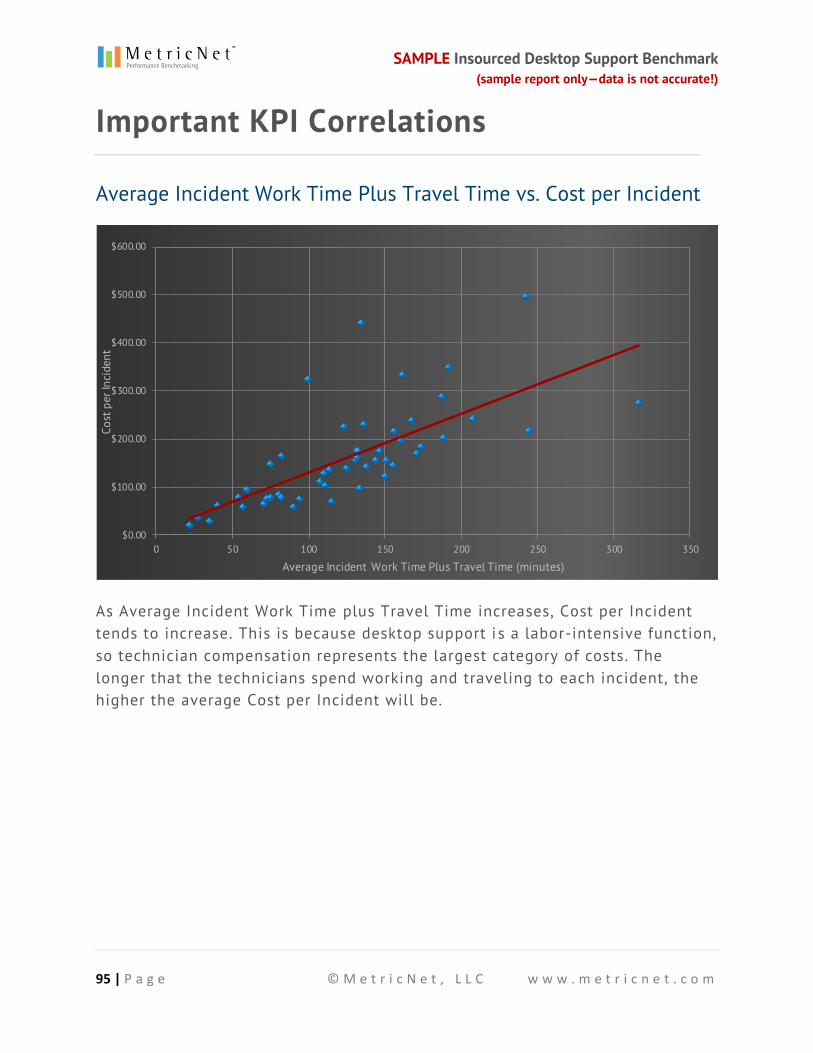
SAMPLE Insourced Desktop Support Benchmark (sample report only—data is not accurate!)
95 | P a g e © M e t r i c N e t , L L C w w w . m e t r i c n e t . c o m
Important KPI Correlations
Average Incident Work Time Plus Travel Time vs. Cost per Incident
$0.00
$100.00
$200.00
$300.00
$400.00
$500.00
$600.00
0 50 100 150 200 250 300 350
Cost
per
Inci
dent
Average Incident Work Time Plus Travel Time (minutes)
As Average Incident Work Time plus Travel Time increases, Cost per Incident tends to increase. This is because desktop support i s a labor-intensive function, so technician compensation represents the largest category of costs. The longer that the technicians spend working and traveling to each incident, the higher the average Cost per Incident will be.
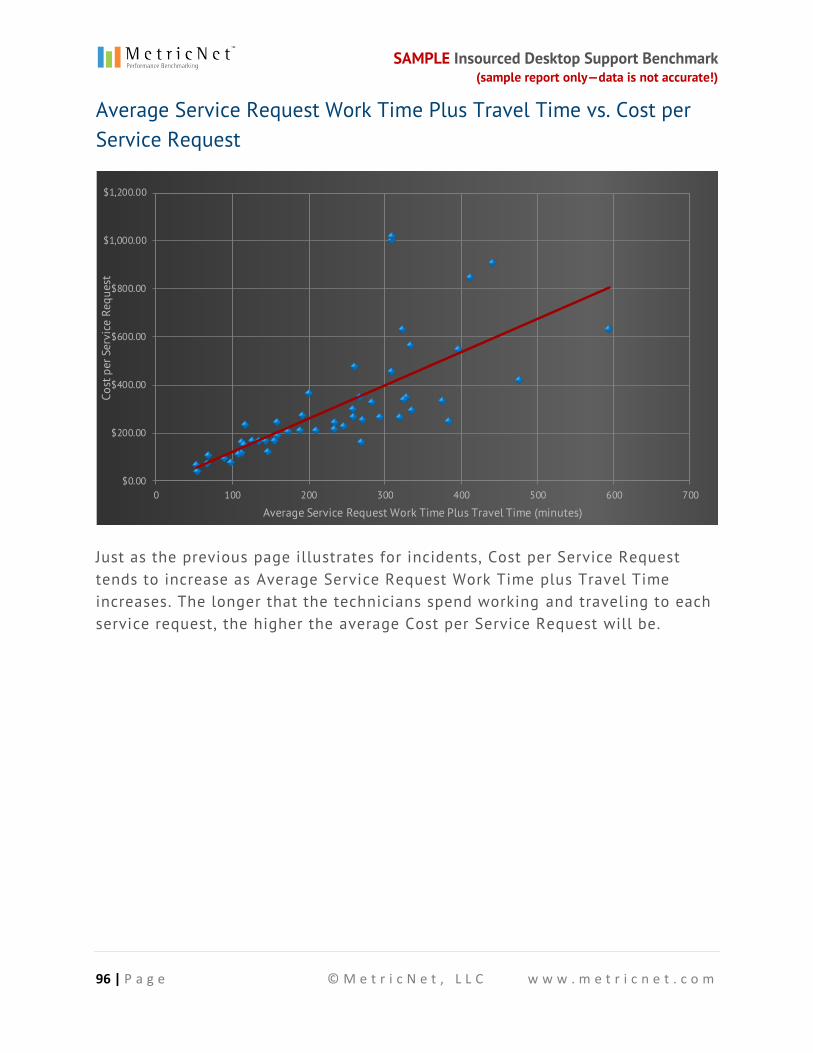
SAMPLE Insourced Desktop Support Benchmark (sample report only—data is not accurate!)
96 | P a g e © M e t r i c N e t , L L C w w w . m e t r i c n e t . c o m
Average Service Request Work Time Plus Travel Time vs. Cost per Service Request
$0.00
$200.00
$400.00
$600.00
$800.00
$1,000.00
$1,200.00
0 100 200 300 400 500 600 700
Cost
per
Ser
vice
Req
uest
Average Service Request Work Time Plus Travel Time (minutes)
Just as the previous page illustrates for incidents, Cost per Service Request tends to increase as Average Service Request Work Time plus Travel Time increases. The longer that the technicians spend working and traveling to each service request, the higher the average Cost per Service Request will be.
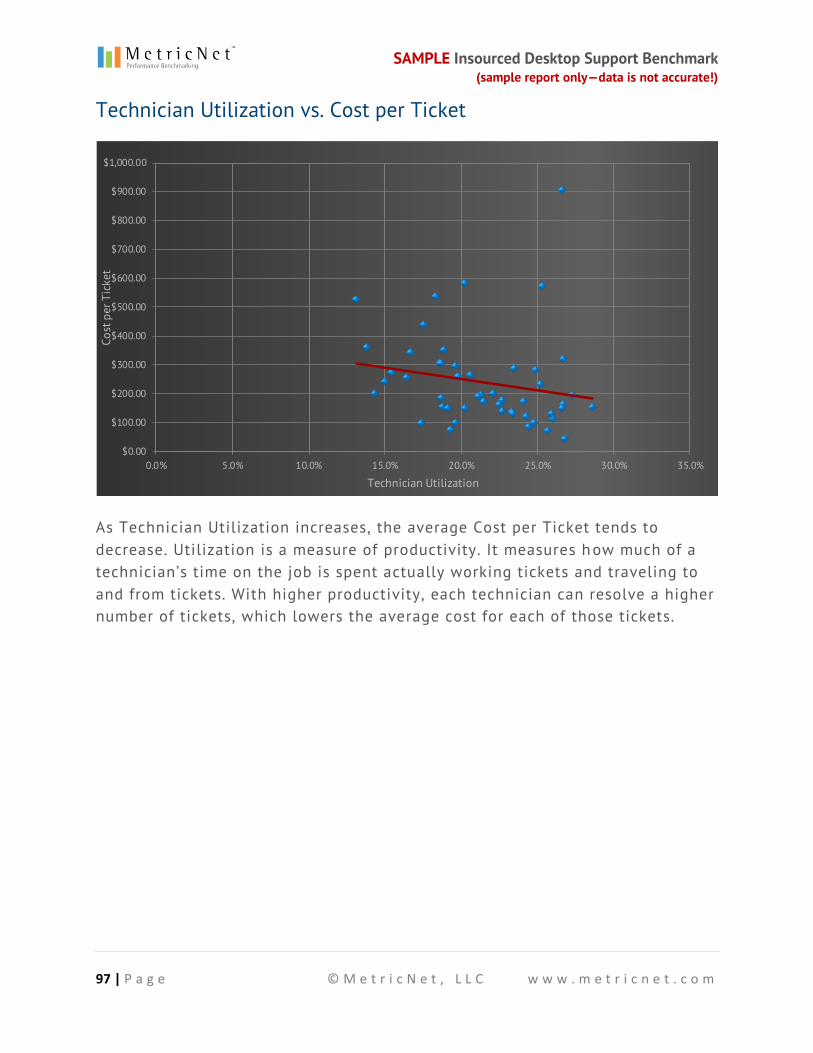
SAMPLE Insourced Desktop Support Benchmark (sample report only—data is not accurate!)
97 | P a g e © M e t r i c N e t , L L C w w w . m e t r i c n e t . c o m
Technician Utilization vs. Cost per Ticket
$0.00
$100.00
$200.00
$300.00
$400.00
$500.00
$600.00
$700.00
$800.00
$900.00
$1,000.00
0.0% 5.0% 10.0% 15.0% 20.0% 25.0% 30.0% 35.0%
Cost
per
Tic
ket
Technician Utilization
As Technician Utilization increases, the average Cost per Ticket tends to decrease. Utilization is a measure of productivity. It measures how much of a technician’s time on the job is spent actually working tickets and traveling to and from tickets. With higher productivity, each technician can resolve a higher number of tickets, which lowers the average cost for each of those tickets.
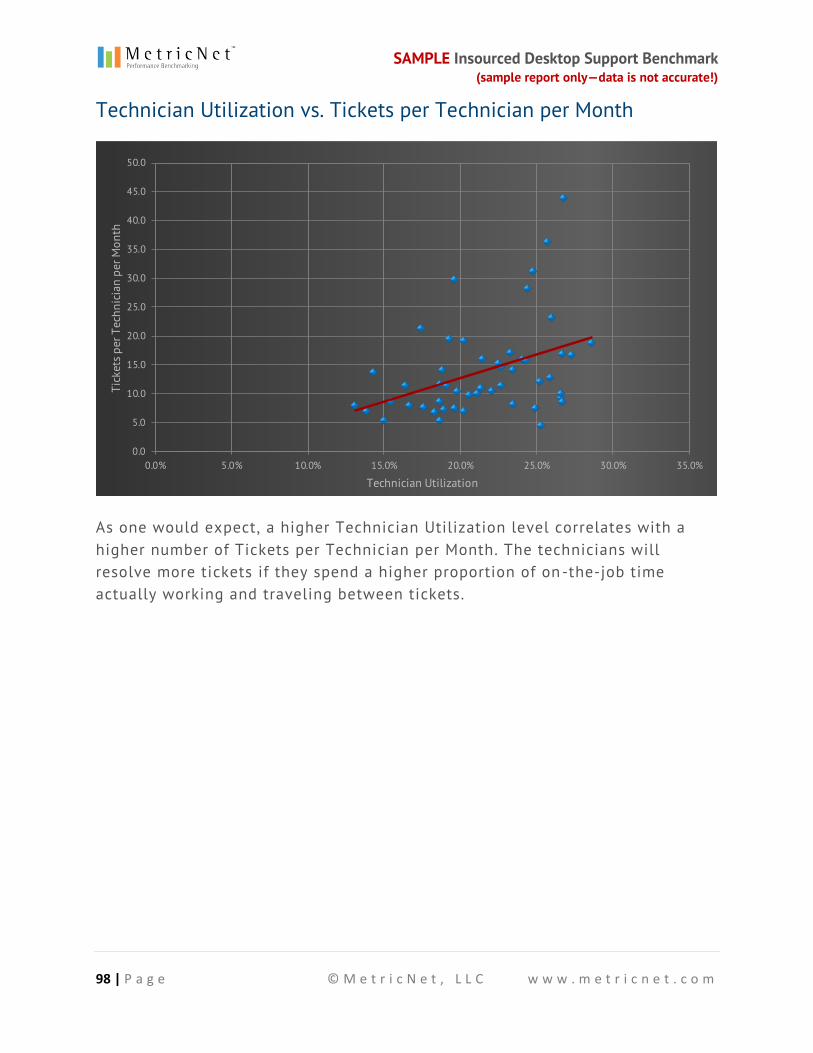
SAMPLE Insourced Desktop Support Benchmark (sample report only—data is not accurate!)
98 | P a g e © M e t r i c N e t , L L C w w w . m e t r i c n e t . c o m
Technician Utilization vs. Tickets per Technician per Month
0.0
5.0
10.0
15.0
20.0
25.0
30.0
35.0
40.0
45.0
50.0
0.0% 5.0% 10.0% 15.0% 20.0% 25.0% 30.0% 35.0%
Tick
ets p
er T
echn
icia
n pe
r Mon
th
Technician Utilization
As one would expect, a higher Technician Utilization level correlates with a higher number of Tickets per Technician per Month. The technicians will resolve more tickets if they spend a higher proportion of on-the-job time actually working and traveling between tickets.
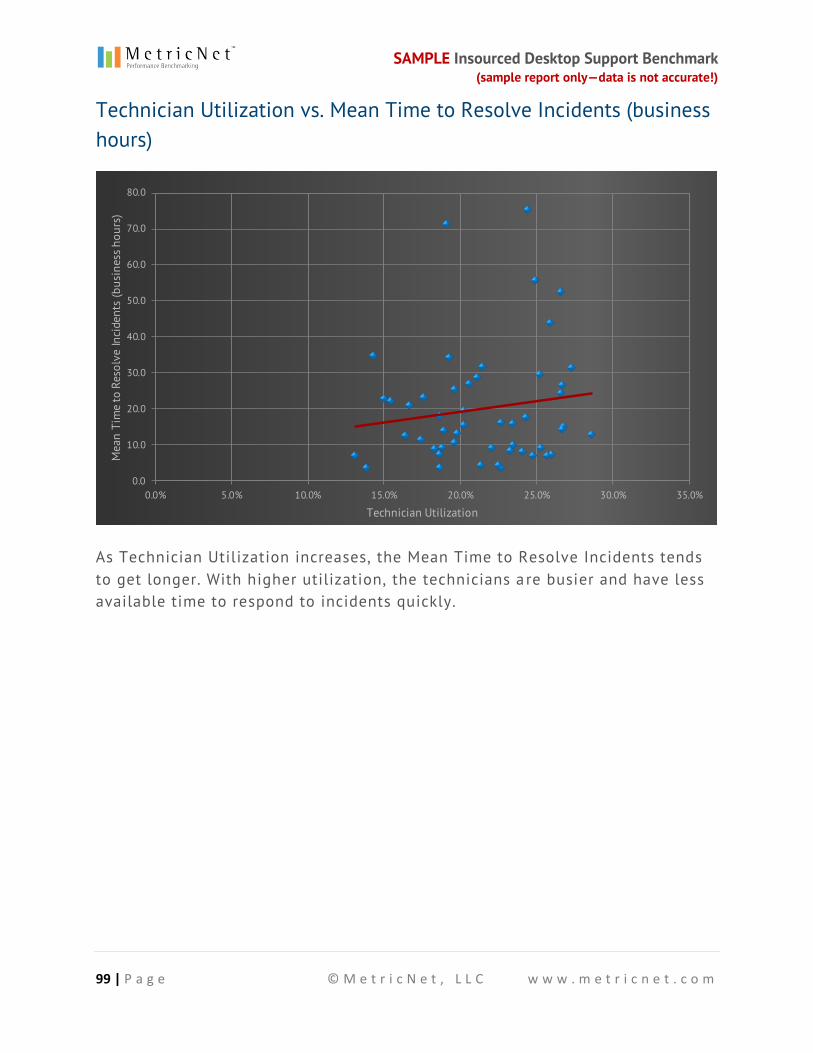
SAMPLE Insourced Desktop Support Benchmark (sample report only—data is not accurate!)
99 | P a g e © M e t r i c N e t , L L C w w w . m e t r i c n e t . c o m
Technician Utilization vs. Mean Time to Resolve Incidents (business hours)
0.0
10.0
20.0
30.0
40.0
50.0
60.0
70.0
80.0
0.0% 5.0% 10.0% 15.0% 20.0% 25.0% 30.0% 35.0%
Mea
n Ti
me
to R
esol
ve In
cide
nts
(bus
ines
s hou
rs)
Technician Utilization
As Technician Utilization increases, the Mean Time to Resolve Incidents tends to get longer. With higher utilization, the technicians a re busier and have less available time to respond to incidents quickly.
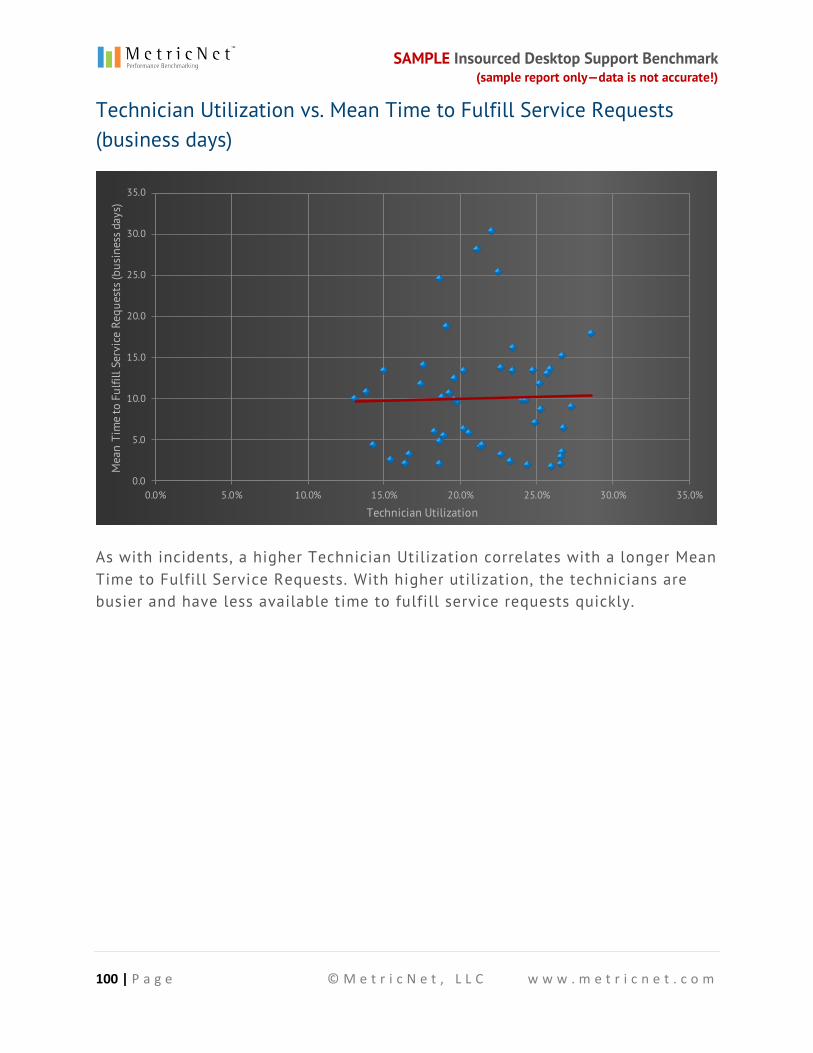
SAMPLE Insourced Desktop Support Benchmark (sample report only—data is not accurate!)
100 | P a g e © M e t r i c N e t , L L C w w w . m e t r i c n e t . c o m
Technician Utilization vs. Mean Time to Fulfill Service Requests (business days)
0.0
5.0
10.0
15.0
20.0
25.0
30.0
35.0
0.0% 5.0% 10.0% 15.0% 20.0% 25.0% 30.0% 35.0%
Mea
n Ti
me
to F
ulfil
l Ser
vice
Req
uest
s (bu
sine
ss d
ays)
Technician Utilization
As with incidents, a higher Technician Utilization correlates with a longer Mean Time to Fulfill Service Requests. With higher utilization, the technicians are busier and have less available time to fulfill service requests quickly.
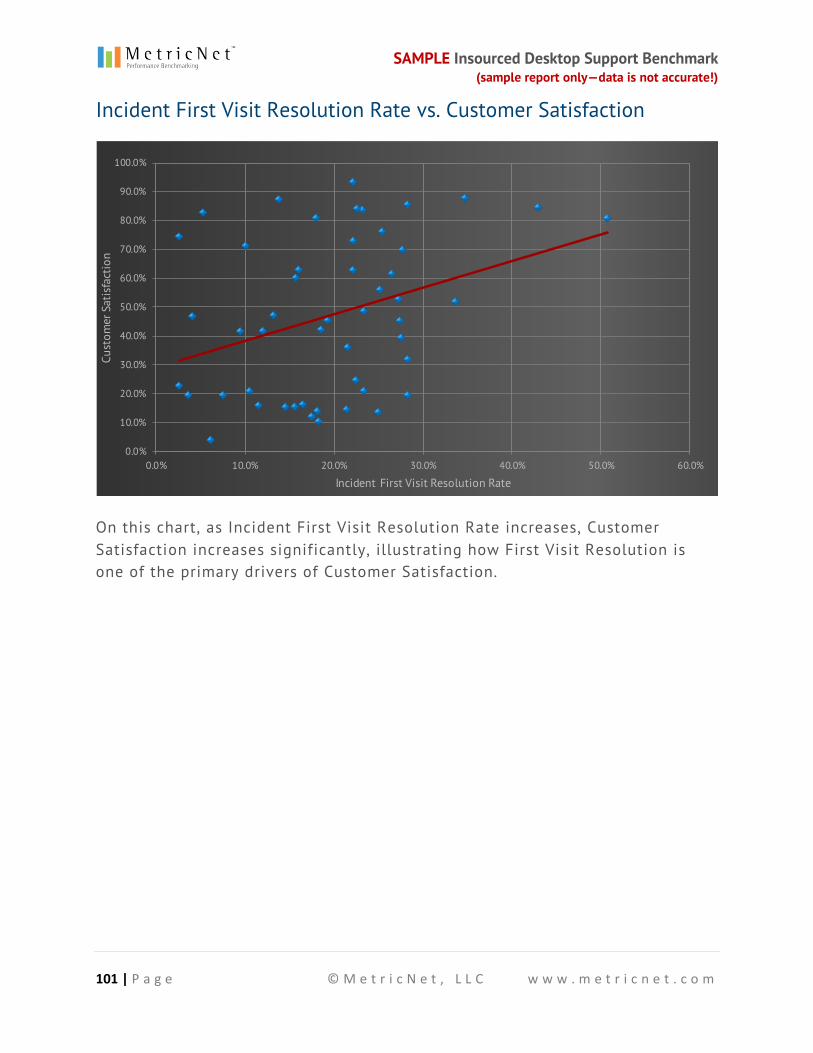
SAMPLE Insourced Desktop Support Benchmark (sample report only—data is not accurate!)
101 | P a g e © M e t r i c N e t , L L C w w w . m e t r i c n e t . c o m
Incident First Visit Resolution Rate vs. Customer Satisfaction
0.0%
10.0%
20.0%
30.0%
40.0%
50.0%
60.0%
70.0%
80.0%
90.0%
100.0%
0.0% 10.0% 20.0% 30.0% 40.0% 50.0% 60.0%
Cust
omer
Sat
isfa
ctio
n
Incident First Visit Resolution Rate
On this chart, as Incident First Visit Resolution Rate increases, Customer Satisfaction increases significantly, illustrating how First Visit Resolution is one of the primary drivers of Customer Satisfaction.
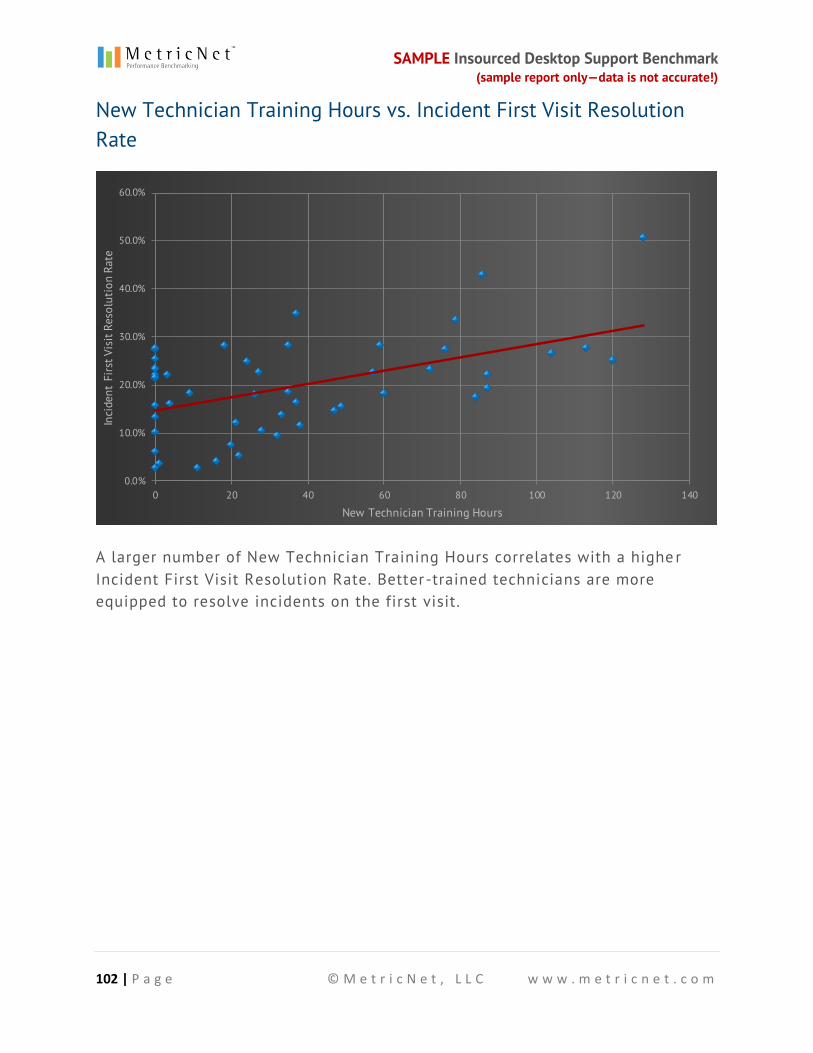
SAMPLE Insourced Desktop Support Benchmark (sample report only—data is not accurate!)
102 | P a g e © M e t r i c N e t , L L C w w w . m e t r i c n e t . c o m
New Technician Training Hours vs. Incident First Visit Resolution Rate
0.0%
10.0%
20.0%
30.0%
40.0%
50.0%
60.0%
0 20 40 60 80 100 120 140
Inci
dent
Firs
t Vis
it Re
solu
tion
Rate
New Technician Training Hours
A larger number of New Technician Training Hours correlates with a highe r Incident First Visit Resolution Rate. Better-trained technicians are more equipped to resolve incidents on the first visit.
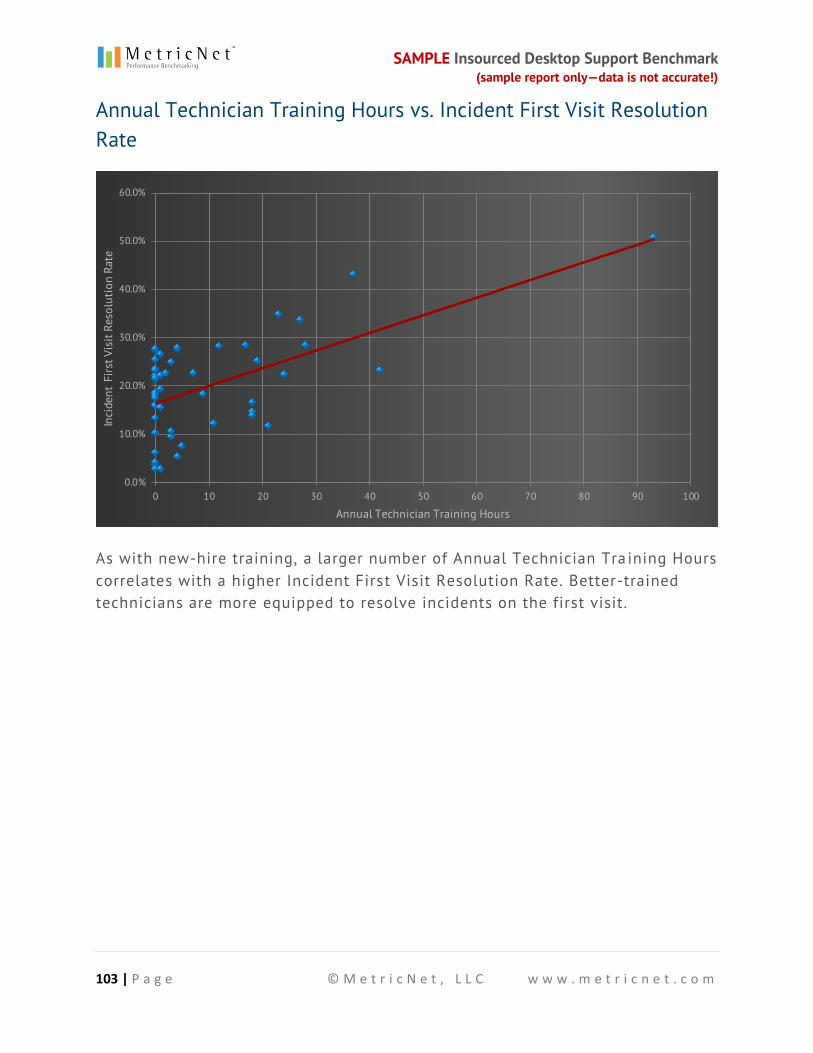
SAMPLE Insourced Desktop Support Benchmark (sample report only—data is not accurate!)
103 | P a g e © M e t r i c N e t , L L C w w w . m e t r i c n e t . c o m
Annual Technician Training Hours vs. Incident First Visit Resolution Rate
0.0%
10.0%
20.0%
30.0%
40.0%
50.0%
60.0%
0 10 20 30 40 50 60 70 80 90 100
Inci
dent
Firs
t Vis
it Re
solu
tion
Rate
Annual Technician Training Hours
As with new-hire training, a larger number of Annual Technician Tra ining Hours correlates with a higher Incident First Visit Resolution Rate. Better-trained technicians are more equipped to resolve incidents on the first visit.
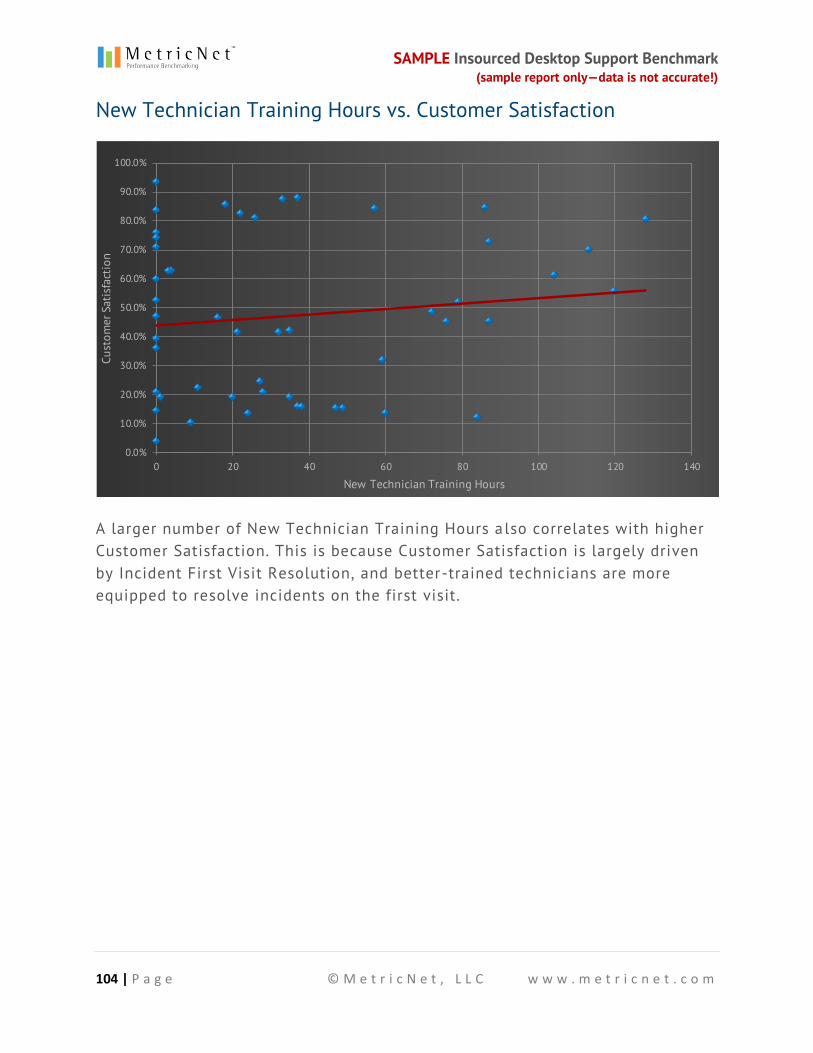
SAMPLE Insourced Desktop Support Benchmark (sample report only—data is not accurate!)
104 | P a g e © M e t r i c N e t , L L C w w w . m e t r i c n e t . c o m
New Technician Training Hours vs. Customer Satisfaction
0.0%
10.0%
20.0%
30.0%
40.0%
50.0%
60.0%
70.0%
80.0%
90.0%
100.0%
0 20 40 60 80 100 120 140
Cust
omer
Sat
isfa
ctio
n
New Technician Training Hours
A larger number of New Technician Training Hours a lso correlates with higher Customer Satisfaction. This is because Customer Satisfaction is largely driven by Incident First Visit Resolution, and better-trained technicians are more equipped to resolve incidents on the first visit.
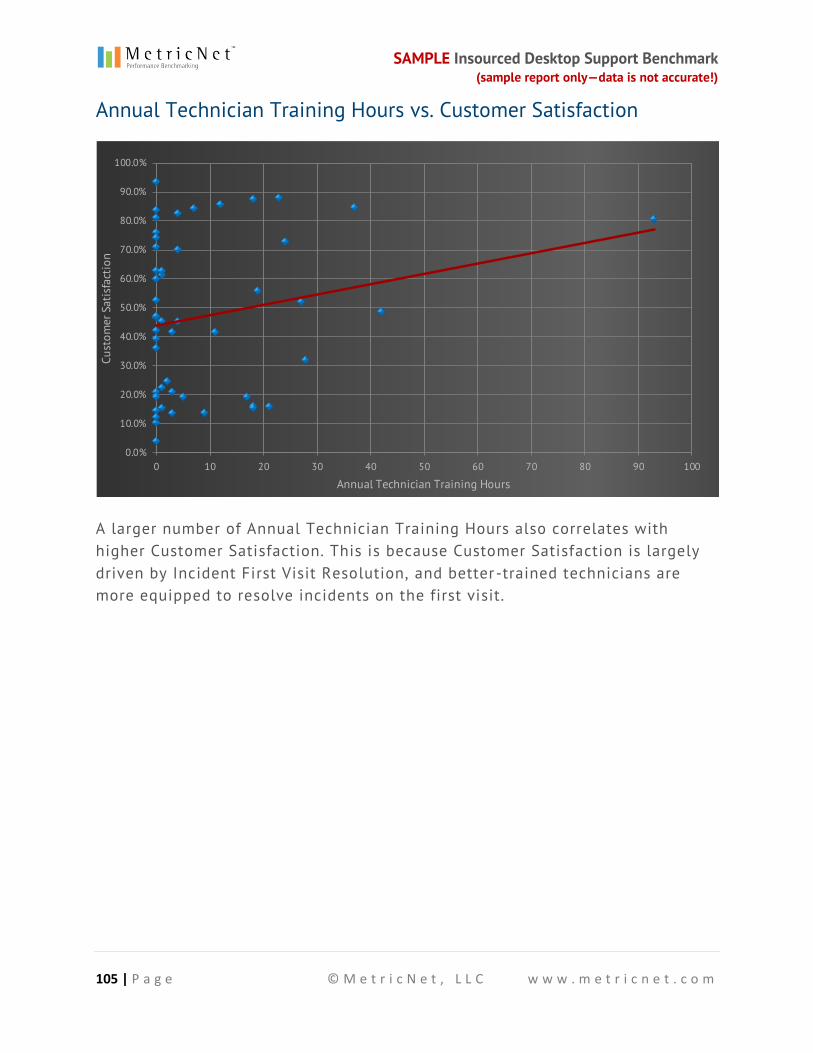
SAMPLE Insourced Desktop Support Benchmark (sample report only—data is not accurate!)
105 | P a g e © M e t r i c N e t , L L C w w w . m e t r i c n e t . c o m
Annual Technician Training Hours vs. Customer Satisfaction
0.0%
10.0%
20.0%
30.0%
40.0%
50.0%
60.0%
70.0%
80.0%
90.0%
100.0%
0 10 20 30 40 50 60 70 80 90 100
Cust
omer
Sat
isfa
ctio
n
Annual Technician Training Hours
A larger number of Annual Technician Training Hours also correlates with higher Customer Satisfaction. This is because Customer Satisfaction is largely driven by Incident First Visit Resolution, and better -trained technicians are more equipped to resolve incidents on the first visit.

SAMPLE Insourced Desktop Support Benchmark (sample report only—data is not accurate!)
106 | P a g e © M e t r i c N e t , L L C w w w . m e t r i c n e t . c o m
Technician Job Satisfaction vs. Cost per Ticket
$0.00
$100.00
$200.00
$300.00
$400.00
$500.00
$600.00
$700.00
$800.00
$900.00
$1,000.00
0.0% 10.0% 20.0% 30.0% 40.0% 50.0% 60.0%
Cost
per
Tic
ket
Technician Job Satisfaction
As Technician Job Satisfaction increases, Cost per Ticket tends to decrease. Job Satisfaction is a bellwether metric that has an indirect but significant effect on both cost and quality.
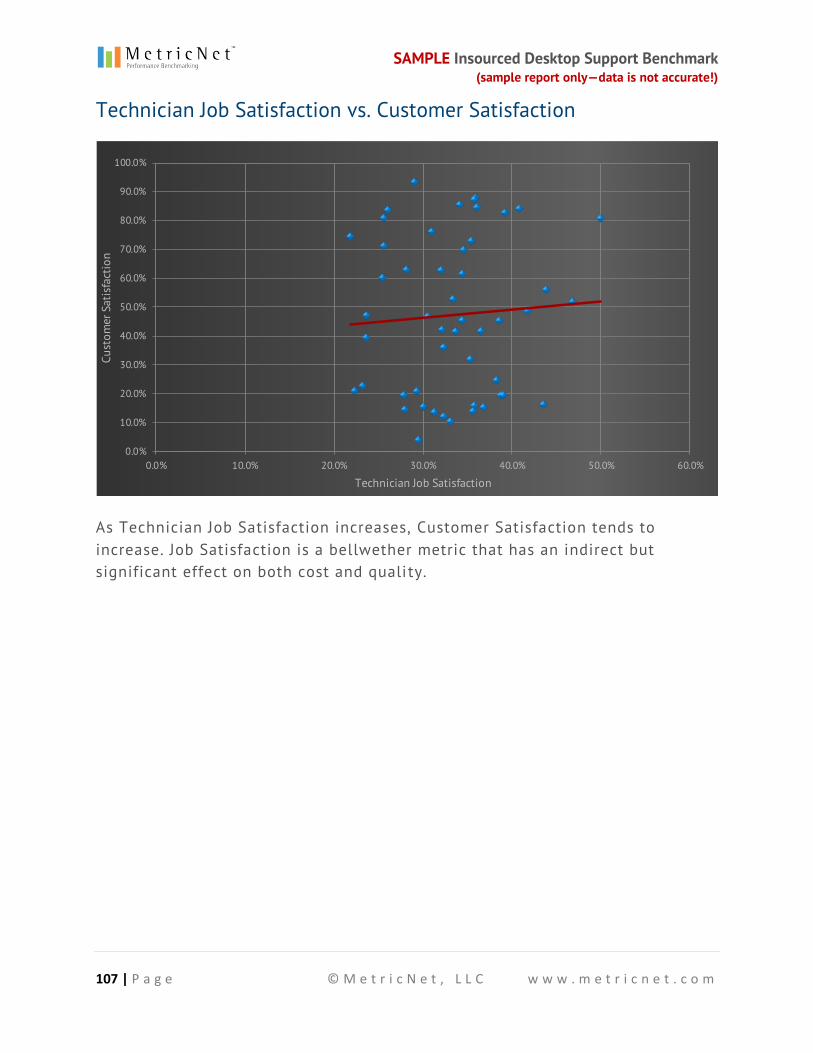
SAMPLE Insourced Desktop Support Benchmark (sample report only—data is not accurate!)
107 | P a g e © M e t r i c N e t , L L C w w w . m e t r i c n e t . c o m
Technician Job Satisfaction vs. Customer Satisfaction
0.0%
10.0%
20.0%
30.0%
40.0%
50.0%
60.0%
70.0%
80.0%
90.0%
100.0%
0.0% 10.0% 20.0% 30.0% 40.0% 50.0% 60.0%
Cust
omer
Sat
isfa
ctio
n
Technician Job Satisfaction
As Technician Job Satisfaction increases, Customer Satisfaction tends to increase. Job Satisfaction is a bellwether metric that has an indirect but significant effect on both cost and quali ty.
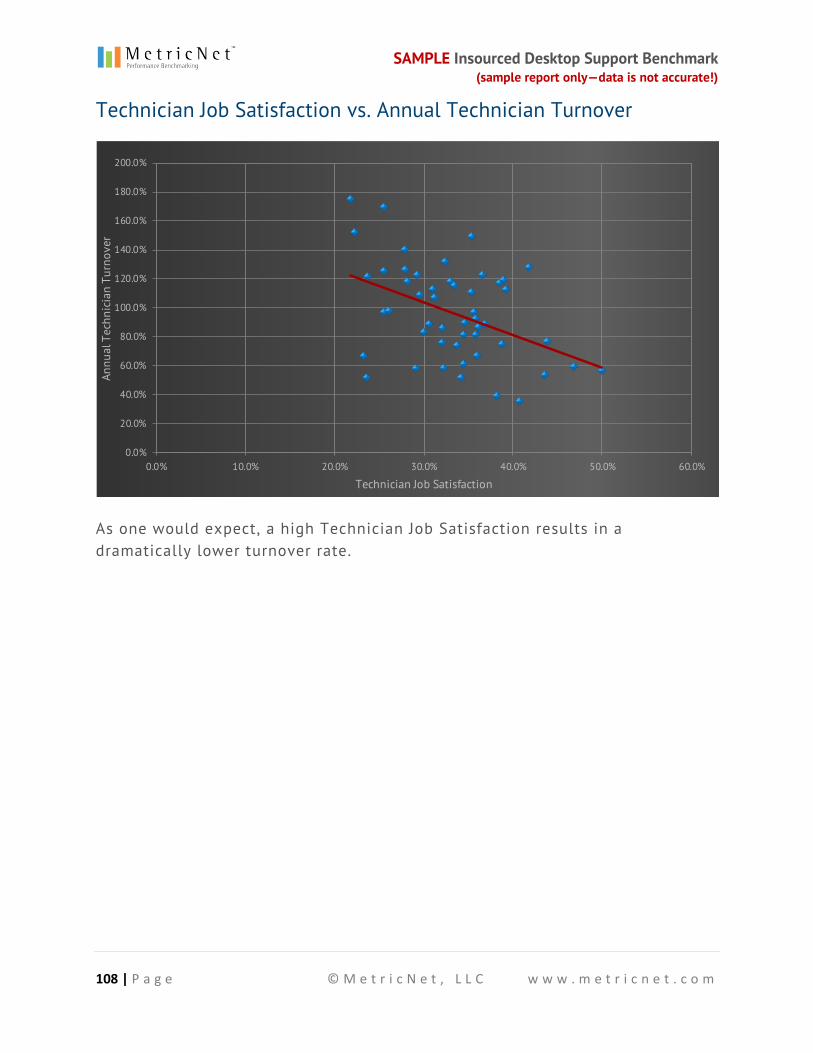
SAMPLE Insourced Desktop Support Benchmark (sample report only—data is not accurate!)
108 | P a g e © M e t r i c N e t , L L C w w w . m e t r i c n e t . c o m
Technician Job Satisfaction vs. Annual Technician Turnover
0.0%
20.0%
40.0%
60.0%
80.0%
100.0%
120.0%
140.0%
160.0%
180.0%
200.0%
0.0% 10.0% 20.0% 30.0% 40.0% 50.0% 60.0%
Annu
al T
echn
icia
n Tu
rnov
er
Technician Job Satisfaction
As one would expect, a high Technician Job Satisfaction results in a dramatically lower turnover rate.
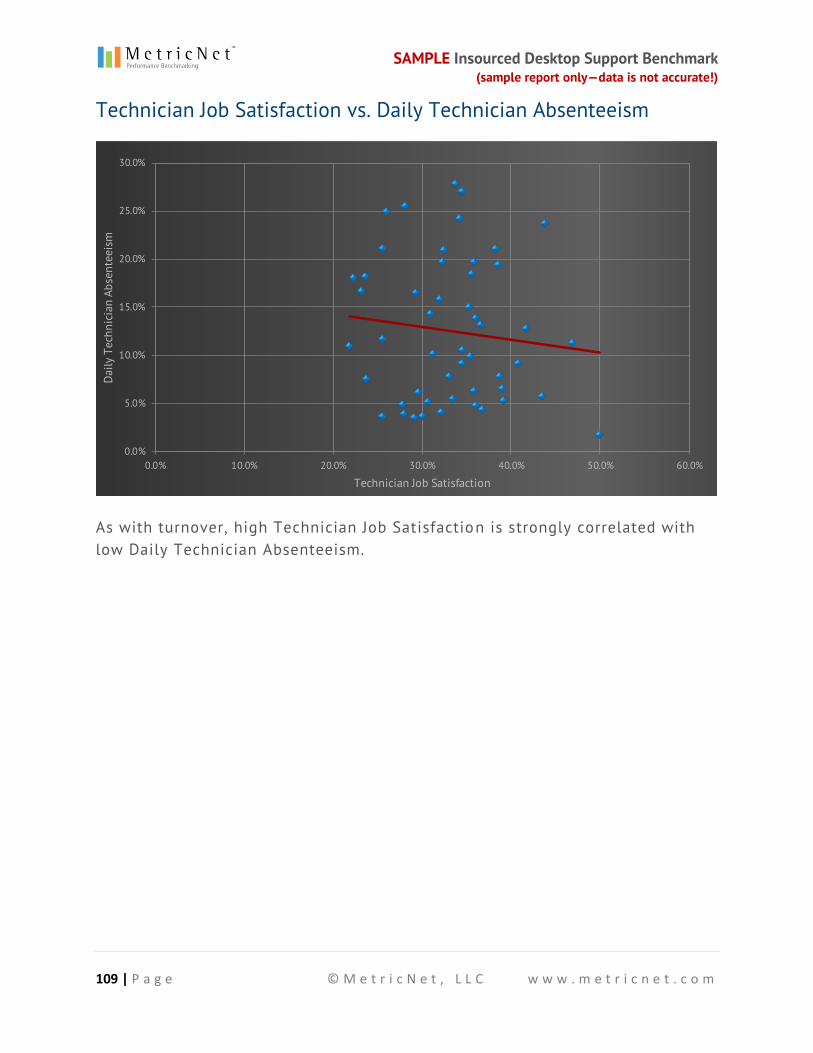
SAMPLE Insourced Desktop Support Benchmark (sample report only—data is not accurate!)
109 | P a g e © M e t r i c N e t , L L C w w w . m e t r i c n e t . c o m
Technician Job Satisfaction vs. Daily Technician Absenteeism
0.0%
5.0%
10.0%
15.0%
20.0%
25.0%
30.0%
0.0% 10.0% 20.0% 30.0% 40.0% 50.0% 60.0%
Daily
Tec
hnic
ian
Abse
ntee
ism
Technician Job Satisfaction
As with turnover, high Technician Job Satisfaction is strongly correlated with low Daily Technician Absenteeism.
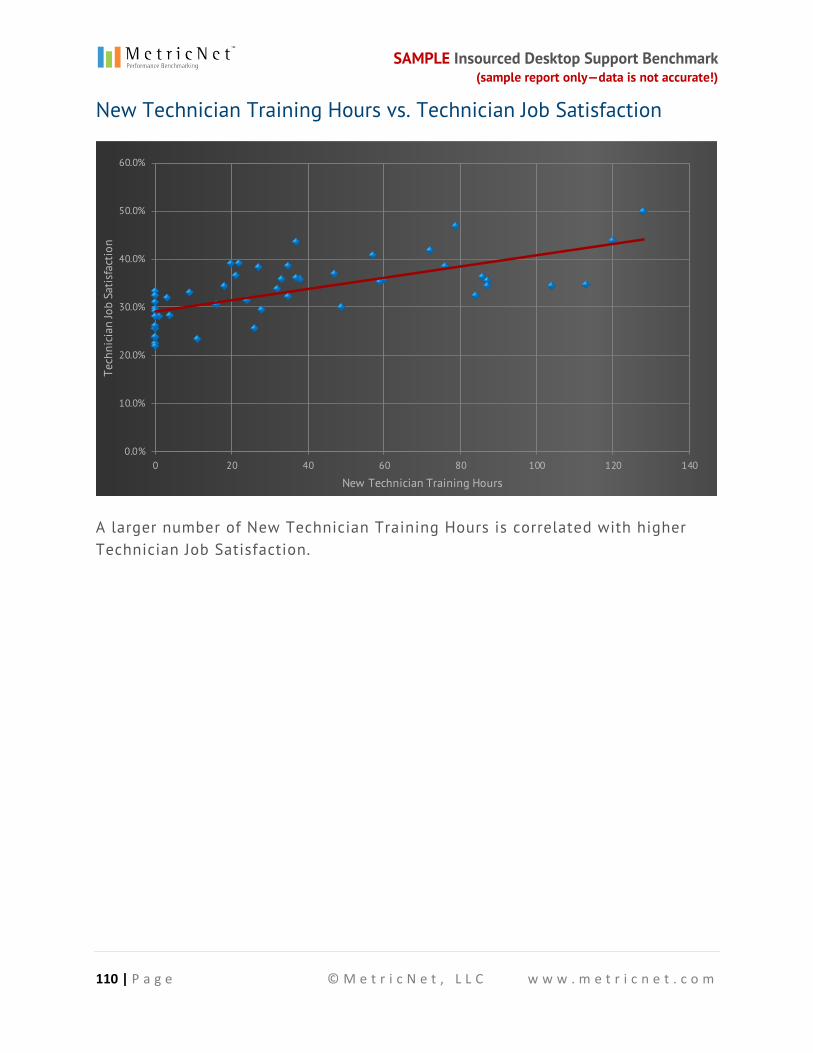
SAMPLE Insourced Desktop Support Benchmark (sample report only—data is not accurate!)
110 | P a g e © M e t r i c N e t , L L C w w w . m e t r i c n e t . c o m
New Technician Training Hours vs. Technician Job Satisfaction
0.0%
10.0%
20.0%
30.0%
40.0%
50.0%
60.0%
0 20 40 60 80 100 120 140
Tech
nici
an Jo
b Sa
tisfa
ctio
n
New Technician Training Hours
A larger number of New Technician Training Hours is correlated with higher Technician Job Satisfaction.
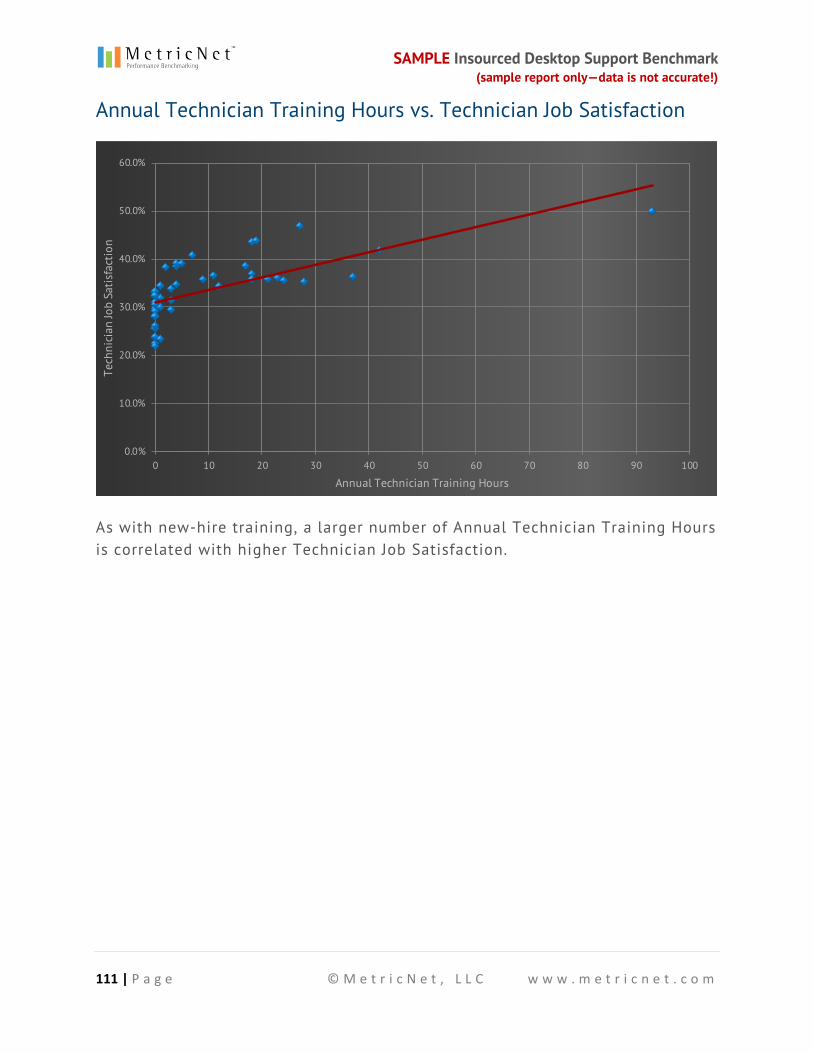
SAMPLE Insourced Desktop Support Benchmark (sample report only—data is not accurate!)
111 | P a g e © M e t r i c N e t , L L C w w w . m e t r i c n e t . c o m
Annual Technician Training Hours vs. Technician Job Satisfaction
0.0%
10.0%
20.0%
30.0%
40.0%
50.0%
60.0%
0 10 20 30 40 50 60 70 80 90 100
Tech
nici
an Jo
b Sa
tisfa
ctio
n
Annual Technician Training Hours
As with new-hire training, a larger number of Annual Technician Training Hours is correlated with higher Technician Job Satisfaction.
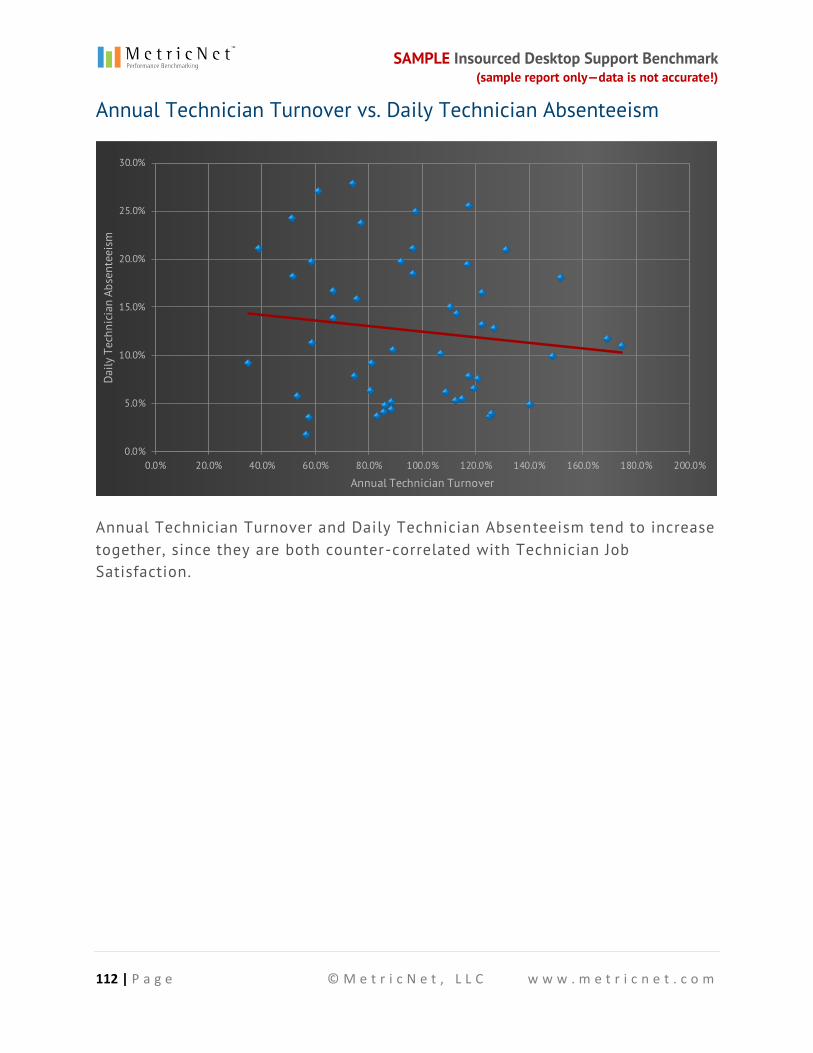
SAMPLE Insourced Desktop Support Benchmark (sample report only—data is not accurate!)
112 | P a g e © M e t r i c N e t , L L C w w w . m e t r i c n e t . c o m
Annual Technician Turnover vs. Daily Technician Absenteeism
0.0%
5.0%
10.0%
15.0%
20.0%
25.0%
30.0%
0.0% 20.0% 40.0% 60.0% 80.0% 100.0% 120.0% 140.0% 160.0% 180.0% 200.0%
Daily
Tec
hnic
ian
Abse
ntee
ism
Annual Technician Turnover
Annual Technician Turnover and Daily Technician Absenteeism tend to increase together, since they are both counter-correlated with Technician Job Satisfaction.
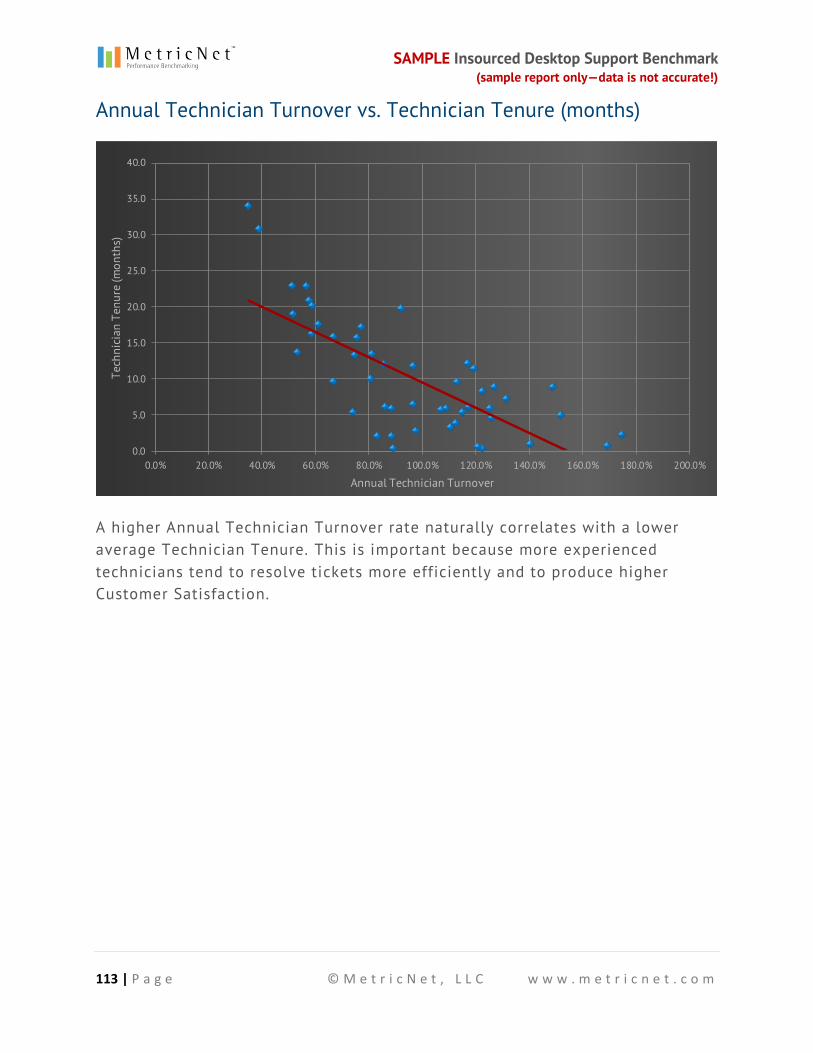
SAMPLE Insourced Desktop Support Benchmark (sample report only—data is not accurate!)
113 | P a g e © M e t r i c N e t , L L C w w w . m e t r i c n e t . c o m
Annual Technician Turnover vs. Technician Tenure (months)
0.0
5.0
10.0
15.0
20.0
25.0
30.0
35.0
40.0
0.0% 20.0% 40.0% 60.0% 80.0% 100.0% 120.0% 140.0% 160.0% 180.0% 200.0%
Tech
nici
an T
enur
e (m
onth
s)
Annual Technician Turnover
A higher Annual Technician Turnover rate naturally correlates with a lower average Technician Tenure. This is important because more experienced technicians tend to resolve tickets more efficiently and to produce higher Customer Satisfaction.
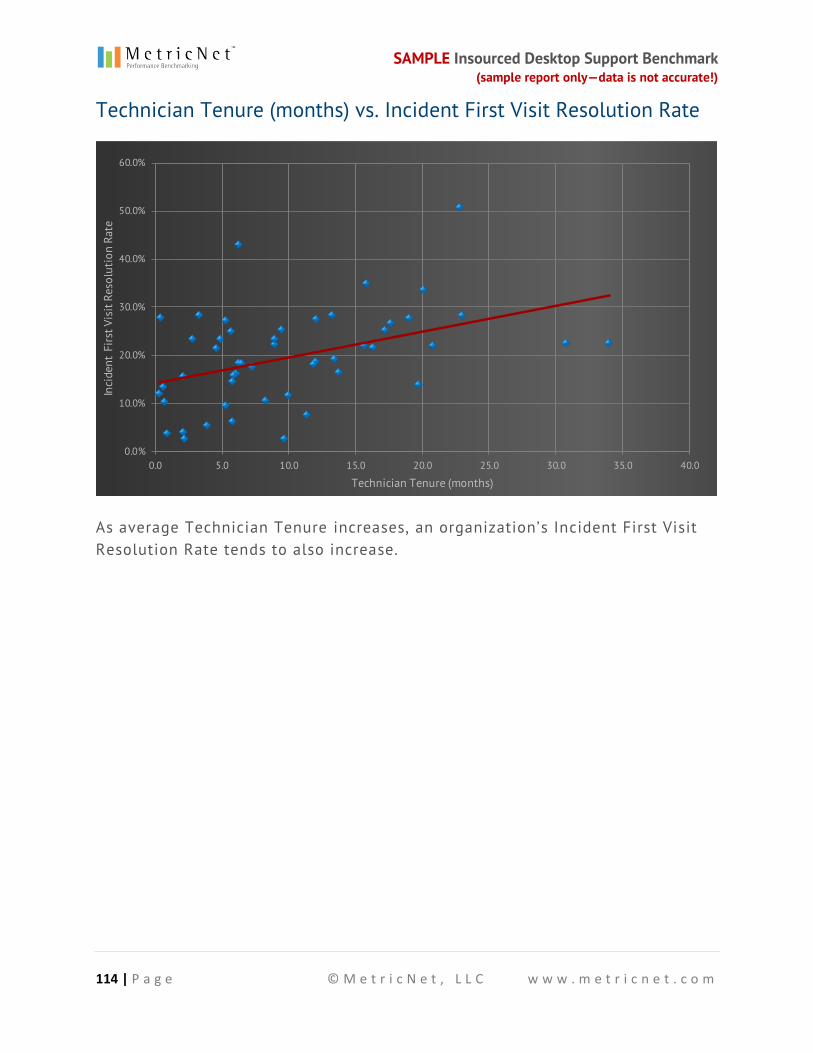
SAMPLE Insourced Desktop Support Benchmark (sample report only—data is not accurate!)
114 | P a g e © M e t r i c N e t , L L C w w w . m e t r i c n e t . c o m
Technician Tenure (months) vs. Incident First Visit Resolution Rate
0.0%
10.0%
20.0%
30.0%
40.0%
50.0%
60.0%
0.0 5.0 10.0 15.0 20.0 25.0 30.0 35.0 40.0
Inci
dent
Firs
t Vis
it Re
solu
tion
Rate
Technician Tenure (months)
As average Technician Tenure increases, an organization’s Incident First Visit Resolution Rate tends to also increase.
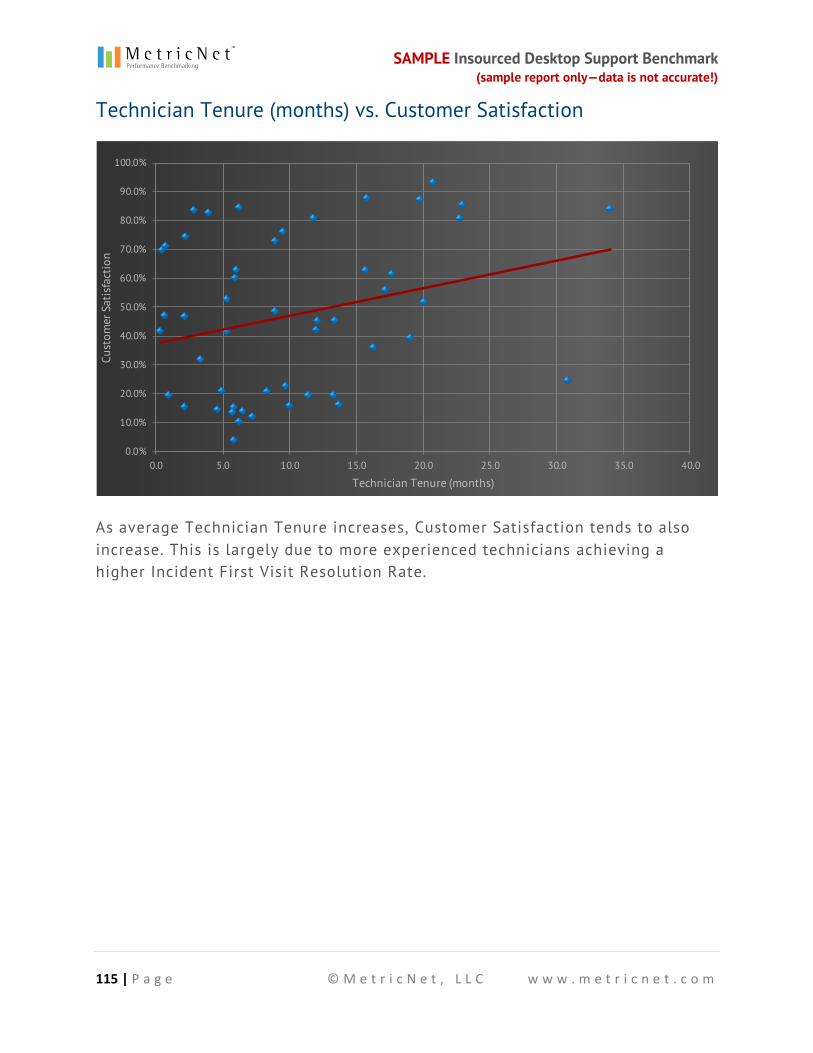
SAMPLE Insourced Desktop Support Benchmark (sample report only—data is not accurate!)
115 | P a g e © M e t r i c N e t , L L C w w w . m e t r i c n e t . c o m
Technician Tenure (months) vs. Customer Satisfaction
0.0%
10.0%
20.0%
30.0%
40.0%
50.0%
60.0%
70.0%
80.0%
90.0%
100.0%
0.0 5.0 10.0 15.0 20.0 25.0 30.0 35.0 40.0
Cust
omer
Sat
isfa
ctio
n
Technician Tenure (months)
As average Technician Tenure increases, Customer Satisfaction tends to also increase. This is largely due to more experienced technicians achieving a higher Incident First Visit Resolution Rate.
SAMPLE Insourced Desktop Support Benchmark (sample report only—data is not accurate!)
116 | P a g e © M e t r i c N e t , L L C w w w . m e t r i c n e t . c o m
About MetricNet
MetricNet, LLC is the leading source of benchmarks, scorecards, and performance metrics for Information Technology and Contact Center Professionals worldwide. Our mission is to provide you with the benchmarks you need to run your business more effectively.
MetricNet has pioneered a number of innovative techniques to ensure that you receive fast, accurate benchmarks, with a minimum of time and effort.
In addition to our industry benchmarks , such as this report, MetricNet also offers:
The One Year Path to World-Class Performance , a continuous Desktop Support
improvement program.
Benchmarking data files for those who wish to conduct their own
benchmarking analysis.
Comprehensive peer group benchmarks that compare your performance to
others in your vertical market.
Free Resources
Every month, MetricNet presents a live training webcast. Thousands of professionals attend each year and many of our clients have their entire teams attend. These events are a great way to boost Annual Technician Training Hours! Topics include Service Desk Best Practices and KPIs, Desktop Support Best Practices and KPIs, Contact Center Best Practices and KPIs, and more. Sign up for our Free Webcasts .
We also have developed an extensive resource library filled with free training materials for Information Technology and Contact Center professionals. Each resource is available to download in PDF format. Browse our resource library .