SAMPLE PREPARATION TECHNIQUES FOR THE IMPROVEMENT …
173
Clemson University TigerPrints All Dissertations Dissertations 12-2012 SAMPLE PREPATION TECHNIQUES FOR THE IMPROVEMENT OF ANALYTICAL MEASUREMENTS: CAPILLARY- CHANNELED POLYMER FIBERS EMPLOYED IN PROTEIN SOLID PHASE EXTCTION APPLICATIONS AND CHACTERIZATION OF ACTIVE COMPONENTS IN BOTANICAL DIETARY SUPPLEMENTS Carolyn Burdee Clemson University, [email protected] Follow this and additional works at: hps://tigerprints.clemson.edu/all_dissertations Part of the Analytical Chemistry Commons is Dissertation is brought to you for free and open access by the Dissertations at TigerPrints. It has been accepted for inclusion in All Dissertations by an authorized administrator of TigerPrints. For more information, please contact [email protected]. Recommended Citation Burdee, Carolyn, "SAMPLE PREPATION TECHNIQUES FOR THE IMPROVEMENT OF ANALYTICAL MEASUREMENTS: CAPILLARY-CHANNELED POLYMER FIBERS EMPLOYED IN PROTEIN SOLID PHASE EXTCTION APPLICATIONS AND CHACTERIZATION OF ACTIVE COMPONENTS IN BOTANICAL DIETARY SUPPLEMENTS" (2012). All Dissertations. 1048. hps://tigerprints.clemson.edu/all_dissertations/1048
Transcript of SAMPLE PREPARATION TECHNIQUES FOR THE IMPROVEMENT …
Clemson UniversityTigerPrints
All Dissertations Dissertations
12-2012
SAMPLE PREPARATION TECHNIQUES FORTHE IMPROVEMENT OF ANALYTICALMEASUREMENTS: CAPILLARY-CHANNELED POLYMER FIBERSEMPLOYED IN PROTEIN SOLID PHASEEXTRACTION APPLICATIONS ANDCHARACTERIZATION OF ACTIVECOMPONENTS IN BOTANICAL DIETARYSUPPLEMENTSCarolyn BurdetteClemson University, [email protected]
Follow this and additional works at: https://tigerprints.clemson.edu/all_dissertations
Part of the Analytical Chemistry Commons
This Dissertation is brought to you for free and open access by the Dissertations at TigerPrints. It has been accepted for inclusion in All Dissertations byan authorized administrator of TigerPrints. For more information, please contact [email protected].
Recommended CitationBurdette, Carolyn, "SAMPLE PREPARATION TECHNIQUES FOR THE IMPROVEMENT OF ANALYTICALMEASUREMENTS: CAPILLARY-CHANNELED POLYMER FIBERS EMPLOYED IN PROTEIN SOLID PHASEEXTRACTION APPLICATIONS AND CHARACTERIZATION OF ACTIVE COMPONENTS IN BOTANICAL DIETARYSUPPLEMENTS" (2012). All Dissertations. 1048.https://tigerprints.clemson.edu/all_dissertations/1048
i
SAMPLE PREPARATION TECHNIQUES FOR THE IMPROVEMENT OF ANALYTICAL MEASUREMENTS: CAPILLARY-CHANNELED POLYMER
FIBERS EMPLOYED IN PROTEIN SOLID PHASE EXTRACTION APPLICATIONS AND CHARACTERIZATION OF ACTIVE
COMPONENTS IN BOTANICAL DIETARY SUPPLEMENTS
A Dissertation Presented to
the Graduate School of Clemson University
In Partial Fulfillment of the Requirements for the Degree
Doctor of Philosophy Chemistry
by Carolyn Q. Burdette
December 2012
Accepted by: Kenneth Marcus, Committee Chair
Kenneth Christensen George Chumanov
Brian Dominy
ii
ABSTRACT
The task of sample preparation encompasses many challenges and
demands for analytical techniques. Appropriate preparative steps can be the
determining factor between successful measurements and failures. Too little
preparation can lead to the inability to detect analytes due to low concentrations,
insufficient extraction of analytes, and/or strong matrix effects; exhaustive
preparation steps increases analysis times, the potential for analyte losses, and
the difficulty to obtain consistent reproducible results. Discussed here are several
examples of analytical techniques where sample preparation is critical and can
be used to improve existing techniques. Capillary-channeled polymer (C-CP)
fibers used for solid phase extraction (SPE) protein analysis techniques is
described first. The C-CP fibers have several advantageous attributes stemming
from the unique shape, wide chemical and pH stability ranges, predictable
surface interactions, and overall low material costs. The fibers have been
employed in micropipette tip and microcolumn SPE formats for the desalting of
proteins from high salt content buffer, synthetic urine and synthetic saliva
matrices. Micropipette tips were prepared and used for an off-line method prior to
UV-VIS detection, and a microcolumn format was developed as an on-line SPE
technique for ESI-MS detection. The characterization of isoflavones present in
soy, kudzu, and red clover products by liquid chromatography-particle beam
electron ionization mass spectrometry (LC-PB/EIMS) is also described. Here,
NIST Standard Reference Materials (SRMs) were extracted using 80% methanol

iii
without a hydrolysis step. Samples were then analyzed using a chromatographic
separation and analytes quantified by an internal standard (IS) method using 7-
hydroxy-4-chromone as the IS compound. The particle beam allows for simple
interfacing between LC separations and EIMS detection, giving ability to attain
qualitative and quantitative information simultaneously. Isoflavones were
quantified and compared to NIST certified values.

iv
DEDICATION
This dissertation is dedicated to the amazing people in my life that God
has blessed me with.
To my wonderful husband, Casey Burdette, I give all my love. I can never
thank you enough for all the little sweet things you do, for being so patient and
supportive, for making me laugh, and most of all - for making me feel beautiful. I
am such a lucky lady. I wouldn’t have wanted to do this without you and I am
excited for what adventures await us.
To my entire family, especially my incredible parents, thank you for always
being there. I cannot express enough how lucky and blessed I am to have grown
up surrounded by such love, support, and trust. You’ve taught me to be strong,
independent, passionate, and caring. I hope I will continue to make you proud.
And to my best friend, Ellie Tennyson, thank you. There are too many
times to count when I don’t know how I would have made it through without you.
Food-comas, car dancing/singing, laughing until we cry, road trips, playing too
much guitar hero, and sitting on the stairs of Hunter – talking about nothing and
everything at the same time. You are the best.
v
ACKNOWLEDGMENTS
I first need to acknowledge my advisor, Dr. R. Ken Marcus. Thank you for
allowing me to work in your research group and all the invaluable opportunities it
has offered to further my knowledge, experiences, and career path. I know that I
would not have been able to attend, and participate in, so many conferences or
visit collaborating laboratories under another advisor. Thank you for expecting
the best, pushing me when I needed it, and continuing to believe in me. I hope
one day I can return the favor.
I want to thank all the members of the Marcus research group. You have
been a supportive group of co-workers and friends, and I am forever grateful for
all the laughs and good times. Joy, Derrick, Jennifer, Manoj, Abby, and Ben,
thank you.
I would like to acknowledge Melissa Phillips and Kate Rimmer. I am so
glad that I was able to meet and work with you both and am very thankful for the
help, guidance, support, and friendship.
I would also like to acknowledge some of the people who have made a
significant impact on who, and where, I am today. To all the teachers, directors,
and coaches who helped shaped my academic career path starting from middle
school all the way through undergrad, Mr. Doll, Dr. Owens, Dr. Calloway, Coach
Dommer, Coach Woods, Coach Elias, and Coach Hogan, I cannot thank you
enough.
vi
TABLE OF CONTENTS
Page
TITLE PAGE ....................................................................................................... i ABSTRACT ........................................................................................................ ii DEDICATION .................................................................................................... iv ACKNOWLEDGMENTS .................................................................................... v LIST OF TABLES ............................................................................................ viii LIST OF FIGURES ........................................................................................... ix CHAPTER I. INTRODUCTION ............................................................................... 1 Sample Preparation ...................................................................... 1 Sample Preparation for the Analysis of Proteins .......................... 3 Capillary-Channeled Polymer (C-CP) Fibers .............................. 10 Sample Preparation for the Analysis of Botanical Materials ....... 13 Liquid Chromatography Particle Beam Mass Spectrometry ....... 15 Summary .................................................................................... 20 References ................................................................................. 21
II. SOLID PHASE EXTRACTION OF PROTEINS FROM BUFFER SOLUTIONS EMPLOYING CAPILLARY- CHANNELED POLYMER (C-CP) FIBERS AS THE STATIONARY PHASE ....................................................... 27
Introduction ................................................................................. 27 Experimental .............................................................................. 31 Results and Discussion .............................................................. 38 Conclusions ................................................................................ 50 References ................................................................................. 51
vii
Table of Contents (Continued)
Page III. IN-LINE DESALTING OF PROTEINS FROM BUFFER SOLUTIONS PRIOR TO ESI-MS ANALYSIS VIA A CAPILLARY-CHANNELED POLYMER FIBER MICROCOLUMN ........................................................................ 57 Introduction ................................................................................. 57 Materials and Methods ............................................................... 62 Results and Discussion .............................................................. 66 Conclusions ................................................................................ 77 References ................................................................................. 79 IV. DETERMINATION OF ISOFLAVONE CONTENT IN SOY, RED CLOVER AND KUDZU DIETARY SUPPLEMENT MATERIALS BY LIQUID CHROMATOGRAPHY-PARTICLE BEAM/ELECTRON IONIZATION MASS SPECTROMETRY (LC-PB/EIMS) ............................................................................. 83 Introduction ................................................................................. 83 Experimental .............................................................................. 88 Results and Discussion .............................................................. 92 Conclusions .............................................................................. 104 References ............................................................................... 105 V. DEVELOPMENT OF A LC-PB/EIMS METHOD OF ANALYSIS FOR THE DETERMINATION OF SOY ISOFLAVONES ................................................................ 108 Introduction ............................................................................... 108 Experimental ............................................................................ 115 Results and Discussion ............................................................ 120 Conclusions .............................................................................. 125 References ............................................................................... 126 VI. SUMMARY .................................................................................... 129 A: AMBIENT DESORPTION/IONIZATION MASS SPECTROMETRY USING A LIQUID SAMPLING-ATMOSPHERIC GLOW DISCHARGE (LS-APGD) IONIZATION SOURCE ................... 134
viii
LIST OF TABLES
Table Page 2.1 UV-VIS absorbance response characteristics for the test proteins in the primary (PBS) and elution (50:50 ACN:H2O) solvents .......................................................... 38 2.2 Example of protein recovery data for the various steps of the C-CP SPE method; lysozyme/PBS system ............. 40 2.3 Protein-specific recovery and coverage characteristics ................... 41 2.4 Protein recovery from complex matrices .......................................... 47 4.1 Experimental Conditions for LC-PB/EIMS Analysis of Isoflavones ............................................................................. 91 4.2 Selected Ion Masses, Limits of Detection, and Response Factors for Target Isoflavones ................................... 98 4.3 Concentrations of Isoflavones Extracted from Standard Reference Materials ................................................................. 101 5.1 Selected Ion Masses, Limits of Detection, and Response Factors for Target Isoflavones ................................. 121
ix
LIST OF FIGURES
Figure Page 1.1 Cartoon depiction of ion formation by electrospray ionization ............ 5 1.2 Depiction of overall SPE process ....................................................... 8
1.3 SEM images of C-CP fibers packed into microbore column (left) and single fiber in resin (right) .................................................... 12 1.4 Depiction of electron ionization process........................................... 17 1.5 Diagram of particle beam interface to EI-MS ................................... 19 2.1 SEM image of a cross section of a PP C-CP fiber packed tip, illustrating the interdigitation of the fiber channels upon packing. ............................................................................. 33 2.2 Set of completed PP C-CP fiber packed micropipette tips. Each tip contains 10 mm of packed tubing, corresponding to ~5 mg of fiber ......................................................................... 35 2.3 Adaptation of C-CP fiber tips to centrifuge format. A 15 mL centrifuge tube cap is cut to accommodate a modified 1.5 mL microcentrifuge tube ....................................................... 36 2.4 Recovery characteristics for each of the test proteins from PBS across the applied protein masses of 0.2 – 2.0 µg. Surface saturation occurs around 1.25 – 1.5 µg of protein, where prior to this the average recoveries of 91.5, 88.1, 88.5, and 90.9% respectively for lysozyme, cytochrome c,
myoglobin, and glucose oxidase. ............................................... 42 3.1 Diagrammatic representation of the components of the in-line C-CP fiber microcolumn desalting apparatus with ESI-MS detection ................................................................ 65 3.2 ESI-MS spectra of target proteins in PBS prior to desalting; a) cytochrome c, b) lysozyme, c) hemoglobin, and d) myoglobin. Spectra represent 25 µL injections of ~20 µM protein concentration ................................................. 67

x
List of Figures (Continued) Figure Page
3.3 ESI-MS spectra of target proteins in PBS following desalting via the PP C-CP fiber microcolumns; a) cytochrome c, b) lysozyme, c) hemoglobin, and d) myoglobin. Spectra represent 25 µL injections of ~2 µM protein concentration ....................................................... 68 3.4 Integrated ESI-MS TIC peak areas (500-2000 Da) for
differing amounts of hemoglobin (in 100 L aliquots of PBS) applied to the C-CP fiber microcolumn. Error bars are based on triplicate injections (n = 3) .................... 70 3.5 Integrated ESI-MS TIC peak areas (500-2000 Da) for differing amounts of cytochrome c (in PBS) applied to the C-CP fiber microcolumn in either 100
or 300 L aliquots. Error bars are based on triplicate injections (n = 3) ......................................................................... 72 3.6 ESI-MS spectra of myoglobin present at a concentration of 200 µg mL-1 (11.8 µM) in a synthetic urine matrix after C-CP fiber desalting; inset - direct injection of 75 µL into the ESI source without C-CP fiber desalting. .............................. 75 3.7 ESI-MS temporal responses for a mixture of CytoC (5 µg, 4.07e-4 µmol) and Myo (9 µg, 5.06e-4 µmol)
present in 100 L of PBS upon elution from a PP C-CP fiber microcolumn. Transient responses represent: - TIC for 500 – 2000 Da, - z = +9 for CytoC, and - z = +12 for Myo. ............................................... 76
4.1 Chemical structures and molecular weights of target isoflavones and internal standard compound ............................. 88 4.2 Diagram of liquid chromatography-particle beam electron ionization mass spectrometer ....................................... 90 4.3 a) UV absorbance detection of separation of isoflavone standard solution. RP-C18 column, linear gradient of 30-90 %B over 40min at a flow rate of 1 mL min-1. b) Selected ion monitoring (SIM) chromatograms for LC-PB/EIMS analysis of isoflavone standard solution ................ 96

xi
List of Figures (Continued) Figure Page 4.4 Extracted mass spectra of the analysis of isoflavone standard solution. a) puerarin, b) daidzein, c) genistein, d) formononetin, e) biochanin A, and f) 7-hydroxy-4-chromone (IS) .............................................. 97 4.5 Extracted SIM chromatograms for the LC-PB/EIMS analysis of SRM 3238 extract. Peaks labeled are the target isoflavones and unknown peaks were identified by structural information obtained. tr 13 = daidzin and tr 17 = genistin ................................................................... 102 4.6 Extracted SIM chromatograms for the LC-PB/EIMS analysis of SRM 3272 extract. Peaks labeled are the target isoflavones. .................................................................... 103 4.7 Extracted SIM chromatograms for the LC-PB/EIMS analysis of SRM 3269 extract. Peaks labeled are the target isoflavones ..................................................................... 103 5.1 LC-PB/EIMS extracted mass spectra and chemical structure of each target isoflavone. a) daidzin, b) glycitin, c) genistin, d) daidzein e) genistein, and f) 7-hydroxy-4-chromone .......................................................... 121 5.2 Extracted SIM chromatograms for the separation of a isoflavone standard mixture ............................................... 124 A.1 Diagrammatic representation of the components of the LS-APGD source as applied in ambient desorption/ionization mass spectrometry ................................................................... 141 A.2 Response of the protonated, pseudo-molecular ion (M+H)+of caffeine as a function of sampling distance between the
plasma and ion sampling orifice. Discharge current = 30 mA, electrolyte = 1 M HNO3, flow rate = 30 µl min-1, He sheath gas flow rate = 1.14 mL min-1, analytical sample: residues
of 10 L, 100 g ml-1 solution in 50:50 H2O:EtOH. Inset: Diagram of sampling geometry ................................................. 145

xii
List of Figures (Continued) Figure Page A.3 Response of the protonated, pseudo-molecular ion (M+H)+ of caffeine as a function of discharge current (sampling distance = 3 mm). Electrolyte = 1 M HNO3, flow rate = 30 µl min-1, He sheath gas flow rate = 1.14 mL min-1,
analytical sample: residues of 10 L, 100 g ml-1 solution in 50:50 H2O:EtOH.................................................................... 146 A.4 Mass spectra obtained in the analysis of caffeine using the a) ESI and b) ADI-LS-APGD sources. Standard ESI conditions of positive ion mode, flow rate 50 µL/min, ESI capillary voltage 4 kV, Sheath gas (He) 30 (AU), ion capillary temperature 250°C,ion capillary voltage 40 V and tube lens offset 95 V, for a 50 µL injection of a 10 µg mL-1 test solution. LS-APGD conditions as described in Fig. A.2, for the dry residue of a 10 µL aliquot of a 50 µg mL-1 test solution ......................................... 149 A.5 Response of the caffeine (M+H)+ signal at m/z = 195 Da to variations in the LS-APGD electrolyte composition. Electrolyte feed rate = 30 µl min-1, discharge current = 15 mA, He sheath gas flow rate = 1.14 mL min-1, analytical sample: residues of 10 µL aliquots of a 100 µg mL-1 solution in 50:50 H2O:EtOH.................................................................... 151 A.6 ADI-LS-APGD mass spectra of green tea and coffee samples.
a) 10 L of an ethanolic green tea tincture, b) a green tea leaf, and c) a coffee bean. Electrolyte = 1 M HNO3, feed rate = 30 µl min-1, discharge current = 15 mA, He sheath gas flow rate = 1.14 mL min-1. * - ions common to catechin compounds ............................................. 154 A.7 ADI-LS-APGD mass spectra of a variety of solid materials. a) cigar tobacco, b) $20 U.S. bill, and c) ibuprofen tablet. Electrolyte = 1 M HNO3, feed rate = 30 µl min-1, discharge current = 15 mA, He sheath gas flow rate = 1.14 mL min-1 ...... 155
1
CHAPTER ONE
INTRODUCTION
1.1 Sample Preparation
Sample preparation is a vital and non-trivial aspect of chemical analyses
that is often taken for granted. Over the past few decades, advancements in
analytical techniques and instrumentation have increased focus towards
decreased solvent and sample volumes, lower waste production, automation,
miniaturization, faster analysis times, and lower overall costs,1 in turn
emphasizing the importance of sample preparation research. An overall analysis
procedure typically consists of several steps including collection, pretreatment,
analyte isolation, identification, quantitation, and data processing. All steps
completed prior to identification, or detection, of the target compounds are part of
the pretreatment and preparation steps which can be time-consuming (up to 60%
of the overall analysis time) and labor-intensive. The main purpose of sample
preparation is to assist in the detection of specific target species by increasing
the selectivity and sensitivity of those chemical species.
Sample preparation steps include physical and chemical operations for the
extraction of analytes from either solid or liquid matrices, altering matrix
composition to be more amendable to analysis, or isolation, enrichment, and/or
derivatization of target analytes.2 There are often challenges in optimizing
sample preparation due to analyte degradation, sample loss, and the introduction

2
of measurement biases. Ideally, sample pretreatment requirements would be
eliminated altogether, but in most instances this is not feasible. Improvements in
the selectivity of separation techniques and the sensitivity of quantitative
instrumentation determinations still have not removed the need for preparative
steps, and despite the efforts over the last few decades, sample preparation
protocols remain tedious and often involve numerous manual manipulations.
Developing and choosing appropriate sample preparation techniques can
be a complex task, and requires fundamental knowledge of equilibrium
conditions and the mass transfer kinetics of the extraction system. There are
many techniques currently available for the extraction of analytes from both liquid
and solid samples, many of which have been developed and/or improved upon in
the past 20 years. Some examples are liquid-liquid extraction (LLE), solvent
microextraction, dispersive liquid-liquid microextraction, solid-phase extraction
(SPE), solid-phase micro-extraction (SPME), and stir-bar-sorptive extraction.
There are also pressurized fluid extractions (PFE) with hot-solvent extraction,
matrix-solid phase dispersion, microwave assisted extraction, and supercritical
fluid extraction (SFE).2, 3 The rapid increased use of automated techniques has
also inspired new formats of sample preparation such as SPE in pipette tips and
well plates. Other mechanical procedures are often applied to increase extraction
efficiencies or decrease extraction times such as crushing, grinding, blending,
sonicating, agitating, and heating.

3
This dissertation will discuss several examples of analytical techniques
where sample preparation is critical and can be used to improve analytical
measurements. It is important to know when and where sample manipulation is
appropriate and how to develop and choose the proper approach(es) to improve
analytical measurements in terms of both qualitative and quantitative
performance. The first example will focus on the field of proteomics with the
specific aim of implementing capillary-channel polymer (C-CP) fibers as solid
phase extraction (SPE) media for sample preparation prior to mass spectrometric
analysis. The second half will discuss the analysis of botanical materials,
focusing on the importance of extraction procedures and method choices on
resulting quantitative measurements. A liquid chromatography-particle beam
electron ionization mass spectrometric (LC-PB/EIMS) technique is employed for
the characterization of isoflavones in soy, red clover, and kudzu standard
reference materials.
1.2 Sample Preparation for the Analysis of Proteins
One area of research that requires extensive sample pretreatment steps
revolves around the analysis of biomolecules. The human genome codes for
over 20,000 proteins, and proteomics is the study of these protein structures and
functions in order to gain insight and understanding of specific biological
pathways and diseases.4 These analytes of interest are found, often in low
concentrations, in highly complex matrices of nucleic acids, lipids, and other

4
cellular materials.5 Common biological matrices, or biofluids, include serum,
plasma, urine, and saliva.6 Other common matrices encountered in protein
studies come from the isolation, purification, and storage procedures, containing
detergents and buffer solutions employed in order to maintain chemical integrity.7
While the term proteomics encompasses the large-scale analysis of proteins, it is
often used to generally describe purification and mass spectrometric detection
techniques.
1.2.1 Mass Spectrometric Techniques for Proteomics
Two popular ionization techniques for the mass spectrometric (MS)
analysis of biomolecules are electrospray ionization (ESI) and matrix-assisted
laser desorption/ionization (MALDI).8-11 Due to the ionization mechanisms
involved, both techniques require essentially salt free samples for analysis. For
the purpose of the studies described in this dissertation, the details of ESI-MS
will be the main focus.
ESI-MS was developed in the late 1980’s, for which John Bennett Fenn
received the 2002 Nobel Prize in Chemistry, and is now one of the most
important analysis techniques for the study of large biomolecules (>100,000
Da).12-14 ESI is extremely valuable in the analyses of biomolecules as it allows
for large, non-volatile molecules to be ionized under atmospheric pressures
directly from a liquid phase, and thus it can be easily coupled to liquid flow
techniques, like liquid chromatography (LC). It quickly gained popularity as early
studies on peptide analysis and sequencing reported that ESI provided a more

5
rapid, sensitive, and accurate technique than previous approaches.15 However,
even with the growth and widespread use of ESI-MS, there are still major
drawbacks and limitations to the technique involving background, interferences,
signal suppression, and inability to handle complex mixtures.12, 15
The overall mechanism of ion formation in ESI begins with a liquid flow
through a capillary that has a high voltage (positive or negative 2-5 kV) applied.
This applied voltage creates what is known as a Taylor cone at the end of the
capillary. The charges formed in the cone will eventually reach the Rayleigh limit,
where the charges on the surface of the droplet overcome the surface tension of
the solution, and charged solvent droplets are released from the capillary tip.
This phenomenon repeats itself as the droplets begin to desolvate, creating
smaller and smaller analyte containing charged droplets. Eventually the surface
charge of the droplets is transferred to the analytes, creating vapor phase ions
which are then analyzed within the mass spectrometer. A graphic representation
of this process is seen in Fig. 1.1.
Figure 1.1: Cartoon depiction of ion formation by electrospray ionization

6
Fragmentation is minimal due to the low energy ions created by the ‘soft’
ionization source.14 ESI produces multiply charged ions, allowing for the analysis
of molecules with masses greater than the range of some common mass
analyzers (i.e. quadrupole).7 Biomolecules, like proteins, tend to produce a m/z
charge distribution that can be readily interpreted and used for molecular weight
(MW) determinations. For example, an unknown single protein solution is
analyzed via ESI-MS and produces a charge distribution at m/z = 1194, 1302,
1432, 1591, and 1790. Using Eq. 1.1 and 1.2, the charge value (n) of each m/z
can be determined and thus the protein MW and identity. The calculated MW of
this protein is 14.3 kDa, and is identified as lysozyme.
n (for m2) = (m1 – 1.0079)/(m2-m1) Eq. 1.1
MW = (m2 – 1.0079) * n Eq. 1.2
Unfortunately, the ESI ionization mechanism is prone to ion suppression,
especially in the case of biomolecules, due to the high concentrations of
contaminates often found in sample solutions. Common buffers used for
biological samples contain ionic species including sulfate, phosphates, chlorides,
sodium, potassium, and ammonia.7,16 These compounds are easily ionizable and
often exist in higher concentrations than the analytes of interest, creating adduct
species or completely suppressing analyte signal. For example, the chemical
components of PBS have been shown to create adduct species [M+nH+mNa](n)+,
[M+nH+mK](n)+ , and [M+nH+mK+mNa](n)+.17 The spectral complexity generated
makes it difficult or impossible to obtain molecular weight determinations.7, 18

7
Sample preparation steps are necessary to remove the interfering compounds
and allow for complete analyte ionization and increased signal intensity and MS
accuracy.15, 19, 20
1.2.2 Solid Phase Extraction
SPE has found a place in the proteomics field and has become a
benchmark approach for the extraction and desalting of proteins prior to analysis.
Often in protein studies, the analytes are found in small volumes (<100 µL) of low
concentration (sub micromolar). SPE formats such as pipette tips allow for the
quantitative transfer of micro-liter volumes of sample/solvent.
Solid phase extraction (SPE) was initially developed to overcome some of
the major drawbacks to liquid-liquid extraction (LLE). Even with the popularity of
LLE as a sample preparation technique, it suffers from labor-intensive steps and
the consumption of large volumes of organic solvents.1, 2 SPE, introduced in the
1970s, utilizes a solid sorbent material for the adsorption of analyte compounds
from either liquid or gaseous matrices and the exclusion of interfering matrix
compounds.21 The result is a sample preparation approach that combines
analyte concentration, sample clean-up, and solvent exchange steps into one
technique.22 This in turn lowers solvent consumption, decreases extraction times,
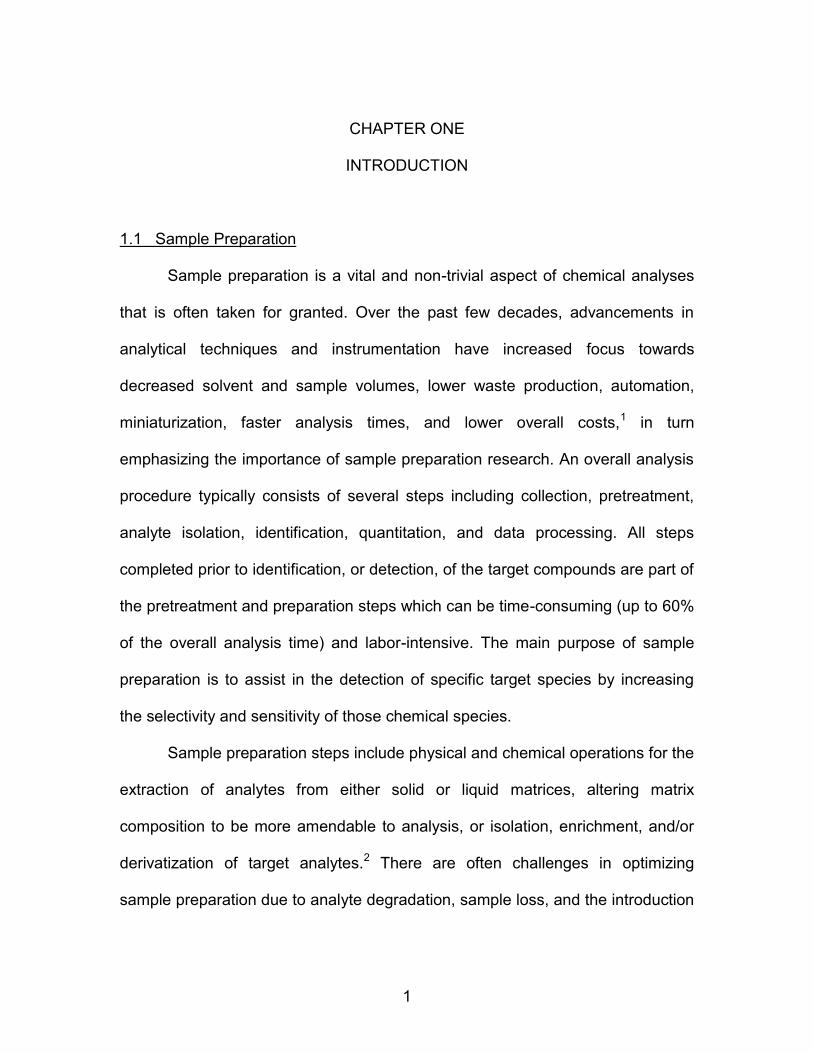
and allows for automation. The overall process of SPE, as seen in Fig. 1.2,
involves adsorbing analyte compounds onto a solid sorbent material, washing
away weakly retained and interfering compounds, and eluting target analytes into
a solvent suitable for subsequent analysis.
8
Figure 1.2: Depiction of overall SPE process
Initially, SPE materials followed closely with sorbent phases in high
performance liquid chromatography (HPLC), where carbon, porous polymer
resins, and bonded-silica phases were predominantly used. The first SPE
products were considered “accumulation columns” and simply used to remove
trace organics from aqueous samples.1 Research then moved towards
developing sorbent materials to provide a pre-concentration technique and
quantitative information.23 It was soon determined that the activated carbon
suffered in terms of recovery compared to the polymeric resins, due to
irreversible binding.23 Bonded-silica phases began to dominate the LC and SPE
field.24 Like the previous phases, the sorbent material was generally formed into
beads and packed into cartridges, columns, and disk formats. Other support
structures began to emerge, such as monoliths. The architecture of the monoliths
provides improved permeability and enhanced mass transfer over the bead
formats, and can be packed into the same cartridges, columns, and disk

9
formats.25-28 The silica based products were able to provide better recovery and
quickly gained popularity, but have specific disadvantages and limited working
ranges (e.g. irreversible binding and pH range) stemming from the presence of
silanol groups and silica solubility. Polymer materials were then investigated for
their use in SPE approaches, because of the resistance to pH extremes, in the
form of polymer beads,29 polymer-based monoliths,30 and textiles/fibers.31, 32 The
robust polymer material provides an SPE format that is both the sorbent phase
and the structural support, and can offer better recoveries than the previous
materials. To increase the range of analytes that could be extracted by the newly
developed SPE formats, a wide range of polymer-type sorbents were employed
to achieve both hydrophilic and hydrophobic interactions.
As new sorbent materials and formats become available, it is essential to
understand the mechanisms and driving forces of the extraction process that
make these techniques successful.3 The basic mechanism of extraction involves
the partitioning of a compound between the sample matrix and the extraction
phase, where the analyte has a greater affinity for the extraction phase.21, 22 In
the case of SPE, where the extraction phase is a solid and the analyte is
dissolved into a liquid solvent, the distribution coefficient, KD, can be explained by
KD = Se/Cs Eq. 1.3
where Se is the concentration of analyte on the surface of the solid extraction
phase, and Cs is concentration of analyte in the sample solution phase. A result
of KD > 1 would indicate the analyte has a stronger interaction with (affinity for)
10
the sorbent material.33 The Se term must inherently reflect the surface area
available for adsorption, displacement effects and the non-linear isotherm, while
also taking into account analyte characteristics; molecular weight, size and
structure, polarity and nature of competitive matrix effects.
The retention of proteins on sorbent materials often differs greatly when
compared to that of small molecules.33 Conformational changes and variability of
protein chemistry/functionality affect the nature of bio-macromolecules at the
interface of the liquid sample solution and the sorbent phase surface. There are
three major properties used to describe the adsorption of proteins. 1) Protein
characteristics - conformational changes, location and nature of binding sites,
overall charge distribution, and isoelectric point. 2) Sorbent surface
characteristics - heterogeneity, topography, hydrophobicity, chemical
composition, and electrical potential. 3) Interface/Solvent characteristics -
composition, pH, ionic strength, temperature, and flow characteristics.34 A solid
understanding the interacting forces will dictate appropriate sorbent phase and
solvent choices, as well as allow for more precise user-control in regards to the
adsorption of desired analytes and the exclusion of undesirable compounds, an
ultimately lead towards more effective sample preparation methods.
1.3 Capillary-Channeled Polymer (C-CP) Fibers
Since their implementation in the 1970s, polymeric resins quickly gained
popularity due to their resistance to pH extremes, available surface modifications,
11
and increased range of applications. There was a major drawback hindering the
growth of polymer resin in SPE applications though - the requirement of laborious
cleaning schemes due to fouling of the sorbent phase surface.35-37 Recently, this
has been overcome with the use of polymer fibers which can serve as both the
sorbent phase and the support material.
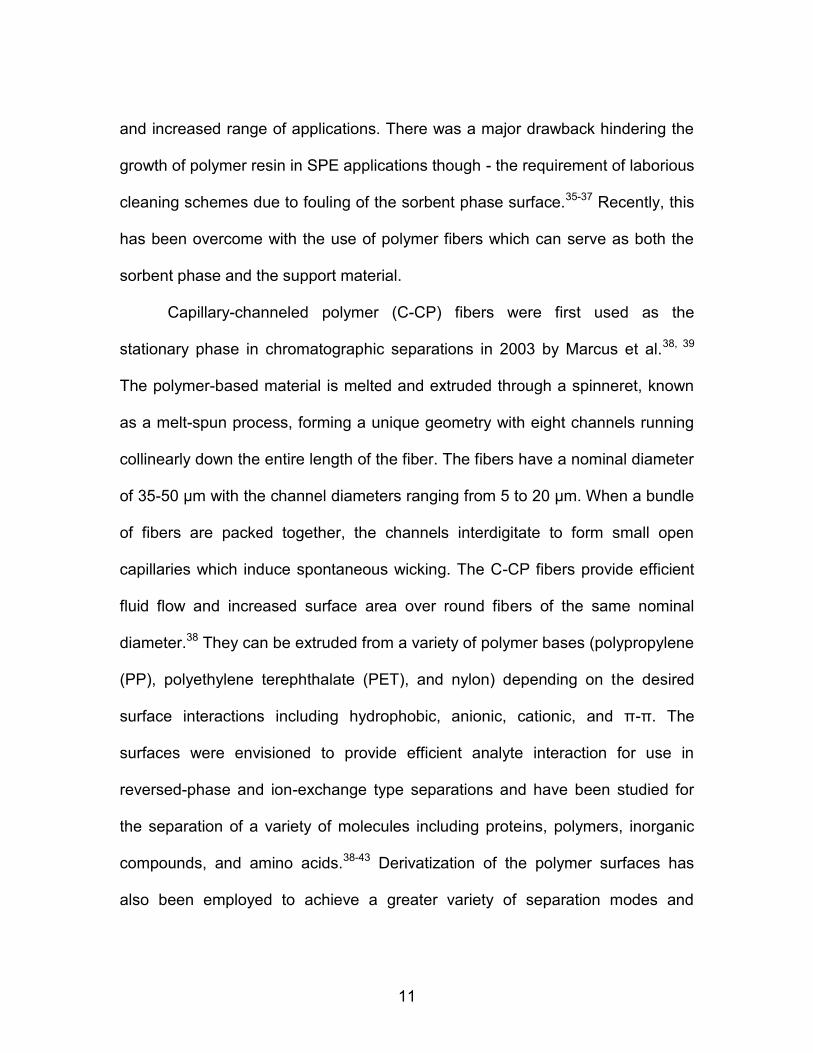
Capillary-channeled polymer (C-CP) fibers were first used as the
stationary phase in chromatographic separations in 2003 by Marcus et al.38, 39
The polymer-based material is melted and extruded through a spinneret, known
as a melt-spun process, forming a unique geometry with eight channels running
collinearly down the entire length of the fiber. The fibers have a nominal diameter
of 35-50 µm with the channel diameters ranging from 5 to 20 µm. When a bundle
of fibers are packed together, the channels interdigitate to form small open
capillaries which induce spontaneous wicking. The C-CP fibers provide efficient
fluid flow and increased surface area over round fibers of the same nominal
diameter.38 They can be extruded from a variety of polymer bases (polypropylene
(PP), polyethylene terephthalate (PET), and nylon) depending on the desired
surface interactions including hydrophobic, anionic, cationic, and π-π. The
surfaces were envisioned to provide efficient analyte interaction for use in
reversed-phase and ion-exchange type separations and have been studied for
the separation of a variety of molecules including proteins, polymers, inorganic
compounds, and amino acids.38-43 Derivatization of the polymer surfaces has
also been employed to achieve a greater variety of separation modes and

12
increased selectivity.44, 45 Columns are constructed by pulling a predetermined
number of fibers collinearly through either standard HPLC stainless steel
columns or microbore polymer tubing.18, 46
Figure 1.3: SEM images of C-CP fibers packed into microbore column (left) and single fiber in resin (right)
In the research discussed here, the C-CP fibers are pulled through FEP
tubing and then cut into smaller segments for use on pipette tips. This format has
recently proven to be a successful approach for the extraction of proteins from
phosphate buffered saline (PBS) solution, tris-buffered solution, and synthetic
biological matrices (e.g. urine and saliva) for analysis by ESI-MS and MALDI-MS
techniques.18, 47, 48 Chapters 2 and 3 discuss in greater detail the application of
PP C-CP fibers for protein SPE applications, employing a micropipette tip format
for UV-VIS absorbance detection and an in-line microcolumn format prior to ESI-
MS analysis. Target proteins cytochrome c, lysozyme, myoglobin, hemoglobin,
and glucose oxidase are used for the C-CP SPE method.
13
1.4 Sample Preparation for the Analysis of Botanical Materials
Nutritional science has influenced the public towards considering more
natural approaches for improving health and the prevention and treatment of
diseases, making nutraceuticals and functional foods a popular and growing
industry. The term nutraceutical, coined in 1989 by Dr. Stephen Felice, is a
combination of the words “nutrition” and “pharmaceutical” and is used to describe
a food or food product that is believed to provide health benefits and protect from
chronic diseases.49 Examples include: folic acid taken during pregnancy to
reduce the risk of birth defects, glucosamine sulphate taken to reduce joint
degeneration, and omega-3 fatty acids taken to improve heart health. While
nutraceutical foods are not under the same rules and regulations as drugs, the
Food and Drug Administration (FDA) works with the American Nutraceutical
Association (ANA) to provide education, manufacturer and product standards,
and other consumer protection functions.50, 51
For many people, the use of nutraceuticals has become a part of their
daily routine; preferred over pharmaceuticals due mainly to a held belief that
desired therapeutic outcomes can be obtained with reduced side effects. In fact,
the popularity of nutraceuticals has turned this industry into a $86 billion per year
business in the U.S. alone. These products include nutrients, dietary
supplements, herbal products, and processed foods. With ever higher levels of
use, there is increased concern for consumer safety. In 1994, the U.S. Congress
passed the Dietary Supplement Health and Education Act (DSHEA) following
14
public debate concerning the importance of dietary supplements in promoting
health, the need for consumers to have access to current and accurate
information about supplements, and controversy over the FDA’s regulatory
approach to this product category. The purpose was to define the term “dietary
supplement” and to provide new regulations for the manufacturing, labeling, and
marketing of dietary supplements. DSHEA defined that a dietary supplement:50-52
is a non-tobacco product intended to supplement the diet, by increasing
the total dietary intake, which carries or contains one or more dietary
ingredients such as vitamins, minerals, herbs/botanicals, and amino acids,
or is a concentrate, metabolite, constituent, extract, or combination of any
ingredient mentioned here.
must be labeled as a dietary supplement and not represented for use as a
conventional food or as a sole item of a meal or the diet.
is intended for ingestion in forms such as capsule, powder, softgel, gelcap,
tablet, and liquid.
DSHEA also authorized the FDA to ensure the quality of dietary
supplement products by enforcing manufacturers of dietary supplements to be in
compliance with good manufacturing practice (GMP) regulations.50 Another
outcome of DSHEA was the establishment of the Office of Dietary Supplements
(ODS) within the National Institutes of Health (NIH), whose purpose was to
explore more fully the potential role of dietary supplements. Since its creation,

15
the ODS and the scientific community as a whole has worked diligently to
characterize the active components present in dietary supplements and to
understand the nature of the chemical behaviors/effects in the human body.
An important aspect of these types of studies is the development and
choice of analytical methods for the extraction, separation, detection, and
quantitation of chemical components present in botanical products. It is important
to have the ability to accurately and precisely identify all of the active
compounds, adulterants, and contaminants present. Sample preparation for
these botanical materials determines the success of downstream analyses. In
order to accurately determine and quantitate a material’s active component
profile, it is essential to extract all analytes of interest and retain the original and
natural chemical forms. With a proper extraction procedure chosen, the
compounds of interest can then be subjected to separation and detection
methods.
1.5 Liquid Chromatography Particle Beam Mass Spectrometry
The development of analytical methods that provide accurate and precise
measurements for the separation, detection, and quantitation of active
compounds, as well as contaminants and potential adulterants in botanical
products and dietary supplements, is of great importance. It is also desired to
have one instrument capable of providing more than one type of chemical
information. Briefly described here is the use of a particle beam interface for the

16
characterization of active components in botanical extracts using a LC separation
prior to UV-VIS absorbance and EI-MS detection. More detailed descriptions for
the optimization of extraction procedures, separation approaches, and detection
modes for the characterization of botanical products and dietary supplements,
and the method validation using NIST standard reference materials (SRMs), will
be given in Chapters 4 and 5.
1.5.1 Electron Ionization Mass Spectrometry
In the research described here, electron ionization (EI) is used for the
mass spectrometric detection of the target analytes. This ionization method was
first used for mass spectrometry in 1918 by Dempser.53 It was first referred to as
electron impact ionization and was utilized for organic species weighing less than
600 Da. When a metal (typically tungsten or rhenium) filament is resistively
heated under high vacuum conditions (~ 10-6 Torr), a pool of electrons is created.
By applying a voltage, the electrons are repelled towards the source block,
creating an electron “beam” with sufficient energy to cause excitation and
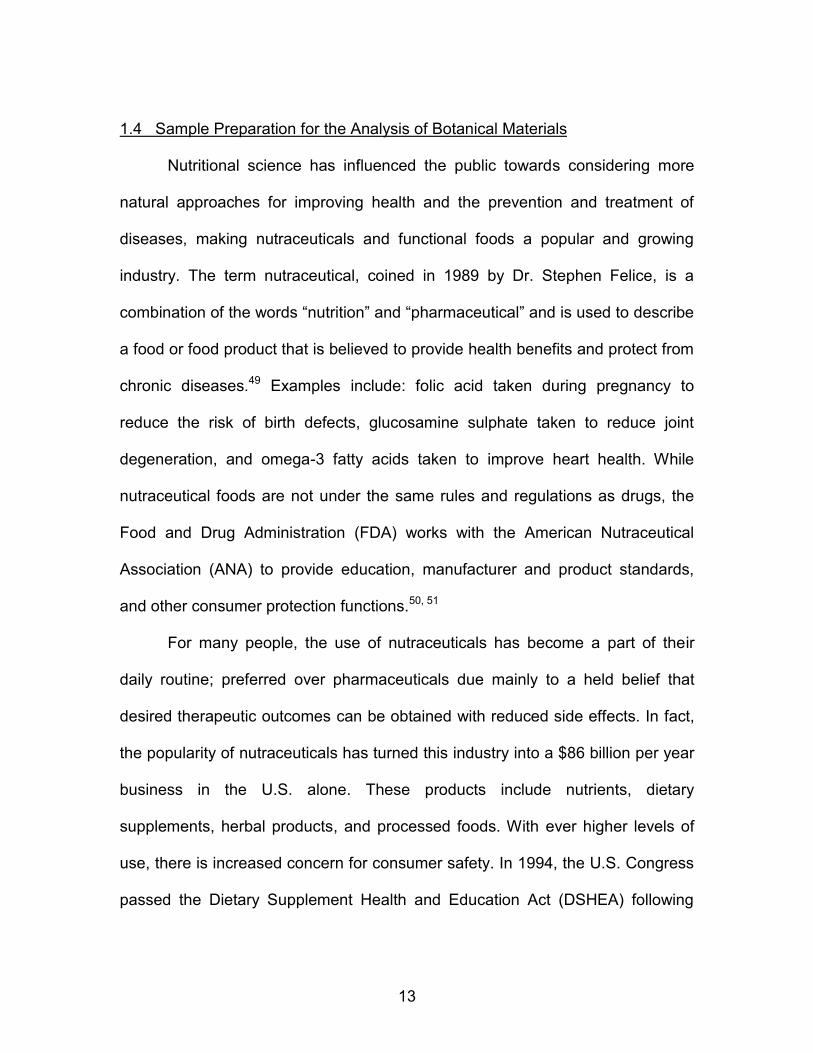
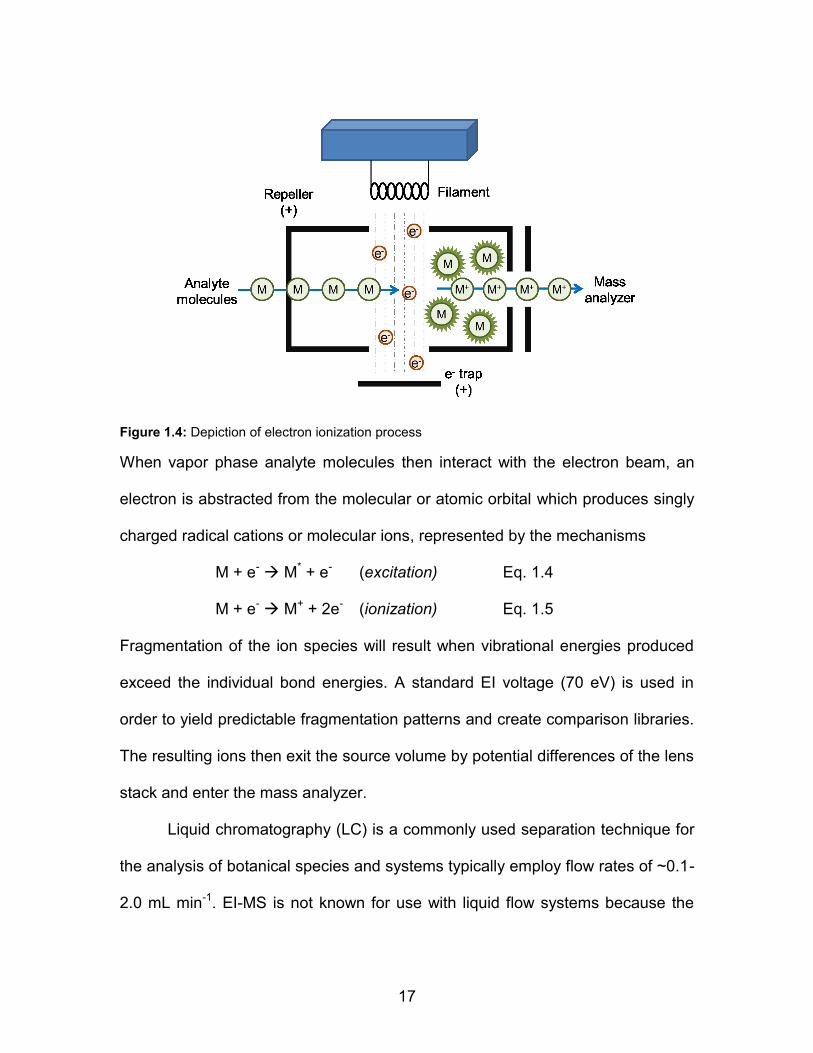
ionization (Fig. 1.4).
17
Figure 1.4: Depiction of electron ionization process
When vapor phase analyte molecules then interact with the electron beam, an
electron is abstracted from the molecular or atomic orbital which produces singly
charged radical cations or molecular ions, represented by the mechanisms
M + e- M* + e- (excitation) Eq. 1.4
M + e- M+ + 2e- (ionization) Eq. 1.5
Fragmentation of the ion species will result when vibrational energies produced
exceed the individual bond energies. A standard EI voltage (70 eV) is used in
order to yield predictable fragmentation patterns and create comparison libraries.
The resulting ions then exit the source volume by potential differences of the lens
stack and enter the mass analyzer.
Liquid chromatography (LC) is a commonly used separation technique for
the analysis of botanical species and systems typically employ flow rates of ~0.1-
2.0 mL min-1. EI-MS is not known for use with liquid flow systems because the

18
source has high vacuum pressure requirements, and the solvent vapors would
cause spectral interferences and signal suppression.54 However, the combination
of these techniques would provide a truly advantageous system for LC/MS
analyses. EI sources are convenient to use for small molecules (<103 Da),
provide good sensitivities due to the high ion currents, and the resulting
fragmentation makes chemical identification possible. EI-MS is envisioned to
produce easily interpretable spectra for the characterization of the active
components in botanical products and dietary supplements and provide both
qualitative and quantitative information simultaneously.
1.5.2 Particle Beam Interface
A particle beam (PB) interface was developed in 1984 in an effort to turn
liquid flow samples into the gas phase for use with EI-MS techniques.55, 56 The
device allows for a wide range of LC solvent compositions and flow rates (0.2-2.0
mL min-1) to be coupled with low pressure (<10-4 Torr) ionization sources by
producing a “beam” of dry analyte particles.57 The PB interface has been used by
Marcus and co-workers for coupling a wide range of liquid sample applications to
both glow discharge and EI ionization sources with optimal emission (OES) and
MS detection.58-69
19
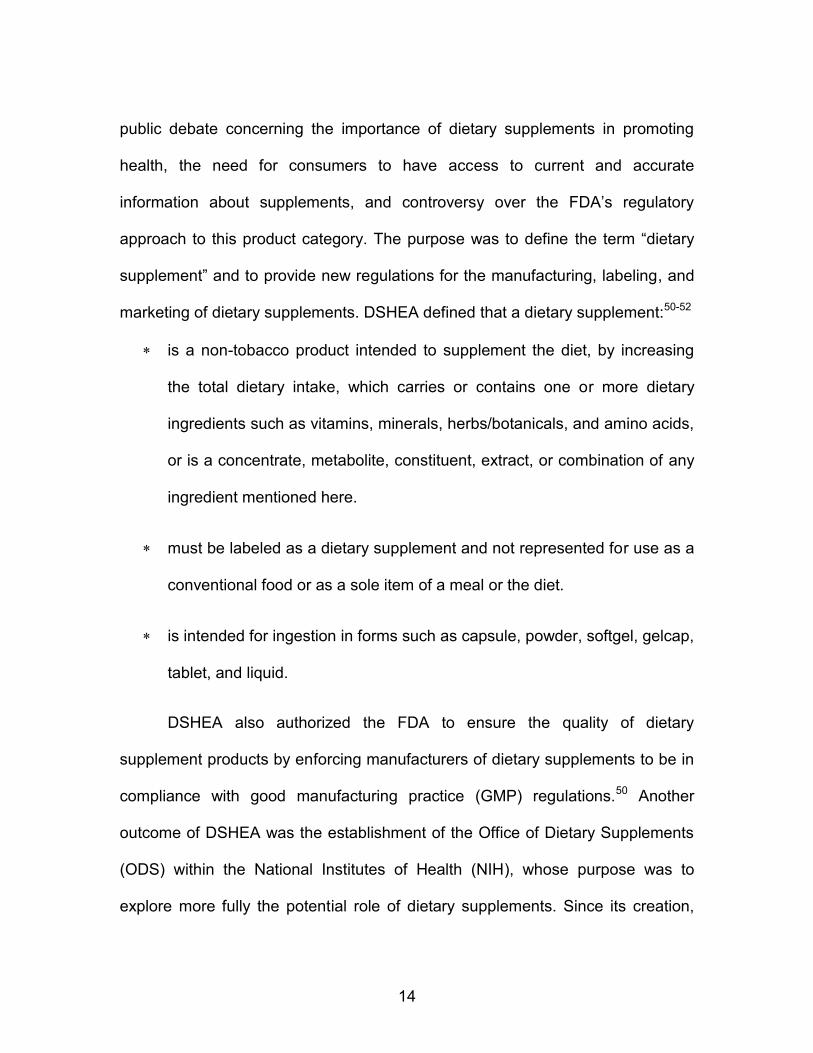
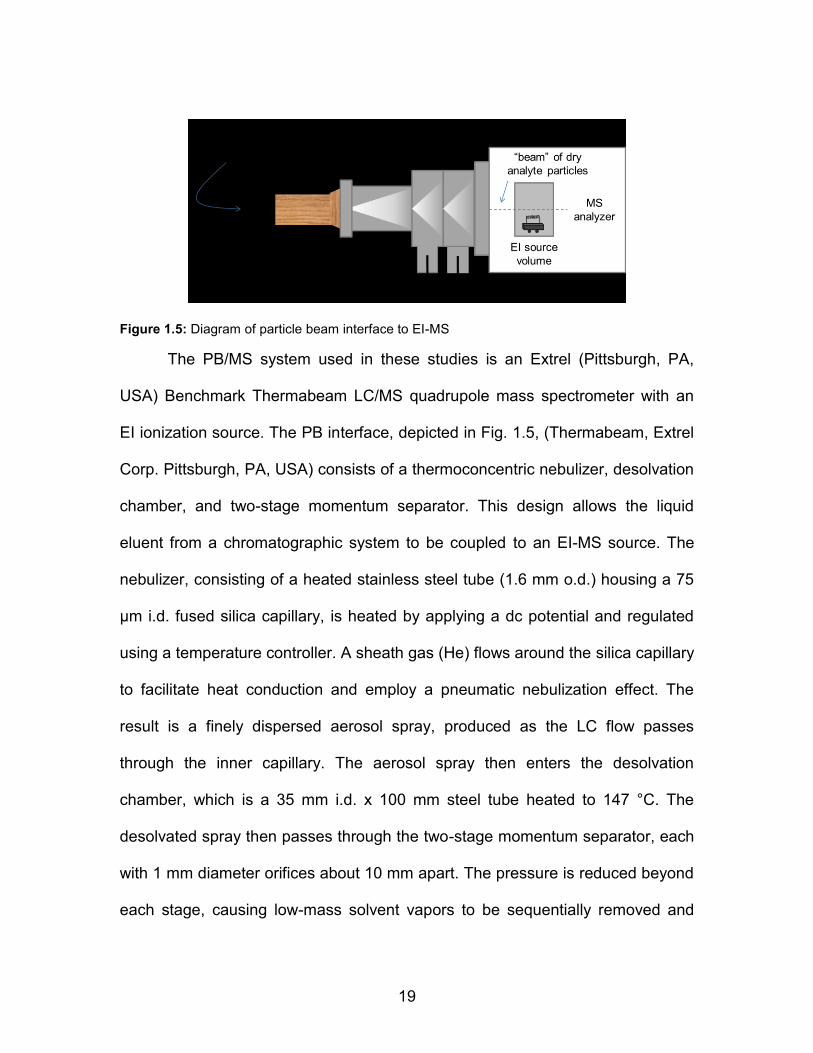
Figure 1.5: Diagram of particle beam interface to EI-MS
The PB/MS system used in these studies is an Extrel (Pittsburgh, PA,
USA) Benchmark Thermabeam LC/MS quadrupole mass spectrometer with an
EI ionization source. The PB interface, depicted in Fig. 1.5, (Thermabeam, Extrel
Corp. Pittsburgh, PA, USA) consists of a thermoconcentric nebulizer, desolvation
chamber, and two-stage momentum separator. This design allows the liquid
eluent from a chromatographic system to be coupled to an EI-MS source. The
nebulizer, consisting of a heated stainless steel tube (1.6 mm o.d.) housing a 75
µm i.d. fused silica capillary, is heated by applying a dc potential and regulated
using a temperature controller. A sheath gas (He) flows around the silica capillary
to facilitate heat conduction and employ a pneumatic nebulization effect. The
result is a finely dispersed aerosol spray, produced as the LC flow passes
through the inner capillary. The aerosol spray then enters the desolvation
chamber, which is a 35 mm i.d. x 100 mm steel tube heated to 147 °C. The
desolvated spray then passes through the two-stage momentum separator, each
with 1 mm diameter orifices about 10 mm apart. The pressure is reduced beyond
each stage, causing low-mass solvent vapors to be sequentially removed and
20
leaving a “beam” of dry analyte particle to enter the heated (~275 °C) EI source
block where they are vaporized and ionized.57, 70, 71 Voltages placed on the exit
lenses accelerate the ions into the mass analyzer for detection. The specific
instrument used will be described in greater detail in relevant chapters.
Chapters 4 and 5 detail the development of a method of analysis for the
characterization of isoflavones in certain botanical products, more specifically
soy, red clover, and kudzu, using a liquid chromatography particle beam electron
ionization mass spectrometer (LC-PB/EIMS). Isoflavones are a sub-class of
polyphenols heavily studied for their potential health benefits, and will be
discussed in greater detail in later chapters. In Chapter 4, a suite of five
isoflavones is characterized across proposed soy, red clover and kudzu SRM
materials, and in Chapter 5 the LC-PB/EIMS technique is compared directly with
the NIST method of analysis for the characterization of isoflavones in soy SRM
materials.
1.6 Summary
As outlined in this chapter, sample preparation often is the bottleneck of
analytical techniques. There are ongoing studies to improve existing techniques
or to develop completely new procedures. Described in the following chapters
are two specific analytical techniques with respective sample preparation
challenges. The first topic revolves around the use of capillary-channeled
polymer (C-CP) fibers as a sorbent material for protein sample SPE approaches.

21
The second issue deals with the characterization of active components in
botanical matrices with use of the LC-PB/EIMS technique.
Chapter 2 has been accepted for publication by Analyst (DOI:
10.1039/c2an36126d) and describes the use of C-CP fibers as a sorbent material
in SPE micropipette tip formats for the desalting of proteins from buffer and
complex matrices. Chapter 3 continues the use of C-CP fibers for protein
analysis in an in-line microcolumn format prior to ESI-MS detection, and is
submitted to the Journal of The American Society for Mass Spectrometry
(JASMS). Chapter 4 will be submitted to the Association of Analytical
Communities and describes the characterization of isoflavones in soy, red clover,
and kudzu materials via the LC-PB/EIMS technique. Chapter 5 is being prepared
for submission to Analytical and Bioanalytical Chemistry, and is a direct method
comparison for the characterization of soy isoflavones comparing the LC-
PB/EIMS technique and NIST approve methods, and is co-authored with Dr.
Melissa Phillips from the National Institute of Standards and Technology.
References 1. J. S. Fritz, Analytical Solid-Phase Extraction, John Wiley & Sons, Inc, New
York, NY, 1999. 2. L. Ramos, Journal of Chromatography A, 2012, 1221, 84-98. 3. J. Pawliszyn, Analytical Chemistry, 2003, 75, 2543-2558. 4. D. A. Egas and M. J. Wirth, Annual Review of Analytical Chemistry, 2008,
1, 833-855.

22
5. A. Manz, N. Pamme and D. Iossifidis, Bioanalytical Chemistry, Imperial College Press, 2004.
6. E. M. Thurman and M. S. Mills, Solid-Phase Extraction: Principles and
Practice, John Wiley and Sons, 1998. 7. E. de Hoffman, J. Charette and V. Stroobant, Mass Spectrometry:
Principles and Applications, Wiley, Chichester, 1996. 8. D. N. Nguyen, G. W. Becker and R. M. Riggin, Journal of Chromatography
A, 1995, 705, 21-45. 9. M. Mann, R. C. Hendrickson and A. Pandey, Annual Review of
Biochemistry, 2001, 70, 437-473. 10. R. K. Upmacis, D. P. Hajjar, B. T. Chait and U. A. Mirza, Journal of the
American Chemical Society, 1997, 119, 10424-10429. 11. J. S. Becker and N. Jakubowski, Chemical Society Reviews, 2009, 38,
1969-1983. 12. A. L. Rosen and G. M. Hieftje, Spectrochimica Acta Part B-Atomic
Spectroscopy, 2004, 59, 135-146. 13. J. Szpunar, R. Lobinski and A. Prange, Applied Spectroscopy, 2003, 57,
102A-112A. 14. K. A. Rubinson and J. F. Rubinson, Contemporary instrumental analysis,
Prentice Hall, Upper Saddle River, NJ [etc.], 2000. 15. N. B. Cech and C. G. Enke, Mass Spectrometry Reviews, 2001, 20, 362-
387. 16. N. E. Good, G. D. Winget, W. Winter, T. N. Connolly, S. Izawa and R. M.
M. Singh, Biochemistry, 1966, 5, 467-&. 17. J. R. Chapman, Practical Organic Mass Spectrometry, John Wiley & Sons,
Inc, Baffins Lane, Chichester, 1993. 18. D. S. Fornea, Y. Wu and R. K. Marcus, Analytical Chemistry, 2006, 78,
5617-5621. 19. A. Shukla and R. E. Majors, LCGC North America, 2005, 23, 646-660.
23
20. F. Xiang and R. C. Beavis, Rapid Communications in Mass Spectrometry, 1994, 8, 199-204.
21. N. Simpson and K. C. Van Horne, Sorbent Extraction Technology
Handbook, Varian Sample Preparation Products, Harbor City, 1993. 22. N. J. K. Simpson, Solid-Phase Extraction: Principles, Techniques, and
Applications, Marcel Dekker, Inc, New York, NY, 2000. 23. A. K. Burnham, G. V. Calder, R. Willis, H. J. Svec, J. S. Fritz and G. A.
Junk, Analytical Chemistry, 1972, 44, 139-143. 24. R. E. Majors, Abstracts of Papers of the American Chemical Society,
1997, 214, 171-ANYL. 25. S. F. Xie, F. Svec and J. M. J. Frechet, Chemistry of Materials, 1998, 10,
4072-4078. 26. F. Svec and J. M. J. Frechet, Journal of Molecular Recognition, 1996, 9,
326-334. 27. C. W. Huck and G. K. Bonn, J Chromatogr A, 2000, 885, 51-72. 28. J. Schulein, D. Martens, P. Spitzauer and A. Kettrup, Fresenius Journal of
Analytical Chemistry, 1995, 352, 565-571. 29. B. L. Gong, C. M. Bo, J. X. Zhu and C. Yan, Journal of Applied Polymer
Science, 2009, 113, 984-991. 30. B. Brand, M. Krattli, G. Storti and M. Morbidelli, Journal of Separation
Science, 2011, 34, 2159-2163. 31. Y. Yang, A. Velayudhan, C. M. Ladisch and M. R. Ladisch, Journal of
Chromatography A, 1992, 598, 169-180. 32. K. Hamaker, S.-L. Rau, R. Hendrickson, J. Liu, C. M. Ladisch and M. R.
Ladisch, Industrial & Engineering Chemistry Research, 1999, 38, 865-872. 33. G. D. Parfitt, Abstracts of Papers of the American Chemical Society, 1983,
185, 55-COLL. 34. J.Toth, Adsorption:Theory,Modeling,and Analysis, Marcel Dekker,Inc, New
york, 2002.
24
35. I. Liska, Journal of Chromatography A, 2000, 885, 3-16. 36. E. E. McNeil, R. Otson, W. F. Miles and F. J. M. Rajabalee, Journal of
Chromatography, 1977, 132, 277-286. 37. G. A. Junk, Advances in Chemistry Series, 1987, 201-246. 38. R. K. Marcus, W. C. Davis, B. C. Knippel, L. LaMotte, T. A. Hill, D. Perahia
and J. D. Jenkins, J. Chromatogr. A, 2003, 986, 17. 39. D. K. Nelson and R. K. Marcus, J. Chromatogr. Sci., 2003, 41, 475. 40. R. D. Stanelle, M. Mignanelli, P. Brown and R. K. Marcus, Analytical and
Bioanalytical Chemistry, 2006, 384, 250-258. 41. R. D. Stanelle, C. A. Straut and R. K. Marcus, Journal of Chromatographic
Science, 2007, 45, 415-421. 42. R. D. Stanelle and R. K. Marcus, Analytical and Bioanalytical Chemistry,
2009, 393, 273-281. 43. K. J. Hilbert and R. K. Marcus, Journal of Separation Science, 2010, 33,
3571-3577. 44. J. J. Pittman, V. Klep, I. Luzinov and R. K. Marcus, Analytical Methods,
2010, 2, 461-469. 45. J. M. Goddard and J. H. Hotchkiss, Progress in Polymer Science, 2007,
32, 698-725. 46. D. M. Nelson and R. K. Marcus, Analytical Chemistry, 2006, 78, 8462-
8471. 47. J. J. Pittman, B. T. Manard, P. J. Kowalski and R. K. Marcus, J Am Soc
Mass Spectrom, 2012, 23, 102-107. 48. B. T. Manard and R. K. Marcus, J. Am. Soc. Mass Spectrom., 2012, 23,
1419-1423. 49. E. K. Kalra, Aaps Pharmsci, 2003, 5. 50. S. Melethil, Life Sciences, 2006, 78, 2049-2053. 51. C. Noonan and W. P. Noonan, Toxicology, 2006, 221, 4-8.

25
52. M. J. Glade, Nutrition, 1997, 13, 999-1001. 53. C. Dass, Fundamentals of Contemporary Mass Spectrometry, John Wiley
& Sons, Inc, Hoboken, New Jersey, 2007. 54. W. M. A. Niessen and A. P. Tinke, Journal of Chromatography A, 1995,
703, 37-57. 55. R. C. Willoughby and R. F. Browner, Analytical Chemistry, 1984, 56,
2626-2631. 56. C. S. Creaser and J. W. Stygall, Analyst, 1993, 118, 1467-1480. 57. T. M. Brewer, J. Castro and R. K. Marcus, Spectrochimica Acta Part B-
Atomic Spectroscopy, 2006, 61, 134-149. 58. R. K. Marcus, Abstracts of Papers of the American Chemical Society,
2000, 220, 155-ANYL. 59. W. C. Davis, F. X. Jin, M. A. Dempster, J. L. Robichaud and R. K. Marcus,
Journal of Analytical Atomic Spectrometry, 2002, 17, 99-103. 60. W. C. Davis, J. L. Venzie, B. Willis, R. L. Coffee, D. P. Arya and R. K.
Marcus, Rapid Communications in Mass Spectrometry, 2003, 17, 1749-1758.
61. F. X. Jin and R. K. Marcus, Journal of Analytical Atomic Spectrometry,
2003, 18, 589-595. 62. F. X. Jin, J. J. Hickman, K. Lenghaus and R. K. Marcus, Journal of
Analytical Atomic Spectrometry, 2004, 19, 1199-1205. 63. T. M. Brewer, B. Fernandez and R. K. Marcus, Journal of Analytical
Atomic Spectrometry, 2005, 20, 924-931. 64. M. V. B. Krishna, J. Castro, T. M. Brewer and R. K. Marcus, Journal of
Analytical Atomic Spectrometry, 2007, 22, 283-291. 65. J. L. Venzie, J. Castro, M. V. B. Krishna, D. M. Nelson and R. K. Marcus,
Analytical and Bioanalytical Chemistry, 2007, 387, 321-333. 66. J. Castro, M. V. M. Krishna and R. K. Marcus, American Laboratory, 2008,
40, 8-+.
26
67. C. D. Quarles and R. K. Marcus, Spectrochimica Acta Part B-Atomic Spectroscopy, 2009, 64, 1185-1193.
68. J. Castro, M. V. B. Krishna, J. R. Choiniere and R. K. Marcus, Analytical
and Bioanalytical Chemistry, 2010, 397, 1259-1271. 69. J. Castro, T. Pregibon, K. Chumanov and R. K. Marcus, Talanta, 2010, 82,
1687-1695. 70. R. K. Marcus, M. A. Dempster, T. E. Gibeau and E. M. Reynolds,
Analytical Chemistry, 1999, 71, 3061-3069. 71. T. E. Gibeau and R. K. Marcus, Analytical Chemistry, 2000, 72, 3833-
3840.

27
CHAPTER TWO
SOLID PHASE EXTRACTION OF PROTEINS FROM BUFFER SOLUTIONS
EMPLOYING CAPILLARY-CHANNELED POLYMER (C-CP) FIBERS AS THE
STATIONARY PHASE
2.1 Introduction
Sample preparation is a general term used to describe the alteration of a
sample in order to make it conducive for subsequent analyses.1-4 This
transformation may be executed through dissolution, extraction, concentration,
and/or purification. At present, solid phase extraction (SPE) is the most widely
applied approach to sample preparation of biological samples due to the complex
matrices in which they reside. SPE was initially envisioned as a complementary
technique to liquid-liquid extraction, but due to its numerous advantages it has
become a benchmark approach. 3, 5-8 SPE approaches are amenable to smaller
sample and solvent volumes, are simpler to perform, and provide great breadth
in the available extraction modes, ultimately integrating sample extraction,
concentration, and introduction into a single process.3, 5-8
SPE has roots in high performance liquid chromatography (HPLC) as it
often takes advantage of the same stationary phases that are employed in
reversed-phase, ion-exchange, and affinity chromatographies.3, 9-11 Target
sample species are adsorbed to the stationary phase due to a greater affinity for
that material than for the primary sample phase. The analyte is subsequently
28
desorbed and transferred into a solvent more appropriate for further
manipulations or a specific analytical measurement. SPE has been applied to a
wide range of systems, including environmental, medicinal, forensics, soil and
water conservation, and food analysis.3, 8 The ability to choose from a range of
different sorbents and extraction solvents allows for considerable control and
flexibility when designing a specific pretreatment process.
Effective SPE sorbents are chosen based on a range of properties
including chemical versatility and stability, efficient surface contact for the
analyte, and high recoveries.1, 3, 4, 12 The elution solvent composition can be
adjusted based on the retention characteristics of the species and the
subsequent analytical methods employed. Initial efforts in SPE employed
bonded silica- and activated carbon-derived sorbents in the form of packed
cartridges and columns.9, 13 Due to the limited pH working range (based on the
presence of silanol groups and silica solubility) and irreversible analyte
adsorption there has been a necessity for the development of other sorbent
types, especially in the field of proteomics.3, 12-16 Organic polymer stationary
phases can offer a greater range of chemical and pH stability, improved
adsorption/desorption kinetics, and an increased breadth of potential bed
formats.3, 7, 13, 15-19
Biological samples are a challenge for many instrumental analysis
techniques due to the complex buffered matrices commonly used to purify and
store samples. Virtually universal, regardless of the detection method, high salt

29
content decreases signal intensities, increases limits of detection, and can even
make detection of the desired analytes impossible. Therefore, matrix
modification (extraction and concentration) methods are required to render the
samples conducive for further investigations; SPE has proven to be a simple and
successful approach.3, 20-23 SPE of proteins has been employed, both as
standalone processing and prior to chromatographic separations, across different
detection techniques including UV-VIS absorbance, fluorescence, mass
spectrometry (MS) employing various ionization methods, and gas
chromatography with flame-ionization detection (FID).12, 20, 24-30
This laboratory has developed capillary-channeled polymer (C-CP) fibers
as stationary phases for the chromatographic separation of proteins31-34 and is
currently investigating the use of these fibers as SPE sorbent material for
proteomic and trace metals applications.35-38 The fibers have interesting
characteristics that stem from their unique shape, consisting of eight parallel
channels that run the entire length of the fiber. C-CP fibers provide larger
surface areas than circular cross section fibers of the same nominal diameter,
with the ability for close packing as the fibers interdigitate, providing for very
efficient fluid flow. Diversity in the potential analyte-surface interactions is
achieved based on the polymer (i.e. polypropylene (PP), polyester (PET), and
nylon) used in the fiber extrusion process. While the fibers have low specific
surface areas when compared to porous silica phases, the increased chemical
stability, increased mass transfer efficiency, and lower material costs are all

30
potential advantages.9, 31, 34, 39 Initial studies of the C-CP fibers in an SPE
micropipette tip format focused on their use in desalting of proteins in buffer
solutions prior to analysis by electrospray ionization mass spectrometry (ESI-
MS).35 Direct injection analysis of lysozyme in phosphate buffered saline (PBS)
and myoglobin in Tris buffer yielded a continuum of peaks in the ESI-MS spectra.
The same solutions were subjected to SPE on PP C-CP fibers by placing a fiber-
containing tip on an Eppendorf pipette, and passing the test solution across the
fibers multiple times by manual aspiration. The respective proteins were eluted
in 50:50 H2O:ACN and the solutions introduced in the ESI source. Significant
improvement in the clarity and quality of the resulting ESI-MS spectra was
achieved as only signals associated with the proteins of interest were observed.
Subsequent studies have looked toward the use of the C-CP materials (films and
fibers) to desalt proteins samples prior to MALDI-MS analysis.37, 38
Presented here is a quantitative characterization of C-CP fibers for the
extraction of proteins from buffer and mock-biological matrices. The
methodology here is not specific to any particular detection method, focusing on
the basic adsorption phenomena. The recovery characteristics of PP C-CP
micropipette tips for the SPE extraction of several different proteins from a PBS
matrix are reported. The current method employs a centrifugation method to
induce fluid transport across the fiber surface rather than the previous manual
aspiration,35 that is common to many commercially-available SPE cartridge and
micropipette tip-type devices.6, 35, 40 Given the difficulties in obtaining quantitative

31
data via ESI-MS, the sequential steps of the SPE method are assessed here via
UV-VIS absorbance spectrophotometry in order to determine the relative
efficiencies of the extraction process. The target proteins used were cytochrome
c, lysozyme, myoglobin, and glucose oxidase. Overall, the observed recoveries
for the protein samples in PBS matrix were very similar, averaging ~80 - 90%,
with tip loading capacities being on the order of 1.5 µg protein per 5 mg of fiber.
Protein extracted from synthetic urine and saliva matrices provided recoveries of
~90%. The overall precision was limited by the UV-VIS absorbance
measurement procedure, and not the extraction per se, as the RSDs found for
the spectrophotometer for neat protein solutions was ~ 8%. The C-CP fiber SPE
format offers a number of advantageous characteristics that make its use in the
proteomics and trace analysis fields very promising.
2.2 Experimental
2.2.1 Reagents and Chemicals
Four proteins were employed to characterize the recovery characteristics
of the C-CP fiber SPE tips: cytochrome c (12.3 kDa, bovine heart), lysozyme
(14.3 kDa, chicken egg white), myoglobin (16.9 kDa, horse) and glucose oxidase
(106 kDa, type VII, Aspergillus niger). Sodium chloride (NaCl), sodium
phosphate dibasic (Na2HPO4), potassium phosphate monobasic (KH2PO4),
potassium phosphate dibasic (K2HPO4) and each of the proteins were obtained
from Sigma-Aldrich (St. Louis, MO). Potassium chloride (KCl) and magnesium
32
chloride (MgCl2) were obtained through Fisher Chemicals (Pittsburgh, PA).
Carboxymethylcellulose sodium salt was obtained from Alfa Aesar (Heyshaw,
England), calcium chloride (CaCl2) from Mallinckrodt (Paris, KY), and urea from
Amresco (Solon, Ohio). Synthetic urine was purchased from Ricca Chemical
Company (Arlington, TX). ACS grade acetonitrile (ACN (Mallinckrodt Baker Inc.,
Phillipsburg, NJ) was used as the organic mobile phase eluent. All aqueous
based solutions and mobile phases were prepared using milliQwater (18.2
MΩ/cm) derived from a NANOpure Diamond Barnstead/Thermolyne Water
System (Dubuque, IA).
Protein stock solutions (1 mg mL-1) were prepared in milliQwater, stored at
2 oC, and then diluted to the desired concentrations in the different matrices for
analysis. Phosphate buffered saline (PBS; 140 mM NaCl, 10 mM Na2HPO4, 1.8
mM KH2PO4, and 2.7 mM KCl) was prepared in-house, as was the synthetic
saliva matrix (15.6 mM NaCl, 16.5 mM KCl, 1.01 mM CaCl2, 0.361 mM MgCl2,
2.07 mM K2HPO4, 16.3 mM urea, and 5.0 g/L carboxymethylcellulose sodium
salt).41 While there are certainly optimum elution conditions for different solutes,
the elution solvent was a 50:50 mixture of ACN and DI-H2O throughout this work,
a mixture common in ESI-MS analyses.
2.2.2 Fiber Tip Construction
Polypropylene fibers were extruded in the School of Materials Science of
Clemson University.42 To achieve a fiber arrangement that allows for efficient
fluid flow in sample loading and elution, a packing approach similar to that of the

33
microbore C-CP fiber HPLC columns was employed.35, 43 The tip assembly
procedure includes a seven-rotation loop of the PP fibers (corresponding to a
total of 658 fibers, each ~30 μm in diameter and ~168 µm in perimeter) pulled
collinearly through approximately 300 mm lengths of 0.8 mm i.d. fluorinated
ethylene polypropylene (FEP) polymer tubing (Cole Parmer, Vernon Hills, IL),
resulting in an interstitial fraction εi ≈ 0.65.44 Figure 2.1 is a scanning electron
micrograph image of the cross section of a “dry” column showing the
interdigitation of the fibers upon packing. Anti-static surfactant, or spin coating,
applied to the fibers during the extrusion process must to be removed in order to
permit the desired hydrophobic analyte-surface interactions.
Figure 2.1: SEM image of a cross section of a PP C-CP fiber packed tip, illustrating the interdigitation of the fiber channels upon packing.
The fibers (in the capillary column) were washed utilizing a Waters (Milford, MA,
USA) high-performance liquid chromatography system, with a 600s series
controller, 626 LC pump, and 996 photodiode array UV-VIS detector. The
system was controlled through the Millennium EmPower 2 software. Successive
34
wash solutions of 100% ACN, 100% hexane, 100% isopropyl alcohol, and finally
100% DI-H2O were pumped through the capillary column (1mL min-1). Each
solvent was flushed until a stable baseline absorbance signal was achieved for at
least 10 min. The capillary was then removed from the HPLC system in order to
construct the individual tips.
At one end of the capillary, the FEP tubing was carefully scored using a
surgical-grade scalpel and stripped to leave about 20 mm of free fiber to allow
the fibers to be pulled down the column, to create a 6 mm open space for
compression fitting to a 1 mL, low-retention pipette tip (Molecular BioProducts,
San Diego, CA). The other end of the capillary was cut so that there was a 10
mm length of fiber packed tubing, producing a ~16 mm-long tip. This procedure
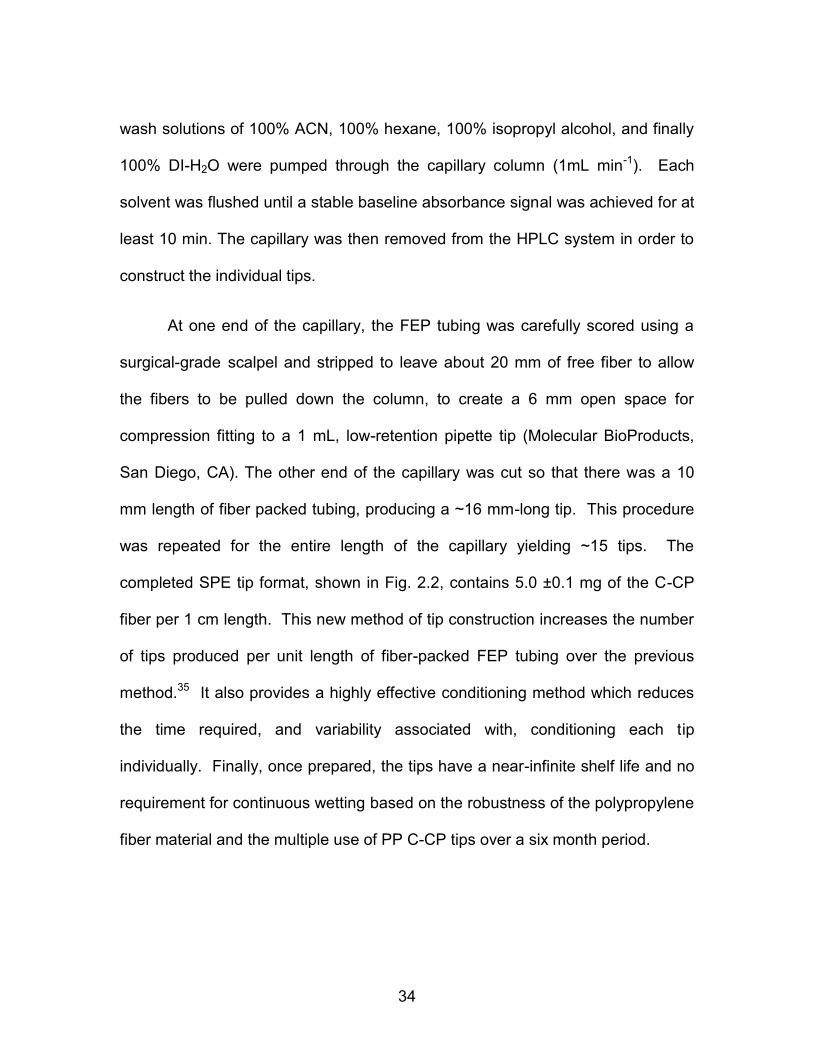
was repeated for the entire length of the capillary yielding ~15 tips. The
completed SPE tip format, shown in Fig. 2.2, contains 5.0 ±0.1 mg of the C-CP
fiber per 1 cm length. This new method of tip construction increases the number
of tips produced per unit length of fiber-packed FEP tubing over the previous
method.35 It also provides a highly effective conditioning method which reduces
the time required, and variability associated with, conditioning each tip
individually. Finally, once prepared, the tips have a near-infinite shelf life and no
requirement for continuous wetting based on the robustness of the polypropylene
fiber material and the multiple use of PP C-CP tips over a six month period.
35
Figure 2.2: Set of completed PP C-CP fiber packed micropipette tips. Each tip contains 10 mm of
packed tubing, corresponding to ~5 mg of fiber.
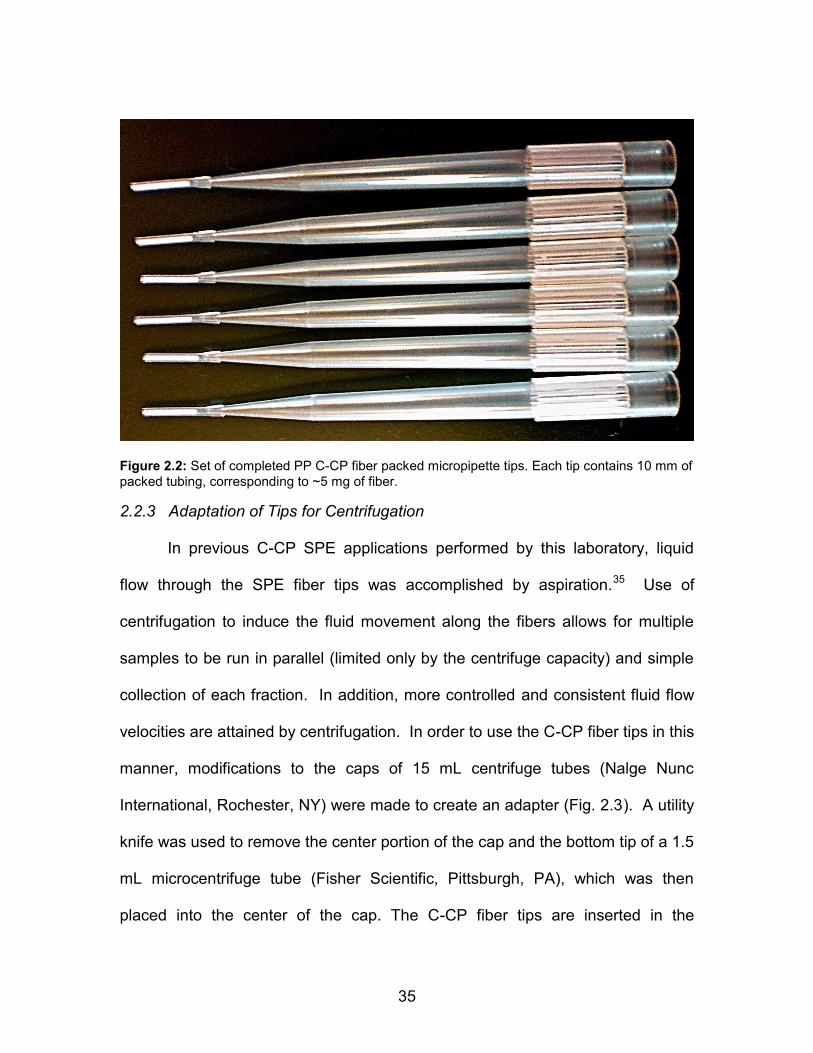
2.2.3 Adaptation of Tips for Centrifugation
In previous C-CP SPE applications performed by this laboratory, liquid
flow through the SPE fiber tips was accomplished by aspiration.35 Use of
centrifugation to induce the fluid movement along the fibers allows for multiple
samples to be run in parallel (limited only by the centrifuge capacity) and simple
collection of each fraction. In addition, more controlled and consistent fluid flow
velocities are attained by centrifugation. In order to use the C-CP fiber tips in this
manner, modifications to the caps of 15 mL centrifuge tubes (Nalge Nunc
International, Rochester, NY) were made to create an adapter (Fig. 2.3). A utility
knife was used to remove the center portion of the cap and the bottom tip of a 1.5
mL microcentrifuge tube (Fisher Scientific, Pittsburgh, PA), which was then
placed into the center of the cap. The C-CP fiber tips are inserted in the

36
microcentrifuge tube and held in place as the outer wall diameter of the tip
approaches the inner diameter of the microcentrifuge tube. Studies here
employed an accuSPINTM 1R analytical centrifuge (Fisher Scientific, Pittsburgh,
PA).
Figure 2.3: Adaptation of C-CP fiber tips to centrifuge format. A 15 mL centrifuge tube cap is cut to accommodate a modified 1.5 mL microcentrifuge tube.
2.2.4 SPE Method
The C-CP fiber packed tips were prepared by flushing with 200 μL aliquot
of PBS (300xg for 5 min) to wet the surfaces. It is important to note that this is not
a sorbent surface activation step, as is often required with other silica- and
carbon-based materials. The polymer surface is inherently ‘activated’ and is not
damaged upon drying. Proteins are known to adsorb to different polymer
surfaces,45, 46 such as the walls of centrifuge tubes, so the 1.5 mL low-retention
microcentrifuge tubes were placed inside the larger centrifuge tubes for sample
37
collection to reduce the risk of analyte loss. Each solution volume (load, rinse,
and elute) was collected in individual tubes so that the protein content for each
fraction could be determined. All fractions were centrifuged at 300xg for 3
minutes to ensure that the entire aliquot had traversed through the SPE tip. In
practice, volumes of 100 μL and 1.0 mL require ~1 and ~5 min, respectively, to
fully elute from the tips. In the present method, the load step (first fraction) is 100
μL of protein-PBS solution, the rinse step (second fraction) is 200 μL of 100% DI-
H2O, and the elute step (third fraction) is 100 μL of 50:50 ACN:DI-H2O. Each of
the fractions were analyzed for protein concentration by UV-VIS
spectrophotometry. The total analysis time is <15 min using this procedure.
2.2.5 Protein Quantification
Protein quantification was performed using a Costar® 96 well UV plate
(Corning, NY) and a TECAN GENios well plate reader (Switzerland) with
Magellan software. UV-VIS absorbance data was processed using Microsoft
Excel (Seattle, WA). Stock solutions were prepared for each of the proteins in
PBS, DI-H2O and 50:50 ACN:DI-H2O, and then dilutions were made in order to
generate a range of concentrations up to 20 μg mL-1 used for quantification. An
80 µL sample volume was deposited in each of the well positions. Response
curves were prepared for each analyte in the specific elution solvents, as
presented in Table 2.1.

38
Table 2.1: UV-VIS absorbance response characteristics for the test proteins in the primary (PBS) and
elution (50:50 ACN:H2O) solvents.
Protein λ (nm) Solvent Response Function
R2
LOD (µg/mL)
LOD (nM)
Cytochrome c
405 PBS y= 0.0011x + 0.0252 0.9912 0.98 79
50:50 ACN:H2O y= 0.0011x + 0.0269 0.9801 1.2 96
Myoglobin 405 PBS y= 0.0015x + 0.0231 0.9975 0.72 43
50:50 ACN:H2O y= 0.001x + 0.1710 0.9817 1.3 77
Lysozyme 280 PBS y= 0.0005x + 0.0499 0.9800 3.3 235
50:50 ACN:H2O y= 0.0004x + 0.0527 0.9781 4.1 288
Glucose oxidase 280 PBS y= 0.0002x + 0.0489 0.9955 5.6 35
50:50 ACN:H2O y= 0.0002x + 0.0553 0.9305 8.2 52
The limits of detection (LODs) for the protein concentrations, in both µg mL-1 and
nM, were calculated using the equation LOD = (3sb)/m, where sb is the standard
deviation of the blank signal and m is the slope of the calibration function. The
variability of the absorbance measurements were in the range of 0.5 – 8% RSD,
representing the greatest source of imprecision across the experimental method.
Unless otherwise noted, all quantitative data represent the results of triplicate
experiments.
2.3 Results and Discussion
2.3.1 Protein Quantification Throughout the C-CP Fiber SPE Method
During the course of the SPE process the protein from the test solution
has the potential to be located in each of the three fractions (primary load, H2O
wash, and elution), or remain adsorbed on the fiber/tip surfaces. The C-CP tips
39
extraction efficiency and reproducibility were determined by quantifying the
protein concentration in each fraction by UV-VIS absorbance. The amount of
protein observed in the first two fractions is considered flow-through (i.e.
unretained) and is used to calculate of the amount of protein adsorbed to the
fiber/tip surface. The amount of protein observed in the elution fraction is the final
recovery of the SPE process. In principle, the mass recoveries of the three
fractions should equal to the total mass of protein applied. Table 2.2 illustrates
the calculated recovery data over the complete SPE procedure for the test
protein lysozyme. A 100 µL aliquot of a 9.4 µg mL-1 (0.94 µg protein applied)
lysozyme/PBS solution was loaded onto three separate tips. Each fraction from
the SPE procedure was analyzed for protein concentration. The average mass of
lysozyme adsorbed to the polymer surface was 0.82 µg (87% adsorbed) and the
mass of protein recovered was 0.81 µg. In this case, the total recovery (mass
recovered/mass applied x 100%) is 86.2 %. The percentage recovery based on
the actual mass of protein adsorbed (mass recovered/mass adsorbed x 100%)
was 98.7% in this instance. Very importantly, the percentage recovery of
adsorbed protein was greater than 95% across all of the studies presented in this
report.

40
Table 2.2: Example of protein recovery data for the various steps of the C-CP SPE method; lysozyme/PBS system.
Determined Conc (μg/mL) Protein mass (µg)
Original Solution 9 ±1 0.9 ±0.1
Fraction 1, “Load” 1.2 ±0.5 0.12 ±0.05 Fraction 2, “Rinse” ND* ND* Fraction 3, “Elute” 8 ±0.9 0.8 ±0.1
Mass adsorbed (µg) 0.8 ±0.1
% Total recovery (from applied mass) % Recovery (from adsorbed mass)
86 ±13 98 ±10
*ND – not determinable
2.3.2 Recovery Dependence on Protein Identity
There are many different possible interactions that affect the adsorption
and desorption characteristics of proteins from the C-CP fiber surfaces,
potentially giving rise to a range of recovery characteristics and adsorption limits
for each. The relative hydrophobicity of each protein is a function of its amino
acid composition, its molecular weight, the tertiary structure, and degree of
ionization under a given set of solution conditions (e.g., pH). Protein-protein
interactions in the solution phase (as well as the surface) could also affect the
extent of adsorption.47 Once on the fiber surface, the solvent strength required
for elution will be related to the initial driving forces as well as the protein-surface
interactions, including the extent of protein denaturation (i.e., unfolding).
Denaturation increases the available surface area (ASA) of the proteins and thus
results in greater surface interactions, potentially to the point of irreversible
binding.48 While not ideal in terms of potential protein denaturation, a 50:50 DI-
H2O:ACN mixture was chosen here due to its frequent use as a delivery solvent

41
for ESI-MS detection methods. Certainly, there is likely solvent optimization that
could be performed on a protein- and detection technique-specific basis.
Figure 2.4 reflects the recovery characteristics for each of the test proteins
from PBS across the applied protein masses of 0.2 – 2.0 µg. This range of
masses was generated through combinations of different solution concentrations
and volumes. As can be clearly seen, the mass of each protein eluted from the
fibers increases in a monotonic fashion up to ~1.25 – 1.5 µg (applied) with ~90 %
total protein recovery for each case (Table 2.3), and then reaching a plateau.
Beyond these mass loadings, the amount of unretained protein (i.e., remaining in
the load solution) increases, with the actual retention being ~75% for each at the
2 µg-applied value. These data suggest the onset of surface saturation rather
than some sort “elution” efficiency limitation.
Table 2.3: Protein-specific recovery and coverage characteristics.
Protein % Total Recovery
(prior to saturation point)
Molar Adsorption
Limit* (pmol)
Molecular Dimensions
(Å)
Area Coverage*
(cm2)
Cytochrome c 88.1 121.7 34 x 34 8.6
Myoglobin 88.5 85.6 44 x 44 10.3
Lysozyme 91.5 87.4 33 x 31 6.6
Glucose Oxidase 90.9 9.1 66 x 21 8.0
*assuming 1.5 µg mass adsorption
Figure 2.4 also reflects greater variability in the obtained recovery values
beyond the saturation points. Based on the precision in the measured values in
the “load” and “elution” volumes, the variability occurs in the elution step, rather
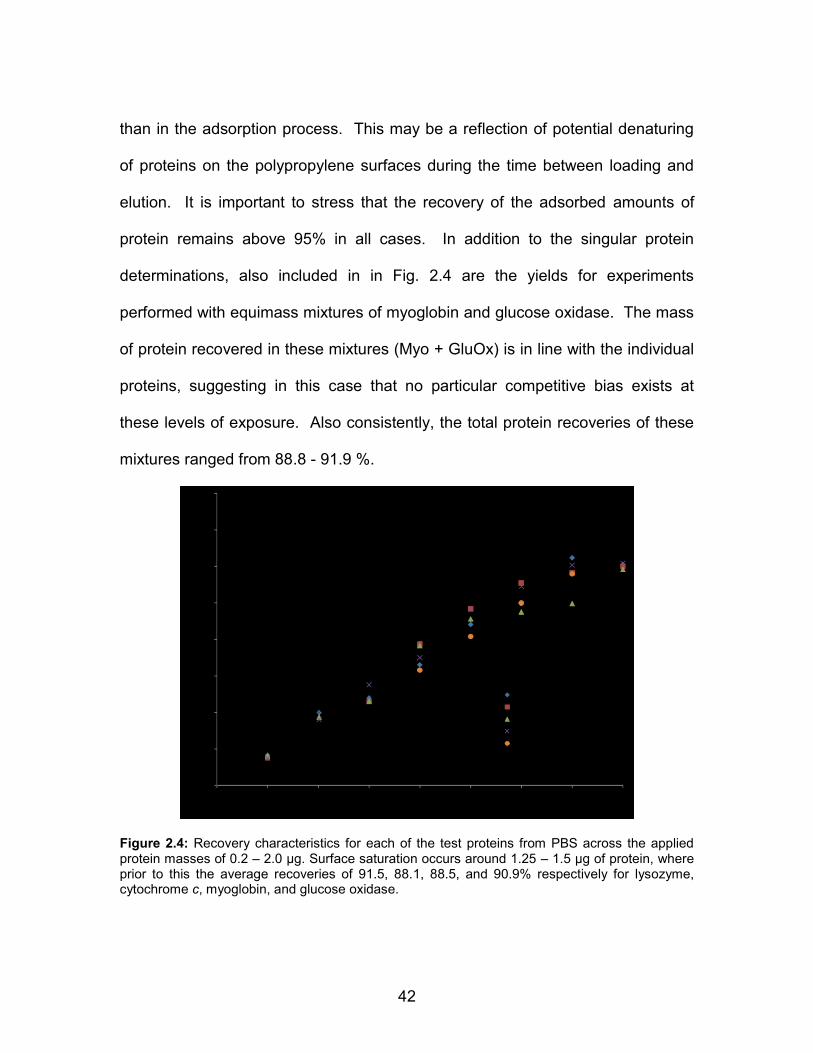
42
than in the adsorption process. This may be a reflection of potential denaturing
of proteins on the polypropylene surfaces during the time between loading and
elution. It is important to stress that the recovery of the adsorbed amounts of
protein remains above 95% in all cases. In addition to the singular protein
determinations, also included in in Fig. 2.4 are the yields for experiments
performed with equimass mixtures of myoglobin and glucose oxidase. The mass
of protein recovered in these mixtures (Myo + GluOx) is in line with the individual
proteins, suggesting in this case that no particular competitive bias exists at
these levels of exposure. Also consistently, the total protein recoveries of these
mixtures ranged from 88.8 - 91.9 %.
Figure 2.4: Recovery characteristics for each of the test proteins from PBS across the applied protein masses of 0.2 – 2.0 µg. Surface saturation occurs around 1.25 – 1.5 µg of protein, where prior to this the average recoveries of 91.5, 88.1, 88.5, and 90.9% respectively for lysozyme, cytochrome c, myoglobin, and glucose oxidase.

43
The appearance of surface saturation in the range of 1.25 – 1.5 µg, for all
of the proteins in the test suite, suggests attaining some sort of limiting situation,
e.g. monolayer coverage of protein on the fiber surfaces. Based on the 168 µm
perimeter of each PP C-CP fiber, a 10 mm length, and 658 fibers in the bundle,
each tip represents a total fiber surface area of ~ 11.0 cm2. (There is no
experimental evidence that any form of protein diffusion/intercollation into the
fibers occurs.) This amount of available surface area can be compared to what
might be expected in a space-filling footprint of the proteins. Admittedly,
extrapolation of the likely size of an adsorbed protein on a hydrophobic surface
from crystallographic data is a tenuous proposition. That said, using a nominal
mass of 1.5 µg as the onset point of saturation, one can calculate the number of
molecules of each protein, and the respective surface areas occupied in each
case. Crystallographic values from a number of data bases were examined, and
nominal values chosen as presented in Table 2.3. The projected space-filling
equivalents for the respective proteins was calculated based on the equivalent
molar quantities and is also reported in Table 2.3. While there is no way at this
point to assess the actual sizes of the proteins on the fiber surfaces, the protein
surface areas calculated here suggest attainment of single-monolayer. Use of
higher protein concentrations or perhaps slower solution flow rates (lower
centrifugation speeds) might lead to further protein-protein interactions at the
surfaces. Such interactions would result in increased loading capacities, but at
the potential expense of perturbed elution characteristics or perhaps irreversible

44
protein-protein interactions detrimental to further analytical measurements. For
example, the presence of dimeric species in an ESI mass spectrum might falsely
suggest their existence in the initial test solution, rather than formation on the
polymer surface.
One of the primary points of comparison of stationary phases employed in
preparative separations and SPE is the mass loading capacity. Typical capacity
values for porous media are 1- 10% of the bed weight 49, 50, meaning 5 mg of
sorbent material could potentially retain 50 µg of analyte under the proper
conditions. The data presented here reflect much lower capacities of 1.5 µg per 5
mg of fiber; ~0.03% by mass. The differences here are a function of the much
lower porosity of the fiber material, which in practical terms is countered by much
more efficient mass transfer in these flow-through experiments, as demonstrated
in the ability to perform highly effective protein separations at linear velocities of
>50 mm s-1.44 In the field of proteomics, low binding capacities accentuate the
existence of an incredible range of protein concentrations (>6 orders of
magnitude) present in human serum for example. In such situations, low binding
capacities may preclude the ability to detect low-abundance proteins. Many
separation systems, for this reason, employ pretreatments including so-called
depletion columns to selectively remove high abundance proteins.51-53 The
same tip format could be employed in-series with C-CP fibers modified to capture
high abundance proteins using coupling chemistries such as those recently
described.54, 55 If required, greater overall capacity could be readily achieved

45
with increased fiber material in tips of greater diameter or length while
maintaining excellent adsorption/desorption characteristics and low pressure
drops.
The inherent robustness of the PP C-CP fibers imparts a long shelf life,
and the fiber tips have not exhibited a requirement of continuous wetting and or
damage from being completely dried; a disadvantage of other sorbent materials.
The PP fibers do not degrade with exposure to organic solvent compositions
common to protein processing, varying pHs, or light. The high recoveries seen
here are due to the lack of fiber porosity as well the chemical inertness of
polypropylene. Indeed, fiber tips can be reused as many as 30 times (the
maximum here) without compromising the recovery characteristics. Throughout
these studies, >95% of the mass of protein applied was adsorbed to the fiber
tips, so long as the mass applied was below the saturation limit. In addition, in
every case, the recoveries of bound protein were >95%.
Clearly, one of the other primary uses of SPE is the ability to pre-
concentrate; extracting target species from large (dilute) volumes, and eluting
them into smaller (concentrated) volumes. In practice, the desired analytical
performance metric is that the amount of protein that adsorbs to the fiber surface
is based on the total mass of analyte applied and not the total
volume/concentration of solution applied. The pre-concentration capability of the
C-CP SPE tips was evaluated by applying solutions with different lysozyme
concentrations (1 – 10 µg/mL) in different volumes to keep the total mass of

46
protein applied to the SPE tips constant at 1 µg (the volume range was limited by
the 1 mL capacity of the primary pipette tips). The average percentage total
recovery across the 10x volume differential was 93.8 ± 3.2%, with no significant
trends related to concentration/volume. Taken a step further, the variability
across the total of 21 measurements was 6.6 %RSD, which is not statistically
different from the precision of the UV-VIS absorbance measurement process
itself for these concentration levels.
2.3.3 Protein Recovery from Complex Matrices
Sample clean-up is required in many protein determination applications
where the matrix is more complex than a buffered solution. Often times the
proteins of interest are collected from biological matrices, such as urine and
serum, and are in the presence of other compounds such as electrolytes, nucleic
acids, and carbohydrates. The recovery characteristics of the C-CP fiber tips
were investigated using protein-spiked synthetic urine and saliva matrices. Urine
possesses challenges due to the chemical complexity of the specimen, including
high levels of salts and small organic compounds, while saliva produces a
challenge based on its high viscosity. Separate calibration curves were made for
myoglobin in the synthetic urine and cytochrome c in the mock saliva to assess
the recovered “load” concentrations. The C-CP SPE tips were employed for
loads over a range of 1.0-1.75 µg total protein applied to the tip (encompassing
the assumed saturation points). The spiked synthetic urine required no extra
sample preparation prior to SPE extractions, while the synthetic saliva was

47
diluted 50:50 with milliQwater due to the viscosity of the sample. In addition, a
lower fiber packing density (corresponding to εi ≈ 0.75) was also employed to
improve the test fluid transport. As seen in Table 2.4, the total recoveries of
protein from both of these environments remains in the range seen previously in
PBS, for myoglobin in synthetic urine and cytochrome c in synthetic saliva,
respectively. The saturation point of ~1.25 - 1.5 µg of protein on the fiber surface
also remains about the same. These results provide preliminary evidence of the
successful use of the C-CP fibers in SPE applications for protein determinations
in matrices of clinical relevance.
Table 2.4: Protein recovery from complex matrices.
Mass applied (µg) 1.0 1.25 1.5 1.75
Myoglobin in synthetic
urine
Mass adsorbed (µg) 0.91 ± 0.25 1.19 ± 0.21 1.41 ± 0.13 1.51 ± 0.16
Mass recovered (µg) 0.87 ± 0.19 1.13 ± 0.28 1.37 ± 0.23 1.47 ± 0.21
% Total recovery 87.0 % 90.4 % 91.3 % 84.0 %
Cytochrome c in synthetic
saliva
Mass adsorbed (µg) ND ND ND ND
Mass recovered (µg) 0.88 ± 0.16 1.11 ± 0.19 1.32 ± 0.22 1.44 ± 0.19
% Total recovery 88.0 % 88.8 % 88.0 % 82.3 %
*ND – not determinable due to high background absorbance of the saliva matrix at 405 nm.
2.3.4 Comparison to Commercially Available SPE Products
The success of SPE has led to many available products with a variety of
chemical phases (ODS, C8, phenyl, amine, polymeric, etc.) and formats (96-well
plate, tube, cartridge, disc, tip, etc.).15-17, 19, 56-59 In order to further assess the
performance of the C-CP fiber SPE tips, comparison to established SPE

48
products was performed. Based on the literature, commercial SPE products tend
to yield recoveries of 70-98 % depending on the analyte and matrix composition.
For example, a recovery comparison was performed by Vallant et al. for the SPE
of the peptides insulin and bradykinin MW = 5808 and 1060 Da, respectively.60 A
C60-amino silica sorbent provided recoveries of 72-97%, Sepak C18 79-92%, and
an Oasis HLB sorbent also had recoveries of 72-92%. A direct comparison of
extraction efficiency was conducted between Varian OMIX C18 tips (Agilent
Technologies, Santa Clara, CA) and the PP C-CP fiber tips using myoglobin/PBS
samples. The commercial tips were run according to the packaged instructions
and the C-CP fiber tips were run as described in the Experimental Section. The
test solution was 100 µL of 10 µg mL-1 myoglobin in PBS, equating to a total of 1
µg protein applied to each phase. For triplicate analyses, the total recovery for
the Varian tips was 55 ± 17%, and with the C-CP tips the value was 82 ± 10%.
Beyond the quantitative aspects, it is interesting to note the differences in the
methodologies. The commercial protocol entailed far more extensive sorbent
conditioning and sample manipulation steps, with the commercial tips processed
individually, with aspiration of the solution with a pipettor. The total time to
complete the triplicate extractions was ~30 minutes. The C-CP fiber tips were
run in parallel, with a processing time of <15 min; with larger numbers of
samples processes (based on the capacity of the centrifuge) with little added
time.
49
Beyond recovery, the tips can be compared to commercial products with
regards to protein adsorption capacity. As mentioned previously, the rule of
thumb for SPE adsorption capacity is 1-5% of the sorbent weight, with many
commercial products reporting in the 1-10% range. Due to similar sample-
sorbent interactions, we can also compare adsorption capacities to
chromatographic materials. To and Lenhoff determined the protein adsorption
capacity of different hydrophobic (polymeric) SPE materials.61 Based on the data
presented here, the C-CP fiber tips accommodated ~1.4 mg m-2 of fiber surface
area, while To’s studies reported a range of 0.7-3.7 mg m-2. There has also been
extensive work on determining protein binding capacities in different solvent
environments and on different ion-exchange media by Staby et al.62-67 It was
reported that the numerous sorbent phases on average utilized 50-90% of the
total available capacity. The aforementioned results on adsorption capacities
supports that the C-CP fiber SPE process utilizes 90-100% of the surface area,
and therefore the total available binding. Overall, the capacity of the C-CP fiber
SPE tips is at least comparable to available products. In making the comparison
with highly porous inorganic materials, C-CP fibers definitely suffer in terms of
equilibrium binding capacities, but the non-porous nature of the fibers provides
better mass transfer characteristics (as seen in the HPLC applications).
Therefore, a method with higher overall throughput and yield, especially in the
case of macromolecules, is expected. Those studies are currently underway. In
truth, total binding capacity is seldom a limiting factor in protein SPE. If needed,

50
the efficient fluid transport in the C-CP fiber tips would likely allow for larger-
formats to increase capacity.
2.4 Conclusions
The data presented here supports the applicability of polypropylene C-CP
fibers as sorbent material in SPE methods of relevance in proteomics, across a
range of detection methods. Proteins having a variety of molecular weights and
chemistries were evaluated to gain a sense of the general utility of the method.
Implementation of a centrifugation approach to sample manipulation has
increased the sample throughput, improved RSDs, and has allowed for greater
extraction efficiencies when compared to previous aspiration techniques.
Overall, binding capacities of 1.25 – 1.5 µg per 5 mg of fiber within a tip are
achieved, with the total recoveries to this point being of the order of 85 – 90 % for
each of the proteins. Recoveries from more complex matrices (myoglobin from
synthetic urine and cytochrome c in synthetic saliva) were not appreciably
different from the buffer solutions. The tips are found to perform very favorably in
comparison to commercial products for the isolation of myoglobin from a PBS
matrix.
Future work will move towards understanding the full range of potential for
the SPE C-CP fiber tips as well as looking further into aspects that are of
relevance in particular detection methods (e.g., fluorescence, ESI/MALDI-MS,
etc.). The tip format could be envisioned for use with a number of fluidic
51
manifolds (i.e. pipettes, centrifuge, vacuum) to suit specific needs, with the
overall advantages of low cost, high throughput, reusability, and long shelf life. A
major goal is construction of an in-line version of the tips (i.e., microcolumn) to
allow for a continuous-flow sample preparation method for introduction into ESI-
MS and other dynamic detection systems. Different protein-surface interactions
affect SPE characteristics based on the specific solute/surface/solvent
combinations. The work presented here with PP operates solely based on the
hydrophobic interactions. C-CP fibers extruded from other base polymers (e.g.,
PET and nylon-6) introduce the capacity to affect π-π and ionic interactions as a
means for sorption. Taken a step further, surface derivatization can be affected
to allow for separations of high specificity, such as antigen-antibody
interactions,68, 69 as have recently been demonstrated.54, 55
This material is based upon work supported by the National Science
Foundation Division of Chemistry under Grant No. 1011820 (co-funded by the
MPS/CHE, ENG/CBET, and EPSCoR).
References 1. L. Ramos, Journal of Chromatography A, 2012, 1221, 84-98. 2. L. Zhao, H. Q. Qin, R. A. Wu and H. F. Zou, Journal of Chromatography A,
2012, 1228, 193-204. 3. J. S. Fritz, Analytical Solid-Phase Extraction, John Wiley & Sons, Inc, New
York, NY, 1999. 4. L. Vidal, M. L. Riekkola and A. Canals, Analytica Chimica Acta, 2012, 715,
19-41.
52
5. N. Simpson and K. C. Van Horne, Sorbent Extraction Technology Handbook, Varian Sample Preparation Products, Harbor City, 1993.
6. N. J. K. Simpson, Solid-Phase Extraction: Principles, Techniques, and
Applications, Marcel Dekker, Inc, New York, NY, 2000. 7. J. M. Rosenfeld, Sample Preparation for Hyphenated Analytical
Techniques, CRC Press LLC, Boca Raton, FL, 2004. 8. S. Risticevic, V. H. Niri, D. Vuckovic and J. Pawliszyn, Analytical and
Bioanalytical Chemistry, 2009, 393, 781-795. 9. S. F. Xie, T. Jiang, F. Svec and R. W. Allington, in Monolithic Materials:
Preparation, Properties and Applications, ELSEVIER SCIENCE BV, AMSTERDAM, 2003, pp. 687-697.
10. R. K. Marcus, Journal of Separation Science, 2008, 31, 1923-1935. 11. R. K. Marcus, Journal of Separation Science, 2009, 32, 695-705. 12. G. B. Smejkal and A. Lazareu, Separation Methods in Proteomics, CRC
Press; Taylor & Francis Group, LLC, Boca Raton, FL, 2006. 13. R. E. Majors, LCGC-Magazine of Separation Science, 1998, 214, 8-15. 14. S. F. Xie, F. Svec and J. M. J. Frechet, Chemistry of Materials, 1998, 10,
4072-4078. 15. I. Liska, Journal of Chromatography A, 2000, 885, 3-16. 16. G. A. Junk, H. J. Svec, R. D. Vick and M. J. Avery, Enviromental Science
and Technology, 1974, 8, 1100-1106. 17. B. Rezaei, E. Sadeghi and S. Meghdadi, Journal of Hazardous Materials,
2009, 168, 787-792. 18. A. R. Türker, Clean, 2007, 35, 548-557. 19. M. J. Walworth, M. S. ElNaggar, J. J. Stankovich, C. Witkowski, J. L.
Norris and G. J. Van Berkel, Rapid Communications in Mass Spectrometry, 2011, 25, 2389-2396.
20. T. Baczek, Journal of Pharmaceutical and Biomedical Analysis, 2004, 34,
851-860.
53
21. A. Shukla and R. E. Majors, Lc Gc North America, 2005, 23, 646-660. 22. R. D. Bagshaw, J. W. Callahan and D. J. Mahuran, Analytical
Biochemistry, 2000, 284, 432-435. 23. J. J. Zheng, E. D. Lynch and S. E. Unger, Journal of Pharmaceutical and
Biomedical Analysis, 2002, 28, 279-285. 24. R. Pirola, M. Gervasoni, C. Pollera, S. Villa, P. Mantegazza and S. R.
Bareggi, Journal of Chromatography B-Analytical Technologies in the Biomedical and Life Sciences, 2002, 769, 27-33.
25. B. J. G. Silva, F. M. Lancas and M. E. C. Queiroz, Journal of
Chromatography A, 2009, 1216, 8590-8597. 26. S. I. Han, K. H. Han, A. B. Frazier, J. P. Ferrance and J. P. Landers,
Biomedical Microdevices, 2009, 11, 935-942. 27. C. Lin, J. Y. K. Hsieh, B. K. Matuszewski and M. R. Dobrinska, Journal of
Pharmaceutical and Biomedical Analysis, 1996, 14, 1601-1608. 28. A. A. B. Badawy, C. J. Morgan and J. A. Turner, Amino Acids, 2008, 34,
587-596. 29. J. Salplachta, P. Rehulka and J. Chmelik, Journal of Mass Spectrometry,
2004, 39, 1395-1401. 30. S. Miyazaki, K. Morisato, N. Ishizuka, H. Minakuchi, Y. Shintani, M.
Furuno and K. Nakanishi, Journal of Chromatography A, 2004, 1043, 19-25.
31. D. M. Nelson and R. K. Marcus, Analytical Chemistry, 2006, 78, 8462-
8471. 32. D. M. Nelson and R. K. Marcus, Protein and Peptide Letters, 2006, 13, 95-
99. 33. D. K. Nelson and R. K. Marcus, Journal of Chromatographic Science,
2003, 41, 475-479. 34. R. K. Marcus, W. C. Davis, B. C. Knippel, L. LaMotte, T. A. Hill, D. Perahia
and J. D. Jenkins, Journal of Chromatography A, 2003, 986, 17-31. 35. D. S. Fornea, Y. Wu and R. K. Marcus, Anal Chem, 2006, 78, 5617-5621.

54
36. J. J. Pittman, V. Klep, I. Luzinov and R. K. Marcus, Analytical Methods, 2010, 2, 461-469.
37. J. J. Pittman, B. T. Manard, P. J. Kowalski and R. K. Marcus, J Am Soc
Mass Spectrom, 2012, 23, 102-107. 38. B. T. Manard and R. K. Marcus, J. Am. Soc. Mass Spectrom., 2012, 23,
1419-1423. 39. W. A. Haile and B. M. Phillips, Tappi Journal, 1995, 78, 139-142. 40. Supelco, Sigma-Aldrich Co., 1998, pp. 1-12. 41. B. W. Darvell, Journal of Oral Rehabilitation, 1978, 5, 41-49. 42. P. J. Brown, K. Sinclair, L. Fuller, K. A. Stevens, K. Webb, K. R. Marcus,
D. M. Nelson and R. D. Stanelle, Polym. Prepr. (Am. Chem. Soc., Div. Polym. Chem.), 2006, 47, 551-552.
43. R. D. Stanelle, M. Mignanelli, P. Brown and R. K. Marcus, Analytical and
Bioanalytical Chemistry, 2006, 384, 250-258. 44. J. M. Randunu and R. K. Marcus, Anal. Bioanal. Chem., 2012, 404, 721-
729. 45. C. FreijLarsson, T. Nylander, P. Jannasch and B. Wesslen, Biomaterials,
1996, 17, 2199-2207. 46. S. X. Liu, J. T. Kim and S. Kim, Journal of Food Science, 2008, 73, E143-
E150. 47. C. Chang and A. M. Lenhoff, Journal of Chromatography A, 1998, 827,
281-293. 48. C. W. Herbold, J. H. Miller and S. C. Goheen, Journal of Chromatography
A, 1999, 863, 137-146. 49. Waters, in http://www.waters.com/, ed. W. Corporation, 2001. 50. Sigma-Aldrich, SPE Cartridge (Tube) Configuration Guide,
http://www.sigmaaldrich.com/analytical-chromatography/sample-preparation/spe/tube-configuration-guide.html, Accessed August 13, 2012, 2012.

55
51. C. S. Olver, T. L. Webb, L. J. Long, H. Scherman and J. E. Prenni, Vet. Clin. Pathol., 2010, 39, 337-345.
52. R. Millioni, S. Tolin, L. Puricelli, S. Sbrignadello, G. P. Fadini, P. Tessari
and G. Arrigoni, PLoS ONE, 2011, 6. 53. M. Andac, I. Galaev and A. Denizli, J. Sep. Sci., 2012, 35, 1173-1182. 54. J. J. Pittman, K. A. Christensen and R. K. Marcus, Anal. Chem.,
submitted for publication. 55. J. J. Pittman, R. C. Smith and R. K. Marcus, React. Funct. Poly.,
submitted for publication. 56. G. Rule and J. Henion, Journal of the American Society for Mass
Spectrometry, 1999, 10, 1322-1327. 57. A. M. Tan, S. Benetton and J. D. Henion, Analytical Chemistry, 2003, 75,
5504-5511. 58. T. Wachs and J. Henion, Analytical Chemistry, 2003, 75, 1769-1775. 59. L. G. Blomberg, Analytical and Bioanalytical Chemistry, 2009, 393, 797-
807. 60. R. M. Vallant, Z. Szabo, S. Bachmann, R. Bakry, M. Najam-ul-Haq, M.
Rainer, N. Heigl, C. Petter, C. W. Huck and G. K. Bonn, Analytical Chemistry, 2007, 79, 8144-8153.
61. B. C. S. To and A. M. Lenhoff, Journal of Chromatography A, 2011, 1218,
427-440. 62. A. Staby, I. H. Jensen and I. Mollerup, Journal of Chromatography A,
2000, 897, 99-111. 63. A. Staby and I. H. Jensen, Journal of Chromatography A, 2001, 908, 149-
161. 64. A. Staby, M. B. Sand, R. G. Hansen, J. H. Jacobsen, L. A. Andersen, M.
Gerstenberg, U. K. Bruus and I. H. Jensen, Journal of Chromatography A, 2004, 1034, 85-97.
65. A. Staby, M. B. Sand, R. G. Hansen, J. H. Jacobsen, L. A. Andersen, M.
Gerstenberg, U. K. Bruus and I. H. Jensen, Journal of Chromatography A, 2005, 1069, 65-77.
56
66. A. Staby, J. H. Jacobsen, R. G. Hansen, U. K. Bruus and I. H. Jensen, Journal of Chromatography A, 2006, 1118, 168-179.
67. A. Staby, R. H. Jensen, M. Bensch, J. Hubbuch, D. L. Dunweber, J.
Krarup, J. Nielsen, M. Lund, S. Kidal, T. B. Hansen and I. H. Jensen, Journal of Chromatography A, 2007, 1164, 82-94.
68. J. M. Goddard and J. H. Hotchkiss, Progress in Polymer Science, 2007,
32, 698-725. 69. J. Curling, Biopharm International-the Applied Technologies of
Biopharmaceutical Development, 2004, 17, 60-66.

57
CHAPTER THREE
IN-LINE DESALTING OF PROTEINS FROM BUFFER SOLUTIONS PRIOR TO
ESI-MS ANALYSIS VIA A CAPILLARY-CHANNELED POLYMER FIBER
MICROCOLUMN
3.1 Introduction
The determination of protein, and other biomolecules, identity and
concentration is an area of great challenge because of their occurrence in
complex matrices and across incredibly wide concentration levels. Electrospray
ionization mass spectrometry (ESI-MS) is a powerful tool that has become
essential in the analysis of many biological molecules 1-6. ESI-MS overcomes
many of the analysis problems within proteomics due to its basic ionization
process, efficiently creating multiply-charged gas phase ions with minimal
fragmentation. As such, in combination with tandem mass spectrometry
approaches, it provides for both molecular weight and structural information to be
obtained simultaneously 1, 5-7. ESI also boasts relatively low detection limits and
the ability to be interfaced to low volume flow rate chromatographic separations.
Even with these analytical capabilities, there are still limitations of ESI concerning
biologically-associated species; mostly with regards to the need for extensive
sample preparation.
58
Generally, analytes of biological relevance such as proteins require
significant sample preparation prior to downstream analyses. The species of
interest must be extracted, purified and then possibly chemically modified, often
leaving the target species in the presence of detergents and/or physiological
buffers 1, 7. As a general rule, it is essential to have the biomolecule in as close
as possible to its native conformation, thus the need for buffered environments.
Ultimately, the presence of detergents, salts, and buffers can be detrimental in
almost any form of chemical/instrumental determination 3, 4, 6. ESI-MS has an
inherent low tolerance towards mixtures and salts stemming from the ionization
mechanism, whereas the liquid droplets are begin to desolvate the smaller, more
easily ionizable compounds take more of the available charge formation during
columbic explosion process. This creates detrimental effects on the ability to
accurately obtain and characterize ESI-MS spectra and limits the analytical
sensitivity 2, 8-10. The polymeric nature of detergents and ions present in buffers
cause spectral complexity and analyte signal suppression by spreading the
signals over multiple m/z values. In addition there is the potential formation of
adduct compounds (i.e. M+23 (Na+), M+59 (acetate)). Beyond these effects,
there is a pronounced suppression of analyte ionization in the presence of
excess, easily ionizable buffer salts as the total ion production is limited by the
spray current. Sample preparation techniques designed to remove salts and pre-
concentrate analytes prior to ESI-MS analysis are thus critical in order to
increase ionization efficiency, improve signal-to-noise ratios (S/N), reduce

59
spectral complexity, and increase MW accuracy and precision. Completing the
pretreatment process and analysis in a timely fashion with the least number of
steps is important in order to further reduce the chance of contamination and
analyte degradation 5. There are several types of off-line and in-line/on-line
desalting techniques prior to MS analysis including dialysis, microchannel
laminar flow, reversed-phase (RP) and size-exclusion (SEC) chromatography,
solid phase extraction (SPE), and solid phase micro extraction (SPME) 2, 10-12.
Solid phase extraction has become a common technique for sample
concentration and desalting in the field of proteomics by virtue of its experimental
simplicity and small reagent volume requirements 5, 13-15. The basic procedure
involves passage of the protein-containing solution across/through a packed bed
of material to which the proteins have some affinity. Salts/buffers/detergents
pass through the bed to waste, and the target analytes elute from the stationary
phase in a solvent that is more conducive to the analytical method (e.g.,
fluorescence, ESI-MS, etc.). When there is no chromatographic separation of
proteins necessary prior to analysis, SPE is the most time consuming step in the
analytical protocol. Based on the similarity in the chemical processes, HPLC
stationary phases, such C4- and C18-modified porous silica are the most common
protein SPE matrices 10, 14, 16, 17, though other materials have been developed
using different chromatographic media 5. The most prevalent format involves the
loose packing of the chromatographic media in micropipette tips, wherein the
test/wash/elution solutions are passed by gravity, aspiration, vacuum, or
60
centrifugation. Collected solutions are then processed as discrete samples or
through a subsequent chromatographic step. Other formats have also been
developed for in-line use in order to increase recovery, improve reproducibility,
reduce elution volumes, and decrease overall analysis time 18-20. Beyond silica-
based supports, polymer type sorbents offer several advantages including a
wider pH working range, improved chemical and mechanical stabilities, greater
possibility for surface modifications, and the ability to be easily employed in
different bed formats 15, 16, 21-24. As a general rule, polymer sorbents exhibit lower
specific surface areas and slower intra-phase mass transfer rates, limiting total
binding capacities and kinetics involved in the adsorption/desorption processes.
In fact, the C-CP fiber surface is essentially non-porous in relation to the size of
many proteins, as the average pore size is 2-5 nm.
This laboratory has developed the use of capillary-channeled polymer (C-
CP) fibers as a stationary phase in HPLC separations and as sorbent media for
SPE across many applications, including metals and protein analysis 25-32. The C-
CP fibers are extruded in a melt-spinning process from a range of base polymers
(e.g. polypropylene (PP), poly(ethylene terephthalate) (PET), and nylon),
depending on the desired type of surface interactions or potential surface
modifications. C-CP fibers have a distinct geometry consisting of eight parallel
channels and are characterized by their efficient solvent transport, low back
pressures, and rapid protein adsorption/desorption kinetics. High throughput
protein separations have been affected in RP, ion exchange, and hydrophobic

61
interaction chromatography modes. PP C-CP fibers have also been applied in a
micropipette tip format for RP-SPE of proteins from buffer solutions prior to ESI-
MS, UV-VIS, and MALDI-MS detection techniques 28, 30, 31, utilizing both
aspiration and centrifugation processing of the solutions. While these studies
have demonstrated that the C-CP fiber tips were very competitive with
commercially available SPE formats, with a number of advantages including
sample throughput and recovery, there is room for general improvement. As is
true in all methods, there are risks of sample contamination, loss, and dilution
during sample handling in the multiple transfer steps involved with off-line
techniques 2, 28. Direct injection and in-line manipulations are generally preferable
in terms of reliability, decreased analysis time, reduction of reagent consumption,
and reduced handling of samples and standards. These aspects have led to
these efforts in the development of an in-line C-CP fiber SPE technique coupled
to ESI-MS.
Reported here is an in-line PP C-CP fiber SPE desalting microcolumn
format, derived from a previously-described microbore HPLC format 32, 33, for the
desalting of several target proteins from phosphate buffered saline (PBS) and a
synthetic urine matrix prior to ESI-MS analysis. The main aim of this work was
the development of a versatile, sensitive, and inexpensive in-line SPE approach
for the analysis of biomolecules across a wide range of matrices. One of the
primary limitations of other in-line packed-bed formats, the need for HPLC
pumping 34, 35, is overcome by the C-CP fiber packed microcolumn format as all

62
of the SPE-ESI flows are affected by a standard syringe pump. Additionally,
while other SPE phases may require a surface activation step, the use of a
desalting buffer or counter flow solvent 9, 11, 12, 21, 36, these steps are not
necessary for C-CP fiber stationary phases. It is believed that the in-line use of
C-CP fiber microcolumns presents a very promising approach to improve
throughput and sensitivity in the field of proteomics.
3.2 Materials And Methods
3.2.1 Reagents
Target proteins (cytochrome c (CytoC), lysozyme (Lys), myoglobin (Myo),
hemoglobin (Hemo)) were purchased from Sigma-Aldrich (St. Louis, MO).
Phosphate buffered saline (PBS; 140 mM NaCl, 10 mM Na2HPO4, 1.8 mM
KH2PO4, and 2.7 mM KCl) was used for protein solution preparation, with the
buffer components each purchased from Sigma-Aldrich (St. Louis, MO) and
Fisher Chemicals (Pittsburgh, PA). ACS-grade acetonitrile (ACN, Mallinckrodt
Baker Inc., Phillipsburg, NJ) was used in the organic mobile phase eluent. MilliQ
water (18.2 MΩ/cm, NANOpure Diamond Barnstead/Thermolyne Water System
(Dubuque, IA)) was used in buffer and protein solution preparation. The elution
solvent was 50:50 ACN:DI-H2O + 0.1% trifluoroacetic acid (Fisher Chemicals
(Pittsburgh, PA)). Synthetic urine was purchased from Ricca Chemical Company
(Arlington, Texas). Stock protein solutions were prepared with approximately 1

63
mg mL-1 protein concentration in milliQwater and stored at 3 °C. Fresh dilutions
were prepared with PBS prior to analysis.
3.2.2 Instrumentation
Preliminary protein quantification was performed using a Genesys 10
(Thermo Electron Corp, Waltham, MA) split beam, dual detector UV-VIS
spectrophotometer equipped with a xenon lamp and a 40 μL volume quartz
cuvette (Starna Cells, Inc, Atascadero, CA). Microsoft Excel (Seattle, WA) was
used for data processing.
Mass spectrometry analysis was performed using a Finnigan LCQ
Advantage Max (Thermo Electron Corporation, San Jose, CA) quadrupole ion
trap mass analyzer equipped with an electrospray ionization source and the
Finnigan surveyor MS pump for fluid/sample flow. The samples were analyzed
with a mass scan range (m/z) of 500-2000 Da. The operational parameters were
as follows - sheath gas flow rate (arb)= 50, aux/sweep gas (arb)= 10, spray
voltage (kV)= -4, capillary temp (°C)= 275.0, capillary voltage (V)= 40.00, tube
lens offset (V)= 95.00. System control and data collection was run by the Xcalibur
software, and Microsoft Excel was used for data compilation and management.
3.2.3 C-CP Fiber SPE Desalting Microcolumn
The C-CP fiber SPE desalting microcolumn construction and fiber
conditioning methods are similar to those previously described for the microbore
HPLC columns and SPE micropipette tip formats 28, 29, 33. Polypropylene (PP)
was chosen as the base polymer due to its purely aliphatic chemical structure,
64
allowing for hydrophilic/hydrophobic characteristics to govern the selective
adsorption of proteins to the fiber surface while inorganic salts and other water-
soluble components pass. A coiled bundle (composed of a total of 658 fibers)
was pulled collinearly through a 25 cm length of fluorinated ethylene propylene
(FEP) tubing (0.8 mm i.d.), corresponding to an interstitial fraction of ~0.65. The
constructed column can then be cut to various lengths as dictated by the loading
capacity of the application at hand. In the work presented here, 5 cm lengths of
fiber-packed tubing were used, corresponding to approximately 25 mg of C-CP
fiber and a total microcolumn void volume of about 6.4 µL. Based on previous
studies, the protein binding capacity of the PP fiber microcolumns is ~1.5 µg per
1 cm of column length (5 mg of fiber) 31, providing a theoretical protein binding
capacity of ~7.5 µg for the 5 cm microcolumns employed here. It is noteworthy
that the high permeability of the C-CP fiber desalting microcolumns allows the
use of both simple syringe pumps as well as HPLC pumps. The back pressure of
these desalting microcolumns increased linearly from 5 – 60 psi over a flow rate
range of 0.1 – 2 mL min-1.
3.2.4 In-line SPE-ESI-MS Method
The fiber-packed microcolumn is equipped with common HPLC end
fittings and connected to the divert/inject valve system located on the ESI-MS
system (Fig. 3.1) in the same manner as an injection loop. Once connected,
liquid flow can be induced either by syringe pump or HPLC pump. In this setup
the load and wash steps were completed using a syringe pump and the elution
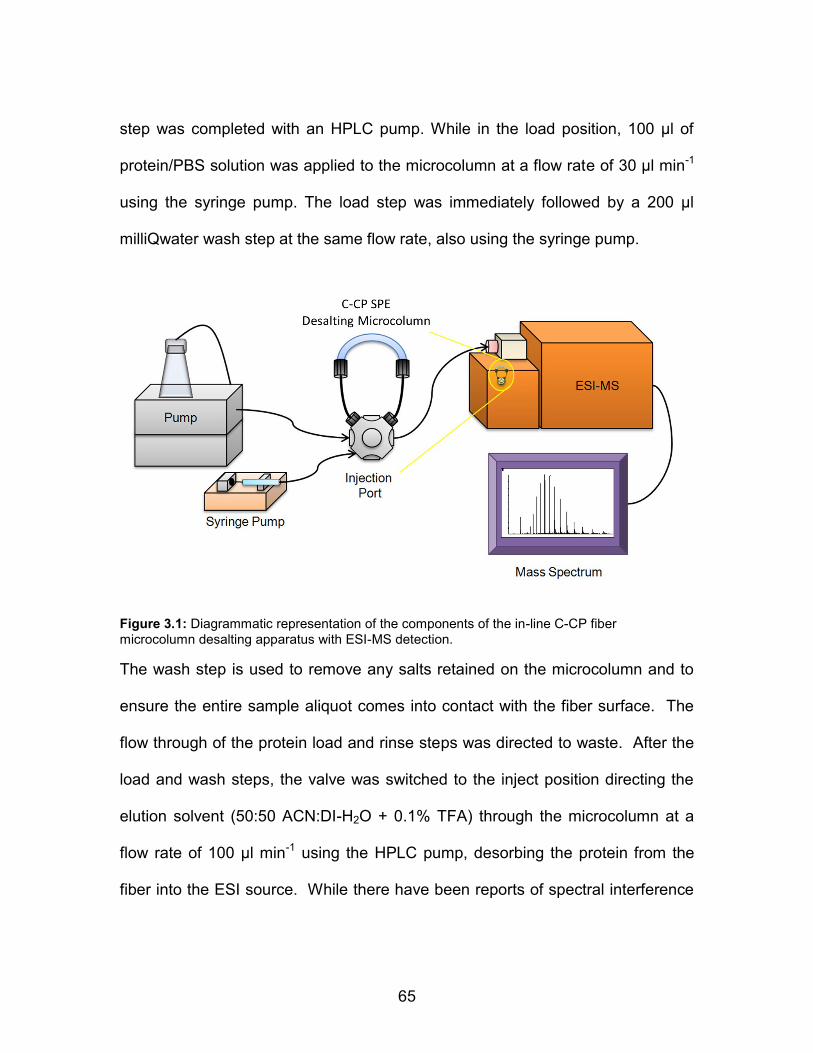
65
step was completed with an HPLC pump. While in the load position, 100 µl of
protein/PBS solution was applied to the microcolumn at a flow rate of 30 µl min-1
using the syringe pump. The load step was immediately followed by a 200 µl
milliQwater wash step at the same flow rate, also using the syringe pump.
Figure 3.1: Diagrammatic representation of the components of the in-line C-CP fiber
microcolumn desalting apparatus with ESI-MS detection.
The wash step is used to remove any salts retained on the microcolumn and to
ensure the entire sample aliquot comes into contact with the fiber surface. The
flow through of the protein load and rinse steps was directed to waste. After the
load and wash steps, the valve was switched to the inject position directing the
elution solvent (50:50 ACN:DI-H2O + 0.1% TFA) through the microcolumn at a
flow rate of 100 µl min-1 using the HPLC pump, desorbing the protein from the
fiber into the ESI source. While there have been reports of spectral interference
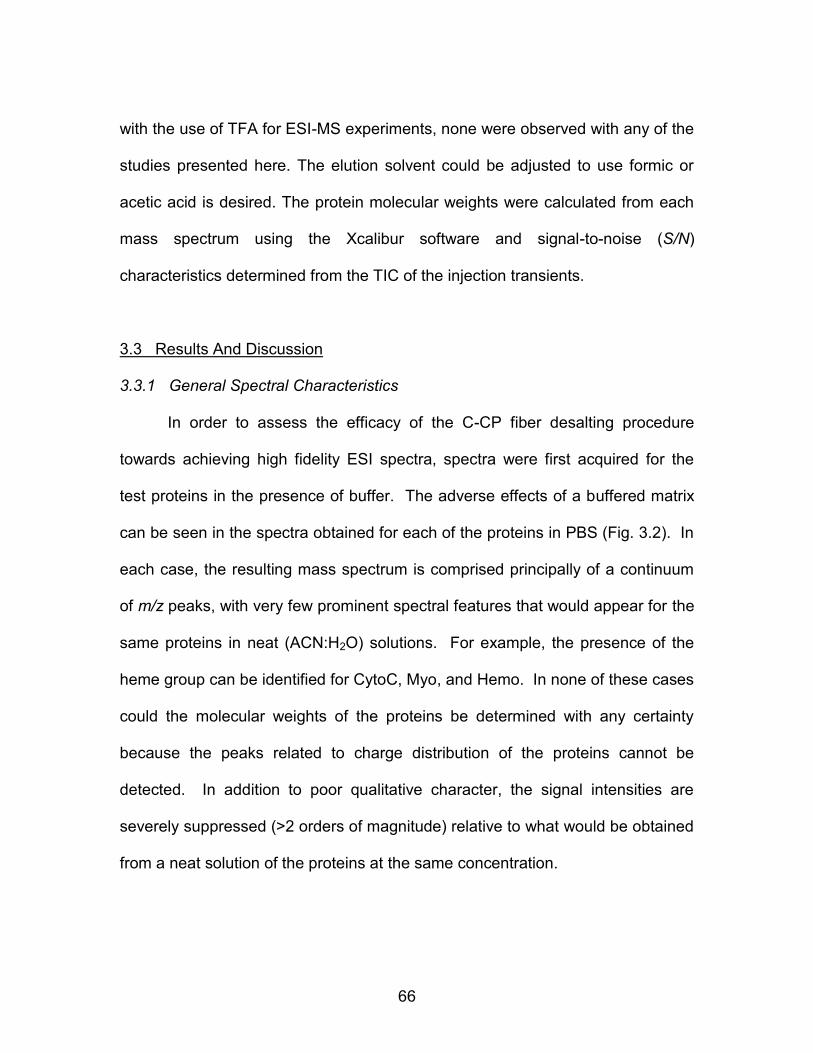
66
with the use of TFA for ESI-MS experiments, none were observed with any of the
studies presented here. The elution solvent could be adjusted to use formic or
acetic acid is desired. The protein molecular weights were calculated from each
mass spectrum using the Xcalibur software and signal-to-noise (S/N)
characteristics determined from the TIC of the injection transients.
3.3 Results And Discussion
3.3.1 General Spectral Characteristics
In order to assess the efficacy of the C-CP fiber desalting procedure
towards achieving high fidelity ESI spectra, spectra were first acquired for the
test proteins in the presence of buffer. The adverse effects of a buffered matrix
can be seen in the spectra obtained for each of the proteins in PBS (Fig. 3.2). In
each case, the resulting mass spectrum is comprised principally of a continuum
of m/z peaks, with very few prominent spectral features that would appear for the
same proteins in neat (ACN:H2O) solutions. For example, the presence of the
heme group can be identified for CytoC, Myo, and Hemo. In none of these cases
could the molecular weights of the proteins be determined with any certainty
because the peaks related to charge distribution of the proteins cannot be
detected. In addition to poor qualitative character, the signal intensities are
severely suppressed (>2 orders of magnitude) relative to what would be obtained
from a neat solution of the proteins at the same concentration.

67
Figure 3.2: ESI-MS spectra of target proteins in PBS prior to desalting; a) cytochrome c, b) lysozyme, c) hemoglobin, and d) myoglobin. Spectra represent 25 µL injections of ~20 µM
protein concentration.
The same sample types were analyzed using the C-CP fiber desalting
microcolumn, at protein concentrations that are a factor of 10 lower than those of
Fig. 3.2; yielding mole factions of >100,000:1 (PBS:protein). The qualitative
spectral improvement is clearly seen in Fig. 3.3 as peaks related to the
electrospray ionization of each separate protein are distinct and readily identified.
Molecular weights were calculated using the respective charge distributions and
were determined to be: CytoC = 12,231 ± 4 Da, Lyso = 14,312 ± 2 Da, Myo =
16,962 ± 5 Da, and Hemo = 17,030 ± 10 Da. The small range of uncertainties
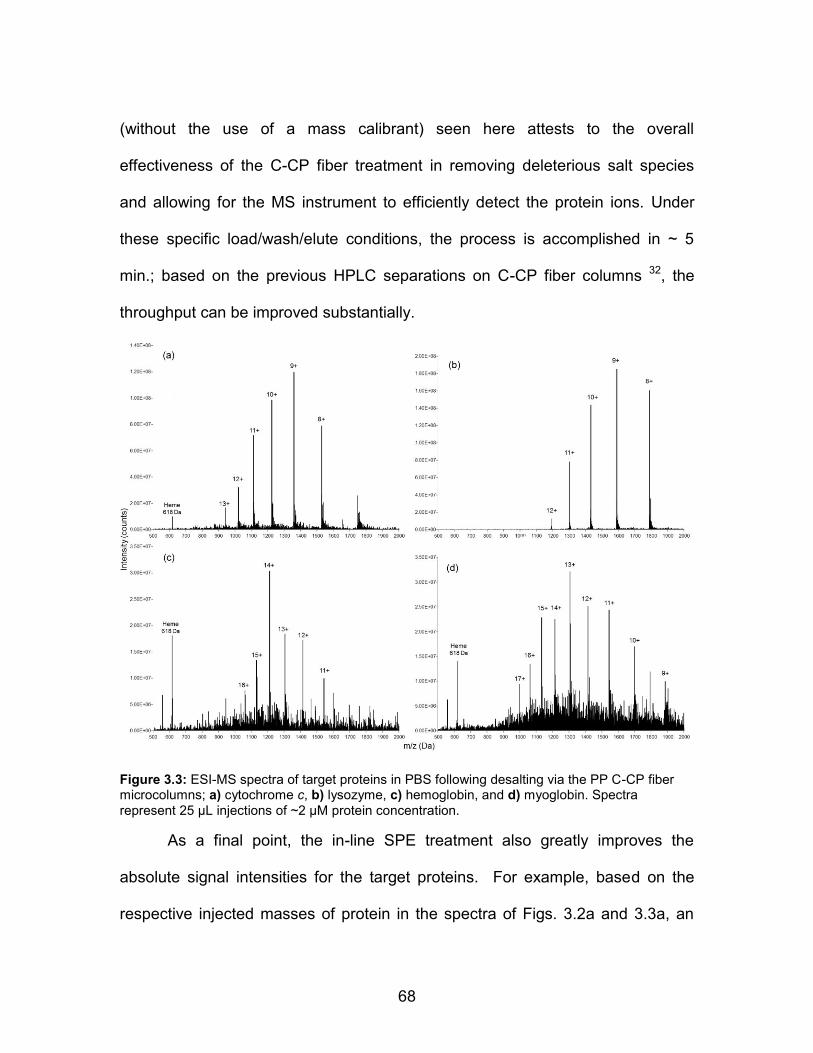
68
(without the use of a mass calibrant) seen here attests to the overall
effectiveness of the C-CP fiber treatment in removing deleterious salt species
and allowing for the MS instrument to efficiently detect the protein ions. Under
these specific load/wash/elute conditions, the process is accomplished in ~ 5
min.; based on the previous HPLC separations on C-CP fiber columns 32, the
throughput can be improved substantially.
Figure 3.3: ESI-MS spectra of target proteins in PBS following desalting via the PP C-CP fiber microcolumns; a) cytochrome c, b) lysozyme, c) hemoglobin, and d) myoglobin. Spectra
represent 25 µL injections of ~2 µM protein concentration.
As a final point, the in-line SPE treatment also greatly improves the
absolute signal intensities for the target proteins. For example, based on the
respective injected masses of protein in the spectra of Figs. 3.2a and 3.3a, an

69
~200-fold improvement is seen for the signal assigned to the z = +11 ion of
CytoC, even with the concentration being 10X less.
3.3.2 Microcolumn Loading Characteristics
Beyond the qualitative aspects of measurement improvement for protein
charge distribution and molecular weight accuracy, the C-CP fiber desalting
microcolumn was evaluated regarding the more quantitative aspects of fiber
loading capacity and protein recovery. Previous studies in this laboratory using
the C-CP fibers in a micropipette tip format (as used in previous SPE work with
centrifugation as the means of moving fluid 28, 29) determined the adsorption
capacity of a 1 cm long C-CP fiber-packed micropipette tip to be approximately
1.5 µg of protein 31, equating to approximately a one-monolayer coverage for the
range of proteins tested. Therefore an adsorption limit of ~7.5 µg was expected
for the 5 cm fiber packed microcolumns here. The first set of experiments
involved loading Hemo:PBS onto the desalting microcolumn and the mass
spectrometric responses analyzed over a range of 1 – 23 µg of applied protein
within an injection volume of 100 µL (~0.06 – 1.4 µM) and a volume flow rate of
30 µL min-1 (equivalent to a linear velocity of ~1.5 mm s-1). This range was
achieved by varying the sample concentration and volume applied in the loading
step. As seen in Fig. 3.4, the integrated peak areas (TIC across 500 – 2000 Da)
increase as more protein is applied to the C-CP microcolumn; up to a mass
loading of ~10 µg.
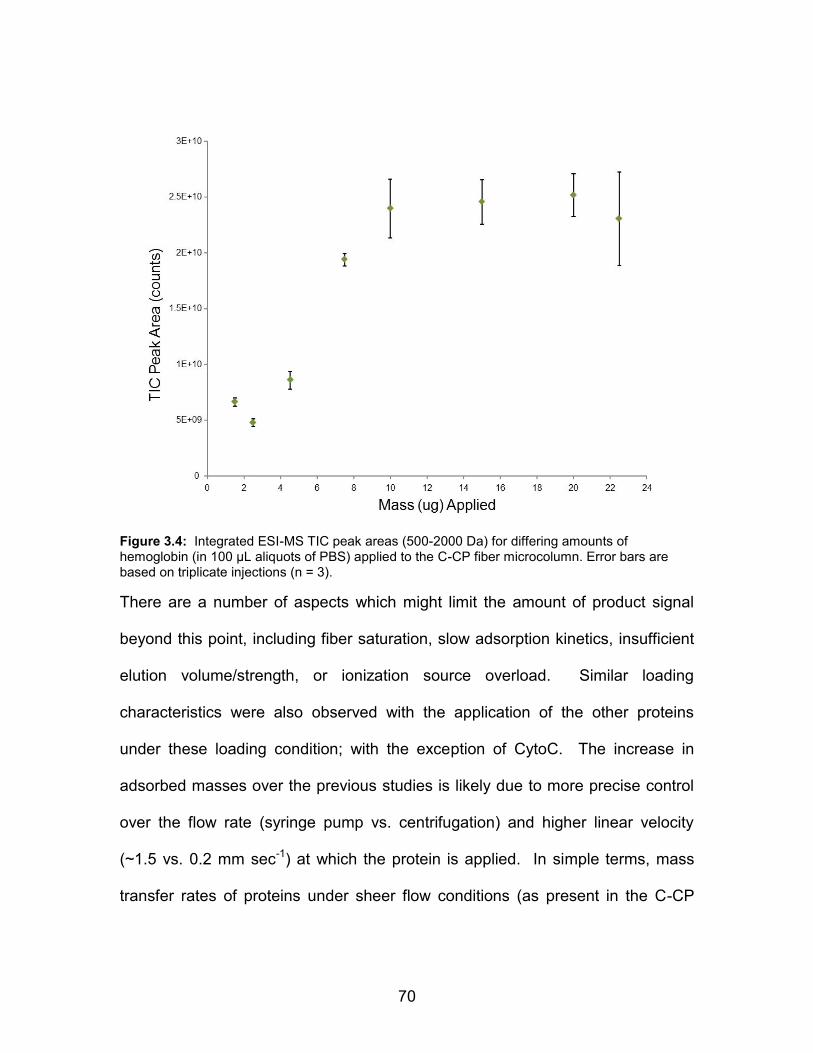
70
Figure 3.4: Integrated ESI-MS TIC peak areas (500-2000 Da) for differing amounts of hemoglobin (in 100 µL aliquots of PBS) applied to the C-CP fiber microcolumn. Error bars are based on triplicate injections (n = 3).
There are a number of aspects which might limit the amount of product signal
beyond this point, including fiber saturation, slow adsorption kinetics, insufficient
elution volume/strength, or ionization source overload. Similar loading
characteristics were also observed with the application of the other proteins
under these loading condition; with the exception of CytoC. The increase in
adsorbed masses over the previous studies is likely due to more precise control
over the flow rate (syringe pump vs. centrifugation) and higher linear velocity
(~1.5 vs. 0.2 mm sec-1) at which the protein is applied. In simple terms, mass
transfer rates of proteins under sheer flow conditions (as present in the C-CP

71
fiber channels) increase with linear velocities due to thinning of the solution-
surface diffusion layer 37-40. Of course such improvements only occur to the point
where the column transit times become too short relative to the limiting
adsorption kinetics. In practical terms, increasing the “load” flow rate can reduce
analysis time, alter the mode in which the analyte adsorbs, as well as determine
the length of time analytes are adsorbed to the fiber surface prior to elution. It is
well known that the degree of protein denaturation observed is directly related to
time spent on a hydrophobic surface 41. Thus the less time spent adsorbed to
the polymer surface in the course of the adsorption step, the greater the fraction
of molecules analyzed in the native conformation. As demonstrated in previous
HPLC separations, the high shear rates present in C-CP fiber columns reduces
the extent of protein denaturing relative to conventional C8-modified silica phases
26. As a general response, increased ESI-MS intensities and higher charge
states are observed when proteins are in a denatured state, due to the fact that
the open conformation can accept more charges than the native folded state 6, 42,
43. The effects of increased throughput and lower levels of denaturation under
high shear conditions towards achieving enhanced responses will be the focus of
future loading studies under various conditions of linear velocity.
An additional variable in determining the binding capacity of an SPE
phase is the role of solution concentration. On a first-principles basis, diffusion
rates increase with solute concentrations and so differences in injection volumes
for the same protein mass should provide greater analytical responses. As seen

72
in Fig. 3.5, there is a definite deviation in the extent of CytoC loading based on
the actual solution concentration/injection volume. Presented below are two sets
of loading/response curves; the upper for 100 µL injection volumes (as in the
case depicted for Hemo in Fig. 3.4) and the lower one for a 300 µL volume. The
first point to note is the fact that the loading/recovery mass capacity for CytoC is
~60-80% greater than the other test proteins; reaching a limit at ~20 µg.
Figure 3.5: Integrated ESI-MS TIC peak areas (500-2000 Da) for differing amounts of cytochrome c (in PBS) applied to the C-CP fiber microcolumn in either 100 or 300 µL aliquots.
Error bars are based on triplicate injections (n = 3).
The tertiary structure of CytoC has potential to exhibit dimerization (protein-
protein interaction) and so the increased adsorption may reflect the multi-layering
of protein on the fiber surface 44, 45. The higher apparent loading/recovery may
also be reflective of greater recoveries in the elution step for CytoC. Based on

73
previous reversed phase C-CP fiber chromatography, CytoC elutes at a lower
solvent strength (lower %ACN) than the other proteins, and so may be more
efficiently eluted from the fiber surface and introduced into the ESI source. The
second phenomenon illustrated in Fig. 3.5 is the fact that the recovery is related
to the initial solution concentration up to an applied mass of ~20 µg. Specifically,
the factor-of-3 lower solution concentrations (by virtue of the larger injection
volumes) show reductions in signal recoveries by the same proportion. This is
not an unexpected result, but highlights another aspect of the use of the C-CP
fibers in this application; solute concentrations on level of 0.2 mg mL-1 are still in
the linear portion of the adsorption isotherm. This implies that adsorption should
be quantitative up to this point. Previous studies in this laboratory have indicated
linearity in isotherms up to values of 5 mg mL-1. The third point which can be
gleaned from Fig. 3.5 is the fact that there is a decrease in signal recovery above
loadings of ~25 µg of CytoC. Among the potential limitations in recovery
described above, it is fairly clear that the system is limited by the ability to desorb
protein quantitatively with the chosen solvent (50:50 ACN:DI-H2O + 0.1% TFA).
This response is not in itself surprising given the likelihood of extensive multi-
layers of CytoC in these instances.
3.3.3 Desalting of Protein in a Synthetic Urine Matrix
While many instances of protein identification and quantification do involve
otherwise simple buffer matrices (e.g., PBS), it is important to investigate the
efficacy of the in-line C-CP fiber SPE approach towards different types of

74
biomatrices. As a preliminary demonstration, synthetic urine was chosen as a
representative matrix. Urine is a common biofluid for protein (and other
biomarker) determinations due to the ability to collect multiple samples over
periods of time and noninvasive collection procedure 46. In this demonstration,
myoglobin was spiked into a synthetic urine solution at a level of 200 µg mL-1
(11.8 µM). The inset in Fig. 3.6 depicts the mass spectrum obtained when 75 µL
of the spiked urine specimen was injected directly into the ESI source. No
discernible myoglobin peaks, including the heme signature, are present over the
entire m/z scan range. The same sample, equating to a total protein mass of 15
µg was injected onto the C-CP fiber microcolumn for desalting prior to ESI-MS
analysis. The peaks characteristic of the myoglobin charge states and the heme
group are clearly present in the main spectrum of Fig. 3.6, with the representative
peaks having intensities on par with what would be obtained by direct injection of
a neat solution, illustrating the alleviation of the signal suppression caused by the
urine matrix. In fact, the extracted single ion transient for the +11 species (1542
Da) displays a >300x improvement in the S/N ratio at the transient peak for the
C-CP fiber microcolumn cleanup, even though the protein masses of the
integrated spectral acquisition is the same.

75
Figure 3.6: ESI-MS spectra of myoglobin present at a concentration of 200 µg mL-1
(11.8 µM) in a synthetic urine matrix after C-CP fiber desalting; inset - direct injection of 75 µL into the ESI source without C-CP fiber desalting
3.3.4 Demonstration of Isocratic Protein Separation
As with all forms of sample pretreatment, natural questions exist regarding
bias with respect to multicomponent mixtures. Such biases can be particularly
problematic at solute levels approaching the binding capacity of the support
phases, where competitive binding is most evident. The in-line C-CP fiber
desalting microcolumn was evaluated for the analysis of a mixture of two proteins
(CytoC and Myo) in PBS. The mixture was loaded onto the microcolumn at near
capacity (14 µg of protein as depicted in Fig. 3.4) in a 100 µL aliquot; consisting
of 5 µg (4.07 X 10 -4 µM) CytoC and 9 µg (5.06 X 10⁻⁴ µM) of Myo. Figure 3.7
presents the transient signals obtained for the elution of the sample under the
76
typical ESI-MS conditions of 50:50 ACN:DI-H2O + 0.1% TFA through the
microcolumn at a flow rate of 100 µl min-1.
Figure 3.7: ESI-MS temporal responses for a mixture of CytoC (5 µg, 4.07e-4 µmol) and Myo (9 µg, 5.06e-4 µmol) present in 100 µL of PBS upon elution from a PP C-CP fiber microcolumn.
Transient responses represent: - TIC for 500 – 2000 Da, - z = +9 for CytoC, and - z = +12 for Myo.
The transient filled in with the black coloring represents the TIC obtained over
masses 500-2000 Da. Processing of extracted ion chromatograms along the
transient reveals a somewhat surprising situation wherein the two proteins exhibit
different temporal characteristics, revealing mass spectra that are dominated by
each of the proteins along the transient. The single ion chromatograms
representing the most prominent of the charge states for each protein

77
demonstrate the species separation. As described previously, CytoC elutes at
lower organic percentages than myoglobin, which is seen in its earlier
appearance in the transient. Note that a mass spectrum extracted from the time
point equating to the TIC maximum is simply a combination of the two proteins.
Other than in the case of size-exclusion chromatography (SEC), it is very
unusual for isocratic elution of proteins to yield a separation on this time scale.
This finding suggests the potential to perform quick, small-scale isocratic
separations under typical ESI-MS solvent conditions, in addition to the gradient
methods demonstrated previously 26, 32. In terms of any competitive binding in
this near-saturation situation, the transient peak responses for each of the
proteins suggest that the recoveries are fairly quantitative.
3.4 Conclusions
The use of an in-line C-CP fiber-based microcolumn to affect solid phase
extraction prior to ESI-MS has been shown to significantly improve the spectral
quality obtained for proteins in complex salt matrices. The microcolumn is simply
incorporated as the injection loop of a standard six-port valve, with its
permeability allowing for simple low-pressure fluidic processing using either
syringe pumps or HPLC pumps. The microcolumn can be used successfully
under various flow rates and elution solvents that are optimal for the method of
detection (e.g. ESI-MS, fluorescence, etc.) and compares will with other low
pressure alternatives, e.g. RP monoliths 47, 48. In the present case, the load,

78
wash, and elution steps can be accomplished in ~5 min. While not demonstrated
specifically here, the non-porous nature of the C-CP fibers allows columns to be
used multiple (at least 50) times without degradation of the extraction
characteristics or physical aspects of the microcolumn. The different available
format options for C-CP fiber extraction media (e.g., columns, loops, and
micropipette tips) provide users flexibility in terms of the desired throughput and
processing complexity based on the desired analysis technique.
There will be continued investigations of the capabilities and limitations of
the PP C-CP desalting microcolumn. Based on protein separations on C-CP
fiber phases, the volume load rates can be increased to the mL min-1 level, such
that 100 µL loads employed here can be achieved in <10 s. Likewise very rapid
rinsing can be affected, with elution taking place under optimal ESI-MS
conditions. Certainly there will be load/elution optimizations that may be
performed that are specific to a given protein/matrix situation. Beyond the
improvements demonstrated here, there also exists a wealth of chemical means
to impart greater chemical selectivity in the C-CP fiber SPE processing. These
could include use of different base polymers, or chemical modifications of those
surfaces 49. These could include covalent attachment of ligands on the fiber
surfaces or indeed their simple adsorption. For example, recent efforts have
shown that simple passage of a protein A solution through a C-CP fiber tip
assembly allows creation of a surface with very good IgG capture and release
characteristics 50. Finally, as suggested here, further work will focus on the
79
incorporation of C-CP fiber microcolumns to perform chromatographic
separations prior to ESI-MS analysis.
This material is based upon work supported by the National Science
Foundation Division of Chemistry under Grant No. 1011820 (co-funded by the
MPS/CHE, ENG/CBET, and EPSCoR).
References 1. R. Aebersold and M. Mann, Nature, 2003, 422, 198-207. 2. S. Canarelli, I. Fisch and R. Freitag, Journal of Chromatography A, 2002,
948, 139-149. 3. J. Griffiths, Analytical Chemistry, 2008, 80, 5678-5683. 4. J. W. Hager, Analytical and Bioanalytical Chemistry, 2004, 378, 845-850. 5. A. Shukla and R. E. Majors, LCGC North America, 2005, 23, 646-660. 6. U. A. Mirza and B. T. Chait, Analytical Chemistry, 1994, 66, 2898-2904. 7. D. N. Nguyen, G. W. Becker and R. M. Riggin, Journal of Chromatography
A, 1995, 705, 21-45. 8. J. J. Zheng, E. D. Lynch and S. E. Unger, Journal of Pharmaceutical and
Biomedical Analysis, 2002, 28, 279-285. 9. S. K. Bergstrom, M. Goiny, R. Danielsson, U. Ungerstedt, M. Andersson
and K. E. Markides, Journal of Chromatography A, 2006, 1120, 21-26. 10. R. L. Winston and M. C. Fitzgerald, Analytical Biochemistry, 1998, 262,
83-85. 11. L. L. Sun, J. C. Duan, D. Y. Tao, Z. Liang, W. B. Zhang, L. H. Zhang and
Y. K. Zhang, Rapid Communications in Mass Spectrometry, 2008, 22, 2391-2397.

80
12. D. J. Wilson and L. Konermann, Analytical Chemistry, 2005, 77, 6887-6894.
13. S. Risticevic, V. H. Niri, D. Vuckovic and J. Pawliszyn, Analytical and
Bioanalytical Chemistry, 2009, 393, 781-795. 14. S. Miyazaki, K. Morisato, N. Ishizuka, H. Minakuchi, Y. Shintani, M.
Furuno and K. Nakanishi, Journal of Chromatography A, 2004, 1043, 19-25.
15. R. E. Majors, LCGC-Magazine of Separation Science, 1998, May, 8-15. 16. I. Liska, Journal of Chromatography A, 2000, 885, 3-16. 17. R. D. Bagshaw, J. W. Callahan and D. J. Mahuran, Analytical
Biochemistry, 2000, 284, 432-435. 18. W. Rist, M. P. Mayer, J. S. Andersen, P. Roepstorff and T. J. D.
Jorgensen, Analytical Biochemistry, 2005, 342, 160-162. 19. O. B. Horning, S. Theodorsen, O. Vorm and O. N. Jensen, International
Journal of Mass Spectrometry, 2007, 268, 147-157. 20. Y. Ishihama, J. Rappsilber and M. Mann, Journal of Proteome Research,
2006, 5, 988-994. 21. S. F. Xie, F. Svec and J. M. J. Frechet, Chemistry of Materials, 1998, 10,
4072-4078. 22. Y. Saito, M. Imaizumi, T. Takeichi and K. Jinno, Analytical and
Bioanalytical Chemistry, 2002, 372, 164-168. 23. W. Boonjob, Y. Yu, M. Miro, M. A. Segundo, J. Wang and V. Cerda,
Analytical Chemistry, 2010, 82, 3052-3060. 24. Y. Zhang, X. Kang, L. Chen, C. Pan, Y. Yao and Z.-Z. Gu, Analytical and
Bioanalytical Chemistry, 2008, 391, 2189-2197. 25. R. K. Marcus, W. C. Davis, B. C. Knippel, L. LaMotte, T. A. Hill, D. Perahia
and J. D. Jenkins, Journal of Chromatography A, 2003, 986, 17-31. 26. D. M. Nelson and R. K. Marcus, Analytical Chemistry, 2006, 78, 8462-
8471.
81
27. P. J. Brown, K. Sinclair, L. Fuller, K. A. Stevens, K. Webb, K. R. Marcus, D. M. Nelson and R. D. Stanelle, Polym. Prepr. (Am. Chem. Soc., Div. Polym. Chem.), 2006, 47, 551-552.
28. D. S. Fornea, Y. Wu and R. K. Marcus, Anal Chem, 2006, 78, 5617-5621. 29. J. J. Pittman, V. Klep, I. Luzinov and R. K. Marcus, Analytical Methods,
2010, 2, 461-469. 30. B. T. Manard and R. K. Marcus, J Am Soc Mass Spectrom, 2012. 31. C. Q. Burdette and R. K. Marcus, Analyst, 2012, DOI:
10.1039/c2an36126d. 32. J. M. Randunu and R. K. Marcus, Anal. Bioanal. Chem., 2012, 404, 721-
729. 33. R. D. Stanelle, M. Mignanelli, P. Brown and R. K. Marcus, Anal. Bioanal.
Chem., 2006, 384, 250-258. 34. L. Geiser, S. Eeltink, F. Svec and J. M. J. Frechet, Journal of
Chromatography A, 2008, 1188, 88-96. 35. D. W. Shang, X. P. Wang, X. T. Zhao, F. M. Huang, G. Z. Tian, W. Lu and
T. Y. Zhou, Journal of Chromatography B-Analytical Technologies in the Biomedical and Life Sciences, 2011, 879, 3459-3464.
36. H. M. Oliveira, M. A. Segundo, J. Lima, M. Miro and V. Cerda, Journal of
Chromatography A, 2010, 1217, 3575-3582. 37. B. R. Bird, W. E. Stewart and E. N. Lightfoot, Transport Phenomena,
Wiley, New York, 1960. 38. C. F. Wertz and M. M. Santore, Langmuir, 1999, 15, 8884-8894. 39. C. F. Wertz and M. M. Santore, Langmuir, 2002, 18, 1190-1199. 40. P. Dejardin and E. N. Vasina, Colloids and Surfaces B-Biointerfaces,
2004, 33, 121-127. 41. C. W. Herbold, J. H. Miller and S. C. Goheen, Journal of Chromatography
A, 1999, 863, 137-146.

82
42. Y. J. Wang, B. M. Balgley, P. A. Rudnick and C. S. Lee, Journal of Chromatography A, 2005, 1073, 35-41.
43. M. Samalikova, I. Matecko, N. Muller and R. Grandori, Analytical and
Bioanalytical Chemistry, 2004, 378, 1112-1123. 44. S. Jones and J. M. Thornton, Proceedings of the National Academy of
Sciences of the United States of America, 1996, 93, 13-20. 45. A. Fantuzzi, S. Sadeghi, F. Valetti, G. L. Rossi and G. Gilardi,
Biochemistry, 2002, 41, 8718-8724. 46. E. J. Saude and B. D. Sykes, Metabolomics, 2007, 3, 19-27. 47. R. Roux, M. A. Jaoude, C. Demesmay and J. L. Rocca, Journal of
Chromatography A, 2008, 1209, 120-127. 48. M. M. Zheng, G. D. Ruan and Y. Q. Feng, Journal of Chromatography A,
2009, 1216, 7739-7746. 49. R. K. Marcus, Journal of Separation Science, 2008, 31, 1923-1935. 50. A. J. Schadock-Hewitt and R. K. Marcus, J. Chromatogr. A, submitted for
publication.

83
CHAPTER FOUR
DETERMINATION OF ISOFLAVONE CONTENT IN SOY, RED CLOVER AND
KUDZU DIETARY SUPPLEMENT MATERIALS BY LIQUID
CHROMATOGRAPHY-PARTICLE BEAM/ELECTRON
IONIZATION MASS SPECTROMETRY (LC-PB/EIMS)
4.1 Introduction
The use of dietary supplements is of ever increasing relevance as the
public continues to be more concerned about cancers, obesity, fitness, and
general well-being.1 It was estimated by the American Herbal Products
Association that in 2004 there were nearly 50,000 different herbal supplement
products being sold, and that number has increased to 55,600 in 2012.2 The
dietary supplement market is substantial, boasting 2010 annual sales of $28.1
billion in the U.S. alone, which increased from an estimated $15.7 billion in
2000.3 It was reported in 2001 that 48% of American adults label themselves as
“supplement users” by claiming the consumption of products such as vitamins,
herbs, botanicals, minerals, and sport nutritional products. About 17% of that
group claimed regular use of dietary supplements such as Echinacea, amino
acids, or over-the-counter hormones.3 This considerable level of consumption
has inherently brought about high awareness for consumer safety and
regulations on available products. In regards to consumer safety, it is important

84
to know what active compounds, and in what amounts, are present in dietary
supplements. However, there are currently no dietary reference intake (DRI)
values for isoflavones.4 Dietary supplement regulations were initiated in the
1930’s with the enactment of the Food and Drug Administration (FDA) Vitamin
Division. Thus began much debate between the public and the government about
what regulations should be allowed. Finally, the Dietary Supplement Health and
Education Act (DSHEA) of 1994 was passed with the aim to define what a dietary
supplement is and to ensure that the identity, purity, and strength of the
components in dietary supplement products are accurately presented on the
labeling. DSHEA established the Office of Dietary Supplements (ODS) within the
Office of Disease Protection (ODP) in the National Institutes of Health (NIH).
Since then, there have been numerous acts and regulations geared towards
protecting and informing consumers of the nature of the products, including the
establishment of six botanical centers aimed towards dealing with
standardization, quality, and safety of dietary supplements.1
Current good manufacturing practices (cGMPs) were also put into place
through legislation, which required full compliance in 2010. The Analytical
Chemistry Division of the National Institute of Standards and Technology (NIST)
works alongside the ODS and has been making strides in the analytical
chemistry side of validating dietary supplement products with the development of
suites of standard reference materials (SRMs).5 The purpose of these SRMs is to
provide matrix-matched standards for different dietary supplements that are

85
certified for realistic levels of active components present in the products. These
standards can then be used to validate in-house analytical methods for precision
and accuracy, provide resources for suppliers to assure safety and proper
labeling of their products, and to determine potential adulterants and ‘spiked’
compounds.1, 5 It is critical to have methods that will provide precise, accurate,
and detailed information, also enabling results to be compared between multiple
laboratories. One of the primary challenges in the development of SRMs is the
requirement of multiple, orthogonal analysis methods to attain the same
quantitative answer. It must be understood that while developing matrix-matched
materials for botanicals, there are variations in chemical fingerprints with location,
season, and other environmental influences.1, 5
Various analytical methods are currently employed for the characterization
of the active components in dietary supplements. A survey of the literature
indicates that the most widely used techniques are reversed-phase high
performance liquid chromatography (RP-HPLC) coupled with ultraviolet/diode
array detector (UV/DAD) or electrospray ionization mass spectrometry (ESI-MS)
detection.1, 6-8 The advantages of UV detection are the sensitivity, simplicity and
lower instrument costs compared to other techniques. One of the major
disadvantages is that absorbance measurements are not analyte-specific (no
structural information) and so are incapable of identifying unknown
peaks/interferences and providing structural information. On the other hand, ESI-
MS is capable of simple interfacing with HPLC (as long as flow rate and mobile
86
phase composition are compatible), provides high sensitivity, and yields
structural information. Some of the disadvantages of ESI-MS are the intolerance
to salts and mixtures, and the multiple charge states formed in the ionization
mechanism can make spectral interpretations difficult, but this is minimized with
the use of LC separations. As such, MS-MS has become an essential component
of ESI as it is necessary to fully characterize the species of interest. Electron
ionization (EI) is a well characterized source for mass spectrometry and allows
for identification of unknowns through predictable fragmentation patterns and
matching spectral patterns in available libraries. EI is generally used with gas
chromatography (GC) sample introduction which hold some disadvantages due
to labor intensive sample preparation and derivatization steps, and possible
thermal decomposition of thermally labile compounds. For the analysis of
botanical materials in complex and varying matrices, it would be advantageous to
have LC separation capabilities combined with the predictable fragmentation
patterns and structural information provided by EI-MS detection.
Presented here is the use of a particle beam (PB) interface to couple a
RP-HPLC separation to EIMS detection for the determination of isoflavones
present in soy, red clover and kudzu dietary supplements. Isoflavones are a set
of active botanical compounds, known as phytoestrogens, which have received
much attention in the context of dietary supplements. 5, 7, 9-11 Epidemiological
studies have shown correlations between diets high in isoflavone-rich foods and
decreased risks of certain cancers and hormone-dependent diseases. 1, 6, 8, 9, 11-13

87
As the roles of absolute uptake, bioavailability, and metabolism pathways of
isoflavones are not completely understood, the potential health benefits and risks
of increased isoflavone and supplement intake is of much concern. 1, 5, 7 The LC-
PB/EIMS system allows for an established HPLC method to be interfaced directly
to an EI source for mass spectrometric detection, and has been studied
extensively in this laboratory. 14, 15 The method has been validated for the
analysis of ephedra-containing SRMs and has been employed in the analysis of
components in other botanical products such as bladderwrack and green tea
extracts. 16-18 In a single run, this tool can provide both comprehensive elemental
speciation and chemical characterization of molecular species. The system can
also be easily run in series with a UV-VIS absorbance detection system when
necessary, or available, and provides both qualitative and quantitative
information simultaneously. The described separation and detection technique
provides an orthogonal method to those currently established NIST approaches,
and will afford another method of analysis for the certification of future isoflavone-
related products. SRMs (Soy; SRM 3234, SRM 3236, SRM 3237, and SRM
3238, Red Clover; SRM 3271, SRM 3272, and SRM 3273, and Kudzu; SRM
3267, SRM 3268, and SRM 3269) that are currently under development are
subjected to isoflavone determination by the LC-PB/EIMS system. A suite of five
target isoflavones (puerarin, daidzein, genistein, formononetin, and biochanin A),
where chosen in order to encompass the diverse isoflavone content of all the
SRMs of interest. The chemical structures of these compounds, as well as the

88
employed internal standard (IS) compound (7-hydroxy-4-chromone, are seen in
Fig. 4.1. The LC-PB/EIMS detection method is presented here to be a viable
analytical technique for the characterization and quantitation of the active
components in botanical products.
Figure 4.1: Chemical structures and molecular weights of target isoflavones and internal
standard compound
4.2 Experimental
4.2.1 Reagents and solutions
MilliQwater was derived from a NANOpure Diamond water system (18.2
MΩ cm-1, Barnstead International, Dubuque, IA). ACS grade methanol (MeOH),
trifluoroacetic acid (TFA), individual isoflavones (puerarin, daidzein, genistein,
formononetin, and biochanin A) and the IS compound (7-hydroxy-4-chromone)
were purchased from Sigma-Aldrich (St. Louis, MO). Individual stock solutions of

89
the isoflavones and IS compound were prepared in 80:20 MeOH:milliQwater and
stored in 15 mL centrifuge tubes at 4 °C and in darkness. Working dilutions were
prepared daily with aqueous 0.1% TFA. Calibration solutions were prepared by
gravimetrically mixing appropriate amounts of each isoflavone diluted solutions
and the IS diluted solution with 80:20 MeOH:milliQwater. Extraction methods,
filtration and/or additional sample preparation procedures can all affect the
downstream analysis. It is critical to be sure that the extract contains all of the
compounds of interest present in the original material as well as be conscious of
derivatives or degradation of the analytes during the extraction procedure and
storage. SRM samples (NIST; Gaithersburg, MD) were extracted by accurately
weighing ~100 mg solid into a 15 mL centrifuge tube, adding an appropriate
amount of IS solution, and adding ~10 g of 80:20 MeOH:milliQwater. The
samples were extracted for three hours using a homemade rotary mixer. The
mixer was constructed by attaching a small wooden plank to the vapor ducting
piece of a commercial BÜCHI Rotavapor R-144 apparatus. Samples tubes are
attached to the plank and the rotavapor turned on to 60 rotations per min. The
samples were then centrifuged (VWR, Clinical 50) at 4000 RPMS for 30 min. The
supernatant was filtered (0.45 µm PTFE syringe filter), transferred to 15 mL
centrifuge tubes, and stored in at 4 °C. These extracts were diluted as needed for
final analysis.
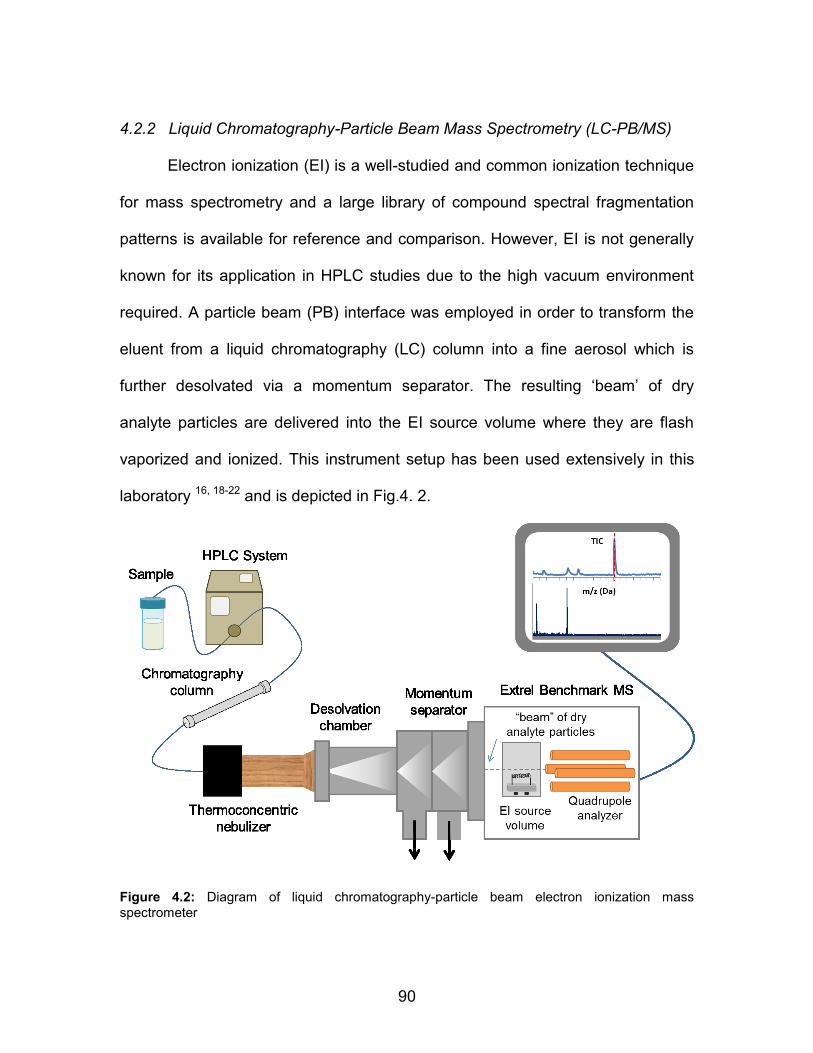
90
4.2.2 Liquid Chromatography-Particle Beam Mass Spectrometry (LC-PB/MS)
Electron ionization (EI) is a well-studied and common ionization technique
for mass spectrometry and a large library of compound spectral fragmentation
patterns is available for reference and comparison. However, EI is not generally
known for its application in HPLC studies due to the high vacuum environment
required. A particle beam (PB) interface was employed in order to transform the
eluent from a liquid chromatography (LC) column into a fine aerosol which is
further desolvated via a momentum separator. The resulting ‘beam’ of dry
analyte particles are delivered into the EI source volume where they are flash
vaporized and ionized. This instrument setup has been used extensively in this
laboratory 16, 18-22 and is depicted in Fig.4. 2.
Figure 4.2: Diagram of liquid chromatography-particle beam electron ionization mass
spectrometer

91
LC separations were carried out using a Waters (Milford, MA, USA) Model
Series 1500 LC pump for sample delivery and an Alltech (Grace; Columbia, MD)
C18 RP column (5 µm silica particle, 250 mm long with 4.6 mm i.d.). Mobile phase
A was milliQwater and mobile phase B was MeOH, both containing 0.1 %TFA. A
linear gradient of 30-90 %B over 40 minutes at a flow rate of 1.0 mL min-1 was
used with a 50 µL sample injection volume. A Waters 2487 Dual λ Absorbance
Detector was used for UV-VIS detection at 254 nm. The LC system was coupled
to an Extrel Benchmark quadrupole mass spectrometer system controlled by the
Extrel Merlin Automation Data System software (Extrel CMS; Pittsburg, PA). The
MS system scanned masses from 50-700 Da at 1.0 s/scan for the collection of
total ion chromatogram (TIC) responses from which selected ion monitoring
(SIM) chromatograms and corresponding mass spectra were extracted.
Operational parameters for the system (e.g., source block temperature) were
optimized previously 18 and are listed in Table 4.1. All collected data was
processed by a combination of the Merlin software and exported to Excel
(Microsoft; Redmond, WA) for data manipulation and presentation.
Table 4.1: Experimental Conditions for LC-PB/EIMS Analysis of Isoflavones
RP-HPLC Column Alltech C18 Flow rate 1.0 mL min
-1
Mobile Phases (A) milliQ H2O with 0.1% TFA (B) MeOH with 0.1% TFA
PB-EIMS
Nebulizer Tip Temp 85-95 °F Desolvation Temp 147 °F Source Block Temp 276 °F Sheath gas (He) flow 500 mL min
-1
Electron energy 70 eV Mass range monitored 50-700 m/z (Da) Scan Rate 1 s/scan

92
4.3 Results and Discussion
Most of the commonly used analytical methods for the characterization of
isoflavone content rely on chromatographic peak retention time comparisons.
This is a fairly reliable method but does not allow for the determination of
unknown compounds and is prone to errors because of the non-analyte-specific
retention time matching. It can also require very complex calibration solutions
when analyzing complex samples with multiple components of interest. A
common way to reduce the complexity of a sample and the subsequent
chromatography, and reduce the number of calibration compounds required for
peak matching, is to include an acid and/or base hydrolysis in the sample
preparation procedure. In the case of isoflavones, this process reduces the
isoflavone malonyl- and acetyl-glucosides into the base glucoside and aglycone
forms. One shortcoming of this approach is the original component profile of the
botanical material is altered at the risk of obtaining misleading or inaccurate
results and loosing important information is increased.8, 23-25
The LC-PB/EIMS method presented here for the characterization of
isoflavones in botanical material requires minimal sample preparation and allows
for simultaneous peak retention time matching with actual mass spectrometric
identification using basic EI fragmentation rules. Retention time assignments are
completed initially with UV-VIS detection at 254 nm as the separation method is
optimized, and then continued since the UV-VIS and EI detection methods are
93
run in series. This provides, in a single run, a full overview of the entire isoflavone
profile in a given sample.
4.3.1 Method of Quantitation
Given the complexity of botanical samples and extraction methods, simple
quantification based on calibration standards for each analyte is impractical. As
such, an internal standard (IS) approach is used. Successful quantitation relies
heavily on the choice of IS compound. A good IS must be chemically similar to
the target analyte(s) to provide similar response characteristics but sufficiently
different so that the two compounds are discernible by the analytical instrument.
This can be achieved by isotopically labeling a target compound, which is
expensive, or choosing a unique compound with structural similarities. There are
many different IS compounds used in current isoflavone research; e.g. 2,4,4’-
trihydroxydeoxybenzoin26, 4-hydroxybenzaldehyde 27, other isoflavones not being
quantified 28, and isotopically-labeled isoflavones29, 30.
For the studies presented here, 7-hydroxy-4-chromone was chosen for the
IS compound based on its structural similarities to all of the target isoflavones
(see Fig. 4.1) and its commercial availability. The isoflavone base structure is
composed of two benzene rings linked by a heterocyclic ring, where the different
isoflavones have –OH, -OCH3, –phenyl, and sugar moieties on different locations
of the core structure. The structure of 7-hydroxy-4-chromone is that same base
molecule, without the phenyl group on 3 position. It was expected that this
compound would have low potential of degradation during extraction and/or
94
separation procedures, little to no fragmentation in the ionization process
(providing greater reproducibility), and similar response characteristics to the
target isoflavones. The compound was well resolved from the five isoflavones in
the chromatography method and responded well for both UV absorbance (254
nm) and EIMS detection methods, supporting its choice for the IS compound.
4.3.2 Development of Chromatographic Separation
Initial trials for the separation of the five isoflavone suite were completed
using UV absorbance detection at 254 nm. After a survey of the literature, it was
clear the RP separations using aqueous/organic gradients. Here, an RP-C18
column using a linear gradient of 20-60 %B over 40 min at a flow rate of 1 mL
min-1 (mobile phase A: aqueous 0.1 %TFA, mobile phase B: acetonitrile) was
initially employed. This did not provide the appropriate resolution between the
compounds in the calibration solution and had undesirable peak shapes.
Different trials were completed using different organic mobile phases (ACN and
MeOH) and different gradient rates, as well as a RP-phenyl column, to determine
the optimal separation. The LC method ultimately chosen used RP-C18 column
and a 30-90 %B linear gradient over 40 min at a flow rate of 1 mL min-1. Mobile
phase A was milliQwater and mobile phase B was MeOH, each containing 0.1%
TFA. Figure 4.3a presents the reference chromatogram for the standard mixture
as measured by UV absorbance detection at 254 nm.

95
4.3.3 MS Characterization
The mass spectral characteristics of the isoflavone compounds were
assessed by direct injections of neat, single compound solutions. The solutions
were prepared in solvent compositions similar to the organic percentage at which
they elute off the C18 column. Each sample was introduced into the EI source (50
µL injection) with a solvent flow of 50:50 MeOH:milliQwater (each with 0.1% TFA)
at a flow rate of 1 mL min-1 and nebulizer temperature ~85 °C. Mass spectra
were obtained for each compound, including the IS, and for each analyte (except
puerarin), the molecular ion is observed with minimum, and predictable,
fragmentation. Puerarin is the largest isoflavone in the suite, and contains a
glycoside moiety on the 9 position. The sugar group makes the whole compound
more susceptible to fragmentation under the EI conditions, and a more
complicated, but still predictable, fragmentation pattern observed. For this
reason, ions chosen for SIM are m/z 162 (7-hydroxy-4-chromone), m/z 254
(daidzein), m/z 270 (genistein), m/z 268 (formononetin), m/z 284 (biochanin A),
and m/z 267, 416 (puerarin) . These traces are used for peak area
determinations.
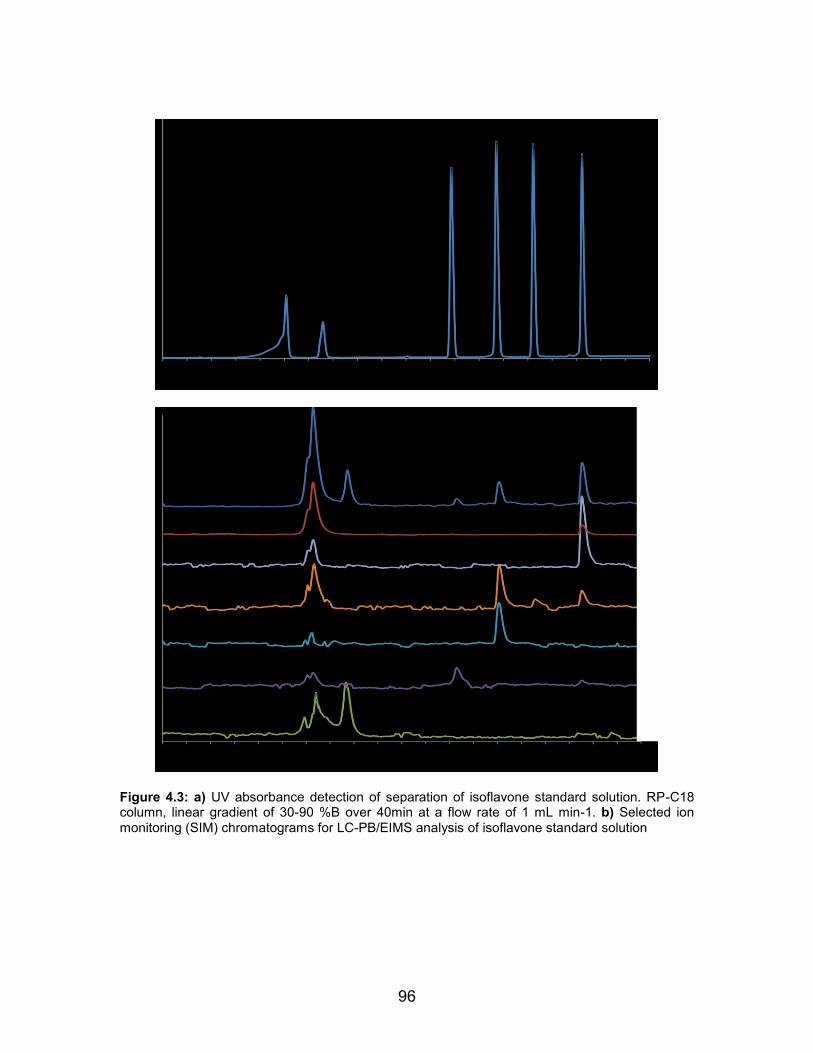
96
Figure 4.3: a) UV absorbance detection of separation of isoflavone standard solution. RP-C18 column, linear gradient of 30-90 %B over 40min at a flow rate of 1 mL min-1. b) Selected ion monitoring (SIM) chromatograms for LC-PB/EIMS analysis of isoflavone standard solution
(a)
(b)

97
Figure 4.4: Extracted mass spectra of the analysis of isoflavone standard solution. a) puerarin, b) daidzein, c) genistein, d) formononetin, e) biochanin A, and f) 7-hydroxy-4-chromone (IS)
As a final test of the approach, a solution containing all of the isoflavones
and the IS was analyzed via LC-PB/EIMS to compare and validate the separation
and mass spectrometric characteristics. Chromatographic conditions are
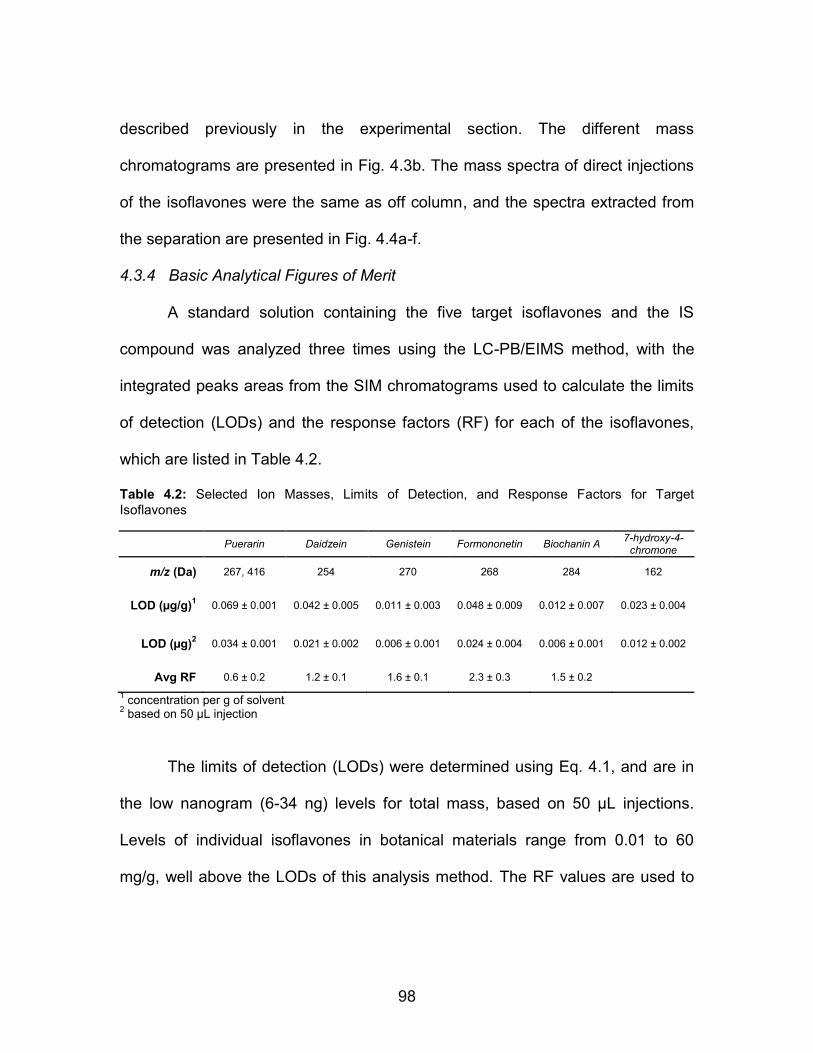
98
described previously in the experimental section. The different mass
chromatograms are presented in Fig. 4.3b. The mass spectra of direct injections
of the isoflavones were the same as off column, and the spectra extracted from
the separation are presented in Fig. 4.4a-f.
4.3.4 Basic Analytical Figures of Merit
A standard solution containing the five target isoflavones and the IS
compound was analyzed three times using the LC-PB/EIMS method, with the
integrated peaks areas from the SIM chromatograms used to calculate the limits
of detection (LODs) and the response factors (RF) for each of the isoflavones,
which are listed in Table 4.2.
Table 4.2: Selected Ion Masses, Limits of Detection, and Response Factors for Target
Isoflavones
Puerarin Daidzein Genistein Formononetin Biochanin A
7-hydroxy-4-chromone
m/z (Da) 267, 416 254 270 268 284 162
LOD (µg/g)1 0.069 ± 0.001 0.042 ± 0.005 0.011 ± 0.003 0.048 ± 0.009 0.012 ± 0.007 0.023 ± 0.004
LOD (µg)2 0.034 ± 0.001 0.021 ± 0.002 0.006 ± 0.001 0.024 ± 0.004 0.006 ± 0.001 0.012 ± 0.002
Avg RF 0.6 ± 0.2 1.2 ± 0.1 1.6 ± 0.1 2.3 ± 0.3 1.5 ± 0.2
1 concentration per g of solvent
2 based on 50 µL injection
The limits of detection (LODs) were determined using Eq. 4.1, and are in
the low nanogram (6-34 ng) levels for total mass, based on 50 µL injections.
Levels of individual isoflavones in botanical materials range from 0.01 to 60
mg/g, well above the LODs of this analysis method. The RF values are used to

99
calculate the isoflavone concentrations in the SRM extracts based on the relative
response of the IS compound, using Eq. 4.2 and 4.3.
LOD = 3*RSDB*0.01*[C] [Eq. 4.1] (S/B)
RF = Area (X) * [IS] [Eq. 4.2] Area (IS) [X]
[X] = Area (X) * (Mass IS*[IS])/RFx) . [Eq. 4.3] Area (IS) Mass extracted material
4.3.5 Isoflavone Content in Proposed NIST Standard Reference Materials
As mentioned previously, NIST creates standard reference materials
(SRMs) for the use in developing accurate analytical methods, calibrating
measurements, and to ensure adequacy and integrity of measurement quality
assurance programs. They are not used to validate what is in a certain product,
but to validate the analytical method and results obtained. In order for a material
to be sold as an SRM, it must be analyzed by at least two completely orthogonal
methods that reach the same quantitative results within accepted limits.
Orthogonal methods are necessary to reduce/eliminate measurement biases that
may be associated with a specific process or method. While the isoflavone
content in the soy, red clover and kudzu materials analyzed here have not yet
been certified, the certification processes are currently underway. The materials
analyzed here were provided by NIST as part of a grant-funded project for the
development and validation of new analytical instrumentation.
100
Currently, there are four soy related (SRM 3234 Soy Flour, SRM 3236 Soy
Protein Isolate, SRM 3237 Soy Protein Concentrate, and SRM 3238 Soy-
Containing Solid Oral Dosage Form), three red clover related (SRM 3271
Trifolium pratense (Red Clover) Flowers, SRM 3272 Trifolium pratense (Red
Clover) Extract, and SRM 3273 Red Clover-Containing Solid Dosage Form), and
three kudzu related SRMs (SRM 3267 Pueraria Montana var. lobata (Kudzu)
Rhizome, SRM 3268 Pueraria Montana var. lobata (Kudzu) Extract, and SRM
3269 Kudzu-Containing Solid Oral Dosage Form). Each of these matrix-matched
materials underwent the aforementioned extraction procedure and separation
with sequential UV-VIS and EIMS detection. The target isoflavone calibration
suite (puerarin, daidzein, genistein, formononetin and biochanin A) was chosen
to be representative of all of the botanical products analyzed here. Soy is
reported to contain high levels of daidzin, genistin, daidzein and genistein.31-33
Red clover plants are reported to have high levels of formononetin and biochanin
A,7, 9, 34, 35 while kudzu is known for containing daidzein and puerarin.9, 23, 36, 37
Using the IS approach, all of the samples were quantified for their
isoflavone content in mg/gram of SRM, presented in Table 4.3. Values are
comparable to that found in the literature for these types of botanical materials.
Measurement precision (standard deviation) for each of the isoflavones was
determined (n = 3), also presented in Table 4.3. The average relative standard
deviations (%RSD) are 9.38 %RSD for puerarin, 9.63 %RSD for daidzein, 8.78
%RSD for genistein, 9.68 %RSD for formononetin, and 6.07 %RSD for biochanin

101
A. This may at first seem to be less than desirable for precision however, RSDs
around 10% are typically acceptable in the dietary supplement community. It is
also worthy to note that these measurements were all completed without the use
of an autosampler, which can greatly improve the precision of analytical
measurements.
Table 4.3: Concentrations of Isoflavones Extracted from Standard Reference Materials
SRM Concentration (mg/g)
Puerarin Daidzein Genistein Formononetin Biochanin A
so
y
3234 ND 0.012 ± 0.001 0.014 ± 0.002 0.006 ± 0.001 0.010 ± 0.001
3236 ND 0.099 ± 0.008 0.170 ± 0.009 0.010 ± 0.001 0.009 ± 0.001
3237 ND 0.007 ± 0.001 0.001 ± 0.001 ND ND
3238 ND 0.229 ± 0.008 0.100 ± 0.008 0.005 ± 0.001 0.010 ± 0.001
red
clo
ve
r
3271 ND 0.072 ± 0.010 0.059 ± 0.003 0.191 ± 0.016 0.120 ± 0.011
3272 ND 0.447 ± 0.049 0.156 ± 0.013 5.010 ± 0.093 0.942 ± 0.021
3273 ND 0.047 ± 0.005 0.060 ± 0.006 0.570 ± 0.059 0.189 ± 0.023
ku
dzu 3267 3.882 ± 0.443 3.521 ± 0.597 0.034 ± 0.004 0.057 ± 0.005 0.010 ± 0.003
3268 14.205 ± 1.026 6.469 ± 0.042 0.134 ± 0.015 0.097± 0.016 0.018 ± 0.004
3269 8.049 ± 0.766 3.077 ± 0.345 0.182 ± 0.014 0.011 ± 0.001 0.014 ± 0.003
* ND – Not detected
Figure 4.5a shows the extracted SIM chromatograms of one of soy
extracts (SRM 3238). The retention time assignments from the calibration
solution match with the SIM traces, showing the presence of daidzein, genistein,
formononetin and biochanin A. There are two significant peaks unidentified (tr ≈
13 and 17 min) with the calibration solutions and retention time matching. Using
the benefits of EIMS characterization, the unknown peaks are easily determined
based on the extracted mass spectra. The fragmentation pattern of each
unknown allowed for structural information to be obtained and the compounds
were identified as daidzin and genistin, which, as mentioned previously, soy is

102
known to contain. Similar results were observed for the other SRM extracts, with
Fig. 4.5b and 4.5c showing the MS SIM chromatograms for one of the red clover
extracts (SRM 3272) and one of the kudzu extracts (SRM 3269). Each extract
has different isoflavone profile, and using the EI-MS technique, all isoflavones
present have the potential to be identified and quantified without the use of
complicated calibration standards.
Figure 4.5: Extracted SIM chromatograms for the LC-PB/EIMS analysis of SRM 3238 extract. Peaks labeled are the target isoflavones and unknown peaks were identified by structural information obtained. tr 13 = daidzin and tr 17 = genistin

103
Figure 4.6: Extracted SIM chromatograms for the LC-PB/EIMS analysis of SRM 3272 extract.
Peaks labeled are the target isoflavones.
Figure 4.7: Extracted SIM chromatograms for the LC-PB/EIMS analysis of SRM 3269 extract.
Peaks labeled are the target isoflavones.
104
4.4 Conclusions
The development of analytical techniques that provide precise and
accurate information is an important endeavor in the realm of dietary
supplements. An extraction method followed by LC-PB/EIMS analysis has been
developed for the determination of isoflavone content in botanical products. This
method does not require hydrolysis or extensive sample pretreatment steps and
allows for simultaneous absorbance and MS detection. An internal standard
approached using 7-hydroxy-4-chromone was used for quantitation yielding
RSDs >9% for all the target isoflavones.
The extraction and analysis procedures described here can be applied to
a wide range of isoflavone containing products and provide accurate and
reproducible results. The precision has been shown to be acceptable, and future
work will be focused on determining optimal extraction and sample preparation
steps, minimizing analyte degradation, analyte loss, and analysis time. It will also
be important to focus on a suite of isoflavones specific to one type of botanical
product, as the separation method can be tailored for different suites of
isoflavone compounds. The five isoflavone suite used here was chosen to
encompass a small range of compounds found in soy, red clover, and kudzu. For
example, a solution of daidzin, glycitin, genistin, daidzein, and genistein will be
used to characterize the isoflavone profile of soy products and used to further
validate the LC-PB/EIMS method by conducting a direct method comparison with
techniques used for certification at NIST.
105
I would like to recognize the Analytical Chemistry Division of the National
Institute of Standards and Technology (NIST) for the financial support in this
project (US Department of Commerce, award number 60NANB12D110). I would
like to specifically thank Drs. Melissa Phillips, Kate Rimmer, and Lane Sander for
their guidance, help, and support while onsite at the NIST campus in
Gaithersburg, MD.
References
1. C. E. Piersen, N. L. Booth, Y. Sun, W. Liang, J. E. Burdette, R. B. van Breemen, S. E. Geller, C. Gu, S. Banuvar, L. P. Shulman, J. L. Bolton and N. R. Farnsworth, Current Medicinal Chemistry, 2004, 11, 1361-1374.
2. P. P. Fu, H. M. Chiang, Q. S. Xia, T. Chen, B. H. Chen, J. J. Yin, K. C.
Wen, G. Lin and H. T. Yu, Journal of Environmental Science and Health Part C-Environmental Carcinogenesis & Ecotoxicology Reviews, 2009, 27, 91-119.
3. R. J. Blendon, C. M. DesRoches, J. M. Benson, M. Brodie and D. E.
Altman, Archives of Internal Medicine, 2001, 161, 805-810. 4. G. Williamson and B. Holst, British Journal of Nutrition, 2008, 99, S55-
S58. 5. J. I. Rader, P. Delmonte and M. W. Trucksess, Analytical and
Bioanalytical Chemistry, 2007, 389, 27-35. 6. R. X. Liu, M. Ye, H. Z. Guo, K. S. Bi and D. A. Guo, Rapid
Communications in Mass Spectrometry, 2005, 19, 1557-1565. 7. B. Klejdus, D. Vitamvasova-Sterbova and V. Kuban, Analytica Chimica
Acta, 2001, 450, 81-97. 8. M. A. Rostagno, A. Villares, E. Guillamon, A. Garcia-Lafuente and J. A.
Martinez, Journal of Chromatography A, 2009, 1216, 2-29.

106
9. P. Delmonte, J. Perry and J. I. Rader, Journal of Chromatography A, 2006, 1107, 59-69.
10. B. Klejdus, D. Vitamvasova and V. Kuban, Journal of Chromatography A,
1999, 839, 261-263. 11. Y. S. Choi and K. H. Row, Journal of Liquid Chromatography & Related
Technologies, 2000, 23, 1671-1679. 12. A. P. Griffith and M. W. Collison, Journal of Chromatography A, 2001, 913,
397-413. 13. F. C. Stintzing, M. Hoffmann and R. Carle, Molecular Nutrition & Food
Research, 2006, 50, 373-377. 14. M. V. B. Krishna, J. Castro, T. M. Brewer and R. K. Marcus, Journal of
Analytical Atomic Spectrometry, 2007, 22, 283-291. 15. G. O. Torres, J. Castro, B. M. V. Krishna and R. K. Marcus, Abstracts of
Papers of the American Chemical Society, 2008, 235, 249-CHED. 16. M. V. B. Krishna, J. Castro, T. M. Brewer and R. K. Marcus, Journal of
Analytical Atomic Spectrometry, 2009, 24, 199-208. 17. J. Castro, M. V. B. Krishna, J. R. Choiniere and R. K. Marcus, Analytical
and Bioanalytical Chemistry, 2010, 397, 1259-1271. 18. J. Castro, T. Pregibon, K. Chumanov and R. K. Marcus, Talanta, 2010, 82,
1687-1695. 19. R. K. Marcus, M. A. Dempster, T. E. Gibeau and E. M. Reynolds,
Analytical Chemistry, 1999, 71, 3061-3069. 20. R. K. Marcus and W. C. Davis, Analytical Chemistry, 2001, 73, 2903-2910. 21. T. M. Brewer, J. Castro and R. K. Marcus, Spectrochimica Acta Part B-
Atomic Spectroscopy, 2006, 61, 134-149. 22. C. D. Quarles and R. K. Marcus, Spectrochimica Acta Part B-Atomic
Spectroscopy, 2009, 64, 1185-1193. 23. P. Delmonte and J. I. Rader, Journal of Aoac International, 2006, 89,
1138-1146.

107
24. D. L. Luthria and S. S. Natarajan, Planta Medica, 2009, 75, 704-710. 25. K. D. R. Setchell, N. M. Brown, P. Desai, L. Zimmer-Nechemias, B. E.
Wolfe, W. T. Brashear, A. S. Kirschner, A. Cassidy and J. E. Heubi, Journal of Nutrition, 2001, 131, 1362S-1375S.
26. T. T. Song, K. Barua, G. Buseman and P. A. Murphy, American Journal of
Clinical Nutrition, 1998, 68, 1474S-1479S. 27. S. M. Cui, C. S. Zhao, X. Tang, D. W. Chen and Z. G. He, Biomedical
Chromatography, 2005, 19, 375-378. 28. Q. L. Wu, M. F. Wang and J. E. Simon, Journal of Chromatography A,
2003, 1016, 195-209. 29. K. Wahala, T. Hase and H. Adlercreutz, Proceedings of the Society for
Experimental Biology and Medicine, 1995, 208, 27-32. 30. H. McNab, E. S. B. Ferreira, A. N. Hulme and A. Quye, International
Journal of Mass Spectrometry, 2009, 284, 57-65. 31. N. Tsunoda, S. Pomeroy and P. Nestel, Journal of Nutrition, 2002, 132,
2199-2201. 32. B. Klejdus, R. Mikelova, J. Petrlova, D. Potesil, V. Adam, M. Stiborova, P.
Hodek, J. Vacek, R. Kizek and V. Kuban, Journal of Chromatography A, 2005, 1084, 71-79.
33. Q. L. Wu, M. F. Wang, W. J. Sciarappa and J. E. Simon, Journal of
Agricultural and Food Chemistry, 2004, 52, 2763-2769. 34. X. G. He, L. Z. Lin and L. Z. Lian, Journal of Chromatography A, 1996,
755, 127-132. 35. L. U. Thompson, B. A. Boucher, M. Cotterchio, N. Kreiger and Z. Liu,
Nutrition and Cancer-an International Journal, 2007, 59, 176-184. 36. A. Reppert, G. G. Yousef, R. B. Rogers and M. A. Lila, Journal of
Agricultural and Food Chemistry, 2008, 56, 7860-7865. 37. S. Barnes, J. Prasain, T. D'Alessandro, A. Arabshahi, N. Botting, M. A.
Lila, G. Jackson, E. M. Janle and C. M. Weaver, Food & Function, 2011, 2, 235-244.

108
CHAPTER FIVE
DEVELOPMENT OF A LC-PB/EIMS METHOD OF ANALYSIS FOR THE
DETERMINATION OF SOY ISOFLAVONES
5.1 Introduction
The public is increasingly concerned with finding more natural ways to
improve health and well-being, and functional foods have become an important
part of the nutritional science field. Soybeans and soy-based products are among
the most popular and most studied foods for their potential health benefits.1-3
Epidemiological studies have found correlations between soy-rich diets and
lowered disease risks, especially those diseases that are age- and hormone-
dependent. Of the active compounds contained in soy, isoflavones are of
particular interest. Isoflavones are a sub-class of polyphenols that have been
shown to have estrogenic activity.1 Health claims for soy protein, such as “25
grams of soy protein a day, as part of a diet low in saturated fat and cholesterol,
may reduce the risk of heart disease,” are permitted by the Food and Drug
Administration (FDA) and isoflavone supplements extracted from soy are
commercially available.2 Studies on the characteristics of isoflavones are
abundant, and have worked towards determining and understanding the
anticancer, estrogenic, antiestrogenic and hormone altering effects of human
consumption. However, the results of many of the current studies and clinical

109
trials have been inconsistent, and some have even pointed toward potential
health risks of increased soy intake.4-6 A better understanding of the absorption,
metabolism, and bioavailability of soy isoflavones is required, but to do so
reliable, precise, accurate and validated analytical techniques that are applicable
to a wide variety of sample matrices (e.g. supplements and biological fluids) are
essential.7-9
An important part of assuring accurate quantitation is the validation of
results obtained from a specific technique. Currently, there is considerable
variability among the analytical methods used across different research
laboratories. 7 Appropriate reference materials, calibration standards, and
validated analytical methods are required in order to compare results from
multiple laboratories and effectively determine potential nutritional status trends.
In general, a reference material is a well-characterized material that is used to
asses measurements. In the case of botanical products and dietary supplements
they can be purified constituents as well as native or synthetic solids and extracts
characterized for the chemical constituents of interest. According to the World
Health Organization (WHO), "the general use of a reference substance should be
considered as an integral part of a compliance-oriented monograph or test
procedure used to demonstrate the identity, purity, and content of pharmaceutical
substances and preparations".10 Established reference materials for botanicals
are in high demand for use by product manufacturers for the improvement of
quality control, by researchers to validate the accuracy of methods of analysis,
110
and by government institutions to monitor products and enforce regulations. The
development of such reference materials is a demanding task. The National
Institute of Standards and Technology (NIST) has recently developed a suite of
soy-based Standard Reference Materials (SRMs) that will be certified for their
isoflavone content. An essential aspect to the certification process is the use of
multiple, orthogonal analysis methods.
Analysis of botanical materials is difficult as there are extensive sample
pretreatment steps and challenges in extraction efficiency, sample conservation,
and storage prior to analysis.1 Added to these are tedious chromatographic
separation and detection requirements.1 Since the chemical structures and
properties of isoflavones are very similar, the identification and distinction of
these compounds in plant matrices can be very complicated.11 There are
currently major weaknesses in the overall scheme of human isoflavone research
stemming from the lack of available reference materials and standardized
methods of analysis, which cause the inability to consistently obtain and compare
accurate, reliable, and validated results.12 Thus, the continued development and
improvement for both of these concerns is a very active area of research.
Sample pretreatment is often the limiting aspect of effective analyses.
These processes can be very time consuming and may require multiple steps.
Extreme care must be taken as this is where the majority of sample degradation,
contamination, and loss can occur if not completed properly.1 Especially in the
case of botanical materials, solvent extraction is a crucial step for proper

111
characterization because the active constituents are part of a cellulosic matrix.
An appropriate extraction procedure should remove all analytes of interest from
the sample matrix in the smallest volume of solvent compatible with subsequent
analysis techniques, and be completed in a timely fashion.13 The number of co-
extracted compounds should be small, and these compounds should not
interfere with the determination of the target analytes. It is also important to keep
the original chemical profile intact, meaning that all the target compounds are
detected in the same chemical/structural form present in the original botanical
material. Some isoflavones have been shown to be sensitive to UV
photodegradation, high temperatures, and pH extremes, which need to be taken
into account when choosing an extraction method, paired with adequate storage
conditions. Many different methods for extraction of isoflavones have been
reported, including Soxhlet extraction, soaking, mixing, shaking, sonication, and
maceration with the use of many different solvents.1-3, 12, 14, 15 More recently,
extraction procedures such as pressurized liquid extraction (PLE), microwave
assisted extraction (MAE) and supercritical fluid extraction (SFE) have been
reported.1, 14 The most common solvents for the extraction of isoflavones are
aqueous solutions containing 50% to 90 %methanol, ethanol, acetonitrile, or
acetone. Additives, such as acids, may also be used. Extraction times vary from
30 min to 24 h, and temperatures used range from 4 °C to 80 °C. Most of these
methods do not achieve full extraction of target analytes as standalone
procedures, and so the combination of several methods is common. This often

112
leaves the analyst with two choices; 1) a laborious procedure with quantitative
recovery and high selectivity or 2) a less quantitative, but reproducible, with an
easier, automatable technique.13 Overall, these methods are quite labor
intensive, time consuming, and costly. It is desirable to perform a complete
extraction using a simple method and within a reasonable time period, and a
review of the literature shows that many laboratories employ some combination
of sonication and/or agitation with centrifugation, filtration, and/or dilution steps
due to ease and availability of the procedures.2, 14, 16-19 It is desirable to perform a
complete extraction using a simple method and within a reasonable time period.
Other treatment steps, such as pre-concentration, hydrolysis, and/or filtration,
may also be necessary depending on the composition of the resulting extract and
the stability of extracted compounds.1
The final process, essential for achieving accurate quantitation, is the
separation and analysis of target compounds. Isoflavone analyses generally
employ a reversed-phase high performance liquid chromatography (RP-HPLC)
separation mode which separates based on the different hydrophobic interaction
between the analytes and the stationary phase, where the less hydrophobic
compounds will elute first and the most hydrophobic will elute last. The most
common columns are C18, using aqueous and methanol or acetonitrile
gradients. All of the compounds must elute in a reasonable time frame (<60 min,
generally) and all potential chemical forms need to be fully resolved (i.e., acetyl,
malonyl, and glycoside). The focus of a particular study will dictate the
113
pretreatment steps and the level of selectivity a method must have, meaning
some clinical studies may require the identification all acetyl and malonyl
conjugates present in a samples while other many only need to identify the base
glucoside and aglycone compounds.
Optimization of the chromatography method can be one of the most
difficult and tedious steps of the total analysis, as column chemistry (sorbent
material), solvents, and gradient profile are all critical aspects in achieving a
suitable separation compatible with subsequent detection techniques. The most
common detection modes for the characterization of isoflavones are liquid
chromatography with ultraviolet absorbance detection (LC-UV) and with mass
spectrometric detection (LC-MS).16, 20, 21 UV absorbance detection is highly
efficient and reproducible, and is widely available at much lower costs than many
other detection techniques. All isoflavones absorb UV light similarly which makes
single or dual wavelength absorbance monitoring possible, but identification is
extremely limited.19 The major disadvantages of UV absorbance detection stem
from the lack of specificity and the requirements of, especially in the case of
botanical material analysis, the use of complex and expensive calibration
standards for retention time matching. MS detection provides better selectivity,
and often better sensitivity, and structural information can be generated for the
eluting compounds.19, 22 Electrospray ionization (ESI) is one of the most
commonly used ionization methods for the analysis of flavonoids; others are
atmospheric pressure chemical ionization (APCI) and thermospray, due mass
114
specificity, sensitivity, and compatibility to LC techniques.22 Even so, ESI has a
low tolerance for salts and heterogeneous mixtures and the multiple charge
states can be confused in mixtures, though the use of LC technique alleviates
most of these issues.
Electron ionization (EI) is a the most common ionization technique for gas
chromatography (GC) yielding consistent compound fragmentation patterns that
allow for easy interpretation and use of reference libraries. An electron beam (70
eV) interacts with analytes in the vapor phase to produce both molecular ions
and fragment ions, the relative abundance which can be used for identification.
While the molecular ions may sometimes be absent due to high degrees of
fragmentation, the use of selected ion monitoring (SIM) of characteristic ions can
yield simplified chromatograms for target species. Problematically, many organic
compounds (such as isoflavones) are not directly amendable to GC sample
introduction due to pre-derivatization requirements and insensitivity to thermally
labile compounds. Ideally, EIMS could be implemented following an HPLC
separation of isoflavones, but the high vacuum environment required does not
tolerate the introduction of liquid samples. Willoughby and Browner introduced
the particle beam (PB) interface to couple HPLC to EI sources. The function of
the PB interface is to transform the liquid eluent from a liquid chromatograph into
a fine aerosol which is further desolvated via a momentum separator, leaving a
‘beam’ of dry analyte particles which are delivered into the EI source volume.
Once in the ion volume the analyte particles are vaporized and ionized for
115
detection. This laboratory has developed and utilized LC-PB/EIMS techniques for
the detection and characterization of active components in botanical products.23-
27
Described here is the development of a method of analysis for the
determination of isoflavone content soy flour using LC-PB/EIMS. A suite of five
isoflavones will be analyzed and quantitative performed using an IS approach
with 7-hydroxy-4-chromone as the IS compound. Isoflavones are extracted by a
3 h inversion mixing process with an 80 %methanol solvent using a homemade
rotary mixer, without a hydrolysis step, prior to subsequent analysis. A direct
comparison to the methodology employed in the NIST laboratories will be made,
as the extraction methods, separation chemistries, and detection methods are all
distinct. Samples prepared at the NIST campus, Gaithersburg, MD, are extracted
using sonication in 80 %methanol followed by a base hydrolysis step. The
measurements made in both NIST and present laboratories, will be used to
validate the LC-PB/EIMS as an independent method for the certification of
isoflavone containing SRMs.
5.2 Experimental
5.2.1 Reagents and Solutions
MilliQwater was derived from a NANOpure Diamond water system (18.2
MΩ cm-1, Barnstead International, Dubuque, IA). Individual isoflavone
compounds (daidzin, glycitin, genistin, daidzein, and genistein) were obtained

116
from INDOFINE Chemical Company, Inc. (Hillsborough, NJ). ACS grade
methanol (MeOH), trifluoroacetic acid (TFA), and the internal standard compound
(7-hydroxy-4-chromone) were purchased from Sigma-Aldrich (St. Louis, MO).
5.2.2 Standard Solutions and SRM Sample Preparation
Stock solutions of each isoflavone were prepared by weighing appropriate
amounts of crystalline (exact mass known) and diluting with 80:20
MeOH:milliQwater (v:v). The stock solutions were gravimetrically mixed to
prepare the calibration solutions. A separate solution of the internal standard (IS)
was prepared in a similar manner, and added to each of the calibration solutions
as well as the SRM 3234 samples prior to extraction. All solutions described here
were prepared and stored in 15 mL centrifuge tubes at 4 °C, away from light. For
the extraction of isoflavones from SRM 3234, approximately 0.1 g of reference
material was accurately weighed into a 15 mL polyethylene centrifuge tube.
Approximately 200 µL (exact mass known) of internal standard solution and 5 mL
of 80:20 methanol:water (v:v) were added to the sample. The sample was
attached to a homemade rotary mixer28 and allowed to mix for 3 h, and then
centrifuged (VWR, Clinical 50) at 4000 RPMS for 30 min. The supernatant was
transferred to a clean 15 mL polyethylene centrifuge tube and stored at 4 °C until
analysis. The extract was appropriately diluted with milliQwater and filtered using
a 0.45 µm PTFE syringe filter to remove any suspended solids for final analysis.

117
5.2.3 Liquid Chromatographic Separation
The LC separations were carried out using a Waters (Milford, MA, USA)
Model Series 1500 liquid chromatography pump for the sample delivery and an
Alltech (Grace; Columbia, MD) C18 reversed-phase (RP) column (250 x 4.6 mm
i.d., 5 µm particles).The mobile phases were (A) milliQwater and (B) methanol,
each containing 0.1 %TFA. The gradient profile was 30-90 %B, completed over
40 min at 1.1 mL min-1 with a 50 µL injection loop. The separation was monitored
at 254 nm via a Waters 2487 Dual λ Absorbance Detector for optimization steps,
and then directly interfaced to the MS detection system via the particle beam
interface. In work described here the UV absorbance detector remained in-line
and run in series with the MS detection.
5.2.4 Particle Beam Electron Ionization Mass Spectrometer System
The PB-MS system used was an Extrel Benchmark Thermabeam LC/MS
quadrupole mass spectrometer with an electron ionization source controlled with
the Extrel Merlin Automation Data System software (Extrel CMS; Pittsburg, PA).
A tungsten filament EI source set to 70 eV (standard EI voltage) was used,
allowing for predictable fragmentation and library comparisons, when available.
The system scanned masses from 150-700 Da at 1.0 s/scan for collection of total
ion chromatograms (TICs), and then selected ion monitoring (SIM)
chromatograms and corresponding mass spectra were extracted. All data
acquired was exported and processed by a combination of the Merlin software,
Microsoft Excel, and PowerPoint.
118
The Thermabeam interface consists of a thermoconcentric nebulizer,
desolvation chamber, and two-stage momentum separator. A fine aerosol mist,
produced by the nebulizer (75°C to 85 °C), enters the heated steel chamber (147
°C) and begins to desolvate, or dry, the solvent droplets containing the analyte
compounds. The vapors then passed through a series of two 1 mm orifices, each
with differential pressure decreases, causing the lower-mass solvent vapors to
be dispersed and pumped away while the heavier-mass analyte particles pass
through the next orifice and into the source block, heated to 275 °C. The ‘beam’
of dry analyte particles are then vaporized and ionized for MS detection.
Operational parameters for the system were previously optimized in this
laboratory.
5.2.5 Soy Isoflavone Quantitation
The target isoflavones present in the sample are quantified using an
internal standard (IS) approach with 7-hydroxy-4-chromone as the IS compound.
The calibration solutions are analyzed per the aforementioned separation
procedure and used to determine response factors for the quantitation of each
target isoflavone in the SRM material.
5.2.6 NIST Method for Isoflavone Characterization
The isoflavones present in the sample were quantified using an IS
approach, with sissotrin as the IS compound. Sissotrin is an isoflavone not
contained in soy materials, and so is a good candidate as an IS for compounds
of interest. Five stock solutions of each target isoflavone were prepared and

119
gravimetrically mixed in appropriate ratios for analysis of the expected
concentrations in SRM 3234. A single solution of sissotrin was prepared and
added to each mixed calibration solution as well as to each sample. These five
calibration solutions were analyzed and used to determine response factors, in
turn used to calculate the concentration of each isoflavone in the SRM material.
Approximately 0.1 g of SRM solid was accurately weighed into a 15 mL
polyethylene centrifuge tube. Then about 1 mL (exact mass known) of IS solution
and about 4 mL of 80:20 methanol:water (v:v) was added to the sample. The
sample was mixed well, sonicated for 15 min, and centrifuged for 10 min. About 1
mL of the supernatant was transferred to a clean 15 mL polyethylene centrifuge
tube. A hydrolysis step was then employed by the addition of 75 µL of 2 mol/L
sodium hydroxide, sonication for 15 min, and addition of 25 µL of glacial acetic
acid to neutralize. A 100 µL aliquot of the sample was transferred to an
autosampler vial and combined with about 1.4 mL of 80:20 methanol:water (v:v).
The separation was completed on a Dionex Ultimate 3000 LC system
consisting of a degasser, quaternary pumps, autosampler, column oven, and
photodiode array detector, and using an Ascentis Express RP-Amide column
(150 x 4.6 mm i.d., 2.7 µm particles). The column was kept at 35 °C and the
gradient program (Table 1) was completed over 30 minutes at 1.2 mL min-1. The
mobile phases were (A) 5 mmol/L ammonium acetate in water (pH 4.7) and (B)
acetonitrile. A 5.0 µL injection loop was used and the autosampler temperature

120
was maintained at 10 °C. The separation was monitored at 254 nm using the
photodiode array detector.
5.3 Results & Discussion
The most abundant isoflavones present in soy products, and the ones
focused on for the studies presented here, are the aglycones daidzein and
genistein as well as the glycosides daidzin, genistin, and glycitin. Calibration
solutions containing the pure isoflavones are used to determine limits of
detection (LODs) and an IS approach with 7-hydroxy-4-chromone is used to
determine response factors. The optimized method of analysis will then be used
in future work, quantifying the isoflavone content in SRM 3234 Soy Flour for a
direct method comparison to NIST and method validation.
5.3.1 Separation of Soy Isoflavones
The analysis method described allows for the simple acquisition of easily
interpreted EI mass spectra, and for library comparisons when available. This is
an advantage when analyzing complex botanical materials since the
determination of unknown compounds is possible. Figures 5.1a-e depict the
individual EI mass spectra obtained from the separation of a calibration solution
containing daidzin, glycitin, genistin, daidzein, genistein, and 7-hydroxy-4-
chromone, along with their respective chemical structures. It is important to note
that the molecular ion (M+) is present for daidzein, genistein, and 7-hydroxy-4-
chromone, but not for daidzin, glycitin, and genistin. These compounds are not

121
fully stable under the EI conditions, with the spectra obtained clearly reflecting
where the fragmentation occurs. The glycoside moiety of daidzin, glycitin and
genistin is removed, leaving the base aglycones of daidzein (254 Da), glycitein
(284), and genistein (269 Da), respectively.
Figure 5.1: LC-PB/EIMS extracted mass spectra and chemical structure of each target isoflavone. a) daidzin, b) glycitin, c) genistin, d) daidzein e) genistein, and f) 7-hydroxy-4-
chromone.
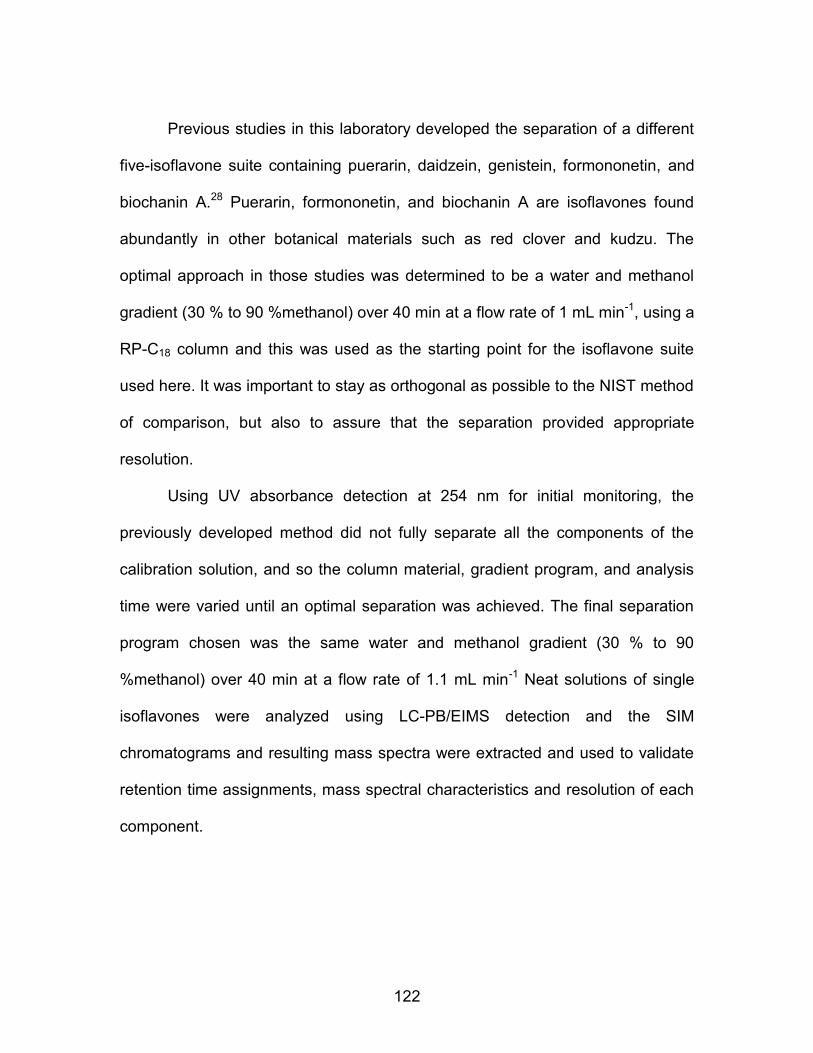
122
Previous studies in this laboratory developed the separation of a different
five-isoflavone suite containing puerarin, daidzein, genistein, formononetin, and
biochanin A.28 Puerarin, formononetin, and biochanin A are isoflavones found
abundantly in other botanical materials such as red clover and kudzu. The
optimal approach in those studies was determined to be a water and methanol
gradient (30 % to 90 %methanol) over 40 min at a flow rate of 1 mL min-1, using a
RP-C18 column and this was used as the starting point for the isoflavone suite
used here. It was important to stay as orthogonal as possible to the NIST method
of comparison, but also to assure that the separation provided appropriate
resolution.
Using UV absorbance detection at 254 nm for initial monitoring, the
previously developed method did not fully separate all the components of the
calibration solution, and so the column material, gradient program, and analysis
time were varied until an optimal separation was achieved. The final separation
program chosen was the same water and methanol gradient (30 % to 90
%methanol) over 40 min at a flow rate of 1.1 mL min-1 Neat solutions of single
isoflavones were analyzed using LC-PB/EIMS detection and the SIM
chromatograms and resulting mass spectra were extracted and used to validate
retention time assignments, mass spectral characteristics and resolution of each
component.

123
5.3.2 Quantitation of Soy Isoflavones
Once a suitable separation had been achieved, the calibration solution,
containing the five isoflavones and the IS compound, was analyzed using the
PB-EIMS detection and the response factors (RF, Eq. 5.1) calculated, presented
in Table 5.1.
RF = AreaX/AreaIS * [IS]/[X] Eq. 5.1
The SIM traces (Fig. 2) at m/z 162 (7-hydroxy-4-chromone), m/z 254 (daidzein
and daidzin), m/z 270 (genistein and genistin), m/z 284 (glycitin), m/z 416
(daidzin), m/z 432 (genistin), and m/z 446 (glycitin) were used for peak area
determinations.
Table 5.1: Selected Ion Masses, Limits of Detection, and Response Factors for Target
Isoflavones
Daidzin Glycitin Genistin Daidzein Genistein
7-hydroxy-4-chromone
SIM m/z (Da) 254, 416 284, 446 270, 432 254 270 162
LOD (ng/g)1 6.63 ±0.04
41.60 ±0.08
191.9 ±0.9
19.75 ±0.09 50.1 ±0.1 8.98 ±0.04
LOD (ng)2
0.331 ±0.002
2.083 ±0.004
9.60 ±0.04
0.987 ±0.005
2.512 ±0.005
0.449 ±0.02
RF 3.71 0.79 1.97 4.07 3.96
1 concentration per g of solvent
2 based on 50 µL injection
124
Figure 5.2: Extracted SIM chromatograms for the separation of a isoflavone standard mixture
5.3.3 Extraction of Soy Isoflavones
As discussed previously, a complete and accurate analysis of the active
components in botanical materials is a non-trivial process and can be affected by
a number of factors, especially during the extraction and pretreatment process.
As might be expected, solvent composition and extraction times can significantly
affect the extraction efficiency and yields of the individual compounds. Hydrolysis
steps are often employed in isoflavone studies to force the removal of the acetyl
and malonyl moieties on the glycosides and aglycones structures, which reduces
chromatographic complexity. Such added sample manipulations can lead to
increased potential of sample contamination and loss. The method of extraction

125
used here is a simple 80:20 MeOH:milliQwater solvent and 3 h rotary mixing at
room temperature. A hydrolysis step is not employed, and the sample is simply
centrifuged and the supernatant transferred for storage. This reduces the sample
handling steps and chemical modifications required, and in turn reducing the
potential of sample degradation, contamination, and loss.
For a complete method comparison, the extracts prepared in this
laboratory will be quantified for their isoflavone content using the LC-PPB/EIMS
method describe previously. The sample prepared at NIST will also be quantified
for their isoflavone content using the LC-PPB/EIMS, employing first the NIST
describe separation method and then the separation method used in this
laboratory. The results of these studies will be compared alongside the results
obtained at NIST. This will allow for the determination of measurement biases, if
any.
5.4 Conclusions
Presented here is a method for the determination of isoflavones found in
soy materials. The method is completely orthogonal from the LC-UV method
used at NIST in the certification of SRM 3234 Soy Flour. The orthogonality of the
two approaches stems from the lack of a hydrolysis step after extraction, the
separation column chemistry, the choice of internal standard, and the detection
method. The LC-PB/EIMS approach provides accurate and precise
measurements for the determination of the target isoflavones as well as providing
126
simultaneous structural information. An additional advantage to the LC-PB/EIMS
method is the ability to simultaneous monitor with UV-VIS absorbance detection
as well.
Future studies will complete the quantitation of target isoflavones in the
SRM 3234 with LC-PB/EIMS detection. The method will also be used for the
determination of isoflavone content in the rest of the suite of soy SRMs as well as
characterizing the isoflavone content in other SRMs suites, including red clover
and kudzu.
The majority of this work is financially supported by the NIST funded grant
(US Department of Commerce, award number 60NANB12D110). I would also
like to thank Dr. Melissa Phillips for all the help, guidance and support throughout
the duration of this project.
References
1. M. A. Rostagno, A. Villares, E. Guillamon, A. Garcia-Lafuente and J. A. Martinez, Journal of Chromatography A, 2009, 1216, 2-29.
2. A. P. Griffith and M. W. Collison, Journal of Chromatography A, 2001, 913,
397-413. 3. B. Klejdus, D. Vitamvasova-Sterbova and V. Kuban, Analytica Chimica
Acta, 2001, 450, 81-97. 4. A. Dewell, P. L. W. Hollenbeck and C. B. Hollenbeck, Journal of Clinical
Endocrinology & Metabolism, 2006, 91, 772-780. 5. L. J. W. Lu and K. E. Anderson, American Journal of Clinical Nutrition,
1998, 68, 1500S-1504S.

127
6. J. I. Rader, P. Delmonte and M. W. Trucksess, Analytical and Bioanalytical Chemistry, 2007, 389, 27-35.
7. V. Thongboonkerd, K. R. McLeish, J. M. Arthur and J. B. Klein, Kidney
International, 2002, 62, 1461-1469. 8. M. A. Kein, R. L. Nahin, M. J. Messina, J. I. Rader, L. U. Thompson, T. M.
Badger, J. T. Dwyer, Y. S. Kim, C. H. Pontzer, P. E. Starke-Reed and C. M. Weaver, Journal of Nutrition, 2010, 140, 1192S-1204S.
9. I. L. F. Nielsen and G. Williamson, Nutrition and Cancer-an International
Journal, 2007, 57, 1-10. 10. Who Chronicle, 1975, 29, 374-374. 11. P. Delmonte and J. I. Rader, Journal of Aoac International, 2006, 89,
1138-1146. 12. M. W. Collison, Journal of Aoac International, 2008, 91, 489-500. 13. J. Vacek, B. Klejdus, L. Lojkova and V. Kuban, Journal of Separation
Science, 2008, 31, 2054-2067. 14. B. Klejdus, R. Mikelova, J. Petrlova, D. Potesil, V. Adam, M. Stiborova, P.
Hodek, J. Vacek, R. Kizek and V. Kuban, Journal of Chromatography A, 2005, 1084, 71-79.
15. S. Sasidharan, Y. Chen, D. Saravanan, K. M. Sundram and L. Y. Latha,
African Journal of Traditional Complementary and Alternative Medicines, 2011, 8, 1-10.
16. Y. S. Choi and K. H. Row, Journal of Liquid Chromatography & Related
Technologies, 2000, 23, 1671-1679. 17. P. Delmonte, J. Perry and J. I. Rader, Journal of Chromatography A,
2006, 1107, 59-69. 18. B. Klejdus, D. Vitamvasova and V. Kuban, Journal of Chromatography A,
1999, 839, 261-263. 19. L. Zhang, L. Xu, S. S. Xiao, Q. F. Liao, Q. Li, J. Liang, X. H. Chen and K.
S. Bi, Journal of Pharmaceutical and Biomedical Analysis, 2007, 44, 1019-1028.
128
20. M. A. Saracino, L. Mercolini, A. Musenga, F. Bugamelli and M. A. Raggi, Journal of Separation Science, 2008, 31, 1851-1859.
21. E. S. Ong, Journal of Chromatography B-Analytical Technologies in the
Biomedical and Life Sciences, 2004, 812, 23-33. 22. J. K. Prasain, C. C. Wang and S. Barnes, Free Radical Biology and
Medicine, 2004, 37, 1324-1350. 23. J. Castro, M. V. M. Krishna and R. K. Marcus, American Laboratory, 2008,
40, 8-+. 24. J. Castro, M. V. B. Krishna, J. R. Choiniere and R. K. Marcus, Analytical
and Bioanalytical Chemistry, 2010, 397, 1259-1271. 25. F. X. Jin and R. K. Marcus, Journal of Analytical Atomic Spectrometry,
2003, 18, 589-595. 26. M. V. B. Krishna, J. Castro, T. M. Brewer and R. K. Marcus, Journal of
Analytical Atomic Spectrometry, 2009, 24, 199-208. 27. J. L. Venzie, J. Castro, M. V. B. Krishna, D. M. Nelson and R. K. Marcus,
Analytical and Bioanalytical Chemistry, 2007, 387, 321-333. 28. C. Q. Burdette and R. K. Marcus, AOAC, Submitted for publication.

129
CHAPTER SIX
SUMMARY
The aim of this dissertation was to emphasize the importance of sample
preparation techniques for the improvement of analytical measurements. Chapter
1 outlined specific needs of sample preparation techniques, highlighting two
major examples: the analysis of proteins in complex matrices, and the
characterization of active components in botanical materials. The first half of the
dissertation focused on the sample cleanup requirements for proteomic
techniques, concentrating on solid phase extraction (SPE) for electrospray
ionization mass spectrometric (ESI-MS) analyses. The second half of the
disseration shifted towards underlining sample preparation challenges in the
analysis of botanical materials, focusing on the extraction, separation, and
detection choices.
Chapter 2 described the utilization of polypropylene (PP) capillary-
channeled polymer (C-CP) fiber for the solid phase extraction (SPE) of proteins
from various matrices. The unique geometry of these fibers combined with the
essentially non-porous aliphatic surface provided an excellent SPE sorbent
material and was employed here in a micropipette tip-based format.
Centrifugation was used as the moving force for solution passage in the
loading/washing steps instead of the previously-employed manual aspiration.
The SPE method performance was evaluated using the target proteins
130
cytochrome c, lysozyme, myoglobin, and glucose oxidase in phosphate buffered
saline (PBS) solutions and UV-VIS absorbance spectrophotometry for protein
quantification. Protein loading capacities were determined to be ~1.5 µg per 5 mg
fiber and the average recoveries were determined for each protein sample;
cytochrome c ~86%, lysozyme ~80%, myoglobin ~86%, and glucose oxidase
~89%. Recoveries from more complex matrices, synthetic urine and synthetic
saliva, were determined to be ~90%. A 10x dilution study for a fixed 1 µg protein
application yielded 94 ± 3.2% recoveries. The C-CP tips provided significantly
higher recoveries for myoglobin in a PBS matrix in comparison to a
commercially-available protein SPE product, with the added advantages of low
cost, high throughput, rapid processing, and reusability.
Chapter 3 continued the use of the C-CP fiber as SPE media by
discussing an in-line micocolumn format for ESI-MS analysis of proteins. The
aliphatic C-CP fibers readily retain hydrophobic species (e.g., proteins) from salt
matrices, releasing them upon switching to typical ESI support solvents (e.g.,
50:50 ACN:H2O). The high permeability of the microcolumn allowed for
operation under simple syringe pump-driven flow, ultimately providing greater
mass spectral clarity and accurate molecular weight determinations for different
protein/buffer combinations. The described work focused on the desalting and
pre-concentration of cytochrome c, lysozyme, myoglobin, and hemoglobin from
PBS and a synthetic urine solution prior to ESI-MS determinations. In every
case, responses for micromolar-level proteins in PBS improved from the situation

131
of not permitting molecular weight determinations to values that were precise to
better than ±10 Da, without internal standards. The protein mass adsorption
limits for a 5 cm desalting microcolumn were determined to be ~ 26 µg for
cytochrome c and ~ 10-13 µg for lysozyme, myoglobin, and hemoglobin.
Analysis of a mixture of proteins (myoglobin/cytochrome c), suggested the
potential of performing small-scale isocratic separations using the C-CP fiber
desalting microcolumn.
Chapter 4 described the characterization of isoflavones in proposed NIST
standard reference materials (SRMs) by a liquid chromatography particle beam
electron ionization mass spectrometry (LC-PB/EIMS) technique. Botanical
materials (soy, red clover, and kudzu) are characterized for the content of a suite
of five isoflavones (puerarin, daidzein, genistein, formononetin, and biochanin A).
The reversed-phase chromatographic separation was first optimized using UV-
VIS detection and then the LC output was introduced to electron ionization mass
spectrometric (EIMS) detection using a particle beam interface. The separation
was carried out using a commercial C18 column and a linear gradient using water
and methanol (both containing 0.1% TFA) as mobile phases A and B. Limits of
detection for the isoflavones were determined to be on the nanogram level.
Quantitation was performed using an internal standard (IS) approach with 7-
hydroxy-4-chromone as the IS compound. The levels of isoflavones in the
botanical products were determined for the proposed SRM suites.

132
Chapter 5 provided a detailed report of the qualitative determination of soy
isoflavones (daidzin, glycitin, genistin, daidzein, and genistein) using a liquid
chromatography-particle beam electron ionization mass spectrometric (LC-
PB/EIMS) technique, and subsequent to the NIST approach for the determination
of soy isoflavones. A 3 h rotary mixing extraction procedure, with 80% MeOH as
the extraction solvent, was employed prior to a reversed-phase separation on a
commercial C18 column with a linear gradient of water and methanol (both
containing 0.1% TFA). Quantitation of the target isoflavones was achieved with
an internal standard (IS) approach using 7-hydroxy-4-chromone as the IS
compound. The absolute limits of detection for the compounds were determined
to be on the nanogram level (0.4-10 ng), based on 50 µL injections onto the LC
column. This method will be directly compared to results obtained by an
approved NIST method, using SRM 3234 Soy Flour as the test sample matrix, for
method validation.
The research presented here has established the base knowledge
necessary to continue work in this laboratory. Future studies will continue to
collaborate with NIST on several exciting areas. Surface modification chemistries
will be used to affect the specificity of the C-CP fibers for both micropipette and
microcolumn formats. It is also envisioned that the adsorption of certain dyes,
such as cibacron blue, will allow for the development of albumin depletion
tips/microcolumns for the analysis of target analytes in fermentation broths. LC-

133
PB/MS techniques, using both glow discharge (GD) and EI ionization, will be
applied to other proposed SRM materials, such as arsenic in human urine.
Overall, I hope this dissertation has shown the important of sample
preparation development and choice for many different areas of analysis. The
primary goals of analytical chemistry are to obtain accurate and precise
measurements, quickly and with lowered costs. Sample preparation is the
starting point to successfully achieve these goals.

134
APPENDIX A
AMBIENT DESORPTION/IONIZATION MASS SPECTROMETRY USING A
LIQUID SAMPLING-ATMOSPHERIC GLOW DISCHARGE (LS-APGD)
IONIZATION SOURCE
A.1 Introduction
The field of ambient desorption/ionization (ADI) sources for mass
spectrometry has been in continuous evolution over the past decade.1-6 Ambient
ionization sources are similar to the common atmospheric pressure ionization
(API) sources, such as electrospray ionization (ESI), atmospheric pressure
chemical ionization (APCI), and atmospheric pressure matrix assisted laser
desorption/ionization (AP-MALDI), but have distinct differences that provide
practical advantages. There are four major features that distinguish the
operational space of ADI sources:1 1) production of ions via a ‘soft’ mechanism
similar to that of ESI, APCI, and AP-MALDI, 2) allows for direct probing of the
sample with minimal pretreatment procedures, 3) easily interfaced to most types
of mass spectrometers, and 4) ionization occurs without enclosures that may limit
sample size/shape/physical state. Thus the major advantages of ADI methods
are the ability to analyze samples in an open ambient environment, in the lab or
field, and without sample pretreatment or processing steps. At present, over 40
variations of ADI sources have been described in the literature,1-5, 7-13 with the

135
approaches generally fitting into categories based on the means of generating
the reactive desorption/ionization agents; either charged droplets or excited-state
gas atoms. In the first case, the means of generating charged droplets is
typically some variant of an ESI source. In the latter, some type of atmospheric
pressure plasma is used to generate metastable atoms.
The first-developed, and most popular, ADI sources are desorption
electrospray ionization (DESI) and direct analysis in real time (DART). DESI is
an ambient ionization source that combines characteristics of ESI and desorption
ionization (DI) methods.14 An electrospray tip is used to emit charged solvent
droplets into the gas phase that are directed (in a gas stream) towards the
sample/surface, setting up the desorption and ionization processes. DESI is a
semi-soft ionization technique with two major ionization mechanisms proposed,
which are dependent on the sample type.1, 3, 5 The first is similar to a mechanism
known as chemical sputtering,2, 5 where sample ions are generated through
proton, electron, or ion transfer from the charged solution droplets on the sample
surface. The now-charged analyte species are ejected from the sample surface
and are transported by gas dynamics to the MS entrance orifice. The second,
and more accepted, mechanism more readily explains the common ESI-like
spectral characteristics.2, 5 In this case, the surface is pre-wet from initial
droplets, forming charged droplets (based on the primary solution composition)
containing analyte on the surface, which are then released through the
momentum of subsequent impacting droplets. These smaller secondary droplets

136
desolvate and create multiply charged ions (as in ESI). Alternative means of
introducing analyte species into the gas phase, with subsequent ionization by
electrospray-generated agents, include piezoelectric, thermal, laser-induced
desorption processes.1 DESI has been shown to successfully ionize a wide
range of analytes including proteins (up to ~65 kDa), carbohydrates, polymers
and small organic molecules.1 The LODs for DESI tend to be an order of
magnitude higher than similar ESI experiments, with low femtomole levels
reported for small molecules.
DART is a plasma-based ambient ionization technique which employs a
corona discharge to create high-lying, metastable atoms of the helium (Hem*)
discharge gas in a heated gas stream.8 The ionization mechanism behind the
various plasma-based sources (in general) is not as clearly defined as other API
sources, but numerous studies has been conducted showing similarities with
atmospheric pressure photon-ionization (APPI) and atmospheric pressure
chemical ionization (APCI).1 With DART the source in particular, a corona-glow
discharge creates metastable helium atoms (He*m) that are entrained in the gas
flow while charged species (ions and electrons) are removed from the stream by
electrostatic potentials placed on screens/plates. The metastable atoms then
interact with the analyte directly (i.e., Penning ionization) or with ambient solvent
or background gases to form various charge transfer agents to affect analyte
ionization via electron capture, dissociative electron capture, anion attachment,
or proton transfer.8 As such, the solvent composition and ambient atmosphere
137
conditions play key roles in the ionization and resulting ion species. Different
from DESI-type methods, the plasma-based methods rely on some form of
thermal volatilization to release analyte species into the gas phase. The thermal
energy can come from the hot gas stream itself, indirect heating of the sample
substrate, or laser vaporization. In addition to the corona discharge employed in
DART, direct current and dielectric barrier glow discharges are employed to
generate the primary reactive species.12, 13, 15, 16 Plasma sources tend to have
advantages over spray techniques stemming from their robust construction and
the near-sole generation of singly-charged ions, regardless of the analyte
chemistries.1, 5, 7, 8, 12, 13 LODs tend to be on the single-nanogram level for most
analytes using plasma-based systems, with analytes molecular weights limited to
~1 kDa due to volatility issues.1, 6
As noted in the reviews referenced above,1, 3, 4, 6 there is a tremendous
variability in terms of designs of ADI-MS sources. Each of the two primary
categories brings its own sets of analytical strengths and weaknesses in terms of
mass sensitivity, potential for quantification, and susceptibility to matrix and
environmental effects. Opportunities would seem to exist for new designs having
greater capacity for generating primary ionization agents, higher volatilization
efficiencies, operation with greater overall robustness, and perhaps providing
real-time means of quantification.
Marcus and Davis initially developed a liquid sampling-atmospheric
pressure glow discharge (LS-APGD) device used for elemental analysis by

138
optical emission spectroscopy (OES) detection.17-19 Detailed optimization of the
source included the effects of gas and liquid flow rates, liquid composition,
powering modes, geometries, and electrode materials. More recently the LS-
APGD has also been used for elemental mass spectrometry, as the energetics of
the plasma ionize solution-originating analyte species as well as laser-ablated
materials directed into the microplasma volume.20-22 This ionization source is
seen as an alternative to inductively coupled plasma (ICP) ionization due to the
advantages of lower operating powers (<10 W, d.c.), smaller footprint (1 mm3
plasma volume), and low liquid flow rates (<25 L min-1). In fact, it complements
traditional, organic, API sources as it has been directly mounted onto commercial
LC/MS instruments. Limits of detection for this device are as low as 0.1 ng for 5
µL injections, which are competitive with first-generation ICP-MS devices.23, 24
Presented here is the preliminary evaluation of an ambient
desorption/ionization-liquid sampling-atmospheric pressure glow discharge (ADI-
LS-APGD) source for mass spectrometry. The source appears (at this point) to
operate as a hybrid of the DESI-type and plasma-based ADI sources, with the
ability to deliver much higher fluxes (on the order of mA) of desorbing/ionizing
agents and higher kinetic temperatures. The previously established LS-APGD
ionization source was modified very slightly to accommodate the new sampling
mechanism where desorption/ionization occurs from the sample surface (either
solution residues or solids) without the requirement of pretreatment or
modification. The source was mounted to the standard interface of a Thermo

139
Finnigan (San Jose, CA) LCQ Advantage Max quadrupole ion trap mass
spectrometer system without any modifications to the instrument faceplate or ion
optics. Plasma current, electrode and sampling geometry/distances, and
sampling liquid composition were investigated regarding their effects on ion
signal intensity and spectral characteristics. Initial assessment of the operational
parameters and limits of detection was undertaken for residues of 10 L drops of
caffeine solutions. A comparison of the role of electrolyte solution identity on
caffeine responses for the LS-APGD and a standard ESI source is presented to
lend some insights into the operable mechanisms of the microplasma ADI
source. Finally, the spectral characteristics of a variety of solution and solid-
phase samples are presented to provide suggestions as to the potential
applicability of the device. The source is in the early stages of development and
optimization, and so while further work in necessary, there is clear potential for
the LS-APGD to provide sensitive ADI analysis with wide sample versatility;
including the previously described elemental analysis of flowing solutions.
A.2 Experimental Section
A.2.1 Samples and Reagents
All reagents were used without additional purification. MilliQwater (18.2
MΩ cm-1, NANOpure Diamond Barnstead/Thermolyne Water System (Dubuque,
IA)), Nitric acid (HNO3) was obtained from VWR (West Chester, PA), and sodium
chloride (NaCl) (Sigma-Aldrich, Inc (St. Louis, MO)) were used in the preparation
of the flowing electrolyte solution and solution-originating samples analyzed as

140
residues off glass slides. Caffeine (99% purity) was purchased from Aldrich
Chemical Company, Inc (Milwaukee, WI). Investigations into the
desorption/ionization characteristics from different sample surfaces were
completed using the following materials: green tea leaf (Boston Tea Company,
Hackensack, NJ), green tea extract (Gaia Herbs, Brevard, NC), coffee bean (The
Eight O’Clock Coffee Company, New Providence, NJ), tobacco leaves from a
cigar (Tabantillas, Weston, FL), Equate ibuprofen tablet (Perrigo, Allegan, MI),
and paper currency ($20 US bill). Helium (Airgas National Welders, Charlotte,
NC) was used as the sheath gas for the LS-APGD and UHP Nitrogen (Airgas
National Welders, Charlotte, NC) was used as the cooling gas in the ion
sampling region of the MS system.
A.2.2 ADI-LS-APGD Ionization Source
The home-built ADI-LS-APGD ion source, adapted from a previous
design,21 was interfaced to a Thermo Finnigan LCQ Advantage MAX quadrupole
ion trap mass spectrometer. A diagrammatic representation of the device is
presented in Fig. A.1. An aluminum mounting plate was designed and built by the
Clemson University machine shop, to attach directly to the LCQ API source
mounting mechanism. The respective glow discharge electrodes were mounted
on translational stages to provide experimental flexibility and control. The ion
source consists of a liquid flow anode and a metal (Ni) cathode mounted on
separate directional stages; X-Y stage from Newport Corporation (North Billerica,
MA) and the X stage from New England Affiliated Technologies, Inc (Lawrence,

141
MA). The electrolytic and test solutions (constituting the anode electrode) are
introduced to the APGD through a glass capillary (125 µm o.d., 75 µm i.d.)
housed within a stainless steel capillary (700 µm o.d., 500 µm i.d.). Solutions
were delivered via a syringe pump (kdScientific, Holliston, MD) operated at a flow
rate of 30 µL min-1. A sheath gas (He) passes in the inter-capillary gap and
Figure A.1: Diagrammatic representation of the components of the LS-APGD source as applied in ambient desorption/ionization mass spectrometry.
over the end of the glass capillary, carrying plasma species toward the sample
surface. The Ni counter electrode (cathode) consisted of a high voltage vacuum
feed through (CeramTec Corp., Laurens, SC), mounted perpendicular to the
anode, with an ~1 mm gap. Power was supplied by Bertan Model 915 series
power supply (Hickville, NY) operated in the constant current mode, with a 10 kΩ
ballast resistor placed in series with the powered cathode (the electrolytic anode

142
is held at ground potential). The spatial arrangement between the electrodes,
the sample surface, and the MS entrance aperture are described in subsequent
sections. In the course of the parametric evaluation, a caffeine test solution, 100
g mL-1 in 50:50 MeOH:H2O, was spotted onto a glass slide in 10 L volumes
and allowed to dry in an 80°C oven (VWR, Radnor, PA); yielding a mass of 1 g
in an ~1mm2 spot. For each analysis, the plasma was initiated and a specific
spot analyzed for ~30 seconds and the integrated MS responses processed. A
new caffeine spot was analyzed for each different discharge condition, with each
data point presented being the average triplicate exposures.
A.2.3 Mass Analyzer System
The Thermo Finnigan LCQ Advantage MAX quadrupole ion trap mass
spectrometer was operated in positive ion mode, ion capillary temperature
250°C, ion capillary voltage 40 V and tube lens offset 95 V. These values are
typical of what is used for ESI-MS analysis of similar analyte types on this type of
instrument. The m/z scan ranges and integration times were chosen on a per
sample basis, with the acquisition rates of 3 scans s-1. No type of collisional
activation MS/MS was applied in this work. The Xcalibur Software (Thermo) was
used for system operation and data acquisition. Xcalibur and Excel (Microsoft,
Redmond, WA) were used for data processing.
A.2.4 Safety Considerations
High voltages and currents are used in the operation of the LS-APGD. The
source assembly and platform is insulated for operator protection by a
143
poly(methyl methacrylate) box constructed in this laboratory, but care should be
taken to avoid potential dangers.
A.3 Results And Discussion
A.3.1 ADI-LS-APGD Parameter Optimization
As with all ADI sources, there is a complex set of interactions and
processes that must be optimized to affect the desired analytical responses.6
Parameters which affect the production rate and delivery flux of the
desorbing/ionizing agents must be matched with the geometric aspects of
delivery the target analyte ions to the region of the MS sampling orifice. The
starting point for the APGD parameter optimization was the conditions employed
in the previous elemental analysis works.20, 21 The helium sheath gas and
electrolyte (1 M HNO3) flow rates were held constant (1 mL min-1 and 50 L min-
1, respectively) in the evaluation of sampling geometries as this provided a high
level of plasma stability. The geometry of the electrodes was then optimized
using caffeine residues on a glass slide as the test species. The primary metric
was the signal intensity of the characteristic, protonated, pseudo-molecular ion at
m/z = 195 Da. An initial discharge current of 15 mA was chosen as higher
currents resulted in additional spectral peaks related to decomposition of the
polymer coating of the glass capillary. The geometric relationship between the
electrodes and MS entrance orifice was varied (somewhat coarsely at this point)
across a wide range of combinations. Ultimately (as might be intuitively
anticipated), a co-linear alignment between the glass capillary exit and the MS

144
sampling orifice, with the Ni counter electrode set off-axis at an angle of 90o
worked very well. The desorption/ionization agents must impinge onto the
surface of the sample, and so the solution electrode was mounted at an angle of
35-40° with respect to the sample plane, which was ~2 mm below the ion
sampler axis. In this arrangement (as is the case in virtually all ADI devices), the
He sheath gas directs the plasma-generated reagents and gases toward the
surface, with the desorbed species entrained in the general direction of sampling
aperture. The translational stages allowed for the relative position of the
electrode intersection (plasma volume) and the deposited sample to be changed
with respect to the MS sampling orifice. This distance was varied from 2 – 13
mm, in single mm steps. As presented in Fig. A.2, appreciable (M+H)+ signals
occurred only at distances from 2 – 6 mm, with a fairly sharp maximum at a
plasma-to-orifice separation of 3 mm, with the deposited solution residue located
approximately half-way in between.

145
Figure A.2: Response of the protonated, pseudo-molecular ion (M+H)+ of caffeine as a function
of sampling distance between the plasma and ion sampling orifice. Discharge current = 30 mA, electrolyte = 1 M HNO3, flow rate = 30 µl min
-1, He sheath gas flow rate = 1.14 mL min
-1,
analytical sample: residues of 10 L, 100 g ml-1
solution in 50:50 H2O:EtOH. Inset: Diagram of
sampling geometry.
The response seen here seems to simply reflect the angular and distance (i.e.,
solid angle) dependence on the transport from the substrate surface and the
sampling orifice. Certainly, much finer evaluation of the geometric aspects of the
sampling (particularly the incident and take-off angles) is in order.
As suggested previously, the primary projected advantage for the LS-
APGD source in ADI applications is the ability to deliver very high primary
reagent fluxes to the substrate surface. As in the case of DESI and most of the
other devices this is controlled by the electrospray/discharge current. In the case
of DESI, the primary particle/droplet current is on the order of single A. Using
caffeine as the test compound, the intensity of the m/z = 195 Da peak was
monitored as a function of the applied current. As seen in Fig. A.3, there was a

146
significant increase in signal as the plasma current was increased above 10 mA,
which peaked at 15 mA, and gradually decreased as the current was further
increased up to 25 mA. In the low current regime, the plasma is somewhat
diffuse, becoming rapidly brighter above 10 mA. This response is interpreted as
the onset of when the plasma has sufficient energy to totally vaporize the
electrolyte feed. Interestingly, the total ion counts (TIC) for the exhaustive
analyses continue to increase while the desired caffeine (M-H)+ signals begin to
diminish at the highest currents. In these situations, the derived mass spectra
become populated with background plasma species (more water clusters) and
decomposition products of the polyimide glass capillary coating. Both of these
phenomena were observed in the earlier “elemental MS” applications.21 While it
might be thought that the
Figure A.3: Response of the protonated, pseudo-molecular ion (M+H)+ of caffeine as a function
of discharge current (sampling distance = 3 mm). Electrolyte = 1 M HNO3, flow rate = 30 µl min-1
,
He sheath gas flow rate = 1.14 mL min-1
, analytical sample: residues of 10 L, 100 g ml-1
solution in 50:50 H2O:EtOH.

147
decreases in pseudo-molecular ion signals might reflect a situation where
ionization suppression may be occurring, in fact here it is seen that the added
power density of the plasma is leading to greater ion fragmentation.
The ADI-LS-APGD source parameters used for the remainder of the study
included a He sheath gas flow rate of 1.14 mL min-1, and electrolyte flow rate of
30 µL min-1, an inter-electrode spacing of 1 mm, a 3-4 mm distance between the
plasma and the MS entrance orifice, a 1-2 mm distance between the sample and
the plasma, and a discharge current of 15 mA. A preliminary determination of
the limits of detection (LOD = (3*RSDB*0.01*[c])/(S/B)),25 based on the spectral
background in the region of the caffeine (M+H)+ signal for the sampling of a 50
g mL-1 solution residue, yielded a value of 1.3 ± 0.8 ng mL-1, corresponding to
~10 pg (~50 fmol) dry weight. This level of detectability is on the lower end of
values reported for other ADI sources.2, 3 More in line with performing quantitative
analyses, replicate exhaustive samplings of 50 µg mL-1 caffeine residues resulted
in a variability of ~50 %RSD for the m/z = 195 Da integrated peak areas.
Certainly, there are opportunities for improvement in terms of greater rigor in the
spotting process and optimization and improved control of the
desorption/sampling geometries. Finally, and very importantly, it is believed that
inclusion of some form of internal standard in the primary electrolyte solution
holds a great deal of promise towards improving reproducibility as well as novel
approaches to quantification.

148
A.3.2 LS-APGD Desorption/Ionization Mechanisms
A cursory evaluation of the operation principles of the LS-APGD would
suggest that the microplasma source likely generates reactive water
clusters/droplets, which affect desorption/ionization in a manner analogous to
DESI. In comparison to the plasma-based ADI sources where helium metastable
atoms are major contributors to the overall ionization, previous optical emission
measurements suggest that the sheath gas atoms in the LS-APGD do not
penetrate into the energetic microplasma to a great extent.19 It is believed that
the collisional processes with plasma electrons are likely the more direct means
of generating (H2O)nH+ species, that have been noted in “elemental” mass
spectra with n-values up to 35-40.20 The fact that the plasma is sustained by
introduction of the 1 M HNO3 electrolyte implies that a high concentration of
protons passes through the plasma per unit time.
As a benchmark to characterize the ionization within the ADI-LS-APGD source,
the mass spectrum of caffeine analyzed as a solution residue was compared to
that obtained with the ESI source conventionally employed on this MS system.
The spectra were acquired under the same MS interface and ion manipulation
conditions. As clearly seen in Fig. A.4, the spectral patterns for the two sources
are virtually identical, dominated by the (M+H)+ species, with slightly less
fragmentation observed for the ADI-LS-APGD ionization source; implying a
common ionization mechanism involving a proton transfer event. It is important
to note that the same total mass of caffeine (0.5 g) was analyzed in both cases,
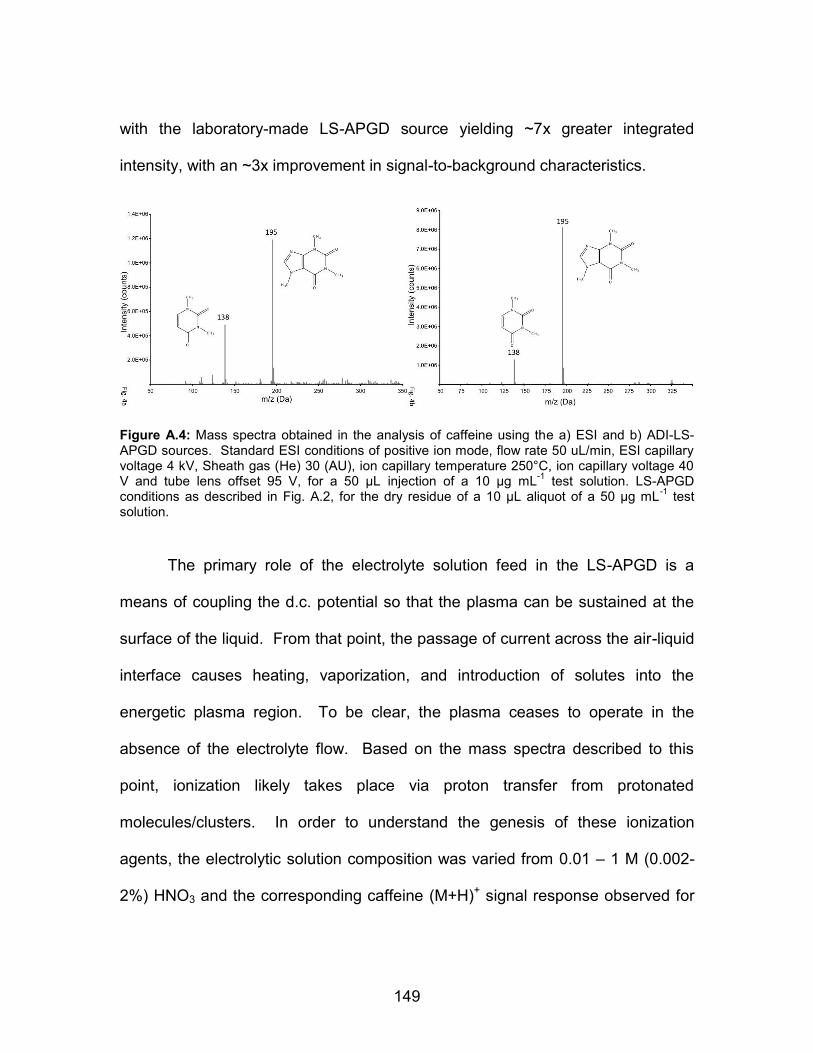
149
with the laboratory-made LS-APGD source yielding ~7x greater integrated
intensity, with an ~3x improvement in signal-to-background characteristics.
Figure A.4: Mass spectra obtained in the analysis of caffeine using the a) ESI and b) ADI-LS-APGD sources. Standard ESI conditions of positive ion mode, flow rate 50 uL/min, ESI capillary voltage 4 kV, Sheath gas (He) 30 (AU), ion capillary temperature 250°C, ion capillary voltage 40 V and tube lens offset 95 V, for a 50 µL injection of a 10 µg mL
-1 test solution. LS-APGD
conditions as described in Fig. A.2, for the dry residue of a 10 µL aliquot of a 50 µg mL-1
test solution.
The primary role of the electrolyte solution feed in the LS-APGD is a
means of coupling the d.c. potential so that the plasma can be sustained at the
surface of the liquid. From that point, the passage of current across the air-liquid
interface causes heating, vaporization, and introduction of solutes into the
energetic plasma region. To be clear, the plasma ceases to operate in the
absence of the electrolyte flow. Based on the mass spectra described to this
point, ionization likely takes place via proton transfer from protonated
molecules/clusters. In order to understand the genesis of these ionization
agents, the electrolytic solution composition was varied from 0.01 – 1 M (0.002-
2%) HNO3 and the corresponding caffeine (M+H)+ signal response observed for
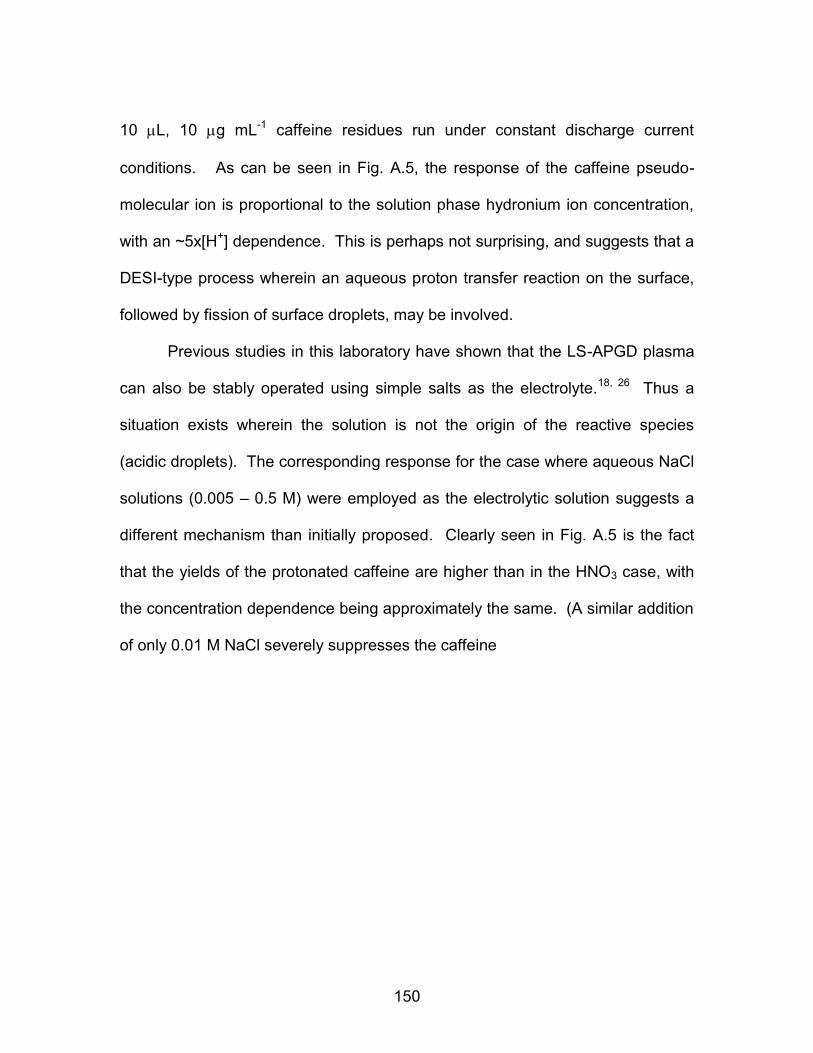
150
10 L, 10 g mL-1 caffeine residues run under constant discharge current
conditions. As can be seen in Fig. A.5, the response of the caffeine pseudo-
molecular ion is proportional to the solution phase hydronium ion concentration,
with an ~5x[H+] dependence. This is perhaps not surprising, and suggests that a
DESI-type process wherein an aqueous proton transfer reaction on the surface,
followed by fission of surface droplets, may be involved.
Previous studies in this laboratory have shown that the LS-APGD plasma
can also be stably operated using simple salts as the electrolyte.18, 26 Thus a
situation exists wherein the solution is not the origin of the reactive species
(acidic droplets). The corresponding response for the case where aqueous NaCl
solutions (0.005 – 0.5 M) were employed as the electrolytic solution suggests a
different mechanism than initially proposed. Clearly seen in Fig. A.5 is the fact
that the yields of the protonated caffeine are higher than in the HNO3 case, with
the concentration dependence being approximately the same. (A similar addition
of only 0.01 M NaCl severely suppresses the caffeine

151
Figure A.5: Response of the caffeine (M+H)+ signal at m/z = 195 Da to variations in the LS-
APGD electrolyte composition. Electrolyte feed rate = 30 µl min-1
, discharge current = 15 mA, He sheath gas flow rate = 1.14 mL min
-1, analytical sample: residues of 10 µL aliquots of a 100 µg
mL-1
solution in 50:50 H2O:EtOH.
(M+H)+ response using the ESI source; as would be expected.) There is no
indication in the product mass spectra that a chemionization involving Na+ is
taking place. Therefore, it is suggested that the formation of the protonated
analyte species is the result of Brønsted acid agents being created in the
microplasma itself from the feed water solution. Indeed, it cannot be concluded
at this point that any type of surface solvation or Coulombic ejection mechanism,
as implied in the DESI literature, can be invoked.6 Condensation is not
observed on the glass slides whatsoever. It is most likely that the ~2,500 K
microplasma19 located 2 mm above the sample surface provides sufficient
thermal energy (via gaseous atoms and molecules) to affect vaporization, as is
152
the case in the DART-type devices. Once in the gas phase, high densities of
(H2O)nH+ or simple H+ species, generated through the vaporization of the
aqueous mobile phase and energetic collisions within the plasma, ionize the
analyte molecules through proton transfer reactions. That said, the spectral
characteristics of caffeine do not suggest processes/environments that impart
appreciable amounts of internal energy. Certainly, there is much
experimentation to be done to unravel the cumulative, underlying processes
occurring in the ADI-LS-APGD device.
A.3.3 ADI-LS-APGD-MS of Different Sample Types
Up to this point, each of the tests has been completed with caffeine
solutions dried onto glass slides. Certainly, this path was not pursued without
prior evidence that the “typical” ADI sample types could be effectively probed.
Following the optimization studies, the potential range of analyte/samples
amenable to general analysis by the ADI-LS-APGD capabilities was evaluated.
The test samples were chosen from those typically used as examples throughout
the ADI literature. In each case the sample was placed 1-2 mm below the
plasma and analyzed for ~10 seconds. The mass spectra presented here
correspond to the integrated signals over that exposure time.
As the mass spectrometric response for caffeine was known, it is reasonable to
assess products wherein caffeine is a major constituent. A liquid green tea
extract (35-45% ethanolic tincture) and a green tea leaf were analyzed as a
means of gaining some indication of the sampling efficiencies of liquid residues

153
and solids. The extract was analyzed by spotting 10 µL onto a glass slide and
allowing it to dry. The green tea leaves were placed on top a small amount of
water to keep them in place during analysis. The resulting mass spectra appear
in Figs. A.6a and b, respectively. Both sample types generate strong mass
spectrometric responses, with the caffeine signatures (195 and 138 Da) clearly
seen in each spectrum. Additional peaks are related to other active components
found in herbal teas, e.g. catechins, which are enriched in the extract. In fact, the
marked peaks (*) correspond to common parent and fragment ions of green tea
catechins (e.g. EGC, EGCG) previously observed in this laboratory by glow
discharge ionization27 as well as ESI-MS works.28, 29 A third sample type
containing caffeine was a roasted coffee bean. In this case, the sample was held
directly under the plasma without any sample modification or pretreatment. The
mass spectrum (Fig. A.6c) again reflects the characteristic caffeine signals as
well as ions (m/z 300-400) reflective of the chlorogenic acids that are common to
coffee beans.30
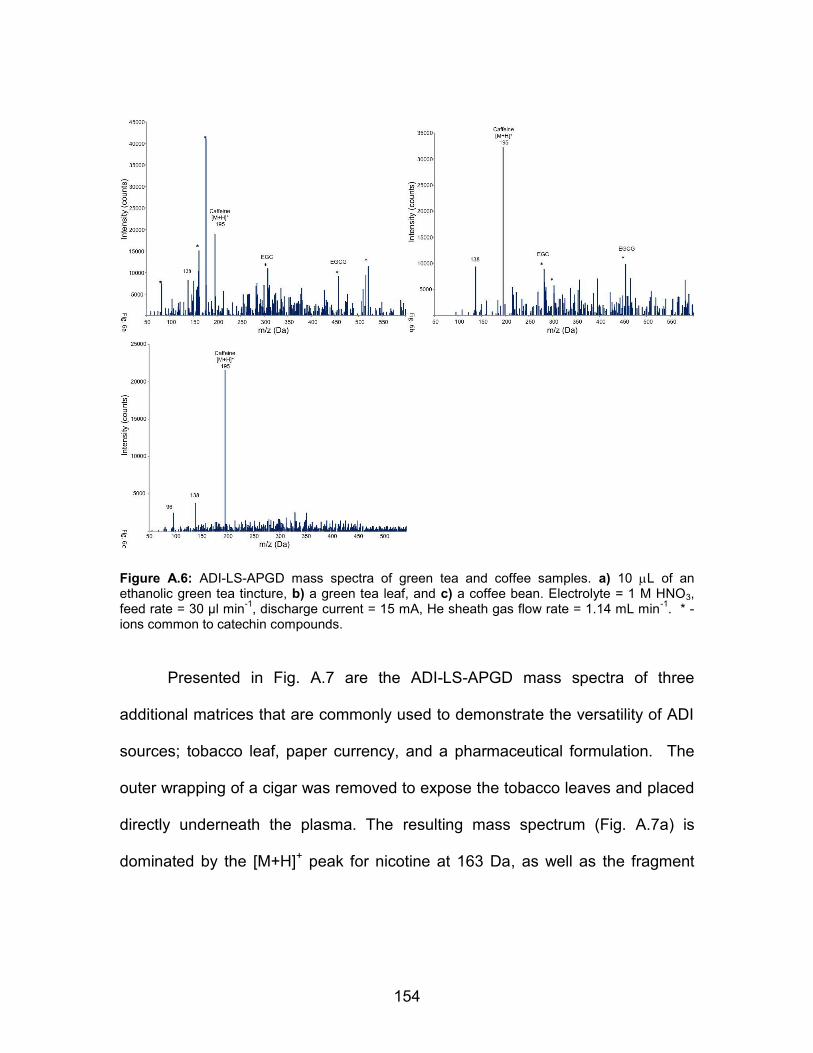
154
Figure A.6: ADI-LS-APGD mass spectra of green tea and coffee samples. a) 10 L of an ethanolic green tea tincture, b) a green tea leaf, and c) a coffee bean. Electrolyte = 1 M HNO3, feed rate = 30 µl min
-1, discharge current = 15 mA, He sheath gas flow rate = 1.14 mL min
-1. * -
ions common to catechin compounds.
Presented in Fig. A.7 are the ADI-LS-APGD mass spectra of three
additional matrices that are commonly used to demonstrate the versatility of ADI
sources; tobacco leaf, paper currency, and a pharmaceutical formulation. The
outer wrapping of a cigar was removed to expose the tobacco leaves and placed
directly underneath the plasma. The resulting mass spectrum (Fig. A.7a) is
dominated by the [M+H]+ peak for nicotine at 163 Da, as well as the fragment

155
ions at m/z = 132, 130, and 117 Da. These correspond well with the ESI-MS
spectra in the literature, as well DART-MS,31 reinforcing the
Figure A.7: ADI-LS-APGD mass spectra of a variety of solid materials. a) cigar tobacco, b) $20 U.S. bill, and c) ibuprofen tablet. Electrolyte = 1 M HNO3, feed rate = 30 µl min
-1, discharge
current = 15 mA, He sheath gas flow rate = 1.14 mL min-1
.
existence of ‘soft’ ionization conditions for small organic molecules; even though
thermal vaporization is likely the mode of desorption. The higher m/z peaks
present in the spectrum could be related to chlorogenic acids and polyphenols
compounds found in tobacco leaves32 or common pesticides33.
The characterization of paper currency is one of the benchmark ADI-MS
examples in forensic analysis.34 For example, it is known that there is a certain

156
level of trace cocaine on most U.S. currency. In the case of the ADI-LS-APGD
sampling, a $20 U.S. bill was folded into a 2.0” X 0.5” rectangle and placed to 2
mm away from the plasma; placement any closer results in the scorching of the
sample. Clearly seen in the obtained mass spectrum (Fig. A.7b) is the [M+H]+
peak at 304 Da attributable to cocaine, along with its characteristic fragment ions
at 182, 150, and 83 Da, which are commonly seen in the ESI-MS of that
molecule.35, 36 Less prominent peaks are likely due to the ink and other
contaminants on the dollar bill.34 In fact, the higher mass peaks are similar to ink
detection by easy ambient sonic spray ionization (EASI). 5 While the spectrum
resulting from the LS-APGD source is complex in terms of its composition, the
device yields relatively high signal intensities that provide the opportunity for
more extensive MS/MS characterization.
The final sample type evaluated by ADI-LS- APGD was a commercial
ibuprofen tablet. In this case, the protective outer coating was gently removed
using a razor blade and the tablet held with tweezers directly under the plasma
without any additional pretreatment steps. The resulting spectrum (Fig. A.7c)
contains the [M+H]+ peak at 207 Da of the active compound ((RS)-2-(4-(2-
methylpropyl)phenyl)propanoic acid), as well fragment ions that are commonly
reported in the literature.37, 38 Other peaks present in the spectrum are related to
the additional compounds and fillers present in the ibuprofen tablet.38

157
A.4 Conclusions
The field of ambient desorption/ionization mass spectrometry has seen
incredible growth in less than a decade. That said, there are few
designs/approaches that offer definitive advantages over others, and so there
may be real opportunities for devices that can deliver greater sensitivity and/or
analytical versatility. Use of the liquid sampling-atmospheric pressure glow
discharge (LS-APGD) as an ADI-MS source would appear to have certain
advantages in the fact that much higher primary fluxes (driven by the discharge
current) are likely produced, with the kinetic temperatures in the proximity of the
plasma being much higher as well. An initial evaluation of the roles of current,
electrode geometry, and electrolytic liquid composition has yielded LODs that
compare very well with peer devices. First-order mechanistic studies involving
the use of NaCl as the supporting electrolyte, in lieu of acidic solutions, suggest
that it is plasma-generated Brønsted acids that ultimately affect analyte
ionization, with thermal energy provided by plasma gases being the mode of
analyte sampling. ADI-LS-APGD mass spectra acquired from a wide range of
representative sample matrices demonstrate basic analytical capabilities, with
spectra that are dominated by (M+H)+ species.
Clearly, much work remains before the ultimate efficacy of this approach
to ADI-MS can be put into perspective. Future studies will continue to optimize
the operational parameters (e.g., other sheath gases and electrolytes) and refine
the design aspects (e.g., more precise control of the geometry) of the LS-APGD

158
device in order to affect not only greater mass sensitivity, but also better sample-
to-sample precision. As with the case of all ADI sources, questions about
quantitative powers exist. Inclusion of internal standards in the electrolyte flow is
projected to be a unique opportunity here, which is not available in many other
ADI designs. While the vast majority of these devices can tout aspects of low
power and solution/support gas consumption, the LS-APGD has the added,
powerful, advantage that it can be applied in the direct analysis of solution-phase
samples with LODs that are of relevance in many fields of study.
References 1. Harris, G. A.; Galhena, A. S.; Fernandez, F. M. Anal. Chem. 2011, 83,
4508-4538. 2. Takats, Z.; Wiseman, J. M.; Cooks, R. G. J. Mass Spectrom. 2005, 40,
1261-1275. 3. Venter, A.; Nefliu, M.; Cooks, R. G. Trac-Trends Anal. Chem. 2008, 27,
284-290. 4. Shelley, J. T.; Hieftje, G. M. J. Anal. At. Spectrom. 2011, 26, 2153-2159. 5. Alberici, R. M.; Simas, R. C.; Sanvido, G. B.; Romao, W.; Lalli, P. M.;
Benassi, M.; Cunha, I. B. S.; Eberlin, M. N. Anal. Bioanal. Chem. 2010, 398, 265-294.
6. Weston, D. J. Analyst 2010, 135, 661-668. 7. Jones, R. W.; Cody, R. B.; McClelland, J. F. J. Forensic Sci. 2006, 51,
915-918. 8. Cody, R. B.; Laramee, J. A.; Durst, H. D. Anal. Chem. 2005, 77, 2297-
2302. 9. Heaton, K.; Solazzo, C.; Collins, M. J.; Thomas-Oates, J.; Bergstrom, E.
T. J. Archaeol. Sci. 2009, 36, 2145-2154.
159
10. Wiseman, J. M.; Ifa, D. R.; Zhu, Y. X.; Kissinger, C. B.; Manicke, N. E.; Kissinger, P. T.; Cooks, R. G. Proc. Natl. Acad. Sci. 2008, 105, 18120-18125.
11. Nyadong, L.; Galhena, A. S.; Fernandez, F. M. Anal. Chem. 2009, 81,
7788-7794. 12. Shelley, J. T.; Wiley, J. T.; Hieftje, G. M. Anal. Chem. 2011, 83, 5741-
5748. 13. Wright, J. P.; Heywood, M. S.; Taylor, N.; Farnsworth, P. B. Anal. Chem.
2011, 83, 6493-6499. 14. Takats, Z.; Wiseman, J. M.; Gologan, B.; Cooks, R. G. Science 2004, 306,
471-473. 15. Stark, A. K.; Schilling, M.; Janasek, D.; Franzke, J. Anal. Bioanal. Chem.
2011, 397, 1767-1772. 16. Harper, J. D.; Charipar, N. A.; Mulligan, C. C.; Zhang, X. R.; Cooks, R. G.;
Ouyang, Z. Anal. Chem. 2008, 80, 9097-9104. 17. Marcus, R. K.; Davis, W. C. Anal. Chem. 2001, 73, 2903-2910. 18. Davis, W. C.; Marcus, R. K. J. Anal. At. Spectrom. 2001, 16, 931-937. 19. Davis, W. C.; Marcus, R. K. Spectrochim. Acta Part B-At. Spectrosc. 2002,
57, 1473-1486. 20. Marcus, R. K.; Quarles, C. D.; Barinaga, C. J.; Carado, A. J.; Koppenaal,
D. W. Anal. Chem. 2011, 83, 2425-2429. 21. Quarles, C. D.; Carado, A. J.; Barinaga, C. J.; Koppenaal, D. W.; Marcus,
R. K. Anal. Bioanal. Chem. 2012, 402, 261-268. 22. Carado, A. J.; Quarles, C. D., Jr.; Duffin, A. M.; Barinaga, C. J.; Russo, R.
E.; Marcus, R. K.; Koppenaal, D. W. J. Anal. At. Spectrom. 2012, 27, 385-389.
23. Houk, R. S.; Fassel, V. A.; Flesch, G. D.; Svec, H. J.; Gray, A. L.; Taylor,
C. E. Anal. Chem. 1980, 52, 2283-2289. 24. Gray, A. L.; Date, A. R. Analyst 1983, 108, 1033-1050.
160
25. Boumans, P. W. J. M.; Vrakking, J. J. A. M. Spectrochim. Acta Part B-At. Spectrosc. 1987, 42, 819-840.
26. Venzie, J. L.; Marcus, R. K. Spectrochim. Acta Part B-At. Spectrosc. 2006,
61, 715-721. 27. Castro, J.; Pregibon, T.; Chumanov, K.; Marcus, R. K. Talanta 2010, 82,
1687-1695. 28. Frauen, M.; Rode, T.; Rapp, C.; Steinhart, H. Chromatographia 2002, 55,
43-48. 29. Poon, G. K. J. Chromatogr. A 1998, 794, 63-74. 30. Mendonca, J. C. F.; Franca, A. S.; Oliveira, L. S.; Nunes, M. Food Chem.
2008, 111, 490-497. 31. Williams, J. P.; Patel, V. J.; Holland, R.; Scrivens, J. H. Rapid Commun.
Mass Spectrom. 2006, 20, 1447-1456. 32. Wang, H. Y.; Zhao, M. M.; Yang, B.; Jiang, Y. M.; Rao, G. H. Food Chem.
2008, 107, 1399-1406. 33. Mayer-Helm, B. Journal of Chromatography A 2009, 1216, 8953-8959. 34. Eberlin, L. S.; Haddad, R.; Neto, R. C. S.; Cosso, R. G.; Maia, D. R. J.;
Maldaner, A. O.; Zacca, J. J.; Sanvido, G. B.; Romao, W.; Vaz, B. G.; Ifa, D. R.; Dill, A.; Cooks, R. G.; Eberlin, M. N. Analyst 2010, 135, 2533-2539.
35. Miguez-Framil, M.; Moreda-Pineiro, A.; Bermejo-Barrera, P.; Cocho, J. A.;
Tabernero, M. J.; Bermejo, A. M. Anal. Chim. Acta 2011, 704, 123-132. 36. Keil, A.; Talaty, N.; Janfelt, C.; Noll, R. J.; Gao, L.; Ouyang, Z.; Cooks, R.
G. Anal. Chem. 2007, 79, 7734-7739. 37. Williams, J. P.; Scrivens, J. H. Rapid Commun. Mass Spectrom. 2005, 19,
3643-3650. 38. Symonds, J. M.; Galhena, A. S.; Fernandez, F. M.; Orlando, T. M. Anal.
Chem. 2010, 82, 621-627.