SAMP Company Report
17
COMPANY UPDATE 1 | P age July 2014, Sri Lanka Equity Research Sampath Bank Softlogic Stockbrokers (Pvt) Ltd #06,37 th Lane, Queens Road Colombo 03, Sri Lanka +94 11 7277000 [email protected] Lead Analyst : Kavindu Ranasinghe Secondary Analyst : Asanka Ranasinghe Third Largest Private Commercial Bank offers good value on 1.0X PBV. The share offers good value trading on book value whilst at 7.5x 2014E net profit and 6.5x 2015 Earnings. At present SAMP accounts for approximately 7.4% of the market share among commercial banks in Sri Lanka with a total asset base of LKR387.6 bn and a branch network of 213. Furthermore the Bank is well renowned for the introduction of innovative practices to the banking industry. SAMP has been able to grow its core banking earnings at a CAGR of c.20% over the last decade. However in 2013 Sampath witnessed a notable decline in bottom line due to impairments as a result of the decline in global gold prices (in 2012 bank had a 25% exposure to pawning). However gold prices have been stable during 2014 and also the bank has been able to reduce the pawning exposure to 17% by 1Q14. In addition we expect a 38% dividend payout for 2014E and 2015E generating a dividend yield of of 5.1% and 6.2% respectively. As per our previous banking update (17 th June 2014), a price upside of 24% was forecasted when the price was at LKR190.9. Since then the price moved north to record a gain of 8.7% as of today. We believe there is further 15% upside and we recommend maintain BUY. Loan book is expected to pick up supported by corporate sector. SAMP witnessed a strong growth in its loan book by 25% in 2013, the highest growth levels among licensed commercial bank during the period, due to the strong growth recorded in the corporate book. Bank’s corporate banking portfolio (accounts c. 34% of the loan book) grew strongly by 38% YoY. We expect credit activity to pick up from 2H2014 where we expect Sampath to further increase corporate sector book to areas where domestic economic growth is expected to fuel from. These areas include Energy, tourism, trade and infrastructure sectors. Asset quality is expected to improve. Sampath has been able to maintain one of the lowest NPL ratios over the years due to the centralized credit appraisal system. However in 2013 the bank saw a c.60 bps increase in NPL ratio to 2.7%. This was mainly due to the decline in global gold prices which resulted in a notable impairment in the pawning related advances. However we expect impairment charges on pawning to decline going forward given SAMP has already recognized most of the losses in the portfolio in 2013. In addition prudent measures taken by bank to minimize the risk arising from the pawning portfolio is also expected to reduce impairment charges which include immediate auctioning of pawning articles which are not redeemed after one year, lesser loan to value ratio on pawning and also the efforts made to reduce the exposure to pawning products. Expected reduction in cost/income ratio. SAMP cost/income (ex.prov) ratio increased to 54.4% in 2013 (cf. 51.5% in 2012) due to the drop in non-interest income as a result of the drop in FCBU gains during the year. In addition during the year bank carried out an island-wide programe to upgrade the interior design of all the branches to a consistent standard which further increased cost to income ratio. We believe the bank would be able to maintain cost/income below 55% in the medium term given the low cost branch model the bank operates. The bank currently has one of the lowest staff per branch ratio in the industry (11 staff per branch). In addition given the likely absence of major upgrades in branches going forward and the moderation of branch expansion we expect further improvement in cost/income ratio. Key risks. Sampath Bank currently has a 17% exposure to pawning in the loan book (LKR44.8 bn). Hence bank’s bottom line is susceptible fluctuation in global gold prices. A notable downtrend in gold prices could result in pawning related impairments as witnessed in 2013. Furthermore with the policy of auctioning articles which are not redeemed within one year could also result in interest losses. As a result this could adversely impact banks bottom-line. SHARE INFO N - 12 Month (High/ Low) 211.5/ 161.6 NV- 12 Month (High/ Low) N- Price Chg (1m/ 1Q/1Y) 10.2 /12.2/ 9.3 NV-Price Chg (1m/ 1Q/1Y) Market Cap. (LKR bn) 34.4 Market Cap. (USD mn) 261.0 Avg. Daily T/O (LKR mn) 15.7 Avg. Daily T/O (USD ‘000) 119.3 N - Issued Shares 167.9 NV - Issued Shares Free Float (%) 54.0 VOTING SHAREHOLDERS As at 31 st March ’14 Vallibel One PLC 14.9% Employees Provident Fund 9.9% Mr. Y.S.H.I. Silva 9.9% Rosewood (Pvt) Ltd 6.8% MATTHEWS International Funds 4.2% Caravel Fund (International) Ltd 2.8% Employees' Trust Fund 2.7% SHARE PRICE CHART 150 160 170 180 190 200 210 220 8-Jul-13 27-Aug-13 16-Oct-13 5-Dec-13 24-Jan-14 15-Mar-14 4-May-14 23-Jun-14 (LKR) Expanding into high growth areas… Rating: BUY Ticker : SAMP.SL;LKR209.00 EARNINGS FORECAST YE 31 Dec/ (LKR mn) 2011 2012 2013 2014E 2015E Net Profit (LKR mn) 3,683.3 5,436.7 3,635.0 4,678.9 5,754.8 YoY growth (%) 5.7% 47.6% -33.1% 28.7% 23.0% EPS (LKR) 21.9 32.4 21.7 27.9 34.3 YoY growth (%) 5.7% 47.6% -33.1% 28.7% 23.0% PER (x) 4.5 6.0 9.7 7.5 6.1 DPS (LKR) 9.0 12.0 8.0 10.6 13.0 Div Yield (%) 4.3% 5.7% 3.8% 5.1% 6.2% BVPS (LKR) 135.9 165.4 188.7 218.0 239.2 PBV (x) 1.5 1.3 1.1 1.0 0.9 ROE (%) 16.1% 19.6% 11.5% 12.8% 14.3% Recurrent Basis Net Profit (LKR mn) 3,683.3 4,975.9 3,635.0 4,678.9 5,754.8 YoY growth (%) 24.7% 35.1% -26.9% 28.7% 23.0% EPS (LKR) 21.9 29.6 21.7 27.9 34.3 YoY growth (%) 24.7% 35.1% -26.9% 28.7% 23.0% PER (x) 9.5 7.1 9.7 7.5 6.1
-
Upload
randora-lk -
Category
Documents
-
view
516 -
download
0
Transcript of SAMP Company Report
COMPANY UPDATE
1 | P a g e July 2014, Sri Lanka Equity Research
Sampath Bank
Softlogic Stockbrokers (Pvt) Ltd #06,37
th Lane, Queens Road
Colombo 03, Sri Lanka +94 11 7277000
Lead Analyst : Kavindu Ranasinghe
Secondary Analyst : Asanka Ranasinghe
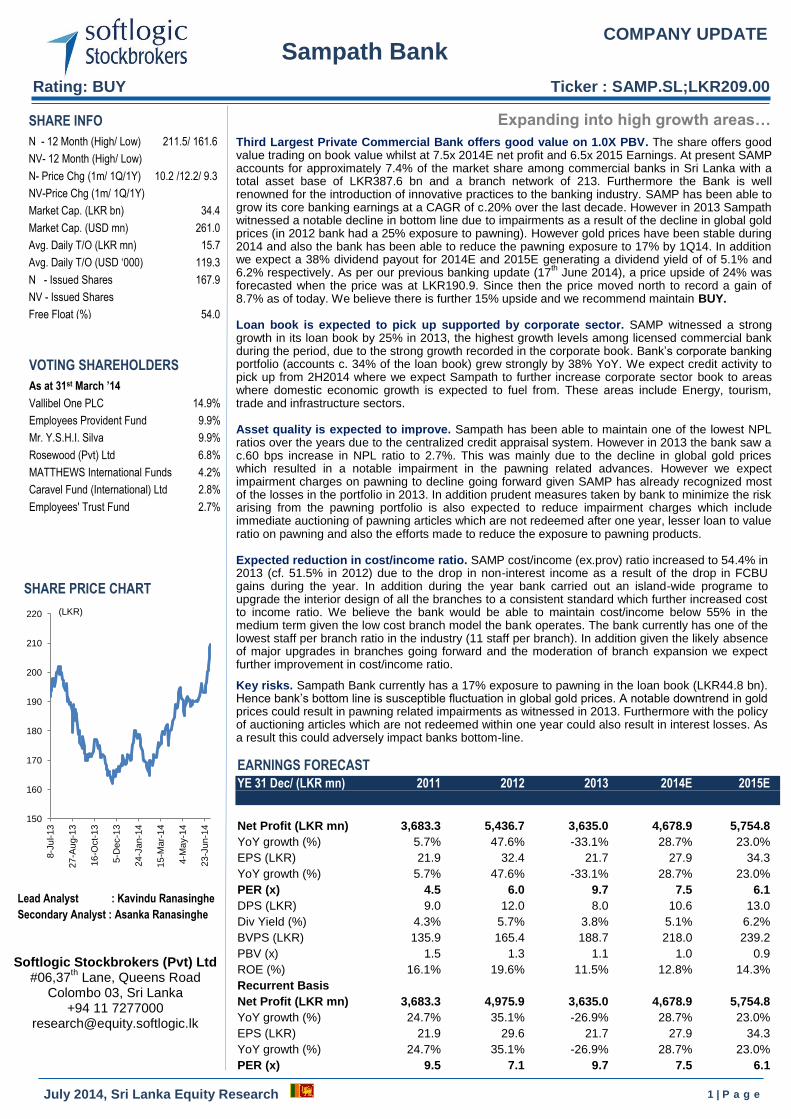
Third Largest Private Commercial Bank offers good value on 1.0X PBV. The share offers good value trading on book value whilst at 7.5x 2014E net profit and 6.5x 2015 Earnings. At present SAMP accounts for approximately 7.4% of the market share among commercial banks in Sri Lanka with a total asset base of LKR387.6 bn and a branch network of 213. Furthermore the Bank is well renowned for the introduction of innovative practices to the banking industry. SAMP has been able to grow its core banking earnings at a CAGR of c.20% over the last decade. However in 2013 Sampath witnessed a notable decline in bottom line due to impairments as a result of the decline in global gold prices (in 2012 bank had a 25% exposure to pawning). However gold prices have been stable during 2014 and also the bank has been able to reduce the pawning exposure to 17% by 1Q14. In addition we expect a 38% dividend payout for 2014E and 2015E generating a dividend yield of of 5.1% and 6.2% respectively. As per our previous banking update (17
th June 2014), a price upside of 24% was
forecasted when the price was at LKR190.9. Since then the price moved north to record a gain of 8.7% as of today. We believe there is further 15% upside and we recommend maintain BUY.
Loan book is expected to pick up supported by corporate sector. SAMP witnessed a strong growth in its loan book by 25% in 2013, the highest growth levels among licensed commercial bank during the period, due to the strong growth recorded in the corporate book. Bank’s corporate banking portfolio (accounts c. 34% of the loan book) grew strongly by 38% YoY. We expect credit activity to pick up from 2H2014 where we expect Sampath to further increase corporate sector book to areas where domestic economic growth is expected to fuel from. These areas include Energy, tourism, trade and infrastructure sectors.
Asset quality is expected to improve. Sampath has been able to maintain one of the lowest NPL ratios over the years due to the centralized credit appraisal system. However in 2013 the bank saw a c.60 bps increase in NPL ratio to 2.7%. This was mainly due to the decline in global gold prices which resulted in a notable impairment in the pawning related advances. However we expect impairment charges on pawning to decline going forward given SAMP has already recognized most of the losses in the portfolio in 2013. In addition prudent measures taken by bank to minimize the risk arising from the pawning portfolio is also expected to reduce impairment charges which include immediate auctioning of pawning articles which are not redeemed after one year, lesser loan to value ratio on pawning and also the efforts made to reduce the exposure to pawning products.
Expected reduction in cost/income ratio. SAMP cost/income (ex.prov) ratio increased to 54.4% in 2013 (cf. 51.5% in 2012) due to the drop in non-interest income as a result of the drop in FCBU gains during the year. In addition during the year bank carried out an island-wide programe to upgrade the interior design of all the branches to a consistent standard which further increased cost to income ratio. We believe the bank would be able to maintain cost/income below 55% in the medium term given the low cost branch model the bank operates. The bank currently has one of the lowest staff per branch ratio in the industry (11 staff per branch). In addition given the likely absence of major upgrades in branches going forward and the moderation of branch expansion we expect further improvement in cost/income ratio.
Key risks. Sampath Bank currently has a 17% exposure to pawning in the loan book (LKR44.8 bn). Hence bank’s bottom line is susceptible fluctuation in global gold prices. A notable downtrend in gold prices could result in pawning related impairments as witnessed in 2013. Furthermore with the policy of auctioning articles which are not redeemed within one year could also result in interest losses. As a result this could adversely impact banks bottom-line.
SHARE INFO
N - 12 Month (High/ Low) 211.5/ 161.6
NV- 12 Month (High/ Low)
N- Price Chg (1m/ 1Q/1Y) 10.2 /12.2/ 9.3
NV-Price Chg (1m/ 1Q/1Y)
Market Cap. (LKR bn) 34.4
Market Cap. (USD mn) 261.0
Avg. Daily T/O (LKR mn) 15.7
Avg. Daily T/O (USD ‘000) 119.3
N - Issued Shares 167.9
NV - Issued Shares
Free Float (%) 54.0
VOTING SHAREHOLDERS
As at 31st March ’14
Vallibel One PLC 14.9%
Employees Provident Fund 9.9%
Mr. Y.S.H.I. Silva 9.9%
Rosewood (Pvt) Ltd 6.8%
MATTHEWS International Funds 4.2%
Caravel Fund (International) Ltd 2.8%
Employees' Trust Fund 2.7%
SHARE PRICE CHART
150
160
170
180
190
200
210
220
8-J
ul-13
27
-Au
g-1
3
16
-Oct-
13
5-D
ec-1
3
24
-Jan-1
4
15
-Mar-
14
4-M
ay-1
4
23
-Jun-1
4
(LKR)
Expanding into high growth areas…
Rating: BUY Ticker : SAMP.SL;LKR209.00
EARNINGS FORECAST
YE 31 Dec/ (LKR mn) 2011 2012 2013 2014E 2015E
Net Profit (LKR mn) 3,683.3 5,436.7 3,635.0 4,678.9 5,754.8
YoY growth (%) 5.7% 47.6% -33.1% 28.7% 23.0%
EPS (LKR) 21.9 32.4 21.7 27.9 34.3
YoY growth (%) 5.7% 47.6% -33.1% 28.7% 23.0%
PER (x) 4.5 6.0 9.7 7.5 6.1
DPS (LKR) 9.0 12.0 8.0 10.6 13.0
Div Yield (%) 4.3% 5.7% 3.8% 5.1% 6.2%
BVPS (LKR) 135.9 165.4 188.7 218.0 239.2
PBV (x) 1.5 1.3 1.1 1.0 0.9
ROE (%) 16.1% 19.6% 11.5% 12.8% 14.3%
Recurrent Basis
Net Profit (LKR mn) 3,683.3 4,975.9 3,635.0 4,678.9 5,754.8
YoY growth (%) 24.7% 35.1% -26.9% 28.7% 23.0%
EPS (LKR) 21.9 29.6 21.7 27.9 34.3
YoY growth (%) 24.7% 35.1% -26.9% 28.7% 23.0%
PER (x) 9.5 7.1 9.7 7.5 6.1

COMPANY UPDATE
2 | P a g e July 2014, Sri Lanka Equity Research
THIRD LARGEST PRIVATE COMMERCIAL BANK
Sampath Bank is the third largest private commercial bank accounting for
approximately 7.4% of the total asset base of commercial banks in Sri
Lanka. At present group operates with a total asset base of LKR387.6 bn
and a branch network of 213, Bank is well renowned for the introduction
of innovative practices to the banking industry. In the past the bank
pioneered in the introduction of ATMS, “one day clearing” for all the
cheques drawn on any Sampath Bank, first cheque Imagine and
Truncating (CIT) site in Sri Lanka, foreign currency Atms and “cardless
cash ATMs etc.However in 2013 Sampath witnessed a notable decline in
bottom line due to impairments as a result of the decline in global gold
prices (in 2012 bank had a 25% exposure to pawning).
Bank has been able to grow its core banking earnings at a CAGR of circa
20% over the last decade. Moreover excluding profit dip in 2013 due to
the pawning impairment, bank’s earnings CAGR grew by c.28% over the
last decade. SAMP is adequately capitalized with Tier I CAR at 9.8% and
TIER II CAR at 13.6% and continued to maintain healthy loan book
(excluding the hit on the pawning portfolio)
STRONG LENDING BASE
SAMP with c.8% market share in loans saw its advances portfolio
growing 25% YoY to LKR265 bn in 2013, the highest growth levels
among licensed commercial bank in the period, due to the strong growth
recorded in the corporate book. However personal banking portfolio
witnessed a lower growth as a result of the moderation in the pawning
portfolio. In 2013 personal banking advances (accounts c. 59% of the
loan book) grew by 17% YoY, leveraging on the expanded business
volumes though the well covered branch network. However growth in the
personal banking advances was notably impacted by the efforts taken to
reduce the pawning portfolio. For an example the bank reduced its
pawning exposure from 25% in 2012 to 20% by the end of 2013 and 17%
by 1Q14. In addition bank’s corporate banking portfolio (accounts c. 34%
TKS Research/ Annual Report
Total Asset Share
24.2%
19.7%
12.4%
10.2%
7.4%
4.3% 4.1% 3.4% 2.7%
1.3% 0.7%
6.0%
2.5%
0.6% 0.5%
“7.4% market share among
commercial banks”
“Loan growth is expected to be
fuelled from the corporate sector”
Source : Company Annual Reports/ Softlogic Equity Research

COMPANY UPDATE
3 | P a g e July 2014, Sri Lanka Equity Research
of the loan book) grew strongly by 38% YoY. The growth was mainly due
to the improved customer service levels, continuous marketing efforts to
canvas new customers etc. For an example in 2013 online process for
documentary credit was further streamlined with the addition of security
features which further improved level of customer experience in the
segment.
Loan growth was rather slow in 1Q14 where bank also recorded a 4% dip
YTD by Mar’14 despite the several measures taken by central bank to
stimulate private sector credit demand (Reduced interest rates cut in
statutory reserve ratio etc). However we expect credit activity to pick up
from 2H2014 where we expect Sampath to further increase funding to
corporate sector especially to areas where domestic economic growth is
expected to fuel from. These areas include Energy, tourism, trade and
infrastructure sectors. This was evident in 2013 where construction
(+27% YoY), tourism (89% YoY), transport (50% YoY) and infrastructure
(25% YoY) lending grew significantly. In addition we expect some
moderation in the personal banking portfolio due to the measures taken to
reduce the pawning portfolio. Therefore we forecast SAMP’s advance
portfolio to grow c.12% in the medium run fuelled by macroeconomic
upside and with more attention placed on the corporate sector.
Loans and Advances
0%
5%
10%
15%
20%
25%
30%
0
50
100
150
200
250
300
350
400
2012 2013 2014E 2015E
(LKR bn)
Gross loans & advances YoY growth
Gross Loans and Advances
0
100
200
300
400
500
600
700
800
900
LKR bn
Gross loans & advances - 2012 Gross loans & advances - 2013
6% YoY
4% YoY
13% YoY
17% YoY
26% YoY
8% YoY
11% YoY
19% YoY 14% YoY
5% YoY 23% YoY
Source : Company Annual Reports/ Softlogic Equity Research
Source : Company Annual Reports/ Softlogic Equity Research
COMPANY UPDATE
4 | P a g e July 2014, Sri Lanka Equity Research
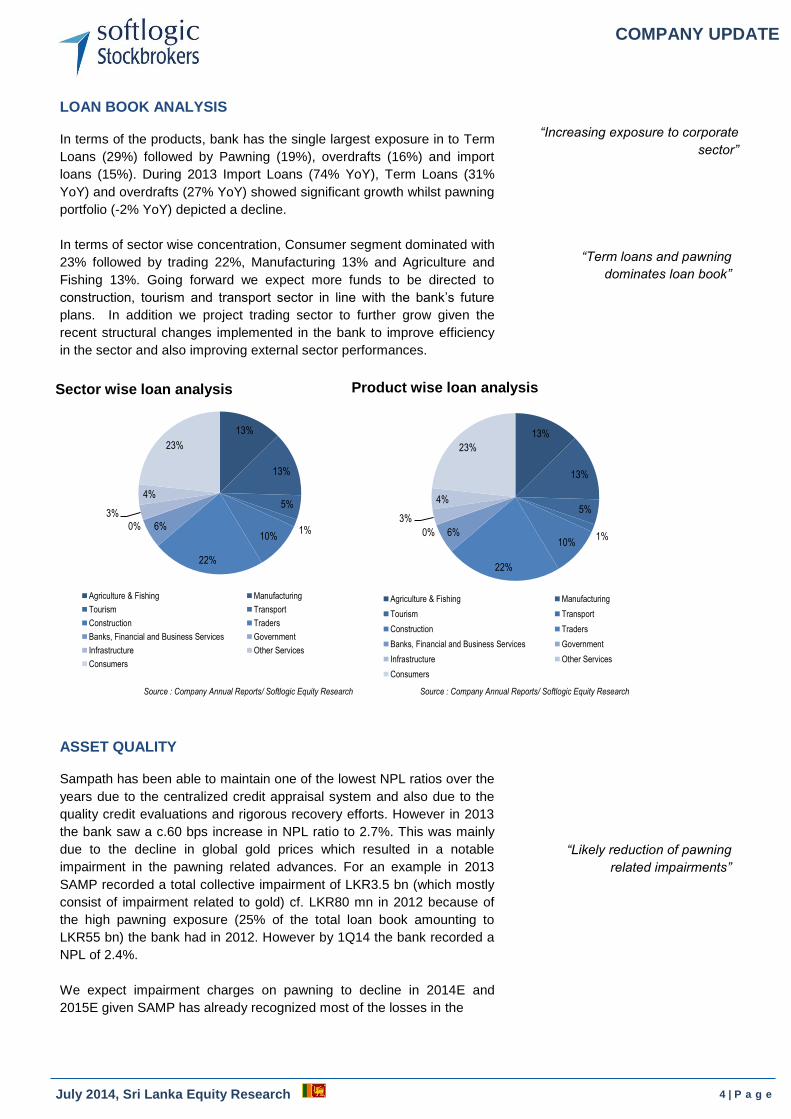
LOAN BOOK ANALYSIS
In terms of the products, bank has the single largest exposure in to Term
Loans (29%) followed by Pawning (19%), overdrafts (16%) and import
loans (15%). During 2013 Import Loans (74% YoY), Term Loans (31%
YoY) and overdrafts (27% YoY) showed significant growth whilst pawning
portfolio (-2% YoY) depicted a decline.
In terms of sector wise concentration, Consumer segment dominated with
23% followed by trading 22%, Manufacturing 13% and Agriculture and
Fishing 13%. Going forward we expect more funds to be directed to
construction, tourism and transport sector in line with the bank’s future
plans. In addition we project trading sector to further grow given the
recent structural changes implemented in the bank to improve efficiency
in the sector and also improving external sector performances.
ASSET QUALITY
Sampath has been able to maintain one of the lowest NPL ratios over the
years due to the centralized credit appraisal system and also due to the
quality credit evaluations and rigorous recovery efforts. However in 2013
the bank saw a c.60 bps increase in NPL ratio to 2.7%. This was mainly
due to the decline in global gold prices which resulted in a notable
impairment in the pawning related advances. For an example in 2013
SAMP recorded a total collective impairment of LKR3.5 bn (which mostly
consist of impairment related to gold) cf. LKR80 mn in 2012 because of
the high pawning exposure (25% of the total loan book amounting to
LKR55 bn) the bank had in 2012. However by 1Q14 the bank recorded a
NPL of 2.4%.
We expect impairment charges on pawning to decline in 2014E and
2015E given SAMP has already recognized most of the losses in the
Sector wise loan analysis
13%
13%
5%
1% 10%
22%
6% 0%
3%
4%
23%
Agriculture & Fishing Manufacturing
Tourism Transport
Construction Traders
Banks, Financial and Business Services Government
Infrastructure Other Services
Consumers
TKS Research/ Annual Report
Product wise loan analysis
13%
13%
5%
1% 10%
22%
6% 0%
3%
4%
23%
Agriculture & Fishing Manufacturing
Tourism Transport
Construction Traders
Banks, Financial and Business Services Government
Infrastructure Other Services
Consumers
“Increasing exposure to corporate
sector”
“Likely reduction of pawning
related impairments”
“Term loans and pawning
dominates loan book”
Source : Company Annual Reports/ Softlogic Equity Research Source : Company Annual Reports/ Softlogic Equity Research

COMPANY UPDATE
5 | P a g e July 2014, Sri Lanka Equity Research
portfolio in 2013. In addition prudent measures taken by bank to minimize
the risk arising from the pawning portfolio is also expected to reduce
impairment charges. These include immediate auctioning of pawning
articles which are not redeemed or re-pawned after one year, lesser loan
to value ratio on pawning (roughly 60% cf. nearly 80% before) and also
the efforts made to reduce the exposure to pawning products.
Furthermore bank increased exposure to pawning when the gold prices
were bottoming out in 2013 (by 3Q 2013) which would provide further
support to the pawning portfolio with lower average cost. However it
should be noted these forecasts are made on the assumption that we
would not envisage another significant downtrend in global gold prices
(especially in the short to medium term).
Therefore given the strong credit track record, possible upgrade of the
Finacle system during 2014 and with stabilised global gold prices we
believe the bank would be able to maintain its NPL ratio below 2.5% in
the medium term.
Asset Quality
0.0%
2.0%
4.0%
6.0%
8.0%
10.0%
12.0%
14.0%
BOC* Peoples* COMB HNB SAMP SEYB NDB DFCC NTB PABC UBC
Gross NPL Net NPL
NPL Ratio
0.0%
0.5%
1.0%
1.5%
2.0%
2.5%
3.0%
2011 2012 2013 2014E 2015E
Gross NPL ratio Net NPL ratioSource : Company Annual Reports/ Softlogic Equity Research
Source : Company Annual Reports/ Softlogic Equity Research

COMPANY UPDATE
6 | P a g e July 2014, Sri Lanka Equity Research
Pawning
Pawning in simple terms means over the counter lending against gold
(acts as the collateral). Pawning is a very short term lending product
ranging from 1 month to a year maximum. With rising gold prices in 2012
pawning became a very popular and profitable lending product for banks
which saw significant growth in their pawning portfolios. A special feature
in pawning is that it is considered a zero risk lending product when
calculating your risk weighted assets. Thereby expanding pawning base
does not impact your capital base which is another reason why some
banks used pawning to expand their asset base.
However gold prices in the world market declined considerably during
2013 where it fell c.28% (declined c.35% from its high of USD1,790.0) in
2013. Declining gold prices reduces the collateral value of gold loans, but
the impact would not be reflected immediately in the income statement.
Impact would be realized in the income statement when the collateral
(gold) of the defaulted loans are sold at the auction at lower prices.
However sentimental value of jewellery may reduce the customer default
rates in pawning as they would not be refinanced even when the gold
prices decline.
During 2012 banks were giving out c.80-85% (loan/value) of the gold
value as pawning loans (which would act as a buffer if gold prices
decline). However steep fall in gold prices has resulted in loan value
dropping beyond the collateral value which has posted a bad loan risk to
the banks which has relatively high exposure in to pawning. Sampath had
one of the highest pawning exposures by 2012 (25% of the loan book)
During 2013the system lost c.LKR100.0 bn in value on gold loans and
almost all the banks have taken a decision to auction the gold and cut
their losses. Further the banks have considerably reduced the loan to
value ratio to 60-65% enabling a higher cushion against future gold price
reductions. Therefore we believe banks would be able to fully clear their
books by end of this year.
“Customer confidence & attractive
products to drive deposits”
“Expected to maintain the gross
NPL ratio below 2.5% in the
medium term”
Gold Prices
1,100
1,200
1,300
1,400
1,500
1,600
1,700
1,800
1,900
Aug-12 Nov-12 Feb-13 May-13 Aug-13 Nov-13 Feb-14 May-14
USD/Oz
Source : Bloomberg/ Softlogic Research

COMPANY UPDATE
7 | P a g e July 2014, Sri Lanka Equity Research
DEPOSIT MOBLISATION
Customer deposit (LKR311.8 bn as at 1Q14) which accounts for c.77% of
the funding witnessed c.24% YoY upside in 2013 and 4% YTD growth by
end of 1Q14. In a highly competitive deposit market with the declining
interest rates we believe SAMP would be able to grow its deposit base by
c.11% in the coming few years. The growth in deposits would be
leveraged on well covered branch network and through the introduction of
innovative products which improves customer convenience. These value
added channel products include mobile banking, internet banking, value
added ATMs, debit cards, credit cards, M-commerce products and E-
remittance etc. Furthermore integrating technology into these channel
products would further assist bank’s deposit mobilization efforts. For an
example Sampath ATMs provide value added facilities such as
exchanging foreign currencies, paying utility bills etc on top of the normal
ATM functions. Moreover in 2013 the bank introduced first cardless ATM
in Asia/South East Asia which enables users to withdraw cash from ATMs
without using a debit card. Bank’s current loan to deposit ratio is 82%
mainly due to the moderation in the pawning portfolio (1Q14) and was
89% in 2013. We believe going forward bank would maintain it at 90%
level with the expected pick up in the private sector credit growth.
Deposits
0%
5%
10%
15%
20%
25%
30%
0
50
100
150
200
250
300
350
400
2011 2012 2013 2014E
(LKR bn)
Deposits YoY growth
“Growth in deposits fuelled by
value added products”
Source : Company Annual Report/ Softlogic Research
Deposit Growth
0
100
200
300
400
500
600
700
800
900
LKR bn
Deposits - 2012 Deposits - 2013
22% YoY
11% YoY
15% YoY
13% YoY
24% YoY
14% YoY
11% YoY
21% YoY 29% YoY
12% YoY 23% YoY
Source : Company Annual Report/ Softlogic Research

COMPANY UPDATE
8 | P a g e July 2014, Sri Lanka Equity Research
GROWING CASA FRANCHISE
Despite relatively low interest rates, SAMP’s CASA mix deteriorated
slightly to c.33% (34% in 2012). However despite the fall in the ratio bank
was able to increase the savings base by 22% YoY in 2013. Therefore
with the low interest rates we believe the bank would see an improvement
in the CASA mix going forward.
SATISFACTORY CAPITALIZATION LEVEL
By end 1Q14, SAMP had a Tier I CAR of 9.8% (minimum regulatory limit
5%) and Tier II CAR of 13.6% (minimum regulatory limit 10%). During the
year 2013 bank successfully completed LKR5.0 bn debenture issue to
further strengthen its total capital base. In addition the bank also raised
USD100 mn in a single transaction during the year. Furthermore USD20
mn was also raised from Proparco, the private investment arm of the
French development agency (AFD). Therefore we believe SAMP is
adequately capitalized to support medium term growth and risks.
However if sustained low growth in profit is recorded SAMP might need to
strengthened its Tier I capital in near future to support the growth
potential. Bank’s liquid asset ratio is at 27.2% (regulatory limit of 20%).
“CASA mix to improve with decline
in interest rates”
“Bank is adequately capitalized”
CASA Base
6% 6% 6% 6% 6%
34% 28% 28% 28% 29%
60% 66% 67% 66% 65%
2011 2012 2013 2014E 2015E
Current accounts Savings accounts Time deposits
CASA Mix
38% 37%
45%
39%
35% 33%
26%
18%
26%
22%
18%
Source : Company Annual Reports/ Softlogic Research
Source : Company Annual Reports / Softlogic Research

COMPANY UPDATE
9 | P a g e July 2014, Sri Lanka Equity Research
Capital adequacy
0.0%
2.0%
4.0%
6.0%
8.0%
10.0%
12.0%
14.0%
16.0%
2011 2012 2013 2014E 2015E
Tier I CAR Tier II CAR
Tier I Regulatory limit Tier II Regulatory limit
Capital adequacy
0.0%
5.0%
10.0%
15.0%
20.0%
25.0%
BOC* Peoples* COMB HNB SAMP SEYB NDB DFCC NTB PABC UBC
Tier I CAR Tier II CAR
Tier II Regulatory Limit
Source : Company Annual Report/ Softlogic Research
Source : Company Annual Reports/ Softlogic Research

COMPANY UPDATE
10 | P a g e July 2014, Sri Lanka Equity Research
FINANCIAL PERFORMANCE
Net Interest Income (NII)
NII increased 25% YoY to LKR15,094.8 mn in 2013 largely due to a 29%
YoY rise in interest income to LKR42,320.2 mn. The growth in interest
income was mainly on account of the 25.1% YoY growth in the loan book
and effective management of the fund base. In addition during the year
the bank converted part of the foreign currency reserve of the FCBU into
local currency to facilitate local lending. This was carried out on the view
to reduce the volatile income. Therefore this initiative also contributed to
the the increase in interest income. However growth in interest income
was partly limited by the lack of credit growth in the overall economy and
dip in the pawning portfolio (-2%YoY). In addition interest expense rose
by 31.7% YoY to LKR27,255.5 mn due to the 23.6% YoY increase in
deposits and rise in foreign borrowings. Going forward we expect a flat
growth in NII in 2014E due to the the possible loss of accrued interest on
auctioned pawning articles. During 2013, bank’s net interest margin was
at 4.2% with an average interest yield of 13.4% and and average intersest
cost of 8.6%.
Non-interest income
Non interest income declined by 16.7%YoY to LKR5,265.5 mn in 2013 as
a resutl of the 34.2% YoY drop in other operating income. The dip in other
opearating income was on account of the drop in foreign exchange
revaluation gain by 84.5%YoY due to the conversion of foreign currency
reserves to expand local lending. Furthermore less volatility of rupee
during the year also contributed drop in forex gains. However these
losses were partially offset by the strong growth (+18.9% YoY in 2013) in
the the fees and commsision income supported by robust growth in the
trade related services (+12.0% YoY), Credit card and debit cards (+18.6%
YoY) and foreign remittance (+25.7% YoY). We expect cards and
remittance to play a pivotal role in driving bank’s fee based business.
Furthermore Sampath Bank recorded the highest growth in fees and
commision income cf. its main peers over the years.
NII
0%
5%
10%
15%
20%
25%
30%
35%
0
2
4
6
8
10
12
14
16
18
2012 2013 2014E 2015E
(LKR bn)
Net interest income (NII) YoY growth
“NII to grow 21% YoY in 2014E
“Non-interest income accounts
17% of total income”
Source : Company Annual Report/ Softlogic Research

COMPANY UPDATE
11 | P a g e July 2014, Sri Lanka Equity Research
Cost/income Ratio
SAMP cost/income (ex.prov) ratio increased to 54.4% in 2013 (cf. 51.5%
in 2012) due to the drop in non interest income as a result of the drop in
FCBU gains during the year. In addition during the year bank carried out
an island-wide programe to upgrade the interior design of all the branches
to a consistent standard which further increased cost to income ratio. We
believe the bank would be able to maintain cost/income below 55% in the
medium term given the low cost branch model the bank operate with the
centralization of specialized functions. The bank currently has one of the
lowest staff per branch ratio in the industry (11 staff per branch). In
addition given the likely absesnse of major upgrades in branches going
forward and the moderation of branch expansion we expect further
improvement in cost/income ratio.
Total Income Composition
79% 84% 89% 88% 88%
21% 16% 11% 12% 12%
2011 2012 2013 2014E 2015E
Interest income Other income
Cost : Income
48%
49%
50%
51%
52%
53%
54%
55%
56%
57%
58%
0
2
4
6
8
10
12
14
2011 2012 2013 2014E 2015E
(LKR bn)
Operating Costs Cost (ex.prov)/income ratio
Source :Company Annual Repor/t Softlogic Equity Research
Source :Company Annual Report/ Softlogic Equity Research

COMPANY UPDATE
12 | P a g e July 2014, Sri Lanka Equity Research
Net Interest Margin
Sampath Bank has been able to maintain NIMs above 4.0% due to the
timely and efficient and repricing of assets and liabilities and also due to
the exposure to higher yielding assets such as pawning and cards.
However in 1Q14 bank’s NIMs dropped by 118 bps to 3.0% cf. 4Q13
owing to the loss in interest income with the auctioning non-redeemed
pawning articles. Therefore going forward we expect a dip in NIMs in
2014E as a result of the possible loss of interest income with the
auctioning of pawning articles. Furthermore in the medium term we
expect a slight deterioation in NIMs (near 4.0%) from the average level
with more funds being divered to the corporate sector.
Net Interest Margin
3.2%
3.7%
4.2%
2011 2012 2013 2014E 2015ENII margin
“NI margin to be maintained in the
range of 3.5-4.0%”
Cost : Income Per Comparison
51%
45% 40%
52% 54%
57%
48%
42%
58%
69%
78%
Source : Company Annual Reports/ Softlogic Equity Research
Source :Company Annual Report Softlogic Equity Research

COMPANY UPDATE
13 | P a g e July 2014, Sri Lanka Equity Research
KEY RISKS
Possible reduction in Gold prices – Sampath Bank currently has a 17%
exposure to pawning in the loan book (LKR44.8 bn). Hence bank’s bottom
line is susceptible fluctuation in global gold prices. A notable downtrend in
gold prices could result in pawning related impairments as witnessed in
2013. Furthermore with the policy of auctioning articles which are not
redeemed within one year could also result in interest losses. As a result
this could adversely impact banks bottom-line. However we believe pawning
related risk is only present to the medium term growth in the profitability.
Persistent weaker asset quality - Sustained weaker asset quality might also
insert pressure on capital adequacy. Currently Sampath has one of the
lowest Tier 1 capital adequacy ratio in the industry (industry average
c.11.0%). Pressure on capital adequacy might also limit loan book
expansion or may lead to assume riskier underwriting standards to increase
profitability. This could further deteriorate credit profile.
VALUATION
Forecast 2014E net profit up 29% to LKR4,678.9 mn. SAMP’s NIM would
be intact around 4.0% whilst continuing to benefit from wider coverage.
Credit growth is expected to pick up from 2H2014 and less pawning related
impairment with gold prices stabilizing would help bank to grow its core
income. Furthermore expected growth in fee based business would further
strengthen the operating income. In addition moderation of the branch
network would enable the bank to bring down cost to income below 55%
boosting the earnings. Samp’s outlook is positive. Therefore we forecast
2014E net profit to rise 28.7% YoY to LKR4,678.9 mn and 2015E net
earnings to grow 23.0%YoY to LKR5,754.8 mn.
Attractive valuation compared local peers. Sampath offers better
valuations compared to local peers both in terms of PBV (x) and PER (x).
Hence the bank is trading at a notable discount.
Attractive valuation compared regional peers. The bank is one of the
cheapest banking counters compared to its regional peers.
Name Mkt Cap (LKR mn) PER (X) PBV (X) ROE (%) Tot Assets (LKR Bn)
SAMPATH BANK PLC 35,009 8.9 1.0 12.7 387.6
NATIONAL DEVELOPMENT BANK PL 34,291 10.4 1.4 14.0 213.1
DFCC BANK 42,416 13.4 1.0 8.2 177.3
SEYLAN BANK 12,142 9.9 1.0 10.3 217.5
COMMERCIAL BANK OF CEYLON PL 124,040 12.1 2.1 18.6 648.6
HATTON NATIONAL BANK PLC 62,751 8.6 1.1 13.9 536.7
Name Mkt Cap (LKR mn) PER (X) PBV (X) ROE (%) Tot Assets (LKR Bn) Country
NIB BANK 30,315 17.3 1.4 8.3 234.5 PAKISTAN
PHILIPPINE SAVINGS BANK 98,505 22.9 1.9 7.7 411.4 PHILIPPINES
BANK OF JORDAN 74,163 9.6 1.3 15.0 400.5 JORDAN
FNB NAMIBIA HOLDINGS LTD 75,233 10.0 2.7 25.9 295.8 NAMIBIA
FIRST NATIONAL BANK BOTSWANA 131,129 12.3 4.3 38.8 242.2 BOTSWANA
Source : Bloomberg/ Softlogic Equity Research
Source : Bloomberg/ Softlogic Equity Research
COMPANY UPDATE
14 | P a g e July 2014, Sri Lanka Equity Research
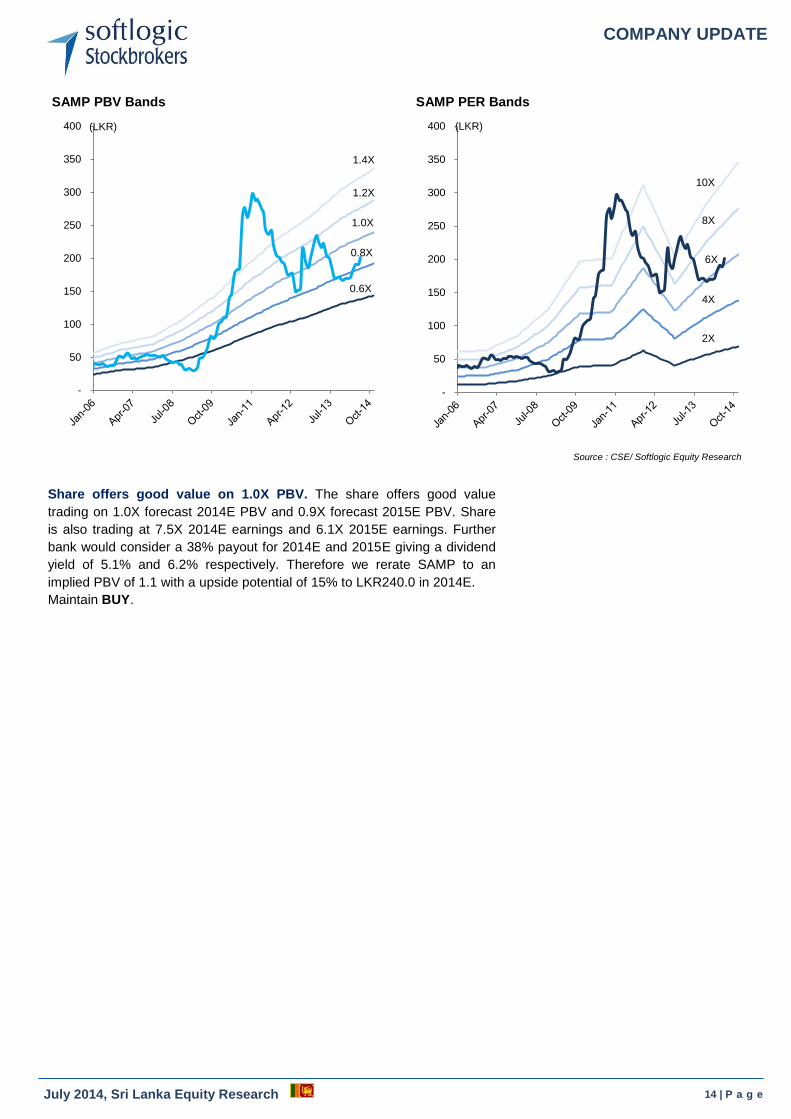
Share offers good value on 1.0X PBV. The share offers good value
trading on 1.0X forecast 2014E PBV and 0.9X forecast 2015E PBV. Share
is also trading at 7.5X 2014E earnings and 6.1X 2015E earnings. Further
bank would consider a 38% payout for 2014E and 2015E giving a dividend
yield of 5.1% and 6.2% respectively. Therefore we rerate SAMP to an
implied PBV of 1.1 with a upside potential of 15% to LKR240.0 in 2014E.
Maintain BUY.
Source : CSE/ Softlogic Equity Research
SAMP PER Bands
-
50
100
150
200
250
300
350
400
2X
4X
6X
8X
10X
(LKR)
SAMP PBV Bands
-
50
100
150
200
250
300
350
400
0.6X
0.8X
1.0X
1.2X
1.4X
(LKR)
COMPANY UPDATE
15 | P a g e July 2014, Sri Lanka Equity Research
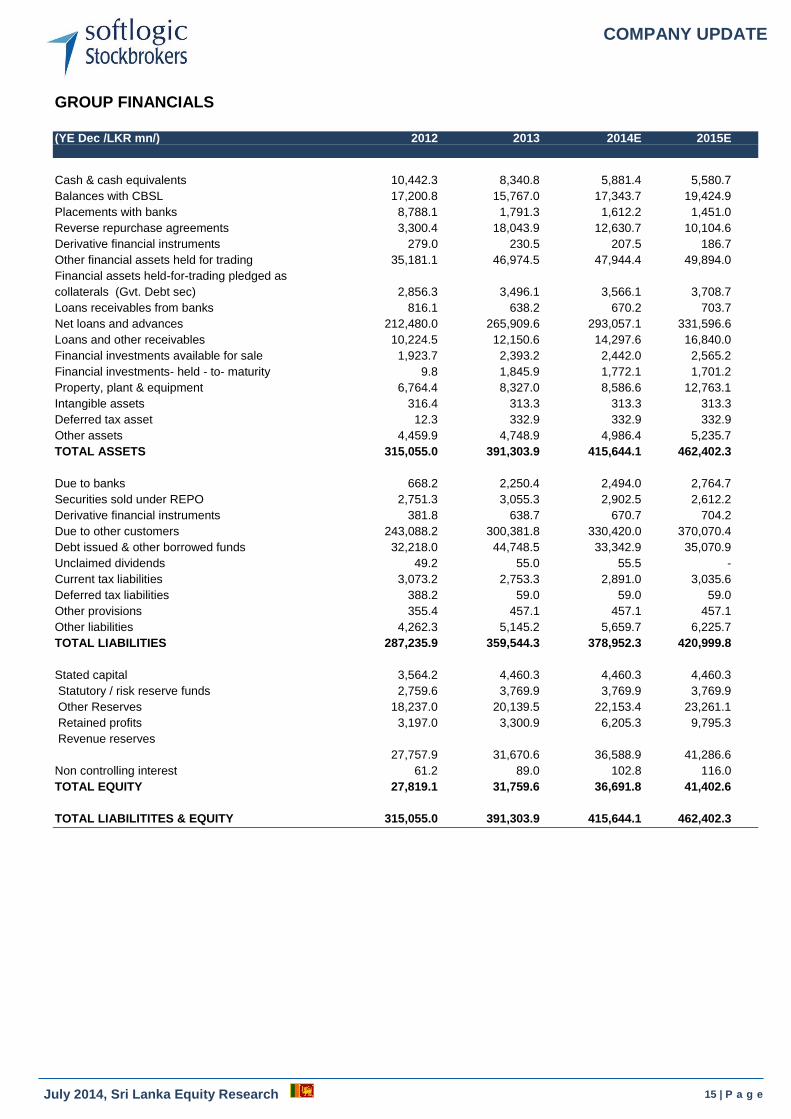
GROUP FINANCIALS
(YE Dec /LKR mn/) 2012 2013 2014E 2015E
Cash & cash equivalents 10,442.3 8,340.8 5,881.4 5,580.7
Balances with CBSL 17,200.8 15,767.0 17,343.7 19,424.9
Placements with banks 8,788.1 1,791.3 1,612.2 1,451.0
Reverse repurchase agreements 3,300.4 18,043.9 12,630.7 10,104.6
Derivative financial instruments 279.0 230.5 207.5 186.7
Other financial assets held for trading 35,181.1 46,974.5 47,944.4 49,894.0
Financial assets held-for-trading pledged as
collaterals (Gvt. Debt sec) 2,856.3 3,496.1 3,566.1 3,708.7
Loans receivables from banks 816.1 638.2 670.2 703.7
Net loans and advances 212,480.0 265,909.6 293,057.1 331,596.6
Loans and other receivables 10,224.5 12,150.6 14,297.6 16,840.0
Financial investments available for sale 1,923.7 2,393.2 2,442.0 2,565.2
Financial investments- held - to- maturity 9.8 1,845.9 1,772.1 1,701.2
Property, plant & equipment 6,764.4 8,327.0 8,586.6 12,763.1
Intangible assets 316.4 313.3 313.3 313.3
Deferred tax asset 12.3 332.9 332.9 332.9
Other assets 4,459.9 4,748.9 4,986.4 5,235.7
TOTAL ASSETS 315,055.0 391,303.9 415,644.1 462,402.3
Due to banks 668.2 2,250.4 2,494.0 2,764.7
Securities sold under REPO 2,751.3 3,055.3 2,902.5 2,612.2
Derivative financial instruments 381.8 638.7 670.7 704.2
Due to other customers 243,088.2 300,381.8 330,420.0 370,070.4
Debt issued & other borrowed funds 32,218.0 44,748.5 33,342.9 35,070.9
Unclaimed dividends 49.2 55.0 55.5 -
Current tax liabilities 3,073.2 2,753.3 2,891.0 3,035.6
Deferred tax liabilities 388.2 59.0 59.0 59.0
Other provisions 355.4 457.1 457.1 457.1
Other liabilities 4,262.3 5,145.2 5,659.7 6,225.7
TOTAL LIABILITIES 287,235.9 359,544.3 378,952.3 420,999.8
Stated capital 3,564.2 4,460.3 4,460.3 4,460.3
Statutory / risk reserve funds 2,759.6 3,769.9 3,769.9 3,769.9
Other Reserves 18,237.0 20,139.5 22,153.4 23,261.1
Retained profits 3,197.0 3,300.9 6,205.3 9,795.3
Revenue reserves
27,757.9 31,670.6 36,588.9 41,286.6
Non controlling interest 61.2 89.0 102.8 116.0
TOTAL EQUITY 27,819.1 31,759.6 36,691.8 41,402.6
TOTAL LIABILITITES & EQUITY 315,055.0 391,303.9 415,644.1 462,402.3

COMPANY UPDATE
16 | P a g e July 2014, Sri Lanka Equity Research
INCOME STATEMENT
(YE Dec /LKR mn) 2012 2013 2014E 2015E
Interest income 32,712.0 42,320.2 42,805.4 47,243.6
Interest expenses 20,673.0 27,225.5 27,413.7 30,114.5
Net interest income 12,039.0 15,094.7 15,391.8 17,129.1
Other income 6,340.6 5,265.5 5,709.3 6,192.5
Net income 18,379.6 20,360.2 21,101.1 23,321.6
Impairment changes on loans 80.1 3,574.1 1,683.5 1,307.1
Total OPEX 9,470.2 11,066.0 11,942.5 12,820.5
PBT 8,829.3 5,720.1 7,475.1 9,194.0
Taxation 3,389.3 2,082.4 2,792.7 3,434.9
PAT 5,440.0 3,637.7 4,682.4 5,759.1
Equity holder profit 5,436.7 3,635.0 4,678.9 5,754.8
Ratios
2012 2013 2014E 2015E 1Q2014
Tier I CAR 11.87% 10.08% 9.80% 9.70% 9.75%
Tier II CAR 13.75% 14.14% 13.12% 12.39% 13.57%
Gross NPL ratio 2.07% 2.68% 2.50% 2.40% 2.38%
Net NPL ratio 0.22% 0.59% 0.50% 0.40% 0.93%
NII margin 4.18% 4.27% 3.82% 3.90% 2.98%
ROA (before tax) 2.61% 1.46% 1.80% 1.99% 1.78%
ROE (after tax) 22.33% 11.48% 12.79% 13.94% 16.78%
Ave. Interest yield 13.3% 13.4% 11.7% 11.9% 11.0%
Ave. Interest cost 8.2% 8.6% 7.6% 7.7% 7.5%
Cost/income (Ex Prov) 51.5% 54.4% 56.6% 55.0% 63.1%
CASA mix 33.8% 33.3% 34.5% 34.7% 34.7%
Loan/Deposit 0.87 0.89 0.89 0.90 0.82
Liquid asset ratio - DBU 21.50% n/a n/a n/a 28.60%

COMPANY UPDATE
17 | P a g e July 2014, Sri Lanka Equity Research
Softlogic Stockbrokers (Pvt) Ltd # 06, 37
th Lane, Queens Road, Colombo 03
Sri Lanka
Telephone +94 117 277 000 |Fax +94 117 277 099
E-mail [email protected]
Equity Research Danushka Samarasinghe Asanka Ranasinghe
[email protected] [email protected]
+94 11 7277001 + 94 11 7277052, +94 77-1078497
Kavindu Ranasinghe Chamithri R.atnapala
[email protected] [email protected]
+94 11 7277031 + 94 11 7277030, +94 77-3723506
Imalka Hettiarachchi Nishanthi Hettiarachchi
[email protected] [email protected]
+94 11 7277032 +94 11 7277030, +94 11 77 1078499 Equity Sales Dihan Dedigama [email protected] 011 7277010 / 0117277055, 0777689933
Hussain Gani [email protected] 011 7277020 / 777209986
Prasanna Chandrasekera [email protected] 011 7277056
Eardley Kern [email protected] 011 7277053, 0777348018
Andre Lowe [email protected] 011 7277034,
Zimry Liyabdeen [email protected] 011 7277057
Achindi.Silva [email protected] 011 7277054 077 3825087
Chandima Kariyawasam [email protected] 011 7277058, 0777885778
Hisham Haniffa [email protected] 0773828781
Branches Horana
Madushanka Rathnayaka [email protected] 034 7451000 0773566465
Negombo
Krishan Williams [email protected] 031 7451000 0773569827 The information contained in this report is for general information purposes only. This report and its content is copyright of Softlogic Stockbrokers and all rights reserved. This report- in whole or in part- may not, except with the express written permission of Softlogic Stockbrokers be reproduced or distributed or commercially exploited in any material form by any means whether graphic, electronic, mechanical or any means. Nor may you transmit it or store it in any other website or other form of electronic retrieval system. Any unauthorised use of this report will result in immediate proceedings. The report has been prepared by Softlogic Stockbrokers (Private) Limited. The information and opinions contained herein has been compiled or arrived at based upon information obtained from sources believed to be reliable and in good faith. Such information has not been independently verified and no guaranty, representation or warranty, express or implied is made as to its accuracy, completeness or correctness, reliability or suitability. All such information and opinions are subject to change without notice. This document is for information purposes only, descriptions of any company or companies or their securities mentioned herein are not intended to be complete and this document is not, and should not be construed as, an offer, or solicitation of an offer, to buy or sell any securities or other financial instruments. In no event will Softlogic Stockbrokers be liable for any loss or damage including without limitation, indirect or consequential loss or damage, or any loss or damage whatsoever arising out of, or in connection with the use of this report and any reliance you place on such information is therefore strictly at your own risk. Softlogic Stockbrokers may, to the extent permissible by applicable law or regulation, use the above material, conclusions, research or analysis in which they are based before the material is disseminated to their customers. Not all customers will receive the material at the same time. Softlogic Stockbrokers, their respective directors, officers, representatives, employees, related persons and/or Softlogic Stockbrokers, may have a long or short position in any of the securities or other financial instruments mentioned or issuers described herein at any time and may make a purchase and/or sale, or offer to make a purchase and/or sale of any such securities or other financial instruments from time to time in the open market or otherwise, in each case either as principal or agent. Softlogic Stockbrokers may make markets in securities or other financial instruments described in this publication, in securities of issuers described herein or in securities underlying or related to such securities. Softlogic Stockbrokers may have entirely underwritten the securities of an issuer mentioned herein.
Softlogic Research Guide to Investment Rating BUY : Share price may exceed 15% over the next 12 months
Trading BUY : Share price may exceed 7.5% over the next 3 months, however longer-term outlook could vary
Neutral : Share price may fall within the range of +/- 7.5% over the next 12 months
Take Profit : Target price has been attained. Look to accumulate at lower levels
Sell : Share price may fall by more than 15% over the next 12 months
Not Rated : Stock is not within regular research coverage