Salmo salar - University of Stirling full MS.pdf · 3 responses of juvenile Atlantic salmon (Salmo...
49
i The effects of increasing dietary levels of amino acid supplemented soy protein concentrate 1 and constant dietary supplementation of phosphorus on growth, composition and immune 2 responses of juvenile Atlantic salmon (Salmo salar L.) 3 4 C. Metochis 1 , V.O. Crampton 2 , K. Ruohonen 2 , J.G. Bell 1 , A. Adams 1 , K.D. Thompson 3 5 1 Institute of Aquaculture, School of Natural Sciences, University of Stirling, 6 Stirling FK9 4LA, Scotland, UK 7 2 EWOS Innovation, N-4335, Dirdal, Norway 8 3 Moredun Research Institute, Pentlands Science Park, Bush Loan, Penicuik, UK 9 10 Corresponding author: Christoforos P. Metochis, Institute of Aquaculture, University of 11 Stirling, Stirling FK9 4LA, UK. Tel: (+44) 1786 466597; Email: [email protected] , 12 [email protected] 13 14 15 16 17 18 19 20 21 22 23 Keywords: Atlantic salmon, body cross-sections, growth, mineral composition, soy protein 24 concentrate 25
Transcript of Salmo salar - University of Stirling full MS.pdf · 3 responses of juvenile Atlantic salmon (Salmo...

i
The effects of increasing dietary levels of amino acid supplemented soy protein concentrate 1
and constant dietary supplementation of phosphorus on growth, composition and immune 2
responses of juvenile Atlantic salmon (Salmo salar L.) 3
4
C. Metochis1, V.O. Crampton2, K. Ruohonen2, J.G. Bell1, A. Adams1, K.D. Thompson3 5
1Institute of Aquaculture, School of Natural Sciences, University of Stirling, 6
Stirling FK9 4LA, Scotland, UK 7
2EWOS Innovation, N-4335, Dirdal, Norway 8
3Moredun Research Institute, Pentlands Science Park, Bush Loan, Penicuik, UK 9
10
Corresponding author: Christoforos P. Metochis, Institute of Aquaculture, University of 11
Stirling, Stirling FK9 4LA, UK. Tel: (+44) 1786 466597; Email: [email protected] , 12
14
15
16
17
18
19
20
21
22
23
Keywords: Atlantic salmon, body cross-sections, growth, mineral composition, soy protein 24
concentrate 25

2
Abstract 26
Diets with 50 (SPC50), 65 (SPC65) and 80 % (SPC80) substitution of prime fishmeal (FM) 27
with soy protein concentrate (SPC) were evaluated against a commercial type control feed 28
with 35% FM replacement with SPC. Increases in dietary SPC were combined with 29
appropriate increases in methionine, lysine and threonine supplementation whereas added 30
phosphorus was constant among treatments. Diets were administered to quadruplicate 31
groups of 29g juvenile Atlantic salmon exposed to constant light, for 97 days. On Day 63 32
salmon were subjected to vaccination. Significant weight reductions in SPC65 and SPC80 33
compared to SPC35 salmon were observed by Day 97. Linear reductions in body cross-34
sectional ash, Ca:P ratios, Ca, P, Mn and Zn were observed at Days 63 (prior vaccination) 35
and 97 (34 days post vaccination) while Mg presented a decrease at Day 63, in salmon fed 36
increasing dietary SPC. Significant reductions in Zn, Ca, P and Ca:P ratios persisted in 37
SPC65 and SPC80 compared to SPC35 salmon at Day 97. Significant haematocrit reductions 38
in SPC50, SPC65 and SPC80 salmon, were observed at Days 63, 70 and 97. Enhanced 39
plasma haemolytic activity, increased total IgM and a rise in thrombocytes were 40
demonstrated in SPC50 and SPC65 salmon on Day 97, while increased lysozyme activity 41
was demonstrated for these groups on Days 63, 70 and 97. Leucocyte and lymphocyte counts 42
revealed enhanced immunostimulation in salmon fed with increasing dietary SPC at Day 97. 43
High SPC inclusion diets did not compromise the immune responses of salmon while SPC50 44
diet also supported good growth without compromising elemental concentrations. 45
1. Introduction 46
As yet, plant proteins have been the most economically viable alternatives to fish meal (FM) 47
(Ytrestøyl et al. 2015), representing 37% of salmon diets, which translates to approximately 48
67% of protein from plants (Ytrestøyl et al. 2015). From this percentage about 38% is 49
covered by soy protein concentrate (SPC) (Ytrestøyl et al. 2015). However, the ever 50

3
increasing FM prices compared to the stable or decreasing soybean prices could potentially 51
improve even more the cost efficiency of SPC over FM, making SPC the dominant protein 52
source in salmon feeds (FAO 2015). SPC is an exceptionally digestible protein source with 53
high protein content and favourable amino acid profile compared to FM (Dersjant-Li 2002; 54
Ytrestøyl et al. 2015). It is produced by aqueous alcohol extraction of the soluble 55
carbohydrates in defatted soy flakes, thus increasing their protein content while reducing the 56
concentrations of antinutritional factors (ANFs) such as trypsin inhibitors, lectins, saponins 57
and soy antigens linked to enteritis (Drew et al. 2007). Studies have demonstrated no changes 58
in the growth of Atlantic salmon fed diets with up to 75% substitution of FM by SPC (Refstie 59
et al. 1998; Storebakken et al. 1998; 2000; Refstie et al. 2001). Moreover, it has been 60
reported that diets with even 100% substitution of FM with SPC did not promote any 61
incidences of soybean induced enteritis in salmonids (Krogdahl et al. 2000; Escaffre et al. 62
2007). 63
Additional information is required regarding the effects of increasing dietary plant 64
protein levels on the growth performance, proximate and elemental compositions of Atlantic 65
salmon (NRC 2011; Prabhu et al. 2013; 2014). Overall, juvenile salmon appear to be more 66
sensitive to dietary soy protein inclusion due to the increasing presence of phytic acid in soy 67
products and the immature state of their digestive tract (Storebakken et al. 1998; 2000; Burr 68
et al. 2013). Phytic acid bound on the protein fraction of soybeans is the main antinutritional 69
factor (ANF) found in SPC (Storebakken et al. 1998). Almost three fourths of the P in 70
soybeans is found in the form of phytic acid, which not digestible by peptic enzymes, thus 71
decreasing the availability of P (Francis et al. 2001). Phytic acid inhibits protein hydrolysis 72
and forms complexes with positively charged cations, proteins and amino acids, reducing 73
their availability for the fish (Francis et al. 2001; Riche and Garling 2004). Muscle is the 74
main storage tissue for most nutrients while skeleton consists the principal elemental store 75

4
in fish. Therefore, any changes in nutrient retention could be reflected in the composition of 76
these tissues. Herein, body cross-sections from the end of the dorsal fin to the start of the 77
anal fin including muscle, bone, skin and scales (in a similar manner as Norwegian quality 78
cutlet (NQC) samples are utilised for flesh quality control in market size salmon) were used 79
for the compositional assessment of both tissues as a whole. Elemental data were compared 80
with whole body concentrations which are generally used as the golden standard in order to 81
assess this novel methodological approach (Shearer et al. 1994; Helland et al. 2005; 2006). 82
In general, there is a lack of information regarding the effects of high dietary levels of 83
plant proteins on the overall health status of Atlantic salmon. Previously, Krogdahl et al. 84
(2000) reported increased lysozyme and total IgM levels in the intestinal mucosa of seawater 85
adapted Atlantic salmon maintained on feeds with 30 % of dietary protein from soy products 86
(SBM and SPC) compared to FM-fed salmon. Moreover, SPC-fed salmon demonstrated 87
improved resistance against Aeromonas salmonicida compared to their FM- and soybean 88
meal (SBM) fed counterparts. While studies on the effects of dietary plant proteins on the 89
immune status of Atlantic salmon are still scarce, the majority of these were focused on the 90
effects of these feedstuffs on the innate immune responses of fish that have not been 91
stimulated immunologically (Thompson et al. 1996). However, determining immune 92
responses shortly or later post immunisation (via vaccination in the present study) may 93
highlight dietary modifications that were not evident before (Thompson et al. 1996). 94
Vaccination in the present study was primarily used in order to provide immunological 95
stimulation and secondarily to reproduce commercial conditions, as most farmed salmon are 96
vaccinated for disease prevention during the freshwater stage (Poppe and Koppang 2014). 97
In fish subjected to vaccination, normal skeletal elemental deposition could be decreased if 98
these nutrients are required for metabolic and immunomodulatory processes (Lall, 2003; 99
Kiron 2013). Overall, the negative effects of vaccination on bone development and 100

5
mineralisation depend on fish size at vaccination (Berg et al., 2006; Grini et al., 2011), the 101
type of the vaccine (Aunsmo et al., 2008) and the culture conditions (Grini et al., 2011). 102
With regards to the latter variable, studies have shown that both vaccinated and non-103
vaccinated salmon exposed to high water temperatures (15-16°C) (used in order to boost 104
salmon growth) are more prone to changes in their vertebral structure and composition which 105
translates to a higher prevalence of skeletal pathologies (Ytterborg et al. 2010; Grini et al. 106
2011). Exposure to continuous light is another common commercial practice, targeting the 107
prevention of maturation and/or smoltification in juvenile salmon but has also been 108
associated with an enhancement in salmon growth (Kråkenes 1990; Bromage et al. 2001; 109
Berrill et al. 2003; Stefansson et al. 2007; 2008). Fjelldal et al. (2005; 2006) reported that 110
Atlantic salmon post-smolts reared in seawater cages under a continuous light regime, 111
promoting faster growth, demonstrated lower vertebral mineralisation compared to fish 112
exposed to natural photoperiod. Therefore, salmon exposure to intensive rearing regimes, 113
aiming faster growth could negatively affect skeletal mineralisation and development. 114
The main aim of the study was to assess the growth and health of juvenile Atlantic 115
salmon fed increasing dietary SPC levels (50, 65 and 80 % of dietary protein from SPC) 116
against a commercial type control diet with 35% of protein from SPC, under constant light, 117
a temperature of 13°C and an intensive feeding regime. While the commercial 118
implementation of salmon diets with higher than 65% of protein from SPC is improbable, 119
due to the high price of this ingredient compared to other FM alternatives, they were used in 120
this context in order to amplify responses, which could highlight nutritional deficiencies. 121
Health was evaluated by assessing immune responses and body cross-sectional composition 122
prior to (Day 63) and post-vaccination with a commercial vaccine (Day 97/34 days post 123
vaccination (dpv)). 124
2. Materials and methods 125

6
2.1. Diets and growth trial 126
Four experimental diets were prepared. These were formulated so that aqueous-alcohol 127
extracted SPC (Imcopa, Paraná, Brazil) supplied 35, 50, 65 and 80 % of total dietary protein 128
(termed SPC35, SPC50, SPC65 and SPC80, respectively) with high quality FM providing 129
the rest of the dietary protein in all cases. Diet formulations are provided in Table 1. SPC35 130
served as the control diet. The rationale behind the use of SPC35 as a control treatment was 131
to mimic commercial salmon dietary compositions with inclusion of plant proteins. In this 132
case, SPC as a sole plant derived FM substitute was chosen due to its premium nutritional 133
value. In previous trials, SPC35 treatment had been tested against EWOS commercial feed 134
formulations and it was found to perform equally well as its commercial counterparts 135
(personal communication Viv Crampton). The diets were manufactured by EWOS 136
Innovation, Dirdal, Norway and were formulated so that protein: fat ratios were constant 137
whereas lysine, methionine and threonine were supplemented to give the same AA: protein 138
ratios across dietary treatments. The amount of supplemented dicalcium phosphate was 139
constant among the diets, representing 3% of all experimental dietary formulations, 140
exceeding Atlantic salmon phosphorus (P) requirement (Lall 2003). 141
The feeding trial was conducted at EWOS Innovation facilities in Dirdal, Norway. For 142
the trial, fresh water was supplied to 16 square tanks with rounded corners each containing 143
approximately 60 litres of water. Water temperature was maintained at 13 ± 1ºC, whilst 144
photoperiod was constant (24 h of light). The diffused oxygen level of inlet water to the 145
tanks was constantly 90-100 % saturation. . A total of one thousand nine hundred and twenty 146
(1920 fish) unvaccinated S0 Atlantic salmon parr (from a commercial SalmoBreed strain 147
selected for improved growth performance) of an average weight of 29 g (i.e. 120 fish × 148
tank-1) were randomly allocated to the 16 tanks. Fish were acclimatised to experimental tanks 149
for 28 days prior to commencing the trial, during which time they were fed a commercial 150

7
EWOS freshwater diet for salmonids (EWOS micro). During the study period quadruplicate 151
tanks of fish were fed one of the 4 experimental diets. Fish were fed with automatic belt 152
feeders, continuously every 435 seconds for 20 seconds. Feeding time and period within feed 153
intervals were the same for the acclimation and trial period. The daily ration depended on 154
the trial period and fish appetite. A daily ration of 3.5 % of tank biomass was recorded during 155
the acclimation period, while this proportion was decreased to 2.75, 2.5 and 1.5% of tank 156
biomass during the first, second and third month of the trial period, respectively. A high 157
daily feed ration was used to avoid differences in feed intake often associated with satiation 158
feeding of plant substituted diets (Refstie et al. 1998). 159
The growth trial was conducted for a total of 97 days, at which time all fish in the tanks 160
were removed and bulk weighed post anaesthetisation (metacaine, 30 mg × l-1) at Days 36, 161
63 and 97. At Day 63 and after bulk weighing fish from each tank, blood from 6 individuals 162
per tank was withdrawn for the evaluation of both haematological and immunological 163
responses. After blood sampling, body cross-sections between the end of the dorsal fin and 164
the start of the anal fin, from the same fish were collected for the commencement of 165
composition analyses in pools of six body cross-sections per tank (4 pools per treatment). 166
Salmon were then intraperitoneally (i.p.) vaccinated with 100μl of a commercial vaccine 167
(AquaVac™ Furovac, Intervet UK Ltd., Milton Keynes) against A. salmonicida in order to 168
simulate commercially applied conditions and most importantly to stimulate immune 169
responses. Thereafter, fish were sampled for haematological and immunological evaluation 170
at Days 70 (7 days post vaccination) and 97 (34 days post vaccination) while body cross-171
sections were sampled at Day 97 of the trial. 172
2.2. Sample collection 173
Blood was withdrawn from the caudal vein of 6 fish per tank per dietary group on Days 63, 174
70 and 94 after the start of the study (i.e. pre vaccination, 7 and 34 dpv) using 1 ml syringes 175

8
rinsed with heparin (10 IU × ml-1; Sigma-Aldrich, Dorset, UK), and used to assess a variety 176
of haematological and immunological parameters in dietary fish. Haematocrit values were 177
determined for all sampled fish at each sampling point. Total and differential leucocyte 178
counts were determined from only three fish per tank. Three blood smears were prepared for 179
each fish for the determination of differential leucocyte counts. The smears were air dried 180
and subsequently stained with Rapid Romanowsky stain (Raymond A lamb, Eastbourne, 181
UK) and examined at × 1000 magnification to determine the percentage of different 182
leucocyte types and the numbers of these cells per ml of blood according to total leucocyte 183
numbers. Two pooled blood samples per tank were then obtained (2 pools of 1.2 ml of blood 184
from three individuals per tank, giving 8 pools of blood per treatment). The blood was 185
centrifuged at 3000 × g for 20 min at 4ºC and pooled serum then aliquoted into seven 186
eppendorf tubes (around 40-50 µl per tube) and stored at -80oC until used. 187
Head kidney samples (approximately 5 mm) from three individuals (from the same 188
tank), were aseptically removed and pooled into plastic 5-ml bjoux containers containing 5 189
ml of ice-cold Leibovitz medium (L-15; Sigma-Aldrich) and 40 μl heparin (10 IU × ml -1). 190
Two pools per tank were used for the determination of the superoxide anion (O-2) production 191
by head kidney macrophages. 192
2.3. Head kidney macrophage isolation and macrophage respiratory burst activity 193
For the isolation of head kidney macrophages (HKMs) the method described by Korkea-aho 194
et al. (2011) was used. The superoxide anion (O-2) production by head kidney macrophage 195
suspensions were measured by the conversion of NBT (Sigma-Aldrich) to formazan, 196
according to the method published by Secombes (1990) with some modifications described 197
by Korkea-aho et al. (2011). 198

9
2.4. Determination of plasma protein and lysozyme activity 199
Protein content of plasma was determined by the Pierce BCA (bicinchoninic acid) Protein 200
Assay kit (Thermo Scientific, IL, USA) based on the conversion of Cu2+ to Cu1+ under 201
alkaline conditions (Biuret reaction) using bovine serum albumin (BSA) as a standard. 202
Serum lysozyme activity was based on the lysis of lysozyme sensitive Micrococcus 203
lysodeikticus as described by Korkea-aho et al. (2011). 204
2.5. Measurement of natural haemolytic activity (Complement) 205
Plasma haemolytic activity used was based on a method described by Sirimanapong et al. 206
(2014) with modifications including a 22°C incubation temperature of the reaction mixture 207
and the use of four double serial plasma dilutions for the determination of haemolytic activity 208
starting from an 1:4 dilution. 209
2.6. Total plasma Immunoglobulin M (IgM) assay 210
The level of IgM in sera of experimental fish was determined using an indirect enzyme 211
linked immunosorbent assay (ELISA) described by Sirimanapong et al. (2014), with 212
modifications including the use of 1:500 and 1:1000 plasma dilutions, the application of a 213
monoclonal mouse anti-trout/salmon IgM (F11-Aquatic Diagnostics Ltd, Stirling, Scotland) 214
diluted 1:66 in antibody buffer (1% BSA in LSWB) for 1 h at 22°C and lastly the use of goat 215
anti-mouse immunoglobulin-G labelled with horseradish peroxidase (HRP) (Sigma-Aldrich) 216
diluted 1: 4000 in conjugate buffer (1% BSA in LSWB) for 60 min at 21°C. 217
2.7. Determination of antibody titres against A. salmonicida 218
An ELISA was used to measure the specific antibody response of Atlantic salmon to the A. 219
salmonicida vaccine using a modification of the method outlined by Adams et al. (1995). 220
2.8. Antiprotease Activity 221
The method used was designed to detect anti-protease activity in trout plasma, and was 222
based on the method described by Ellis (1990), modified for use in microtitre plates. 223

10
2.9. Calculations 224
Estimated feed conversion ratios (FCRs) in the current trial were based on the feed amount 225
given to the fish and do not represent the actual FCR; therefore they were not included in 226
the current report or statistical analyses. For simplicity, growth performance was evaluated 227
by monitoring the mean salmon weight from each tank and estimating the weight gain of the 228
experimental salmon groups: 229
Weight gain (WG): 230
WG =𝐵𝑖𝑜𝑚𝑎𝑠𝑠 𝑓𝑖𝑛𝑎𝑙 (𝑔)−𝐵𝑖𝑜𝑚𝑎𝑠𝑠 𝑖𝑛𝑖𝑡𝑖𝑎𝑙 (𝑔)
𝑁𝑢𝑚𝑏𝑒𝑟 𝑜𝑓 𝑓𝑖𝑠ℎ 231
Specific Growth Rate (SGR): 232
𝑆𝐺𝑅 = (𝑙𝑛𝑊1 − 𝑙𝑛𝑊0
𝑡) × 100 233
Thermal Growth Rate (TGC): 234
𝑇𝐺𝐶 = (√𝑊13
− √𝑊03
(𝑡 × 𝑇)) × 100 235
where W1 is the group’s average weight at each timepoint of the feeding trial (g) and W0 is 236
the group’s average initial weight (g). T is the water temperature (°C) and t is the duration 237
of the experiment (number of days). 238
2.10. Proximate composition analysis 239
Cross-section samples obtained as described at the end of the Section 2.1 were stored frozen 240
and then thawed prior to analysis. Feeds were homogenised prior to the analysis. Dry matter 241
and moisture were determined according to standard methods (AOAC 1990) by oven drying 242
of both homogenised feeds and pooled body cross-sections, for 16 h at constant weight. After 243
drying the pooled cross-sections were homogenised and used for ash, crude protein, crude 244
lipid and elemental determination. Pulverised body cross-section and feed samples were 245
ashed in a muffle furnace at 550°C according to (AOAC 1990). Crude protein was estimated 246

11
by the Kjeldahl method using the Tecator Kjeltec System (AOAC 1990) and crude fat was 247
determined using Soxhlet extraction with chloroform: methanol (2:1 v/v) (Christie 2003). 248
Minerals and phosphorus from homogenised feed and dried body cross-section pools were 249
determined using inductively coupled plasma mass spectroscopy, ICP-MS with collision cell 250
technology (CCT) (Thermo X Series 2). One hundred milligrams of pooled body cross-251
section homogenates were added to Teflon digestion tubes with 5 ml of 69 % nitric acid. The 252
tubes were then put into a microwave digester (Mars Fish digester) for the initiation of the 253
digestion process (Step 1: 21-190°C for 10 min at 800 W; Step 2: 190°C for 20 min at 800 254
W; Step 3: 190-21°C for 30 min cooling period). Samples from digestion tubes were then 255
poured into 10 ml volumetric flasks and made up to 10 ml with the addition of distilled water. 256
Four hundred µl of the diluted digested material were poured into another plastic 10 ml 257
sample tube and made up to a final volume of 10 ml with distilled water prior to measuring 258
the elemental concentration within pooled dried carcass and bone homogenates using ICP-259
MS. Mineral concentration was calculated as µg × g-1 using the following equation: 260
𝐸𝑙𝑒𝑚𝑒𝑛𝑡𝑎𝑙 𝑐𝑜𝑛𝑐𝑒𝑛𝑡𝑟𝑎𝑡𝑖𝑜𝑛 (µ𝑔
𝑔) =
𝑆𝑎𝑚𝑝𝑙𝑒 𝑣𝑜𝑙𝑢𝑚𝑒 (𝑚𝑙)
1000×
𝑅𝑒𝑠𝑢𝑙𝑡 𝑓𝑟𝑜𝑚 𝐼𝐶𝑃
𝑆𝑎𝑚𝑝𝑙𝑒 𝑤𝑒𝑖𝑔ℎ𝑡 (𝑔) 261
Dietary phytic acid-bound P levels were estimated using a Megazyme Phytate/Total 262
Phosphorus Assay kit (Megazyme, Ireland). After estimating the % of P bound to phytic acid 263
from the total amount of P in the diet using the kit, the concentration of P bound to phytic 264
acid and the amount of phytic acid were extrapolated from the concentration of P estimated 265
via ICP/MS. 266
2.11. Statistics 267
Growth trajectories based on the mean weight estimates at Day 36/prior vaccination, Day 268
63/prior vaccination and Day 97/ 34 days post vaccination were modelled as repeated 269
measures (Crampton et al. 2010; Espe et al. 2012). Growth performance indices (mean daily 270

12
weight gain, SGR and TGC) were also assessed in a similar manner. Moreover, a hierarchical 271
(multilevel) statistical model was used for body cross-sections composition, haematological 272
and composition data from each tank, since multiple observations from a single tank were 273
available (several pools) (Espe et al. 2012; Nanton et al. 2012; Hartviksen et al. 2014). The 274
statistical analysis was carried out with the help of the R language (R Core Development 275
Team 2014) and its lme4 package (Bates et al. 2014). The statistical approach applied was 276
model-based. This means that to find if any specific effect was statistically significant data 277
were fitted in three different models with increasing complexity where tank was included as 278
a random effect, sampling time as a categorical variable and the percentage of protein from 279
SPC as a continuous factor possibly having non-linear effects: 280
1. a model with only sampling time (Tank considered as a random effect). 281
2. a model with sampling time and % protein from SPC with their interaction (Tank 282
considered as a random effect). 283
3. a model as above but with an additional quadratic effect of % protein from SPC with 284
interactions to reveal any non-linearity in the response (Tank considered as a random 285
effect). 286
The three models were nested and compared with a likelihood ratio test (LRT) that evaluated 287
if the improvement in the likelihood required a more complex model or whether the simpler 288
model could be applied. Models demonstrating possibilities (P values) < 0.05 were selected 289
for the description of data. The simplest possible model was adopted according to Occam's 290
razor principle. The adopted model was demonstrated by plotting the expected mean 291
response with 95% confidence intervals. For a categorical effect these were represented as 292
points with error bars and for a continuous effect as a curve with shaded confidence region. 293
The expected mean and 95% confidence intervals were solved by a posterior simulation from 294

13
the adopted statistical model (n=1500 random draws were used throughout this study) 295
(Gelman and Hill 2007). 296
3. Results 297
3.1. Growth performance 298
The mortalities among the four experimental groups of Atlantic salmon were negligible 299
(<1%) for all groups (Table 2). Fig. 1 demonstrates the weight development of the four 300
dietary groups of Atlantic salmon. The models with the linear effect of the dietary percentage 301
of protein from SPC were favoured using the LRTs (likelihood ratio tests) for both expected 302
mean weight of salmon and expected mean daily weight gain (WG) (Statistical models are 303
presented in Fig. 2A and 2B). The expected mean values of the aforementioned growth 304
parameters with their estimated 95% confidence intervals (C.I.) are presented with different 305
colour for each timepoint or period respectively. More specifically the black line (expected 306
mean values) and its corresponding shaded region (estimated 95 % C.I.) represents the 307
expected mean weight values for Day 36 and the expected mean WG for the pre vaccination 308
period from Day 0 to Day 36. The values in red represent the mean weight estimates for Day 309
63 and the expected mean daily WGs for the pre-vaccination period from Day 36 to Day 63, 310
while values in blue demonstrate the corresponding values for Day 97 and the post 311
vaccination period, from Day 63 (day of vaccination) to Day 97 (34dpv). Overall, increasing 312
SPC levels resulted in lower mean weight and daily WG in Atlantic salmon juveniles at all 313
timepoints of the study. Approximate reductions of 12 and 10% in expected mean weight 314
were observed in SPC80 compared to SPC35 salmon at Day 36 and 63 of the feeding trial 315
respectively, while an 8% reduction in weight was demonstrated at Day 97 (34dpv) between 316
the two dietary groups (Fig. 2A). Moreover, SPC65 and SPC80 salmon exhibited 317
significantly lower mean weights compared to the SPC35 group at all timepoints. In a similar 318
manner, the reduction in daily WG observed in the high SPC inclusion dietary groups was 319

14
improved at post-vaccination compared to the SPC35 group. This could be observed by the 320
slope of the WG curve for the post-vaccination period when 8% reduction in WG for SPC80 321
compared to SPC35 salmon was recorded. This slope was much shallower compared to the 322
slopes obtained for the pre-vaccination periods, when 17 and 10% reduction in WG in SPC80 323
compared to SPC35 salmon was observed (Fig. 2B). Overall, SPC65 and SPC80 salmon 324
demonstrated significantly lower mean daily WG compared to the SPC35 group, for the first 325
(Day 0 –Day 63) and second (Day 63 – Day 97) period of the feeding trial while no 326
differences were noted for the last bit of the study, further supporting the improved 327
performance of fish receiving higher SPC levels compared to the SPC35 group. SGR and 328
TGC values for the experimental groups did not present significant differences among the 329
four dietary groups and were only affected by the study period and the developmental stage 330
of the fish. Overall, Atlantic salmon experienced the highest SGR and TGC values during 331
the first part of the study, while the lowest values were demonstrated at the last part of the 332
study and after the vaccination of the fish, while intermediate SGRs and TGCs were 333
exhibited for the second period of the study. 334
3.2. Proximate and elemental composition of pooled body cross-sections 335
No differences due to the inclusion of SPC in the feeds were demonstrated among dietary 336
groups of salmon in terms of lipid, protein and moisture concentrations; whereas a linear 337
reduction in body cross-section ash levels both prior to vaccination (Day 63) and at 34 dpv 338
(Day 97) was demonstrated in salmon fed on high dietary levels of SPC (Model is plotted in 339
Fig. 3A). Overall, moisture, lipid and protein concentrations were only affected by time. 340
Expected ash values in salmon juveniles were affected linearly by the increased inclusion of 341
SPC in the diets with the SPC80 group demonstrating a 13% decrease in credible ash content 342
compared to SPC35 salmon at Day 63. Lower ash levels were demonstrated at Day 97 (34 343
dpv) for all dietary groups. However, the groups receiving lower levels of dietary protein 344

15
from SPC were the ones demonstrating the highest reduction in body cross-section ash 345
levels. A 5% reduction in expected ash concentration was demonstrated in SPC80 compared 346
to the SPC35 salmon at Day 97. 347
Expected calcium to phosphorus (Ca:P) ratio, calcium (Ca), phosphorus (P), 348
manganese (Mn) and zinc (Zn) levels in pooled body cross-section samples were affected 349
in a linear fashion by increasing levels of dietary SPC, since the model with linear description 350
of the data was found to describe the data in a better manner compared to the other two 351
models (Models selected are presented in Fig. 3B, 3C, 3D, 4B and 4C). Therefore the dietary 352
groups receiving feeds with higher levels of SPC inclusion exhibited lower amounts of the 353
abovementioned elements. On the other hand, the model showing a quadratic effect of the 354
percentage of dietary SPC, improved the fit over the linear model for body cross-section 355
expected Mg levels (Model selected is plotted in Fig. 4A). Overall, at Day 63, SPC35 salmon 356
demonstrated significantly higher Ca: P ratio, Ca, P and Mg concentrations than the SPC50, 357
SPC65 and SPC80 groups and higher amounts of Zn and Mn in comparison to the SPC65 358
and SPC80 groups. 359
In general, lower body cross-sectional elemental amounts were demonstrated for all 360
dietary groups at Day 97 (34 dpv) compared to Day 63 (prior to vaccination). At this 361
timepoint significantly lower Ca: P ratio, Ca, P and Zn concentrations were recorded for 362
SPC65 and SPC80 salmon compared to the SPC35 group. Despite the observed reduction in 363
body cross-section elemental concentrations at Day 97 compared to Day 63, an overall 364
improvement in expected Ca:P ratio, Ca, P, Mg and Mn was demonstrated from the modelled 365
based statistical analysis in vaccinated salmon receiving increased dietary SPC. This was 366
apparent from the slope connecting the expected mean values for the dietary groups at this 367
timepoint (blue lines in Fig. 3B, 3C, 3D, 4A and 4C) which was much shallower compared 368
to Day 63 and the fact that SPC35 salmon was the group demonstrating the greatest reduction 369

16
for all elements except Zn compared to the other groups. Expected Zn was the only mineral 370
with no marked improvement in the body cross-sections of Atlantic salmon fed increasing 371
dietary SPC-inclusions, at Day 97 (34dpv). 372
3.3. Haematological and Immunological responses 373
Haematocrit declined with increasing dietary proportions of SPC at all time-points 374
(Modelled response is presented in Fig.5A). Significant differences were demonstrated 375
between SPC80 compared to SPC35 salmon prior vaccination/PBS injection (since the 376
expected confidence intervals given with the shaded regions for each treatment are 377
overlapping with the expected mean values of the four groups). Overall lower haematocrits 378
were obtained at 7 dpv. The decrease in haematocrit values with increasing SPC inclusion 379
was much more noticeable at 7 dpv compared to the other sampling dates. At 7dpv, 380
haematocrit decreased significantly in the SPC50, SPC65 and SPC80 groups compared to 381
SPC35 salmon. At 34dpv despite the slight increment in haematocrit values exhibited in the 382
former groups, salmon receiving diets with higher than 35% of protein from SPC 383
demonstrated significantly lower haematocrits compared to the SPC35 group. Higher 384
haematocrit levels were recorded for all groups at 34 dpv in comparison to the previous 385
timepoints. 386
Similar trends were obtained for leucocyte numbers during the two first time-points 387
(pre vac and 7 dpv) with decreasing numbers observed upon increased dietary SPC inclusion. 388
Significant differences were revealed for the SPC65 and SPC80 groups compared to SPC35 389
salmon at both timepoints, while increased leucocyte counts were demonstrated for all 390
dietary groups at 7dpv compared to pre vaccination levels. However, at 34 dpv leucocyte 391
concentrations followed the opposite pattern, demonstrating increasing numbers in salmon 392
fed diets with increasing dietary SPC inclusion (Modelled response is presented in Fig. 5B). 393
No significant differences in total leucocyte levels were recorded among the three dietary 394
17
groups of salmon at this timepoint. Regarding the expected differential leucocyte numbers, 395
lymphocytes and thrombocytes were the only types of leucocytes affected by increasing SPC 396
inclusion. Lymphocytes followed similar trends to that of total leucocytes. Prior to 397
vaccination and at 7 dpv, lymphocyte numbers exhibited a linear reduction in salmon fed 398
diets with increasing levels of SP. Significantly lower lymphocyte numbers were detected in 399
SPC50, SPC65 and SPC80 salmon compared to SPC35 salmon before the vaccination of the 400
fish. However, at 7 dpv lymphocyte numbers exhibited a slight increase in salmon fed on 401
diets with higher than 35% of total protein from SPC, whereas SPC35 salmon lymphocytes 402
presented a slight reduction. At this point significantly lower lymphocyte counts were 403
demonstrated in SPC65 and SPC80 salmon in contrast to the SPC35 group of fish. At 34 dpv 404
a linear increase in lymphocytes was observed in salmon fed with higher dietary amounts of 405
SPC (Modelled response is presented in Fig. 5C). Nonetheless, no differences on lymphocyte 406
levels were recorded among the three dietary groups at 34dpv. On the other hand, 407
thrombocytes were affected curvilinearly in salmon fed increasing amounts of SPC with 408
SPC50 and SPC65 salmon demonstrating the highest levels of thrombocytes and the SPC35 409
group having slightly higher thrombocyte numbers than SPC80 salmon, at all time- points 410
(Modelled response is presented in Fig. 5D). However, no significant differences were 411
revealed prior to and 7 dpv. Overall, thrombocytes increased upon vaccination with levels 412
peaking at 34 dpv. At this point significantly higher thrombocyte levels were demonstrated 413
for the SPC50 and SPC65 groups compared to SPC35 salmon. Increasing dietary SPC 414
inclusion had no significant effect on circulating granulocyte and monocyte levels of 415
juvenile salmon. Neutrophilic granulocytes increased after vaccination peaking up at 7 dpv, 416
while at 34 dpv the levels of these leucocytes decreased. Contrary to the results above, 417
monocytes demonstrated a gradual increase post-vaccination, showing the highest levels 34 418
dpv. 419

18
Statistical models revealed no effect of increasing dietary SPC inclusion on the 420
respiratory burst activity of both PMA-stimulated and non-stimulated HKMs. Head kidney 421
macrophages in general demonstrated increased respiratory burst activity a week after 422
vaccination and a subsequent reduction to pre-vaccination levels, at 34dpv. 423
Increasing dietary SPC inclusion in the diets of Atlantic salmon parr had no significant 424
effect on their plasma protein levels and plasma anti-protease activity. Plasma protein 425
concentrations demonstrated a sharp reduction at 7 dpv compared to pre-vaccination levels. 426
At 34 dpv plasma protein presented an increase compared to protein levels at 7 dpv. 427
Nonetheless, protein levels at this timepoint were found to be lower than pre-vaccination 428
values. Plasma anti-protease, activity on the other hand, presented a gradual decrease at the 429
post-vaccination period compared to pre-vaccination levels, with the lowest activity 430
obtained at 34dpv. Plasma specific antibody titres against A. salmonicida were only 431
measured at 34 dpv, so there was no time effect to model. Thus, the plausible statistical 432
models consisted of only the SPC inclusion effects. The likelihood comparison demonstrated 433
no effect of dietary SPC inclusion, however. 434
Increasing SPC levels in the diets had a curvilinear effect on plasma lysozyme activity, 435
total IgM levels and haemolytic activity (Modelled responses are presented in Fig. 6A, 6B 436
and 6C). At prior to vaccination, expected lysozyme activity, appeared to be higher in salmon 437
receiving the SPC50 and SPC65 dietary treatments compared to the SPC35 and SPC80 438
salmon. Significant differences were also demonstrated between the former two groups and 439
SPC35 salmon. At 7dpv a similar trend was observed, however, the levels of lysozyme 440
activity were markedly higher than prior to vaccination. At this point significantly higher 441
lysozyme activity was demonstrated for the SPC65 group of fish in contrast to SPC35 442
salmon. The pattern of lysozyme activity with respect to the level of dietary SPC inclusion 443
was the same at 34 dpv, as seen with the previous time points, however the activity was 444

19
lower than prior to vaccination. Moreover, significantly higher activity was demonstrated in 445
SPC50 and SPC65 salmon compared to the SPC35 group (Modelled response is shown in 446
Fig. 6A). Expected plasma IgM levels prior to vaccination demonstrated no differences 447
among the four dietary groups of salmon. At both post vaccination points (7dpv, 34dpv), 448
total plasma IgM concentrations were found to be significantly higher for SPC50 and SPC65 449
salmon compared to SPC35 salmon while similar levels were demonstrated for SPC35 and 450
SPC80 salmon (Modelled response is illustrated in Fig.6B). Expected haemolytic activity 451
demonstrated minor differences among the four experimental dietary groups of salmon prior 452
to and at 7 dpv. However, at 34 dpv plasma haemolytic activity presented a salient increase 453
for fish from all the dietary treatments with fish fed on medium levels of SPC inclusions 454
possessing the highest values. Significant differences were denoted for the SPC50, SPC65 455
and SPC80 groups in comparison to SPC35 salmon at 34dpv (Modelled response is shown 456
in Fig.6C). 457
4. Discussion 458
4.1. Growth 459
Phytic acid in soybean products has been proven to reduce nutrient digestibility, inhibit the 460
activity of gastrointestinal enzymes and compromise dietary intake, feed efficiency and fish 461
growth (Destandli et al., 2006; Kumar et al. 2012). Compositional analyses of the tested 462
treatments demonstrated an increase in the phytic acid concentrations upon increased dietary 463
inclusion of SPC which could explain the reductions on juvenile salmon growth performance 464
(Destandli et al. 2006). The reductions in salmon mean weight and daily WG were much 465
more evident during the first (Day 0 - Day 36) and second period (Day 36 – Day 63), prior 466
to salmon vaccination, while improved growth was observed at post vaccination, during the 467
last part of the study, indicating a slow but steady adaptation of juvenile salmon to diets with 468
increasing levels of SPC. Burr et al. (2012) noted that the growth performance of Atlantic 469

20
salmon parr fed diets in which protein was supplied from alternative protein blends improved 470
with the age of the fish, with late stage parr presenting improved growth. In the present study, 471
despite the overall reduction in mean weight, an improvement in WG was witnessed for high 472
SPC inclusion dietary salmon during the post-vaccination period. This was an indication that 473
larger size Atlantic salmon can utilise the nutrients of these diets more efficiently either due 474
to having a more developed digestive tract or due to the fact that they require a longer 475
adaptation time to accept these diets, which is in accordance with the findings of Burr et al. 476
(2012). Despite the observed significant reduction in the growth performance of the SPC80 477
compared to the SPC35 group, numerically this decrease was not substantial. Overall, weight 478
reduction in SPC80 compared to SPC35 salmon was only 8% upon completion of the study 479
and was much lower than weight differences observed in salmon fed diets entirely based on 480
different FM varieties (Anderson et al. 1997). 481
The lower WG values observed at post vaccination (Day 63-Day 97) compared to the 482
pre vaccination period from Day 36 to Day 63 (Fig. 2B), despite the longer duration and the 483
larger size of the fish at the former phase, could be attributed to the stressful nature of the 484
vaccination process reducing fish appetite and growth modulating hormones (Pickering 485
1993; Wendelaar Bonga 1997). Moreover, decreased energy expenditure for growth due to 486
immune induction is expected at post vaccination (Van Muiswinkel and Wiegertjes 1997; 487
Melingen and Wergeland 2000). 488
4.2. Body cross-sectional composition 489
To overcome any differences attributed to dietary P limitations in SPC, 30 g × kg-1 of 490
dicalcium phosphate was added in all experimental diets, exceeding the minimum reported 491
dietary P requirements for Atlantic salmon which was previously estimated at around 10-11 492
g × kg-1 (Åsgard and Shearer 1997; NRC 2011; Prabhu et al. 2013). Analysis of the diets 493
also confirmed that available P levels (total P - P bound to phytic acid) were found to be 494
21
close to the reported requirement range, from 13.4 - 10.6 g × kg-1, decreasing progressively 495
upon increased SPC inclusion (Storebakken et al. 1998). 496
Body cross-sectional proximate and elemental composition analysis revealed a linear 497
reduction in expected ash, Ca:P ratio, Ca, P, Mn, and Zn content and an overall reduction of 498
Mg in juvenile salmon fed on increasing dietary SPC levels prior to (Day 63) and 34 dpv 499
(Day 97). Estimated body cross-sectional P, Ca, Mg and Mn concentrations at Day 63 were 500
similar to the whole body contents reported by Helland et al. (2005; 2006) for healthy 501
juvenile Atlantic salmon of comparable size. Zinc levels at Day 63 were also found within 502
the range reported by Helland et al. (2006), however these values were closer to the lower 503
end of this distribution, suggesting either limitations in the use of body cross-sections for the 504
estimation of this mineral or the onset of Zn deficiency in salmon. Similarly, Ca:P ratio 505
which usually lies close to 1:1 in whole body samples was found to range from 0.8-0.9 506
suggesting reduced skeletal calcification at Day 63 (Shearer et al. 1994; Helland et al. 2006). 507
At Day 97 (34 dpv), elemental concentrations and Ca:P ratio were lower compared to the 508
first timepoint, and the whole body values previously described by Helland et al. (2005; 509
2006), which could be an indication of salmon with subclinical deficiencies for all the above 510
elements. Nonetheless, no apparent signs of elemental deficiencies were recorded for any 511
of the dietary groups of salmon such as growth reductions, increased mortalities, lens 512
cataracts, fin and skin erosions or morphological anomalies (Lall 2003). 513
Similarly to our findings, Storebakken et al. (1998) reported decreased levels of whole 514
body ash, P, Ca Mg, Zn and Ca:P ratio in salmon fed diets with 75% of dietary protein from 515
SPC and 30 g × kg-1 of supplementary dicalcium phosphate for 84 days compared to FM-516
fed salmon. Increased presence of phytic acid in diets with higher SPC content, negatively 517
affects P availability (Storebakken et al. 1998; Lall 2003), as shown by the chemical 518
compositions of the four diets used in the present study. Inadequate dietary uptake of 519
22
phosphorus might lead to the inability of the fish to retain several minerals including Ca and 520
Mg (Åsgard and Shearer 1997; Storebakken et al. 1998). In addition to that, the chelating 521
effects of this substance on positively charged ions such as Ca, Mg, Mn and Zn and the 522
formation of insoluble salts within the gut are the main reasons for the observed reduction 523
of these minerals in whole body samples (Francis et al. 2000; Lall 2003). Therefore, it is 524
suggested that increased dietary SPC inclusion in salmon diets should be combined with an 525
appropriate increment in dietary P supplementation. An alternative solution, of great 526
potential, would be the use of graded levels of phytases which are enzymes that can break 527
down phytic acid and their salts, increasing the availability of P and several other essential 528
macro- and micro-nutrients from plant feedstuffs such as SPC (Storebakken et al. 1998; 529
Cheng and Hardy 2003; Carter and Sajjadi 2011). Phytase can be applied prior pelleting or 530
onto pellets (Denstadli et al. 2007; Wang et al. 2008). However, the high processing costs, 531
the existent inconsistencies regarding the optimum doses of phytase in salmon plant based 532
feeds for the replacement of inorganic P, the inactivation of the enzyme at high temperatures 533
required for pelleting (>80°C) or certain storage temperatures and the narrow optimum pH 534
range for its activation are the main limiting factors for the current use of phytase in 535
commercial salmon feeds (Carter and Sajjadi 2011; Kumar et al. 2012). 536
The present study shows that diets with higher than 50% of dietary protein from SPC 537
require higher than 30 g × kg-1 of dicalcium phosphate supplementation in order to promote 538
both good growth and sufficient bone mineralisation. Studies on salmonids have shown that 539
diets supplemented with phosphates of a low Ca: P ratio (≤ 1) are more digestible, improving 540
the availability of P to fish (Aliphos 2012). Therefore, monocalcium or monoammonium 541
phosphates might be more appropriate inorganic P sources compared to dicalcium phosphate 542
in high plant protein inclusion diets (Aliphos 2012). Additional fortification of such diets 543
with other nutrients (vitamins or minerals) should not be excluded (Prabhu et al. 2013; 2014; 544

23
Torstensen 2014), with Zn being a predominant candidate mineral to consider for increased 545
supplementation upon increased addition of plant proteins in salmon feeds as shown by the 546
present data (Helland et al. 2006; Prabhu et al. 2014). In an era of dynamic changes in the 547
protein sources used in aqua-feeds, Atlantic salmon elemental requirements (NRC 2011), 548
should be re-assessed so that the requirements of salmon grown on diets with higher plant 549
protein inclusions are met (Prabhu et al. 2013; 2014). Hence, the assessment of elemental 550
availability from commercially applied alternative dietary protein sources and identification 551
of Atlantic salmon elemental requirements according to their growth rate and life stage, are 552
of uttermost importance in order to proportionately balance the inclusion of these nutrients 553
in their dietary premixes (Torstensen et al. 2008; Prabhu et al. 2013; 2014). 554
The reduction in body cross-sectional ash, Ca: P ratio, Ca, P, Mg, Mn, and Zn levels 555
detected at Day 97 (34 dpv) of the study compared to Day 63 (prior vaccination) seems to 556
have a multifactorial cause. Storebakken et al. (1998) stated that reductions in body 557
elemental concentrations at different production stages could be attributed to differences in 558
fish size. Vaccination with injectable oil-based vaccines can also exert a negative effect on 559
the mineral status of salmon (Berg et al. 2006; Grini et al. 2011; Berg et al. 2012). However, 560
the negative impacts of injection-vaccination on salmon skeletal mineral levels are often 561
combined with intensive culture conditions inducing faster growth (Grini et al. 2011; Fjelldal 562
et al. 2012). Herein, the primary reason for the observed elemental reductions seems to be 563
the enhanced growth performance of salmon, promoted by the application of continuous 564
light (combined with favourable temperature of ~13°C for salmon growth) and the intensive 565
feeding regime which represent the commercial reality (Kråkenes et al. 1991; Fjelldal et al. 566
2005; 2006; Stefansson et al. 2008). These conditions have led to the achievement of almost 567
double daily WG and ~1.6 greater weight in juvenile salmon compared to the study 568
performed by Helland et al. (2006), despite the fact that fish have been subjected to 569

24
vaccination during the last part of the trial. Fjelldal et al. (2006) reported that fast growing 570
Atlantic salmon post-smolts after 6 months under continuous light demonstrated lower 571
mineral content and mechanical strength in vertebral bones than slower growing salmon 572
under natural light. Rungruangsak-Torrissen et al. (2009) added that increased growth in 573
salmon by exposure to continuous light could be associated with reduced vertebral 574
mineralisation and strength. Moreover, Hernandez et al. (2000) noted that during periods of 575
fast growth, the actual time required for the bone matrix to be produced and mineralised 576
could be decreased to a critical level, resulting to under-mineralised bony tissues. This was 577
one of the proposed explanations for the higher incidence of vertebral deformities in fast 578
growing under-yearling Atlantic salmon smolts compared to slower growing yearling smolts 579
(Fjelldal et al. 2006). In addition, Stefansson et al. (2007; 2008) noted that juvenile Atlantic 580
salmon reared under constant light (as a means of blocking salmon maturation and 581
smoltification) could develop into “pseudo-smolts” exhibiting all the external changes, 582
characterising smoltifying salmon but not the physiological changes required for seawater 583
adaptation. Therefore, disturbances in ion and osmo-regulation of salmon due to “pseudo-584
smoltification” could have led to reduced elemental levels at Day 97. 585
Despite the observed decline in elemental levels at Day 97 compared to Day 63 in all 586
dietary groups, salmon fed on higher dietary SPC levels demonstrated subsidiary decrements 587
in body cross-sectional ash and elemental concentrations (Zn excluded) compared to Day 63 588
(Fig. 3, 4A & 4C). On the contrary, the decrements in body cross-sectional elemental levels 589
were much more evident in the groups fed lower dietary SPC levels, with SPC35 salmon 590
demonstrating the greatest reductions regarding ash and mineral concentrations by 591
comparison to Day 63. The improvement in elemental retention observed in salmon fed diets 592
with increasing dietary amounts of SPC could primarily be attributed to the overall delayed 593
growth performance of these groups compared to SPC35 salmon. Fjelldal et al. (2010) 594

25
reported that in the long term, high plant protein inclusion feeds could have a positive impact 595
on the skeletal health of Atlantic salmon post-smolts by delaying salmon growth. Possible 596
extension of the study could have eliminated the elemental differences among the four 597
dietary groups. In addition to the overall delayed growth, better assimilation of high SPC 598
inclusion feeds (either through improved feed intake and/or digestibility) is suggested by the 599
improvement in the growth performance (daily WG) of these groups, during the last period 600
of the study (post-vaccination period from Day 63 to Day 97) (Fig. 2B). Earlier studies 601
suggest that Atlantic salmon requires long adaptation periods in order to accept and start 602
utilising efficiently high plant protein diets, after which they might be able to compensate 603
growth and nutrient uptake (Torstensen et al. 2008; Burr et al. 2011). Moreover, according 604
to Prabhu et al. (2013; 2014), the elemental requirement for WG in farmed fish differs from 605
the requirement for proper skeletal mineralisation and these depend on both the growth rate 606
and the life stage of the fish. Herein, it was evident that during the last period of the study, 607
high SPC inclusion diets performed better by comparison to the first two periods and 608
matched more closely the elemental requirements of the fish they were allocated to, for both 609
growth and skeletal mineralisation compared to their SPC35 counterpart. 610
4.3. Haematological and Immune responses 611
For Atlantic salmon, haematocrit values, which represent the oxygen carrying capacity of 612
blood, normally range from 35 to 60 % (Hardie et al. 1990; Thompson et al. 1996). 613
Haematocrit levels were found to be within this range in the present study. Decreasing 614
haematocrit however, was observed in salmon fed diets with increasing dietary SPC protein. 615
Hemre et al. (2005) reported decreased erythrocyte size in Atlantic salmon fed diets with 616
increased protein levels from soybeans, which could explain the lower haematocrit in these 617
groups. 618

26
Increased circulatory leucocytes mainly attributed to simultaneous increments in both 619
lymphocyte and thrombocyte numbers reveal immune and haemostatic stimulation at 34 dpv 620
for all dietary groups (Nikoskelainen et al. 2007; Silva et al. 2009). Overall, the state of 621
leucocyto- and lymphocyto-penia in salmon fed increasing amounts of SPC prior to 622
vaccination and 7 dpv could be accredited to poorer nutrition of these fish caused by the 623
increasing presence of phytic acid (Fletcher 2011). Furthermore it is possible that salmon 624
fed on diets with moderate and high SPC inclusion, due reduced nutrient uptake, could have 625
exhibited suppression of various pathways including the ones involved in systemic immunity 626
and possibly haematology, utilizing most of the dietary energy for growth (Tacchi et al., 627
2012). A slow but steady reversal of this trend however, seems to occur upon vaccination 628
(at 34 dpv), with salmon fed increasing dietary SPC inclusion investing more energy on 629
immunostimulation which is revealed by the linear increase in lymphocyte numbers 630
(Nikoskelainen et al. 2007). Moreover, increased haemostatic stimulation was exhibited in 631
SPC50 and SPC65 compared to the SPC35 and SPC80 salmon, as suggested by the higher 632
thrombocyte levels (haemostasis regulating cells) recorded for these groups at 34 dpv (Silva 633
et al. 2009). The increase in granulocyte and monocyte levels at post-vaccination were in 634
accordance to earlier reports by Chin and Woo (2005) and Nikoskelainen et al. (2007), 635
demonstrating significant increases in the circulating numbers of these cells in salmonids 636
vaccinated against different pathogens. However, no differences were exhibited among the 637
dietary groups, suggesting that increasing dietary SPC does not compromise the production 638
of these cells. 639
Respiratory burst of both PMA-stimulated and naive HKMs did not appear to be 640
affected by dietary SPC inclusion. In accordance Bransden et al. (2001), reported unaffected 641
neutrophil oxygen radical production in Atlantic salmon fed on dehulled lupin meal at 40% 642
inclusion. Contrarily Burrells et al. (1999) demonstrated reduction of HKM respiratory burst 643

27
activity in rainbow trout (Oncorhynchus mykiss) fed diets with 80 % substitution of FM with 644
dehulled solvent extracted SBM. The decreased post vaccination plasma protein levels 645
observed in the dietary groups could be attributed to stress-induced reduction of fish appetite 646
(Melingen and Wergeland 2000). Nevertheless, no differences in plasma protein 647
concentrations were exhibited among the dietary groups of salmon. Reduced anti-protease 648
activity have been reported in salmon after vaccination or infection via intra-peritoneal 649
injection (Secombes and Olivier 1997), which is in agreement with the present findings. 650
Similarly to plasma protein levels, no differences in anti-protease activity were exhibited 651
among the groups. Unaffected anti-protease activity in Atlantic salmon fed on diets with 652
40% substitution of FM with dehulled lupin meal has been reported by Brandsen et al. 653
(2001). Unaltered lysozyme activity has been previously demonstrated in rainbow trout fed 654
with up to 100 % of dietary protein from plant derived feedstuffs (Jalili et al. 2013). On the 655
contrary, higher lysozyme activity was recorded in SPC50 and SPC65 salmon at all 656
timepoints while higher levels of total IgM were revealed at both timepoints post vaccination 657
compared to SPC35 salmon. In accordance to the present results, Rumsey et al. (1994) 658
reported increased lysozyme activity in rainbow trout fed SBM diets. Increased circulatory 659
total IgM levels, are expected after salmon vaccination explaining the higher amounts at 7 660
and 34 dpv (Melingen and Wergeland 2000). Superior lysozyme activity in SPC50 and 661
SPC65 salmon suggests stimulation of the cellular part of immunity and could be a 662
favourable trait against disease outbreaks (Waagbø et al. 1993; Krogdahl et al. 2000). 663
Moreover, increased circulating total IgM levels at post vaccination for the aforementioned 664
groups could improve the effectiveness of vaccination conferring higher protection against 665
diseases (Krogdahl et al. 2000). 666
Plasma haemolytic activity as a consequence of the activation of complement factors 667
(from both alternative and classical pathways) and/or other substances such as lectins and 668

28
haemolysins (Alexander and Ingram, 1992) was not affected linearly by increasing dietary 669
SPC levels. Prior to and 7 dpv, salmon from different dietary groups exhibited no differences 670
in plasma haemolytic activity. Sitja-Bobadilla et al. (2005) and Jalili et al. (2013) reported 671
decreased alternative complement activity in gilthead sea bream (Sparus aurata) and 672
rainbow trout respectively, fed diets with 70 % protein from plant derived products. The 673
former study however, exhibited an enhancement of alternative complement activity in 674
gilthead sea bream fed 50 % of protein from vegetal ingredients. At 34 dpv, there was a 675
marked increase of haemolytic activity in fish from all the dietary treatments with SPC50, 676
SPC65 and SPC80 salmon exhibiting higher activity than SPC35 salmon suggesting higher 677
immunostimulation of these groups at 34 dpv while highlighting dietary modifications that 678
were not evident prior to vaccination (Thompson et al. 1996; Nikoskelainen et al. 2002). 679
4. Conclusions 680
In conclusion, increasing substitution of high quality FM with SPC at a percentage beyond 681
35% of dietary protein reduced the growth performance and body cross-sectional elemental 682
concentrations and enhanced several humoral immune responses of juvenile Atlantic 683
salmon. Diets with 50% of protein from SPC, appropriate supply of lysine, methionine and 684
threonine and 30 g × kg-1 of P promoted similar growth and elemental composition to a 685
control diet with 35 % of protein from SPC, mimicking commercial salmon formulations. 686
Body cross-sectional elemental reductions due to the increasing dietary SPC levels, observed 687
during the initial 63-day period, were improved at Day 97 (34 dpv). This seems to be both 688
an effect of the long term provision of juvenile salmon with increasing dietary SPC levels or 689
an interaction of these diets with vaccination. Moreover, it was shown that exposure of 690
Atlantic salmon to continuous light, intensive feeding regimes and vaccination may result in 691
elemental deficiencies rendering developing salmon susceptible to skeletal deformities or 692
diseases. Under these conditions slow growing salmon fed on high SPC inclusion feeds can 693

29
match their elemental requirements for both growth and bone mineralisation more efficiently 694
than the faster growing SPC35 fish. Lastly the use of body cross-sections appears to be 695
promising for the assessment of salmon elemental status, however validation studies are 696
required to demonstrate the correlation between whole body and body cross-sectional 697
compositions, from fish reared under the same conditions. While P involvement on growth 698
and mineral retention in fish is well documented, the implication of P in fish immunity is not 699
clear (Lall 2003). However, P could affect immunity either directly by supplying the energy 700
required for immunological stimulation, or indirectly by influencing the digestion of other 701
dietary elements including Zn, Mg or Ca, modulating important immune responses (Lall 702
2003; Kiron 2012). It is proposed that higher supplementation of P (> 30 g×kg-1) and several 703
other nutrients (e.g. minerals and vitamins) in diets with 65 % or over of protein from SPC 704
could improve salmon growth, elemental retention and prevent potential compromises in 705
immune responses. Further studies are required to assess the effect of high SPC inclusion 706
diets on these aspects and whether the observed increments in immunological responses are 707
translated into increased disease resistance. 708
Acknowledgments 709
This study was financially supported by the University of Stirling and EWOS Innovation. 710
The authors would like to thank Mr. Graeme McWhinnie and Mr. William Struthers from 711
the Institute of Aquaculture, University of Stirling for their technical assistance in proximate 712
and elemental composition analyses. We would also like to thank the technical staff of 713
EWOS Innovation for the feed manufacture, the performance of the feeding trial and their 714
assistance during the samplings. 715
REFERENCES 716
Alexander JB, Ingram GA (1992) Noncellular nonspecific defence mechanisms of fish. Annu Rev 717 Fish Dis 2: 249–279. 718

30
Aliphos (2012) The role of Phosphorus for Salmonids. Talk. Feed Ingredients. Feed Ingredients news 719 from Aliphos pp. 1–6. 720
Anderson, JS, Higgs DA, Beames RM, Rowshandeli M (1997) Fish meal quality assessment for 721 Atlantic salmon (Salmo salar L.) reared in sea water. Aquac Nutr 3: 25–38. 722
AOAC (1990) Official Methods of Analysis of the AOAC, Fifteenth. ed. AOAC International, 723 Washington DC. 724
Åsgard T, Shearer KD (1997) Dietary phosphorus requirement of juvenile Atlantic salmon, Salmo 725 salar L. Aquac. Nutr. 3: 17–23. 726
Aunsmo A, Guttvik A, Midtlyng PJ, Larssen RB, Evensen O, Skjerve E (2008) Association of spinal 727 deformity and vaccine-induced abdominal lesions in harvest-sized Atlantic salmon, Salmo 728 salar L. J. Fish Dis. 31, 515–524 729
Baeverfjord G, Åsgård T, Shearer KD (1998) Development and detection of phosphorus deficiency 730 in Atlantic salmon, Salmo salar L., parr and post-smolts. Aquac Nutr 4: 1–11. 731
Bates D, Maechler M, Bolker B, Walker S (2014) lme4: Linear mixed-effects models using Eigen 732 and S4. R package version 1 (4) 733
Berg A, Fjelldal PG, Hansen T (2005) Vaccination strategy influence growth of the vertebral column, 734 In: Waagbø R, Kryvi H, Breck O, Ørnsrud R (Eds.), Final Report from Workshop on Bone 735 Deformities in Salmon and Cod. NIFES, Bergen, pp. 30. 736
Berg A, Rødseth OM, Tangerås A, Hansen T (2006) Time of vaccination influences development of 737 adhesions, growth and spinal deformities in Atlantic salmon Salmo salar. Dis Aquat Organ 738 69: 239–48. 739
Berg A, Yurtseva A, Hansen T, Lajus D, Fjelldal PG (2012) Vaccinated farmed Atlantic salmon are 740 susceptible to spinal and skull deformities. J. Appl. Ichthyol. 28, 446–452. 741
Berrill IK, Porter MJR, Smart A, Mitchell D, Bromage NR (2003) Photoperiodic effects on 742
precocious maturation, growth and smoltification in Atlantic salmon, Salmo salar. 743
Aquaculture 222: 239-252. 744
Bransden MP, Carter CG, Nowak BF (2001) Effects of dietary protein source on growth, immune 745 function, blood chemistry and disease resistance of Atlantic salmon (Salmo salar L.) parr. 746 Anim Sci 73:105 – 113. 747
Bromage N, Porter M, Randall C (2001) The environmental regulation of maturation in farmed 748 finfish with special reference to the role of photoperiod and melatonin. Aquaculture 197: 63-749 98. 750
Burrells C, Williams PD, Southgate PJ, Crampton VO (1999) Immunological, physiological and 751 pathological responses of rainbow trout (Oncorhynchus mykiss) to increasing dietary 752 concentrations of soybean proteins. Vet Immunol Immunopathol 72: 277–288. 753
Burr GS, Wolters, WR, Barrows FT, Hardy RW (2012) Replacing fishmeal with blends of alternative 754 proteins on growth performance of rainbow trout (Oncorhynchus mykiss), and early or late 755 stage juvenile Atlantic salmon (Salmo salar). Aquaculture 334-337: 110–116. 756

31
Carter CG, Sajjadi M (2011) Low fishmeal diets for Atlantic salmon, Salmo salar L., using soy 757 protein concentrate treated with graded levels of phytase. Aquacalture International 19: 431–758 444. 759
Cheng ZJ, Hardy RW (2003) Effects of extrusion and expelling processing, and microbial phytase 760 supplementation on apparent digestibility coefficients of nutrients in full-fat soybeans for 761 rainbow trout (Oncorhynchus mykiss). Aquaculture 218: 501–514. 762
Chin A, Woo PTK (2005) Innate cell-mediated immune response and peripheral leukocyte 763 populations in Atlantic salmon, Salmo salar L., to a live Cryptobia salmositica vaccine. 764 Parasitol Res 95: 299–304. 765
Christie WW (2003) Isolation, separation, identification and structural analysis of lipids, in: Christie 766 WW, Han X (Eds.), Lipid Analysis. The Oily Press, High Wycombe, pp. 91–102. 767
Crampton, VO, Nanton DA, Ruohonen K, Skjervold P-O, El-Mowafi AFA (2011) Demonstration of 768 salmon farming as a net producer of fish protein and oil. Aquac Nutr 16: 437–446. 769
Denstadli V, Skrede A, Krogdahl Å, Sahlstrømd S, Storebakken T (2006). Feed intake, growth, feed 770 conversion, digestibility, enzyme activities and intestinal structure in Atlantic salmon (Salmo 771 salar L.) fed graded levels of phytic acid. Aquaculture 15: 365–376. 772
Denstadli V, Storebakken T, Svihus B, Skrede A (2007) A comparison of online phytase pre-773 treatment of vegetable feed ingredients and phytase coating in diets for Atlantic salmon (Salmo 774 salar L.) reared in cold water. Aquaculture, 269: 414–426. 775
Drew MD, Borgeson TL, Thiessen DL (2007) A review of processing of feed ingredients to 776 enhance diet digestibility in finfish. Anim Feed Sci Technol 138: 118–136. 777
Escaffre A-M, Kaushik S, Mambrini M (2007) Morphometric evaluation of changes in the digestive 778 tract of rainbow trout (Oncorhynchus mykiss) due to fish meal replacement with soy protein 779 concentrate. Aquaculture 273: 127–138. 780
Espe M, Ruohonen K, El-Mowafi A (2012) Effect of taurine supplementation on the metabolism and 781 body lipid-to-protein ratio in juvenile Atlantic salmon (Salmo salar) Aquac Res: 43: 349–360. 782
FAO (2015) Oilseeds, oils and Meals monthly price and policy update (MPPU) issue No. 75. Food 783 and Agriculture Organization of the United Nations, Rome, Italy, pp. 1-6. 784
Fjelldal PG, Grøtmol S, Kryvi H, Gjerdet NR, Taranger GL, Hansen T, Porter MJR, Totland GK 785 (2004) Pinealectomy induces malformation of the spine and reduces the mechanical strength 786 of the vertebrae in Atlantic salmon, Salmo salar . J Pineal Res 36: 132–139. 787
Fjelldal PG, Hansen T, Breck O, Ørnsrud R, Lock E-J. Waagbø R, Wargelius A, Eckhard Witten P 788 (2012) Vertebral deformities in farmed Atlantic salmon (Salmo salar L.) - etiology and 789 pathology. J Appl Ichthyol 28: 433–440. 790
Fjelldal PG, Lock E-J, Grøtmol S, Totland GK, Nordgarden U, Flik G, Hansen T (2006) Impact of 791 smolt production strategy on vertebral growth and mineralisation during smoltification and the 792 early seawater phase in Atlantic salmon (Salmo salar , L.). Aquaculture 261: 715–728. 793

32
Fjelldal PG, Nordgarden U, Berg A, Grøtmol S, Totland GK, Wargelius A, Hansen T (2005) 794 Vertebrae of the trunk and tail display different growth rates in response to photoperiod in 795 Atlantic salmon, Salmo salar L., post-smolts. Aquaculture 250: 516–524. 796
Fjelldal PG, Nordgarden U, Wargelius A, Taranger GL, Waagbø R, Olsen RE (2010) Effects of 797 vegetable feed ingredients on bone health in Atlantic salmon. J Appl Ichthyol 26: 327–333. 798
Fletcher TC (2011) Dietary effects on stress and health. In: Iwama GK, Pickering AD, Sumpter JP, 799 Schreck CB (Eds.). Fish Stress Heal. Aquac., Cambridge University Press, Cambridge, UK, 800 pp. 223–260. 801
Francis G, Makkar HP, Becker K (2001) Antinutritional factors present in plant-derived alternate 802 fish feed ingredients and their effects in fish. Aquaculture 199: 197–227. 803
Gelman A, Hill J (2007) Data Analysis Using Regression and Multilevel/Hierarchical Models. 804 Cambridge University Press: New York, NY pp. 625. 805
Grini A, Hansen T, Berg A, Wargelius A, Fjelldal PG (2011) The effect of water temperature on 806 vertebral deformities and vaccine-induced abdominal lesions in Atlantic salmon, Salmo salar 807 L. J Fish Dis 34: 531–546. 808
Hardie LJ, Fletcher TC, Secombes CJ (1990) The effect of vitamin E on the immune response of the 809 Atlantic salmon (Salmo salar L.). Aquaculture 87: 1–13. 810
Hartviksen M, Vecino JLG, Ringø E, Bakke A-M, Wadsworth S, Krogdahl Ǻ Ruohonen K, Kettunen 811 A (2014) Alternative dietary protein sources for Atlantic salmon (Salmo salar L.) effect on 812 intestinal microbiota, intestinal and liver histology and growth. Aquac Nutr 20: 381-398. 813
Helland S, Denstadli V, Witten PE, Hjelde K, Storebakken T, Skrede A, Åsgård T, Baeverfjord G 814 (2006) Hyper dense vertebrae and mineral content in Atlantic salmon (Salmo salar L.) fed 815 diets with graded levels of phytic acid. Aquaculture 261: 603–614. 816
Helland S, Refstie S, Espmark Å, Hjelde K, Baeverfjord G (2005) Mineral balance and bone 817 formation in fast-growing Atlantic salmon parr (Salmo salar) in response to dissolved 818 metabolic carbon dioxide and restricted dietary phosphorus supply. Aquaculture 250: 364–819 376. 820
Hernandez CJ, Beaupré GS, Carter DR (2000) A model of mechanobiologic and metabolic influences 821 on bone adaptation. J Rehabil Res Dev 37: 235–244. 822
Jalili R, Tukmechi A, Agh N, Noori F, Ghasemi A (2013) Replacement of dietary fish meal with 823 plant sources in rainbow trout (Oncorhynchus mykiss); effect on growth performance, immune 824 responses, blood indices and disease resistance. Iran J Fish Sci 12: 577–591. 825
Kiron V (2012) Fish immune system and its nutritional modulation for preventive health care. Anim 826 Feed Sci Technol 173:111–133. 827
Korkea-aho TL, Heikkinen J, Thompson KD, von Wright A, Austin B (2011) Pseudomonas sp. 828 M174 inhibits the fish pathogen Flavobacterium psychrophilum. J Appl Microbiol 111:266–829 277Kissil GW, Lupatsch I, Higgs DA, Hardy RW (2000) Dietary substitution of soy and 830 rapeseed protein concentrates for fish meal, and their effects on growth and nutrient utilisation 831 in gilthead seabream Sparus aurata L. Aquac Res 31: 595–601. 832

33
Kråkenes R, Hansen T, Stefansson SO, Taranger GL (1991) Continuous light increases growth rate 833 of Atlantic salmon (Salmo salar L.) postsmolts in sea cages. Aquaculture 95: 281–287. 834
Krogdahl A, Bakke-McKellep AM, Røed KH, Baeverfjord G (2000) Feeding Atlantic salmon Salmo 835 salar L. soybean products: effects on disease resistance (furunculosis), and lysozyme and IgM 836 levels in the intestinal mucosa. Aquac Nutr 6:77–84. Lall SP (2003) The minerals, in: Halver, 837 J.E., Hardy, R.W. (Eds.), Fish Nutrition. Elsevier, San Diego, CA, pp. 259–308. 838
Kumar V, Sinha AK, Makkar HPS, Becker K (2012) Dietary roles of phytate and phytase in human 839 nutrition: A review. Food Chem 120(4): 945-959. 840
Lall SP (2003) The minerals, in: Halver, J.E., Hardy, R.W. (Eds.), Fish Nutrition. Elsevier, San 841 Diego, CA, pp. 259–308. 842
Mambrini M, Roem AJ, Carvèdi JP, Lallès JP, Kaushik SJ (1999) Effects of replacing fish meal with 843 soy protein concentrate and of DL-methionine supplementation in high-energy, extruded diets 844 on the growth and nutrient utilisation of rainbow trout, Oncorhynchus mykiss. J Anim Sci 77: 845 2990–2999. 846
Melingen GO, Wergeland HI (2000) Serum protein and IgM profiles in connection with the smolting 847 and vaccination of out-of-season Atlantic salmon (Salmo salar L.). Aquaculture 188: 189–848 201. 849
Nanton DA, Ruohonen K, Robb DHF, El-Mowafi A, Hrtnell GF (2012) Effect of soy oil containing 850 stearidonic acid on growth performance and fillet fatty acid composition of Atlantic salmon. 851 Aquac Nutr 18: 640-650. 852
Nikoskelainen S, Lehtinen J, Lilius EM (2002) Bacteriolytic activity of rainbow trout (Oncorhynchus 853 mykiss) complement. Dev Comp Immunol 26: 797–804. 854
Nikoskelainen S, Verho S, Järvinen S, Madetoja J, Wiklund T, Lilius E-M (2007) Multiple whole 855 bacterial antigens in polyvalent vaccine may result in inhibition of specific responses in 856 rainbow trout (Oncorhynchus mykiss). Fish Shellfish Immunol 22: 206–217. 857
NRC (2011) Nutrient Requirements of Fish and Shrimp. National Research Council. The National 858 Academies Press, Washington, D.C. 859
Øverland M, Sørensen M, Storebakken T, Penn M, Krogdahl Å, Skrede A (2009) Pea protein 860 concentrate substituting fish meal or soybean meal in diets for Atlantic salmon (Salmo 861 salar)—Effect on growth performance, nutrient digestibility, carcass composition, gut health, 862 and physical feed quality. Aquaculture 288: 305–311. 863
Pickering AD (1993) Growth and stress in fish production. Aquaculture 111: 51–63. 864
Poppe TT, Koppang EO (2014) Side-Effects of Vaccination, in: Gudding, R., Lillehaug, A., Evensen, 865 Ø. (Eds.), Fish Vaccination. John Wiley & Sons, Ltd, Chichester, UK, pp. 153–161. 866
Prabhu PAJ, Schrama JW, Kaushik SJ (2013) Quantifying dietary phosphorus requirement of fish –867 a meta-analytic approach. Aquaculture Nutrition 19: 233–249. 868
Prabhu PAJ, Schrama JW, Kaushik SJ (2014) Mineral requirements of fish: a systematic review. 869 Reviews in Aquaculture 6: 1–48. 870

34
R Core Development Team (2014) R: a language and environment for statistical computing | 871 GBIF.ORG [WWW Document]. URL http://www.r-project.org. (accessed 11.17.14) 872
Refstie S, Storebakken T, Baeverfjord G, Roem AJ (2001) Long-term protein and lipid growth of 873 Atlantic salmon (Salmo salar) fed diets with partial replacement of fish meal by soy protein 874 products at medium or high lipid level. Aquaculture 193: 91–106. 875
Refstie, S., Storebakken, T., Roem, A.J., 1998. Feed consumption and conversion in Atlantic salmon 876 (Salmo salar) fed diets with fish meal, extracted soybean meal or soybean meal with reduced 877 content of oligosaccharides, trypsin inhibitors, lectins and soya antigens. Aquaculture 162, 878 301–312. 879
Riche M, Garling DL (2004) Effect of phytic acid on growth and nitrogen retention in tilapia 880 Oreochromis niloticus L. Aquac Nutr 10: 389–400. 881
Rumsey GL, Siwicki AK, Anderson DP, Bowser PR (1994) Effect of soybean protein on serological 882 response, non-specific defense mechanisms, growth, and protein utilization in rainbow trout. 883 Vet Immunol Immunopathol 41: 323–339. 884
Rungruangsak-Torrissen K, Sunde J, Berg AE, Nordgarden U, Fjelldal PG, Oppedal F (2009) 885 Digestive efficiency, free amino acid pools and quality of growth performance in Atlantic 886 salmon (Salmo salar L.) affected by light regimes and vaccine types. Fish Physiol Biochem 887 35: 255–272. 888
Secombes CJ, Olivier G (1997) Host-pathogen interactions in salmonids. In: Bernoth EM, Ellis A, 889 Midtlyng P, Olivier G, Smith P (Eds.). Furunculosis, Academic Press, New York, NY, pp. 890 269–296. 891
Shearer KD, Åsgard T, Andorsdottir G, Aas GH (1994) Whole body elemental and proximate 892 composition of Atlantic salmon (Salmo salar) during the life cycle. J Fish Biol 44: 785–797. 893
Silva BC, Martins ML, Jatobá A, Buglione Neto CC, Vieira FN, Pereira GV, Jerônimo GT, Seiffert 894 WQ, Mouriño JLP (2009) Hematological and immunological responses of Nile tilapia after 895 polyvalent vaccine administration by different routes. Pesqui Veterinária Bras 29: 874–880. 896
Sirimanapong W, Thompson KD, Kledmanee K, Thaijongrak P, Collet B, Ooi EL, Adams A (2014) 897 Optimisation and standardisation of functional immune assays for striped catfish 898 (Pangasianodon hypophthalmus) to compare their immune response to live and heat killed 899 Aeromonas hydrophila as models of infection and vaccination. Fish Shell Immun 40(2): 374-900 383. 901
Sitjà-Bobadilla A, Peña-Llopis S, Gómez-Requeni P, Médale F, Kaushik S, Pérez-Sánchez J (2005) 902 Effect of fish meal replacement by plant protein sources on non-specific defence mechanisms 903 and oxidative stress in gilthead sea bream (Sparus aurata). Aquaculture 249:387–400. 904
Stefansson SO, Bjornsson, BT, Ebbesson LOE, McCormick SD (2008) Smoltification, In: Finn RN, 905 Kapoon BG (Eds.). Fish Larval Physiology. Science Publishers, Enfield, NH, USA, pp. 639-906 681. 907
Stefansson SO, Björnsson BT, Hansen T, Haux C, Tarange, GL, Saunders RL (1991) Growth, parr-908 smolt transformation, and changes in growth hormone of Atlantic salmon reared under 909 different photoperiods. Can J Fish Aquat Sci 48: 2100-2108. 910
http://www.ncbi.nlm.nih.gov/pubmed/?term=Thompson%20KD%5BAuthor%5D&cauthor=true&cauthor_uid=25064539

35
Stefansson SO, Nilsen TO, Ebbesson LOE, Wargelius A, Madsen SS, Björnsson, BT, McCormick 911 SD (2007) Molecular mechanisms of continuous light inhibition of Atlantic salmon parr–smolt 912 transformation. Aquaculture 273: 235–245. 913
Storebakken T, Shearer K, Roem A (1998) Availability of protein, phosphorus and other elements in 914 fish meal, soy-protein concentrate and phytase-treated soy-protein-concentrate-based diets to 915 Atlantic salmon, Salmo salar. Aquaculture 161: 365–379. 916
Storebakken T, Shearer KD, Roem AJ (2000) Growth, uptake and retention of nitrogen and 917 phosphorus, and absorption of other minerals in Atlantic salmon Salmo salar fed diets with 918 fish meal and soy-protein concentrate as the main sources of protein. Aquac Nutr 6: 103–108. 919
Tacchi L, Secombes CJ, Bickerdike R., Adler MA, Venegas C, Takle H, Martin SAM (2012) 920 Transcriptomic and physiological responses to fishmeal substitution with plant proteins in 921 formulated feed in farmed Atlantic salmon (Salmo salar). BMC Genomics 13: 363. 922
Torstensen (2014) Nutrients not ingredients! Fiskeribladet Fiskaren, Available online from 923 27/03/2015 at: http://nifes.no/en/nutrients-ingredients/. 924
925 Torstensen BE, Espe M, Sanden M, Stubhaug I, Waagbø R, Hemre G-I, Fontanillas R, Nordgarden 926
U, Hevrøy EM, Olsvik P, Berntssen MHG (2008) Novel production of Atlantic salmon (Salmo 927 salar) protein based on combined replacement of fish meal and fish oil with plant meal and 928 vegetable oil blends. Aquaculture 285: 193–200. 929
930 Van Muiswinkel WB, Wiegertjes GF (1997) Immune responses after injection vaccination of fish. 931
Dev Biol Stand 90: 55–57. 932
Waagbø R, Glette J, Raa Nilsen E, Sandnes K (1993) Dietary vitamin C, immunity and disease 933 resistance in Atlantic salmon (Salmo salar). Fish Physiol Biochem 12: 61-73. 934
935 Wang F, Yang Y-H, Han Z-Z, Dong H-W, Yang C-H, Zou Z-Y (2008) Effects of phytase 936
pretreatment of soybean meal and phytase-sprayed in diets on growth, apparent digestibility 937 coefficient and nutrient excretion of rainbow trout (Oncorhynchus mykiss Walbaum). Aquac 938 Int 17: 143–157. 939
Wendelaar Bonga SE (1997) The stress response in fish. Physiol Rev 77: 591–625. 940
Yano T, Hatayama Y, Matsuyama H, Nakao M, (1988) Titration of the alternative complement 941 pathway activity of representative cultured fishes. Bull Japanese Soc Sci Fish 54: 1049-1054. 942
Ytrestøyl T, Aas ST, Åsgård AT (2015) Utilisation of feed resources in production of Atlantic 943 salmon (Salmo salar) in Norway. Aquaculture 448: 365-374. 944
Ytteborg E, Baeverfjord G, Torgersen J, Hjelde K, Takle H (2010) Molecular pathology of vertebral 945 deformities in hyperthermic Atlantic salmon (Salmo salar). BMC Physiol 10: 12.946

36
Figure captions 947
Figure 1. Observed weight development of the four dietary groups of Atlantic salmon juveniles. 948
Mean salmon weight (g) per dietary treatment with standard deviations at each timepoint of the study. 949
Figure 2. Modelled representation of growth performance for the four dietary groups at each 950
timepoint. (A) Expected mean salmon weight (g) and (B) Expected mean daily weight gain per fish 951
(g × day-1); (with 95% C.I.) in relation to % SPC inclusion over the course of the study. Black line 952
connects the expected mean weights of the four dietary groups at Day 36 in the first case and the 953
expected mean daily weight gains over the period between Day 0 - Day 36 of the feeding trial (prior 954
to vaccination); Red line connects the expected mean weights at Day 63 and the expected mean daily 955
weight gains over the period between Day 36 - Day 63 of the feeding trial (prior to vaccination); 956
Blue line connects the expected mean weights at Day 97 of the feeding trial (34 days post 957
vaccination) and the expected mean daily weight gains over the period between Day 63 - Day 97 of 958
the feeding trial (post vaccination period). Shaded regions of the same colours indicate the 95% 959
confidence interval regions for these values (derived by posterior simulation of the model with 960
n=1500 random draws). Dashed horizontal lines denote the mean values for the salmon fed diets 961
with 35% of dietary protein from SPC. Mean values which lie outside the 95% C.I. of the the group 962
receiving 35% of dietary protein from SPC are considered significant. Asterisks denote significant 963
differences between salmon fed 35% of protein from SPC and salmon fed diets with higher 964
percentage of dietary protein from SPC at different timepoints. 965
Figure 4. Modelled ash, Ca: P ratio, P and Ca pooled body cross-section levels. Statistical models 966
showing a significant linear effect of the percentage of protein from SPC on pooled body cross-967
section ash and elemental levels with P values < 0.05; Expected (A) Ash (g × kg-1); (B) Ca: P ratio; 968
(C) Phosphorus (P) (mg × kg-1); (D) Calcium (Ca) (mg × kg-1) (with 95% C.I.) (y axis) in relation to 969
% SPC inclusion (x axis) over the course of the study. Red, and blue lines connect the expected mean 970
values for each measurement at Day 63 post feeding prior to vaccination and Day 97 post feeding 971
(34 days post vaccination) respectively, while shaded regions of the same colours indicate the 95% 972
confidence regions for these values (derived by posterior simulation of the model with n=1500 973
random draws). Dashed horizontal lines of the aforementioned colours denote the mean values for 974
salmon fed diets with 35% of dietary protein from SPC. Mean values which lie outside the 95% C.I. 975
of the group receiving 35% of dietary protein from SPC are considered significant. Asterisks of the 976
same colours denote significant differences between salmon fed 35% of protein from SPC and 977
salmon fed diets with higher percentage of dietary protein from SPC at different timepoints. 978
Figure 5. Modelled Mg, Zn and Mn pooled body cross-section levels. Statistical models showing 979
a significant quadratic or linear effect of the percentage of protein from SPC on pooled body cross-980
section elemental levels with P values < 0.05; Expected (A) Magnesium (Mg) (mg × kg-1); (B) Zinc 981
(Zn) (mg × kg-1); (C) Manganese (Mn) (mg × kg-1) (with 95% C.I.) (y axis) in relation to % SPC 982
inclusion (x axis) over the course of the study. Red, and blue lines connect the expected mean values 983
for each measurement at Day 63 post feeding prior to vaccination and Day 97 post feeding (34 days 984
post vaccination) respectively, while shaded regions of the same colours indicate the 95% confidence 985
regions for these values (derived by posterior simulation of the model with n=1500 random draws). 986
Dashed horizontal lines of the aforementioned colours denote the mean values for salmon fed diets 987
with 35% of dietary protein from SPC. Mean values which lie outside the 95% C.I. of the group 988
receiving 35% of dietary protein from SPC are considered significant. Asterisks of the same colours 989
denote significant differences between salmon fed 35% of protein from SPC and salmon fed diets 990
with higher percentage of dietary protein from SPC at different timepoints. 991

37
Figure 5. Modelled haematological responses. Statistical models showing the linear (Models 992
selected with P values < 0.05) effect of the percentage of dietary protein from SPC on: (A) Expected 993
haematocrit (%); (B) Expected leucocytes (× 107 × ml-1); (C) Expected lymphocytes (× 107 × ml-1); 994
(D) Expected thrombocytes (× 107 × ml-1). Red, green and blue lines connect the expected mean 995
values for each measurement prior to vaccination –pre vacc (Day 63 post feeding), 7 days post 996
vaccination (7 dpv-Day 70 post feeding) and 34 dpv (Day 97 post feeding) respectively, while shaded 997
regions of the same colours indicate the 95% confidence regions for these values (derived by 998
posterior simulation of the model with n=1500 random draws). Dashed horizontal lines of the 999
aforementioned colours denote the mean values for salmon fed diets with 35% of dietary protein 1000
from SPC. Mean values which lie outside the 95% C.I. of the group receiving 35% of dietary protein 1001
from SPC are considered significant. Asterisks of the same colours denote significant differences 1002
between salmon fed 35% of protein from SPC and salmon fed diets with higher percentage of dietary 1003
protein from SPC at different timepoints. 1004
Figure 6. Modelled immunological responses. Statistical models showing significant quadratic 1005
effect (Models selected with P values < 0.05) of the percentage of protein from SPC on: (A) Expected 1006
lysozyme activity (Units × min-1 × ml-1); (B) Expected total plasma IgM (mg × ml-1); (C) Expected 1007
haemolytic activity (Units H50 × ml-1). Red, green and blue lines connect the expected mean values 1008
for each measurement prior to vaccination –prevacc-(Day 63 post feeding), 7 days post vaccination 1009
(7 dpv-Day 70 post feeding) and 34 dpv (Day 97 post feeding) respectively, while shaded regions of 1010
the same colours indicate the 95% confidence regions for these values (derived by posterior 1011
simulation of the model with n=1500 random draws). Dashed horizontal lines of the 1012
aforementioned colours denote the mean values for salmon fed diets with 35% of dietary protein 1013
from SPC. Mean values which lie outside the 95% C.I. of the group receiving 35% of dietary protein 1014
from SPC are considered significant. Asterisks of the same colours denote significant differences 1015
between salmon fed 35% of protein from SPC and salmon fed diets with higher percentage of dietary 1016
protein from SPC at different timepoints.1017

38
Table 1. Formulation and calculated chemical composition of experimental diets with varying soy protein concentrate levels
Feed composition (× kg-1) SPC35 SPC50 SPC65 SPC80 SPC35 SPC50 SPC65 SPC80
2mm 3mm
Fishmeal a (g) 462.86 344.15 230.64 121.98 462.86 344.15 230.64 121.98
SPCb (g) 274.64 384.25 489.16 590.97 274.64 384.25 489.16 590.97
Tapiocac (g) 100.00 100.00 100.00 100.00 100.00 100.00 100.00 100.00
Di-calcium phosphated (g) 30.00 30.00 30.00 30.00 30.00 30.00 30.00 30.00
Vitamin and mineral premixese (g) 3.55 3.55 3.55 3.55 3.55 3.55 3.55 3.55
Vitamin C 35% e (g) 1.00 1.00 1.00 1.00 1.00 1.00 1.00 1.00
MgSO4 d (g) 0.45 0.45 0.45 0.45 0.45 0.45 0.45 0.45
Methionine f (g) 2.10 3.50 4.50 5.50 2.10 3.50 4.50 5.50
Lysine 78% f (g) 1.80 2.40 2.80 3.30 1.80 2.40 2.80 3.30
L-Threonine f (g) 0.60 0.70 0.90 0.98 0.60 0.70 0.90 0.98
Ultralec g (g) 10.00 10.00 10.00 10.00 10.00 10.00 10.00 10.00
Fish Oil h (g) 113.00 120.00 127.00 132.26 113.00 120.00 127.00 132.26
Chemical composition (× kg-1)
Dry matter (g) 937.4 938.7 932.5 911.9 920.6 907.7 921.3 931.2
In dry matter basis
Crude protein (g) 504.2 502.1 491.7 471 501.2 488.9 491.2 485.4
Crude fat (g) 175.6 166.2 157.6 144.4 174.3 158.5 151.4 146.1
Crude protein: Crude fat ratio 2.9 3 3.1 3.3 2.9 3.1 3.2 3.4
Phytic acid (g) 11.9 13.5 14.6 15.3 11.6 13.1 14.2 15.2
Phytic Acid Bound P (g) 3.4 3.8 4.1 4.3 3.3 3.7 4.0 4.3
Ash (g) 108.4 106.3 103 97.1 106.2 102.8 100.9 100.1
Phosphorus (P) (g) 16.6 16.0 15.3 14.6 16.4 16.0 15.5 14.7
Calcium (Ca) (g) 33.4 26.8 22.5 19.0 31.8 27.8 23.1 18.5
Ca: P ratio 2 1.7 1.5 1.3 1.9 1.7 1.5 1.3
Zn (mg) 295.4 285.3 273.4 265.9 287.00 285.5 275.4 268.4

39
Mg (g) 2.18 2.32 2.39 2.44 2.21 2.34 2.39 2.43
Mn (mg) 83.54 87.32 86.99 86.78 83.87 87.45 86.32 85.89
Abbreviations: SPC 35 - diet with 35 % of dietary protein soy protein concentrate (SPC); SPC 50 - diet with 50 % of dietary protein from SPC;
SPC 65 - diet with 65 % of dietary protein from SPC; SPC 80 - diet with 80% of dietary protein from SPC. a Fishmeal (Egersund Sildoljefabrikk, Norway) with an apparent protein digestibility coefficient (ADC protein) of 90.2 % ; b SPC (~62% crude
protein) (Imcopa, Paraná, Brazil) with an apparent protein digestibility coefficient (ADC protein) of 90.8 % (Antitrypsins < 3.0 mg × g-1, Fibre <
5.0 mg × g-1, Lectins < 0.1 μg × g-1, Saponins = 0% , Glycinin < 3.0 μg × g-1, β-conglycinin < 1.0 μg × g-1) (Compositional analyses performed
by an authorized external laboratory hired by Imcopa) ; c Tapioca (Hoff Norske Potetindustrier, Gjøvik, Norway); d Dicalcium Phosphate (Normin
AS, Hønefoss, Norway); e Vitamin premix and Mineral premix (EWOS AS, Bergen, Norway); f Amino acids (Evonik Degussa International AG,
Hanau, Germany); g Ultralec: De-oiled lecithin powder (ADM, Decatur, USA); h Fish Oil (Egersund Sildoljefabrikk, Norway).
* The concentrations of phytic acid and phytic acid-bound P were estimated using a Megazyme Phytate/Total Phosphorus Assay kit (Megazyme,
Ireland) following the protocols provided by the company and were then corrected according to the total dietary P values estimated via ICP/MS.

40
Table 2. Performance data of juvenile Atlantic salmon dietary groups.
Growth and survival SPC35 SPC50 SPC65 SPC80 Linear Quadratic
Initial weight (g) (Day 0) 29.2±0.49 28.8±0.60 28.6±0.89 28.8±0.80 - -
Intermediate weight (g) (Day
36) 72.7±3.92 69.1±2.91 67.7±6.80 65.7±6.38 P<0.05 NS
Intermediate weight (g) (Day
63) 122.8±1.47 118.6±4.23 110.7±11.12 112.8±5.66 P<0.05 NS
Final weight (g) (Day 97) 174.1±3.56 169.4±5.70 159.8±9.76 162.4±12.03 P<0.05 NS
Weight gain*(g×fish-1×day-1)
(Days 0-36) 1.21±0.10 1.12±0.08 1.08±0.17 1.03±0.16 P<0.05 NS
Weight gain*(g×fish-1×day-1)
(Days 36-63) 2.05±0.16 2.03±0.07 1.76±0.40 1.93±0.09 P<0.05 NS
Weight gain*(g×fish-1×day-1)
(Days 63-97) 1.48±0.09 1.46±0.08 1.43±0.12 1.42±0.21 P<0.05 NS
Feed Given (g×fish-1)
(Days 0-36) 20.55±0.42 20.24±0.42 20.08±0.62 20.22±0.56 - -
Feed Given (g×fish-1)
(Days 36-63) 25.83±0.65 25.06±1.06 23.53±2.42 23.83±1.68 - -
Feed Given (g×fish-1)
(Days 63-97) 76.09±1.26 73.14±2.37 67.90±7.76 70.11±3.46 - -
Mortalities (%) 0.8 0 0.8 0 NS NS
Data for performance represent means ±SD for 4 replicate tanks.
Abbreviations: SPC 35 - diet with 35 % of dietary protein from soy protein concentrate (SPC);
SPC 50 - diet with 50 % of dietary protein from SPC; SPC 65 - diet with 65 % of dietary protein
from SPC; SPC 80 - diet with 80% of dietary protein from SPC.
*Weight gain (Daily Weight gain) (g fish-1 day-1) = Total weight of fish within treatment (g) ×
(Number of fish within treatment)-1*(Number of trial days)-1.

41
Figure 1.

42
Figure 2.

43
Figure 3.

44
Figure 4.
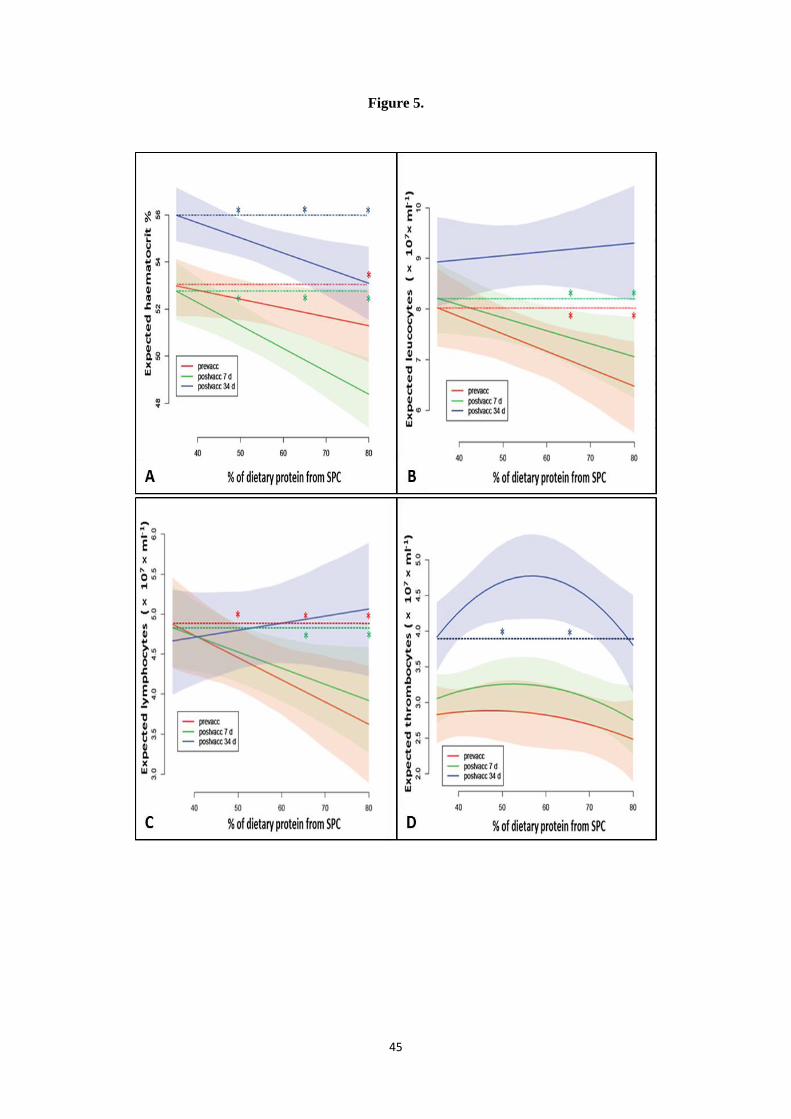
45
Figure 5.

46
Figure 6.

47
Supplementary Data
Table 2. Ash and elemental composition of Atlantic salmon parr pooled body cross-sections
Mineral Composition (× kg-1)
Day 63(prior to
vaccination)
SPC35 SPC50 SPC65 SPC80 Linear Quadratic
Ash (g) 2.12±0.06 2.00±0.03 1.90±0.06 1.83±0.08 P<0.05 NS
Phosphorus (P) (mg) 4887±208 4875±472 4220±102 4336±314 P<0.05 NS
Calcium (Ca) (mg) 4265±286 4269±511 3602±95 3069±704 P<0.05 NS
Ca: P ratio 0.87±0.03 0.87±0.03 0.85±0.01 0.70±0.01 P<0.05 NS
Magnesium (Mg) (mg) 369±11 351±12 320±4 345±22 NS P<0.05
Manganese (Mn) (mg) 0.96±0.05 1.09±0.21 0.85±0.11 0.82±0.05 P<0.05 NS
Zinc (Zn) (mg) 22.02±0.67 22.29±2.78 19.41±0.88 20.88±1.64 P<0.05 NS
Day 97(34 days post
vaccination)
Ash (g) 1.77±0.02 1.85±0.05 1.74±0.05 1.71±0.09 P<0.05 NS
Phosphorus (P) (mg) 3480±25 3602±53 3439±114 3261±62 P<0.05 NS
Calcium (Ca) (mg) 2127±171 2328±190 2002±101 1816±89 P<0.05 NS
Ca: P ratio 0.61±0.04 0.65±0.05 0.58±0.02 0.56±0.04 P<0.05 NS
Magnesium (Mg) (mg) 305±5 315±5 308±12 298±4 NS P<0.05
Manganese (Mn) (mg) 0.56±0.05 0.70±0.08 0.58±0.06 0.54±0.02 P<0.05 NS
Zinc (Zn) (mg) 13.29±1.28 14.60±1.11 13.19±0.67 12.06±0.58 P<0.05 NS
Data for ash and elemental composition are referred as means ± SD of 4 pooled samples (1 pool of 6 body cross-section homogenates per tank).
Abbreviations: SPC 35 - diet with 35 % of dietary protein from soy protein concentrate (SPC); SPC 50 - diet with 50 % of dietary protein from SPC; SPC 65 - diet with 65 %
of dietary protein from SPC; SPC 80 - diet with 80% of dietary protein from SPC.

48
Supplementary Data
Table 3. Haematological and immunological responses of Atlantic salmon juveniles
PRE VACCINATION SPC35 SPC50 SPC65 SPC80 Linear Quadratic
Haematocrit (%) 53.0±4.5 51.9±4.7 51.8±4.7 51.3±4.4 P<0.05 NS
Leucocytes (× 107× ml-1) 6.7±2.3 7.5± 1.7 7.1± 0.9 6.4 ±2.0 P<0.05 NS
Lymphocytes (×107× ml-1) 4.2±1.6 4.3±1.1 4.1±0.6 3.6±1.4 P<0.05 NS
Thrombocytes (×107× ml-1) 2.2±0.9 3.0±1.0 2.6±0.7 2.7±1.2 NS P<0.05
Granulocytes (×107× ml-1) 0.1±0.1 0.1±0.1 0.1±0.1 0.1±0.04 NS NS
Monocytes (×107× ml-1) 0.02±0.02 0.02±0.02 0.02±0.02 0.02±0.03 NS NS
Lysozyme act. (units × min-1× ml-1 of plasma) 369.8±80.4 480.2±90.9 442.1±78.2 389.7±118.5 NS P<0.05
Haemolytic act. (units H50 × ml-1 of plasma) 444.3±87.9 497.4±130.4 528.4±105.2 416.4±64.8 NS P<0.05
HKMs resp. burst (NBT) (OD for 105 nuclei) 0.2±0.2 0.2±0.1 0.2±0.1 0.3±0.1 NS NS
Stimulated HKMs resp. burst (OD for 105 nuclei) 0.4±0.3 0.4±0.2 0.4±0.3 0.5±0.2 NS NS
Total plasma protein (mg × ml-1 of plasma) 48.3±5.2 49.5±3.6 47.7±2.8 47.4±4.9 NS NS
Antiprotease activity (Units TI75 × ml-1)** 845.6±96.6 908±39.8 855.7±60.2 891.6±67.4 NS NS
Total plasma IgM (mg × ml-1 of plasma) 1.9±3.0 1.3±2.3 2.3±2.0 0.9±1.1 NS P<0.05
7 DAYS POST VACCINATION
Haematocrit (%) 52.2±5.1 49.4±4.3 51.6±6.7 47.8±4.3 P<0.05 NS
Leucocytes (× 107 × ml-1) 8.4±1.7 8.5±1.9 8.2±3.0 6.4±2.5 P<0.05 NS
Lymphocytes (×107× ml-1) 4.5±1.3 4.7±1.5 4.8±1.9 3.5±1.5 P<0.05 NS
Thrombocytes (×107× ml-1) 3.4±1.0 3.3±0.9 3.1±1.3 2.6±1.2 NS P<0.05
Granulocytes (×107× ml-1) 0.4±0.3 0.4±0.3 0.4±0.3 0.3±0.2 NS NS
Monocytes (×107× ml-1) 0.02±0.03 0.04±0.04 0.03±0.04 0.02±0.02 NS NS
Lysozyme act. (units × min-1× ml-1 of plasma) 639.4±216.0 719.4±75.1 662.0±184.1 698.63±97.0 NS P<0.05

49
Haemolytic act. (units H50 × ml-1 of plasma) 446.0±96.1 447.2±108.1 529.0±133.7 507.6±209.1 NS P<0.05
HKMs resp. burst (NBT) (OD for 105 nuclei) 0.6±0.5 0.8±0.4 0.9±0.3 0.8±0.2 NS NS
Stimulated HKMs resp. burst (OD for 105 nuclei) 0.9±0.8 1.0±0.6 1.1±0.4 1.1±0.3 NS NS
Total plasma protein (mg × ml-1 of plasma) 42.1±5.7 39.5±2.6 40.3±3.1 37.3±3.5 NS NS
Antiprotease activity (Units TI75 × ml-1)** 653.3±98.6 677.9±138.2 647.1±98.0 667.8±97.6 NS NS
Total plasma IgM (mg × ml-1 of plasma) 3.6±2.3 4.9±3.6 6.5±4.1 3.8±2.9 NS P<0.05
34 DAYS POST VACCINATION
Haematocrit (%) 55.3±4.1 54.5±2.8 54.4±3.3 53.0±4.9 P<0.05 NS
Leucocytes (× 107× ml-1) 8.7±1.5 8.6±1.5 9.4±2.9 9.3±2.9 P<0.05 NS
Lymphocytes (×107× ml-1) 4.1±0.9 3.9±1.2 4.8±1.7 5.5±2.7 P<0.05 NS
Thrombocytes (×107× ml-1) 4.2±1.1 4.5±1.2 4.8±2.2 3.8±1.2 NS P<0.05
Granulocytes (×107× ml-1) 0.4±0.2 0.2±0.1 0.3±0.2 0.2±0.1 NS NS
Monocytes (×107× ml-1) 0.05±0.05 0.03±0.03 0.05±0.05 0.04±0.05 NS NS
Lysozyme act. (units × min-1× ml-1 of plasma) 438.4±68.4 373.3±96.3 450.4±62.7 390.0±78.9 NS P<0.05
Haemolytic act. (units H50 × ml-1 of plasma) 1183.7±126.7 1344.6±242.2 1424.9±208.2 1072.4±126.9 NS P<0.05
HKMs resp. burst (NBT) (OD for 105 nuclei) 0.2±0.1 0.3±0.2 0.2±0.1 0.3±0.2 NS NS
Stimulated HKMs resp. burst (OD for 105 nuclei) 0.3±0.1 0.3±0.2 0.2±0.1 0.3±0.2 NS NS
Total plasma protein (mg × ml-1 of plasma) 46.4±7.7 8.6±1.5 9.4±2.9 9.3±2.9 NS NS
Antiprotease activity (Units TI75 × ml-1)** 596.6±15.9 604.0±16.8 600.6±30.2 598.9±11.6 NS NS
Total plasma IgM (mg × ml-1 of plasma) 3.6±3.8 6.4±2.6 5.6±2.8 2.9±2.2 NS P<0.05
Specific IgM (plasma titers) 0.02±0.01 0.02±0.01 0.02±0.01 0.02±0.01 NS NS
Values for immune responses are means ±SD of 8 pools of 2 fish per diet ±SD; haematocrit values are means ±SD of 24 fish; leukocyte and differential leucocyte counts are
means ± SD of 12 fish per diet. Abbreviations: SPC 35 - diet with 35 % soy protein concentrate (SPC); SPC 50 - diet with 50 % SPC; SPC 65 - diet with 65 % SPC; SPC 80 -
diet with 80% SPC.
**Units TI75 × min-1 × ml-1 of plasma.