Saliva versus Plasma Pharmacokinetics: Theory and Application of a Salivary Excretion Classification...
6
Saliva versus Plasma Pharmacokinetics: Theory and Application of a Salivary Excretion Classification System Nasir Idkaidek* and Tawfiq Arafat College of Pharmacy and Jordan Center for Pharmaceutical Research, University of Petra, Amman, Jordan ABSTRACT: The aims of this work were to study pharmacokinetics of randomly selected drugs in plasma and saliva samples in healthy human volunteers, and to introduce a Salivary Excretion Classification System. Saliva and plasma samples were collected for 3-5 half-life values of sitagliptin, cinacalcet, metformin, montelukast, tolterodine, hydrochlor- othiazide (HCT), lornoxicam, azithromycin, diacerhein, rosuvastatin, cloxacillin, losartan and tamsulosin after oral dosing. Saliva and plasma pharmacokinetic parameters were calculated by noncompartmental analysis using the Kinetica program. Effective intestinal permeability (P eff ) values were estimated by the Nelder-Mead algorithm of the Parameter Estimation module using the SimCYP program. P eff values were optimized to predict the actual average plasma profile of each drug. All other physicochemical factors were kept constant during the minimization processes. Sitagliptin, cinacalcet, metformin, tolterodine, HCT, azithromycin, rosuvastatin and cloxacillin had salivary excretion with correlation coefficients of 0.59-0.99 between saliva and plasma concentrations. On the other hand, montelukast, lornoxicam, diacerhein, losartan and tamsulosin showed no salivary excretion. Estimated P eff ranged 0.16-44.16 × 10 -4 cm/s, while reported fraction unbound to plasma proteins (fu) ranged 0.01-0.99 for the drugs under investigation. Saliva/plasma concentrations ratios ranged 0.11-13.4, in agreement with drug protein binding and permeability. A Salivary Excretion Classification System (SECS) was suggested based on drug high (H)/low (L) permeability and high (H)/low (L) fraction unbound to plasma proteins, which classifies drugs into 4 classes. Drugs that fall into class I (H/H), II (L/H) or III (H/L) are subjected to salivary excretion, while those falling into class IV (L/ L) are not. Additional data from literature was also analyzed, and all results were in agreement with the suggested SECS. Moreover, a polynomial relationship with correlation coefficient of 0.99 is obtained between S* and C*, where S* and C* are saliva and concentration dimensionless numbers respectively. The proposed Salivary Excretion Classification System (SECS) can be used as a guide for drug salivary excretion. Future work is planned to test these initial findings, and demonstrate SECS robustness across a range of carefully selected (based on physicochemical properties) drugs that fall into classes I, II or III. KEYWORDS: Salivary Excretion Classification System, protein binding, effective permeability, bioequivalence, pharmacokinetics, SimCYP 1. INTRODUCTION Salivary excretion of some drugs has been reported previously as a good indicator for drug bioavailability, therapeutic drug monitoring, pharmacokinetics and also drug abuse. Saliva sampling offers a simple, noninvasive and cheap method as compared with plasma sampling with no contamination risk. Two structures in the oral cavity participate in the formation of saliva and the exchange of products between blood and whole saliva; these are the salivary glands and the oral mucosa. The salivary glands are responsible for the production of the largest portion of saliva with the formation of enzymes, mucin, and other components of saliva; the exchange of inorganic ions with blood; and the excretion of water which is obtained from the complex capillary system surrounding the salivary glands. The oral mucosa participates in the formation of whole saliva by the passage of some blood components from the capillaries of the oral mucosa into the saliva bathing these tissues. Emphasis has been shown on the rule of plasma protein binding on salivary excretion, and that only unbound drug is available for diffusion into saliva. Polar drugs' saliva/plasma concentration ratios were suggested to depend on saliva pH, yet some deviations from pH partition theory existed. 1-8,22 In this research, rules of drug protein binding and membrane permeability were investigated. Studied drugs with different pharmacokinetic, physicochemical and pharmacodynamic properties were selected randomly from ongoing bioequiva- lence studies in humans. Salivary excretion investigated in this study was for sitagliptin, cinacalcet, metformin, montelukast, tolterodine, hydrochlorothiazide (HCT), lornoxicam, azithro- mycin, diacerhein, rosuvastatin, cloxacillin, losartan and tamsulosin. Paracetamol, phenytoin, carbamazepine, flucona- Received: February 18, 2012 Revised: July 1, 2012 Accepted: July 11, 2012 Published: July 11, 2012 Brief Article pubs.acs.org/molecularpharmaceutics © 2012 American Chemical Society 2358 dx.doi.org/10.1021/mp300250r | Mol. Pharmaceutics 2012, 9, 2358-2363
Transcript of Saliva versus Plasma Pharmacokinetics: Theory and Application of a Salivary Excretion Classification...

Saliva versus Plasma Pharmacokinetics: Theory and Application of aSalivary Excretion Classification SystemNasir Idkaidek* and Tawfiq Arafat
College of Pharmacy and Jordan Center for Pharmaceutical Research, University of Petra, Amman, Jordan
ABSTRACT: The aims of this work were to studypharmacokinetics of randomly selected drugs in plasma andsaliva samples in healthy human volunteers, and to introduce aSalivary Excretion Classification System. Saliva and plasmasamples were collected for 3−5 half-life values of sitagliptin,cinacalcet, metformin, montelukast, tolterodine, hydrochlor-othiazide (HCT), lornoxicam, azithromycin, diacerhein,rosuvastatin, cloxacillin, losartan and tamsulosin after oraldosing. Saliva and plasma pharmacokinetic parameters werecalculated by noncompartmental analysis using the Kineticaprogram. Effective intestinal permeability (Peff) values wereestimated by the Nelder−Mead algorithm of the ParameterEstimation module using the SimCYP program. Peff values were optimized to predict the actual average plasma profile of eachdrug. All other physicochemical factors were kept constant during the minimization processes. Sitagliptin, cinacalcet, metformin,tolterodine, HCT, azithromycin, rosuvastatin and cloxacillin had salivary excretion with correlation coefficients of 0.59−0.99between saliva and plasma concentrations. On the other hand, montelukast, lornoxicam, diacerhein, losartan and tamsulosinshowed no salivary excretion. Estimated Peff ranged 0.16−44.16 × 10⁻⁴ cm/s, while reported fraction unbound to plasma proteins(fu) ranged 0.01−0.99 for the drugs under investigation. Saliva/plasma concentrations ratios ranged 0.11−13.4, in agreementwith drug protein binding and permeability. A Salivary Excretion Classification System (SECS) was suggested based on drug high(H)/low (L) permeability and high (H)/low (L) fraction unbound to plasma proteins, which classifies drugs into 4 classes.Drugs that fall into class I (H/H), II (L/H) or III (H/L) are subjected to salivary excretion, while those falling into class IV (L/L) are not. Additional data from literature was also analyzed, and all results were in agreement with the suggested SECS.Moreover, a polynomial relationship with correlation coefficient of 0.99 is obtained between S* and C*, where S* and C* aresaliva and concentration dimensionless numbers respectively. The proposed Salivary Excretion Classification System (SECS) canbe used as a guide for drug salivary excretion. Future work is planned to test these initial findings, and demonstrate SECSrobustness across a range of carefully selected (based on physicochemical properties) drugs that fall into classes I, II or III.
KEYWORDS: Salivary Excretion Classification System, protein binding, effective permeability, bioequivalence, pharmacokinetics,SimCYP
1. INTRODUCTION
Salivary excretion of some drugs has been reported previouslyas a good indicator for drug bioavailability, therapeutic drugmonitoring, pharmacokinetics and also drug abuse. Salivasampling offers a simple, noninvasive and cheap method ascompared with plasma sampling with no contamination risk.Two structures in the oral cavity participate in the formation ofsaliva and the exchange of products between blood and wholesaliva; these are the salivary glands and the oral mucosa. Thesalivary glands are responsible for the production of the largestportion of saliva with the formation of enzymes, mucin, andother components of saliva; the exchange of inorganic ions withblood; and the excretion of water which is obtained from thecomplex capillary system surrounding the salivary glands. Theoral mucosa participates in the formation of whole saliva by thepassage of some blood components from the capillaries of theoral mucosa into the saliva bathing these tissues. Emphasis hasbeen shown on the rule of plasma protein binding on salivary
excretion, and that only unbound drug is available for diffusioninto saliva. Polar drugs' saliva/plasma concentration ratios weresuggested to depend on saliva pH, yet some deviations from pHpartition theory existed.1−8,22
In this research, rules of drug protein binding and membranepermeability were investigated. Studied drugs with differentpharmacokinetic, physicochemical and pharmacodynamicproperties were selected randomly from ongoing bioequiva-lence studies in humans. Salivary excretion investigated in thisstudy was for sitagliptin, cinacalcet, metformin, montelukast,tolterodine, hydrochlorothiazide (HCT), lornoxicam, azithro-mycin, diacerhein, rosuvastatin, cloxacillin, losartan andtamsulosin. Paracetamol, phenytoin, carbamazepine, flucona-
Received: February 18, 2012Revised: July 1, 2012Accepted: July 11, 2012Published: July 11, 2012
Brief Article
pubs.acs.org/molecularpharmaceutics
© 2012 American Chemical Society 2358 dx.doi.org/10.1021/mp300250r | Mol. Pharmaceutics 2012, 9, 2358−2363

zole, norfloxacin, erythromycin and ibuprofen salivary excretionhas been investigated previously.8,11−18
2. OBJECTIVESThe objectives are to investigate the scientific rationale of thesalivary excretion of randomly selected drugs based on asuggested Salivary Excretion Classification System (SECS), tocompare pharmacokinetic parameters calculated from salivasamples with those from plasma samples, and to correlate salivaand plasma drug concentrations.
3. EXPERIMENTAL SECTION3.1. Study Designs. Saliva pharmacokinetics under fasted
state, in healthy human volunteers was compared to plasmapharmacokinetics in 2 way crossover design studies. Thirteenbioequivalence studies were conducted as per the ICH, GCP,and Helsinki declaration guidelines after IRB of Al-MuwasahHospital and Jordan FDA approvals. Oral dosing with 240 mLof water was given after 10 h overnight fasting without dietaryrestrictions. Then resting saliva (without stimulation) andplasma samples were collected up to five half-life values duringeach study phase. Thorough rinsing of the mouth was doneprior to saliva sampling to avoid contamination of salivasamples by any drug residues. Washout time between phaseswas up to ten half-life values. 2−3 humans were randomlyenrolled in each study for both saliva and plasma sampling after
signing informed consent. Medical history, vital signs, physicalexamination, and laboratory safety test results showed noevidence of clinically significant deviation from normal medicalcondition as evaluated by the clinical investigator.
3.2. Assay Methodology. All samples were deep frozenuntil assayed by validated assay methods as summarized inTable 1. These methods were used for the assay of saliva andplasma samples.
3.3. Data Analysis. 3.3.1. Calculated PharmacokineticParameters. Individual pharmacokinetic parameters for drugconcentration in both saliva and plasma samples werecalculated by noncompartmental analysis (NCA) using theKinetica program. Pharmacokinetic parameters were area underthe concentration curves to last collection time (AUC0→t),maximum measured concentration (Cmax), time to maximumconcentration (Tmax) and half-life.
3.3.2. Optimized Effective Intestinal Permeability. Effectiveintestinal permeability (Peff) values were estimated by Nelder−Mead algorithm of the Parameter Estimation module usingSimCYP program.19 The Nelder−Mead method, which is alsocalled downhill simplex, is a commonly used nonlinearoptimization algorithm. This was done by searching for thebest parameter values that produce plasma concentration thatmatches the actual plasma concentration at the same time. Theobjective function is the weighted sum of squared differences ofobserved and model predicted values. Polar surface area (PSA)
Table 1. Summary of the Analytical Methods Used in Saliva and Plasma Samples
drug % intraday CV LOQ linear range % interday accuracy range % interday precision range
cinacalcet 3.85 0.2 ng/mL 0.2−50 ng/mL 101.96−107.28 2.24−3.32sitagliptin 4.70 5 ng/mL 5−500 ng/mL 95.02−97.84 2.21−4.19diacerheina 6.11 50 ng/mL 50−8000 ng/mL 98.14−102.58 1.01−4.88tolterodine 6.12 75 pg/mL 75−7500 pg/mL 95.78−103.00 0.93−3.04losartan 11.18 2.5 ng/mL 2.5−500 ng/mL 96.08−98.53 3.23−11.37HCT 9.56 2 ng/mL 2−200 ng/mL 95.22−99.13 2.01−5.67tamsulosin 2.98 0.25 ng/mL 0.25−15 ng/mL 95.15−96.91 3.13−3.78montelukast 8.19 5 ng/mL 5−800 ng/mL 95.11−104.27 3.14−7.51lornoxicam 5.83 20 ng/mL 20−1200 ng/m 93.93−103.65 1.70−6.47metformin 2.23 0.06 ng/mL 0.06−3.00 ng/mL 96.15−100.75 1.52−2.53cloxacillin 10.96 0.25 μg/mL 0.25−20.00 μg/mL 96.97−99.25 4.54−8.79azithromycin 10.17 1 ng/mL 1−200 ng/mL 92.80−100.94 6.97−10.03rosuvastatin 14.26 0.5 ng/mL 0.5−40 ng/mL 91.76−102.80 2.21−13.41
aRhein was assayed.
Table 2. Saliva and Plasma Mean (% CV) Pharmacokinetic Parameters after Oral Doses to Healthy Volunteers
saliva plasma
drug AUC0→t (ng/mL h) Cmax (ng/mL) Tmax (h) half-life (h) AUC0→t (ng/mL h) Cmax (ng/mL) Tmax (h) half-life (h)
cinacalcet 23.2(123) 10.3(145) 2.3(137) 2.59(51) 97.4(50) 15.0(29) 1.3(88) 4.65(23)sitagliptin 592(57) 111(75) 6(0) 2.98(4) 3717(56) 585(72) 1.5(0) 6.19(23)diacerhin NSEa NSE NSE NSE 22724(53) 5748(20) 2.3(53) 4.1(27)tolterodine 2.47(48) 1.11(69) 1.22(69) 1.88(27) 11.75(95) 3.60(50) 0.8(33) 1.98(40)losartan NSE NSE NSE NSE 1405(49) 610(79) 1.75(2) 2.38(18)HCT 265(16) 89.6(70) 2.39(28) 5.2(8) 646(32) 113(34) 2.14(34) 3.9(25)tamsulosin NSE NSE NSE NSE 176(46) 6.3(38) 5.7(61) 38(16)montelukast NSE NSE NSE NSE 2690(44) 395(37) 3.2(38) 4.7(28)lornoxicam NSE NSE NSE NSE 2063(35) 587(24) 2.0(37) 3.9(27)metformin 990(38) 166(46) 4.1(68) 4.2(40) 8711(14) 1392(18) 1.8(55) 2.7(6)cloxacillin 31518(111) 36620(76) 0.58(25) 0.66(79) 17859(24) 14051(27) 0.58(49) 1.22(3)azithromycinb 5624(49) 2263(82) 4.33(66) 1003(36) 134(42) 4.2(28)rosuvastatin 23.4(95) 4.19(94) 4.5(40) 4.3(31) 279(60) 24.9(56) 4.3(24) 5(20)
aNSE stands for no salivary excretion. bAzithromycin half-life was not calculated since design was truncated at 72 h.
Molecular Pharmaceutics Brief Article
dx.doi.org/10.1021/mp300250r | Mol. Pharmaceutics 2012, 9, 2358−23632359

was used first, using SimCYP, to predict an initial estimate ofPeff.All other physicochemical factors used in calculations such as
Log P, MW and fu were obtained from the literature and werekept constant during the minimization processes. In vitrodissolution rate, in vivo clearance and volume of distributionwere input from actual dissolution and plasma profiles.Fraction absorption (Fa) was calculated according to
equations below:
= − −Fa 1 e 2An
= P t RAn /eff res
where An is the absorption number, R and tres are radius, set at1.75 cm, and mean residence time, set at 3 h, in the humansmall intestine respectively.20
3.3.3. Dimensional and Statistical Analysis. Saliva/plasmacorrelation, dimensional analysis and descriptive statistics ofconcentrations and pharmacokinetic parameters were doneusing Microsoft Excel program for comparison purposes. Thefollowing dimensionless ratios were used for comparisons:
AUC* = saliva AUCt/plasma AUCtTmax* = saliva Tmax/plasma TmaxCmax* = saliva Cmax/plasma Cmaxt0.5* = saliva t0.5/plasma t0.5C* = saliva concentration/plasma concentration = Cs/CpPeff* = dimensionless effective permeability = RPeff/D,where D is drug diffusivity as predicted by SimCYPS* = saliva dimensionless number = (fu)Peff*
4. RESULTS AND DISCUSSIONPharmacokinetic parameters in saliva and plasma for all of the13 drugs are summarized in Table 2. Montelukast, tamsulusin,losartan, diacerhein and lornoxicam were not excreted in saliva.However, sitagliptin, cinacalcet, metformin, tolterodine, HCT,azithromycin, rosuvastatin and cloxacillin had salivary excretionwith correlations of 0.59−0.99 between saliva and plasmaconcentrations up to median Tmax values of plasma profiles asshown in Table 3. Assuming one compartment linear model,
salivary excretion rate is dependent on plasma drugconcentration. This explains the close behavior of the salivaand plasma profiles. Salivary concentrations showed goodcorrelation with plasma concentrations up to median Tmaxvalues of plasma data. This result is in agreement with previousstudies done on paracetamol and caffeine.11 Representativeprofiles of cloxacillin are shown in Figures 1 and 2. Intersubject
variability values (% CV) were high in both saliva and plasmadue to small sample size used in each drug.
Dimensional analysis results are shown in Table 3. Theyindicated lower bioavailability in saliva for most drugs. This canbe related to the effect of protein binding, which was suggestedbefore with salicylates where higher protein binding led tolower saliva/plasma ratios.3 Azithromycin had markedly highersaliva profiles than plasma profiles, suggesting high salivarydistribution. This is in agreement with azithromycin mono-graph, where the drug concentrations in tissues such as tonsilscan reach 60-fold that of plasma. On the other hand, Tmax waslonger in saliva for most drugs suggesting a lag time betweenplasma and saliva compartments due to drug distribution/redistribution processes in the body. Moreover, AUC* andCmax* values were in close agreement with C* values. However,t0.5* were either low or high, indicating variable eliminationrates from plasma and saliva.Plasma mean concentration profiles were used to estimate
the effective intestinal permeability values as shown in Table 5.
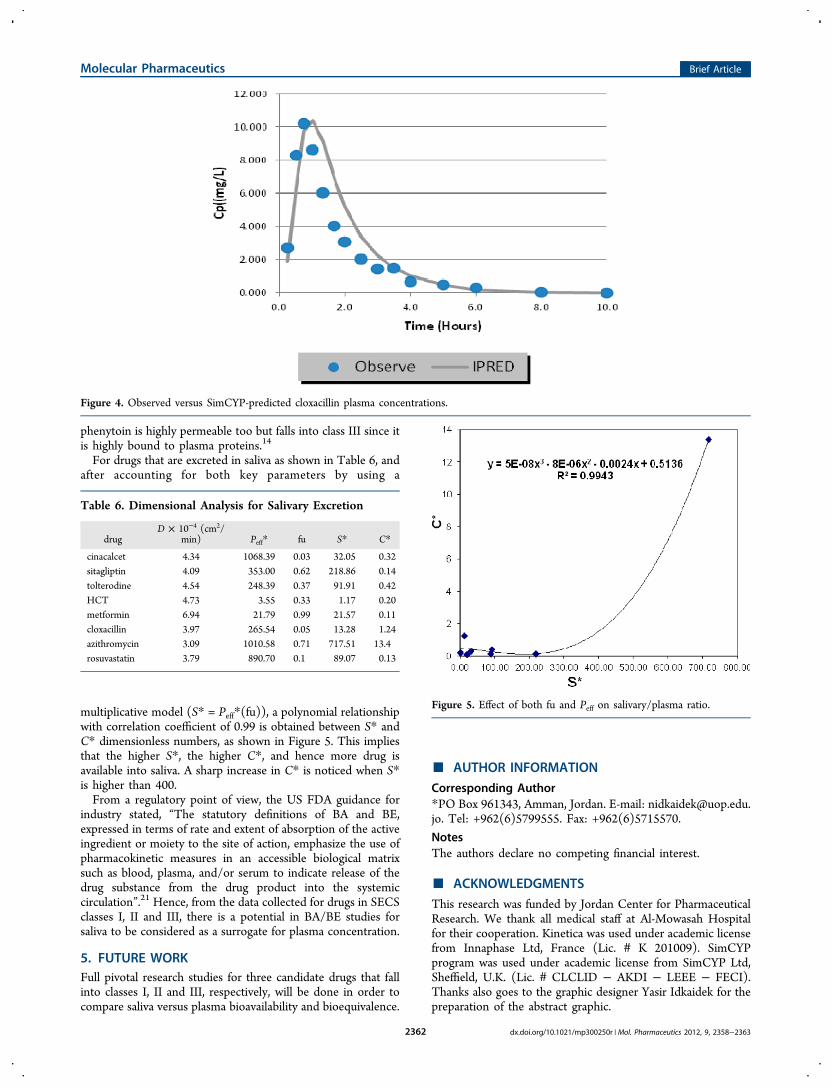
Figures 3 and 4 show observed versus SimCYP-predictedplasma concentration profiles for cloxacillin with correlationcoefficient of 0.93 indicating good fitting of observed plasmaconcentrations.This suggests that permeability and protein binding are
major key factors in salivary excretion, assuming that intestinalpermeability is similar to salivary mucosal permeability. Similar
Table 3. Dimensional Analysis Values of PharmacokineticParameters
drug AUC* Cmax* Tmax* t0.5* C* Ra
cinacalcet 0.24 0.69 1.56 0.56 0.32 0.59sitagliptin 0.16 0.19 4.00 0.48 0.14 0.99tolterodine 0.21 0.31 1.53 0.95 0.42 0.99HCT 0.41 0.79 1.12 1.35 0.20 0.83metformin 0.11 0.12 2.23 1.58 0.11 0.87cloxacillin 1.76 2.61 1.00 0.54 1.24 0.99azithromycin 5.61 16.89 1.03 13.4 0.99rosuvastatin 0.08 0.17 1.05 0.86 0.13 0.89
aCorrelation coefficient of Cs versus Cp up to median Tmax of Cp.
Figure 1. Plasma and saliva of cloxacillin mean profiles.
Figure 2. Correlation of saliva (Cs) and plasma (Cp) concentrations ofcloxacillin.
Table 4. Salivary Excretion Classification System (SECS)According to Drug Permeability (Peff) and FractionUnbound to Plasma Proteins (fu)
Peff fu salivary excretion
class I high high yesclass II low high yesclass III high low yesclass IV low low no
Molecular Pharmaceutics Brief Article
dx.doi.org/10.1021/mp300250r | Mol. Pharmaceutics 2012, 9, 2358−23632360
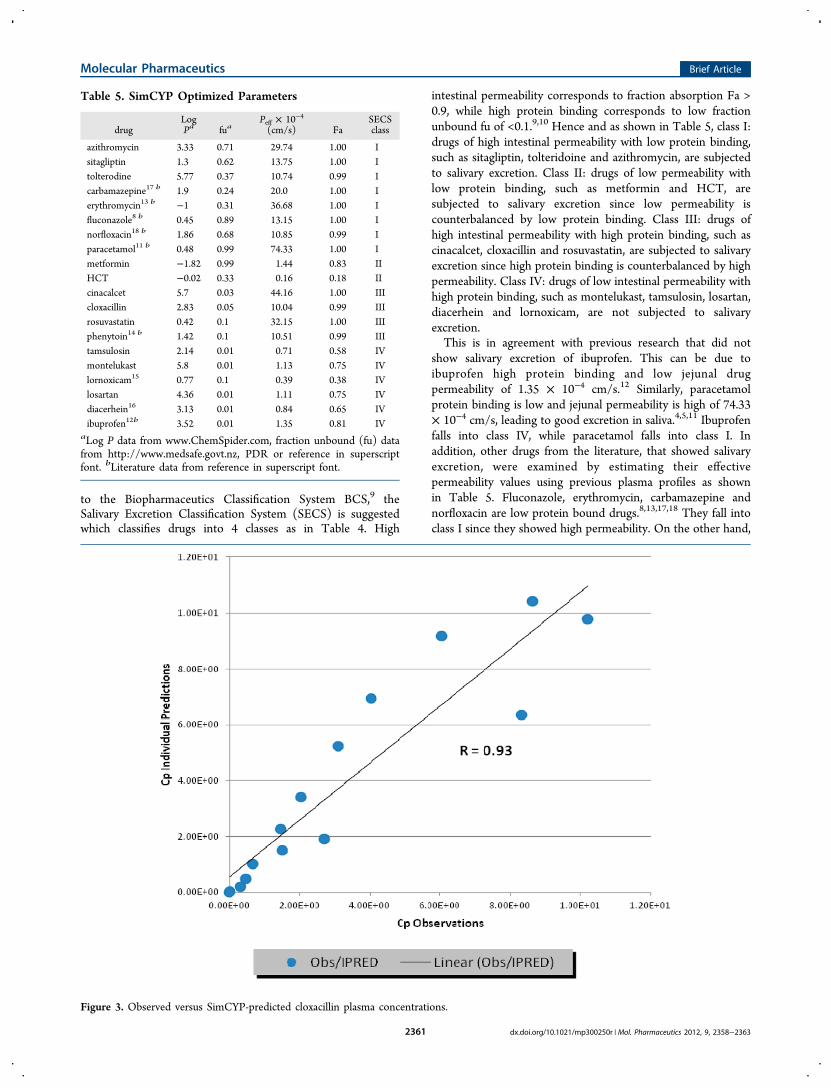
to the Biopharmaceutics Classification System BCS,9 theSalivary Excretion Classification System (SECS) is suggestedwhich classifies drugs into 4 classes as in Table 4. High
intestinal permeability corresponds to fraction absorption Fa >0.9, while high protein binding corresponds to low fractionunbound fu of <0.1.9,10 Hence and as shown in Table 5, class I:drugs of high intestinal permeability with low protein binding,such as sitagliptin, tolteridoine and azithromycin, are subjectedto salivary excretion. Class II: drugs of low permeability withlow protein binding, such as metformin and HCT, aresubjected to salivary excretion since low permeability iscounterbalanced by low protein binding. Class III: drugs ofhigh intestinal permeability with high protein binding, such ascinacalcet, cloxacillin and rosuvastatin, are subjected to salivaryexcretion since high protein binding is counterbalanced by highpermeability. Class IV: drugs of low intestinal permeability withhigh protein binding, such as montelukast, tamsulosin, losartan,diacerhein and lornoxicam, are not subjected to salivaryexcretion.This is in agreement with previous research that did not
show salivary excretion of ibuprofen. This can be due toibuprofen high protein binding and low jejunal drugpermeability of 1.35 × 10⁻⁴ cm/s.12 Similarly, paracetamolprotein binding is low and jejunal permeability is high of 74.33× 10⁻⁴ cm/s, leading to good excretion in saliva.4,5,11 Ibuprofenfalls into class IV, while paracetamol falls into class I. Inaddition, other drugs from the literature, that showed salivaryexcretion, were examined by estimating their effectivepermeability values using previous plasma profiles as shownin Table 5. Fluconazole, erythromycin, carbamazepine andnorfloxacin are low protein bound drugs.8,13,17,18 They fall intoclass I since they showed high permeability. On the other hand,
Table 5. SimCYP Optimized Parameters
drugLogPa fua
Peff × 10−4
(cm/s) FaSECSclass
azithromycin 3.33 0.71 29.74 1.00 Isitagliptin 1.3 0.62 13.75 1.00 Itolterodine 5.77 0.37 10.74 0.99 Icarbamazepine17 b 1.9 0.24 20.0 1.00 Ierythromycin13 b −1 0.31 36.68 1.00 Ifluconazole8 b 0.45 0.89 13.15 1.00 Inorfloxacin18 b 1.86 0.68 10.85 0.99 Iparacetamol11 b 0.48 0.99 74.33 1.00 Imetformin −1.82 0.99 1.44 0.83 IIHCT −0.02 0.33 0.16 0.18 IIcinacalcet 5.7 0.03 44.16 1.00 IIIcloxacillin 2.83 0.05 10.04 0.99 IIIrosuvastatin 0.42 0.1 32.15 1.00 IIIphenytoin14 b 1.42 0.1 10.51 0.99 IIItamsulosin 2.14 0.01 0.71 0.58 IVmontelukast 5.8 0.01 1.13 0.75 IVlornoxicam15 0.77 0.1 0.39 0.38 IVlosartan 4.36 0.01 1.11 0.75 IVdiacerhein16 3.13 0.01 0.84 0.65 IVibuprofen12b 3.52 0.01 1.35 0.81 IV
aLog P data from www.ChemSpider.com, fraction unbound (fu) datafrom http://www.medsafe.govt.nz, PDR or reference in superscriptfont. bLiterature data from reference in superscript font.
Figure 3. Observed versus SimCYP-predicted cloxacillin plasma concentrations.
Molecular Pharmaceutics Brief Article
dx.doi.org/10.1021/mp300250r | Mol. Pharmaceutics 2012, 9, 2358−23632361
phenytoin is highly permeable too but falls into class III since itis highly bound to plasma proteins.14
For drugs that are excreted in saliva as shown in Table 6, andafter accounting for both key parameters by using a
multiplicative model (S* = Peff*(fu)), a polynomial relationshipwith correlation coefficient of 0.99 is obtained between S* andC* dimensionless numbers, as shown in Figure 5. This impliesthat the higher S*, the higher C*, and hence more drug isavailable into saliva. A sharp increase in C* is noticed when S*is higher than 400.From a regulatory point of view, the US FDA guidance for
industry stated, “The statutory definitions of BA and BE,expressed in terms of rate and extent of absorption of the activeingredient or moiety to the site of action, emphasize the use ofpharmacokinetic measures in an accessible biological matrixsuch as blood, plasma, and/or serum to indicate release of thedrug substance from the drug product into the systemiccirculation”.21 Hence, from the data collected for drugs in SECSclasses I, II and III, there is a potential in BA/BE studies forsaliva to be considered as a surrogate for plasma concentration.
5. FUTURE WORKFull pivotal research studies for three candidate drugs that fallinto classes I, II and III, respectively, will be done in order tocompare saliva versus plasma bioavailability and bioequivalence.
■ AUTHOR INFORMATION
Corresponding Author*PO Box 961343, Amman, Jordan. E-mail: [email protected]. Tel: +962(6)5799555. Fax: +962(6)5715570.
NotesThe authors declare no competing financial interest.
■ ACKNOWLEDGMENTS
This research was funded by Jordan Center for PharmaceuticalResearch. We thank all medical staff at Al-Mowasah Hospitalfor their cooperation. Kinetica was used under academic licensefrom Innaphase Ltd, France (Lic. # K 201009). SimCYPprogram was used under academic license from SimCYP Ltd,Sheffield, U.K. (Lic. # CLCLID − AKDI − LEEE − FECI).Thanks also goes to the graphic designer Yasir Idkaidek for thepreparation of the abstract graphic.
Figure 4. Observed versus SimCYP-predicted cloxacillin plasma concentrations.
Table 6. Dimensional Analysis for Salivary Excretion
drugD × 10−4 (cm2/
min) Peff* fu S* C*
cinacalcet 4.34 1068.39 0.03 32.05 0.32sitagliptin 4.09 353.00 0.62 218.86 0.14tolterodine 4.54 248.39 0.37 91.91 0.42HCT 4.73 3.55 0.33 1.17 0.20metformin 6.94 21.79 0.99 21.57 0.11cloxacillin 3.97 265.54 0.05 13.28 1.24azithromycin 3.09 1010.58 0.71 717.51 13.4rosuvastatin 3.79 890.70 0.1 89.07 0.13
Figure 5. Effect of both fu and Peff on salivary/plasma ratio.
Molecular Pharmaceutics Brief Article
dx.doi.org/10.1021/mp300250r | Mol. Pharmaceutics 2012, 9, 2358−23632362

■ REFERENCES(1) Madonia, J. V.; Bahn, A. N. Permeability of Oral Tissues toBlood-borne Coxsackievirus B-1. Appl. Microbiol. 1967, 15 (2), 296−299.(2) Navarro, M.; Pichini, S.; Farre, M.; Ortuno, J.; Roset, P. N.;Segura, J.; de la Torre, R. Usefulness of Saliva for Measurement of 3,4-Methylenedioxymethamphetamine and Its Metabolites: Correlationwith Plasma Drug Concentrations and Effect of Salivary pH. Clin.Chem. 2001, 47 (10), 1788−1795.(3) Rumble, R.; Brooks, P.; Roberts, M. Metabolism of SalicylateDuring Chronic Aspirin Therapy. Br. J. Clin. Pharmacol. 1980, 9, 41−45.(4) Gandia, P.; Bareille, M. P.; Saivin, S.; et al. Influence of simulatedweightlessness on the oral pharmacokinetics of acetaminophen as agastric emptying probe in man: a plasma and a saliva study. J. Clin.Pharmacol. 2003, 43, 1235−1243.(5) Kamali, F.; Edwards, C.; Rawlins, M. The effect of pirenzepine ongastric emptying and salivary flow rate: constraints on the use of salivaparacetamol concentrations for the determination of paracetamolpharmacokinetics. Br. J. Clin. Pharmacol. 1992, 33, 309−312.(6) Ahmad, R. A.; Rogers, H. J. Pharmacokinetics and ProteinBinding Interactions of Dapsone and Pyrimethamine. Br. J. Clin.Pharmacol. 1980, 10, 519−524.(7) Cardot, J.-M.; Chaumont, C.; Dubray, C.; Costantini, D.; Aiache,J.-M. Comparison of the pharmacokinetics of miconazole afteradministration via a bioadhesive slow release tablet and an oral gelto healthy male and female subjects. Br. J. Clin. Pharmacol. 2004, 58(4), 345−351.(8) Koks, C. H. W.; Meenhorst, P. L.; Hillebrand, M. J. X.; Bult, A.;Beijnen, J. H. Pharmacokinetics of Fluconazole in Saliva and Plasmaafter Administration of an Oral Suspension and Capsules. Antimicrob.Agents Chemother. 1996, 40 (8), 1935−1937.(9) Amidon, G. L.; Lennernas, H.; Shah, V. P.; Crison, J. R. Atheoretical basis for a biopharmaceutic drug classification: thecorrelation of in vitro drug product dissolution and in vivobioavailability. Pharm. Res. 1995, 12 (3), 413−420.(10) Jambhekar, S. S.; Breen, P. J. Basic Pharmacokinetics, 1st ed.;Pharmaceutical Press: London, 2009.(11) Rhie J. The pellet gastric emptying (PGE) test: Development ofa non-invasive method to assess gastric emptying. PhD Diss.University of Michigan, 1996.(12) Idkaidek, N.; Arafat, T. Effect of Microgravity on thePharmacokinetics of Ibuprofen in Humans. J. Clin. Pharmacol. 2011,51 (12), 1685−1689.(13) Henry, J.; Turner, P.; Garland, M.; Esmieu, F. Plasma andsalivary concentrations of erythromycin after administration of threedifferent formulations. Postgrad. Med. J. 1980, 55, 707−710.(14) Ruiz, M. E.; Fagiolino, P.; de Buschiazzo, P. M.; Volonte, M. G.Is saliva suitable as a biological fluid in relative bioavailability studies?Analysis of its performance in a 4 × 2 replicate crossover design. Eur. J.Drug Metab. Pharmacokinet. 2011, 36 (4), 229−236.(15) Skjodt, N. M.; Davies, N. M. Clinical pharmacokinetics oflornoxicam. A short half-life oxicam. Clin. Pharmacokinet. 1998, 34 (6),421−428.(16) Nicolas, P.; Tod, M.; Padoin, C.; Petitjean, O. Clinicalpharmacokinetics of diacerein. Clin. Pharmacokinet. 1998, 35 (5),347−359.(17) Ruiz, M. E.; Conforti, P.; Fagiolino, P.; Volonte, M. G. The useof saliva as a biological fluid in relative bioavailability studies:comparison and correlation with plasma results. Biopharm. DrugDispos. 2010, 31 (8−9), 476−485.(18) Uematsu, M. Pharmacokinetic significance of measurement ofsalivary penetration of protein-unbound pyridonecarboxylic acidantimicrobial agents. Shikwa Gakuho 1989, 89 (1), 127−153.(19) Jamei, M.; Turner, D.; Yang, J.; Neuhoff, S.; Polak, S.; Rostami-Hodjegan, A.; Tucker, G. Population-based mechanistic prediction oforal drug absorption. AAPS J. 2009, 11 (2), 225−237.(20) Takamatsu, N.; Kim, O. N.; Welage, L. S.; Idkaidek, N. M.;Hayashi, Y.; Barnett, J.; Yamamoto, R.; Lipka, E.; Lennernas, H.;
Hussain, A.; Lesko, L.; Amidon, G. L. Human jejunal permeability oftwo polar drugs: cimetidine and ranitidine. Pharm. Res. 2001, 18 (6),742−744.(21) Guidance for Industry: Bioavailability and BioequivalenceStudies for Orally Administered Drug Products GeneralConsiderations. March 2003. Division of Drug Information, Centerfor Drug Evaluation and Research, Food and Drug Administration5600 Fishers Lane Rockville, MD 20857, USA.(22) Gorodischer, R.; Koren, G. Salivary excretion of drugs inchildren: theoretical and practical issues in therapeutic drugmonitoring. Dev. Pharmacol. Ther. 1992, 19 (4), 161−177.
Molecular Pharmaceutics Brief Article
dx.doi.org/10.1021/mp300250r | Mol. Pharmaceutics 2012, 9, 2358−23632363