Salinization of Irrigated Urban Soils: A Case Study of El ...
15
Salinization of Irrigated Urban Soils: A Case Study of El Paso, TX S. Miyamoto Texas A&M University/Texas A&M AgriLife Research Texas Water Resources Institute TR-433 October, 2012
Transcript of Salinization of Irrigated Urban Soils: A Case Study of El ...

Salinization of Irrigated Urban Soils: A Case Study of El Paso, TXS. Miyamoto Texas A&M University/Texas A&M AgriLife Research
Texas Water Resources Institute TR-433October, 2012

1TWRI TR-433
Salinization of Irrigated Urban Soils: A Case Study of El Paso, TX
S. Miyamoto1┘
Synopsis
This study was conducted to assess soil salinity levels in large landscape areas, such as golf courses, parks, and school grounds which were developed on various soil types in El Paso, Texas. The survey encompassed the East, the Central, the Northwest, and the Upper and Lower Valleys, covering 16 fairways at seven golf courses, 37 city parks, 30 school grounds, and 13 apartment landscapes on the Westside. The highest soil salinity (6 to 11 dS m-1) was found in the clayey soils of the Upper and Lower valleys, even when water of low salinity (650 to 750 ppm) had been used for irrigation. Spadoratic soil salinization was also observed in loamy soils of the South Central irrigated with city potable water, and topdressed soils of the Northwest after conversion to reclaimed water. Soil salinization was not observed in deep sand along I-10, and seldom in sandy calcic soils in the East and North Central, even though these soils contain a layer of caliche. Soil types play a role on soil salinization as much as does water quality.
Introduction
Most communities in the Southwest are experiencing the fast population growth and additional demands for water. The city of El Paso (TX) is no exception, and is in need of increasing water supply for domestic use as well as for irrigating urban landscapes. As a mean to conserve portable quality water, most communities began using non-potable water for irrigating large landscapes, such as parks, school grounds, and golf courses. Non-potable water sources include reclaimed municipal effluent, ground water with elevated salinity, and in some cases, agricultural drainage water.
Fig. 1. Mean soil salinity and the standard deviation as related to salinity of irrigation water at eight sites (Miyamoto & Chacon, 2006).
__
There have been some concerns that indiscriminate uses of salty water for irrigation can cause soil salinization as experienced in irrigated crop lands in the west. Nonetheless, there has been no dramatic report which indicates serious soil salinization associated with irrigation use of reclaimed municipal effluent in Arizona or neighboring New Mexico. One must, however, keep in mind that the upper limit of salinity in drinking water in these states is 500 ppm, whereas in Texas it is 1000 ppm. The difference in salinity of water supply affects salinity of effluent and reclaimed water. When salinity of irrigation water exceeds 1000 ppm, the water quality criteria developed in California indicate that, “moderate salt problems” may result (e.q., Westcott and Ayers, 1984). The US Golf Association, however, takes a more cautious approach; Water with salinity exceeding 1000 ppm or sodicity exceeding 6 in SAR should not be used for irrigating golf courses, except under special circumstances.
________________________________________________ 1┘ Professor and Soil Scientist, Texas A&M University, AgriLife Research Center 1380 A&M Circle El Paso, TX 79936

2
Our previous survey of golf courses in West Texas and Southern New Mexico (Miyamoto et. al., 2005) indicated that soil salinity had poor correlation with salinity of irrigation water used (Fig. 1). Each datum point shown in the figure is an average salinity of soil samples taken at least 27 each per fairway, and the standard deviation is shown by the vertical bar. Note that soil salinity is expressed by the electrical conductivity of soil saturation extract (ECe). If salinity of irrigation water is the dominant factor, soil salinity should increase with increasing salinity of irrigation water, such as shown by the dashed line. The field data, however, indicated that soil salinity not only has poor correlation with water salinity, but also is highly variable within a fairway or among the different courses. Note that these golf courses have been irrigated similarly using sprinklers and real-time estimate of daily evapotranspiration (ET). This means that factors other than water salinity must be affecting salt accumulation. The purpose of this project was to evaluate if salt accumulation may be affected by the difference in soil types.
Soil Type Distribution
The soil map for the El Paso County (Fig. 2) was copied from our earlier publication (Miyamoto, 2000). The mapping units used in Fig. 2 are common descriptions, and the official descriptions are given in Table 1 (USDA, SCS/TAES, 1971). Broadly speaking, the soils in the county are classified into two soil orders; Entisols of the Rio Grande Valley, and Aridisols in the upland area. However, there are some soils which are transition from Entisols to Aridisols, and are designated as Camborthids in Table 1. Entisols can also appear in intermountain arroyos, besides in the valley.
The geographical distribution of different soils is shown in Fig. 2. Bluepoint loamy sand (Torripsament, Entisol) is distributed along I-10, mostly in the East and the North Central District. However, it can also appear along I-10 in the Northwest District. Sandy soils also appear in small areas in the Valley, and they are designated in the county soil map as Brazito (Br), Gila (Ga), and Vinton (Vn) series.
The Hueco-Wink Soil Association occupies a large portion of the East and the Northeast
Districts, as well as the North Central. A detailed soil survey is yet to be performed for this area, but most of the area consists of either Hueco fine sandy loam or Wink sandy loam, both of which contain the calcic horizon (a layer of caliche), starting at 18 to 24 inches in depth. The calcic horizon of Hueco series is indurated and hard (Fig. 3b), whereas that of Wink series is not (Fig. 3c). These two soils share what is commonly called “Red Sand” at the surface, and it is difficult to differentiate the two. The Hueco series is supposedly older soil, and the surface layer (2 to 4 inches) may not contain appreciable amounts of CaCO3. Although, it is rare, deep sandy loam can also be found along arroyos in the East District. It is named Mimbres sandy loam (Camborthid, Aridisol).
The Delnorte-Canutilo Association occupies foothills of the Franklin Mts. The Delnorte series
(Paleorthid, Aridisols) typically appears in hilly landscapes (Fig. 3d), and the Canutio series (Torriothent, Entisols) along the intermountain arroyos. Delnorte soils have indurated layers of caliche (Fig. 3d), whereas Canutio soils do not, as it was developed in active arroyo.
The Agustin series (AGB) is a deep gravelly sediment, and appears mostly at the tip of the
alluvial fans along I-10 in the Northwest District. Although it is classified as Aridisol, it contains little or no calcic horizon, and behaves as if the soil is an Entisol. In some instances, the sediment which fills the space between gravel and stone can be loamy or clayey (Fig. 3e). The source of clay in this area is believed to have originated from clayey sediments similar to those appearing in the Upper Valley. According to a geological report (Lovejoy and Cornell, 1996), the area was once a large playa basin, and the uplifting of the Franklins brought the clayey sediments to the surface. These clayey strata appear in most cases under the newer alluvial fan deposit consisting of gravelly sediments. The clayey

3
Upland SoilsU-1 Deep loamy soilsU-2 Deep sandU-3 Sandy loam over calicheU-4 Shallow gravelly loamU-5 Shallow calcic soilsNot surveyed
Lowland SoilsV-1 Loamy over loamy sedimentsV-2 Sandy loam over sandy sedimentsV-3 Silty clay loam over sand to loamV-4 Deep silty clay over sand to loam
N
Upland SoilsU-1 Deep loamy soilsU-2 Deep sandU-3 Sandy loam over calicheU-4 Shallow gravelly loamU-5 Shallow calcic soilsNot surveyed
Lowland SoilsV-1 Loamy over loamy sedimentsV-2 Sandy loam over sandy sedimentsV-3 Silty clay loam over sand to loamV-4 Deep silty clay over sand to loam
Upland SoilsU-1 Deep loamy soilsU-2 Deep sandU-3 Sandy loam over calicheU-4 Shallow gravelly loamU-5 Shallow calcic soilsNot surveyed
Upland SoilsU-1 Deep loamy soilsU-2 Deep sandU-3 Sandy loam over calicheU-4 Shallow gravelly loamU-5 Shallow calcic soilsNot surveyed
Lowland SoilsV-1 Loamy over loamy sedimentsV-2 Sandy loam over sandy sedimentsV-3 Silty clay loam over sand to loamV-4 Deep silty clay over sand to loam
Lowland SoilsV-1 Loamy over loamy sedimentsV-2 Sandy loam over sandy sedimentsV-3 Silty clay loam over sand to loamV-4 Deep silty clay over sand to loam
N
Fig. 2. Soil map of El Paso (Miyamoto, 2000)
Table 1. The soils in the different districts in El Paso, TX.Mapping Units Description Soil Designation SubgroupNortheast
U-1 Deep loamy soils Pajarito (PAA) CamborthidsTurney (TBB) CalciorthidsBerino (TBB) Haplargids
U-3 Sandy loam over caliche Huecco (HW) PaleargidsWink (WKA) Calciorthids
East and North CentralU-2 Deep sand Bluepoint (BPC, BUC) TorripsammentsU-3 Sandy loam over caliche Huecco (HW), Wink (WKA) As above
NorthwestU-2 Deep sand Bluepoint (BPC, BUC) TorripsammentsU-3 Sandy loam over caliche Huecco (HW), Wink (WKA) As aboveU-4 Shallow gravelly loam Agustin (AGB) Camborthids
Canutio (DCB) TorriorthentsDelnorte (DCD) Paleorthid
Upper & Lower Valley plus South CentralV-1 Loam over loamy sediments Gila (Ga), Harkey (Ha) TorrifluventsV-2 Sandy loam over sandy sediments Brazito (Br) Torripsamments
Gila (Ga), Vinton (Vn) TorrifluventsV-3 Silty clay loam over sand to loam Harkey (Hk), Glendale (Ge), Saneli (Sa) TorrifluventsV-4 Deep silty clay over sand to loam Saneli (Sc), Glendale (Gs), Tigua (Tg) Torrifluvents
Aridisols
Soil Classification
EntisolsEntisols
EntisolsAridisolsAridisols
EntisolsEntisolsEntisols
Entisols
Aridisols
Aridisols
EntisolsAridisols
AridisolsAridisols
Aridisols
4
a
b
c
d
e
f
g
h
i
Fig. 3. Calcic soils of the East, Aridisols of the Northwest and clayey alluvial soils of the El Paso Valley.
Glendale Silty Clay Loam
35"
0
Tigua SiltyClay
0
10"
50"
silty clay loam
silty clay
clay
60"
Anapra SiltyClay Loam
0
23"
60"
silty clay loam
fine sand
Saneli Silty Clay
32"
0
12"
silty clay
clay
60"
fine sand
Glendale Silty Clay
40"
18"
0
silty clay
silty clay loam
60"
Variable Variable
AveSandy loam
VariableSandy loam
toclay loam
(An) (Ge) (Sc) (Gs) (Tg)
Soil Units V-3 Soil Units V-4
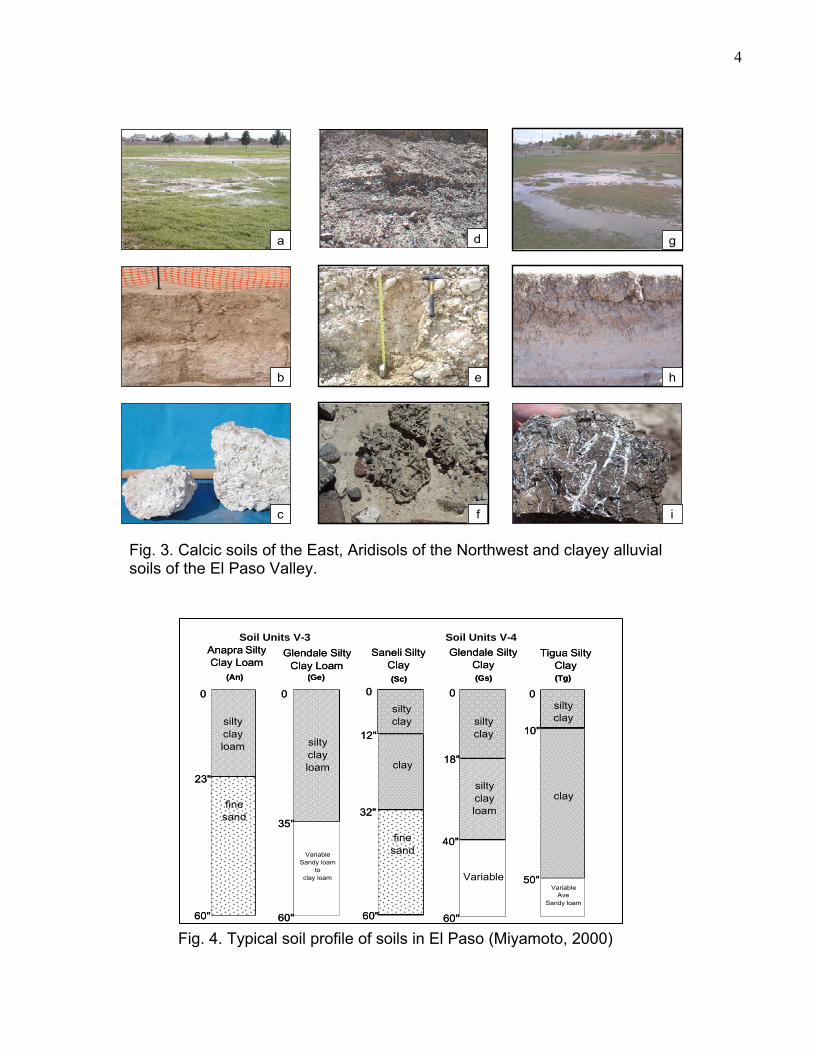
Fig. 4. Typical soil profile of soils in El Paso (Miyamoto, 2000)

5
sediment is usually sodium (Na)-affected, and at times contains gypsum crystals which commonly appear in the saline playa (Fig. 3f). The soils along the foothill of the Franklin Mts. are highly variable, due to complex geological history.
Alluvial soils of the Valley have soil textures ranging from sand to clay, but ¾ of the valley floor
is estimated to contain clayey soils, mainly silty clay loam and silty clay (USDA, SCS/TAES, 1971). Permeability of these soils, especially when compacted is low, and water puddling (Fig. 3g) and associated salt accumulation are common (Fig. 3i). The majority of silty clay loam soil contains sandy strata within 2 to 3 ft from the ground surface (Fig. 3h). However, Tigua silty clay (Tg), Saneli and Glendale series can have the clayey layer extending to 4 ft, and at times, as deep as 6 ft. Typical soil profiles of some of these alluvial soils are shown in Fig. 4. Additional details can be found elsewhere (Miyamoto, 2000).
Survey Areas, Soil Sampling, and Analysis
Three categories of landscapes were surveyed. The first group was golf courses, the second group, city parks and school grounds used for sports activities, mainly soccer and football, and the third was turfed apartment landscape. The criteria for selection were to cover various soil types, and to focus on large facility which is older than 5 years. Some school grounds had little turf cover, presumably due to inadequate irrigation. These sites were excluded from this survey. There are ten golf courses in El Paso, and six of them were surveyed. No name is provided to maintain the confidentiality agreement with the cooperators. At each golf course, several fairways which were rated by an applicable superintendant as being average, below, or above the average were selected. Soil samples were taken from 1 to 8 inches in depth from the selected fairways every 25 to 50 ft intervals for 20 to 30 samples per fairway. These soil samples were air-dried, and analyzed for the saturation water content (SWC), and salinity of the saturation extract (ECe) following an official method (Rhodes and Miyamoto, 1990). In addition, the field soil moisture contents were measured gravimetrically. The soil samples taken in this manner usually yield the mean salinity of a fairway with a deviate range of less than 15% from the true mean at a 95% confidence level (Miyamoto et. al., 2005). The total number of soil samples collected from these golf courses was 402 each.
Municipal parks in the city of El Paso have been maintained with the general guideline that irrigation of turfed areas should not exceed 46 to 48 inches per year. Some school grounds have also been maintained similarly, while others have been managed in a less-strict fashion. Soil samples were collected from five districts; East, Central, Northwest, Upper and Lower Valleys. We did not cover the Northeast, mainly due to resource constraints. However, the El Paso County soil survey report indicates that the soil types there are similar to those in the East. The East District was further subdivided into the area along I-10 where the soil consists of the Bluepoint series (U-2). The Central District was also subdivided into two; North Central consisting of sandy soils, and South Central containing loamy or clayey alluvial soils (V 2, 3, and 4). The names of the parks and schools surveyed are available in Appendix. The Northwest District was subdivided into areas irrigated with city potable water and reclaimed water from the Northwest Wastewater Treatment Plant. Some of these parks and school grounds located in the Northwest, the Central, and the Lower Valley were once surveyed during the period of 1995 through 2000, and some parks in the Northwest were resampled after the conversion to reclaimed water from the Northwest Plant. All other areas, chiefly the East, and the Upper Valley were sampled in 2011. Soil samples were collected from a depth of 1 to 8 inches, typically 2 to 7 samples per sports field. The total number of soil samples collected and analyzed amounted to 395 (241 from parks and 154 from schools). The soil samples collected in this fashion yield the mean salinity of the site within a deviate range of around 20% from the true mean, except in cases of the high coefficient of variability (CV), such as exceeding 40% (Miyamoto et. al., 2005).
6
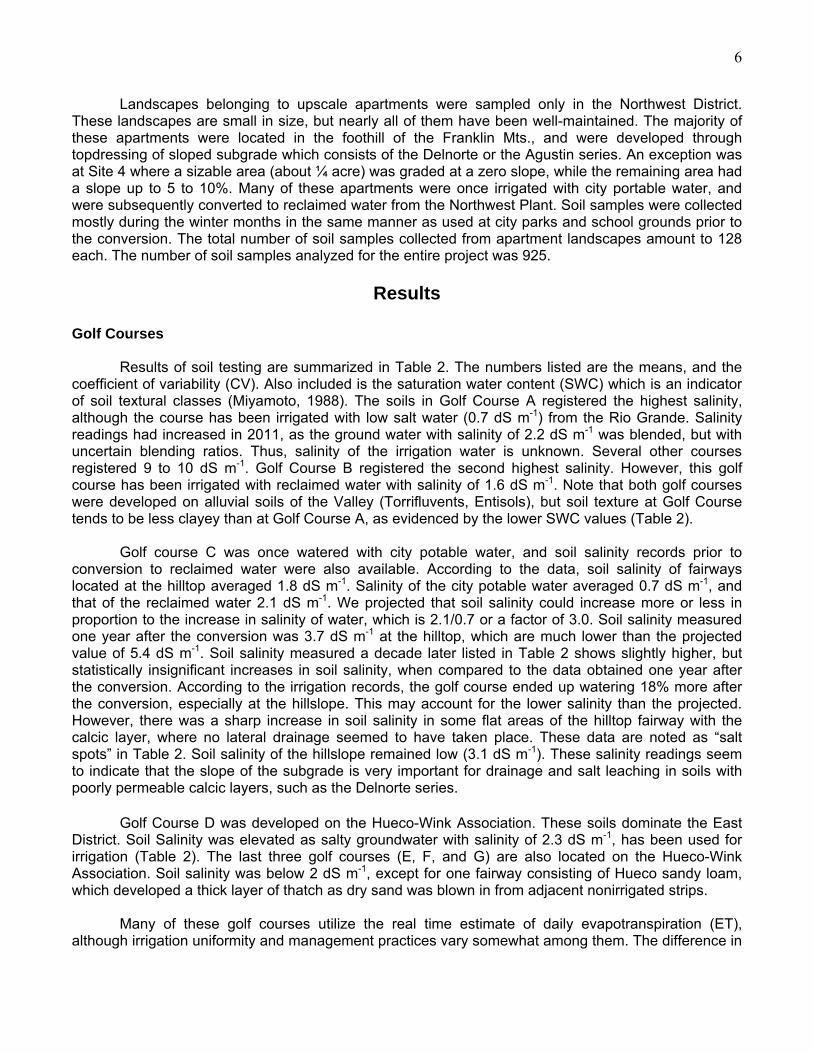
Landscapes belonging to upscale apartments were sampled only in the Northwest District. These landscapes are small in size, but nearly all of them have been well-maintained. The majority of these apartments were located in the foothill of the Franklin Mts., and were developed through topdressing of sloped subgrade which consists of the Delnorte or the Agustin series. An exception was at Site 4 where a sizable area (about ¼ acre) was graded at a zero slope, while the remaining area had a slope up to 5 to 10%. Many of these apartments were once irrigated with city portable water, and were subsequently converted to reclaimed water from the Northwest Plant. Soil samples were collected mostly during the winter months in the same manner as used at city parks and school grounds prior to the conversion. The total number of soil samples collected from apartment landscapes amount to 128 each. The number of soil samples analyzed for the entire project was 925.
Results
Golf Courses
Results of soil testing are summarized in Table 2. The numbers listed are the means, and the coefficient of variability (CV). Also included is the saturation water content (SWC) which is an indicator of soil textural classes (Miyamoto, 1988). The soils in Golf Course A registered the highest salinity, although the course has been irrigated with low salt water (0.7 dS m-1) from the Rio Grande. Salinity readings had increased in 2011, as the ground water with salinity of 2.2 dS m-1 was blended, but with uncertain blending ratios. Thus, salinity of the irrigation water is unknown. Several other courses registered 9 to 10 dS m-1. Golf Course B registered the second highest salinity. However, this golf course has been irrigated with reclaimed water with salinity of 1.6 dS m-1. Note that both golf courses were developed on alluvial soils of the Valley (Torrifluvents, Entisols), but soil texture at Golf Course tends to be less clayey than at Golf Course A, as evidenced by the lower SWC values (Table 2).
Golf course C was once watered with city potable water, and soil salinity records prior to conversion to reclaimed water were also available. According to the data, soil salinity of fairways located at the hilltop averaged 1.8 dS m-1. Salinity of the city potable water averaged 0.7 dS m-1, and that of the reclaimed water 2.1 dS m-1. We projected that soil salinity could increase more or less in proportion to the increase in salinity of water, which is 2.1/0.7 or a factor of 3.0. Soil salinity measured one year after the conversion was 3.7 dS m-1 at the hilltop, which are much lower than the projected value of 5.4 dS m-1. Soil salinity measured a decade later listed in Table 2 shows slightly higher, but statistically insignificant increases in soil salinity, when compared to the data obtained one year after the conversion. According to the irrigation records, the golf course ended up watering 18% more after the conversion, especially at the hillslope. This may account for the lower salinity than the projected. However, there was a sharp increase in soil salinity in some flat areas of the hilltop fairway with the calcic layer, where no lateral drainage seemed to have taken place. These data are noted as “salt spots” in Table 2. Soil salinity of the hillslope remained low (3.1 dS m-1). These salinity readings seem to indicate that the slope of the subgrade is very important for drainage and salt leaching in soils with poorly permeable calcic layers, such as the Delnorte series.
Golf Course D was developed on the Hueco-Wink Association. These soils dominate the East
District. Soil Salinity was elevated as salty groundwater with salinity of 2.3 dS m-1, has been used for irrigation (Table 2). The last three golf courses (E, F, and G) are also located on the Hueco-Wink Association. Soil salinity was below 2 dS m-1, except for one fairway consisting of Hueco sandy loam, which developed a thick layer of thatch as dry sand was blown in from adjacent nonirrigated strips.
Many of these golf courses utilize the real time estimate of daily evapotranspiration (ET),
although irrigation uniformity and management practices vary somewhat among them. The difference in

7
water quality and soils are likely to be the contributing factor for the difference in soil salinity. By reviewing the data shown in Table 2, there are two groups of water, one group with salinity less than 1 dS m-1, and another group with salinity 1.6 to 2.3 dS m-1. Among the low water salinity group, soil salinity of the golf courses located in upland was lower than those located in the Valley. Among the golf courses using water of elevated salinity, this pattern was, however, not distinct.
Course Name Soil Subgroup and Order ECw SARw ECe CV SCF SWCCode Soil Types dS m-1 dS m-1 % g/100g
A. Torrifluvents, Entisols1a #18 Harkey silty clay loam 0.7 2.7 4.6 20 6.6 561b #14 Saneli silty clay loam 0.7 2.7 6.1 25 8.7 56 #18 Harkey silty clay loam (?) (?) 5.8 23 - 54
#14 Saneli silty clay loam (?) (?) 7.5 24 - 59B. Torrifluvents, Entisols
2a Poor Glendale silty clay loam 1.6 7.3 5.2 29 3.3 572b Average Harkey silt loam 1.6 7.3 1.9 21 1.2 42
C. Paleortheids, Aridisols3a Salt Spots Delnorte gravelly loam 2.1 9.0 7.3 46 3.5 333b Hilltop Delnorte gravelly loam 2.1 9.0 4.1 28 1.5 323c Slope Delnorte gravelly loam 2.1 9.0 3.1 28 1.5 32
D. Calciorcthids, Aridisols 4a Wink sandy loam 2.3 11.0 3.7 10 1.6 304b Hueco sandy loam 2.3 11.0 3.5 8 1.9 34
E. Paleargid/Calciorthids, Aridisols5a Poor Hueco sandy loam 0.9 3.7 2.6 45 2.9 375b Average Wink sandy loam 0.9 3.7 2.0 25 2.2 28
F. Calciortheids, Aridisols6a Wink sandy loam 0.9 2.5 2.0 20 2.2 37
G. Calciortheids, AridisolsSect. A Calvary loam 0.7 3.0 1.8 41 2.6 44Sect. C Hueco loam 0.7 3.0 1.9 38 2.6 44
1 CV: The coefficient of variables2 SCF: The salt concentration factor3 SWC: The saturation water content
Table 2. Golf courses surveyed for salt accumulation in the El Paso area
City Parks and School Grounds Eastside: These parks are located on either Bluepoint series, or the Hueco-Wink Soil Association. Soil salinity of three parks sampled (Blackie Chesher, Hacienda Heights, and Yucca) provided the mean salinity of 1.6 dS m-1 with the coefficient of variability (CV) of 30.8%. Likewise, salinity of the soil samples collected from three schools (Valle Verde Campus softball field, Hillcrest Middle School, and Loma Terrace) provided virtually the same salinity, but with an elevated CV of 46%. These school grounds are also located on Bluepoint series. There were additional soil salinity data collected from parks and schools located on the Bluepoint series. They were lower than 1.8 dS m-1. It appears that salt accumulation is minimal in Bluepoint series.
Soil salinity of three parks sampled (Album, Dick Shinaut, and Pico Norte) in the Hueco-Wink Association was also low (<2.0 dS m-1), but was slightly higher than salinity of the Bluepoint Series. Note that the Hueco-Wink Association contains a calcic horizon, starting at a depth of 18 to 20 inches in the native state. However, the top soil of this soil series has been traded, and the topsoil depth ranges from 4 to 9 inches; shallowest at Dick Shinaut Park (around 4 to 6 inches), followed by Album Park. No

8
soil appeared to have been removed at Pico Norte Park. Soil salinity was highest at Dick Shinaut Park averaging 2.7 dS m-1. Soil salinity measurements for schools were limited to Walter Clark Middle School. This site had sandy topsoil to a depth of 4 to 7 inches over a soft calcic horizon (Fig. 3c). Soil salinity was somewhat elevated (2.3 dS m-1). When the depth of topsoil is very shallow, as it appears in Fig. 3a, irrigation water puddles and is exposed to evaporative losses, until it infiltrates. Fortunately, the calcic horizon of Wink sandy loam appears to be mostly permeable, although water retention is very low. However, some subsoils of Hueco loamy sand can be less permeable, thus yielding elevated soil salinity.
Central: No official soil map is available for this district, because it was already urbanized by the time of the soil survey conducted in 1971. We divided the district into the North and the South, using the Interstate 10 as a boundary. The soil samples from the North Central were found to be generally sandy, and included Austin, Grandview, Lincoln, Logan, Memorial, and Mary Webb Parks. Soil salinity averaged 1.9 dS m-1 with a CV of 32%. Soil salinity from two private schools (St. Anthony and Radford) registered somewhat lower salinity and lower CV. These soil samples appeared to be the Bluepoint series, except at Grandview Park, which has a hard sloped caliche layer with a shallow layer of topsoil. Soil samples from the two schools (St. Anthony and Radford) were also sandy, and soil salinity was
Table 3. Soil salinity and the saturation water content (SWC) of the soil samples collected from five districts and grouped based on soil typesDistricts Sample Soil Salinity SCF Mean SWC Soil Units Count mean CV1┘ + SD < 2 2 - 4 4 - 8 > 8
ppm dS m-1 # dS m-1 % dS m-1 g/100gEastU-2 Bluepoint Series 630 0.95
Parks 11 1.6 31 1.7 2.0 90 10 0 0 27Schools 11 1.5 46 1.6 2.2 70 30 0 0 29
U-3 Hueco-Wink Ass'n 630 0.95Parks 9 2.0 32 2.1 2.6 50 50 0 0 32Schools 2 2.3 35 2.4 3.1 - - - - -
CentralU-2,3 North Central 650 0.72
Parks 62 1.9 32 2.6 2.5 60 37 3 0 39Schools 14 1.4 21 1.9 1.7 93 7 0 0 40
V-3,4 South Central 650 0.72Parks 27 4.6 41 6.4 6.5 7 52 30 11 41Schools 38 3.8 60 5.3 6.0 26 42 26 6 41
Upper ValleyV-2,3,4 630 0.68
Parks 16 9.2 42 13.5 13.1 0 12 19 69 52Schools 4 9.1 86 13.3 16.9 - - - - 35
Lower ValleyV-2,3,4 700-850 0.9 - 1.1
Parks 29 8.4 69 8.4 14.1 17 31 28 24 43Schools 37 6.0 66 6.0 10.1 27 33 24 16 48
NorthwestU-4 City Water 630 0.68
Parks 20 1.3 34 1.9 1.8 80 20 0 0 30Schools 7 1.6 55 2.3 2.4 71 29 0 0 -
U-4 Reclaimed Water 1150 2.1Parks 65 4.3 36 2.0 5.8 12 56 26 6 38Schools 41 7.1 36 3.4 9.7 7 17 44 32 32
SD: Standard deviation1┘CV: Coefficient of variability
--------------%-------------
WaterSalinity
Frequency (dS m-1)

9
less than 2 dS m-1. Soil salinity of samples collected from the South Central was elevated. Salinity of the four parks (Orchard, Estrella-Rivera, Pera Luna, and Washington Park) in South Central averaged 4.6 dS m-1, and the CV was also elevated (41%). Salinity of school grounds (Bowie, Burleson, Jefferson, and Zavala) averaged 3.8 dS m-1 with the CV of 60%. The lowest soil salinity (1.8 dS m-1) was detected at Bowie HS with the soil texture ranging from loamy sandy to silty loam. The highest salinity (6.9 dS m-1) was recorded at Burleson which had clay loam, and a poor turf condition. The irrigation system was reported to be poor. Upper and Lower Valleys: Three parks (Marwood, White Spur, and West Green) and one school (Zach White) were sampled in the Upper Valley, and all had high salinity, averaging 9.2 dS m-1. Park soil samples from the Lower valley (Capistrano, South Middle Drain, Ysleta and Pavo Real) also had high salinity averaging 8.4 dS m-1 and a high CV of 69%. Two additional parks (Lancaster and North Middle Drain) were also sampled, and they registered low salinity. Lancaster Park is located on Vinton sandy loam, and North Middle Drain was filled with loamy sand. Salinity of the school ground samples from the Lower Valley, except at Ysleta Middle School, was also elevated with the mean value of 6.0 dS m-1 with a CV of 66%. Soil salinity data from Ysleta Middle School was not included for averaging, because it is flood-irrigated, using the project water. Soil salinity at the school was low, averaging 2.2 dS m-1 with a CV of 54%. The turf condition of this school was reported to be among the best for the schools in the District. Northwest: Six parks located in the upland area of the Northwest (Galatzan, Cloudview, Paul Harvey, Cresmont, Ponsford, and Falcon Hill) registered low salinity (1.3 dS m-1) with a CV of 34%. In fact, none of these parks registered salinity greater than 2.0 dS m-1. Crestmont and Ponsford parks are located on Bluepoint loamy sand. Likewise, salinity of seven school grounds sampled (Franklin, Morehead, Lyndon Johnson, Rivera, Putnum, Guerrero and Roberts) averaged 1.6 dS m-1. However, Franklin High School had elevated salinity of 3.3 dS m-1. These schools are located on the Delnorte-Canutio Association or on the Agustin series. All of these sites were topdressed with loamy sand or fine sandy loam. Many of these parks, which were once irrigated with city potable water, were converted to reclaimed water from the Northwest Plant. The average salinity of five parks irrigated with reclaimed water was 4.3 dS m-1 with a CV of 36%. Salinity of three parks (Galatzan, Cloudview, and Paul Harvey) was 1.3 dS m-1 and 4.7 dS m-1 before and after the conversion, respectively. The average salinity of four schools tested (Franklin, Canutillo HS, Coronado HS, and Western Hills ES) increased from 1.6 to 7.1 dS m-1. Franklin HS and Western Hills ES have experienced severe soil salinization. Apartments in the Northwest
Three apartment landscapes surveyed provided soil salinity of 1.7 dS m-1 with an average CV of
42% (Table 4). All of these landscapes were developed through topdressing over the designated soil types. An exception was Site 6 where silty clay loam was exposed. After conversion to reclaimed water, the mean salinity of the five apartments increased to 2.7 dS m-1 with an average CV of 40%. Salinity of Sites 3, 4 and 5 (where soil salinity data prior to and after the conversion were available) increased from 1.7 dS m-1 to 3.6 dS m-1. This rate of salinity increase was similar to the experience at Golf Course C located on Delnorte soil (Table 2). The conversion to reclaimed water at apartments 1 through 5 did not cause visible degradation of plantings, except at Apartment 5 where an area graded at zero slope developed salt problems due to poor drainage.

10
Table 4 Soil salinity and the saturation water content of the soil samples collected from apartments in the Northwest DistrictDistrict
(TNS)1┘ Soil Salinity Mean (TNS)1┘ Soil Salinity Mean Site ID Soil Types Mean CV1┘ +SD1┘ SWC2┘ Mean CV1┘ +SD1┘ SWC2┘
dS m-1 % dS m-1 g/100g dS m-1 % dS m-1 g/100g1 Delnorte grav. loam - - - - - (10) 1.5 20 1.8 412 Agustin grav sandy loam - - - - - (9) 2.8 57 4.4 423 Delnorte grav. loam (6) 1.4 21 1.7 38 (17) 2.8 57 4.4 374 Agustin grav sandy loam (11) 1.4 29 1.8 36 (13) 3.2 31 4.2 235 Delnorte grav. loam (10) 2.4 75 4.2 40 (9) 3.3 33 4.4 226 Unclassified clay loam (12) (5.6) (41) (7.9) (57) (31) (6.0) (85) (11.1) (53)
(39) 1.7 42 2.6 38 (89) 2.7 40 3.8 331┘TNS: Total number of samples analyzed. CV: Coefficient of variability SD: Standard deviation2┘SWC: Saturation water contentNumbers in parenthesis were not used to estimating the group average.
Reclaimed WaterCity Tap Water
Discussion
Threshold Soil Salinity: From a theoretical point of view, salt accumulation is considered to have occurred when soil salinity exceeded salinity of irrigation water. In reality, we use soil salinity levels which might affect plant growth as a practical criterion for soil salinization. When dealing with turfgrass species, for example, soil salinity levels exceeding 4 to 6 dS m-1 begin to affect growth, even with salt tolerant species, such as bermudagrass and ryegrass. When reaching 8 to 10 dS m-1, the growth essentially ceases (Miyamoto, 2008). Many tree species and some native plants have lower salt tolerance.
The actual mean soil salinity readings we obtained ranged from 1.4 to 9.2 dS m-1 (Tables 2 and 3). The soils with salinity exceeding 4 dS m-1 will be considered salinized. Another practical question arises relative to the use of the mean value for expressing salinity of the area of concern. If the mean value is used, we need to recognize that about half of the area is likely to have soil salinity greater than the mean value; and some of which could be as high as 6 or 8 dS m-1 or even higher. Such situations can lead to development of “salt spots” which are not acceptable to the modern standard of grounds maintenance, especially at golf courses and sports fields. An alternative would be to use the mean plus the standard deviation (SD). We have shown our results in both ways to accommodate the preference of readers.
According to the data shown in Tables 2 and 3, the highest (mean) soil salinity was observed in the Upper Valley where the mean salinity of city parks and school grounds was around 9 dS m-1. A golf course located in the Upper Valley also registered high soil salinity. This was followed by high soil salinity in the Lower Valley, and elevated salinity in the South Central and some areas of the Northwest District. Soil salinity was low in the East District as well as in the North Central. High soil salinity is definitely of concern for maintenance of landscapes except in the East and the North Central Districts. Causes of Soil Salinization: The prevailing idea held mainly by water supply engineer is that water quality dictates soil salinization. This idea, however, ignores the salt balance; how salts are leached out besides being loaded. The data presented at the onset (Fig. 1) indicate that this idea alone can not explain why some soils were salinized when irrigated with water of comparatively low salinity. Irrigation engineers believe that soil salinization is controlled by irrigation systems and management, besides water quality. The case in point is the low salinity at Ysleta MS where flood-irrigation, instead of sprinkler irrigation is practiced. However, this idea can not explain why soil salinity readings varied

11
widely within a field or among the different parks where irrigation systems or managements are similar. We believe that salt accumulation is influenced by the difference in soil types, irrigation management, as well as by water quality. In order to evaluate the potential for salt accumulation, we introduce a simple parameter referred to as the salt concentration factor (SCF)
SCF = ECe / ECw (1) where ECe is the electrical conductivity of the soil saturation extract, and ECw, the salinity of irrigation water. The actual SCF, using the mean salinity is shown in Table 3. For golf course data, we estimated SCF using the mean plus the standard deviation (Table 2) to better meet their needs. For this concept to be useful, the SCF should remain similar among similar soils, regardless of salinity of water used for irrigation. In the case of city parks surveyed in the Northwest district, the SCF did not change greatly; 1.9 with city potable water, and 2.0 with reclaimed water, although the actual soil salinity changed from 1.3 to 4.3 dS m-1 (Table 3). In the case of four schools surveyed, the mean SCF increased from 2.3 to 3.4 dS m-1. However, this apparent discrepancy is caused mainly by the unexpected sharp increase in salinity at Franklin HS, and Western Hill ES, both of which developed severe salinization. If we exclude these two schools, the SCF before and after the conversion was 2.3 and 2.4, respectively. In the case of apartments, the SCF before and after the conversion was 2.1 and 1.4, respectively, and it coincides with the hillside samples collected from Golf Course C which is located in the same area. The reduction in SCF upon the conversion to reclaimed water is likely related to an increase in irrigation. The specific cause(s) of soil salinization are site-specific. However, some general interpretations can be made for soil type influences. In the case of clayey alluvial soils developed in the Rio Grande Basin, the principal cause of salinization is undoubtedly related to inadequate permeability and high water holding capacity. In such soils, irrigation water puddles and can not infiltrate deep enough to cause salt leaching, as exemplified in Fig. 3g and Fig. 3i. An end result is high levels of salt accumulation in shallow depth of the soils. This problem appears to be compounded by high frequency light irrigation, such as practiced at Golf Course A which involves daily light irrigation. There is no doubt that soil compaction accentuates this problem. The high SCF reported in parks and schools in both the Upper and Lower Valleys are likely to be a result of soil compaction, besides the clayey texture. Also note that the CV of soil samples from the parks and schools are often highly elevated (40 to 80%), as compared to the CV at golf courses. The sparse turf cover along with uneven soil compaction and low uniformity of water application may have contributed to the high variability. In the case of the clayey soils of the Upper Valley, elevated sodicity may have compounded water penetration problems as well. High soil salinity, high SCF and high CV are repeated in the clayey soils of the Lower Valley, and to a lesser extent in loamy to clay loam soils in the South Central where the soils are less clayey (Table 3). There are basically three types of upland soils which contain a calcic horizon; Delnorte gravelly loam, Hueco sandy loam, and Wink sandy loam. The A-horizon of Delnorte soil is no more than 4 to 6 inches, whereas Hueco and Wink soils have 18 to 24 inches. However, subsoil permeability of Wink soil can be higher than that of Hueco soil. When subsoil permeability is low due to the presence of the indurated calcic layer, such as the Delnorte series, drainage would be impaired, unless there is a sufficient slope to cause lateral drainage. This seems to be a logical interpretation of the data obtained from Golf Course C (Table 2), and from apartment landscapes (Table 4). This problem, however, was not detected in parks and schools developed on the Hueco-Wink soils. The primary reason appears to be that both of these soils have adequate subsoil permeability plus the natural slope associated with a number of fault zones. It is also possible that the depth of the topsoil is deep enough to push salts away from the shallow sampling depth. In fact, we noted slightly elevated soil salinity when the topsoil depth was very shallow at Dick Shinaut Park as well as at Marty Robbins Park. When it is very shallow, water
12
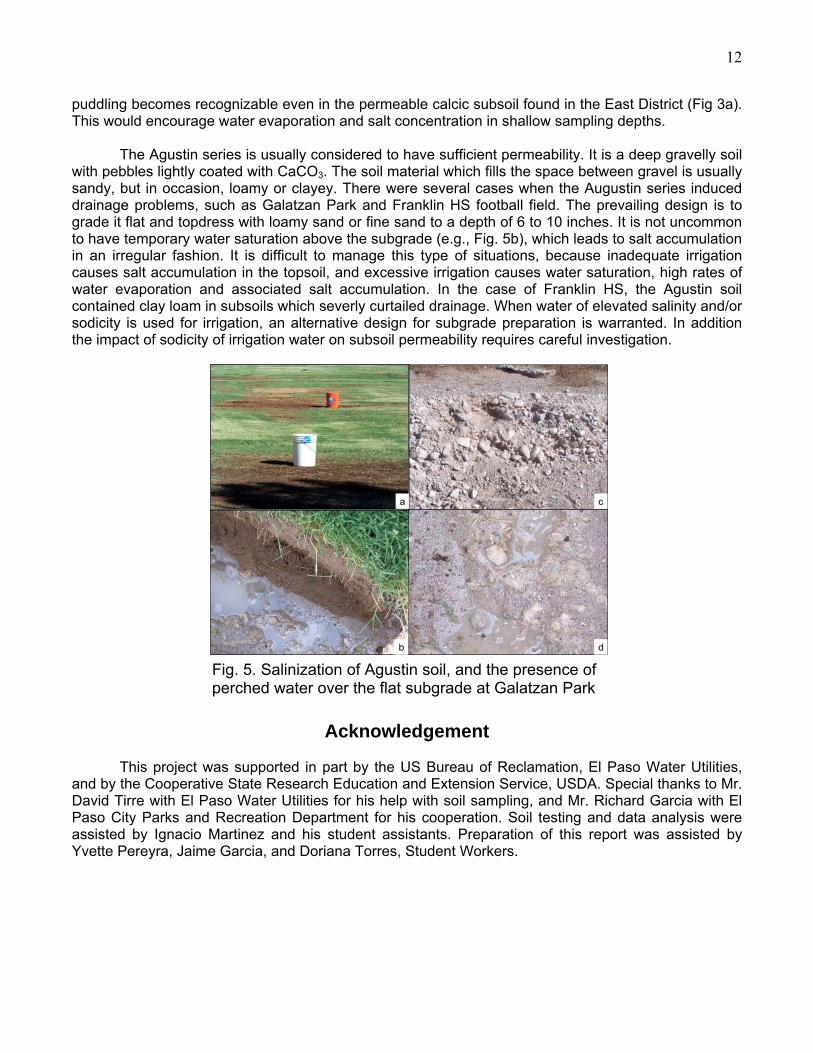
puddling becomes recognizable even in the permeable calcic subsoil found in the East District (Fig 3a). This would encourage water evaporation and salt concentration in shallow sampling depths. The Agustin series is usually considered to have sufficient permeability. It is a deep gravelly soil with pebbles lightly coated with CaCO3. The soil material which fills the space between gravel is usually sandy, but in occasion, loamy or clayey. There were several cases when the Augustin series induced drainage problems, such as Galatzan Park and Franklin HS football field. The prevailing design is to grade it flat and topdress with loamy sand or fine sand to a depth of 6 to 10 inches. It is not uncommon to have temporary water saturation above the subgrade (e.g., Fig. 5b), which leads to salt accumulation in an irregular fashion. It is difficult to manage this type of situations, because inadequate irrigation causes salt accumulation in the topsoil, and excessive irrigation causes water saturation, high rates of water evaporation and associated salt accumulation. In the case of Franklin HS, the Agustin soil contained clay loam in subsoils which severly curtailed drainage. When water of elevated salinity and/or sodicity is used for irrigation, an alternative design for subgrade preparation is warranted. In addition the impact of sodicity of irrigation water on subsoil permeability requires careful investigation.
b d
a c
Fig. 5. Salinization of Agustin soil, and the presence of perched water over the flat subgrade at Galatzan Park
Acknowledgement
This project was supported in part by the US Bureau of Reclamation, El Paso Water Utilities, and by the Cooperative State Research Education and Extension Service, USDA. Special thanks to Mr. David Tirre with El Paso Water Utilities for his help with soil sampling, and Mr. Richard Garcia with El Paso City Parks and Recreation Department for his cooperation. Soil testing and data analysis were assisted by Ignacio Martinez and his student assistants. Preparation of this report was assisted by Yvette Pereyra, Jaime Garcia, and Doriana Torres, Student Workers.

13
y (dS mDistrict
(TNS)1┘ (TNS)1┘East Mean CV Mean + SD SWC1┘ Mean CV Mean + SD SWC1┘ Sandy Blackie Chesher (4) 1.4 43 2.0 28 Valle Verde CC (2) 1.6 50 2.4 29 Hacienda Heights (2) 1.6 20 1.9 26 Hillcrest (6) 1.3 38 1.8 23 Yucca (5) 1.7 29 2.2 27 Loma Terrace (3) 1.6 50 2.4 25
(11) 1.6 31 2.0 27 (11) 1.5 46 2.2 26 Remaining Album (2) 1.2 25 1.5 39 Walter E. Clark (2) 2.3 35 3.1 29 Dick Shinaut (5) 2.7 63 4.4 35 Pico Norte (2) 2.2 9 2.4 43
(9) 2.0 32 2.7 39 (2) 2.3 35 3.1 29Central North Austin (6) 1.5 13 1.7 34 Anthony St. (3) 1.1 18 2.3 48 Grandview (7) 1.9 43 2.7 45 Radford (11) 1.7 24 2.9 32 Lincoln (10) 2.1 29 2.7 33 Logan (5) 1.7 45 2.5 39 Memorial (20) 1.8 25 2.3 46 Mary Webb (14) 2.6 31 3.4 35
(62) 1.9 31 2.5 39 (14) 1.4 21 1.7 40 South Estrella-Rivera (5) 7.4 41 10.4 36 Bowie (11) 1.8 61 2.9 33 Orchard (8) 2.9 31 3.8 43 Burleson (6) 6.2 69 10.5 40 Pera-Luna (5) 4.3 44 6.2 51 Jefferson (19) 3.8 42 5.4 49 Washington (9) 3.6 50 5.4 34 Zavala (2) 3.3 67 5.5 43
(27) 4.6 41 6.5 41 (38) 3.8 60 6.0 41Upper Valley Marwood (4) 19.4 63 31.7 47 Zach White (4) 9.1 86 16.9 35 Valley Creek (4) 11.2 41 15.8 71 White Spur (4) 12.3 53 18.8 32 West Green (4) 6.2 65 10.2 58
(16) 9.2 42 13.1 52 (4) 9.1 86 16.9 35Lower Valley Capistrano (5) 12.4 89 23.4 51 Camino Real (4) 4.6 49 6.9 62 Lancaster (3) (1.7) (24) (2.1) (44) Capistrano (ES) (3) 6.2 50 9.3 31 Middle Drain (North) (4) (1.7) (35) (2.3) (30) Del Valle (7) 5.6 88 10.5 29 Middle Drain (South) (6) 5.7 67 9.5 50 Lancaster (4) 7.6 80 13.7 60 Ysleta (4) 8.9 87 16.6 27 Le Barron (4) 5.4 72 9.3 42 Pavo Real (7) 6.5 32 8.6 46 Presa (4) 4.6 56 7.2 45
South Loop (5) 8.1 64 13.3 66Ysleta MS (6) (2.2) (55) (3.4) (62)
(29) 8.4 69 14.1 43 (37) 6.0 66 10.0 48NorthwestTap Water Galatzan (3) 1.3 23 1.6 30 Franklin (1) 3.3 - - - Cloudview (6) 1.5 40 2.1 27 Paul Harvey (2) 1.2 8 1.3 33 Morehead (1) 0.9 - - -
Lyndon B. Johnson (1) 0.8 - - - Cresmont (3) 0.9 44 1.3 28 Rivera (1) 1.2 - - - Ponsford (2) 1.1 18 1.3 34 Putnam (1) 1.3 - - - Falcon Hill (4) 1.9 68 3.2 28 Guerrero (1) 1.3 - - -
Roberts (1) 2.2 - - -(20) 1.3 34 1.8 30 (7) 1.6 55.0 2.4 -
Reclaimed Water Galatzan (16) 7.2 54 11.1 35 Franklin HS (16) 9.4 33 12.5 34 Cloudview (4) 4.4 36 6.0 41 Paul Harvey (26) 2.4 25 3.0 50 Western Hills (ES) (2) 8.9 40 12.5 28
Coronado High (3) 5.6 27 7.1 37 Snow Heights (6) 3.4 24 4.2 38 Canutillo HS (20) 4.5 44 6.5 31 Three Hills (13) 4.0 43 5.7 24
(65) 4.3 36 5.8 38 (41) 7.1 36 9.7 32TNS: Total number of samples analyzed, CV: Coefficient of Variability, SD: Standard Deviation, SWC: Saturation Water Content.Numbers in parenthesis were not used to estimating the group average.
Soil Salinity at the City Parks and School Grounds SurveyedAppendix
Salinity (dS m-1) Salinit -1)SchoolsParks

14
References Lovejoy, E.P., and W.C. Cornell, 1996. El Paso’s Geological Past, Texas Western Press. The
University of Texas at El Paso. Miyamoto, S. 2008. Salt Tolerance of Landscape Plants Common to the Southwest. Texas Water
Resources Institute, Technical Report No. 316. Miyamoto et. al., 2005. Soil Salinity of Urban Turf Areas Irrigated with Saline Water. I. Spatial
Variability. Landscape and Urban Plan. 71: 233-241. Miyamoto, S., 2000. Soil Resources of El Paso: Characteristics, Distribution, and Management
Guidelines. Texas A&M University, Agricultural Research Center at El Paso, Texas. Center Special Publication. 49 pages.
Miyamoto, S., 1988. Sampling Irrigated soils for salinity Appraisal. Tex. Agr. Ext. Sta. Tech. Buil. 1570. Rhodes, J.D., and S. Miyamoto, 1990. Testing Soils for Salinity and Sodicity. In Soil Testing and Plant
Analysis. Westman (Ed) SSSA. Madison, WI. USDA, SCS/TAES, 1971. Soil Survey. El Paso County. USGA, 1994. Wastewater Reuse for Golf Course Irrigation. Lewis Publishers Inc. Westcot, D.Q., and R.S Ayers, 1984. Irrigation Water Quality Criteria in “Irrigation with Reclaimed
Municipal Wastewater”- A Guidance Manual Report No. 84-1 California State Water Res. Ctr. Board. Sacramento, CA.
Salinity1 dS m-1 = 650 to 680 ppm
Length1 cm = 0.4 inches or 1 inch = 2.54 cm1 km = 0.62 miles or 1 mile = 1.61 km
Area1 ha = 2.47 acres or 1 acre = 0.405 ha
1 km2 = 247 acres or 1 sq. mile = 2.59 km2
Volume1 liter = 0.264 gallons or 1 gallon = 3.78 liters
Unit Conversion