Sales Pipeline/Funnel Management Template (with Win Loss ... Guides... · Sales Funnel/Pipeline...
23
[email protected] 4/27/2011 Sales Pipeline/Funnel Management Template (with Win Loss Analysis) User Guide Sales Funnel/Pipeline Management Template This Excel-based template is a comprehensive application for Sales Funnel/Pipeline management. The sales pipeline management system provides analysis by Sales Region, Sales Executive, Lead Source, Pipeline Stage, Product Group and Market Sector. The analysis is available in both tabular and chart forms. This user guide covers two products (1) the Pipeline Management Template and (2) the Pipeline Template that incorporates comprehensive Win Loss analysis. The Excel templates are totally customizable, and use only standard Excel features.
Transcript of Sales Pipeline/Funnel Management Template (with Win Loss ... Guides... · Sales Funnel/Pipeline...

4/27/2011
Sales Pipeline/Funnel
Management Template (with Win
Loss Analysis) User Guide
Sales Funnel/Pipeline Management Template
This Excel-based template is a comprehensive application for Sales
Funnel/Pipeline management. The sales pipeline management system
provides analysis by Sales Region, Sales Executive, Lead Source, Pipeline
Stage, Product Group and Market Sector. The analysis is available in both
tabular and chart forms. This user guide covers two products (1) the
Pipeline Management Template and (2) the Pipeline Template that
incorporates comprehensive Win Loss analysis. The Excel templates are
totally customizable, and use only standard Excel features.

4/27/2011
www.businesstoolsstore.com 1
Copyright © 2011 The Business Tools Store
SALES PIPELINE/FUNNEL MANAGEMENT
TEMPLATE (WITH WIN LOSS ANALYSIS)
USER GUIDE
Sales Funnel/Pipeline Management Template
INTRODUCTION This Excel-based spreadsheet template is a comprehensive system for Sales Funnel/Pipeline
management.
The sales Funnel/Pipeline management template provides a detailed analysis of the sales
funnel / sales pipeline by:
Sales Region,
Sales Executive,
Lead Source,
Pipeline Stage
Product Group and
Market Sector.
The analysis is available in both tabular and chart forms.
The highly flexible Excel template allows the user to set up flexible tables to define sales
regions, sales executives, lead sources, pipeline stages and associated probability of
closing, and market sectors.
Entering new sales opportunities in the sales funnel / sales pipeline is then made "quick and
easy" by selecting the table entry from a dropdown list. This approach also eliminates typing
errors in inserting any of these parameters. There is no limit to the number of Sales
Regions, Sales Executives, etc. that can be used
The funnel / pipeline net value of each opportunity is calculated based on the funnel /
pipeline stage and associated probability of closing an opportunity in that stage of the funnel
/ pipeline. Part 2 of the guide covers the additional features that are available with the
version that includes Win Loss analysis.
These templates use Excel 2007 of later version features and are NOT compatible with
earlier versions of Excel.
Macros should be enabled in the Excel environment.

4/27/2011
www.businesstoolsstore.com 2
Copyright © 2011 The Business Tools Store
These templates are available as one of three companion template set.
1. The Sales Pipeline Funnel Planner & Calculator identified the level of new business
leads/opportunities required to achieve the sales revenue budget. (Excel 2003)
2. The Sales Leads Generation Plan and Budget template develops a plan and budget to
generate the necessary leads by different marketing sources or categories, i.e. trade
show, telemarketing, etc. (Excel 2003)
3. The Sales Pipeline / Sales Funnel Management template provides a comprehensive
pipeline management system for all new and current opportunities as they progress
through the sales funnel / sales pipeline. (Excel 2007).
4/27/2011
www.businesstoolsstore.com 3
Copyright © 2011 The Business Tools Store
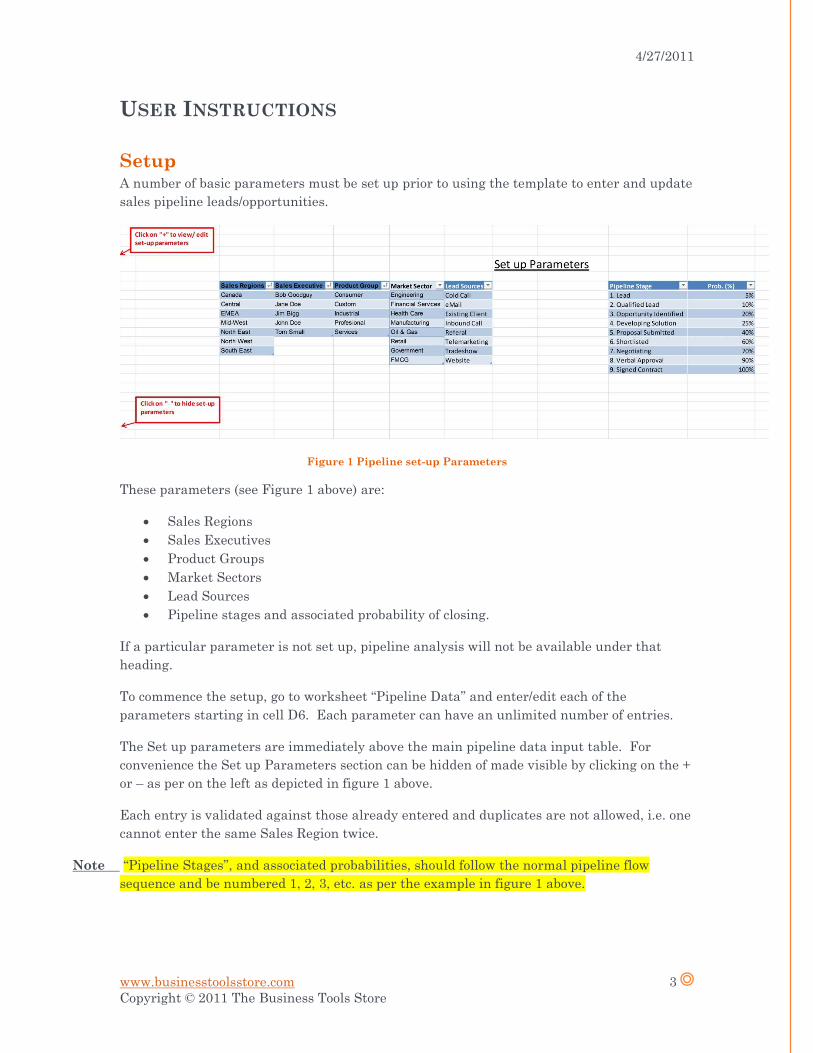
USER INSTRUCTIONS
Setup A number of basic parameters must be set up prior to using the template to enter and update
sales pipeline leads/opportunities.
Figure 1 Pipeline set-up Parameters
These parameters (see Figure 1 above) are:
Sales Regions
Sales Executives
Product Groups
Market Sectors
Lead Sources
Pipeline stages and associated probability of closing.
If a particular parameter is not set up, pipeline analysis will not be available under that
heading.
To commence the setup, go to worksheet “Pipeline Data” and enter/edit each of the
parameters starting in cell D6. Each parameter can have an unlimited number of entries.
The Set up parameters are immediately above the main pipeline data input table. For
convenience the Set up Parameters section can be hidden of made visible by clicking on the +
or – as per on the left as depicted in figure 1 above.
Each entry is validated against those already entered and duplicates are not allowed, i.e. one
cannot enter the same Sales Region twice.
Note “Pipeline Stages”, and associated probabilities, should follow the normal pipeline flow
sequence and be numbered 1, 2, 3, etc. as per the example in figure 1 above.

4/27/2011
www.businesstoolsstore.com 4
Copyright © 2011 The Business Tools Store
Enter & Update Sales Pipeline Opportunities
New Sales Opportunities are entered and existing Opportunities are updated as they
progress through the sales pipeline/funnel.
Figure 2 Pipeline Input Data Table
Go to the “Pipeline Data” worksheet.
The Pipeline data input table (see figure 2 above) commences in cell B28 and can have an
unlimited number of entries.
To ensure that the validation and formatting of the Input Data Table is maintained as new
rows are added to the table, please “tab” out of the last cell of the table, i.e. the Weighted Net
Value cell (column U) in the last row of the table; A new row with appropriate formating and
validation will be automatically added to the table.
If you are using the version incorporating Win Loss analysis, please “tab” out of the last cell
of the table, i.e. the Reason for Status cell (column Y) in the last row of the table; A new row
with appropriate formatting and validation will be automatically added to the table..
ENTERING NEW OPPORTUNITIES
For each new opportunity enter the following:
Opportunity Description: This is a free format text field and a recognisable description
should be entered.
Sales Region: The relevant “Sales Region” should be selected from the dropdown list of
valid Sales Regions. Any new Sales Region should entered via the Setup table as described in
page 3 above.
Sales Executive: The relevant “Sales Executive” should be selected from the dropdown list
of valid Sales Executives. Any new Sales Executive should be entered via the Setup table as
described in page 3 above.

4/27/2011
www.businesstoolsstore.com 5
Copyright © 2011 The Business Tools Store
Product Group: The relevant “Product Group” should be selected from the dropdown list of
valid Product Groups. Any new Product Group should be entered via the Setup table as
described in page 3 above.
Lead Source: The relevant “Lead Source” should be selected from the dropdown list of valid
Lead Sources. Any new Lead Source should be entered via the Setup table as described in
page 3 above.
Market Sector: The relevant “Market Sector” should be selected from the dropdown list of
valid Market Sectors. Any new Market Sector should be entered via the Setup table as
described in page 3 above.
Gross Value: The estimated Gross Value of the opportunity should be entered as a whole
positive number.
Projected Close Date: Enter the estimated close date for this opportunity. It should be
entered in MM/YYYY format; e.g. 09/2012
Current Pipeline Stage: The relevant “Current Pipeline Stage” should be selected from the
dropdown list of valid Pipeline Stages. Any changes to the Pipeline Stages or their associated
probabilities should be entered via the Setup table as described in page 3 above. However,
such changes may effect the existing entries in the Active Sales Pipeline.
Probability of Close: This field is automatically calculated based on the Pipeline Stage
selected.
This cell should NOT be edited.
Weighted Net Value: This field is automatically calculated by multiplying the Gross Value
by the Probability of Closing the opportunity; which in turn is based on the Pipeline Stage
selected.
This cell should NOT be edited.
UPDATING EXISTING OPPORTUNITIES
To update an existing opportunity the relevant Opportunity should be selected and the
chosen fields can be updated, typically such updates would involve updating the estimated
Gross Value or Projected Close Date and the Pipeline Stage as the Opportunity is
progressed through the Sale Pipeline/Funnel. However, any of the field can be updated, e.g.
responsible Sales Executive changed.
As for New Opportunities, the Probability of Close and Weighted Net Value should not be
edited.

4/27/2011
www.businesstoolsstore.com 6
Copyright © 2011 The Business Tools Store
CLOSING & DELETING EXISTING OPPORTUNITIES
All Opportunites have a specific Lifecycle that results in a Sales Win, Sales Loss or
a decision to Opt Out.
At the end of the Opportunity Lifecycle the Opportunity should be removed from
the Active Pipeline.
For users of the system incorporating the Win Loss analysis at the end of the
Opportunity Lifecycle the opportunities are automatically moved to the Win Loss
analysis. (See page 16 below)
For users who do not have Win Loss analysis the following procedure should be
followed:
To remove an Opportunity the following procedure should be followed:
1. Right mouse click on any field in the Opportunity to be removed.
2. Select “Delete”from the right mouse button menu
3. Select “Table Rows” from the Delete submenu.
RESFRESHING DATA
Once the Sales Pipeline data has been edited it is important to “Refresh” the data to update
all the Analysis Tables/Reports and Charts.
To Refresh the data the following procedure should be followed:
Select the Excel “Data” ribbon on the main menu (top of the screen)
Choose the “Refresh All” option.

4/27/2011
www.businesstoolsstore.com 7
Copyright © 2011 The Business Tools Store
Analysis The Sales Pipeline/Funnel template provides a comprehensive range of analysis outputs to
facilitate detailed Pipeline management.
The reports generated include:
Pipeline by Sales Region and Sales Executive within each Region
Pipeline by Sales Executive and Sales Opportunities managed by each Sales
Executive
Pipeline by Pipeline Stage by Sales Region and Sales Executive within each Region.
Pipeline by Lead Source
Pipeline by Market Sector and Sales Region within each Market Sector.
Pipeline by Product Group and Sales Region within each Product Group.
The Charts created include:
Bar chart of Pipeline by Sales Region and Pipeline Stage within each Region
Pie chart of Pipeline by Pipeline Stage
Pie chart of Pipeline by Lead Source.
PIPELINE BY SALES REGION AND SALES EXECUTIVE WITHIN EACH REGION
Filter Options
Figure 3 Sales Region/Sales executive
Expand/Collapse
The Regional analysis, as depicted in figure 3 above, by default includes all Regions and
Months. The Filter Options highlighted allow the report to be filtered to include only specific
Regions or Months.
Within each Region a full analysis is provided for each Sales Executive active within the
Region. Using the Expand/Collapse option highlighted allows the user to show all the details
or to show only Regional totals. The Expand/Collapse option shows a “-“ where the details
Pipeline Value Close Date
Sales Region/Sales Exec. Sep-12 Oct-12 Nov-12 Dec-12 Dec-12 Jan-13 Mar-13 Apr-13 May-13 Jun-13 Grand Total
Canada 120,000 45,000 225,000 390,000
Bob Goodguy 120,000 45,000 165,000
Jim Bigg 225,000 225,000
EMEA 80,000 30,000 100,000 210,000
Jane Doe 80,000 30,000 100,000 210,000
Mid-West 45,000 50,000 95,000
Tom Small 45,000 50,000 95,000
Central 200,000 250,000 50,000 80,000 580,000
Jim Bigg 200,000 50,000 80,000 330,000
John Doe 250,000 250,000
North East 20,000 20,000
Tom Small 20,000 20,000
Grand Total 280,000 75,000 50,000 250,000 70,000 120,000 80,000 45,000 225,000 100,000 1,295,000

4/27/2011
www.businesstoolsstore.com 8
Copyright © 2011 The Business Tools Store
can be collapsed to show the Regional data summarized and a “+” where the Region total can
be expanded to show the Sales Executives details.
PIPELINE BY SALES EXECUTIVE AND SALES OPPORTUNITIES MANAGED BY
EACH SALES EXECUTIVE
Filter Options
Figure 4 Sales Executive/Opportunity
Expand/Collapse
The analysis by Sales Executive, as depicted in figure 4 above, by default includes all Sales
Executives and Months. The Filter Options highlighted allow the report to be filtered to
include only specific Sales Executives or Months.
Within each Sales Executive details a full analysis is provided for each Sales Opportunity.
Using the Expand/Collapse option highlighted allows the user to show all the opportunity
details or to show only Sales Executive totals. The Expand/Collapse option shows a “-
“ where the details can be collapsed to show the Sales Executive data summarized and a “+”
where the Sales Executive total can be expanded to show the Sales Opportunities details.
Pipeline Gross Value Closing Date
Sales Exec by Opportunity Sep-12 Oct-12 Nov-12 Dec-12 Dec-12 Jan-13 Mar-13 Apr-13 May-13 Jun-13 Grand Total
Bob Goodguy 120,000 45,000 165,000
Big Oil 120,000 120,000
Dept. of Energy 45,000 45,000
Jane Doe 80,000 30,000 100,000 210,000
ABC Inc 30,000 30,000
Hi_Tech Inc 80,000 80,000
Good Food Ltd 100,000 100,000
Tom Small 45,000 50,000 20,000 115,000
Poject X 45,000 45,000
XYZ Inc Pilot Project 50,000 50,000
High Flyers Inc 20,000 20,000
Jim Bigg 200,000 50,000 80,000 225,000 555,000
Big Company Inc 200,000 200,000
High Street Saving Bank 50,000 50,000
Another Bank 225,000 225,000
Defence Dept 80,000 80,000
John Doe 250,000 250,000
ABC BioTech Inc 250,000 250,000
Grand Total 280,000 75,000 50,000 250,000 70,000 120,000 80,000 45,000 225,000 100,000 1,295,000

4/27/2011
www.businesstoolsstore.com 9
Copyright © 2011 The Business Tools Store
PIPELINE BY PIPELINE STAGE BY REGION AND SALES EXECUTIVE
Filter Options
Expand/Collapse
Figure 5 Pipeline stage/Sales Executive
The analysis by Pipeline Stage, as depicted in figure 5 above, by default includes all Pipeline
Stages and Months. The Filter Options highlighted allow the report to be filtered to include
only specific Pipeline Stages or Months.
Within each Pipeline Stage a full analysis is provided for each Sales Region and Sales
Executive. Using the Expand/Collapse option highlighted allows the user to show all the
details or to show only Pipeline Stage totals. The Expand/Collapse option shows a “-“ where
the details can be collapsed to show the Pipeline Stage data summarized and a “+” where the
Pipeline Stage total can be expanded to show the details.

4/27/2011
www.businesstoolsstore.com 10
Copyright © 2011 The Business Tools Store
PIPELINE BY LEAD SOURCE
Filter Options
Figure 6 Pipeline by Lead Sources
The analysis by Lead Source, as depicted in figure 6 above, by default includes all Lead
Sources and Months. The Filter Options highlighted allow the report to be filtered to include
only specific Lead Sources or Months.
PIPELINE BY MARKET SECTOR AND SALES REGION
Filter Options
Figure 7 Market Sector/Sales Region
Expand/Collapse
The analysis by Market Sector, as depicted in figure 7 above, by default includes all Market
Sectors and Months. The Filter Options highlighted allow the report to be filtered to include
only specific Market Sectors or Months.
Pipeline by Close Date
Lead Source Sep-12 Oct-12 Nov-12 Dec-12 Dec-12 Jan-13 Mar-13 Apr-13 May-13 Jun-13 Grand Total
Existing Client 30,000 45,000 225,000 300,000
Inbound Call 45,000 45,000
Tradeshow 120,000 80,000 200,000
Website 280,000 50,000 330,000
eMail 70,000 70,000
Cold Call 100,000 100,000
Referal 250,000 250,000
Grand Total 280,000 75,000 50,000 250,000 70,000 120,000 80,000 45,000 225,000 100,000 1,295,000
Gross Value by Column Labels
Market & Sales Region Sep-12 Oct-12 Nov-12 Dec-12 Dec-12 Jan-13 Mar-13 Apr-13 May-13 Jun-13 Grand Total
Financial Services 30,000 50,000 225,000 305,000
Canada 225,000 225,000
Central 50,000 50,000
EMEA 30,000 30,000
Manufacturing 80,000 50,000 130,000
EMEA 80,000 80,000
Mid-West 50,000 50,000
Oil & Gas 120,000 120,000
Canada 120,000 120,000
Retail 45,000 20,000 65,000
Mid-West 45,000 45,000
North East 20,000 20,000
Health Care 200,000 250,000 450,000
Central 200,000 250,000 450,000
Government 80,000 45,000 125,000
Canada 45,000 45,000
Central 80,000 80,000
FMCG 100,000 100,000
EMEA 100,000 100,000
Grand Total 280,000 75,000 50,000 250,000 70,000 120,000 80,000 45,000 225,000 100,000 1,295,000

4/27/2011
www.businesstoolsstore.com 11
Copyright © 2011 The Business Tools Store
Within each Market Sector a full analysis is provided for each Sales Region. Using the
Expand/Collapse option highlighted allows the user to show all the details or to show only
Market Sector totals. The Expand/Collapse option shows a “-“ where the details can be
collapsed to show the Market Sector data summarized and a “+” where the Market Sector
total can be expanded to show the Sales Regions details.
PIPELINE BY PRODUCT GROUP AND SALES REGION
Filter Options
Figure 8 Product Group/Sales Regions
Expand/Collapse
The analysis by Product Group by Sales Region, as depicted in figure 8 above, by default
includes all Product Groups and Months. The Filter Options highlighted allow the report to
be filtered to include only specific Product Groups or Months.
Within each Product Group a full analysis is provided for each Sales Region. Using the
Expand/Collapse option highlighted allows the user to show all the details or to show only
Product Group totals. The Expand/Collapse option shows a “-“ where the details can be
collapsed to show the Product Group data summarized and a “+” where the Market Sector
total can be expanded to show the Sales Regions details.
Gross Values Closing Months
Product Group/Region Sep-12 Oct-12 Nov-12 Dec-12 Dec-12 Jan-13 Mar-13 Apr-13 May-13 Jun-13 Grand Total
Consumer 100,000 100,000
EMEA 100,000 100,000
Custom 20,000 20,000
North East 20,000 20,000
Industrial 200,000 50,000 250,000 120,000 620,000
Canada 120,000 120,000
Central 200,000 250,000 450,000
Mid-West 50,000 50,000
Profesional 30,000 50,000 225,000 305,000
Canada 225,000 225,000
Central 50,000 50,000
EMEA 30,000 30,000
Services 80,000 45,000 80,000 45,000 250,000
Canada 45,000 45,000
Central 80,000 80,000
EMEA 80,000 80,000
Mid-West 45,000 45,000
Grand Total 280,000 75,000 50,000 250,000 70,000 120,000 80,000 45,000 225,000 100,000 1,295,000

4/27/2011
www.businesstoolsstore.com 12
Copyright © 2011 The Business Tools Store
BAR CHART OF PIPELINE BY SALES REGION AND PIPELINE STAGE WITHIN
EACH REGION
Figure 9 Sales Regions/Pipeline Stage
The bar chart shows the Pipeline by Region by Pipeline stage in figure 9 above.
The gross values of the Pipeline by Region by Stage are depicted in the legend table below
the bar chart.

4/27/2011
www.businesstoolsstore.com 13
Copyright © 2011 The Business Tools Store
PIE CHART OF PIPELINE BY PIPELINE STAGE
Figure 10 Pipeline Net Value by Stage
The Pie chart, as depicted in figure 10 above, shows the breakdown of the Pipeline Gross
Value by Stage.

4/27/2011
www.businesstoolsstore.com 14
Copyright © 2011 The Business Tools Store
PIE CHART OF PIPELINE BY LEAD SOURCE.
Figure 11 Pipeline Gross Value by Lead Source
The Pie chart, as depicted in figure 11 above, shows the breakdown of the Pipeline Gross
Value by Lead Source.

4/27/2011
www.businesstoolsstore.com 15
Copyright © 2011 The Business Tools Store
Customization and Enhancement The template uses only standard features of Excel 2007 and is fully customizable. The
Pipeline Management template does not use any macros. The version that provides Win
Loss analysis has a single macro to automatically update the Win Loss Data table. This
macro can be edited by a competent individual.
The main features used are:
Table option for Setup and Data Input.
Data Validation for Setup and Data Input
Pivot Tables and Pivot Charts for the analysis.
Each of the tables used for the Pipeline Parameters such as Sales Region, Sales Executive,
etc. can have any unlimited number of entries in the current template without any
customization.
An unlimited number of sales opportunity entries can be made in the template’s current form
without any customization.
Validation procedures identify and prevent duplicate entries for the Pipeline Parameters.
For Data Input the validation procedures ensure that only valid parameters are entered by
selecting them from the appropriate dropdown list.
The analysis uses standard Pivot Tables and Pivot Charts and can be modified by any user
familiar with these Excel 2007 features.
Additional analysis reports and charts can be developed by creating new reports or charts
using standard Excel 2007 Pivot Tables and Pivot Charts features.

4/27/2011
www.businesstoolsstore.com 16
Copyright © 2011 The Business Tools Store
WIN LOSS ANALYSIS FEATURES Detailed Win Loss analysis features are provided in the Sales Pipeline Management
template that incorporates Win Loss Analysis.
This section highlights the differences to the standard Sales Pipeline Management template
described above.
Setup A basic set up parameters described in page 3 above have additional parameters that
describe the Win Loss status and the reasons for the outcome on which the Win Loss analysis
is based on as per figure 12 below.
Figure 12 Setup Parameters including Win Loss
The incremental parameters are Lead Status and Reason for Status. The default lead
outcome statuses are Win, Loss or Opted Out. These can be edited and others added if
appropriate. The Win Loss analysis is based on the outcomes setup here.
The other additional Setup parameter is “Reason for Status” Typical reasons for status are
Win: existing Customer, Price/value, product quality, etc.; Loss: Price, lack of good fit, limited
product range, etc. or you may have Opted Out due to lack of budget, or scale/resources.
Comprehensive analysis is based on the Reasons for Status.
Enter & Update Sales Pipeline Opportunities
New Sales Opportunities are entered and existing Opportunities are updated as they
progress through the sales pipeline/funnel.
Additional input fields that describe the Win Loss status and the reasons for the outcomes on
which the Win Loss analyses are based are used as per figure 13 below.

4/27/2011
www.businesstoolsstore.com 17
Copyright © 2011 The Business Tools Store
Figure 13 Pipeline Input Data Table
The Pipeline Data input table as depicted in figure 13 above has two fields that should be
completed once the Opportunity outcome, i.e., Win, Loss or Opt Out, is known. These fields
are used to provide the outcome Status and the Reason for the Status in columns W and Y.
Lead Status: The relevant “Lead Status” should be selected from the dropdown list of valid
Lead statuses.
Reason for Status: The relevant “Reason for Status” should be selected from the dropdown
list of valid Reasons for Status.
CLOSING & DELETING EXISTING OPPORTUNITIES
All Opportunites have a specific Lifecycle that results in a Sales Win, Sales Loss or a decision
to Opting Out.
Prior to the Win Loss analysis these Opportunities should be removed from the Active
Pipeline and added to the Win Loss Analysis table.
The Win Loss Update button in cell Y 25 as depicted in figure 13 should be used to
automatically remove these opportunities from the active pipeline and move them to the Win
Loss data table.
All opportunities with an entry in the Status column will be moved and deleted from the
active pipeline table.
Win Loss update Button

4/27/2011
www.businesstoolsstore.com 18
Copyright © 2011 The Business Tools Store
Win Loss Analysis The Win Loss Data table as depicted in figure 14 below
Figure 14 Win Loss Data Table
This data in this table is used as the basis for the comprehensive Win Loss analysis
described below.
WIN LOSS BY REASON AND CLIENT BY CLOSE MONTH
Filter Options
Figure 15 Win Loss by Reason and Client
Expand/Collapse
Project ID. Sales Region Sales Executive Product Group Market Sector Lead Source Gross Value Projected Close Date Current Pipeline Stage Probability of Close Weighted Net Value Lead Status Reason for Status
Test ABC Canada Jim Bigg Profesional Health Care Existing Client 50,000 Dec-12 2. Qualified Lead 10% 5,000 Loss Win: Price/Value
Dept. of Energy Canada Bob Goodguy Services Government Existing Client 45,000 Sep-12 9. Signed Contract 20% 9,000 win Win: Existing Customer
XYZ Inc Pilot Project North East Tom Small Industrial Manufacturing Website 50,000 Nov-12 5. Proposal Submitted 40% 20,000 Loss Loss: Company Size/Resources
High Street Saving Bank Central Jim Bigg Profesional Financial Services eMail 50,000 Sep-12 9. Signed Contract 100% 50,000 Win Win: Existing Customer
High Flyers Inc North East Tom Small Custom Retail eMail 20,000 Aug-12 9. Signed Contract 100% 20,000 Win Win: After Sales Service
Big Oil Canada Bob Goodguy Industrial Oil & Gas Tradeshow 120,000 Jan-13 3. Opportunity Identified 20% 24,000 Opted Out Opted Out: Not Good Fit
Another Bank Canada Jim Bigg Profesional Financial Services Existing Client 225,000 Dec-12 7. Negotiating 70% 157,500 Loss Loss: Price
ABC BioTech Inc Central John Doe Industrial Health Care Referal 250,000 Dec-12 9. Signed Contract 100% 250,000 Win Win: Product Range
Big Co. Inc North West Tom Small Services FMCG Tradeshow 45,000 Feb-13 3. Opportunity Identified 20% 9,000 Loss Loss: Not Good Fit
Hi-Tech (West) Inc Mid-West John Doe Industrial Engineering Referal 100,000 Dec-12 9. Signed Contract 20% 20,000 Win Win: After Sales Service
Hi_Tech Inc EMEA Jane Doe Services Manufacturing Website 80,000 Sep-12 4. Developing Solution 25% 20,000 Loss Loss: Not Good Fit
Good Food Ltd EMEA Jane Doe Consumer FMCG Cold Call 100,000 Dec-12 9. Signed Contract 100% 100,000 Win Win: Price/Value
Defence Dept Central Jim Bigg Services Government Tradeshow 80,000 Mar-13 3. Opportunity Identified 20% 16,000 Opted Out Opted Out: Budget
Big Company Inc Central Jim Bigg Industrial Health Care Website 200,000 Sep-12 9. Signed Contract 100% 200,000 Win Win: Product Features
ABC Inc EMEA Jane Doe Profesional Financial Services Existing Client 30,000 Oct-12 9. Signed Contract 100% 30,000 Win Win: Existing Customer
4/27/2011
www.businesstoolsstore.com 19
Copyright © 2011 The Business Tools Store
The Win Loss analysis, as depicted in figure 15 above, by default includes all of the outcomes
(Win, Loss & Opted Out) and Months. The Filter Options highlighted allow the report to be
filtered to include only specific Outcomes or Months.
Within each Outcome a full analysis is provided for each Lead/Sale opportunity. Using the
Expand/Collapse option highlighted allows the user to show all the details or to show only
Outcome totals. The Expand/Collapse option shows a “-“ where the details can be collapsed
to show the data summarized and a “+” where the total can be expanded to show the details.
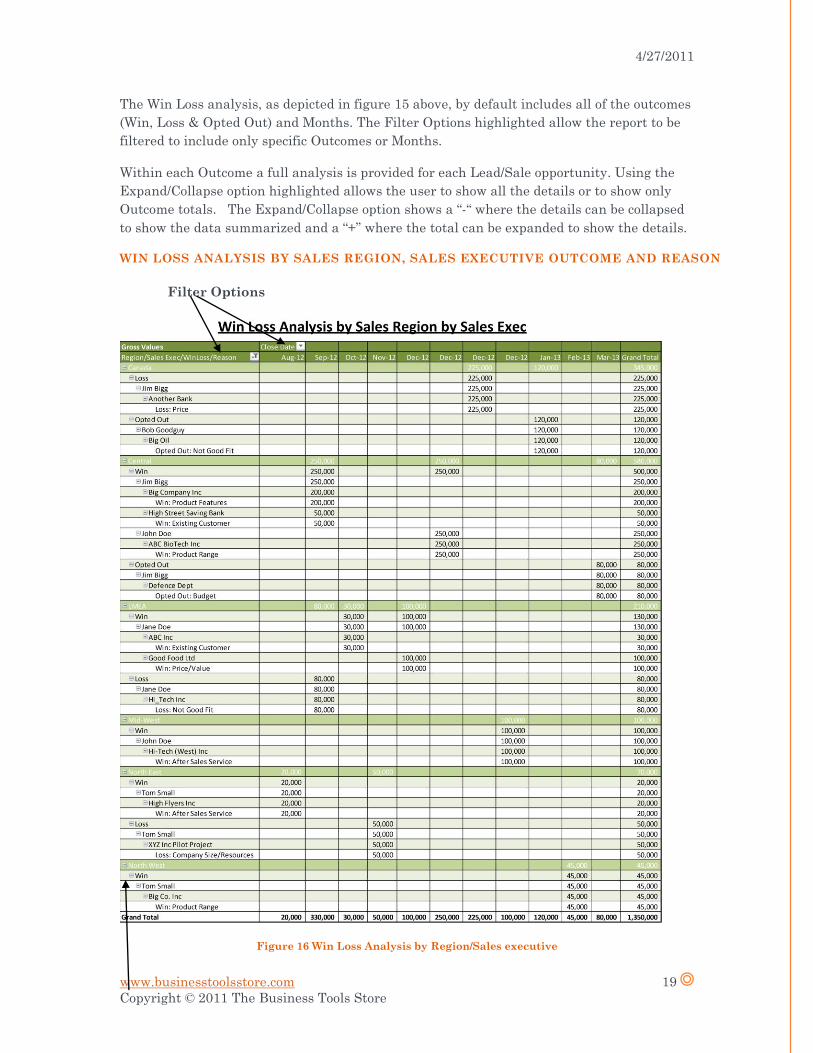
WIN LOSS ANALYSIS BY SALES REGION, SALES EXECUTIVE OUTCOME AND REASON
Filter Options
Figure 16 Win Loss Analysis by Region/Sales executive

4/27/2011
www.businesstoolsstore.com 20
Copyright © 2011 The Business Tools Store
Expand/Collapse
The Regional analysis, as depicted in figure 16 above, by default includes all Regions and
Months. The Filter Options highlighted allow the report to be filtered to include only specific
Regions or Months.
Within each Region a full analysis is provided for each Sales Executive active within the
Region, outcomes and reasons. Using the Expand/Collapse option highlighted allows the user
to show all the details or to show only Regional totals. The Expand/Collapse option shows a
“-“ where the details can be collapsed to show the Regional data summarized and a “+” where
the Region total can be expanded to show the Sales Executives details, etc.
WIN LOSS ANALYSIS BY MARKET SECTOR
Figure 17 Win Loss Analysis by Market Sector
The chart in Figure 17 shows a breakdown of the Wins & Losses by market sector.

4/27/2011
www.businesstoolsstore.com 21
Copyright © 2011 The Business Tools Store
WIN LOSS ANALYSIS BY SALES REGION
Figure 18 Win Loss Analysis by Sales Region
The chart in Figure 18 shows a breakdown of the Wins & Losses by Sale Region.

4/27/2011
www.businesstoolsstore.com 22
Copyright © 2011 The Business Tools Store
WIN LOSS ANALYSIS BY PRODUCT GROUP
Figure 19 Win Loss Analysis by Sales Region
The chart in Figure 19 shows a breakdown of the Wins & Losses by Product Group.