SAKIKO FUKUDA-PARR COLLABORATIVE WORK WITH JOSHUA GREENSTEIN, SUSAN RANDOLPH, TERRA LAWSON-REMER...
38
SAKIKO FUKUDA-PARR COLLABORATIVE WORK WITH JOSHUA GREENSTEIN, SUSAN RANDOLPH, TERRA LAWSON-REMER Beyond Indicators: why metrics matter
-
Upload
curtis-mclaughlin -
Category
Documents
-
view
216 -
download
2
Transcript of SAKIKO FUKUDA-PARR COLLABORATIVE WORK WITH JOSHUA GREENSTEIN, SUSAN RANDOLPH, TERRA LAWSON-REMER...

SAKIKO FUKUDA-PARR
COLLABORATIVE WORK WITH JOSHUA GREENSTEIN, SUSAN RANDOLPH, TERRA LAWSON-REMER
Beyond Indicators: why metrics matter

Beyond Indicators for assessing state performance – some insights from the SERF
Index
Indicators in evaluative frameworks (normative use)Exploring characteristics and conditions (predictive and behavioural use)
2

Progressive realization
‘Each State party to the present Covenant undertakes to take steps, individually and through international assistance and cooperation, especially economic and technical, to the maximum of its available resources, with a view to achieving progressively the full realization of the rights recognized in the present covenant by all appropriate means, including particularly the adoption of legislative measures (article 2, paragraph 1).
3

Why metrics matter – measuring HR performance vs development
performance
Obligations of conduct vs. obligations of resultAssessment of conduct: by policy? by ‘effort’? By
empirical evidence of improved outcomes? Value of quantification: rigorous assessment of
magnitude and trendProgressive realization: making progress over time?Maximum available resources: maximum
government spending?Resources beyond government revenue? Constraint of resources imposed by level of development and size of economy?
4

Assumptions and evaluative frameworks
Criteria for defining success and failure, compliance and non-compliance with obligationsFocus of measurement: (i) achieved level; (ii) pace of progress and progressive realization; (iii) initial starting point; (iv) resource constraints and maximum resources.
5

Comparison of evaluative frameworks
Achieved level
Pace of progress
Initial conditions
Resource constraints
‘HR outcome Indicators’
x (x) (x)
MDGs – on/off track
x
MDG – pace of progress method
x x
SERF Index x (x) x x
HDI x (x) (x)
6
Example: achieving MDGs vs. ESR fulfillment
Country MDG 1 SERF Index (work component)
MDGs overall
SERF Index composite
China Likely 63.98 On track/likely 5/5
79.73
India Possible to achieve
27.6 Possible 4/5 56.06
The Gambia Off track 5/8 93.88 Off track 5/7Likely/poss 2/7
81,65
Viet Nam On track 58.66 On track/likely 7/8
78.79
7
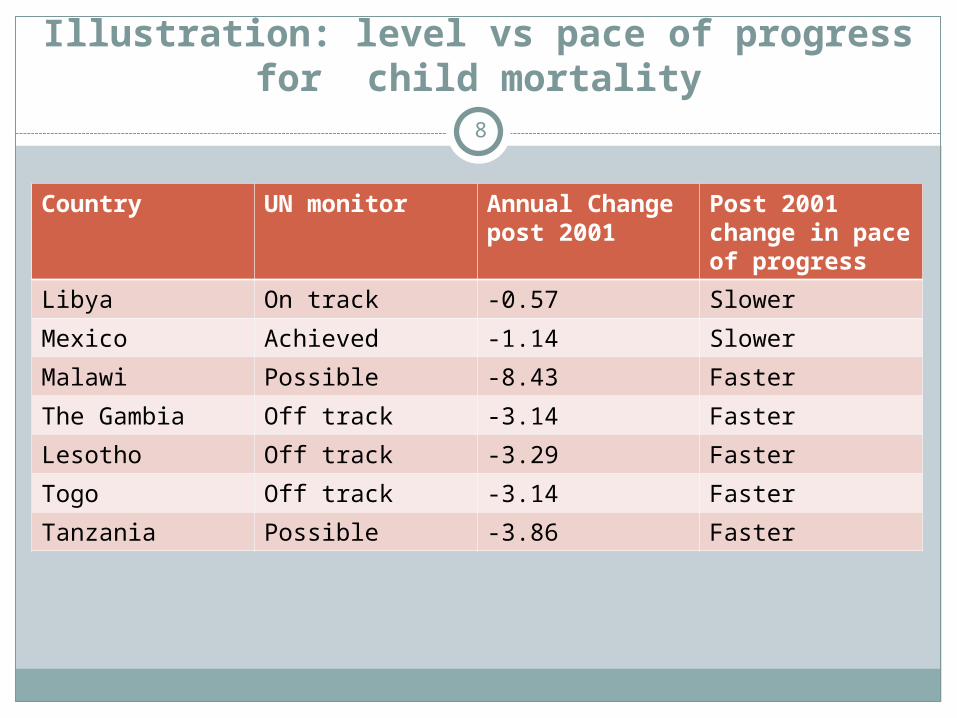
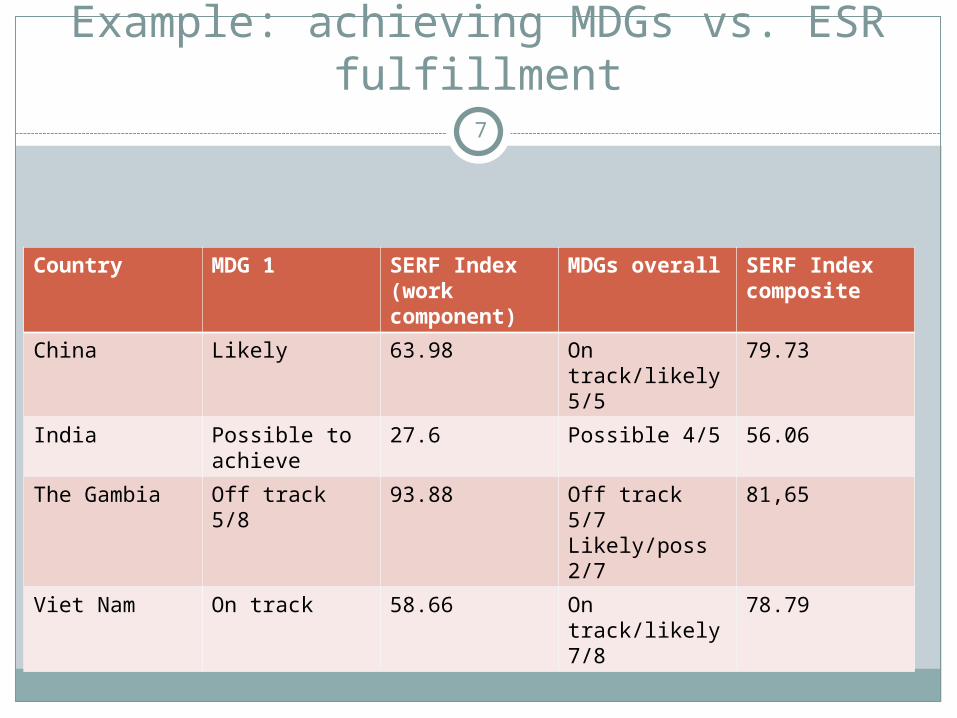
Illustration: level vs pace of progress for child mortality
Country UN monitor Annual Change post 2001
Post 2001 change in pace of progress
Libya On track -0.57 Slower
Mexico Achieved -1.14 Slower
Malawi Possible -8.43 Faster
The Gambia Off track -3.14 Faster
Lesotho Off track -3.29 Faster
Togo Off track -3.14 Faster
Tanzania Possible -3.86 Faster
8

Illustration: HDI vs SERF vs. Income
HDI improvement top performer
SERF score Income top performer
SERF score
Oman 52 - 75 China 80
China 80 Botswana 60
Nepal 68 S. Korea 92
Indonesia 66 Hong Kong (85)
Saudi Arabia 71-81 Malaysia 85
9

Using measurement to explore conditions for human rights performance
Explore relationships between SERF scores and:-Government spending-Gender equality-Governance, civil and political rights, legal guarantees-Economic structure-Regions
10

Public expenditure
Health and education: weak relationship - High spending does not guarantee good
score, low spending does not guarantee low score. However on average good performers spent more than 2% gdp on health, almost 5% on education
11


*OUTLIERS REMOVED

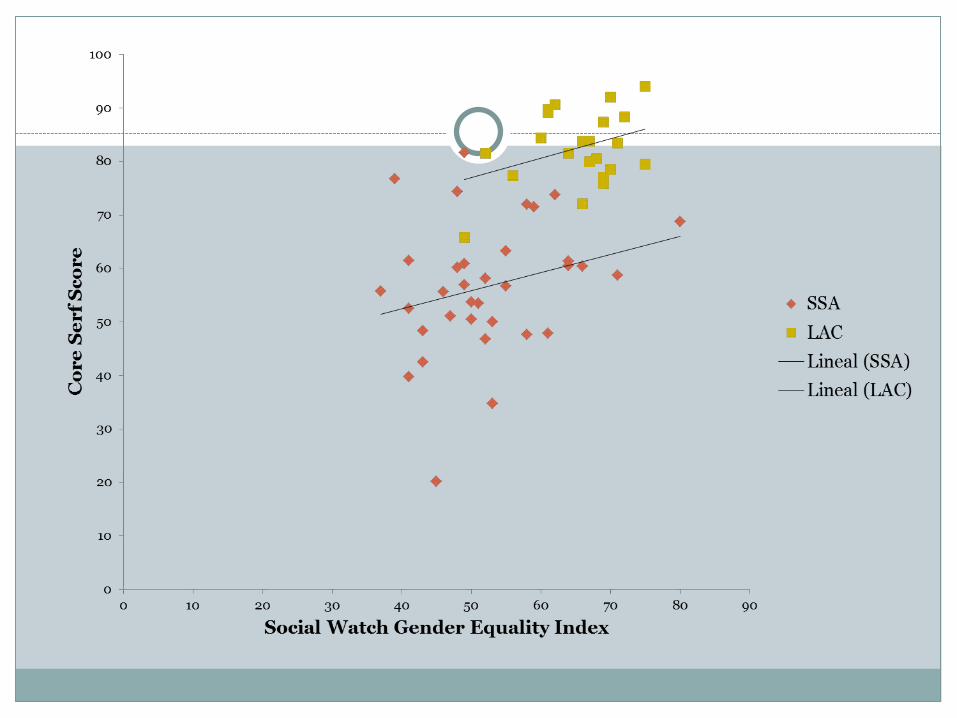
Gender equality
Shows strongest correlation with SERF performance
Social Watch Gender Equality Index - 70% of countries with good scores scored more than 70
UNDP Gender Inequality Index – good performers had good GII index, poor performers had poor GII index
15


0
10
20
30
40
50
60
70
80
90
100
20 30 40 50 60 70 80 90
Serf
Hea
lth
Inde
x Sc
ore
Social Watch Gender Equality Index
0
10
20
30
40
50
60
70
80
90
100
0.2 0.3 0.4 0.5 0.6 0.7 0.8 0.9
Serf
Hea
lth
Inde
x Sc
ore
UN Gender Inequality Index

Governance/Civil and political rights, legal guarantees
Polity combined index (democracy) – positive but inconsistent correlation. V. few countries scoring well on Polity score poorly on SERF
CIRI – V. few high CIRI score countries do poorly on SERF
World Bank governance indicators – positive correlation but many good performers on SERF do poorly
TIESR (legal guarantees) – positive but inconsistent correlation for health, weak for food
20

Relationship with Polity Autocracy/Democracy Score

Relationship with Performance on CIRI Rights Index

0
10
20
30
40
50
60
70
80
90
100
0 20 40 60 80 100
Core
Serf
Control of Corruption, WB
0
10
20
30
40
50
60
70
80
90
100
0 20 40 60 80 100
Core
Serf
Voice and Accountability, WB
0
10
20
30
40
50
60
70
80
90
100
0 20 40 60 80 100
Core
Serf
Rule of Law, WB
0
10
20
30
40
50
60
70
80
90
100
0 20 40 60 80 100
Core
Serf
Political Stability, No Violence, WB


Legally Enshrined Social and Economic Rights

Average Governance Measurement Scores, LAC and SSA

Economic structure
Higher proportion of GDP in manufacturing and services – better performance by SERF
Higher proportion in agriculture – weaker performance by SERF
28

0
10
20
30
40
50
60
70
80
90
100
0 10 20 30 40 50 60 70
Core
SER
F Sc
ore
% GDP Agriculture
0
10
20
30
40
50
60
70
80
90
100
0 10 20 30 40 50
Core
SER
F Sc
ore
% GDP Manufacturing
0
10
20
30
40
50
60
70
80
90
100
0 20 40 60 80
Core
SER
F Sc
ore
% GDP Natural Resource Rents
0
20
40
60
80
100
120
0 20 40 60 80 100
Core
SER
F Sc
ore
% GDP Services

0
20
40
60
80
100
120
0 10 20 30 40 50 60 70
Healt
h SE
RF Sc
ore
% GDP Agriculture
0
20
40
60
80
100
120
0 10 20 30 40 50
Healt
h SE
RF Sc
ore
% GDP Manufacturing
0
20
40
60
80
100
120
0 20 40 60 80
Healt
h SE
RF Sc
ore
% GDP Natural Resource Rents
0
20
40
60
80
100
120
0 20 40 60 80 100
Healt
h SE
RF Sc
ore
% GDP Services

0
10
20
30
40
50
60
70
80
90
100
0 20 40 60 80 100
Core
SER
F Sc
ore
% Population Rural
0
10
20
30
40
50
60
70
80
90
100
0 20 40 60 80 100
Core
SER
F Sc
ore
% Population Urban

0
20
40
60
80
100
120
0 20 40 60 80 100H
ealt
h S
ERF
Scor
e
% Population Rural
0
20
40
60
80
100
120
0 20 40 60 80 100
Hea
lth
SER
F Sc
ore
% Population Urban

Structural Relationship constant?

Structural Relationship constant?

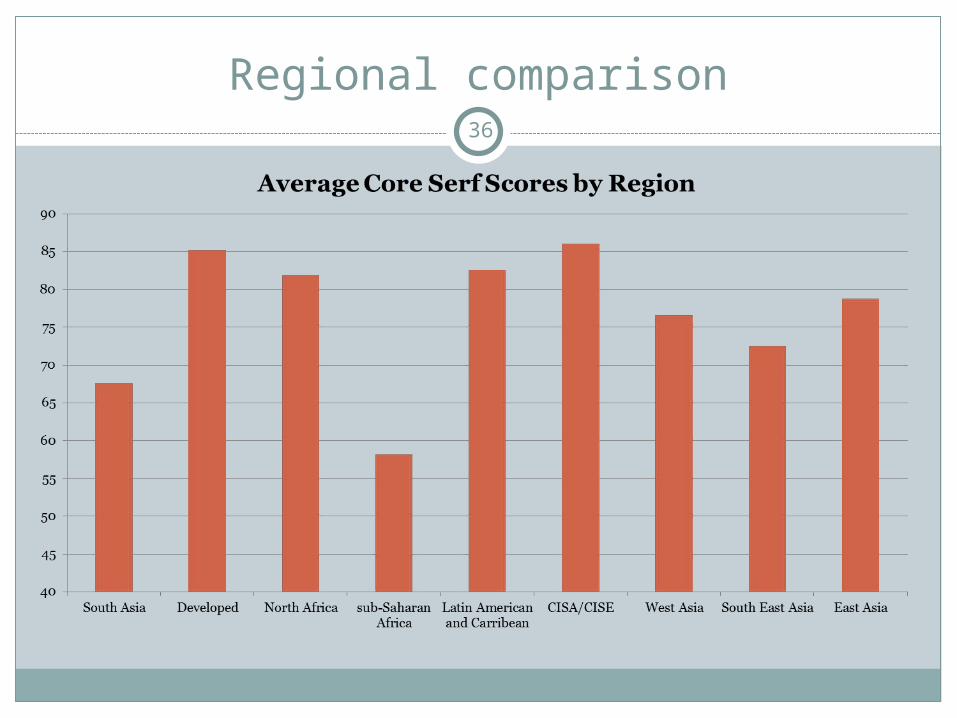
Regional comparison
Sub-saharan Africa and South Asia have lowest average scores
More than 75% of countries with poor SERF scores are in SSA
FSU and LAC do disproportionately well.
35
Regional comparison36