SAICA - INITIAL TEST OF COMPETENCE: April 2021
21
SAICA - INITIAL TEST OF COMPETENCE: April 2021 Index Page No. Analysis of Candidate Population (Number of candidates who wrote) 1 Overview of the results 3 Top 10 candidates 4 By university (number of passes) 5 By university (all candidates) 8 By university (by attempt) 10 By university (by residential vs distance learning - all candidates) 11 By university (by demographics - all candidates) 13 By university (by demographics - first time candidates) 14 By demographics (all candidates) 15 By demographics (first time candidates) 16 By gender (all candidates) 17 By demographics and gender (all candidates) 18 University statistic's contained within this document should be analysed/ reviewed holistically and therefore the individual university pass rates should not be regarded as the only measure of success. Of greater importance is the university's contibution to transformation of the CA profession.
Transcript of SAICA - INITIAL TEST OF COMPETENCE: April 2021
SAICA - INITIAL TEST OF COMPETENCE: April 2021
IndexPage No.
Analysis of Candidate Population (Number of candidates who wrote) 1
Overview of the results 3
Top 10 candidates 4
By university (number of passes) 5
By university (all candidates) 8
By university (by attempt) 10
By university (by residential vs distance learning - all candidates) 11
By university (by demographics - all candidates) 13
By university (by demographics - first time candidates) 14
By demographics (all candidates) 15
By demographics (first time candidates) 16
By gender (all candidates) 17
By demographics and gender (all candidates) 18
University statistic's contained within this document should be analysed/ reviewed holistically and
therefore the individual university pass rates should not be regarded as the only measure of success.
Of greater importance is the university's contibution to transformation of the CA profession.
SAICA - INITIAL TEST OF COMPETENCE: April 2021
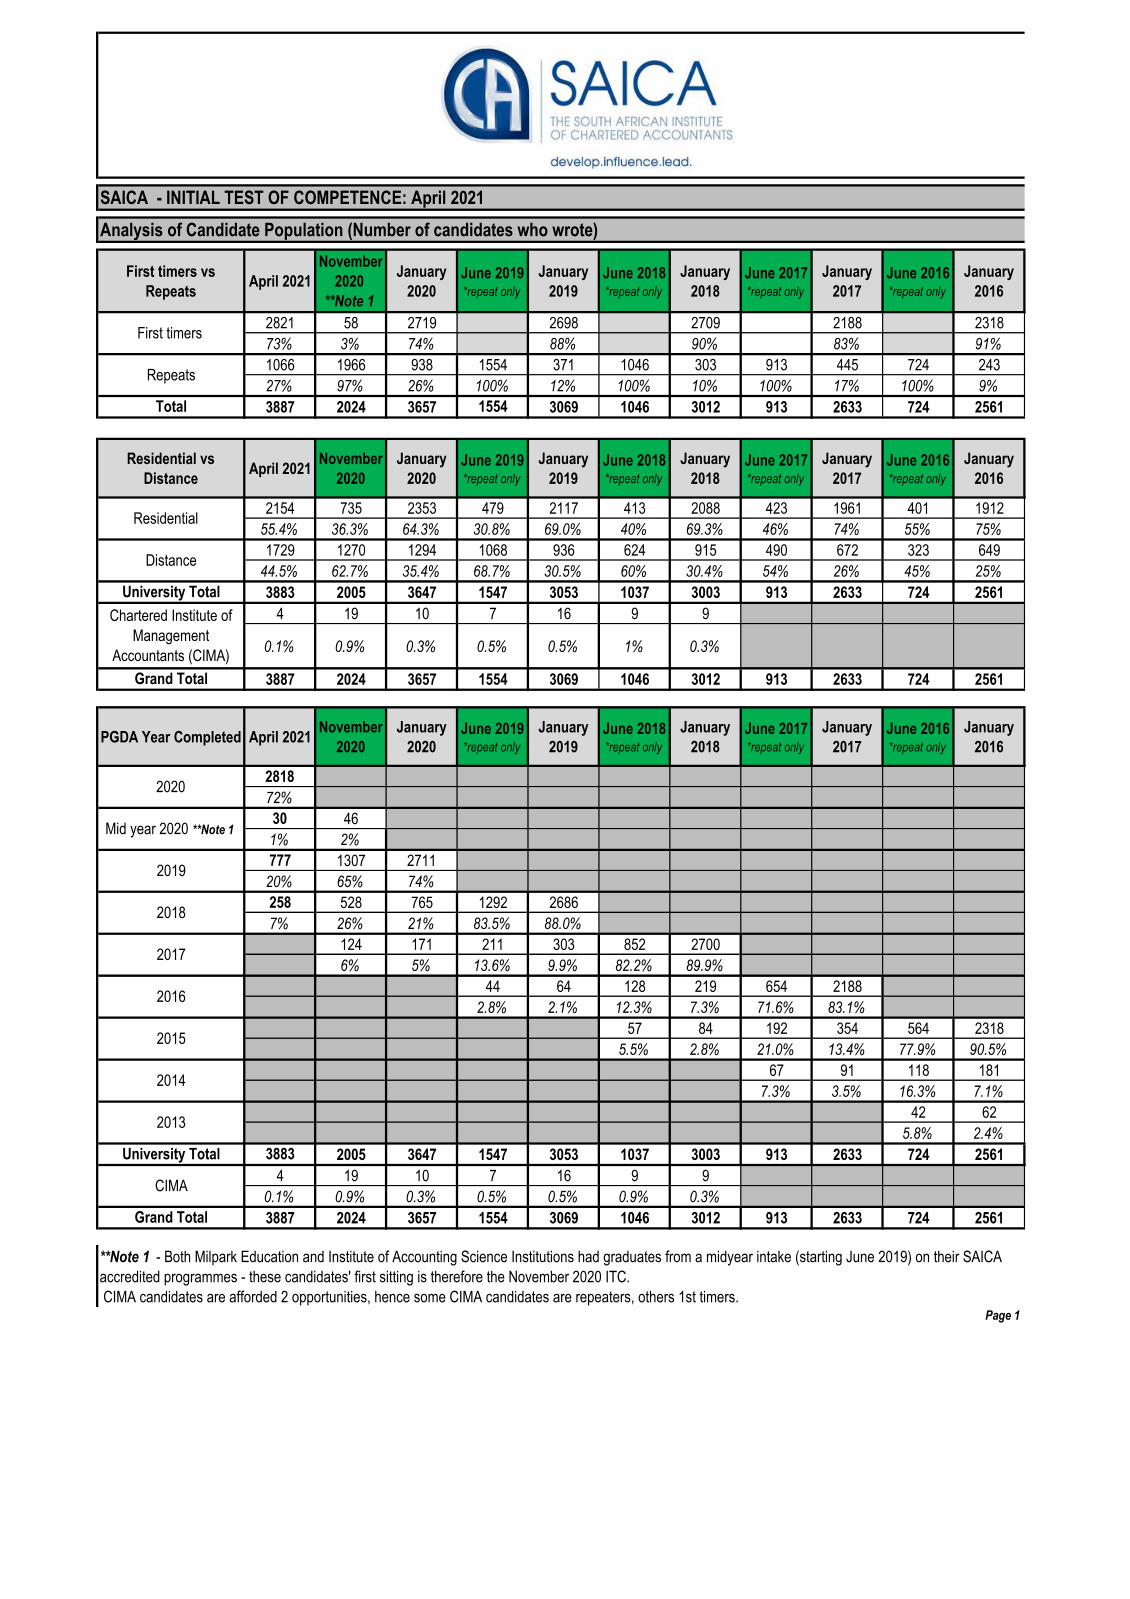
Analysis of Candidate Population (Number of candidates who wrote)
First timers vs
RepeatsApril 2021
November
2020
**Note 1
January
2020June 2019 *repeat only
January
2019June 2018 *repeat only
January
2018June 2017 *repeat only
January
2017June 2016 *repeat only
January
2016
2821 58 2719 2698 2709 2188 2318
73% 3% 74% 88% 90% 83% 91%
1066 1966 938 1554 371 1046 303 913 445 724 243
27% 97% 26% 100% 12% 100% 10% 100% 17% 100% 9%
Total 3887 2024 3657 1554 3069 1046 3012 913 2633 724 2561
Residential vs
DistanceApril 2021
November
2020
January
2020June 2019 *repeat only
January
2019June 2018 *repeat only
January
2018June 2017 *repeat only
January
2017June 2016 *repeat only
January
2016
2154 735 2353 479 2117 413 2088 423 1961 401 1912
55.4% 36.3% 64.3% 30.8% 69.0% 40% 69.3% 46% 74% 55% 75%
1729 1270 1294 1068 936 624 915 490 672 323 649
44.5% 62.7% 35.4% 68.7% 30.5% 60% 30.4% 54% 26% 45% 25%
University Total 3883 2005 3647 1547 3053 1037 3003 913 2633 724 2561
4 19 10 7 16 9 9
0.1% 0.9% 0.3% 0.5% 0.5% 1% 0.3%
Grand Total 3887 2024 3657 1554 3069 1046 3012 913 2633 724 2561
PGDA Year Completed April 2021November
2020
January
2020June 2019 *repeat only
January
2019June 2018 *repeat only
January
2018June 2017 *repeat only
January
2017June 2016 *repeat only
January
2016
2818
72%
30 46
1% 2%
777 1307 2711
20% 65% 74%
258 528 765 1292 2686
7% 26% 21% 83.5% 88.0%
124 171 211 303 852 2700
6% 5% 13.6% 9.9% 82.2% 89.9%
44 64 128 219 654 2188
2.8% 2.1% 12.3% 7.3% 71.6% 83.1%
57 84 192 354 564 2318
5.5% 2.8% 21.0% 13.4% 77.9% 90.5%
67 91 118 181
7.3% 3.5% 16.3% 7.1%
42 62
5.8% 2.4%
University Total 3883 2005 3647 1547 3053 1037 3003 913 2633 724 2561
4 19 10 7 16 9 9
0.1% 0.9% 0.3% 0.5% 0.5% 0.9% 0.3%
Grand Total 3887 2024 3657 1554 3069 1046 3012 913 2633 724 2561
Page 1
CIMA
**Note 1 - Both Milpark Education and Institute of Accounting Science Institutions had graduates from a midyear intake (starting June 2019) on their SAICA
accredited programmes - these candidates' first sitting is therefore the November 2020 ITC.
CIMA candidates are afforded 2 opportunities, hence some CIMA candidates are repeaters, others 1st timers.
2018
2015
2013
2017
2014
2016
2019
First timers
Repeats
Residential
Distance
Chartered Institute of
Management
Accountants (CIMA)
Mid year 2020 **Note 1
2020
SAICA - INITIAL TEST OF COMPETENCE: April 2021
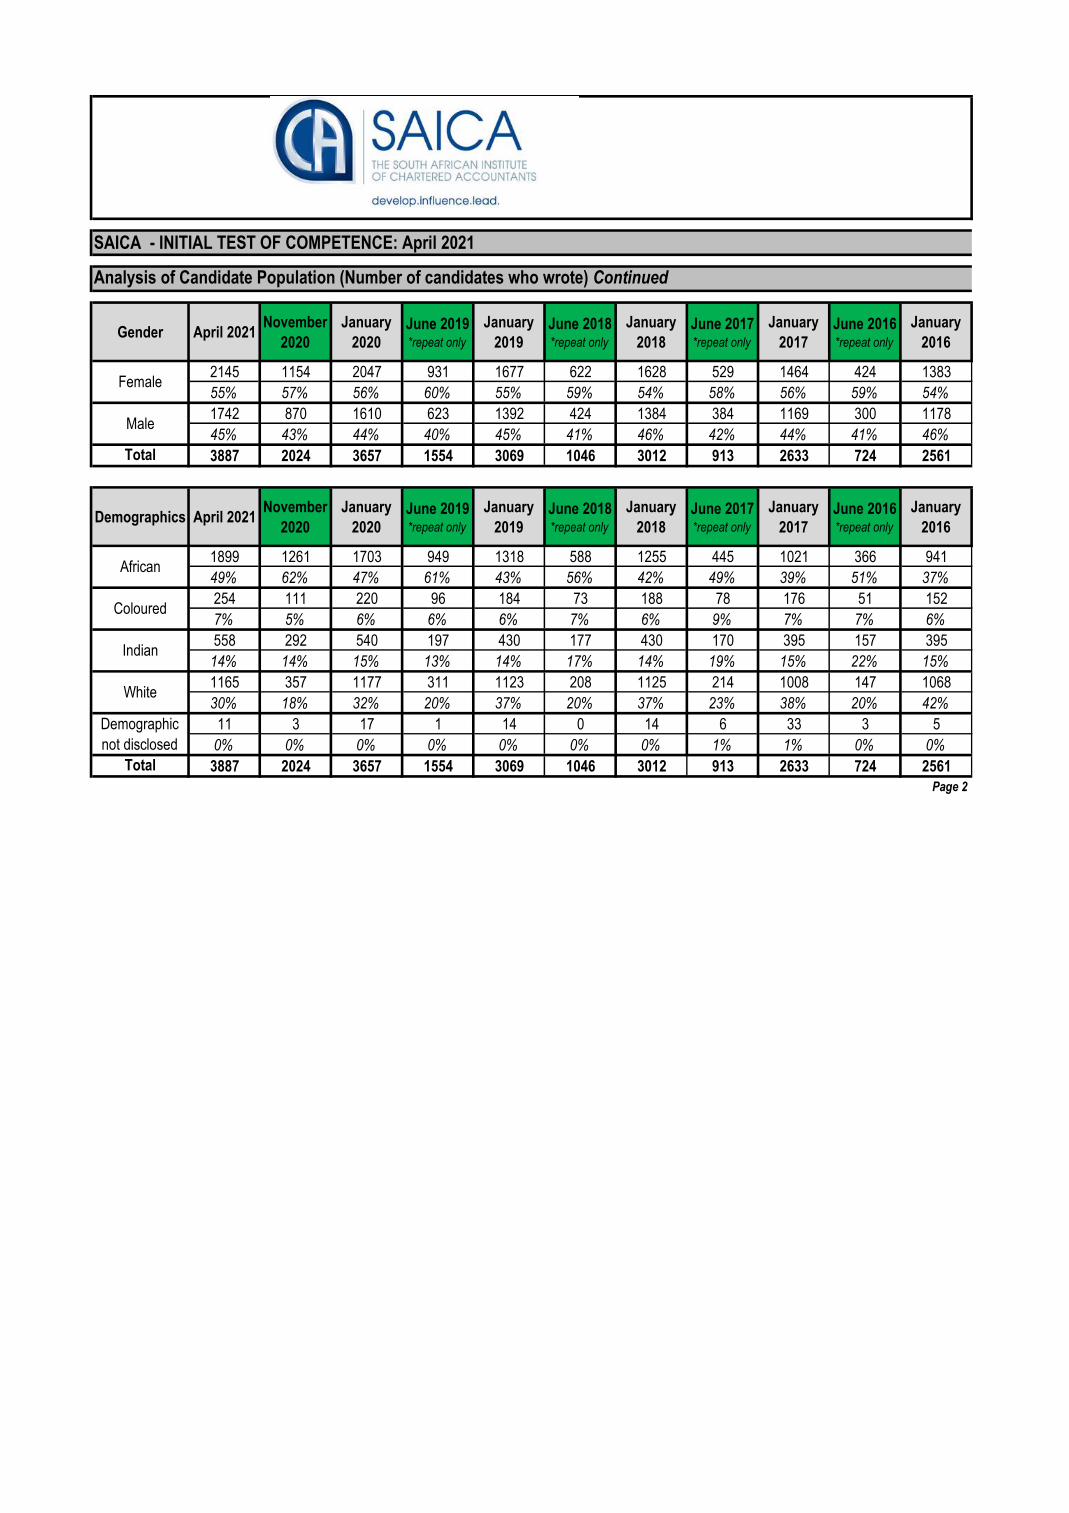
Analysis of Candidate Population (Number of candidates who wrote) Continued
Gender April 2021November
2020
January
2020June 2019 *repeat only
January
2019June 2018 *repeat only
January
2018June 2017 *repeat only
January
2017June 2016 *repeat only
January
2016
2145 1154 2047 931 1677 622 1628 529 1464 424 1383
55% 57% 56% 60% 55% 59% 54% 58% 56% 59% 54%
1742 870 1610 623 1392 424 1384 384 1169 300 1178
45% 43% 44% 40% 45% 41% 46% 42% 44% 41% 46%
Total 3887 2024 3657 1554 3069 1046 3012 913 2633 724 2561
Demographics April 2021November
2020
January
2020June 2019 *repeat only
January
2019June 2018 *repeat only
January
2018June 2017 *repeat only
January
2017June 2016 *repeat only
January
2016
1899 1261 1703 949 1318 588 1255 445 1021 366 941
49% 62% 47% 61% 43% 56% 42% 49% 39% 51% 37%
254 111 220 96 184 73 188 78 176 51 152
7% 5% 6% 6% 6% 7% 6% 9% 7% 7% 6%
558 292 540 197 430 177 430 170 395 157 395
14% 14% 15% 13% 14% 17% 14% 19% 15% 22% 15%
1165 357 1177 311 1123 208 1125 214 1008 147 1068
30% 18% 32% 20% 37% 20% 37% 23% 38% 20% 42%
11 3 17 1 14 0 14 6 33 3 5
0% 0% 0% 0% 0% 0% 0% 1% 1% 0% 0%
Total 3887 2024 3657 1554 3069 1046 3012 913 2633 724 2561
Page 2
White
Demographic
not disclosed
Female
Male
African
Coloured
Indian
SAICA - INITIAL TEST OF COMPETENCE: April 2021
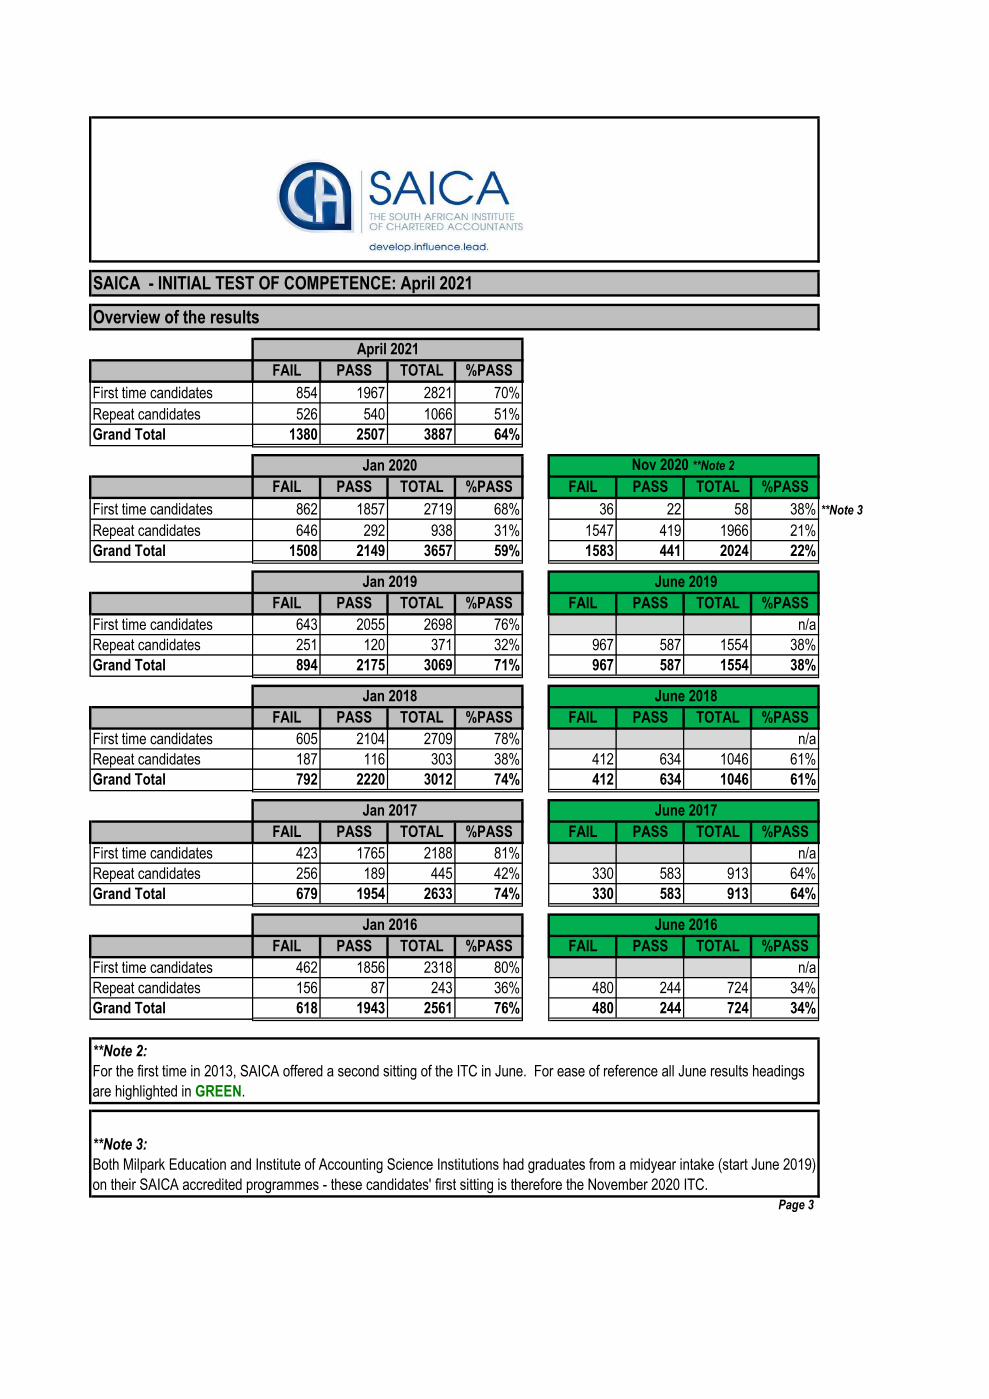
Overview of the results
FAIL PASS TOTAL %PASS
First time candidates 854 1967 2821 70%
Repeat candidates 526 540 1066 51%
Grand Total 1380 2507 3887 64%
FAIL PASS TOTAL %PASS FAIL PASS TOTAL %PASS
First time candidates 862 1857 2719 68% 36 22 58 38% **Note 3
Repeat candidates 646 292 938 31% 1547 419 1966 21%
Grand Total 1508 2149 3657 59% 1583 441 2024 22%
FAIL PASS TOTAL %PASS FAIL PASS TOTAL %PASS
First time candidates 643 2055 2698 76% n/a
Repeat candidates 251 120 371 32% 967 587 1554 38%
Grand Total 894 2175 3069 71% 967 587 1554 38%
FAIL PASS TOTAL %PASS FAIL PASS TOTAL %PASS
First time candidates 605 2104 2709 78% n/a
Repeat candidates 187 116 303 38% 412 634 1046 61%
Grand Total 792 2220 3012 74% 412 634 1046 61%
FAIL PASS TOTAL %PASS FAIL PASS TOTAL %PASS
First time candidates 423 1765 2188 81% n/a
Repeat candidates 256 189 445 42% 330 583 913 64%
Grand Total 679 1954 2633 74% 330 583 913 64%
FAIL PASS TOTAL %PASS FAIL PASS TOTAL %PASS
First time candidates 462 1856 2318 80% n/a
Repeat candidates 156 87 243 36% 480 244 724 34%
Grand Total 618 1943 2561 76% 480 244 724 34%
Page 3
**Note 2:
For the first time in 2013, SAICA offered a second sitting of the ITC in June. For ease of reference all June results headings
are highlighted in GREEN.
**Note 3:
Both Milpark Education and Institute of Accounting Science Institutions had graduates from a midyear intake (start June 2019)
on their SAICA accredited programmes - these candidates' first sitting is therefore the November 2020 ITC.
Jan 2020
Jan 2016
Jan 2017 June 2017
Jan 2018
Jan 2019
June 2018
June 2019
Nov 2020 **Note 2
April 2021
June 2016
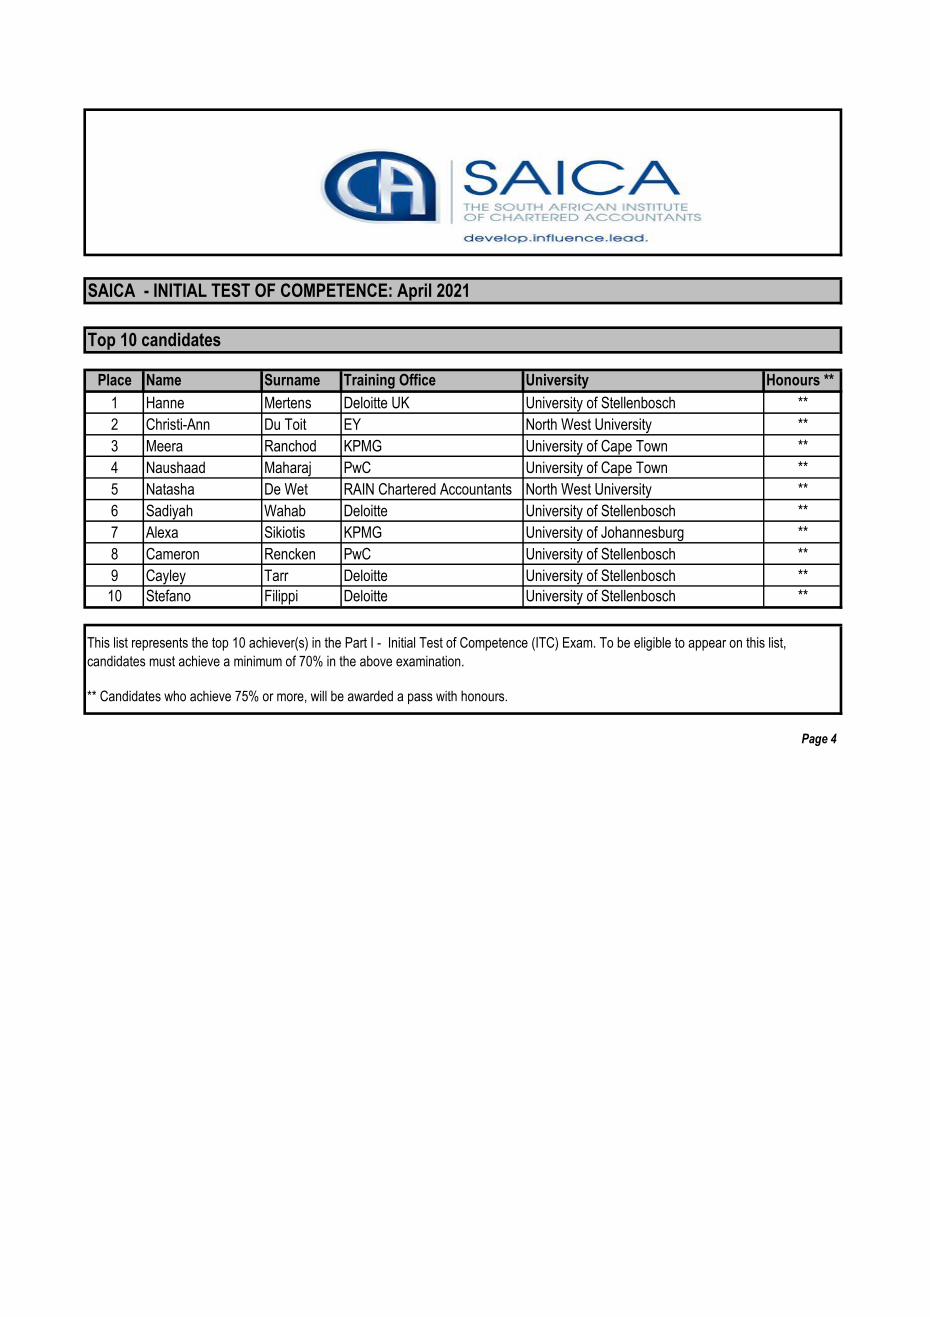
SAICA - INITIAL TEST OF COMPETENCE: April 2021
Top 10 candidates
Place Name Surname Training Office University Honours **
1 Hanne Mertens Deloitte UK University of Stellenbosch **
2 Christi-Ann Du Toit EY North West University **
3 Meera Ranchod KPMG University of Cape Town **
4 Naushaad Maharaj PwC University of Cape Town **
5 Natasha De Wet RAIN Chartered Accountants North West University **
6 Sadiyah Wahab Deloitte University of Stellenbosch **
7 Alexa Sikiotis KPMG University of Johannesburg **
8 Cameron Rencken PwC University of Stellenbosch **
9 Cayley Tarr Deloitte University of Stellenbosch **
10 Stefano Filippi Deloitte University of Stellenbosch **
Page 4
This list represents the top 10 achiever(s) in the Part I - Initial Test of Competence (ITC) Exam. To be eligible to appear on this list,
candidates must achieve a minimum of 70% in the above examination.
** Candidates who achieve 75% or more, will be awarded a pass with honours.
PGDA UNIVERSITY NAME
No. of
PASSES
% of
total
No. of
PASSES
% of
total
No. of
PASSES
% of
total
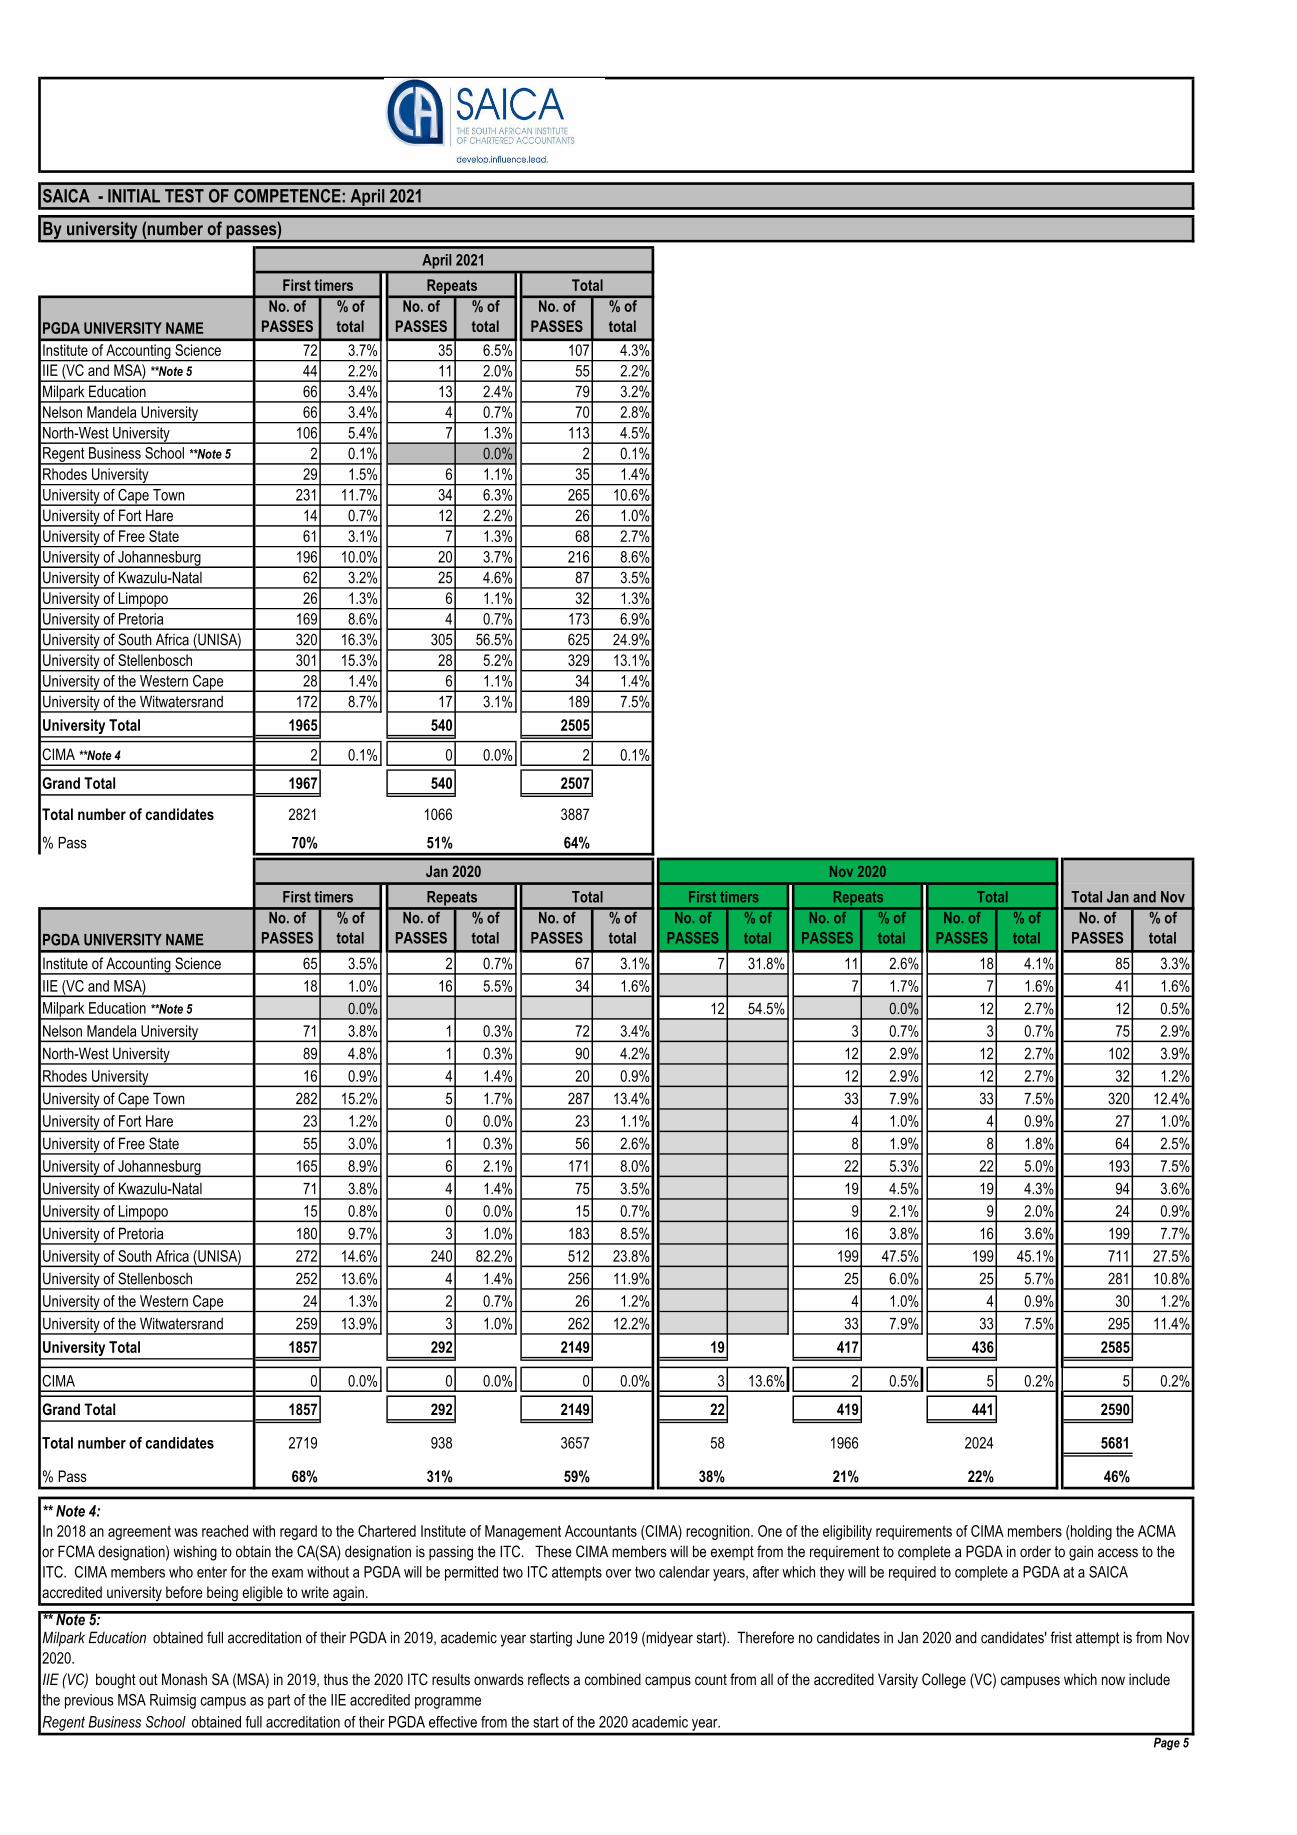
Institute of Accounting Science 72 3.7% 35 6.5% 107 4.3%
IIE (VC and MSA) **Note 5 44 2.2% 11 2.0% 55 2.2%
Milpark Education 66 3.4% 13 2.4% 79 3.2%
Nelson Mandela University 66 3.4% 4 0.7% 70 2.8%
North-West University 106 5.4% 7 1.3% 113 4.5%
Regent Business School **Note 5 2 0.1% 0.0% 2 0.1%
Rhodes University 29 1.5% 6 1.1% 35 1.4%
University of Cape Town 231 11.7% 34 6.3% 265 10.6%
University of Fort Hare 14 0.7% 12 2.2% 26 1.0%
University of Free State 61 3.1% 7 1.3% 68 2.7%
University of Johannesburg 196 10.0% 20 3.7% 216 8.6%
University of Kwazulu-Natal 62 3.2% 25 4.6% 87 3.5%
University of Limpopo 26 1.3% 6 1.1% 32 1.3%
University of Pretoria 169 8.6% 4 0.7% 173 6.9%
University of South Africa (UNISA) 320 16.3% 305 56.5% 625 24.9%
University of Stellenbosch 301 15.3% 28 5.2% 329 13.1%
University of the Western Cape 28 1.4% 6 1.1% 34 1.4%
University of the Witwatersrand 172 8.7% 17 3.1% 189 7.5%
University Total 1965 540 2505
CIMA **Note 4 2 0.1% 0 0.0% 2 0.1%
Grand Total 1967 540 2507
Total number of candidates 2821 1066 3887
% Pass 70% 51% 64%
PGDA UNIVERSITY NAME
No. of
PASSES
% of
total
No. of
PASSES
% of
total
No. of
PASSES
% of
total
No. of
PASSES
% of
total
No. of
PASSES
% of
total
No. of
PASSES
% of
total
No. of
PASSES
% of
total
Institute of Accounting Science 65 3.5% 2 0.7% 67 3.1% 7 31.8% 11 2.6% 18 4.1% 85 3.3%
IIE (VC and MSA) 18 1.0% 16 5.5% 34 1.6% 7 1.7% 7 1.6% 41 1.6%
Milpark Education **Note 5 0.0% 12 54.5% 0.0% 12 2.7% 12 0.5%
Nelson Mandela University 71 3.8% 1 0.3% 72 3.4% 3 0.7% 3 0.7% 75 2.9%
North-West University 89 4.8% 1 0.3% 90 4.2% 12 2.9% 12 2.7% 102 3.9%
Rhodes University 16 0.9% 4 1.4% 20 0.9% 12 2.9% 12 2.7% 32 1.2%
University of Cape Town 282 15.2% 5 1.7% 287 13.4% 33 7.9% 33 7.5% 320 12.4%
University of Fort Hare 23 1.2% 0 0.0% 23 1.1% 4 1.0% 4 0.9% 27 1.0%
University of Free State 55 3.0% 1 0.3% 56 2.6% 8 1.9% 8 1.8% 64 2.5%
University of Johannesburg 165 8.9% 6 2.1% 171 8.0% 22 5.3% 22 5.0% 193 7.5%
University of Kwazulu-Natal 71 3.8% 4 1.4% 75 3.5% 19 4.5% 19 4.3% 94 3.6%
University of Limpopo 15 0.8% 0 0.0% 15 0.7% 9 2.1% 9 2.0% 24 0.9%
University of Pretoria 180 9.7% 3 1.0% 183 8.5% 16 3.8% 16 3.6% 199 7.7%
University of South Africa (UNISA) 272 14.6% 240 82.2% 512 23.8% 199 47.5% 199 45.1% 711 27.5%
University of Stellenbosch 252 13.6% 4 1.4% 256 11.9% 25 6.0% 25 5.7% 281 10.8%
University of the Western Cape 24 1.3% 2 0.7% 26 1.2% 4 1.0% 4 0.9% 30 1.2%
University of the Witwatersrand 259 13.9% 3 1.0% 262 12.2% 33 7.9% 33 7.5% 295 11.4%
University Total 1857 292 2149 19 417 436 2585
CIMA 0 0.0% 0 0.0% 0 0.0% 3 13.6% 2 0.5% 5 0.2% 5 0.2%
Grand Total 1857 292 2149 22 419 441 2590
Total number of candidates 2719 938 3657 58 1966 2024 5681
% Pass 68% 31% 59% 38% 21% 22% 46%
Page 5
IIE (VC) bought out Monash SA (MSA) in 2019, thus the 2020 ITC results onwards reflects a combined campus count from all of the accredited Varsity College (VC) campuses which now include
the previous MSA Ruimsig campus as part of the IIE accredited programme
April 2021
First timers Repeats Total
Milpark Education obtained full accreditation of their PGDA in 2019, academic year starting June 2019 (midyear start). Therefore no candidates in Jan 2020 and candidates' frist attempt is from Nov
2020.
Regent Business School obtained full accreditation of their PGDA effective from the start of the 2020 academic year.
SAICA - INITIAL TEST OF COMPETENCE: April 2021
By university (number of passes)
Nov 2020
Total Jan and NovFirst timers Repeats Total
In 2018 an agreement was reached with regard to the Chartered Institute of Management Accountants (CIMA) recognition. One of the eligibility requirements of CIMA members (holding the ACMA
or FCMA designation) wishing to obtain the CA(SA) designation is passing the ITC. These CIMA members will be exempt from the requirement to complete a PGDA in order to gain access to the
ITC. CIMA members who enter for the exam without a PGDA will be permitted two ITC attempts over two calendar years, after which they will be required to complete a PGDA at a SAICA
accredited university before being eligible to write again.
** Note 4:
** Note 5:
Jan 2020
First timers Repeats Total
PGDA UNIVERSITY NAME
No. of
PASSES % of total
No. of
PASSES % of total
No. of
PASSES % of total
No. of
PASSES % of total
No. of
PASSES % of total
Institute of Accounting Science **Note 6 21 1.0% 21 1.0% 11 1.9% 32 1.2%
Monash SA 26 1.3% 3 2.5% 29 1.3% 33 5.6% 62 2.2%
Nelson Mandela University 60 2.9% 1 0.8% 61 2.8% 10 1.7% 71 2.6%
North-West University 92 4.5% 0 0.0% 92 4.2% 7 1.2% 99 3.6%
Rhodes University 17 0.8% 2 1.7% 19 0.9% 13 2.2% 32 1.2%
University of Cape Town 318 15.5% 2 1.7% 320 14.7% 41 7.0% 361 13.1%
University of Fort Hare 30 1.5% 2 1.7% 32 1.5% 22 3.7% 54 2.0%
University of Free State 63 3.1% 5 4.2% 68 3.1% 15 2.6% 83 3.0%
University of Johannesburg 231 11.2% 10 8.3% 241 11.1% 37 6.3% 278 10.1%
University of Kwazulu-Natal 106 5.2% 4 3.3% 110 5.1% 17 2.9% 127 4.6%
University of Limpopo 17 0.8% 1 0.8% 18 0.8% 12 2.0% 30 1.1%
University of Pretoria 192 9.3% 1 0.8% 193 8.9% 11 1.9% 204 7.4%
University of South Africa (UNISA) 389 18.9% 81 67.5% 470 21.6% 291 49.6% 761 27.6%
University of Stellenbosch 247 12.0% 2 1.7% 249 11.4% 22 3.7% 271 9.8%
University of the Western Cape 30 1.5% 4 3.3% 34 1.6% 14 2.4% 48 1.7%
University of the Witwatersrand 209 10.2% 1 0.8% 210 9.7% 29 4.9% 239 8.7%
University Total 2048 119 2167 585 2752
CIMA 7 0.3% 1 0.8% 8 0.4% 2 0.3% 10 0.4%
Grand Total 2055 120 2175 587 2762
Total number of candidates 2709 303 3012 1554 4566
% Pass 76% 40% 72% 38% 60%
PGDA UNIVERSITY NAME
No. of
PASSES % of total
No. of
PASSES % of total
No. of
PASSES % of total
No. of
PASSES % of total
No. of
PASSES % of total
Monash SA 57 2.7% 12 10.3% 69 3.1% 17 2.7% 86 3.0%
Nelson Mandela University 76 3.6% 2 1.7% 78 3.5% 18 2.8% 96 3.4%
North-West University 101 4.8% 1 0.9% 102 4.6% 7 1.1% 109 3.8%
Rhodes University 26 1.2% 1 0.9% 27 1.2% 11 1.7% 38 1.3%
University of Cape Town 263 12.5% 6 5.2% 269 12.1% 18 2.8% 287 10.1%
University of Fort Hare 43 2.0% 4 3.4% 47 2.1% 3 0.5% 50 1.8%
University of Free State 70 3.3% 1 0.9% 71 3.2% 18 2.8% 89 3.1%
University of Johannesburg 202 9.6% 5 4.3% 207 9.3% 97 15.3% 304 10.7%
University of Kwazulu-Natal 109 5.2% 5 4.3% 114 5.1% 20 3.2% 134 4.7%University of Limpopo **Note 6 18 0.9% 18 0.8% 5 0.8% 23 0.8%
University of Pretoria 194 9.2% 1 0.9% 195 8.8% 16 2.5% 211 7.4%
University of South Africa (UNISA) 453 21.5% 71 61.2% 524 23.6% 341 53.8% 865 30.3%
University of Stellenbosch 233 11.1% 4 3.4% 237 10.7% 11 1.7% 248 8.7%
University of the Western Cape 30 1.4% 1 0.9% 31 1.4% 11 1.7% 42 1.5%
University of the Witwatersrand 229 10.9% 2 1.7% 231 10.4% 39 6.2% 270 9.5%
University Total 2104 116 2220 632 2852
CIMA 0 0.0% 0 0.0% 0 0.0% 2 0.3% 2 0.1%
Grand Total 2104 116 2220 634 2854
Total number of candidates 2709 303 3012 1046 4058
% Pass 78% 38% 74% 61% 70%
PGDA UNIVERSITY NAME
No. of
PASSES % of total
No. of
PASSES % of total
No. of
PASSES % of total
No. of
PASSES % of total
No. of
PASSES % of total
Monash SA 54 3.1% 12 6.3% 66 3.4% 37 6.3% 103 4.1%
Nelson Mandela University 53 3.0% 3 1.6% 56 2.9% 7 1.2% 63 2.5%
North-West University 93 5.3% 6 3.2% 99 5.1% 4 0.7% 103 4.1%
Rhodes University 29 1.6% 4 2.1% 33 1.7% 8 1.4% 41 1.6%
University of Cape Town 271 15.4% 24 12.7% 295 15.1% 53 9.1% 348 13.7%
University of Fort Hare 37 2.1% 1 0.5% 38 1.9% 9 1.5% 47 1.9%
University of Free State 36 2.0% 11 5.8% 47 2.4% 17 2.9% 64 2.5%
University of Johannesburg 239 13.5% 16 8.5% 255 13.1% 41 7.0% 296 11.7%
University of Kwazulu-Natal 76 4.3% 18 9.5% 94 4.8% 26 4.5% 120 4.7%
University of Pretoria 175 9.9% 6 3.2% 181 9.3% 21 3.6% 202 8.0%
University of South Africa (UNISA) 338 19.2% 63 33.3% 401 20.5% 297 50.9% 698 27.5%
University of Stellenbosch 176 10.0% 4 2.1% 180 9.2% 25 4.3% 205 8.1%
University of the Western Cape 31 1.8% 2 1.1% 33 1.7% 11 1.9% 44 1.7%
University of the Witwatersrand 157 8.9% 19 10.1% 176 9.0% 27 4.6% 203 8.0%
Grand Total 1765 189 1954 583 2537
Total number of candidates 2188 445 2633 913 3546
% Pass 81% 42% 74% 64% 72%
Page 6
University of Limpopo obtained full accreditation of their PGDA in 2017. Therefore no repeat candidates in Jan 2018
Jan 2019
Total Jan and JuneFirst timers Repeats Total Repeats
June 2019
** Note 6:
Institute of Accounting Science obtained full accreditation of their PGDA in 2018. Therefore no repeat candidates in Jan 2019
Total Jan and June
Jan 2017 June 2017
Total Jan and JuneFirst timers Repeats Total Repeats
Jan 2018
SAICA - INITIAL TEST OF COMPETENCE: April 2021
By university (number of passes) Continued
June 2018
First timers RepeatsRepeats Total
PGDA UNIVERSITY NAME
No. of
PASSES
% of
total
No. of
PASSES
% of
total
No. of
PASSES
% of
total
No. of
PASSES
% of
total
No. of
PASSES
% of
total
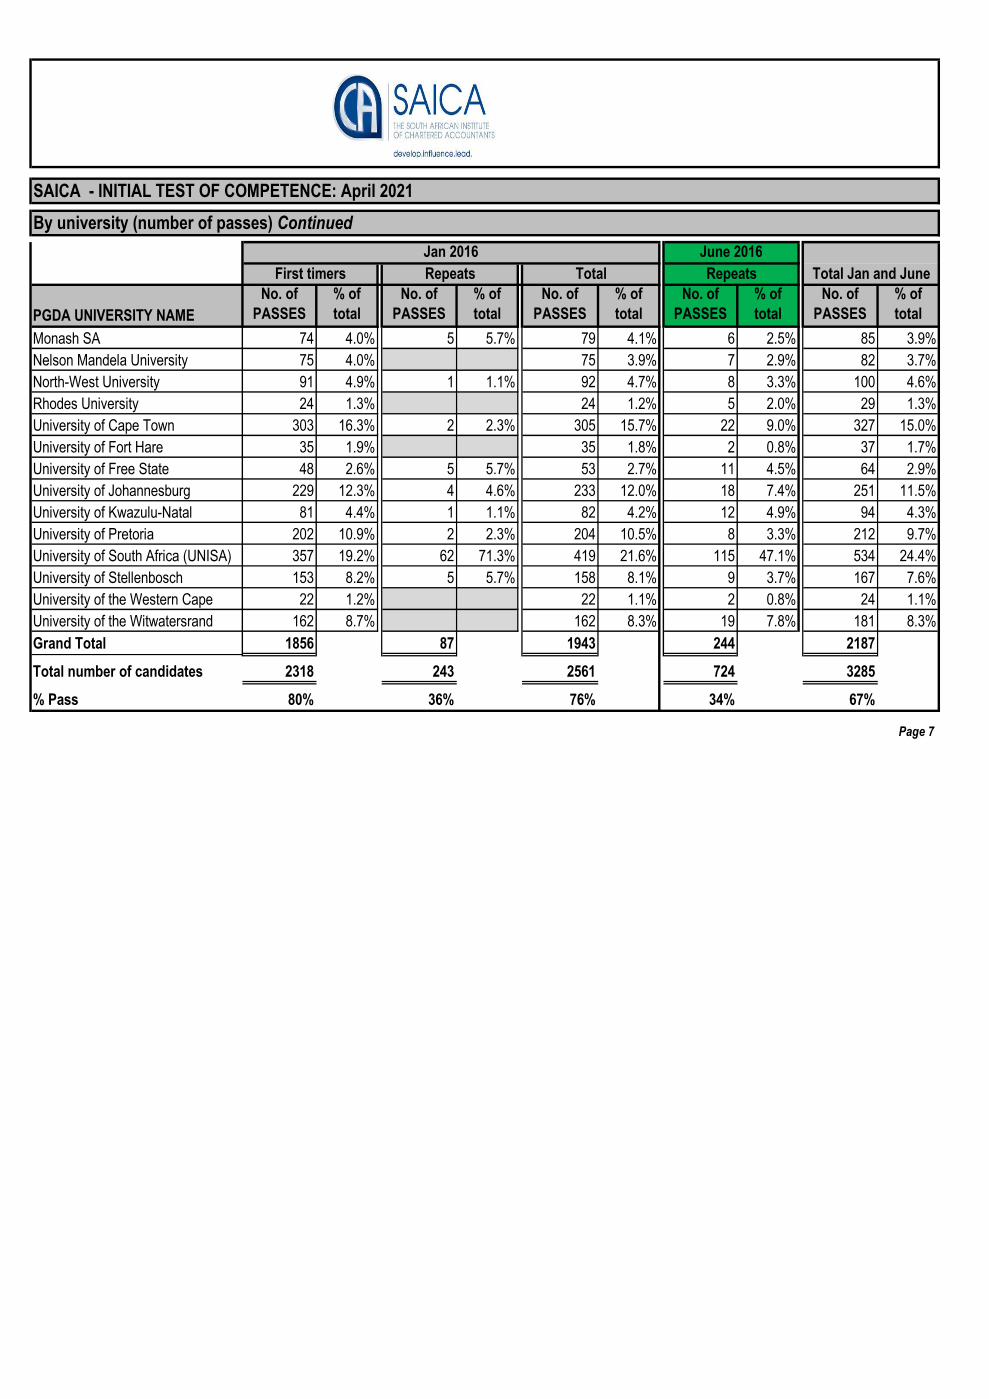
Monash SA 74 4.0% 5 5.7% 79 4.1% 6 2.5% 85 3.9%
Nelson Mandela University 75 4.0% 75 3.9% 7 2.9% 82 3.7%
North-West University 91 4.9% 1 1.1% 92 4.7% 8 3.3% 100 4.6%
Rhodes University 24 1.3% 24 1.2% 5 2.0% 29 1.3%
University of Cape Town 303 16.3% 2 2.3% 305 15.7% 22 9.0% 327 15.0%
University of Fort Hare 35 1.9% 35 1.8% 2 0.8% 37 1.7%
University of Free State 48 2.6% 5 5.7% 53 2.7% 11 4.5% 64 2.9%
University of Johannesburg 229 12.3% 4 4.6% 233 12.0% 18 7.4% 251 11.5%
University of Kwazulu-Natal 81 4.4% 1 1.1% 82 4.2% 12 4.9% 94 4.3%
University of Pretoria 202 10.9% 2 2.3% 204 10.5% 8 3.3% 212 9.7%
University of South Africa (UNISA) 357 19.2% 62 71.3% 419 21.6% 115 47.1% 534 24.4%
University of Stellenbosch 153 8.2% 5 5.7% 158 8.1% 9 3.7% 167 7.6%
University of the Western Cape 22 1.2% 22 1.1% 2 0.8% 24 1.1%
University of the Witwatersrand 162 8.7% 162 8.3% 19 7.8% 181 8.3%
Grand Total 1856 87 1943 244 2187
Total number of candidates 2318 243 2561 724 3285
% Pass 80% 36% 76% 34% 67%
Page 7
SAICA - INITIAL TEST OF COMPETENCE: April 2021
By university (number of passes) Continued
Jan 2016 June 2016
Total Jan and JuneFirst timers Repeats Total Repeats
SAICA - INITIAL TEST OF COMPETENCE: April 2021
By university (all candidates)
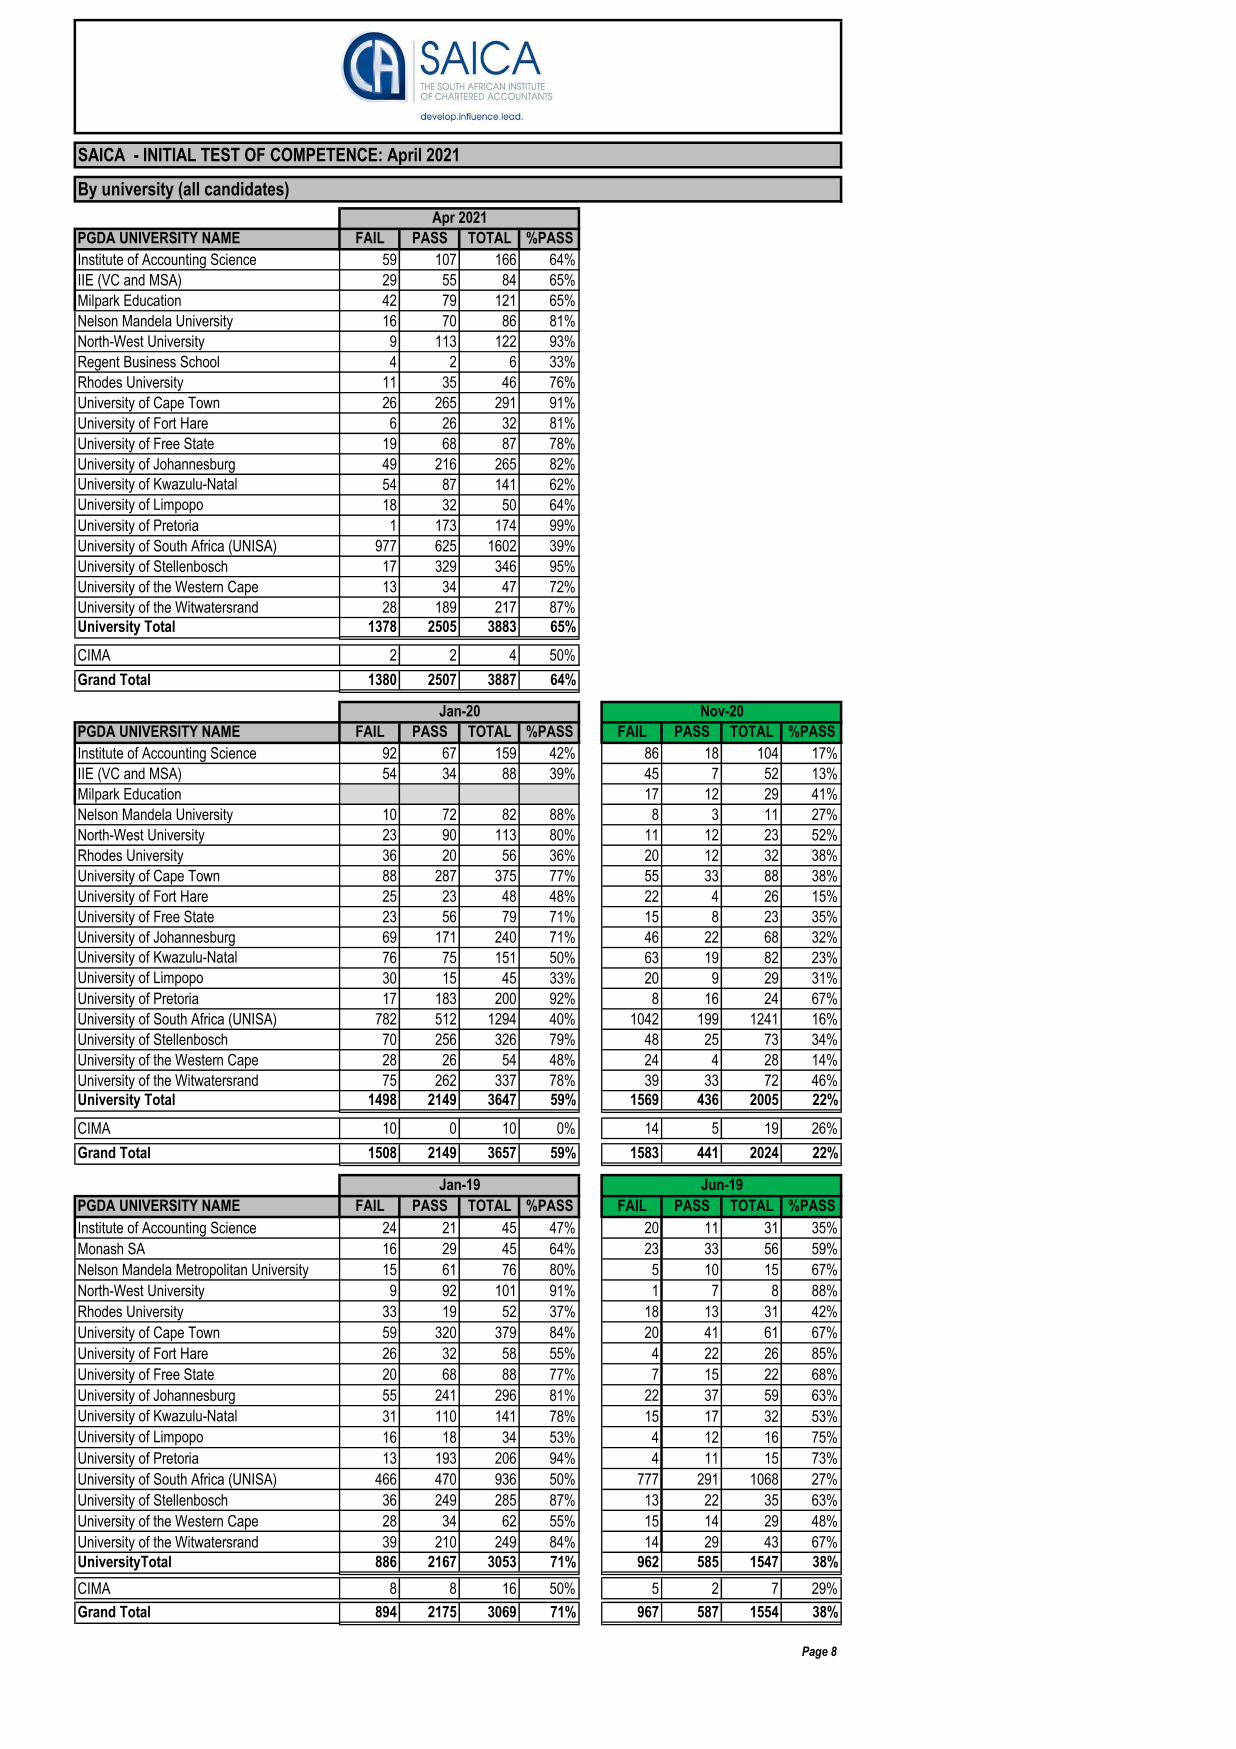
PGDA UNIVERSITY NAME FAIL PASS TOTAL %PASS
Institute of Accounting Science 59 107 166 64%
IIE (VC and MSA) 29 55 84 65%
Milpark Education 42 79 121 65%
Nelson Mandela University 16 70 86 81%
North-West University 9 113 122 93%
Regent Business School 4 2 6 33%
Rhodes University 11 35 46 76%
University of Cape Town 26 265 291 91%
University of Fort Hare 6 26 32 81%
University of Free State 19 68 87 78%
University of Johannesburg 49 216 265 82%
University of Kwazulu-Natal 54 87 141 62%
University of Limpopo 18 32 50 64%
University of Pretoria 1 173 174 99%
University of South Africa (UNISA) 977 625 1602 39%
University of Stellenbosch 17 329 346 95%
University of the Western Cape 13 34 47 72%
University of the Witwatersrand 28 189 217 87%
University Total 1378 2505 3883 65%
CIMA 2 2 4 50%
Grand Total 1380 2507 3887 64%
PGDA UNIVERSITY NAME FAIL PASS TOTAL %PASS FAIL PASS TOTAL %PASS
Institute of Accounting Science 92 67 159 42% 86 18 104 17%
IIE (VC and MSA) 54 34 88 39% 45 7 52 13%
Milpark Education 17 12 29 41%
Nelson Mandela University 10 72 82 88% 8 3 11 27%
North-West University 23 90 113 80% 11 12 23 52%
Rhodes University 36 20 56 36% 20 12 32 38%
University of Cape Town 88 287 375 77% 55 33 88 38%
University of Fort Hare 25 23 48 48% 22 4 26 15%
University of Free State 23 56 79 71% 15 8 23 35%
University of Johannesburg 69 171 240 71% 46 22 68 32%
University of Kwazulu-Natal 76 75 151 50% 63 19 82 23%
University of Limpopo 30 15 45 33% 20 9 29 31%
University of Pretoria 17 183 200 92% 8 16 24 67%
University of South Africa (UNISA) 782 512 1294 40% 1042 199 1241 16%
University of Stellenbosch 70 256 326 79% 48 25 73 34%
University of the Western Cape 28 26 54 48% 24 4 28 14%
University of the Witwatersrand 75 262 337 78% 39 33 72 46%
University Total 1498 2149 3647 59% 1569 436 2005 22%
CIMA 10 0 10 0% 14 5 19 26%
Grand Total 1508 2149 3657 59% 1583 441 2024 22%
PGDA UNIVERSITY NAME FAIL PASS TOTAL %PASS FAIL PASS TOTAL %PASS
Institute of Accounting Science 24 21 45 47% 20 11 31 35%
Monash SA 16 29 45 64% 23 33 56 59%
Nelson Mandela Metropolitan University 15 61 76 80% 5 10 15 67%
North-West University 9 92 101 91% 1 7 8 88%
Rhodes University 33 19 52 37% 18 13 31 42%
University of Cape Town 59 320 379 84% 20 41 61 67%
University of Fort Hare 26 32 58 55% 4 22 26 85%
University of Free State 20 68 88 77% 7 15 22 68%
University of Johannesburg 55 241 296 81% 22 37 59 63%
University of Kwazulu-Natal 31 110 141 78% 15 17 32 53%
University of Limpopo 16 18 34 53% 4 12 16 75%
University of Pretoria 13 193 206 94% 4 11 15 73%
University of South Africa (UNISA) 466 470 936 50% 777 291 1068 27%
University of Stellenbosch 36 249 285 87% 13 22 35 63%
University of the Western Cape 28 34 62 55% 15 14 29 48%
University of the Witwatersrand 39 210 249 84% 14 29 43 67%
UniversityTotal 886 2167 3053 71% 962 585 1547 38%
CIMA 8 8 16 50% 5 2 7 29%
Grand Total 894 2175 3069 71% 967 587 1554 38%
Page 8
Apr 2021
Jan-20 Nov-20
Jan-19 Jun-19
SAICA - INITIAL TEST OF COMPETENCE: April 2021
By university (all candidates) Continued
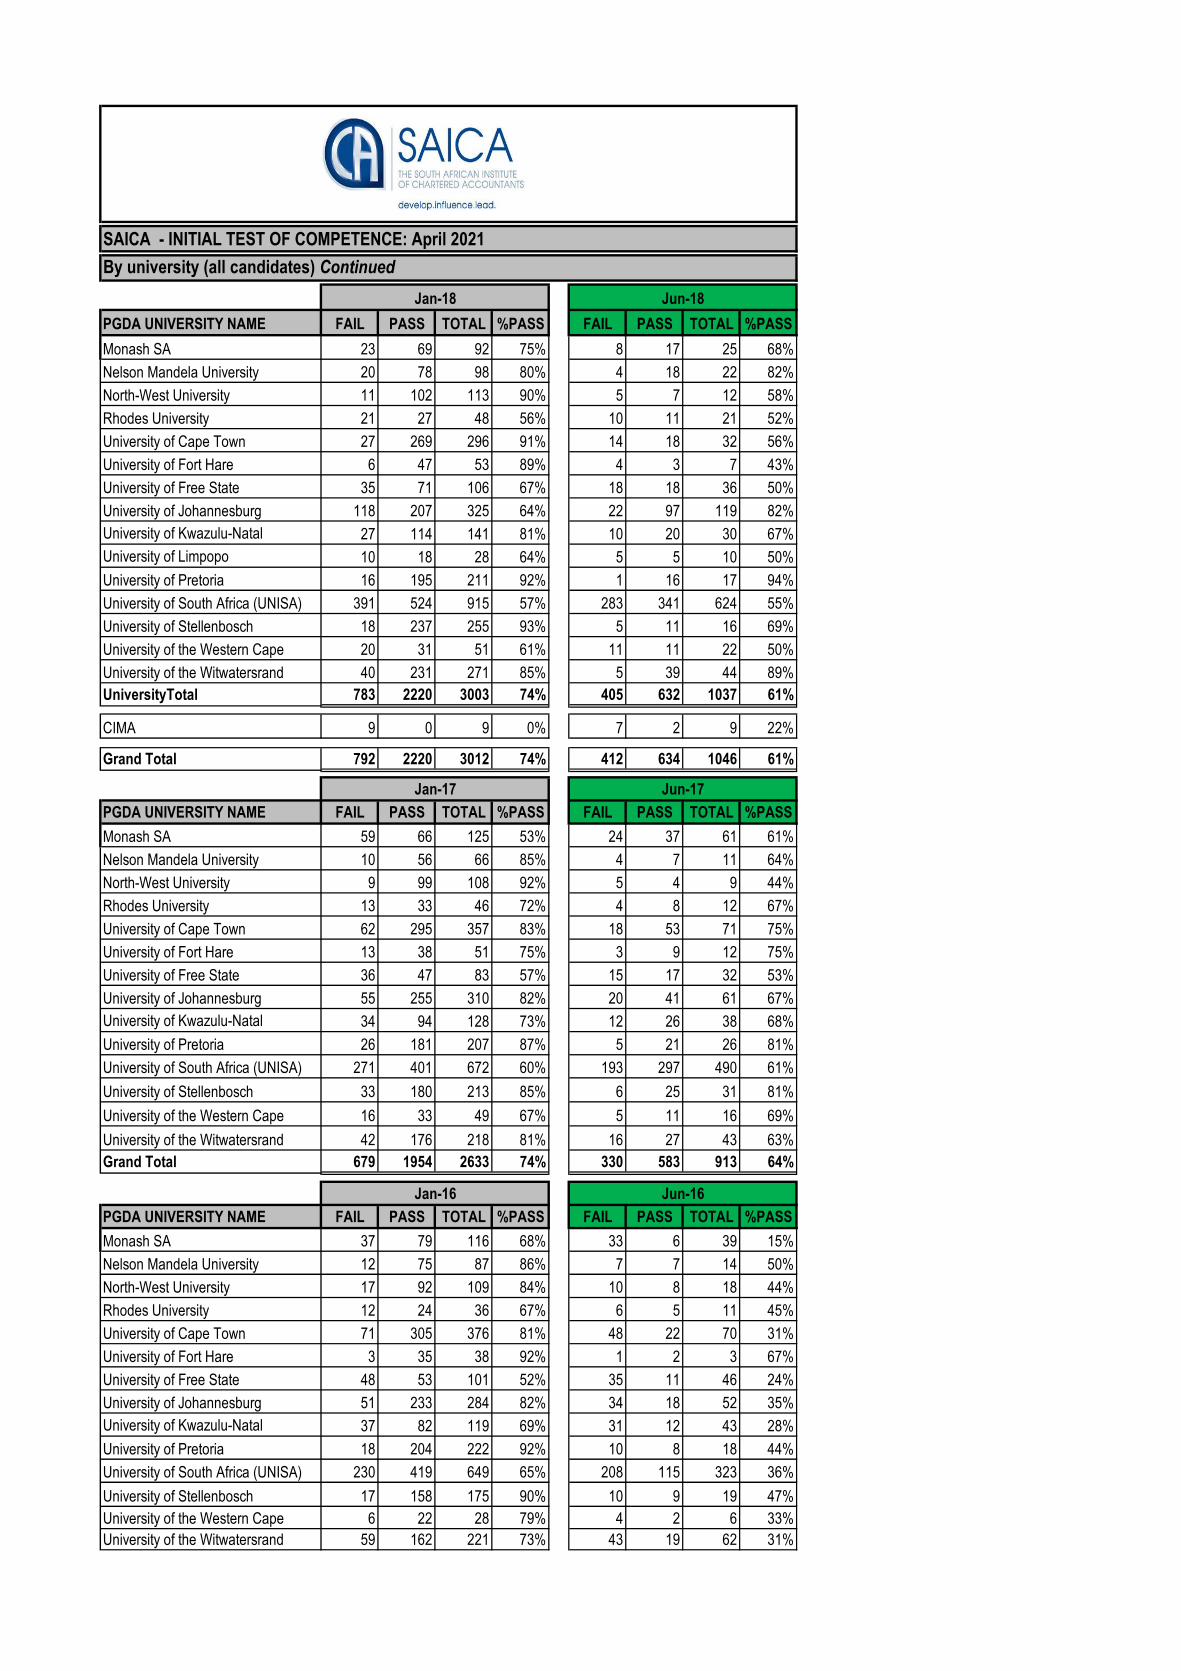
PGDA UNIVERSITY NAME FAIL PASS TOTAL %PASS FAIL PASS TOTAL %PASS
Monash SA 23 69 92 75% 8 17 25 68%
Nelson Mandela University 20 78 98 80% 4 18 22 82%
North-West University 11 102 113 90% 5 7 12 58%
Rhodes University 21 27 48 56% 10 11 21 52%
University of Cape Town 27 269 296 91% 14 18 32 56%
University of Fort Hare 6 47 53 89% 4 3 7 43%
University of Free State 35 71 106 67% 18 18 36 50%
University of Johannesburg 118 207 325 64% 22 97 119 82%
University of Kwazulu-Natal 27 114 141 81% 10 20 30 67%
University of Limpopo 10 18 28 64% 5 5 10 50%
University of Pretoria 16 195 211 92% 1 16 17 94%
University of South Africa (UNISA) 391 524 915 57% 283 341 624 55%
University of Stellenbosch 18 237 255 93% 5 11 16 69%
University of the Western Cape 20 31 51 61% 11 11 22 50%
University of the Witwatersrand 40 231 271 85% 5 39 44 89%
UniversityTotal 783 2220 3003 74% 405 632 1037 61%
CIMA 9 0 9 0% 7 2 9 22%
Grand Total 792 2220 3012 74% 412 634 1046 61%
PGDA UNIVERSITY NAME FAIL PASS TOTAL %PASS FAIL PASS TOTAL %PASS
Monash SA 59 66 125 53% 24 37 61 61%
Nelson Mandela University 10 56 66 85% 4 7 11 64%
North-West University 9 99 108 92% 5 4 9 44%
Rhodes University 13 33 46 72% 4 8 12 67%
University of Cape Town 62 295 357 83% 18 53 71 75%
University of Fort Hare 13 38 51 75% 3 9 12 75%
University of Free State 36 47 83 57% 15 17 32 53%
University of Johannesburg 55 255 310 82% 20 41 61 67%
University of Kwazulu-Natal 34 94 128 73% 12 26 38 68%
University of Pretoria 26 181 207 87% 5 21 26 81%
University of South Africa (UNISA) 271 401 672 60% 193 297 490 61%
University of Stellenbosch 33 180 213 85% 6 25 31 81%
University of the Western Cape 16 33 49 67% 5 11 16 69%
University of the Witwatersrand 42 176 218 81% 16 27 43 63%
Grand Total 679 1954 2633 74% 330 583 913 64%
PGDA UNIVERSITY NAME FAIL PASS TOTAL %PASS FAIL PASS TOTAL %PASS
Monash SA 37 79 116 68% 33 6 39 15%
Nelson Mandela University 12 75 87 86% 7 7 14 50%
North-West University 17 92 109 84% 10 8 18 44%
Rhodes University 12 24 36 67% 6 5 11 45%
University of Cape Town 71 305 376 81% 48 22 70 31%
University of Fort Hare 3 35 38 92% 1 2 3 67%
University of Free State 48 53 101 52% 35 11 46 24%
University of Johannesburg 51 233 284 82% 34 18 52 35%
University of Kwazulu-Natal 37 82 119 69% 31 12 43 28%
University of Pretoria 18 204 222 92% 10 8 18 44%
University of South Africa (UNISA) 230 419 649 65% 208 115 323 36%
University of Stellenbosch 17 158 175 90% 10 9 19 47%
University of the Western Cape 6 22 28 79% 4 2 6 33%
University of the Witwatersrand 59 162 221 73% 43 19 62 31%
Jan-16 Jun-16
Jun-17Jan-17
Jan-18 Jun-18

Grand Total 618 1943 2561 76% 480 244 724 34%
Page 9
SAICA - INITIAL TEST OF COMPETENCE: April 2021
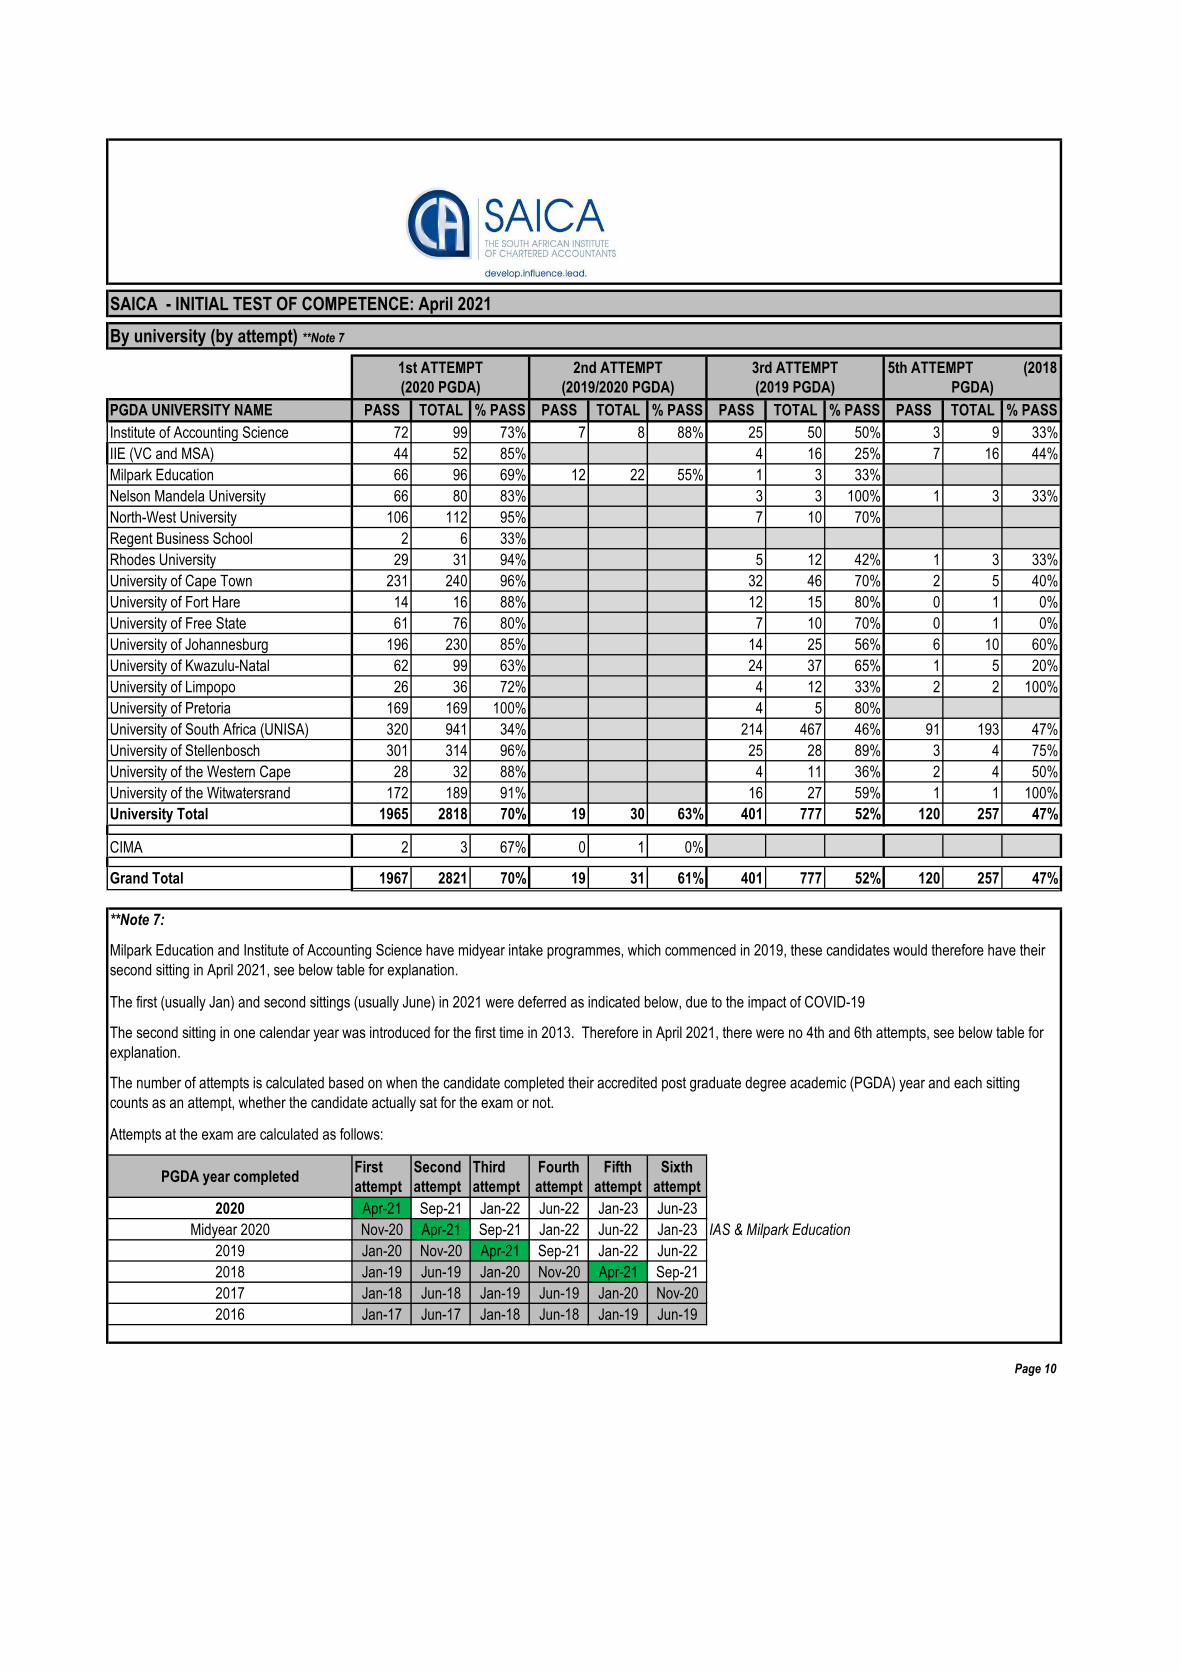
PGDA UNIVERSITY NAME PASS TOTAL % PASS PASS TOTAL % PASS PASS TOTAL % PASS PASS TOTAL % PASS
Institute of Accounting Science 72 99 73% 7 8 88% 25 50 50% 3 9 33%
IIE (VC and MSA) 44 52 85% 4 16 25% 7 16 44%
Milpark Education 66 96 69% 12 22 55% 1 3 33%
Nelson Mandela University 66 80 83% 3 3 100% 1 3 33%
North-West University 106 112 95% 7 10 70%
Regent Business School 2 6 33%
Rhodes University 29 31 94% 5 12 42% 1 3 33%
University of Cape Town 231 240 96% 32 46 70% 2 5 40%
University of Fort Hare 14 16 88% 12 15 80% 0 1 0%
University of Free State 61 76 80% 7 10 70% 0 1 0%
University of Johannesburg 196 230 85% 14 25 56% 6 10 60%
University of Kwazulu-Natal 62 99 63% 24 37 65% 1 5 20%
University of Limpopo 26 36 72% 4 12 33% 2 2 100%
University of Pretoria 169 169 100% 4 5 80%
University of South Africa (UNISA) 320 941 34% 214 467 46% 91 193 47%
University of Stellenbosch 301 314 96% 25 28 89% 3 4 75%
University of the Western Cape 28 32 88% 4 11 36% 2 4 50%
University of the Witwatersrand 172 189 91% 16 27 59% 1 1 100%
University Total 1965 2818 70% 19 30 63% 401 777 52% 120 257 47%
CIMA 2 3 67% 0 1 0%
Grand Total 1967 2821 70% 19 31 61% 401 777 52% 120 257 47%
Attempts at the exam are calculated as follows:
PGDA year completedFirst
attempt
Second
attempt
Third
attempt
Fourth
attempt
Fifth
attempt
Sixth
attempt
2020 Apr-21 Sep-21 Jan-22 Jun-22 Jan-23 Jun-23
Midyear 2020 Nov-20 Apr-21 Sep-21 Jan-22 Jun-22 Jan-23 IAS & Milpark Education
2019 Jan-20 Nov-20 Apr-21 Sep-21 Jan-22 Jun-22
2018 Jan-19 Jun-19 Jan-20 Nov-20 Apr-21 Sep-21
2017 Jan-18 Jun-18 Jan-19 Jun-19 Jan-20 Nov-20
2016 Jan-17 Jun-17 Jan-18 Jun-18 Jan-19 Jun-19
Page 10
The second sitting in one calendar year was introduced for the first time in 2013. Therefore in April 2021, there were no 4th and 6th attempts, see below table for
explanation.
The number of attempts is calculated based on when the candidate completed their accredited post graduate degree academic (PGDA) year and each sitting
counts as an attempt, whether the candidate actually sat for the exam or not.
By university (by attempt) **Note 7
5th ATTEMPT (2018
PGDA)
**Note 7:
1st ATTEMPT
(2020 PGDA)
2nd ATTEMPT
(2019/2020 PGDA)
3rd ATTEMPT
(2019 PGDA)
Milpark Education and Institute of Accounting Science have midyear intake programmes, which commenced in 2019, these candidates would therefore have their
second sitting in April 2021, see below table for explanation.
The first (usually Jan) and second sittings (usually June) in 2021 were deferred as indicated below, due to the impact of COVID-19
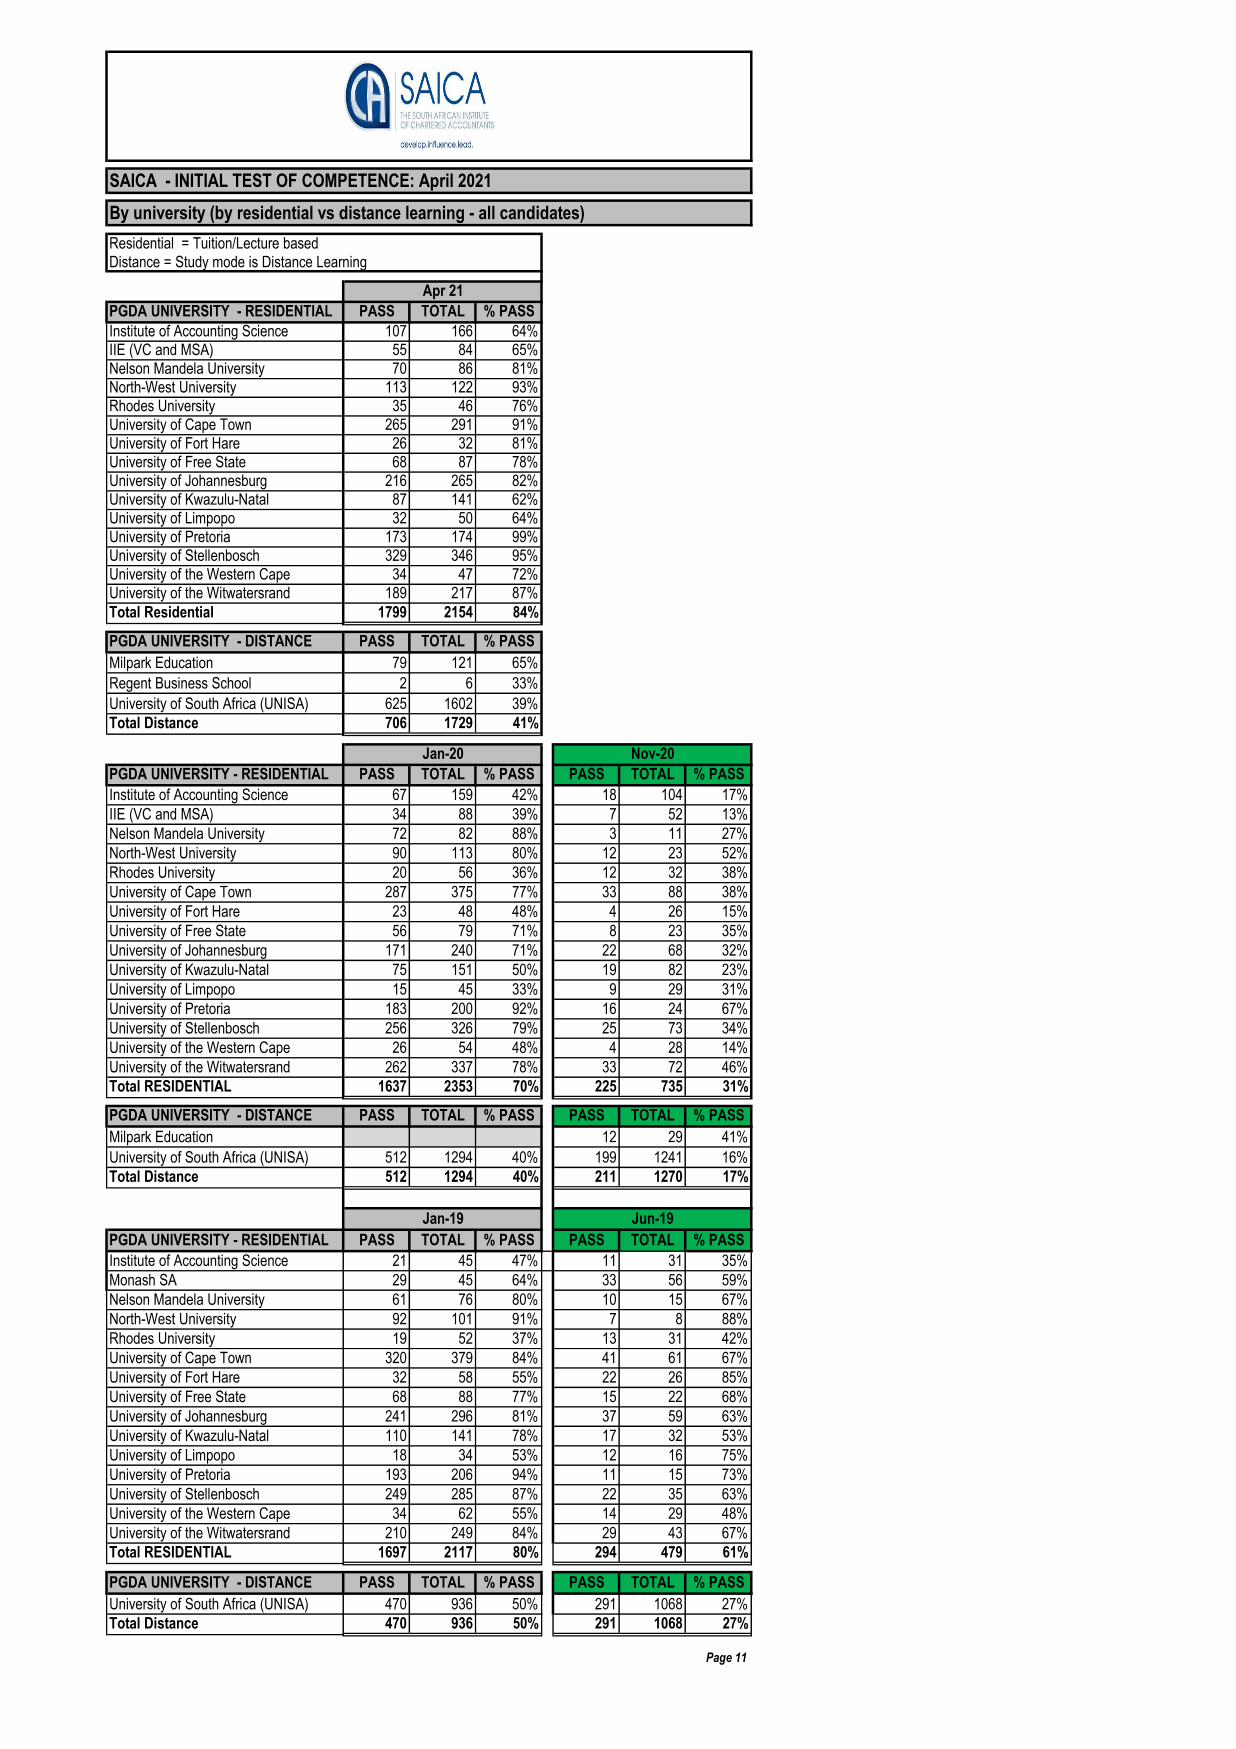
PGDA UNIVERSITY - RESIDENTIAL PASS TOTAL % PASS
Institute of Accounting Science 107 166 64%IIE (VC and MSA) 55 84 65%Nelson Mandela University 70 86 81%
North-West University 113 122 93%Rhodes University 35 46 76%University of Cape Town 265 291 91%University of Fort Hare 26 32 81%
University of Free State 68 87 78%University of Johannesburg 216 265 82%University of Kwazulu-Natal 87 141 62%University of Limpopo 32 50 64%
University of Pretoria 173 174 99%University of Stellenbosch 329 346 95%
University of the Western Cape 34 47 72%University of the Witwatersrand 189 217 87%
Total Residential 1799 2154 84%
PGDA UNIVERSITY - DISTANCE PASS TOTAL % PASS
Milpark Education 79 121 65%
Regent Business School 2 6 33%
University of South Africa (UNISA) 625 1602 39%
Total Distance 706 1729 41%
PGDA UNIVERSITY - RESIDENTIAL PASS TOTAL % PASS PASS TOTAL % PASS
Institute of Accounting Science 67 159 42% 18 104 17%
IIE (VC and MSA) 34 88 39% 7 52 13%
Nelson Mandela University 72 82 88% 3 11 27%
North-West University 90 113 80% 12 23 52%
Rhodes University 20 56 36% 12 32 38%
University of Cape Town 287 375 77% 33 88 38%
University of Fort Hare 23 48 48% 4 26 15%
University of Free State 56 79 71% 8 23 35%
University of Johannesburg 171 240 71% 22 68 32%
University of Kwazulu-Natal 75 151 50% 19 82 23%
University of Limpopo 15 45 33% 9 29 31%
University of Pretoria 183 200 92% 16 24 67%
University of Stellenbosch 256 326 79% 25 73 34%
University of the Western Cape 26 54 48% 4 28 14%
University of the Witwatersrand 262 337 78% 33 72 46%
Total RESIDENTIAL 1637 2353 70% 225 735 31%
PGDA UNIVERSITY - DISTANCE PASS TOTAL % PASS PASS TOTAL % PASS
Milpark Education 12 29 41%
University of South Africa (UNISA) 512 1294 40% 199 1241 16%
Total Distance 512 1294 40% 211 1270 17%
PGDA UNIVERSITY - RESIDENTIAL PASS TOTAL % PASS PASS TOTAL % PASS
Institute of Accounting Science 21 45 47% 11 31 35%
Monash SA 29 45 64% 33 56 59%
Nelson Mandela University 61 76 80% 10 15 67%
North-West University 92 101 91% 7 8 88%
Rhodes University 19 52 37% 13 31 42%
University of Cape Town 320 379 84% 41 61 67%
University of Fort Hare 32 58 55% 22 26 85%
University of Free State 68 88 77% 15 22 68%
University of Johannesburg 241 296 81% 37 59 63%
University of Kwazulu-Natal 110 141 78% 17 32 53%
University of Limpopo 18 34 53% 12 16 75%
University of Pretoria 193 206 94% 11 15 73%
University of Stellenbosch 249 285 87% 22 35 63%
University of the Western Cape 34 62 55% 14 29 48%
University of the Witwatersrand 210 249 84% 29 43 67%
Total RESIDENTIAL 1697 2117 80% 294 479 61%
PGDA UNIVERSITY - DISTANCE PASS TOTAL % PASS PASS TOTAL % PASS
University of South Africa (UNISA) 470 936 50% 291 1068 27%
Total Distance 470 936 50% 291 1068 27%
Page 11
Jun-19
Jan-20 Nov-20
SAICA - INITIAL TEST OF COMPETENCE: April 2021
Residential = Tuition/Lecture based
Jan-19
Distance = Study mode is Distance Learning
By university (by residential vs distance learning - all candidates)
Apr 21
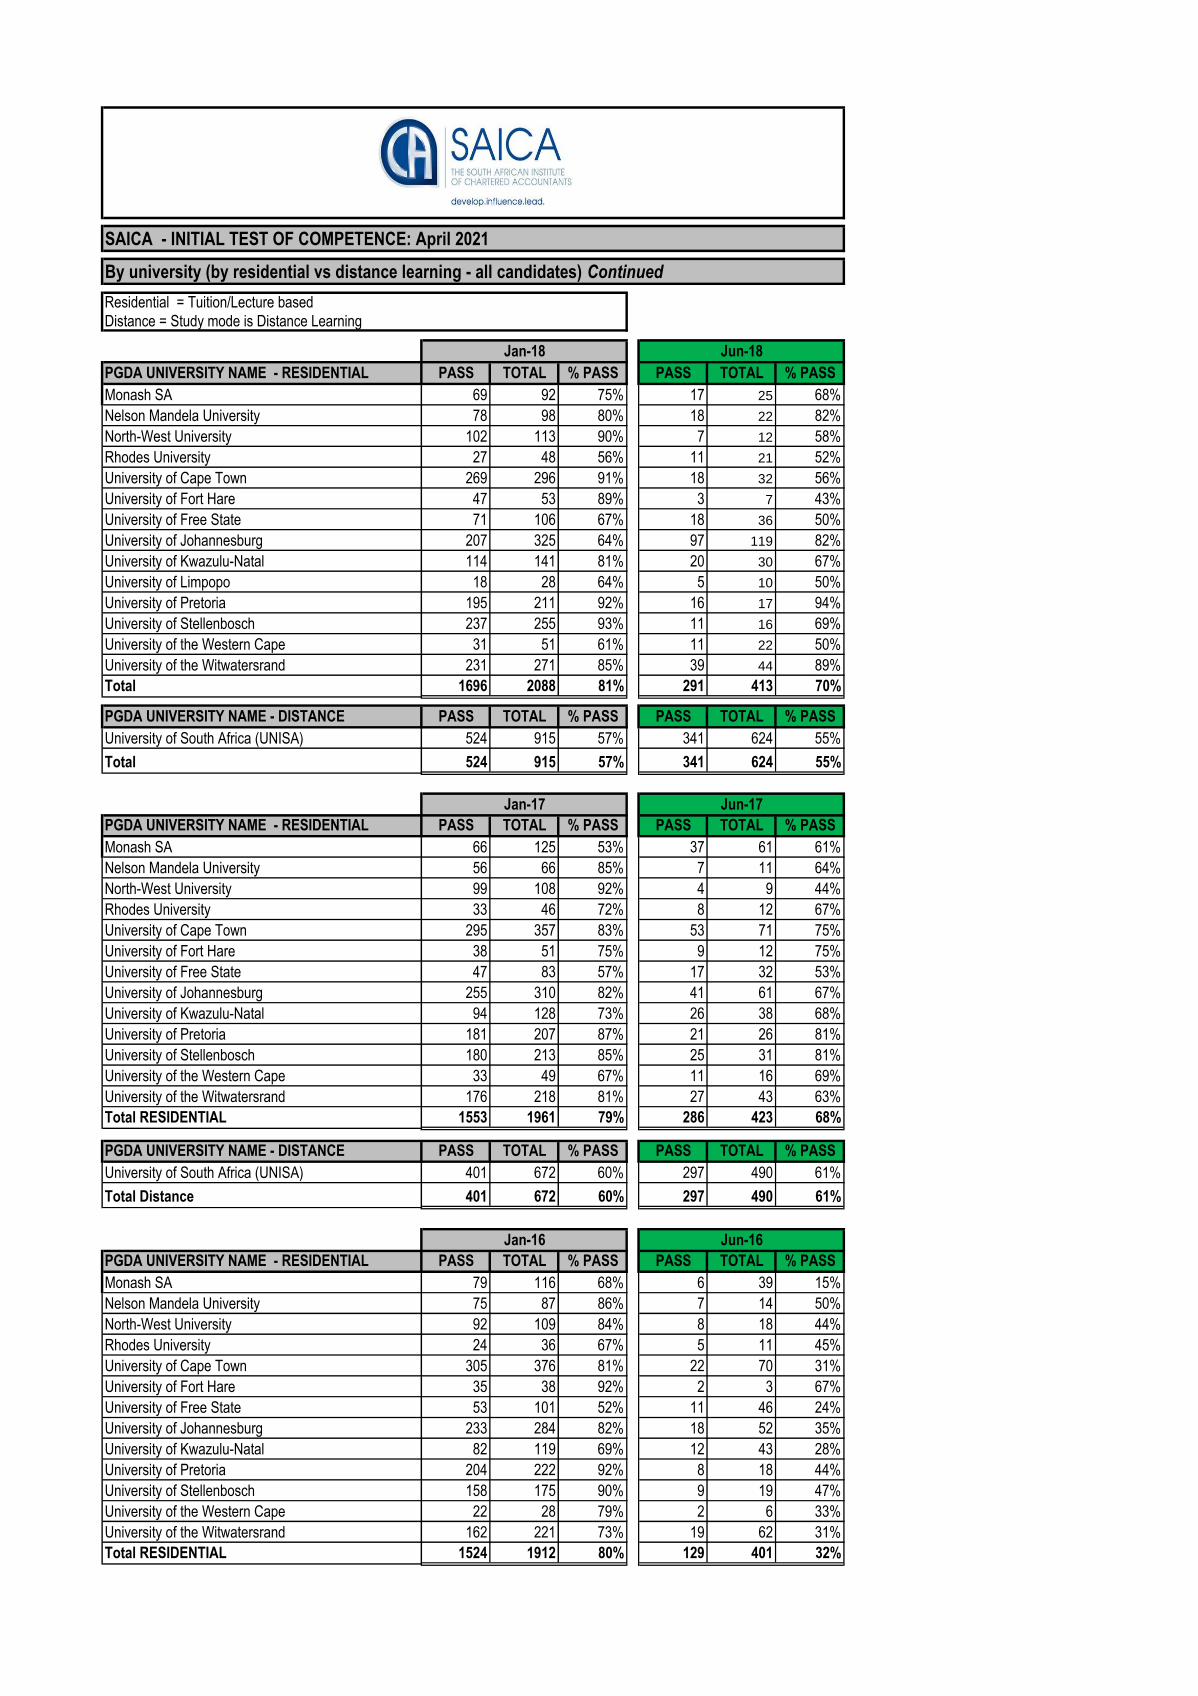
PGDA UNIVERSITY NAME - RESIDENTIAL PASS TOTAL % PASS PASS TOTAL % PASS
Monash SA 69 92 75% 17 25 68%
Nelson Mandela University 78 98 80% 18 22 82%
North-West University 102 113 90% 7 12 58%
Rhodes University 27 48 56% 11 21 52%
University of Cape Town 269 296 91% 18 32 56%
University of Fort Hare 47 53 89% 3 7 43%
University of Free State 71 106 67% 18 36 50%
University of Johannesburg 207 325 64% 97 119 82%
University of Kwazulu-Natal 114 141 81% 20 30 67%
University of Limpopo 18 28 64% 5 10 50%
University of Pretoria 195 211 92% 16 17 94%
University of Stellenbosch 237 255 93% 11 16 69%
University of the Western Cape 31 51 61% 11 22 50%
University of the Witwatersrand 231 271 85% 39 44 89%
Total 1696 2088 81% 291 413 70%
PGDA UNIVERSITY NAME - DISTANCE PASS TOTAL % PASS PASS TOTAL % PASS
University of South Africa (UNISA) 524 915 57% 341 624 55%
Total 524 915 57% 341 624 55%
PGDA UNIVERSITY NAME - RESIDENTIAL PASS TOTAL % PASS PASS TOTAL % PASS
Monash SA 66 125 53% 37 61 61%
Nelson Mandela University 56 66 85% 7 11 64%
North-West University 99 108 92% 4 9 44%
Rhodes University 33 46 72% 8 12 67%
University of Cape Town 295 357 83% 53 71 75%
University of Fort Hare 38 51 75% 9 12 75%
University of Free State 47 83 57% 17 32 53%
University of Johannesburg 255 310 82% 41 61 67%
University of Kwazulu-Natal 94 128 73% 26 38 68%
University of Pretoria 181 207 87% 21 26 81%
University of Stellenbosch 180 213 85% 25 31 81%
University of the Western Cape 33 49 67% 11 16 69%
University of the Witwatersrand 176 218 81% 27 43 63%
Total RESIDENTIAL 1553 1961 79% 286 423 68%
PGDA UNIVERSITY NAME - DISTANCE PASS TOTAL % PASS PASS TOTAL % PASS
University of South Africa (UNISA) 401 672 60% 297 490 61%
Total Distance 401 672 60% 297 490 61%
PGDA UNIVERSITY NAME - RESIDENTIAL PASS TOTAL % PASS PASS TOTAL % PASS
Monash SA 79 116 68% 6 39 15%
Nelson Mandela University 75 87 86% 7 14 50%
North-West University 92 109 84% 8 18 44%
Rhodes University 24 36 67% 5 11 45%
University of Cape Town 305 376 81% 22 70 31%
University of Fort Hare 35 38 92% 2 3 67%
University of Free State 53 101 52% 11 46 24%
University of Johannesburg 233 284 82% 18 52 35%
University of Kwazulu-Natal 82 119 69% 12 43 28%
University of Pretoria 204 222 92% 8 18 44%
University of Stellenbosch 158 175 90% 9 19 47%
University of the Western Cape 22 28 79% 2 6 33%
University of the Witwatersrand 162 221 73% 19 62 31%
Total RESIDENTIAL 1524 1912 80% 129 401 32%
Jan-16 Jun-16
SAICA - INITIAL TEST OF COMPETENCE: April 2021
By university (by residential vs distance learning - all candidates) Continued
Residential = Tuition/Lecture based
Distance = Study mode is Distance Learning
Jan-17 Jun-17
Jan-18 Jun-18
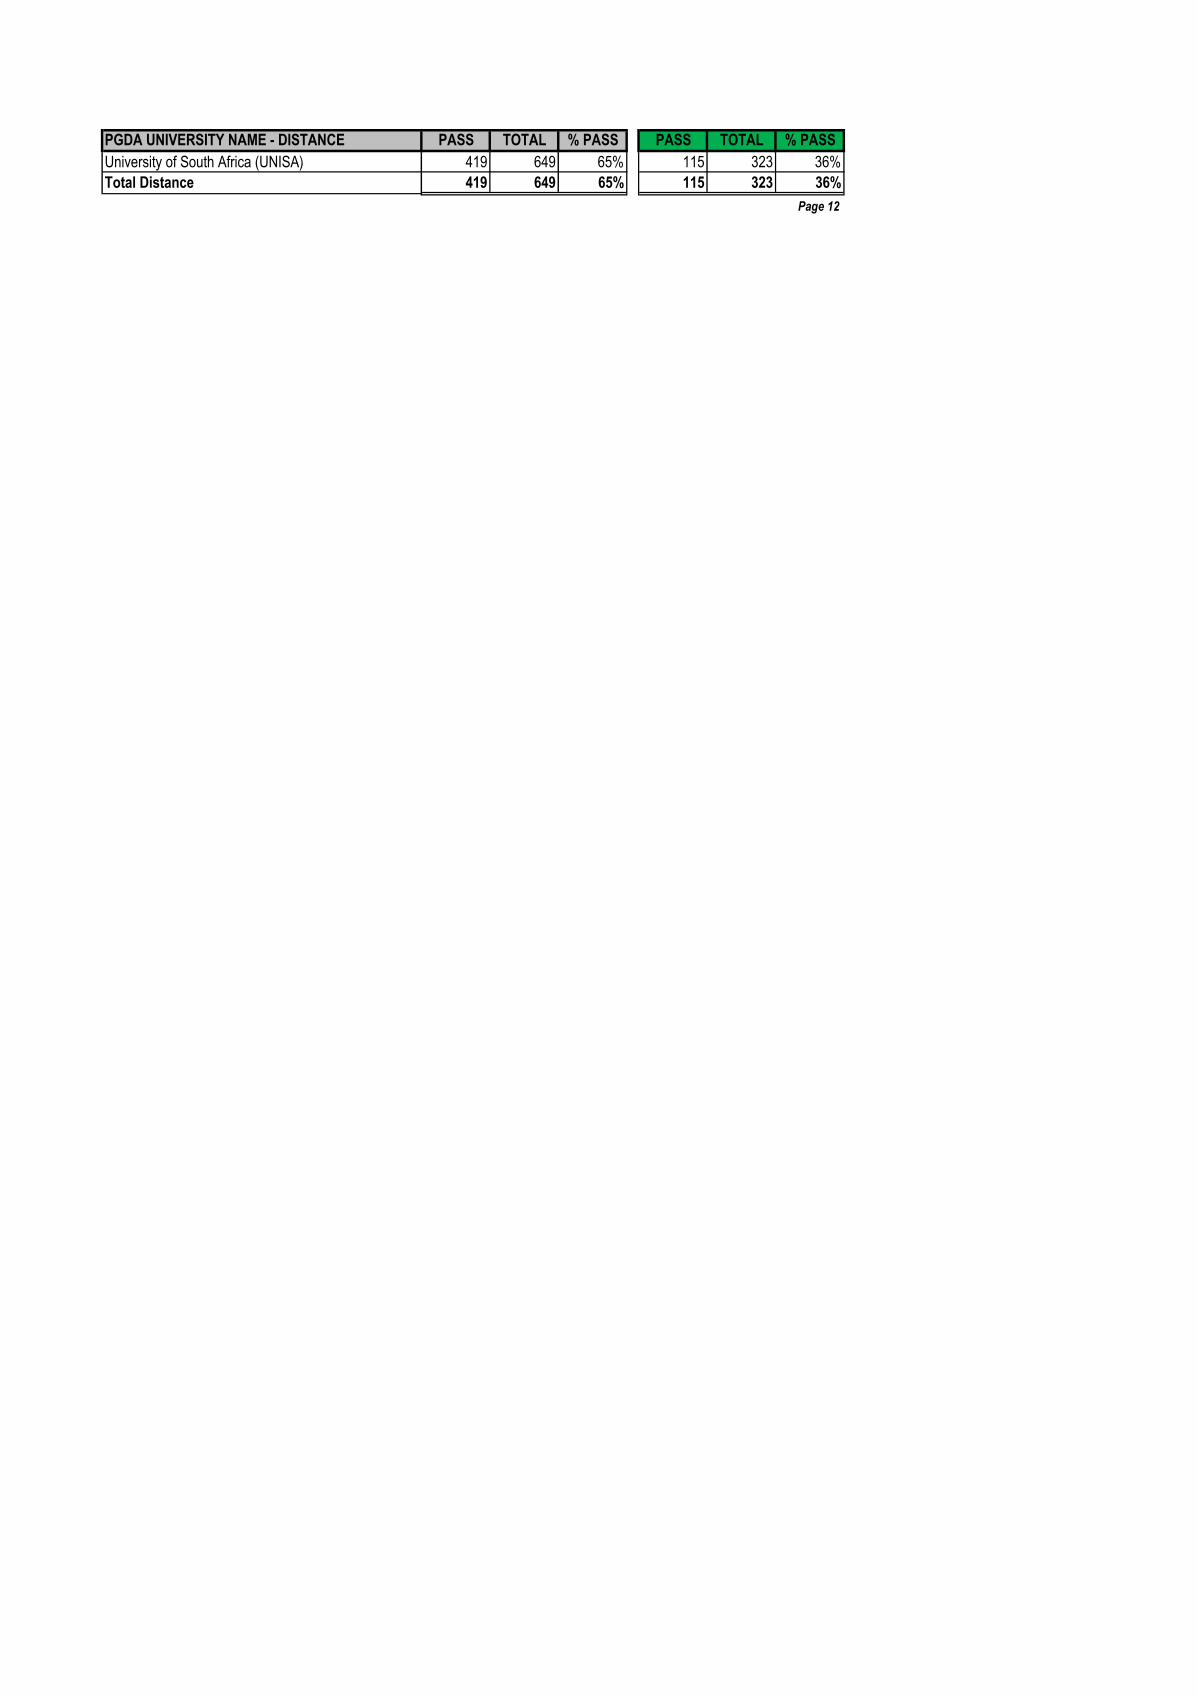
PGDA UNIVERSITY NAME - DISTANCE PASS TOTAL % PASS PASS TOTAL % PASS
University of South Africa (UNISA) 419 649 65% 115 323 36%
Total Distance 419 649 65% 115 323 36%
Page 12
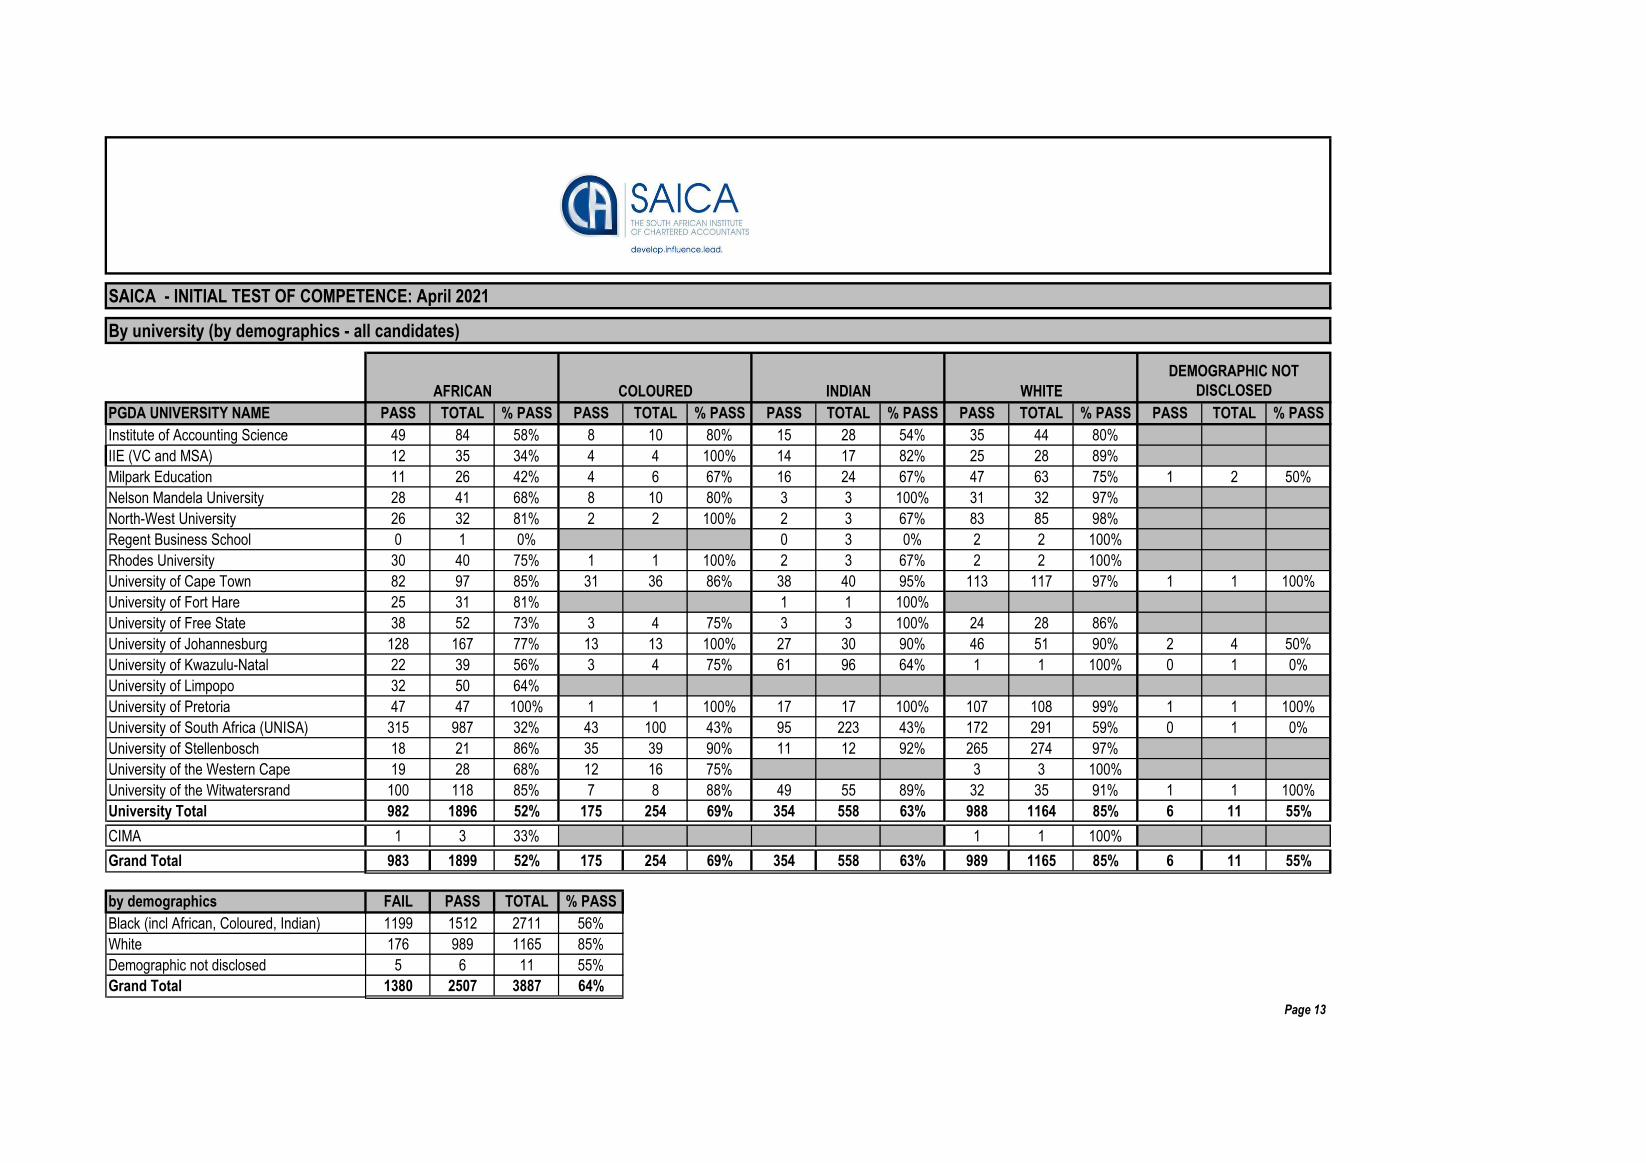
COLOURED INDIAN WHITE
PGDA UNIVERSITY NAME PASS TOTAL % PASS PASS TOTAL % PASS PASS TOTAL % PASS PASS TOTAL % PASS PASS TOTAL % PASS
Institute of Accounting Science 49 84 58% 8 10 80% 15 28 54% 35 44 80%
IIE (VC and MSA) 12 35 34% 4 4 100% 14 17 82% 25 28 89%
Milpark Education 11 26 42% 4 6 67% 16 24 67% 47 63 75% 1 2 50%
Nelson Mandela University 28 41 68% 8 10 80% 3 3 100% 31 32 97%
North-West University 26 32 81% 2 2 100% 2 3 67% 83 85 98%
Regent Business School 0 1 0% 0 3 0% 2 2 100%
Rhodes University 30 40 75% 1 1 100% 2 3 67% 2 2 100%
University of Cape Town 82 97 85% 31 36 86% 38 40 95% 113 117 97% 1 1 100%
University of Fort Hare 25 31 81% 1 1 100%
University of Free State 38 52 73% 3 4 75% 3 3 100% 24 28 86%
University of Johannesburg 128 167 77% 13 13 100% 27 30 90% 46 51 90% 2 4 50%
University of Kwazulu-Natal 22 39 56% 3 4 75% 61 96 64% 1 1 100% 0 1 0%
University of Limpopo 32 50 64%
University of Pretoria 47 47 100% 1 1 100% 17 17 100% 107 108 99% 1 1 100%
University of South Africa (UNISA) 315 987 32% 43 100 43% 95 223 43% 172 291 59% 0 1 0%
University of Stellenbosch 18 21 86% 35 39 90% 11 12 92% 265 274 97%
University of the Western Cape 19 28 68% 12 16 75% 3 3 100%
University of the Witwatersrand 100 118 85% 7 8 88% 49 55 89% 32 35 91% 1 1 100%
University Total 982 1896 52% 175 254 69% 354 558 63% 988 1164 85% 6 11 55%
CIMA 1 3 33% 1 1 100%
Grand Total 983 1899 52% 175 254 69% 354 558 63% 989 1165 85% 6 11 55%
by demographics FAIL PASS TOTAL % PASS
Black (incl African, Coloured, Indian) 1199 1512 2711 56%
White 176 989 1165 85%
Demographic not disclosed 5 6 11 55%
Grand Total 1380 2507 3887 64%
Page 13
By university (by demographics - all candidates)
SAICA - INITIAL TEST OF COMPETENCE: April 2021
DEMOGRAPHIC NOT
DISCLOSEDAFRICAN
COLOURED INDIAN WHITE
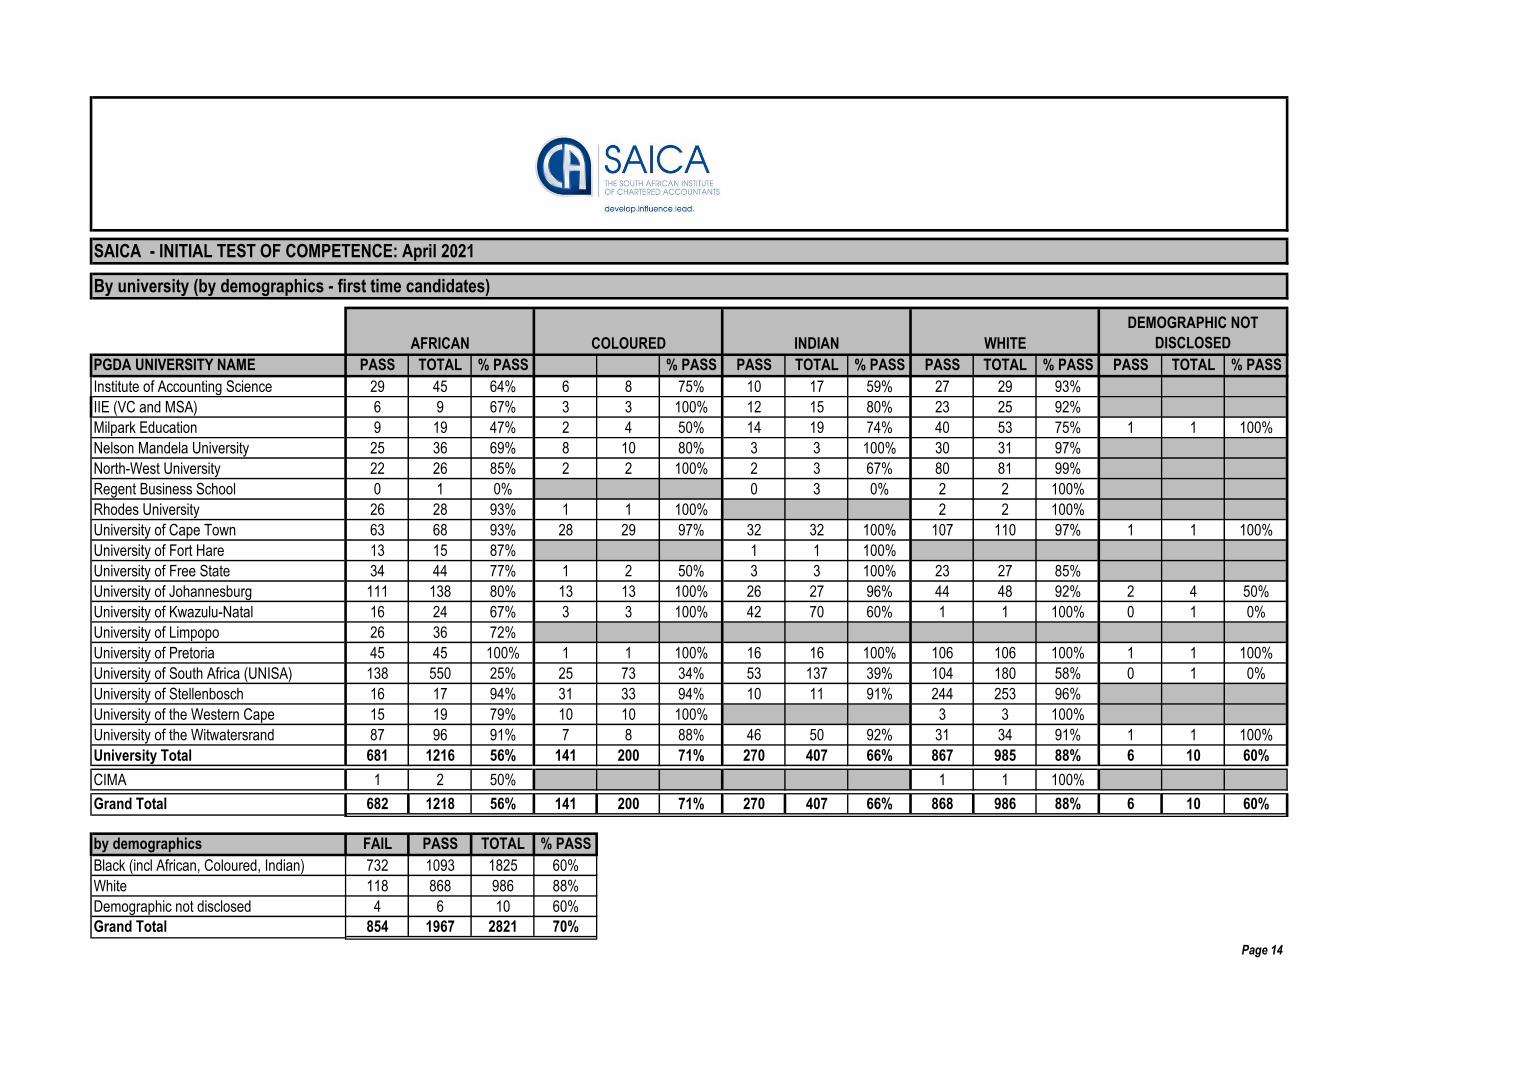
PGDA UNIVERSITY NAME PASS TOTAL % PASS % PASS PASS TOTAL % PASS PASS TOTAL % PASS PASS TOTAL % PASS
Institute of Accounting Science 29 45 64% 6 8 75% 10 17 59% 27 29 93%
IIE (VC and MSA) 6 9 67% 3 3 100% 12 15 80% 23 25 92%
Milpark Education 9 19 47% 2 4 50% 14 19 74% 40 53 75% 1 1 100%
Nelson Mandela University 25 36 69% 8 10 80% 3 3 100% 30 31 97%
North-West University 22 26 85% 2 2 100% 2 3 67% 80 81 99%
Regent Business School 0 1 0% 0 3 0% 2 2 100%
Rhodes University 26 28 93% 1 1 100% 2 2 100%
University of Cape Town 63 68 93% 28 29 97% 32 32 100% 107 110 97% 1 1 100%
University of Fort Hare 13 15 87% 1 1 100%
University of Free State 34 44 77% 1 2 50% 3 3 100% 23 27 85%
University of Johannesburg 111 138 80% 13 13 100% 26 27 96% 44 48 92% 2 4 50%
University of Kwazulu-Natal 16 24 67% 3 3 100% 42 70 60% 1 1 100% 0 1 0%
University of Limpopo 26 36 72%
University of Pretoria 45 45 100% 1 1 100% 16 16 100% 106 106 100% 1 1 100%
University of South Africa (UNISA) 138 550 25% 25 73 34% 53 137 39% 104 180 58% 0 1 0%
University of Stellenbosch 16 17 94% 31 33 94% 10 11 91% 244 253 96%
University of the Western Cape 15 19 79% 10 10 100% 3 3 100%
University of the Witwatersrand 87 96 91% 7 8 88% 46 50 92% 31 34 91% 1 1 100%
University Total 681 1216 56% 141 200 71% 270 407 66% 867 985 88% 6 10 60%
CIMA 1 2 50% 1 1 100%
Grand Total 682 1218 56% 141 200 71% 270 407 66% 868 986 88% 6 10 60%
by demographics FAIL PASS TOTAL % PASS
Black (incl African, Coloured, Indian) 732 1093 1825 60%
White 118 868 986 88%
Demographic not disclosed 4 6 10 60%
Grand Total 854 1967 2821 70%
Page 14
SAICA - INITIAL TEST OF COMPETENCE: April 2021
By university (by demographics - first time candidates)
DEMOGRAPHIC NOT
DISCLOSEDAFRICAN
Total
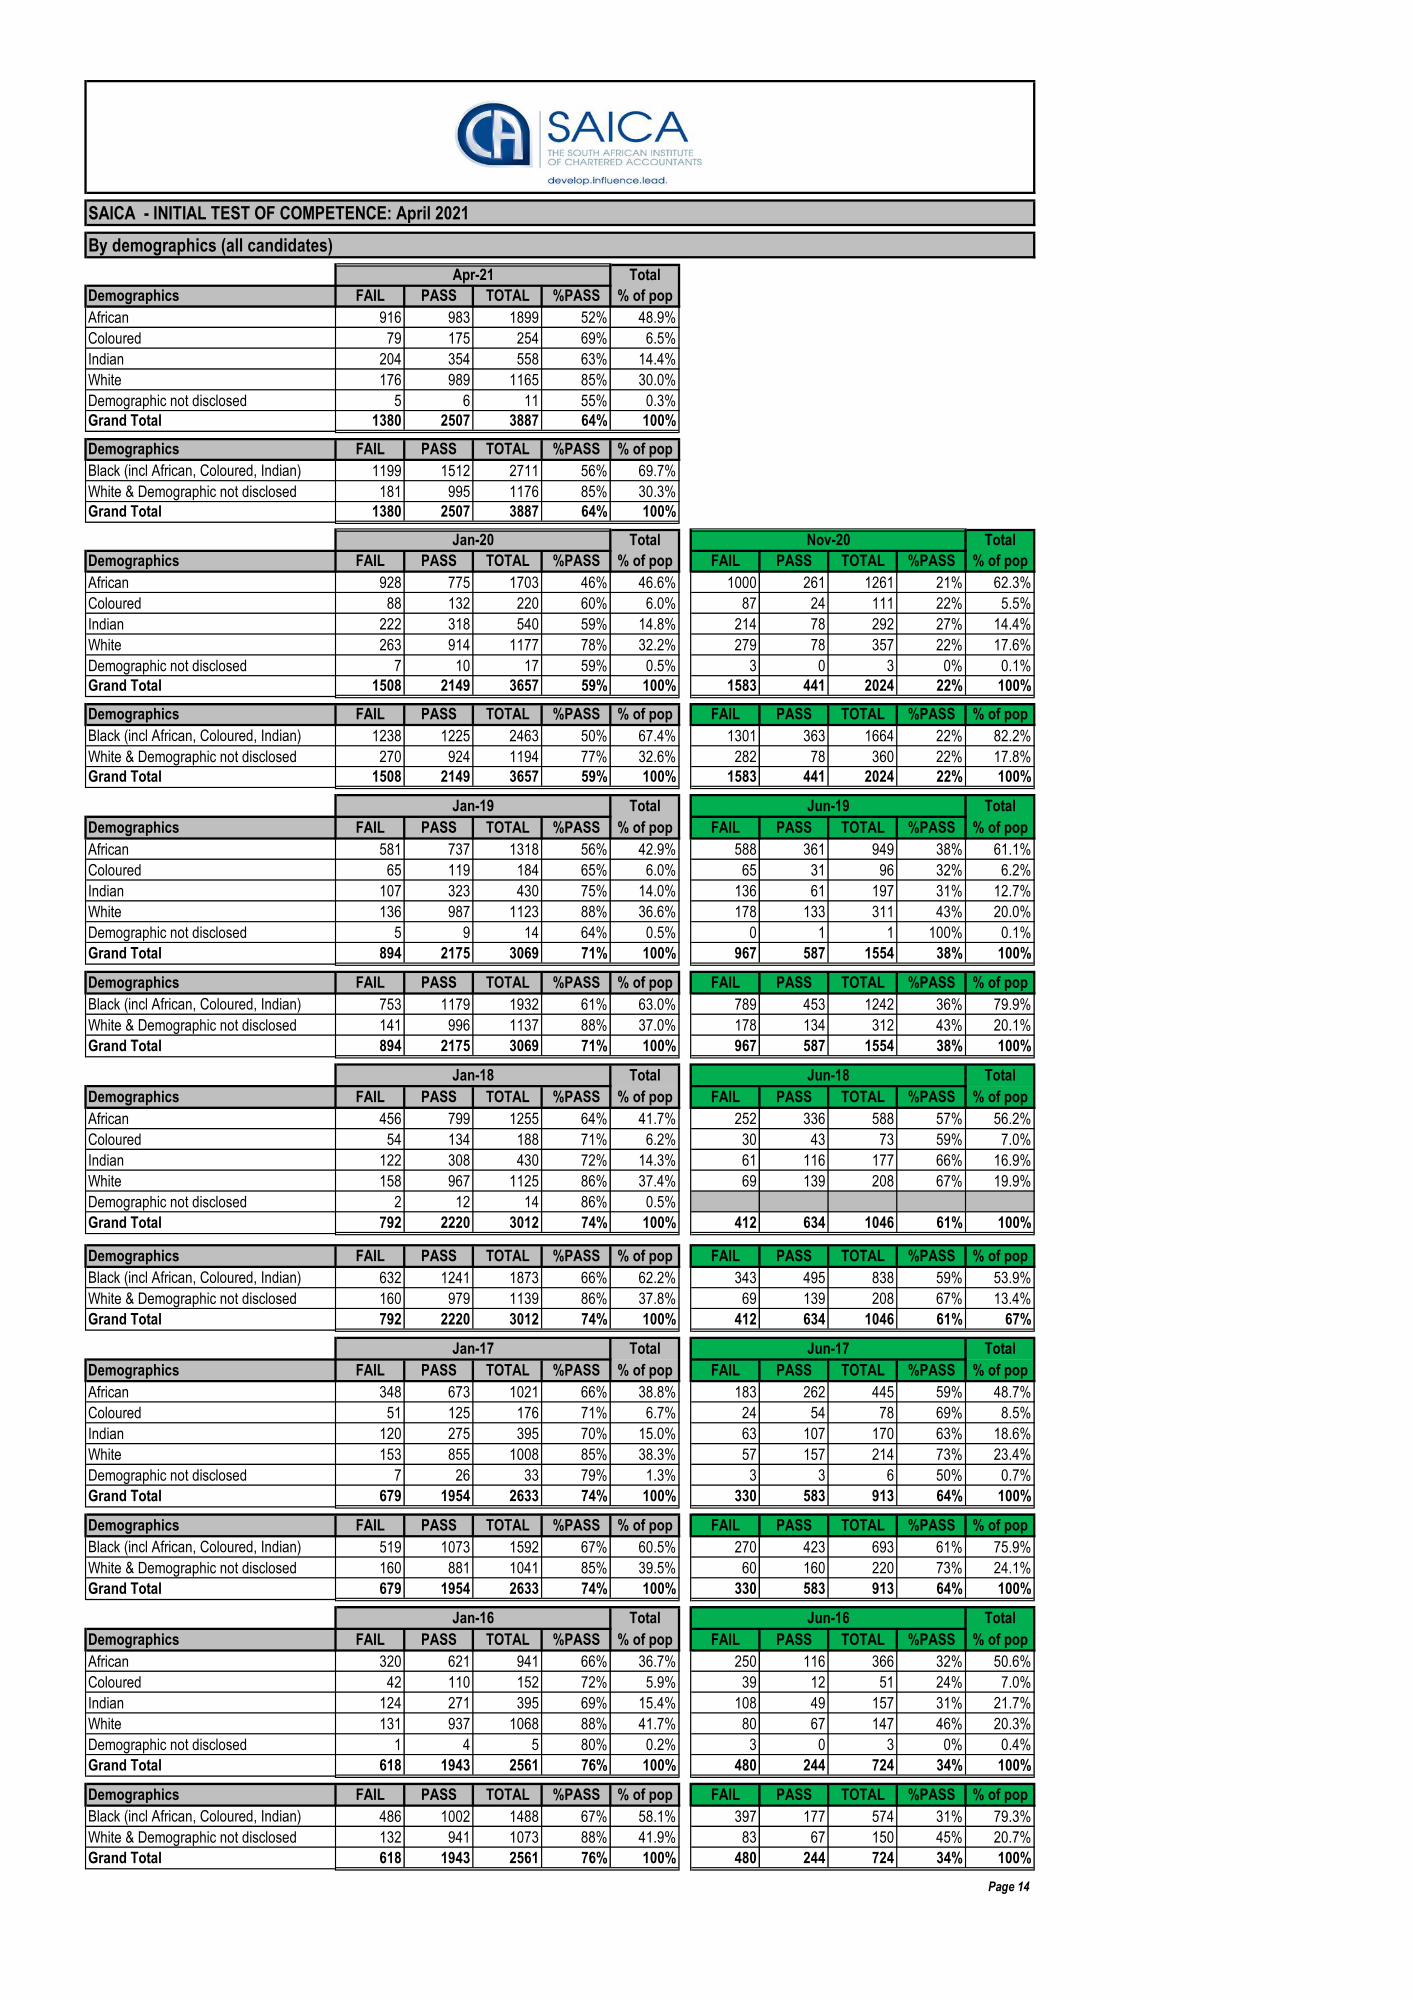
Demographics FAIL PASS TOTAL %PASS % of pop
African 916 983 1899 52% 48.9%
Coloured 79 175 254 69% 6.5%
Indian 204 354 558 63% 14.4%
White 176 989 1165 85% 30.0%
Demographic not disclosed 5 6 11 55% 0.3%
Grand Total 1380 2507 3887 64% 100%
Demographics FAIL PASS TOTAL %PASS % of pop
Black (incl African, Coloured, Indian) 1199 1512 2711 56% 69.7%
White & Demographic not disclosed 181 995 1176 85% 30.3%
Grand Total 1380 2507 3887 64% 100%
Total Total
Demographics FAIL PASS TOTAL %PASS % of pop FAIL PASS TOTAL %PASS % of pop
African 928 775 1703 46% 46.6% 1000 261 1261 21% 62.3%
Coloured 88 132 220 60% 6.0% 87 24 111 22% 5.5%
Indian 222 318 540 59% 14.8% 214 78 292 27% 14.4%
White 263 914 1177 78% 32.2% 279 78 357 22% 17.6%
Demographic not disclosed 7 10 17 59% 0.5% 3 0 3 0% 0.1%
Grand Total 1508 2149 3657 59% 100% 1583 441 2024 22% 100%
Demographics FAIL PASS TOTAL %PASS % of pop FAIL PASS TOTAL %PASS % of pop
Black (incl African, Coloured, Indian) 1238 1225 2463 50% 67.4% 1301 363 1664 22% 82.2%
White & Demographic not disclosed 270 924 1194 77% 32.6% 282 78 360 22% 17.8%
Grand Total 1508 2149 3657 59% 100% 1583 441 2024 22% 100%
Total Total
Demographics FAIL PASS TOTAL %PASS % of pop FAIL PASS TOTAL %PASS % of pop
African 581 737 1318 56% 42.9% 588 361 949 38% 61.1%
Coloured 65 119 184 65% 6.0% 65 31 96 32% 6.2%
Indian 107 323 430 75% 14.0% 136 61 197 31% 12.7%
White 136 987 1123 88% 36.6% 178 133 311 43% 20.0%
Demographic not disclosed 5 9 14 64% 0.5% 0 1 1 100% 0.1%
Grand Total 894 2175 3069 71% 100% 967 587 1554 38% 100%
Demographics FAIL PASS TOTAL %PASS % of pop FAIL PASS TOTAL %PASS % of pop
Black (incl African, Coloured, Indian) 753 1179 1932 61% 63.0% 789 453 1242 36% 79.9%
White & Demographic not disclosed 141 996 1137 88% 37.0% 178 134 312 43% 20.1%
Grand Total 894 2175 3069 71% 100% 967 587 1554 38% 100%
Total Total
Demographics FAIL PASS TOTAL %PASS % of pop FAIL PASS TOTAL %PASS % of pop
African 456 799 1255 64% 41.7% 252 336 588 57% 56.2%
Coloured 54 134 188 71% 6.2% 30 43 73 59% 7.0%
Indian 122 308 430 72% 14.3% 61 116 177 66% 16.9%
White 158 967 1125 86% 37.4% 69 139 208 67% 19.9%
Demographic not disclosed 2 12 14 86% 0.5%
Grand Total 792 2220 3012 74% 100% 412 634 1046 61% 100%
Demographics FAIL PASS TOTAL %PASS % of pop FAIL PASS TOTAL %PASS % of pop
Black (incl African, Coloured, Indian) 632 1241 1873 66% 62.2% 343 495 838 59% 53.9%
White & Demographic not disclosed 160 979 1139 86% 37.8% 69 139 208 67% 13.4%
Grand Total 792 2220 3012 74% 100% 412 634 1046 61% 67%
Total Total
Demographics FAIL PASS TOTAL %PASS % of pop FAIL PASS TOTAL %PASS % of pop
African 348 673 1021 66% 38.8% 183 262 445 59% 48.7%
Coloured 51 125 176 71% 6.7% 24 54 78 69% 8.5%
Indian 120 275 395 70% 15.0% 63 107 170 63% 18.6%
White 153 855 1008 85% 38.3% 57 157 214 73% 23.4%
Demographic not disclosed 7 26 33 79% 1.3% 3 3 6 50% 0.7%
Grand Total 679 1954 2633 74% 100% 330 583 913 64% 100%
Demographics FAIL PASS TOTAL %PASS % of pop FAIL PASS TOTAL %PASS % of pop
Black (incl African, Coloured, Indian) 519 1073 1592 67% 60.5% 270 423 693 61% 75.9%
White & Demographic not disclosed 160 881 1041 85% 39.5% 60 160 220 73% 24.1%
Grand Total 679 1954 2633 74% 100% 330 583 913 64% 100%
Total Total
Demographics FAIL PASS TOTAL %PASS % of pop FAIL PASS TOTAL %PASS % of pop
African 320 621 941 66% 36.7% 250 116 366 32% 50.6%
Coloured 42 110 152 72% 5.9% 39 12 51 24% 7.0%
Indian 124 271 395 69% 15.4% 108 49 157 31% 21.7%
White 131 937 1068 88% 41.7% 80 67 147 46% 20.3%
Demographic not disclosed 1 4 5 80% 0.2% 3 0 3 0% 0.4%
Grand Total 618 1943 2561 76% 100% 480 244 724 34% 100%
Demographics FAIL PASS TOTAL %PASS % of pop FAIL PASS TOTAL %PASS % of pop
Black (incl African, Coloured, Indian) 486 1002 1488 67% 58.1% 397 177 574 31% 79.3%
White & Demographic not disclosed 132 941 1073 88% 41.9% 83 67 150 45% 20.7%
Grand Total 618 1943 2561 76% 100% 480 244 724 34% 100%
Page 14
Jan-16 Jun-16
Nov-20
By demographics (all candidates)
Jun-19
Jan-20
Jan-17
SAICA - INITIAL TEST OF COMPETENCE: April 2021
Jun-17
Jan-19
Jan-18 Jun-18
Apr-21
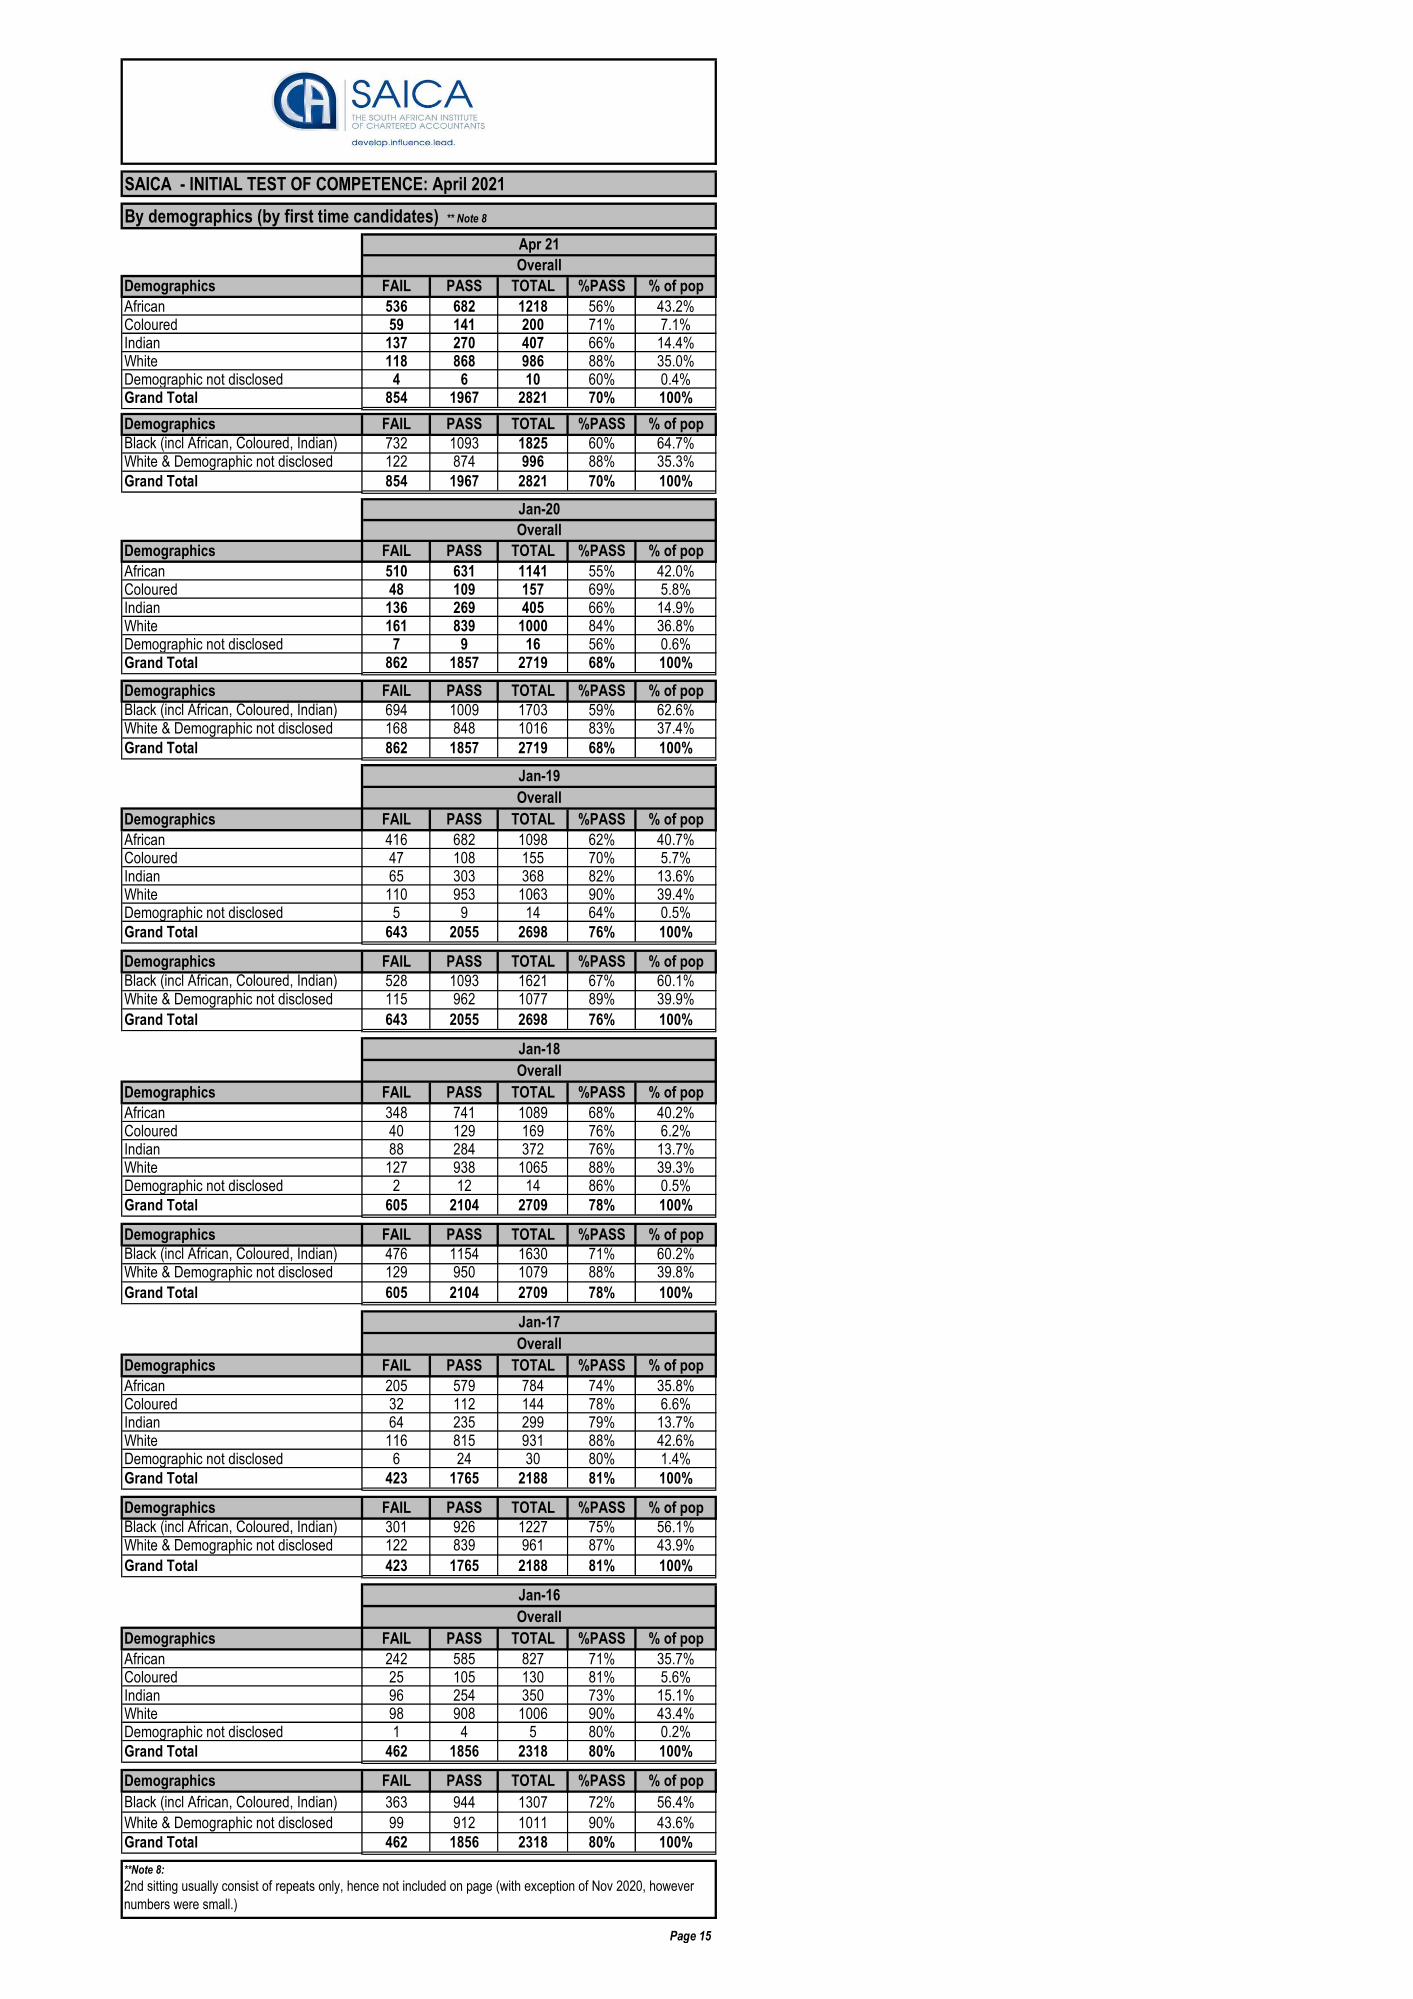
Demographics FAIL PASS TOTAL %PASS % of pop
African 536 682 1218 56% 43.2%Coloured 59 141 200 71% 7.1%Indian 137 270 407 66% 14.4%White 118 868 986 88% 35.0%Demographic not disclosed 4 6 10 60% 0.4%Grand Total 854 1967 2821 70% 100%
Demographics FAIL PASS TOTAL %PASS % of pop
Black (incl African, Coloured, Indian) 732 1093 1825 60% 64.7%White & Demographic not disclosed 122 874 996 88% 35.3%
Grand Total 854 1967 2821 70% 100%
Demographics FAIL PASS TOTAL %PASS % of pop
African 510 631 1141 55% 42.0%Coloured 48 109 157 69% 5.8%Indian 136 269 405 66% 14.9%White 161 839 1000 84% 36.8%Demographic not disclosed 7 9 16 56% 0.6%Grand Total 862 1857 2719 68% 100%
Demographics FAIL PASS TOTAL %PASS % of pop
Black (incl African, Coloured, Indian) 694 1009 1703 59% 62.6%White & Demographic not disclosed 168 848 1016 83% 37.4%
Grand Total 862 1857 2719 68% 100%
Demographics FAIL PASS TOTAL %PASS % of pop
African 416 682 1098 62% 40.7%Coloured 47 108 155 70% 5.7%Indian 65 303 368 82% 13.6%White 110 953 1063 90% 39.4%Demographic not disclosed 5 9 14 64% 0.5%
Grand Total 643 2055 2698 76% 100%
Demographics FAIL PASS TOTAL %PASS % of pop
Black (incl African, Coloured, Indian) 528 1093 1621 67% 60.1%White & Demographic not disclosed 115 962 1077 89% 39.9%
Grand Total 643 2055 2698 76% 100%
Demographics FAIL PASS TOTAL %PASS % of pop
African 348 741 1089 68% 40.2%Coloured 40 129 169 76% 6.2%Indian 88 284 372 76% 13.7%White 127 938 1065 88% 39.3%Demographic not disclosed 2 12 14 86% 0.5%
Grand Total 605 2104 2709 78% 100%
Demographics FAIL PASS TOTAL %PASS % of pop
Black (incl African, Coloured, Indian) 476 1154 1630 71% 60.2%White & Demographic not disclosed 129 950 1079 88% 39.8%
Grand Total 605 2104 2709 78% 100%
Demographics FAIL PASS TOTAL %PASS % of pop
African 205 579 784 74% 35.8%Coloured 32 112 144 78% 6.6%Indian 64 235 299 79% 13.7%White 116 815 931 88% 42.6%Demographic not disclosed 6 24 30 80% 1.4%
Grand Total 423 1765 2188 81% 100%
Demographics FAIL PASS TOTAL %PASS % of pop
Black (incl African, Coloured, Indian) 301 926 1227 75% 56.1%White & Demographic not disclosed 122 839 961 87% 43.9%
Grand Total 423 1765 2188 81% 100%
Demographics FAIL PASS TOTAL %PASS % of pop
African 242 585 827 71% 35.7%Coloured 25 105 130 81% 5.6%Indian 96 254 350 73% 15.1%White 98 908 1006 90% 43.4%Demographic not disclosed 1 4 5 80% 0.2%
Grand Total 462 1856 2318 80% 100%
Demographics FAIL PASS TOTAL %PASS % of pop
Black (incl African, Coloured, Indian) 363 944 1307 72% 56.4%
White & Demographic not disclosed 99 912 1011 90% 43.6%
Grand Total 462 1856 2318 80% 100%
Page 15
2nd sitting usually consist of repeats only, hence not included on page (with exception of Nov 2020, however
numbers were small.)
Overall
Jan-19
Overall
Jan-20
Overall
**Note 8:
SAICA - INITIAL TEST OF COMPETENCE: April 2021
By demographics (by first time candidates) ** Note 8
Jan-16
Jan-17
Overall
Jan-18
Overall
Apr 21
Overall
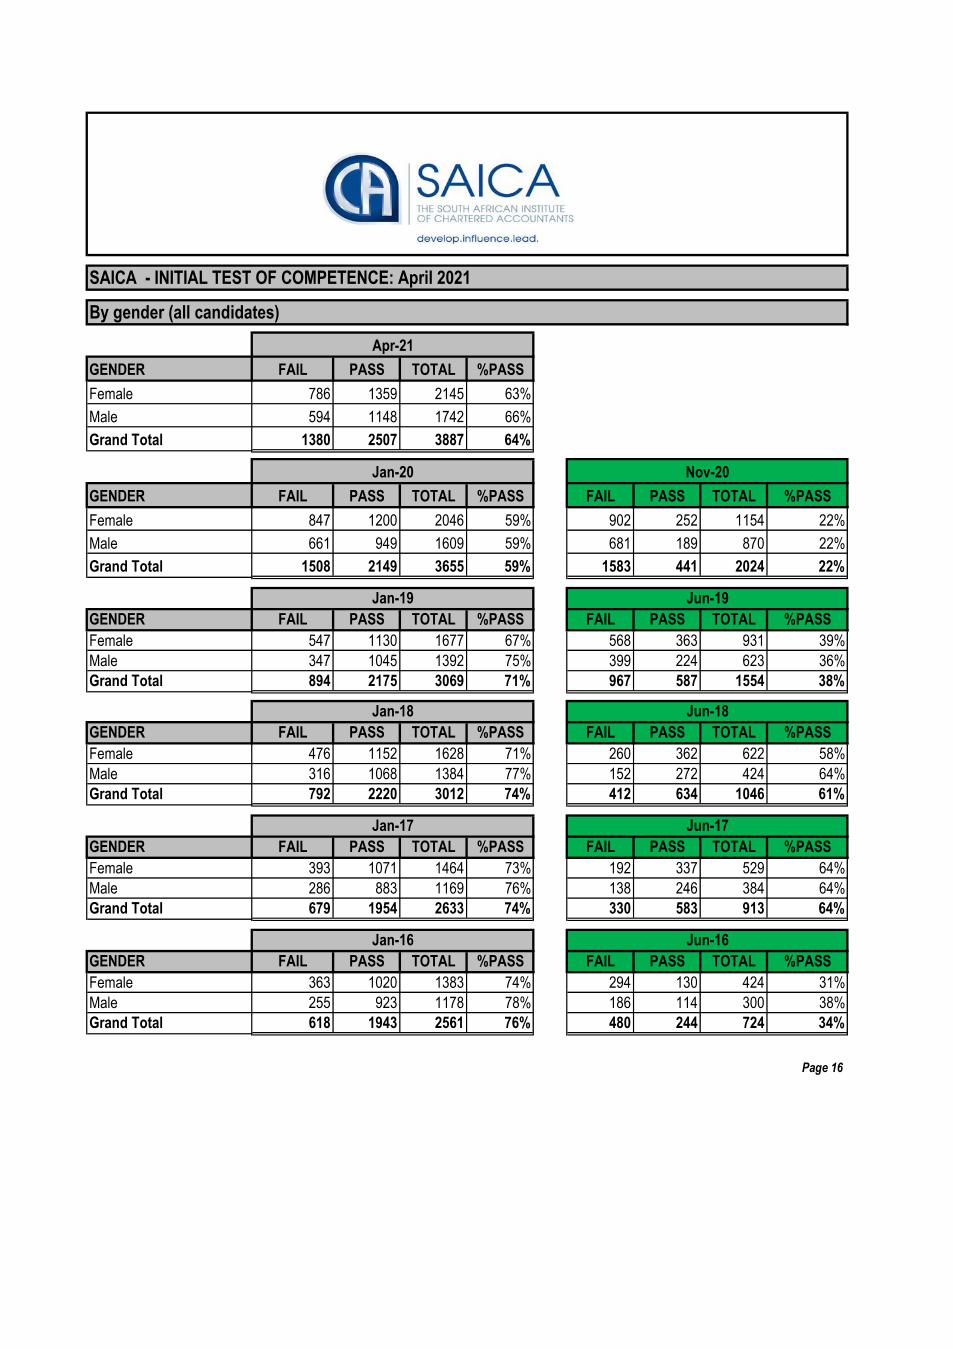
SAICA - INITIAL TEST OF COMPETENCE: April 2021
By gender (all candidates)
GENDER FAIL PASS TOTAL %PASS
Female 786 1359 2145 63%
Male 594 1148 1742 66%
Grand Total 1380 2507 3887 64%
GENDER FAIL PASS TOTAL %PASS FAIL PASS TOTAL %PASS
Female 847 1200 2046 59% 902 252 1154 22%
Male 661 949 1609 59% 681 189 870 22%
Grand Total 1508 2149 3655 59% 1583 441 2024 22%
GENDER FAIL PASS TOTAL %PASS FAIL PASS TOTAL %PASS
Female 547 1130 1677 67% 568 363 931 39%
Male 347 1045 1392 75% 399 224 623 36%
Grand Total 894 2175 3069 71% 967 587 1554 38%
GENDER FAIL PASS TOTAL %PASS FAIL PASS TOTAL %PASS
Female 476 1152 1628 71% 260 362 622 58%
Male 316 1068 1384 77% 152 272 424 64%
Grand Total 792 2220 3012 74% 412 634 1046 61%
GENDER FAIL PASS TOTAL %PASS FAIL PASS TOTAL %PASS
Female 393 1071 1464 73% 192 337 529 64%
Male 286 883 1169 76% 138 246 384 64%
Grand Total 679 1954 2633 74% 330 583 913 64%
GENDER FAIL PASS TOTAL %PASS FAIL PASS TOTAL %PASS
Female 363 1020 1383 74% 294 130 424 31%
Male 255 923 1178 78% 186 114 300 38%
Grand Total 618 1943 2561 76% 480 244 724 34%
Page 16
Jun-19
Jan-17 Jun-17
Jan-16 Jun-16
Jan-18 Jun-18
Jan-19
Jan-20 Nov-20
Apr-21
SAICA - INITIAL TEST OF COMPETENCE: April 2021
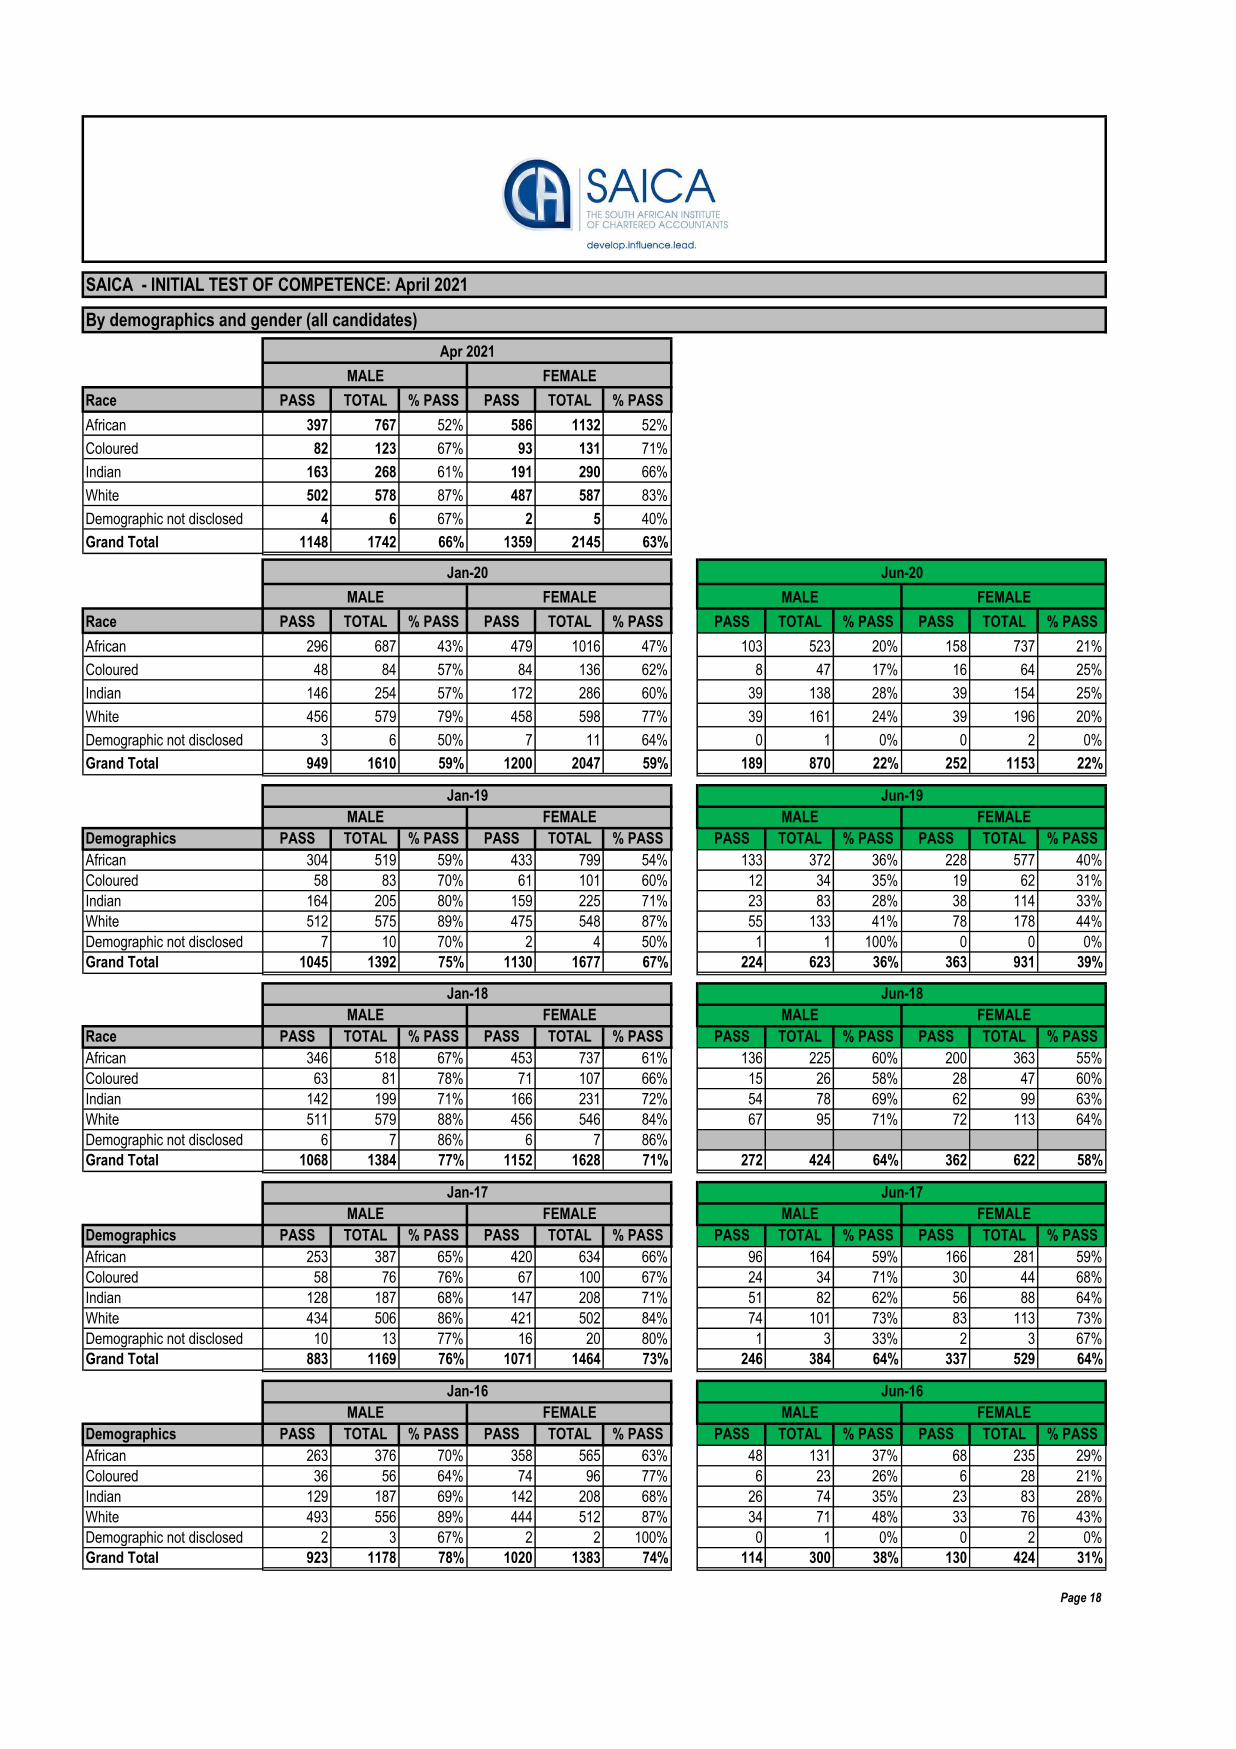
By demographics and gender (all candidates)
MALE FEMALE
Race PASS TOTAL % PASS PASS TOTAL % PASS
African 397 767 52% 586 1132 52%
Coloured 82 123 67% 93 131 71%
Indian 163 268 61% 191 290 66%
White 502 578 87% 487 587 83%
Demographic not disclosed 4 6 67% 2 5 40%
Grand Total 1148 1742 66% 1359 2145 63%
MALE FEMALE MALE FEMALE
Race PASS TOTAL % PASS PASS TOTAL % PASS PASS TOTAL % PASS PASS TOTAL % PASS
African 296 687 43% 479 1016 47% 103 523 20% 158 737 21%
Coloured 48 84 57% 84 136 62% 8 47 17% 16 64 25%
Indian 146 254 57% 172 286 60% 39 138 28% 39 154 25%
White 456 579 79% 458 598 77% 39 161 24% 39 196 20%
Demographic not disclosed 3 6 50% 7 11 64% 0 1 0% 0 2 0%
Grand Total 949 1610 59% 1200 2047 59% 189 870 22% 252 1153 22%
MALE FEMALE MALE FEMALE
Demographics PASS TOTAL % PASS PASS TOTAL % PASS PASS TOTAL % PASS PASS TOTAL % PASS
African 304 519 59% 433 799 54% 133 372 36% 228 577 40%
Coloured 58 83 70% 61 101 60% 12 34 35% 19 62 31%
Indian 164 205 80% 159 225 71% 23 83 28% 38 114 33%
White 512 575 89% 475 548 87% 55 133 41% 78 178 44%
Demographic not disclosed 7 10 70% 2 4 50% 1 1 100% 0 0 0%
Grand Total 1045 1392 75% 1130 1677 67% 224 623 36% 363 931 39%
MALE FEMALE MALE FEMALE
Race PASS TOTAL % PASS PASS TOTAL % PASS PASS TOTAL % PASS PASS TOTAL % PASS
African 346 518 67% 453 737 61% 136 225 60% 200 363 55%
Coloured 63 81 78% 71 107 66% 15 26 58% 28 47 60%
Indian 142 199 71% 166 231 72% 54 78 69% 62 99 63%
White 511 579 88% 456 546 84% 67 95 71% 72 113 64%
Demographic not disclosed 6 7 86% 6 7 86%
Grand Total 1068 1384 77% 1152 1628 71% 272 424 64% 362 622 58%
MALE FEMALE MALE FEMALE
Demographics PASS TOTAL % PASS PASS TOTAL % PASS PASS TOTAL % PASS PASS TOTAL % PASS
African 253 387 65% 420 634 66% 96 164 59% 166 281 59%
Coloured 58 76 76% 67 100 67% 24 34 71% 30 44 68%
Indian 128 187 68% 147 208 71% 51 82 62% 56 88 64%
White 434 506 86% 421 502 84% 74 101 73% 83 113 73%
Demographic not disclosed 10 13 77% 16 20 80% 1 3 33% 2 3 67%
Grand Total 883 1169 76% 1071 1464 73% 246 384 64% 337 529 64%
MALE FEMALE MALE FEMALE
Demographics PASS TOTAL % PASS PASS TOTAL % PASS PASS TOTAL % PASS PASS TOTAL % PASS
African 263 376 70% 358 565 63% 48 131 37% 68 235 29%
Coloured 36 56 64% 74 96 77% 6 23 26% 6 28 21%
Indian 129 187 69% 142 208 68% 26 74 35% 23 83 28%
White 493 556 89% 444 512 87% 34 71 48% 33 76 43%
Demographic not disclosed 2 3 67% 2 2 100% 0 1 0% 0 2 0%
Grand Total 923 1178 78% 1020 1383 74% 114 300 38% 130 424 31%
Page 18
Jun-19
Jan-20 Jun-20
Apr 2021
Jan-19
Jan-17 Jun-17
Jan-16 Jun-16
Jan-18 Jun-18


![2017 Budget SAICA Summary and Commentary FINAL [8]2017 BUDGET SAICA TAX COMMENTARY AND SUMMARY . Page 2 of 30 ... Furthermore, it is proposed that in 2018 VAT be introduced on fuel](https://static.fdocuments.us/doc/165x107/5e87e108eaf854508d79f482/2017-budget-saica-summary-and-commentary-final-8-2017-budget-saica-tax-commentary.jpg)