SAGE−SMC: Surveying the Agents of Galaxy Evolution in the ...sage.stsci.edu/SAGE_SMC.pdf ·...
22
SAGE-SMC: Surveying the Agents of Galaxy Evolution in the Tidally- Disrupted, Low-Metallicity Small Magellanic Cloud Spitzer Space Telescope Legacy Science Proposal #40245. Principal Investigator: Karl D Gordon Institution: University of Arizona Electronic mail: [email protected] Technical Contact: Karl D Gordon, University of Arizona Co-Investigators: Margaret Meixner (ES, SF, ISM, archive), STScI Robert Blum (ES), NOAO William Reach (ISM, SF, IRAC), IPAC/Caltech Barbara Whitney (SF, IRAC), Space Science Institute Jason Harris (SF), U. of Arizona Remy Indebetouw (SF, ISM, IRAC), U. of Virginia Alberto Bolatto (SF, ISM), U. of California-Berkeley Jean-Philippe Bernard (ISM, SF), Centre d’Etude Spatiale des Rayonnements Marta Sewilo (SF), U. of Wisconsin, Madison Brian Babler (IRAC), U. of Wisconsin-Madison Miwa Block (MIPS), U. of Arizona Caroline Bot (ISM, SF), Caltech/IPAC Steve Bracker (IRAC, SF), Univ. of Wisconsin-Madison Lynn Carlson (SF), Johns Hopkins Ed Churchwell (SF, IRAC), U. of Wisconsin-Madison Geoffrey Clayton (ISM, ES), Louisiana State University Martin Cohen (ISM, ES, Cal), UC Berkeley/RAL Charles Engelbracht (ISM, SF, MIPS), U. of Arizona Yasuo Fukui (ISM, SF), Nagoya University Varoujan Gorjian (SF), JPL/Caltech Sacha Hony (ISM, SF), CEA Saclay Joseph Hora (SF, ISM, IRAC), Harvard-Smithsonian CFA Frank Israel (ISM, SF), Leiden University
Transcript of SAGE−SMC: Surveying the Agents of Galaxy Evolution in the ...sage.stsci.edu/SAGE_SMC.pdf ·...

SAGE−SMC: Surveying the Agents of Galaxy Evolution in the Tidally−Disrupted, Low−Metallicity Small Magellanic Cloud
Spitzer Space Telescope Legacy Science Proposal #40245.
Principal Investigator: Karl D Gordon
Institution: University of Arizona
Electronic mail: [email protected]
Technical Contact: Karl D Gordon, University of Arizona
Co−Investigators: Margaret Meixner (ES, SF, ISM, archive), STScI
Robert Blum (ES), NOAO
William Reach (ISM, SF, IRAC), IPAC/Caltech
Barbara Whitney (SF, IRAC), Space Science Institute
Jason Harris (SF), U. of Arizona
Remy Indebetouw (SF, ISM, IRAC), U. of Virginia
Alberto Bolatto (SF, ISM), U. of California−Berkeley
Jean−Philippe Bernard (ISM, SF), Centre d’Etude Spatiale desRayonnements
Marta Sewilo (SF), U. of Wisconsin, Madison
Brian Babler (IRAC), U. of Wisconsin−Madison
Miwa Block (MIPS), U. of Arizona
Caroline Bot (ISM, SF), Caltech/IPAC
Steve Bracker (IRAC, SF), Univ. of Wisconsin−Madison
Lynn Carlson (SF), Johns Hopkins
Ed Churchwell (SF, IRAC), U. of Wisconsin−Madison
Geoffrey Clayton (ISM, ES), Louisiana State University
Martin Cohen (ISM, ES, Cal), UC Berkeley/RAL
Charles Engelbracht (ISM, SF, MIPS), U. of Arizona
Yasuo Fukui (ISM, SF), Nagoya University
Varoujan Gorjian (SF), JPL/Caltech
Sacha Hony (ISM, SF), CEA Saclay
Joseph Hora (SF, ISM, IRAC), Harvard−Smithsonian CFA
Frank Israel (ISM, SF), Leiden University

Akiko Kawamura (SF, ISM), Nagoya University
Adam Leroy (ISM, SF), MPIA
Aigen Li (ISM, SF, ES), Univ. of Missouri−Columbia
Suzanne Madden (ISM, SF), CEA Saclay
Ciska Markwick−Kemper (ES), U. of Manchester
Marilyn Meade (IRAC), U. of Wisconsin−Madison
Karl Misselt (ISM, SF, MIPS), U. of Arizona
Akira Mizuno (ISM, SF), Nagoya University
Norikazu Mizuno (ISM, SF), Nagoya University
Erik Muller (ISM, SF), CSIRO
Joana Oliveira (SF), U. of Keele
Knut Olsen (ES), CTIO/NOAO
Toshikazu Onishi (SF, ISM), Nagoya University
Roberta Paladini (SF, ISM), Caltech/IPAC
Sean Points (ES, ISM), CTIO/NOAO
Thomas Robitaille (SF), University of St Andrew
Douglas Rubin (ISM), Wesleyan University
Karin Sandstrom (ISM, SF), U. of California, Berkeley
Shuji Sato (SF), Nagoya University
Hiroshi Shibai (ISM, SF), Nagoya University
Josh Simon (SF, ISM), Caltech
Linda Smith (ISM, SF, ES), STScI/ESA
Sundar Srinivasan (ES), Johns Hopkins/STScI
Xander Tielens (ISM, SF, ES), NASA Ames
Uma Vijh (ISM, SF, ES, archive), STScI
Schuyler Van Dyk (ES, ISM), IPAC/Caltech
Jacco Van Loon (ISM, SF, ES), U. of Keele
Kevin Volk (ES), Gemini
Dennis Zaritsky (SF), U. of Arizona
Science Category:Extragalactic: local group galaxies
Observing Modes: IRAC Mapping, MIPS Scan Map
Hours Requested:317.1
Proprietary Period(days): 0
Abstract:The observable properties of galaxy evolution are largely driven by the life−cycle of baryonicmatter: stars precipitate out of a complex, multi−phase interstellar medium; and eventually, evolvedstellar populations return enriched material back to the ISM via stellar winds or supernovaexplosions. As demonstrated by the SAGE−LMC survey, comprehensive Spitzer imaging of anearby galaxy provides an incredibly rich view of this baryonic lifecycle, allowing for anunprecedented understanding of the physical processes which drive galaxy evolution. Thisproposal will extend the SAGE analysis to the whole SMC (Bar, Wing, and high−density portion ofthe Magellanic Bridge), a galaxy whose properties are uniquely similar to those of star−forminggalaxies at high redshift. Specifically, the SMC’s metallicity is below the critical threshold (1/3−1/4 Z_sun) where interstellar medium properties are observed to change dramatically (sharpreduction in the PAH dust mass fraction, reduced dust−to−gas ratio, and extreme ultravioletextinction curve variations). In addition, the SMC has been profoundly influenced by pastinteractions with the LMC and Milky Way, allowing us to study the impact of periodic interactionson the structure of the ISM and the physical processes of star formation. We will gain crucialinsight into the ISM and star formation in a known tidal debris structure (Bridge portion of SMC),which has a metallicity 4 times lower than the rest of the SMC. When combined with observationsof the Milky Way (GLIMPSE, MIPSGAL) and the LMC (SAGE−LMC), our survey of the SMC(SAGE−SMC) will provide a complete and detailed picture of the life−cycle of baryons in galacticenvironments spanning orders of magnitude in metallicity, and wide ranges in star formationhistory. This understanding will equip us to properly interpret the infrared properties of moredistant galaxies, both in the local (e.g., SINGS) and high−redshift (e.g., GOODS and SWIRE)universe.
SAGE-SMC, K. D. Gordon et al. 1
1 Scientific Justification
The interstellar medium (ISM) plays a central role in the galaxy evolution as the birthsite ofnew stars and repository of old stellar ejecta. The formation of new stars slowly consumesthe ISM, locking it up for millions to billions of years. As these stars age, the winds fromlow mass, asymptotic giant branch (AGB) stars and high mass, red supergiants (RSGs),and supernova explosions inject nucleosynthetic products of stellar interiors into the ISM,slowly increasing its metallicity. This constant recycling and associated enrichment drives theevolution of a galaxy’s visible matter and changes its emission characteristics. To understandthis recycling, we have to study the physical processes of the ISM, the formation of new stars,and the injection of mass by evolved stars, and their relationships on a galaxy-wide scale.
Among the nearby galaxies, the Small Magellanic Cloud (SMC) represents a uniqueastrophysical laboratory for studies of the lifecycle of the ISM, because of its proximity(∼60 kpc, Hilditch et al. 2005), low ISM metallicity (1/5-1/20 Z⊙; Russell & Dopita 1992;Rolleston et al. 1999) and tidally-disrupted interaction status (Zaritsky & Harris 2004). TheSMC offers a rare glimpse into the physical processes in an environment with a metallicitywhich is below the threshold of 1/4–1/3 Z⊙ where the properties of the ISM in galaxieschanges significantly as traced by the rapid reduction in the PAH dust mass fractions anddust-to-gas ratios (Engelbracht et al. 2005; Draine et al. 2007). In addition, the SMC is theonly local galaxy which has the ultraviolet dust characteristics (lack of 2175 A extinctionbump; Gordon et al. 2003) of starburst galaxies in the local (Calzetti et al. 1994; Gordonet al. 1997) and high-redshift (2 < z < 4; Vijh et al. 2003) universe. The evolution ofstars in the SMC is also clearly affected by the low metallicities (Cioni et al. 2006) withthe corresponding expected differences in stellar mass loss. The Large and Small Magellanicclouds represent the nearest example of tidally interacting galaxies and the Magellanic Bridgeis a clear manifestation of a close encounter of these two galaxies some 200 Myr ago (Zartisky& Harris 2004). Over cosmological timescales, galaxy interactions are one of the key drivers ofgalaxy evolution and, thus, tidally interacting galaxies allow us to examine star formation inan unusual and disturbed environment, which resembles the conditions in the early universewhen galaxies were forming. The Magellanic Bridge is a filament of neutral hydrogen, whichjoins the SMC and LMC over some 15 kpc (Staveley-Smith et al. 1998; Muller et al. 2004).Recent studies have revealed the presence of locally formed, young (<200 Myrs) massivestars associated with the highest-density portion of the Bridge which is adjacent to the mainSMC body (Harris 2007). Finally, the Magellanic bridge is characterized by a much lowermetallicity than the main SMC body (1/20 instead of 1/5 Z⊙) which provides an even moreextreme star formation environment than the main SMC body.
We propose to survey the full SMC (33 ⊓⊔◦) and the star forming portion of the Magellanic
bridge using IRAC and MIPS. The multiwavelength appearance of the SMC (Fig. 1) clearlyshows this galaxy is made of three main components: the Bar, Wing, and high-densityportion of the Magellanic Bridge. The proposed observations will allow us to trace the lifecycle of dust (and thereby gas) on a galaxy wide scale from their injection by late-typestars, through their sojourn in the violent ISM, until their demise during the process ofstar formation. In addition, the IR emission will trace the global structure of the ISMon a galaxy-wide scale and allow us to trace the interrelationship of the various phases ofthe ISM. This survey will provide a complete census of the star formation population inthis low and spatially varying metallicity environment. Full and uniform coverage of theSMC is necessary to understand the galaxy as a complete system, to develop a template

SAGE-SMC, K. D. Gordon et al. 2
for more distant galaxies, and to create an archival data set that promises a lasting legacyto match SMC surveys at other wavelengths. With much improved wavelength coverage,up to ∼1000 times better point source sensitivity and ∼11 times better angular resolutionthan the MSX and IRAS surveys (Fig. 2) and >10X spatial coverage than the S3MC Spitzermini-survey (Bolatto et al. 2007), SAGE-SMC will reveal over 3 million sources including8,000 mass-losing evolved stars and 3,000 young stellar objects (YSOs). The S3MC mini-survey was mainly concerned with the characterizing SMC low metallicity star formationand was limited to cover only the Bar and a portion of the Wing which represent ∼10% ofthe whole SMC. As a result, the S3MC cannot address the science goals which are at thecore of this proposal: the lifecycle of interstellar dust, the global structure of the ISM, andthe characteristics of tidally driven star formation.
Combining the results from this proposed SMC survey with the existing LMC (SAGE-LMC, Meixner et al. 2006) and Milky Way (GLIMPSE, Benjamin et al. 2003; MIPSGAL,Casey et al. 2005) surveys will provide a foundation for understanding the physics of theISM, current star formation, and evolved stellar mass loss as a function of metallicity. Thisfoundation is crucial for interpreting the observations of more distant galaxies like those inthe SINGS (Kennicutt et al. 2003), SWIRE (Lonsdale et al. 2003), and GOODS (Dickinsonet al. 2003) Spitzer Legacy programs. Without the SAGE-SMC survey, there would be amissing link in our understanding of galaxies at the low metallicity, less chemically evolvedstage. Our imaging survey is a base for future work in the SMC with SOFIA, Herschel, theJames Webb Space Telescope (JWST), and the Atacama Large Millimeter Array.
Interstellar MediumThe SMC presents a distinct mix of ISM components different from that found in the MW
and LMC. For example, the molecular phase in the MW dominates the inner disk and atomicgas dominates elsewhere, while the diffuse ISM only has ∼15% of the gas mass. In contrast,in the SMC, the ionized ISM dominates, then the atomic gas and, finally, the molecularISM which is relatively confined and lower mass (Leroy et al. 2007). The differences seenin the SMC are likely related to its low metallicity which varies from ∼1/5 Z⊙ (Bar/Wing,Russell & Dopita 1992) to ∼1/20 Z⊙ (Bridge, Rolleston et al. 1999). Observations with ISO(Madden et al. 2006) and Spitzer (Engelbracht et al. 2005) have revealed that the ISM inlow-metallicity environments has weak/absent PAH emission. The absence of PAHs has aprofound influence on the gas heating and the existence of cold/warm phases in the ISM(Wolfire et al. 1995). In particular, variations in the small grain properties, as traced byPAH emission, are of fundamental importance to the ISM thermodynamics since these grainsare efficient in heating the gas through the photoelectric effect (Bakes & Tielens 1994). Thebasic question that will be answered by the SAGE-SMC survey is:How do the dust properties vary across the SMC and what do they tell us aboutthe physics of ISM processing?
Previous observations in the SMC have shown large variations in dust properties: dustin the Bar has very weak aromatic features and has UV extinction with a steep UV rise andno 2175 A bump, while the dust in the Wing shows MW-like UV extinction and aromaticfeatures (Gordon et al. 2003; Li & Draine 2002; Bolatto et al. 2006). Additionally, the gas-to-dust ratio has been seen to vary spatially across the SMC by a factor of a few (Bot etal. 2004, Leroy et al. 2007). Using the average SMC Bar extinction curve, Galliano et al.(2007) found that the proportion of carbonaceous:silicaceous grains is 0.02:0.98 in the SMC,whereas it is 0.14:0.86 in the LMC and 0.36:0.64 in the MW, quantifying how silicate rich thedust in the SMC is compared to the LMC and MW. The Galliano et al. result only applies

SAGE-SMC, K. D. Gordon et al. 3
to the Bar region; Li & Draine (2002) find large variations in the dust grain properties inthe SMC. The existing UV and IR data are so limited that we really only know that thedust in the SMC shows very large variations. Understanding how the dust varies in detailacross the SMC is crucial to increasing our understanding of dust in general and for galaxyevolution and star formation as SMC dust is often used as a template for dust in starburstand high-redshift galaxies (Pei et al. 1999). By mapping the entire SMC we measure thespatial variations of dust grain compositions and abundances which will be influenced by thedusty stellar winds of evolved stars and the destructive forces of massive star formation.
The combination of SAGE-SMC with existing multi-wavelength data on the SMC willprobe the interrelationship between the different phases of the ISM and their relationship tostellar sources of UV radiation and kinetic energy. The Spitzer resolutions (even at 160 µmwhere the FWHM = 40” = 12 pc) are sufficient to separate the major components of theISM: HII regions, photodissociation regions, molecular clouds, atomic clouds and the diffusemedium. Recent results from the global SEDs of SINGS galaxies suggest that below ametallicity of 1/4 Z⊙, the dust-to-gas ratio deviates from that expected from the knownmetallicity variations (Draine et al. 2007). The far-infrared 70 & 160 µm observations willtrace the dust column density and, combined with the interferometric HI (Stanimirovic etal. 2004) and CO (Mizuno et al. 2001; 2006) observations, will measure the dust-to-gasvariations across the whole SMC.
Star FormationThe SMC offers a unique laboratory for studying tidally-driven galaxy evolution. It
has been more profoundly affected by recent interactions than the LMC, both in termsof its overall morphology and star formation history. Together with its low metallicity(1/5-1/20 Z⊙), this interaction-rich history makes it a valuable local environment in whichconditions approximating the epoch of galaxy assembly at high redshift can be studied indetail. The SAGE-SMC survey will be used to probe how the SMC-wide star formationvaries with environment both through resolved studies of IR SEDs of YSOs and unresolvedstudies utilizing the IR flux combined with multiwavelength tracers of the unobscured starformation. The basic question that will be answered by the SAGE-SMC survey is:How does the low metallicity and interaction-rich history of the SMC affect thestar formation process?
The SMC’s low metallicity influences its ISM properties in ways that impact on thephysics of star formation. The dust-to-gas ratio and molecular gas content are lower inthe SMC than in the LMC or MW, and the UV radiation field is more pervasive. Thesedifferences likely lead to substantially altered star formation efficiency rates, initial massfunctions, clustering properties of newly-formed stars, and size and timescales for feedbackand triggered star formation. Present day SMC star formation is concentrated in the Bar,Wing, and Bridge regions. Most of the Bar region and part of the Wing region was coveredby the Spitzer S3MC mini-survey (Bolatto et al. 2006). The Wing and Bridge regions probethe most extreme star formation conditions, more strongly affected by tidal interactions andat even lower metallicity and gas density than in the main body of the SMC.
Prominent shell structures in both Magellanic Clouds suggest that feedback plays animportant role in shaping the pattern of star formation (Zaritsky & Harris 2004, Hatzidim-itriou et al. 2005; Muller et al. 2003). Proper understanding of feedback timescales andmechanisms requires resolving HII regions and CO clouds in the IR at the few parsec scale.Of particular interest is to study the star formation in the low density environment of theBridge and how this affects the energy feedback into the ISM. Such an environment may be
SAGE-SMC, K. D. Gordon et al. 4
close to that expected at the highest redshifts. SMC star formation historically has beentraced via HII regions, but with the advent of HST and Spitzer systematic studies of YSOsare possible (Chu et al. 2005; Nota et al. 2006). Bolatto et al. (2007) found 280 high-massYSOs by using the Spitzer S3MC mini-survey of the inner 3⊓⊔◦ of the SMC. This is consistentwith the few thousand high reliability YSOs discovered in the SAGE-LMC data (Whitneyet al. 2007). Extrapolating the SAGE-LMC results to the whole SMC, we expect that theS3MC mini-survey missed at least 90% of the YSOs in the SMC (Fig. 2), and all of the YSOsin the most extreme conditions (very low metallicity and density, high tidal shear).
Stellar Mass LossHigh mass loss during the AGB and RSG phases leads to the formation of circumstellar
envelopes that are observable via their dust emission at 8 µm and longer. The SMC hassignificant metallicity and age variations in the evolved star population over its full field ofview (Harris & Zaritsky 2004; Cioni et al. 2006). Harris & Zaritsky and Cioni et al. findyounger and more metal rich evolved stars at large radii beyond the limits of the S3MCmini-survey. The proposed SAGE-SMC survey will be the first to systematically survey themass loss from these sources and will be sensitive to all mass losing evolved stars (mass-lossrates > 10−8 M⊙ yr−1) across the entire SMC (Fig. 2). The fundamental question in stellarmass loss that will be answered by the SAGE-SMC survey is:
How does stellar mass loss rate depend on stellar parameters: luminosity,effective temperature, period, composition (carbon- or oxygen-rich), metallicityand at what rate is dust injected into the ISM?
Stellar mass loss can drive the late stages of stellar evolution yet the mechanism for massloss remains poorly understood. The SAGE-SMC survey will allow us to quantify the massloss rates from the numerous lower luminosity AGB stars, the IR bright stars at the tip ofthe AGB (both C-rich and O-rich), the ”extreme” or obscured AGB stars with prodigiousmass-loss (Blum et al. 2006), and the rare RSGs. Present estimates disagree on the relativecontributions from these different stellar classes to the injected mass budget of a galaxy(Tielens 2001). Modeling of the evolved star SEDs measured in the SAGE-LMC survey hasbeen successful both using empirical methods (Srinivasan et al. 2006) and radiative transfercalculations (Volk et al. 2007). Our preliminary estimates from SAGE-LMC indicate thecurrent mass loss in the LMC is comprised of 24% from each of the optically visible C-richand O-rich groups, 14% from bright RSG stars, and 37% from extreme AGB stars with atotal dusty mass-loss return of about 0.7 × 10⁻² M⊙ yr−1. In the lower metallicity of theSMC, we expect to find more carbon stars and hence a different distribution of mass-losscontributions over the classes of objects (Costa & Frogel 1996). Our SMC map of calculatedmass loss rates will provide a basis for tying mass-loss-rate return to the parent stellarpopulation, its metallicity and its star formation history (e.g., Harris & Zaritsky 2004). TheSMC represents a crucial metallicity and the detailed evolved star work proposed here willprovide strong constraints on dust production in the early universe.
Our two epochs of photometry (see technical plan), separated by ∼3 months will beused in conjunction with variability databases (MACHO, OGLE) to probe the relationshipbetween mass-loss and stellar variability. For the first time, we will have photometric obser-vations of the variable stellar core and its associated mass-loss envelope for a large sample ofstars. Some 6,000 sources show strong variability in the SAGE-LMC data (Vijh et al. 2007),the majority of which will have MACHO or OGLE counterparts and hence light curves. TheSAGE-SMC data will represent the opportunity to statistically study the physics of stellarvariability and mass loss at low metallicities.

SAGE-SMC, K. D. Gordon et al. 5
2 Technical Plan
SAGE-SMC will be a uniform, unbiased survey of the whole SMC (33⊓⊔◦) including the Bar,Wing, and Bridge, in all the IRAC (3.6, 4.5, 5.8 & 8 µm) and MIPS (24, 70 & 160 µm) bands(Fig. 1). The angular resolutions of 2′′ (0.6 pc at the distance to the SMC) in the IRACbands, and 6′′ (1.7 pc), 18′′ (5.2 pc) and 40′′ (12 pc) in the MIPS bands will be 11 timesbetter than the angular resolution of the MSX and IRAS surveys. The science-driven pointsource sensitivity (3σ) of 5.1, 7.2, 41 and 44 µJy in the IRAC 3.6, 4.5, 5.8 & 8 µm bands,respectively, and 0.5, 30 and 275 mJy in the MIPS 24, 70 and 160 µm bands, respectively,will improve upon these previous surveys by a factor of ∼1000 and with better wavelengthcoverage (Fig. 2). The most efficient strategy is to map with 1.1◦×1.1◦ degree tiles of IRACHDR exposures, and MIPS fast scans with varying scan leg lengths (Fig. 1). To minimizeartifacts that limit sensitivity, we will map at two epochs, separated by ∼3 months, whichwill provide a ∼90◦ roll angle difference. This strategy has proven to be the most effectiveway of removing artifacts in the SAGE-LMC project and is recommended by the SSC, IRAC,and MIPS teams. These two epochs will be critical for measurements of source variabilityexpected for evolved stars and YSOs. The observing strategy is designed to maximize thescience return and observatory efficiency, while minimizing observing artifacts, and requires317 total hours (196 IRAC, 121 MIPS).
Observation DetailsFull and Uniform Coverage: The science of SAGE-SMC requires full and uniform cover-age. The coverage must extend to the IR edge of the SMC and beyond to provide adequatebackground in both scientific terms, to measure the background and Galactic foregroundsource populations, and in data reduction terms for the Ge:Ga MIPS arrays which requireoff-source background for accurate photometric measurements. Proper source identificationin the SMC needs to be done over the whole galaxy because the different types of IR sources,e.g. AGB stars and YSOs, have different spatial distributions in the SMC which can be usedto improve the source identification (e.g., Cioni et al. 2000). Our strategy for full coveragewill duplicate ∼8.5%(IRAC) and ∼11.2%(MIPS) of the SMC which is currently covered bythe S3MC mini-survey. Mapping strategies that carefully avoid these small regions withoutmany time constraints would significantly increase the total time requested and compromisethe data quality (for MIPS).Sensitivity, Column Density Limits & Source Count Estimates: SAGE-SMC willhave maximum scientific impact and longest duration as a legacy dataset only if the popu-lation of red objects is completely sampled down to the confusion limit imposed by Spitzer’sspatial resolution, and the diffuse emission at all spatial scales is mapped at high enoughsignal-to-noise ratio to determine physical conditions in PDRs, HII regions, and molecularclouds. Fig. 2 shows color-magnitude diagrams constructed from SAGE-LMC and S3MCdata that illustrate the sensitivity required to study the two populations of greatest interestin the IR, evolved stars and forming stars. IRAC [8.0] sensitivity of >15th magnitude allowsthe measurement of YSOs down to a few solar masses depending on their age, as youngerYSOs of a given mass are more luminous. This limit also ensures that all evolved stars withmass loss rates >10−8 M⊙ yr−1 will be detected. Color-magnitude diagrams constructedfrom other combinations of bands yield similar requirements, of ∼45s exposure time withIRAC and ∼50s with MIPS. With these integration times, the 5σ diffuse emission sensitivi-ties will be ∼0.1, 0.3, 2.5, & 4 MJy/sr at [8.0], [24], [70], and [160], respectively as measuredfrom the SAGE-LMC data. The SAGE-SMC at 70 & 160 µm sensitivities will be as good

SAGE-SMC, K. D. Gordon et al. 6
or better than in the S3MC mini-survey even given the shorter SAGE-SMC exposure timesbecause the SAGE-SMC observations are constructed to better handle the systematics suchas background subtraction and instrumental signature removal. From these diffuse emissionsensitivity limits in the MIPS and IRAC 8 µm bands, we estimate a minimum detectablecolumn density of ∼ 2.5 × 10²¹ H cm−2 (AV ∼ 0.4 mag) by assuming a solar neighborhoodSED for the diffuse dust emission (Desert, Boulanger & Puget 1990) and the SMC gas-to-dust ratio (Gordon et al. 2003). The IRAC 3.6 and 4.5 µm bands will also detect this samecolumn density when their angular resolution is degraded to the 160 µm band. For thestudy of the diffuse ISM, we will work with residual images, i.e. ones with the point sourcessubtracted, that we will smooth to improve the signal-to-noise ratio.
Our work with point source extraction of sources in the SAGE-LMC survey demonstratesthat we will be near background limited even in the most confused regions of the Bar.We estimate the total number of sources detectable in our survey to be ∼3 million byextrapolating the number SAGE-LMC detected sources, which were detected in at least 2IRAC bands, to the SAGE-SMC survey by accounting for the different survey areas andgalaxy distances. The ∼8,000 evolved stars estimate followed a similar approach by scalingdown the SAGE-LMC evolved star numbers by a factor of 5, which is the ratio of theLMC/SMC V-band fluxes, a tracer of the total stellar population. The ∼3,000 YSOs andHII regions estimate was determine in a similar manner.Mapping Strategy: The mapping strategy maximizes observing efficiency while minimiz-ing artifacts that compromise data quality that will limit the science. The IRAC and MIPSartifacts fall in two classes: random effects (e.g. cosmic rays, bad pixels) and systematiceffects that are tied to pixel location and usually systematically effect rows/columns. IRACsystematic effects include: saturation latents, scattered light, MUX bleed, banding, and col-umn pulldown. MIPS systematic effects include: streaking due to saturation latents andtime dependent responsivity drifts [70 & 160 µm]) and insufficient 160 µm coverage in fastscan mode. Clean removal of random effects requires at least 4 overlapping measurements.Systematic effects are optimally removed by combining images taken with a ∼90 degree rollangle difference which is achieved with two epochs of observations separated by ∼3 months.This strategy is recommended by the SSC and the IRAC and MIPS instrument teams andhas been proven to be very successful in the SAGE-LMC data analysis (Meixner et al. 2006).
To achieve the above goals, four 12s HDR IRAC frames taken in pairs at two differentepochs are planned for a total frame time per pixel of 48s. For IRAC, the maximum tilesize is 1.1◦ × 1.1◦ with half-array steps. Steps are done instead of dithers to minimize thetime required to cover the desired area. Each IRAC AOR consists of a 14x28 map of 12sHDR frames, with a duration of 2.97h. The SMC is mapped with 33 of these AORs, taking98h per epoch, for a total of 196h. Each MIPS AOR consists of 8-16 fast scan legs that are2◦–5◦ long with 1/2 array cross scan steps, with durations 2.79–2.95 hours. The SMC will beobserved with an optimized grid of these AORs (Fig. 1), taking 57.5 hours per epoch, for atotal 115 hours. Tight sequential constraints relative to the roll angle rate of change will beinvoked so that neighboring long strips have sufficient overlap. We have carefully designedour MIPS strategy to ensure off-source measurements in every scan leg which will allow foraccurate self-calibration of the instrumental effects. While MIPS fast scan mode does notachieve full coverage at 160 µm, the SAGE-LMC observations have shown that the use ofthe two sets of observations with one set rotated ∼90◦ from the other produces a very nicefilled 160 µm map (Meixner et al. 2006). The exposure times per pixel are 60s, 30s, and∼9s at 24, 70, and 160 µm, respectively.
SAGE-SMC, K. D. Gordon et al. 7
Previous Spitzer ObservationsLess than 10% of the SMC has been mapped with IRAC/MIPS in the Spitzer S3MC
program (Bolatto et al. 2006). This program concentrated on the IR bright regions mapping∼2.8 deg2 with IRAC and ∼3.7 deg2 with MIPS. The region mapped by S3MC in bothIRAC and MIPS is shown in Fig. 1. While the S3MC observations are somewhat deeperthan our proposed observations, it is clear from Fig. 2 that the SAGE-SMC depth will enableuse to carry out our proposed science over the whole SMC. Since the S3MC observationsconcentrated on the bright regions of the Bar and Wing, they are missing a large fraction ofthe SMC include the lower density and metallicity outer regions. Besides the need for fullcoverage of the SMC to ensure we have a complete picture of the evolution of this unique low-metallicity, tidally-disrupted galaxy, the biased nature of the S3MC coverage also severelylimits our understanding in all three SAGE-SMC science areas. For ISM studies, a key pointis that over 1/2 of the HI emission comes from regions outside the S3MC coverage where theISM is known to be more dust poor and at lower metallicity. For star formation work, oneof the most extreme star formation environments in the Local Group is found in the Bridgeregion where very low metallicity, tidally triggered star formation exists. Finally, for stellarmass loss studies the concentration of the S3MC survey on just the current star formation isa strong bias to our understanding of the mass loss from the much more smoothly distributedevolved stars. For example, Fig. 2 shows a paucity of evolved extreme AGB stars in theS3MC sample in comparison to the SAGE-LMC sample. This is either an intriguing discoveryor simply due to a selection effect of the S3MC’s coverage. Thus it is critical to image theentire SMC in order to capture the entire census of its dusty objects.
In addition to a biased and incomplete coverage of the S3MC mini-survey, the IRACand (especially) MIPS data reduction presented challenges due to lack of background mea-surements. For example, reduction of MIPS observations greatly benefits from backgroundmeasurements in every scan leg to help measure and remove the zodiacal background (24 µm),cirrus background (70 & 160 µm) and instrumental residuals (streaking along scan mirrordirection; 70 & 160 µm). The strategy used by the SAGE-LMC survey with long scan legsto achieve background measurements on every scan leg has clearly been shown to allow formuch better reductions of the MIPS observations. We have reduced the S3MC MIPS datawith the SAGE-LMC pipeline, but were unable to achieve anywhere near the improvementsdemonstrated in the SAGE-LMC data. Only new observations will enable us to achieve thesame MIPS 70 & 160 µm sensitivities in the SMC that have been achieved in the LMC.
By mapping the entire SMC we will not only be able to study the entire SMC, but wewill also be able to improve the reductions of the existing S3MC data. The new IRACdata will allow for an accurate correction for the somewhat variable background level in theIRAC bands. The new MIPS data will provide the the baseline needed to derive correctionsfor the zodiacal light, cirrus background, and instrumental streaking present in the S3MC.Combining this newly corrected S3MC data with the new SAGE-SMC data will allow fordeeper images in the regions of overlap. For example, the combined S3MC and SAGE-SMCdata would allow for detection or improved upper limits on class 0 YSOs and understandingof dusty early B-stars (both best found at 70 µm which is severely limited by residual detectortransients caused by the single pass and lack of good background subtraction). Also, longterm infrared variability (2+ years) in the S3MC region and image deconvolution work willbe made possible. The S3MC PI (Bolatto) and a few other S3MC team members are alsomembers are on this proposal and will take the lead in integrating the S3MC data into boththe point source catalogs and the combined image products.

SAGE-SMC, K. D. Gordon et al. 8
3 Legacy Data Products Plan
Data Processing and Release Plan to the Community: A uniform legacy data productconsisting of a point source catalog and mosaicked images will be provided to the commu-nity. We will make immediately available the data pipeline products produced by the SSC:calibrated images and individual AOR mosaics. Beginning 12 months after receipt of finalobservations we will make available source catalogs and mosaic images produced by our en-hanced pipelines, with the goal to support Herschel and JWST proposals. The catalogs andmosaic images will be delivered in six month increments as they are processed. The IRACand MIPS sources will be merged into one catalog with corresponding 2MASS photometry.The IRAC and MIPS mosaic images will have the same size and projection to ensure theimages line up. The S3MC observations will be included in the SAGE-SMC deliveries.IRAC pipeline: We will use the SAGE-LMC pipeline at University of Wisconsin to processthe IRAC data. The pipeline removes or corrects for image artifacts (cosmic rays, columnpulldown, banding; see the Spitzer Observer’s Manual); does point source extraction andband merging across multiple observations and wavelengths; and mosaics images. Currentdevelopments on the SAGE-LMC pipeline (such as mosaic photometry) will be applied toboth the SAGE-LMC and SAGE-SMC projects. The IRAC processing effort will be ledby team members Whitney, Churchwell, Meade, Babler, and Indebetouw, with guidanceprovided by Joe Hora (SAO/IRAC instrument scientist) and Bill Reach (IRAC lead).MIPS pipeline: The MIPS data will be reduced using the MIPS instrument team pipeline(Gordon et al. 2005) after which we will further process the data using programs designed toremove the transients associated with the MIPS detectors (e.g., Gordon et al. 2006a; Meixneret al. 2006). These programs have been successfully used on large GTO galaxies (M31, M33,& M101), all the SINGS galaxies, and the SAGE-LMC survey. In particular, we have drawnupon our experience observing other large galaxies in optimizing the SMC observing strategyto best overcome saturation effects in the MIPS bands. The MIPS processing effort will bydone by MIPS instrument team members Gordon (lead), Block, Engelbracht, and Misselt.Database/Archive: Meixner will lead the SAGE-SMC database team at STScI. TheSAGE-SMC database will use the same format as our SAGE-LMC database which is arelational database management system queried with a structured query language (SQL).The quality and uniformity of the point source photometry will be monitored using the anetwork of calibration stars over the whole SAGE-SMC survey area (also done for GLIMPSEand SAGE-LMC). The SAGE-SMC database will include the IRAC and MIPS point sourcecatalog as well as the 2MASS and the Magellanic Cloud Photometry Survey (MCPS) cata-logs (Zaritsky et al. 2004). This database will provide complete spectral energy distributionsfor the SAGE-SMC objects enabling source classification of the whole SAGE-SMC catalogbased on what we have learned from SAGE-LMC (e.g., Blum et al. 2006).Science Teams: Our proposed work will be tackled by an international team of experts onthe SMC, star formation, evolved stars, ISM, and dust. Our large team will be split intosmaller science teams to concentrate on the three themes raised in this proposal: interstellarmedium (ISM), star formation (SF), and evolved stars (ES). Team members’ interests arelabeled with the abbreviations in parentheses. Indebetouw will lead the star formation team,Blum/Meixner will co-lead the stellar mass loss team and Reach/Bernard will co-lead theISM team. Members of this team are involved in many SMC surveys including IR (S3MCmini-survey, Bolatto), HI (Muller), CO (Israel, Mizuno, Muller), optical (MCPS, Zaritsky,Harris), NIR (VISTA, van Loon), and optical spectra (AAOmegallan, van Loon).

SAGE-SMC, K. D. Gordon et al. 9
4 Figures and Tables
SAGE-SMC, K. D. Gordon et al. 10
MIPS coverage IRAC coverage
Bar
Magellanic Bridge
Wing
HI
H−alpha (SHASSA)
IRAS 60
47 Tuc
HII regions
SN r
emna
nt
YSOEvolved Stars
UV (1775 A)
High−Density 4 de
g2MASS Stellar Density
V Stellar Density
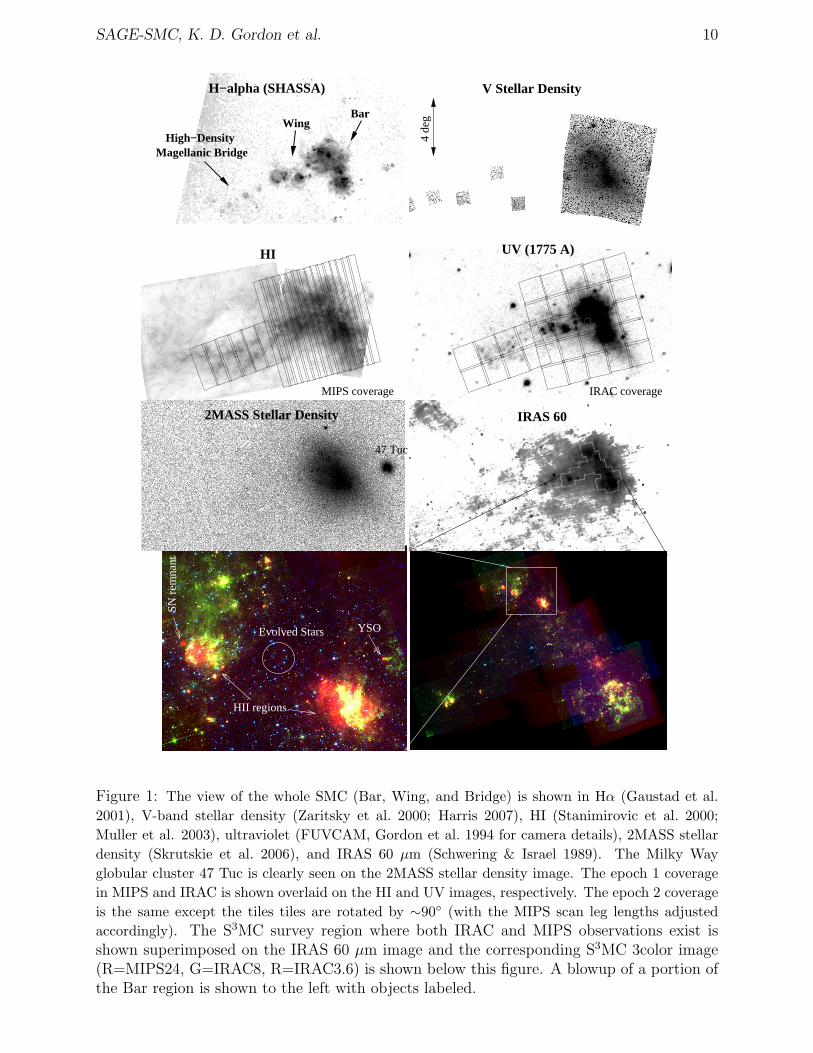
Figure 1: The view of the whole SMC (Bar, Wing, and Bridge) is shown in Hα (Gaustad et al.
2001), V-band stellar density (Zaritsky et al. 2000; Harris 2007), HI (Stanimirovic et al. 2000;
Muller et al. 2003), ultraviolet (FUVCAM, Gordon et al. 1994 for camera details), 2MASS stellar
density (Skrutskie et al. 2006), and IRAS 60 µm (Schwering & Israel 1989). The Milky Way
globular cluster 47 Tuc is clearly seen on the 2MASS stellar density image. The epoch 1 coverage
in MIPS and IRAC is shown overlaid on the HI and UV images, respectively. The epoch 2 coverage
is the same except the tiles tiles are rotated by ∼90◦ (with the MIPS scan leg lengths adjusted
accordingly). The S3MC survey region where both IRAC and MIPS observations exist isshown superimposed on the IRAS 60 µm image and the corresponding S3MC 3color image(R=MIPS24, G=IRAC8, R=IRAC3.6) is shown below this figure. A blowup of a portion ofthe Bar region is shown to the left with objects labeled.

SAGE-SMC, K. D. Gordon et al. 11
Figure 2: The [8.0] vs. [8.0]-[24.0] color-magnitude and [4.5]-[8.0] vs. [8.0]-[24.0] color-color plotscomparing the SAGE-LMC sources (left panel; Meixner et al. 2006) and the S3MC sources (rightpanel; Bolatto et al. 2007). The [4.5], [8.0], & [24.0] symbols give the Vega magnitude at thosewavelengths. Only sources which were detected at >5σ in all three bands in the 1st epoch SAGE-LMC or S3MC catalogs are shown. All sources are displayed as Hess diagrams (greyscale). Overlaidon the SAGE-LMC plots are dusty objects color coded according to the legend. “Empty field”objects are most likely background galaxies and are derived from the four corners of the SAGEsurvey. The SAGE-LMC sources, shown here, are from the initial, only epoch 1, single-framephotometry catalog. The dashed line show the 5σ sensitivities of the final catalogs in a single band.In the S3MC survey area, we plan to combine the SAGE-SMC and S3MC survey to create a deepercatalog with limits shown as a red dashed lines. Comparison of the identified SAGE-LMC sourceswith the S3MC plots illustrates the types of dusty objects the SAGE-SMC survey will detect acrossthe entire SMC.

SAGE-SMC, K. D. Gordon et al. 12
5 References
Alard, C. et al. 2001, ApJ, 552, 289
Bakes, E. L. O. & Tielens, A. G. G. M. 1994,
ApJ, 427, 822
Benjamin, R. A. et al. 2003, PASP, 115, 953
Blum, R. D. et al. 2006, AJ, 132, 2034
Bolatto, A., et al. 2006, ApJ, 652, 283
Bot, C. et al. 2004, A&A, 423, 567
Bruns, C. et al. 2005, A&A, 432, 45
Calzetti, D. et al. 1994, ApJ, 429, 582
Carey, S. J. et al. 2005, AAS, 207, 6333
Carlson, L. R. et al. 2007, ApJ, submitted
Chu, Y.-H. et al. 2006, ApJ, 634, L189
Cioni, M.-R. L. & Habing, H. J. 2003, A&A,
402, 133
Cioni, M.-R. L. et al. 2006, A&A, 452, 195
Da Costa, G. & Hatzidimitriou, D. 1998, AJ,
115, 1934
Desert, F.-X. et al. 1990, A&A, 237, 215
Draine, B. et al. 2007, ApJ, submitted
Dickinson, M. et al. 2003, The Mass of Galaxies
at Low and High Redshift, 324
Engelbracht, C. W. et al. 2005, ApJ, 628, L29
Engelbracht, C. W. et al. 2006, in prep.
Galliano, F. et al. 2007, in prep.
Gardiner, L. T. & Noguchi, M. 1996, MNRAS,
278, 191
Gaustad, J. E. et al. 2001, PASP, 113, 1326
Glass, I. S. et al. 1999, MNRAS, 308, 127
Gordon, K. D. & Clayton, G. C. 1998, ApJ, 500,
816
Gordon, K. D. et al. 1994, ApJ, 432, 641
Gordon, K. D. et al. 1997, ApJ, 487, 625
Gordon, K. D. et al. 2003, ApJ, 594, 279
Gordon, K. D. et al. 2005, PASP, 117, 503
Gordon, K. D. et al. 2006a, ApJ, 638, L87
Gordon, K. D. et al. 2006b, in prep.
Hatzidimitriou, D. et al. 2005, MNRAS, 360,
1171
Harris, J. 2006, ApJ, in press
Harris, J. & Zaritsky, D. 2004, AJ, 127, 1531
Hilditch, R. W., et al. 2005, MNRAS, 357, 304
Israel F.P. et al. 2003 A&A 406, 817
Leroy, A. et al. 2006 ApJ, in press
Li, A. & Draine, B. 2002, ApJ, 576, 762
Lonsdale, C. J. et al. 2003, PASP, 115, 897
Madden, S. C. et al. 2006, A&A, 446, 877
Meixner, M. et al. 2006, AJ, 132, 2268
Mizuno, N. et al. 2001, PASJ, 53, L45
Mizuno, N. et al. 2006, ApJ, 643, L107
Muller, E. et al. 2003, MNRAS, 339, 105
Nota, A. et al. 2006, ApJ, 640, L29
Pei, Y. C. et al. 1999, ApJ, 522, 604
Ramdani, A. & Jorissen, A. 2001, A&A, 372, 85
Rolleston, W. R. et al. 1999, A&A, 348, 728
Russell, S. C. & Dopita, M. A. 1992, ApJ, 384,
508
Schwering, P. B. W. & Israel, F. P. A&AS, 79,
79
Skrutskie, M. F. et al. 2006, AJ, 131, 1163
Srinivasan, S. et al. 2006, AAS, #209, 160.05
Stanimirovic, S. et al. 2000, MNRAS, 315, 791
Stanimirovic, S. et al. 2004, ApJ, 604, 176
Staveley-Smith, L. et al. 1998, RvMA, 11, 117
Tielens, A. G. G. M. 2001, ASP Conv. Ser. 231,
92
van Loon, J. Th. 1999, A&A, 351, 559
Volk, K. et al. 2007, in prep.
Vijh, U. P. et al. 2003, ApJ, 587, 553
Vijh, U. P. et al. 2006, AAS, #209, 160.06
Whitney, B. et al. 2007, in prep.
Zaritsky, D. et al. 2000, ApJ, 534, L53
Zaritsky, D. et al. 2002, AJ, 123, 855
Zaritsky, D. & Harris, J. 2004, ApJ, 604, 167
6 Brief Resume/Bibliography
Karl D. Gordon is an Assistant Astronomer at Steward Observation at the Univ. of Arizona.He received his PhD from the Univ. of Toledo in 1997 working with Adolf Witt. He hasworked extensively on dust, star formation, and evolved stars in the Milky Way, Local GroupGalaxies, and other galaxies in the local universe.

SAGE-SMC, K. D. Gordon et al. 13
The team for this proposal is extremely well qualified as illustrated by this selection ofpublications and the SAGE website: sage.stsci.edu.”Spitzer Survey of the Large Magellanic Cloud: Surveying the Agents of a Galaxy’s Evolu-tion (SAGE). I. Overview and Initial Results” Meixner, M., K. D. Gordon, et al. 2006, AJ,132, 2268”Spitzer SAGE Survey of the Large Magellanic Cloud. II. Evolved Stars and Infrared Color-Magnitude Diagrams” Blum, R. D. et al. 2006, AJ, 132, 2034”The Spitzer Survey of the Small Magellanic Cloud: S3MC Imaging and Photometry in theMid- and Far-Infrared Wave Bands” Bolatto, A. et al. 2007, ApJ, 655, 212“Interpreting Spectral Energy Distributions from Young Stellar ”The Bubbling GalacticDisk” Churchwell, E. et al. 2006, ApJ, 649, 759Objects. I. A Grid of 200,000 YSO Model SEDs” Robitaille, T.P. et al. 2006, ApJS, 167,256“Metallicity Effects on Mid-Infrared Colors and the 8 micron PAH Emission in Galaxies”Engelbracht, C.W. et al. 2005, ApJ, 628, L29“The Star Formation History of the Small Magellanic Cloud” Harris, J. & Zaritsky, D. 2004,AJ, 127, 1531“A GLIMPSE of Star Formation in the Giant H II Region RCW 49” B. A. Whitney, B. A.et al. 2004, ApJS, 154, 315”A Quantitative Comparison of SMC, LMC, and Milky Way UV to NIR Extinction Curves”Gordon, K. D. et al. 2003, ApJ, 594, 279“2-Dust: an axisymmetric dust radiative transfer code” Ueta, T. & Meixner, M. 2003, ApJ,586, 1338“Interacting LMC supergiant shells” Cohen, M., Staveley-Smith, L. & Green, A. 2003, MN-RAS, 340, 275“The DIRTY Model. II. Self-Consistent Treatment of Dust Heating and Emission in a 3-DRadiative Transfer Code” Misselt, K.A. et al. 2001, ApJ, 551, 277“The DIRTY Model. I. Monte Carlo Radiative Transfer Through Dust” Gordon, K.D. et al.2001, ApJ, 551, 269

SAGE-SMC, K. D. Gordon et al. 14
7 Observation Summary Table
Target Position AOT/ Int./ AOR # ofField (J2000) Bands Pixel Duration AORS
(secs) (hours)Epoch 1
SMC 15.81◦,-72.89◦ IRAC 48 2.97 25main 5◦ × 5◦ allbodySMC 29.5◦,-74.5◦ IRAC 48 2.97 8bridge 4◦ × 2◦ allregionSMC 15.81◦,-72.89◦ MIPS 24:30 2.79 16main 5◦ × 5◦ scan 70:15body 160:4.5SMC 29.5◦,-74.5◦ MIPS 24:30 2.95 6bridge 4◦ × 2◦ scan 70:15region 160:4.5
Epoch 1SMC 15.81◦,-72.89◦ IRAC 48 2.97 25main 5◦ × 5◦ allbodySMC 29.5◦,-74.5◦ IRAC 48 2.97 8bridge 4◦ × 2◦ allregionSMC 15.81◦,-72.89◦ MIPS 24:30 2.79 16main 5◦ × 5◦ scan 70:15body 160:4.5SMC 29.5◦,-74.5◦ MIPS 24:30 2.85 5bridge 4◦ × 2◦ scan 70:15region 160:4.5
There are 196 hrs total in IRAC AORs and 121 hrs total in MIPS AORs.
8 Status of Existing Spitzer Programs
PI K. Gordon is the TC of the MIPS ERO program 717 to study M81. Data publishedin “Spatially Resolved Ultraviolet, H-alpha, Infrared, and Radio Star Formation in M81”,Gordon et al. 2004, ApJS, 154, 215.
PI K. Gordon is the TC of the MIPS GTO programs 60 and 30244 to study the HIIregions in M101. All of the PID:60 data have been obtained and results presented at theSpitzer meetings in Fall 2004 and 2005. A paper discussing the main results of this programis in preparation. The PID:30244 data will be obtained this Spring.
PI K. Gordon is the TC of the MIPS GTO programs 99 and 30203 to study M31. ThePID:99 data have all been obtained and an analysis of the infrared morphology of M31published in Gordon et al. 2006, ApJ, 638, L87 and the dust content of the companiongalaxy NGC 205 has been published in Marleau, et al. 2006, ApJ, 646, 929. The PID:30203

SAGE-SMC, K. D. Gordon et al. 15
data should be taken this Summer. Additional papers on comparison of the MIPS imagesto other wavelength data are in preparation by members a large international collaborationwhich seeded around the MIPS observations.
PI K. Gordon is the PI of the GO-2 program 20146 to study the diffuse interstellarextinction curve in the Spitzer infrared. The final observations for this program have recentlybeen taken and all the data has been reduced. A progress report was presented at the Jan2006 AAS meeting and the analysis of the full dataset is ongoing.
Co-I M. Meixner is PI of the Cycle-2 Spitzer Legacy Program: “Spitzer Survey of theLarge Magellanic Cloud: Surveying the Agents of Galaxy’s Evolution (SAGE)”. The SAGEEpoch 1 IRAC point source catalog and archive, ∼4 million sources, and the SAGE Epoch 1MIPS 24 micron point source catalog, ∼60,000 sources, were delivered to IRSA in December2006 for the community, in less than a year from obtaining all of the data. Results basedon these data are discussed in Meixner, M. et al. 2006, AJ, 132, 2268 and Blum, R.D. et al.2006, AJ, 132, 2034. Six papers are in preparation/writing stage. Six projects/papers are inthe analysis stage. SAGE results have been presented at several conferences, most recentlya SAGE special session at the January 2007 AAS meeting.
Co-I A. Bolatto is the PI of cycle 1 project 3316 “The Small Magellanic Cloud: ATemplate for the Primitive Interstellar Medium”, and cycle 3 project 30491 “A CompletePicture of the Dust in the Small Magellanic Cloud: Following up Spitzer Imaging”. The cycle1 observations are complete and have resulted in several refereed publications, with moreunder preparation. The public project website, which describes the project, its publications,and is used for data releases, is located at http://celestial.berkeley.edu/spitzer. Thecycle 3 observations are well under way, and in the process of being reduced.
Co-I R. Indebetouw is PI of PID 249; LMC data are expected to be submitted this Spring.He is also PI of a program for spectroscopy of 30Dor - initial data reduction is complete,refinement of artifacts is ongoing.
Co-I B. Whitney is also PI of a Cycle-3 Theory proposal (PID 30467) to make a YSOSED grid & fitter publicly available and to produce the next generation grid of models. Thefirst task is finished, and the second is in progress. Two papers have been published.
9 Proprietary Period Modification
To promote follow-up efforts by the community, we waive our proprietary time; i.e. shortenthe proprietary period from 12 months to 0 months.
10 Justification of Duplicate Observations
Previous observations of the SMC exist for the central 2.8 deg2 in IRAC and 3.7 deg2 inMIPS. Mapping around the existing IRAC observations is technically possible, but wouldsignificantly add to the amount of time needed due to the complicated geometry of theprevious IRAC observations. Given that the previous observations consist of around 3 of the33 IRAC tiles needed to cover the SMC, we request that our duplication of these observationsbe allowed. Mapping around the existing MIPS observations is not technically feasible giventhe need to measure the background in each MIPS scan leg to achieve good reductions. Giventhat it would significantly compromise the MIPS reductions to map around the existingobservations, we request that our duplications be allowed. As a side benefit of allowing for
SAGE-SMC, K. D. Gordon et al. 16
these duplications, we will be able to improve the reductions of the previous observationsand use the existing observations for a third epoch in the search for long-period variables.
11 Justification of Targets of Opportunity
There are no ToO observations.
12 Justification of Scheduling Constraints
To map the SMC efficiently, our proposed observations will need to be time constrained.We simulated a variety of schemes to map the SMC in IRAC and MIPS with and withouttiming constraints and with and without duplications. Reducing scheduling constraints whileavoiding duplication increases the time request by ∼50% making that approach undesirable.Essentially, the mapped regions have to be much bigger to achieve uniform coverage withless time constraints. We have conferred with the SSC about our strategy and found that itcould be accomplished with current scheduling practice especially given that it was possibleto schedule the SAGE-LMC observations which are larger than those proposed here for theSMC. We also include a relative time constraint of ∼3 months between the two passes of thefull SMC maps so that they will have ∼90◦ relative rotation angle which is important for thecorrection of artifacts. Based on our team members’ experiences with GLIMPSE, SINGS,and SAGE-LMC, we would plan to work with the SSC to provide them with optimized AORsfor their chosen scheduled date for observations.
13 Data Analysis Funding Distribution
PI K. Gordon (24%), M. Meixner (20%), E. Churchwell (20%), B. Whitney (5%), W. Reach(5%), B. Blum (5%), A. Bolatto (5%), R. Indebetouw (5%), M. Cohen (5%), A. Li (3%), U.Vijh (1%), X. Tielens (1%), V. Gorjian (1%)
14 Financial Contact Information
For PI K. GordonSherry Esham, DirectorUniversity of ArizonaSponsored ProjectsPO Box 3308Tucson AZ 85722-2208520-626-6000 (phone)520-626-4137 (fax)[email protected]
For Co-I M. MeixnerLynn KozloskiSTScIContracts & Business

SAGE-SMC, K. D. Gordon et al. 17
3700 San Martin Dr.Baltimore, MD 21218(410) [email protected]
For Co-I W. ReachEloise KennedyCalifornia Institute of TechnologyMail Code 100-22Pasadena, California [email protected]
For Co-I E. ChurchwellUniversity of Wisconsin-MadisonDiane Barrett, Contract AdministratorResearch and Sponsored Programs21 N. Park St., Suite 6401Madison, WI [email protected]
For Co-I B. Whitney:Space Science InstituteJennifer GartnerContracts & Grants Officer4750 Walnut St., Suite 205Boulder, CO 80301Tel.: 720-974-5845Fax: 720-974-5837E-mail: [email protected]
For Co-I B. BlumChris RichardsonNOAO950 N. Cherry AvenueTucson, AZ, [email protected]
For Co-I R. IndebetouwUniversity of VirginiaNeal Grandy, Research AdministratorPO Box 400772Cabell HallCharlottesville, VA [email protected]

SAGE-SMC, K. D. Gordon et al. 18
For A. BolattoDavid Weldon, Sponsored Projects OfficeUniversity of California at Berkeley336 Sproul Hall #5940Berkeley, CA [email protected]
For Co-I M. CohenPatricia A. GatesSponsored Projects’ OfficeUniversity of California, Berkeley2150 Shattuck Ave., Suite 313Berkeley, CA 94704-5940Phone: 510-642-8109; FAX: 510-642-8236E-mail: [email protected]
For Co-I A. LiSherry Long, Administrative AssociateUniversity of Missouri-ColumbiaColumbia, MO 65211, USAemail: [email protected]
For Co-I X. TielensMr. Brett VuNASA Ames Research CenterMS 245-1Moffett Field, CA 94035email: [email protected]: +1 650-604-6779Telephone: +1 650-604-0911
For Co-I U. VijhDorothy SpurlockDirector, Research and Sponsored ProgramsOffice of ResearchThe University of Toledo2801 W. Bancroft St.Toledo, OH [email protected]
For Co-I V. GorjianEloise S. KennedyJPL, M/S: 100-224800 Oak Grove DrivePasadena, CA 91109-8099+1 626 395-1810
![What We Learned from Surveying the Galaxy in [CII] with Herschel …herschel.esac.esa.int/TheUniverseExploredByHerschel/... · 2013-10-29 · What We Learned from Surveying the Galaxy](https://static.fdocuments.us/doc/165x107/5e860dcf3963b556e33113a3/what-we-learned-from-surveying-the-galaxy-in-cii-with-herschel-2013-10-29-what.jpg)