Safety Performance Measurement
44
Safety Performance Measurement - SPI & ALoSP Development (APRAST-6 Workshop) 6 April 2015 [email protected] 1
Transcript of Safety Performance Measurement
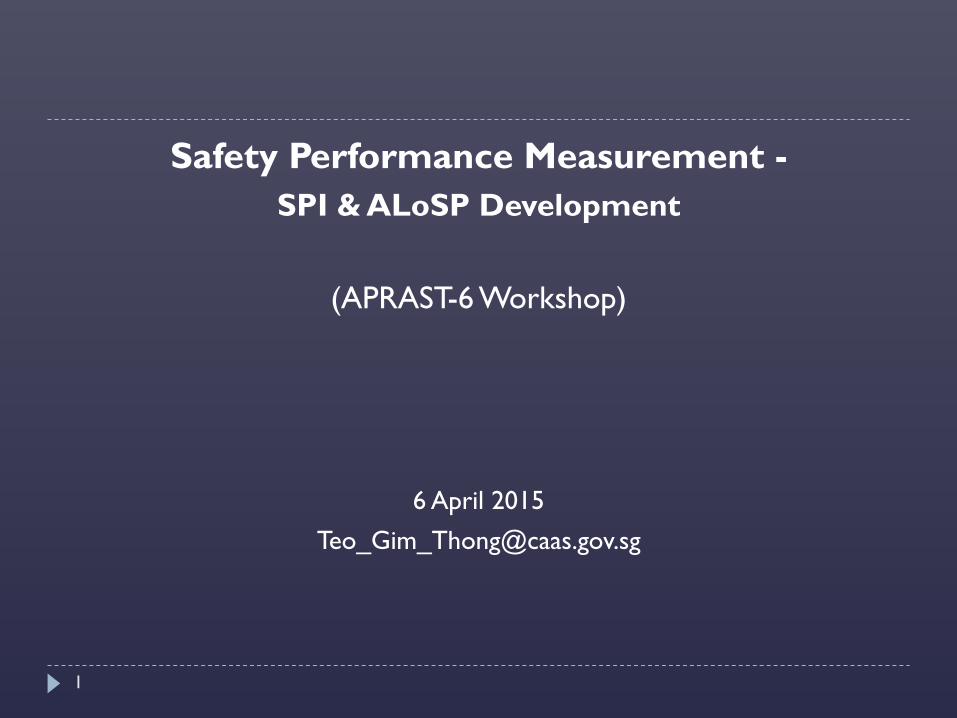
Safety Performance Measurement -
SPI & ALoSP Development
(APRAST-6 Workshop)
6 April 2015
1

Safety Performance Measurement (SPM):
SPIs & ALoSP Development
Agenda
1. Definition
2. Why measure safety performance
3. Safety Performance Indicators
4. Alert level
5. Target setting
6. SPI data template & trending chart
7. Acceptable Level of Safety Performance
Quiz, Discussion, Q&A
2

1. SPM Definition
“Safety Performance Measurement” in the context of this
presentation refers to the process of measuring and
monitoring safety related outcomes associated with a given
operational system or organisation.
3

2. Why measure safety performance
A19, 3.1.1- Each State shall establish an SSP for the management
of safety in the State, in order to achieve an acceptable level of
safety performance in civil aviation
A19, 3.1.2 - The acceptable level of safety performance to be
achieved shall be established by the State”
SSP Element 3.2 - Safety data collection, analysis and exchange
SMS Element 3.1 - Safety performance monitoring and
measurement
Quote -“You cannot manage what you cannot measure”
4
5
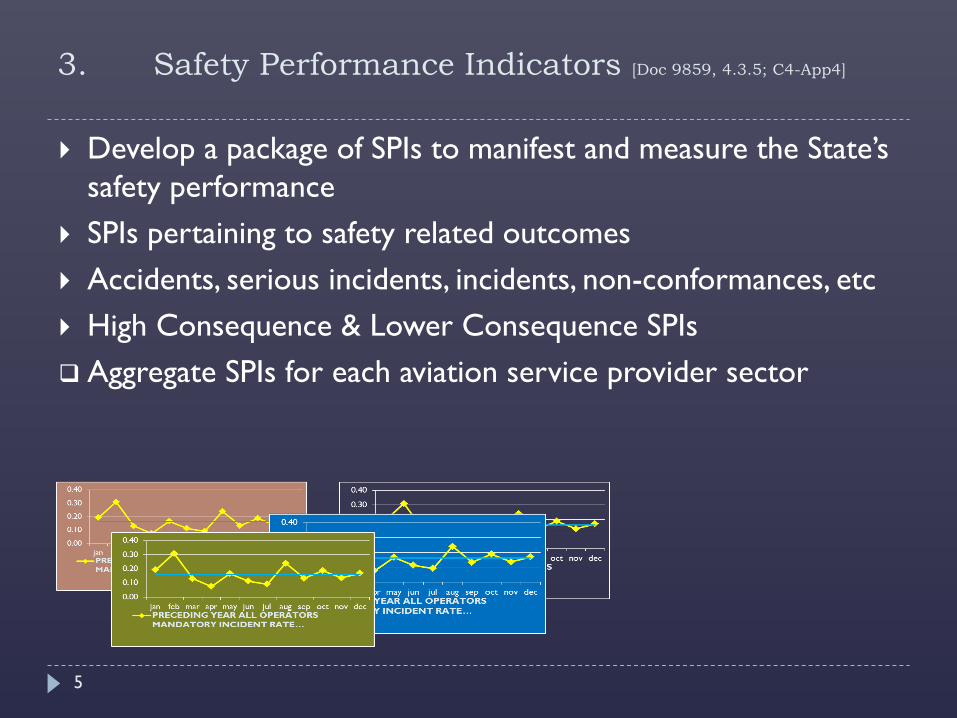
Develop a package of SPIs to manifest and measure the State’s
safety performance
SPIs pertaining to safety related outcomes
Accidents, serious incidents, incidents, non-conformances, etc
High Consequence & Lower Consequence SPIs
Aggregate SPIs for each aviation service provider sector
3. Safety Performance Indicators [Doc 9859, 4.3.5; C4-App4]

6
Establish high occurrence rate Alert trigger within each SPI
Establish planned improvement Target level within each SPI
3. Two SPI Performance Markers [Doc 9859, 4.3.5.6]
0.00
0.05
0.10
0.15
0.20
0.25
0.30
0.35
0.40
jan feb mar apr may jun jul aug sep oct nov dec
PRECEDING YEAR ALL OPERATORS
MANDATORY INCIDENT RATE (PER
1000FH)
Ave+1 SD
Ave+2 SD
Ave+3 SD
Target
dec jan feb mar apr may jun jul aug sep oct nov dec
CURRENT YEAR ALL OPERATORS
MANDATORY INCIDENT RATE
(PER 1000 FH)

4. Alert Trigger setting
7
Statistical Alarm bell (out of control criteria)
Based on SPI’s preceding period’s data performance i.e Average & Standard Deviation values
Ave+1SD; Ave+2SD; Ave+3SD
Continuous monitoring for abnormal trends
0.00
0.05
0.10
0.15
0.20
0.25
0.30
0.35
0.40
jan feb mar apr may jun jul aug sep oct nov dec
PRECEDING YEAR ALL OPERATORS
MANDATORY INCIDENT RATE (PER
1000FH)
Ave+1 SD
Ave+2 SD
Ave+3 SD
dec jan feb mar apr may jun jul aug sep oct nov dec
CURRENT YEAR ALL OPERATORS
MANDATORY INCIDENT RATE (PER
1000 FH)

8
4. Alert Trigger setting – 3 criteria
One single point above 3-SD
line
Two or more consecutive
points above 2-SD line
Three or more consecutive
points above 1-SD line

9
5. Target Level setting
A planned (desired) occurrence rate improvement for a new
monitoring period
Reduction (eg 5%) of current period’s Average over preceding
period’s Average rate
Target achievement assessed at end of each monitoring period
0.00
0.05
0.10
0.15
0.20
0.25
0.30
0.35
0.40
jan feb mar apr may jun jul aug sep oct nov dec
PRECEDING YEAR ALL OPERATORS
MANDATORY INCIDENT RATE (PER
1000FH)
Target
dec jan feb mar apr may jun jul aug sep oct nov dec
CURRENT YEAR ALL OPERATORS
MANDATORY INCIDENT RATE (PER
1000 FH)
10
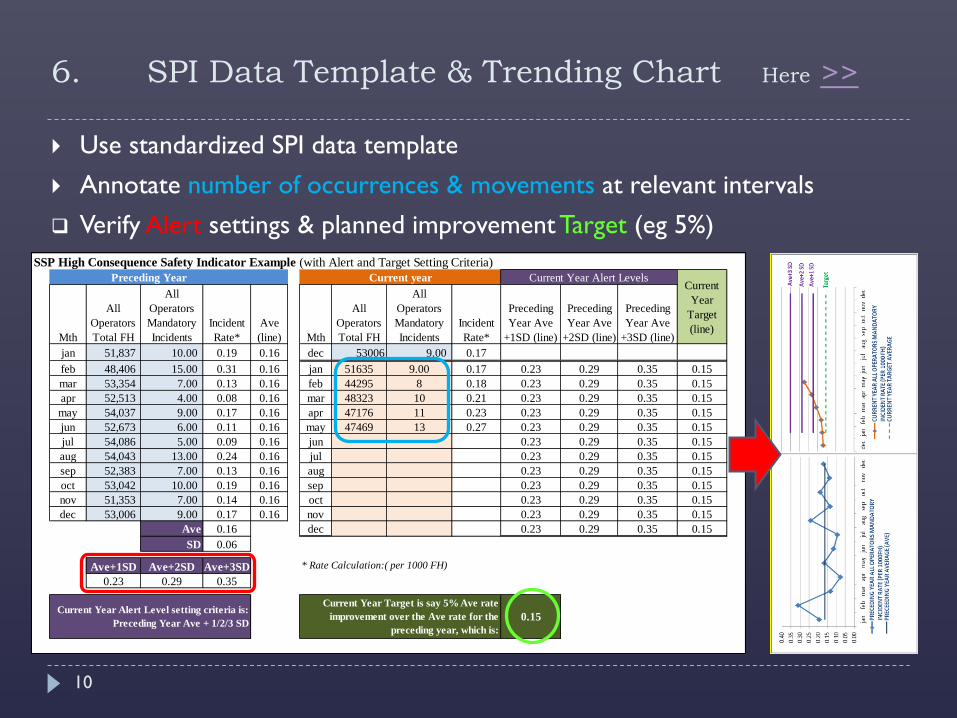
6. SPI Data Template & Trending Chart Here >>
SSP High Consequence Safety Indicator Example (with Alert and Target Setting Criteria)
Mth
All
Operators
Total FH
All
Operators
Mandatory
Incidents
Incident
Rate*
Ave
(line) Mth
All
Operators
Total FH
All
Operators
Mandatory
Incidents
Incident
Rate*
Preceding
Year Ave
+1SD (line)
Preceding
Year Ave
+2SD (line)
Preceding
Year Ave
+3SD (line)
jan 51,837 10.00 0.19 0.16 dec 53006 9.00 0.17
feb 48,406 15.00 0.31 0.16 jan 51635 9.00 0.17 0.23 0.29 0.35 0.15
mar 53,354 7.00 0.13 0.16 feb 44295 8 0.18 0.23 0.29 0.35 0.15
apr 52,513 4.00 0.08 0.16 mar 48323 10 0.21 0.23 0.29 0.35 0.15
may 54,037 9.00 0.17 0.16 apr 47176 11 0.23 0.23 0.29 0.35 0.15
jun 52,673 6.00 0.11 0.16 may 47469 13 0.27 0.23 0.29 0.35 0.15
jul 54,086 5.00 0.09 0.16 jun 0.23 0.29 0.35 0.15
aug 54,043 13.00 0.24 0.16 jul 0.23 0.29 0.35 0.15
sep 52,383 7.00 0.13 0.16 aug 0.23 0.29 0.35 0.15
oct 53,042 10.00 0.19 0.16 sep 0.23 0.29 0.35 0.15
nov 51,353 7.00 0.14 0.16 oct 0.23 0.29 0.35 0.15
dec 53,006 9.00 0.17 0.16 nov 0.23 0.29 0.35 0.15
Ave 0.16 dec 0.23 0.29 0.35 0.15
SD 0.06
Ave+1SD Ave+2SD Ave+3SD * Rate Calculation:( per 1000 FH)
0.23 0.29 0.35
Current
Year
Target
(line)
Preceding Year Current year
Current Year Alert Level setting criteria is:
Preceding Year Ave + 1/2/3 SD
Current Year Target is say 5% Ave rate
improvement over the Ave rate for the
preceding year, which is:
0.15
Current Year Alert Levels
Use standardized SPI data template
Annotate number of occurrences & movements at relevant intervals
Verify Alert settings & planned improvement Target (eg 5%)

11
At end of a monitoring period –
Each SPI’s performance is manifested by its own Alert &
Target achievement outcome as follows:
7. Acceptable Level of Safety Performance
Alert avoidance –
Yes / No
Target achieved –
Yes/ No

12
7. Acceptable Level of Safety Performance
Consequently –
A package of SPIs’ performance is
manifested by its consolidated Alert
& Target achievement outcome
>>>
SI Alert Level/
Criteria (for 2010)
Alert level
Not
Breached
[Yes (4),
No (0)]
SI Target level/
criteria (for 2010)
Target
Achieved
[Yes (3),
No (0)]
1 CAA aggregate Air Operators
monthly accident/ serious
incident rate [per 1000 FH]
2009 Average Rate +
1/2/3 SD. (annual
reset)
4
5 % improvement of
the 2010 Average Rate
over the 2009 Average
Rate.
0
2 CAA aggregate Aerodromes
monthly ground accident/
serious incidents rate - involving
any aircraft [per 10,000 ground
movements]
2009 Average Rate +
1/2/3 SD. (annual
reset)
4
3 % improvement of
the 2010 Average Rate
over the 2009 Average
Rate.
3
3 CAA aggregate ATS monthly
FIR serious incidents rate -
involving any aircraft [per
100,000 air movements]
2009 Average Rate +
1/2/3 SD. (annual
reset)
0
4 % improvement of
the 2010 Average Rate
over the 2009 Average
Rate.
0
Sub-total 8 Sub-total 3
Max 12 Max 9
SI Alert Level/
Criteria (for 2010)
Alert level
Not
Breached
[Yes (2),
No (0)]
SI Target level/
criteria (for 2010)
Target
Achieved
[Yes (1),
No (0)]
CAA aggregate Air Operators
Organization annual
surveillance/ audit outcomes
>25% Average LEI;
OR any level 1 finding;
OR >5 level 2 findings
per audit
2
<10% Average LEI;
AND <1 level 2
finding per audit
0
CAA annual Air Operator Line
Station surveillance inspection
Ave LEI% (for each Operator).
>25% Average LEI;
OR any level 1 finding;
OR >5 level 2 findings
per audit
2 <10% Average LEI 1
CAA annual Foreign Air
Operators Ramp sampling
inspection program.
>25% Average LEI;
OR any level 1 finding;
OR >5 level 2 findings
per audit; OR <25% of
Foreign Operators
inspected
2
Not less than 50% of
Foreign Operators to
be inspected
0
CAA aggregate Aerodrome
Operators Organization annual
surveillance/ audit outcomes
>25% Average LEI;
OR any level 1 finding;
OR >5 level 2 findings
per audit
0
<10% Average LEI;
AND <1 level 2
finding per audit
0
CAA aggregate ATS Operators
Organization annual
surveillance/ audit outcomes
>25% Average LEI;
OR any level 1 finding;
OR >5 level 2 findings
per audit
2
<10% Average LEI;
AND <1 level 2
finding per audit
1
CAA aggregate ATS quarterly
FIR TCAS RA incidents rate -
involving any aircraft [per
10,000 flight movements]
2009 Average Rate +
1/2/3 SD. (annual
reset)
2
5 % improvement of
the 2010 Average Rate
over the 2009 Average
Rate.
0
CAA aggregate D&M/ MRO
Organization annual
surveillance/ audit outcomes
>25% Average LEI;
OR any level 1 finding;
OR >5 level 2 findings
per audit
2
<10% Average LEI;
AND <1 level 2
finding per audit
1
CAA aggregate AMO (MRO)
quarterly rate of component
warranty claims due to (Major)
technical defects.
2009 Average Rate +
1/2/3 SD. (annual
reset)
0
5 % improvement of
the 2010 Average Rate
over the 2009 Average
Rate.
0
Sub-total 12 Sub-total 3
Max 16 Max 8
No Alert % 71.4% Target Achieved % 35.3%
57.8%
Safety Indicator (SI) Description
Lower Consequence Safety Indicators
Safety Indicator (SI) Description
High Consequence Safety Indicators
Overall ALoS Performance

13
At the beginning of a new monitoring period -
Organization establish its desired minimum consolidated Alert & Target achievement outcome (i.e ALoSP), after taking into consideration the previous period’s performance (57.8% in below illustration)
Could 60% be a possible ALoSP to be established for the next monitoring period?
7. Acceptable Level of Safety Performance
CAA aggregate D&M/ MRO
Organization annual
surveillance/ audit outcomes
>25% Average LEI;
OR any level 1 finding;
OR >5 level 2 findings
per audit
2
<10% Average LEI;
AND <1 level 2
finding per audit
1
CAA aggregate AMO (MRO)
quarterly rate of component
warranty claims due to (Major)
technical defects.
2009 Average Rate +
1/2/3 SD. (annual
reset)
0
5 % improvement of
the 2010 Average Rate
over the 2009 Average
Rate.
0
Sub-total 12 Sub-total 3
Max 16 Max 8
No Alert % 71.4% Target Achieved % 35.3%
57.8%Overall ALoS Performance

14
This established ALoSP (eg 60%) is then measured against
the actual consolidated Alert & Target achievement
outcome at the end of the monitoring period, to verify its
achievement
Q: What would a 100% ALoSP mean?
Ans: All Targets achieved + zero Alerts
7. Acceptable Level of Safety Performance
CAA aggregate D&M/ MRO
Organization annual
surveillance/ audit outcomes
>25% Average LEI;
OR any level 1 finding;
OR >5 level 2 findings
per audit
2
<10% Average LEI;
AND <1 level 2
finding per audit
1
CAA aggregate AMO (MRO)
quarterly rate of component
warranty claims due to (Major)
technical defects.
2009 Average Rate +
1/2/3 SD. (annual
reset)
0
5 % improvement of
the 2010 Average Rate
over the 2009 Average
Rate.
0
Sub-total 12 Sub-total 3
Max 16 Max 8
No Alert % 71.4% Target Achieved % 35.3%
57.8%Overall ALoS Performance

Quiz:
15
At the end of a current 12 month monitoring period,
there were 3 data points (Apr, Jul, Oct) that went above
the “Ave+1SD” Alert line as shown here:
Q: Has this SPI chart
breached an Alert
condition?
Answer: NO!
(non consecutive
points!)

Quiz
16
A Target setting is the planned Alert level to be achieved.
TRUE / FALSE?
Answer: FALSE
Target level is meant to be achieved
Alert level is meant to be avoided

Quiz
17
An Acceptable Level of Safety Performance can be
established and monitored for achievement by the
consolidated Alert & Target outcome of a package of SPIs.
TRUE / FALSE
Ans: TRUE

In summary
18
Manage safety performance by measuring it
Develop a package of SPIs to measure safety performance
Set individual SPI Alert & Target performance markers based on safety metrics principles
Consolidate SPIs package Alert & Target outcomes to manifest the system’s overall safety performance
Establish and achieve the organization’s acceptable level of safety performance through the consolidated outcome of the SPIs package
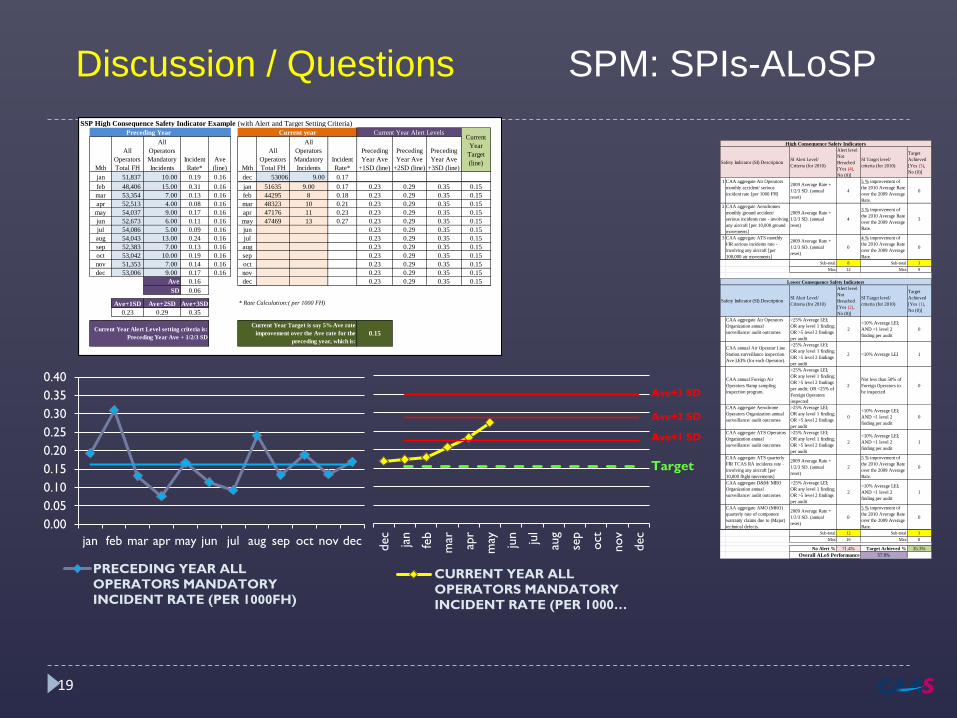
Discussion / Questions SPM: SPIs-ALoSP
19
0.00
0.05
0.10
0.15
0.20
0.25
0.30
0.35
0.40
jan feb mar apr may jun jul aug sep oct nov dec
PRECEDING YEAR ALL
OPERATORS MANDATORY
INCIDENT RATE (PER 1000FH)
Ave+1 SD
Ave+2 SD
Ave+3 SD
Target
dec
jan
feb
mar
apr
may jun jul
aug
sep
oct
nov
dec
CURRENT YEAR ALL
OPERATORS MANDATORY
INCIDENT RATE (PER 1000 …
SSP High Consequence Safety Indicator Example (with Alert and Target Setting Criteria)
Mth
All
Operators
Total FH
All
Operators
Mandatory
Incidents
Incident
Rate*
Ave
(line) Mth
All
Operators
Total FH
All
Operators
Mandatory
Incidents
Incident
Rate*
Preceding
Year Ave
+1SD (line)
Preceding
Year Ave
+2SD (line)
Preceding
Year Ave
+3SD (line)
jan 51,837 10.00 0.19 0.16 dec 53006 9.00 0.17
feb 48,406 15.00 0.31 0.16 jan 51635 9.00 0.17 0.23 0.29 0.35 0.15
mar 53,354 7.00 0.13 0.16 feb 44295 8 0.18 0.23 0.29 0.35 0.15
apr 52,513 4.00 0.08 0.16 mar 48323 10 0.21 0.23 0.29 0.35 0.15
may 54,037 9.00 0.17 0.16 apr 47176 11 0.23 0.23 0.29 0.35 0.15
jun 52,673 6.00 0.11 0.16 may 47469 13 0.27 0.23 0.29 0.35 0.15
jul 54,086 5.00 0.09 0.16 jun 0.23 0.29 0.35 0.15
aug 54,043 13.00 0.24 0.16 jul 0.23 0.29 0.35 0.15
sep 52,383 7.00 0.13 0.16 aug 0.23 0.29 0.35 0.15
oct 53,042 10.00 0.19 0.16 sep 0.23 0.29 0.35 0.15
nov 51,353 7.00 0.14 0.16 oct 0.23 0.29 0.35 0.15
dec 53,006 9.00 0.17 0.16 nov 0.23 0.29 0.35 0.15
Ave 0.16 dec 0.23 0.29 0.35 0.15
SD 0.06
Ave+1SD Ave+2SD Ave+3SD * Rate Calculation:( per 1000 FH)
0.23 0.29 0.35
Current
Year
Target
(line)
Preceding Year Current year
Current Year Alert Level setting criteria is:
Preceding Year Ave + 1/2/3 SD
Current Year Target is say 5% Ave rate
improvement over the Ave rate for the
preceding year, which is:
0.15
Current Year Alert Levels
SI Alert Level/
Criteria (for 2010)
Alert level
Not
Breached
[Yes (4),
No (0)]
SI Target level/
criteria (for 2010)
Target
Achieved
[Yes (3),
No (0)]
1 CAA aggregate Air Operators
monthly accident/ serious
incident rate [per 1000 FH]
2009 Average Rate +
1/2/3 SD. (annual
reset)
4
5 % improvement of
the 2010 Average Rate
over the 2009 Average
Rate.
0
2 CAA aggregate Aerodromes
monthly ground accident/
serious incidents rate - involving
any aircraft [per 10,000 ground
movements]
2009 Average Rate +
1/2/3 SD. (annual
reset)
4
3 % improvement of
the 2010 Average Rate
over the 2009 Average
Rate.
3
3 CAA aggregate ATS monthly
FIR serious incidents rate -
involving any aircraft [per
100,000 air movements]
2009 Average Rate +
1/2/3 SD. (annual
reset)
0
4 % improvement of
the 2010 Average Rate
over the 2009 Average
Rate.
0
Sub-total 8 Sub-total 3
Max 12 Max 9
SI Alert Level/
Criteria (for 2010)
Alert level
Not
Breached
[Yes (2),
No (0)]
SI Target level/
criteria (for 2010)
Target
Achieved
[Yes (1),
No (0)]
CAA aggregate Air Operators
Organization annual
surveillance/ audit outcomes
>25% Average LEI;
OR any level 1 finding;
OR >5 level 2 findings
per audit
2
<10% Average LEI;
AND <1 level 2
finding per audit
0
CAA annual Air Operator Line
Station surveillance inspection
Ave LEI% (for each Operator).
>25% Average LEI;
OR any level 1 finding;
OR >5 level 2 findings
per audit
2 <10% Average LEI 1
CAA annual Foreign Air
Operators Ramp sampling
inspection program.
>25% Average LEI;
OR any level 1 finding;
OR >5 level 2 findings
per audit; OR <25% of
Foreign Operators
inspected
2
Not less than 50% of
Foreign Operators to
be inspected
0
CAA aggregate Aerodrome
Operators Organization annual
surveillance/ audit outcomes
>25% Average LEI;
OR any level 1 finding;
OR >5 level 2 findings
per audit
0
<10% Average LEI;
AND <1 level 2
finding per audit
0
CAA aggregate ATS Operators
Organization annual
surveillance/ audit outcomes
>25% Average LEI;
OR any level 1 finding;
OR >5 level 2 findings
per audit
2
<10% Average LEI;
AND <1 level 2
finding per audit
1
CAA aggregate ATS quarterly
FIR TCAS RA incidents rate -
involving any aircraft [per
10,000 flight movements]
2009 Average Rate +
1/2/3 SD. (annual
reset)
2
5 % improvement of
the 2010 Average Rate
over the 2009 Average
Rate.
0
CAA aggregate D&M/ MRO
Organization annual
surveillance/ audit outcomes
>25% Average LEI;
OR any level 1 finding;
OR >5 level 2 findings
per audit
2
<10% Average LEI;
AND <1 level 2
finding per audit
1
CAA aggregate AMO (MRO)
quarterly rate of component
warranty claims due to (Major)
technical defects.
2009 Average Rate +
1/2/3 SD. (annual
reset)
0
5 % improvement of
the 2010 Average Rate
over the 2009 Average
Rate.
0
Sub-total 12 Sub-total 3
Max 16 Max 8
No Alert % 71.4% Target Achieved % 35.3%
57.8%
Safety Indicator (SI) Description
Lower Consequence Safety Indicators
Safety Indicator (SI) Description
High Consequence Safety Indicators
Overall ALoS Performance

SSP Safety Performance Indicators and ALoSP 3-Apr-15
Contents:Sheet 1 Instructions for WGsSheet 2 SSP-SMS Safety Performance Indicators correlation >>Sheet 3 Safety Indicator Chart >>Sheet 4 SPI Data Sheet >>Sheet 5A SPIs Summary Package Performance (ALoSP) >>
Purpose – Template for the selection and development of individual SPIs with harmonized Alert & Target setting procedure. Include procedure for consolidation of the SPIs’ individual Alert and Target performance outcomes to derive the ALoSP (applicable for SSP & SMS).
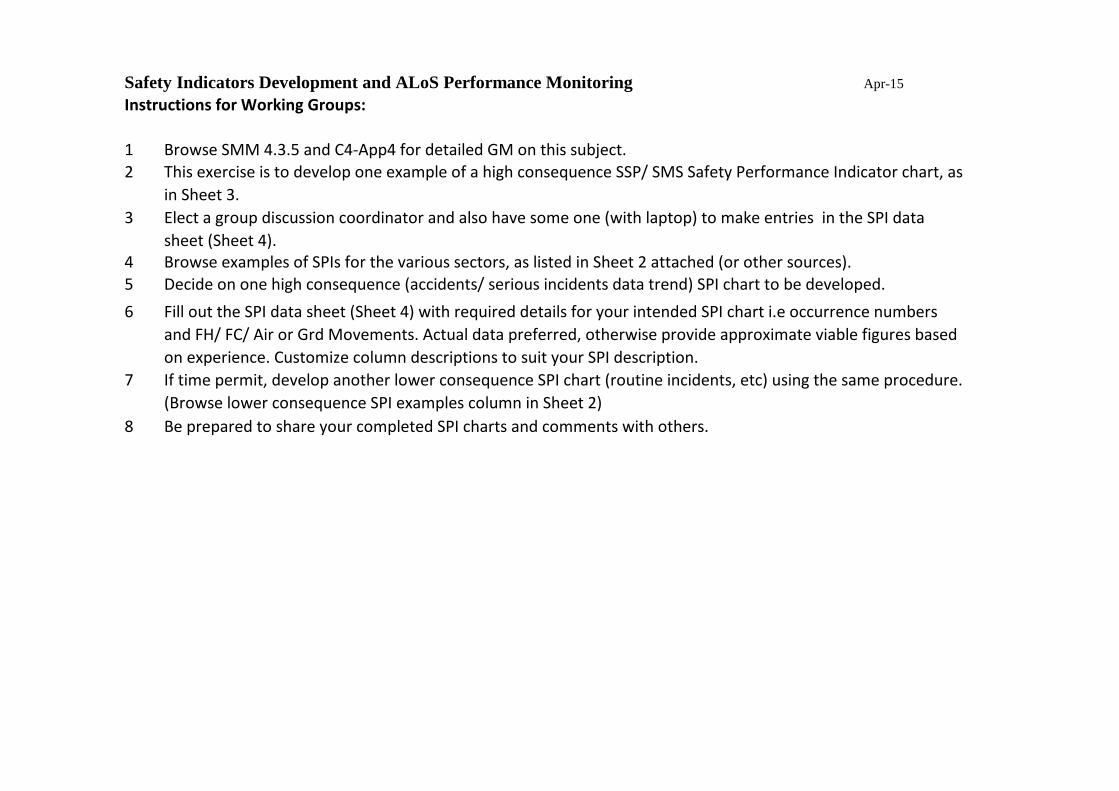
Safety Indicators Development and ALoS Performance Monitoring Apr-15Instructions for Working Groups:
1 Browse SMM 4.3.5 and C4-App4 for detailed GM on this subject. 2
3
456
7
8 Be prepared to share your completed SPI charts and comments with others.
This exercise is to develop one example of a high consequence SSP/ SMS Safety Performance Indicator chart, as in Sheet 3.Elect a group discussion coordinator and also have some one (with laptop) to make entries in the SPI data sheet (Sheet 4).Browse examples of SPIs for the various sectors, as listed in Sheet 2 attached (or other sources).Decide on one high consequence (accidents/ serious incidents data trend) SPI chart to be developed.Fill out the SPI data sheet (Sheet 4) with required details for your intended SPI chart i.e occurrence numbers and FH/ FC/ Air or Grd Movements. Actual data preferred, otherwise provide approximate viable figures based on experience. Customize column descriptions to suit your SPI description.If time permit, develop another lower consequence SPI chart (routine incidents, etc) using the same procedure. (Browse lower consequence SPI examples column in Sheet 2)

Safety Indicator Alert level criteria
Target level criteria Safety Indicator Alert level
criteriaTarget level
criteriaSafety Performance Indicator
Alert level criteria
Target level criteria
Safety Performance Indicator
Alert level criteria
Target level criteria
CAA aggregate Air Operators monthly serious incident rate (eg per 1000FH)
Ave + 1/2/3 SD. (annual or 2 yearly reset)
__% (eg 5%) improvement between each annual Mean Rate.
CAA aggregate Air Operator annual surveillance Audit LEI% or findings rate (findings per audit) Co
nside
ratio
n
Cons
idera
tion Air Operator Individual Fleet
monthly serious incident rate (eg per 1000FH)
Ave + 1/2/3 SD. (annual or 2 yearly reset)
__% (eg 5%) improvement between each annual Mean Rate.
Operator Combined Fleet monthly Incident rate (eg per 1000FH)
Ave + 1/2/3 SD. (annual or 2 yearly reset)
__% (eg 5%) improvement between each annual Mean Rate.
CAA aggregate Air Operators quarterly Engine IFSD incident rate (eg per 1000 FH)
Ave + 1/2/3 SD. (annual or 2 yearly reset)
__% (eg 5%) improvement between each annual Mean Rate.
CAA aggregate Air Operator annual Line Station Inspection LEI% or findings rate (findings per inspection) Co
nside
ratio
n
Cons
idera
tion Air Operator Combined Fleet
monthly serious incident rate (eg per 1000FH)
Ave + 1/2/3 SD. (annual or 2 yearly reset)
__% (eg 5%) improvement between each annual Mean Rate.
Operator Internal QMS annual audit LEI% or findings rate (findings per audit)
Cons
idera
tion
Cons
idera
tion
CAA aggregate Air Operators quarterly IFTB incident rate (eg per 1000 FH)
Ave + 1/2/3 SD. (annual or 2 yearly reset)
__% (eg 5%) improvement between each annual Mean Rate.
CAA annual Foreign Air Operators Ramp surveillance inspection Ave LEI% (for each Foreign Operator).
Cons
idera
tion
Cons
idera
tion Air Operator Engine IFSD
incident rate (eg per 1000 FH)Ave + 1/2/3 SD. (annual or 2 yearly reset)
__% (eg 5%) improvement between each annual Mean Rate.
Operator Voluntary Hazard reports rate [eg per 1000 FH]
Cons
idera
tion
Cons
idera
tion
CAA aggregate Operators' DGR incident reports rate [eg per 1000 FH]
Ave + 1/2/3 SD. (annual or 2 yearly reset)
__% (eg 5%) improvement between each annual Mean Rate.
Air Operator Air Turn Back (ATB, technical) incident rate (eg per 1000 FH)
Ave + 1/2/3 SD. (annual or 2 yearly reset)
__% (eg 5%) improvement between each annual Mean Rate.
Operator DGR incident reports rate [eg per 1000 FH]
Ave + 1/2/3 SD. (annual or 2 yearly reset)
__% (eg 5%) improvement between each annual Mean Rate.
ETC Air Operator RTO (high speed) incident rate (eg per 1000 FH)
Ave + 1/2/3 SD. (annual or 2 yearly reset)
__% (eg 5%) improvement between each annual Mean
Air Operators (Air Operators of the State only)
Aerodrome Operators
Examples of Safety Indicators (SSP) & Safety Performance Indicators (SMS) 6Mar14
SSP Safety Indicators (Aggregate State) SMS Safety Performance Indicators (Individual Service Provider)High Consequence Indicators (Occurrence/ Outcome-based)
Lower Consequence Indicators (Event/ Activity-based)
High Consequence Indicators (Occurrence/ Outcome-based)
Lower Consequence Indicators (Event/ Activity-based)

Safety Indicator Alert level criteria
Target level criteria Safety Indicator Alert level
criteriaTarget level
criteriaSafety Performance Indicator
Alert level criteria
Target level criteria
Safety Performance Indicator
Alert level criteria
Target level criteria
SSP Safety Indicators (Aggregate State) SMS Safety Performance Indicators (Individual Service Provider)High Consequence Indicators (Occurrence/ Outcome-based)
Lower Consequence Indicators (Event/ Activity-based)
High Consequence Indicators (Occurrence/ Outcome-based)
Lower Consequence Indicators (Event/ Activity-based)
CAA aggregate aerodromes quarterly ground accident/ serious incidents rate - involving any aircraft [eg per 10,000 ground movements]
Ave + 1/2/3 SD. (annual or 2 yearly reset)
__% (eg 5%) improvement between each annual Mean Rate.
CAA aggregate Aerodrome Operators annual surveillance Audit LEI% or findings rate (findings per audit)
Cons
idera
tion
Cons
idera
tion Aerodrome Operator quarterly
ground accident/ serious incident rate - involving any aircraft [eg per 10,000 ground movements]
Ave + 1/2/3 SD. (annual or 2 yearly reset)
__% (eg 5%) improvement between each annual Mean Rate.
Aerodrome Operator Internal QMS annual audit LEI% or findings rate (findings per audit)
Cons
idera
tion
Cons
idera
tion
CAA aggregate aerodromes monthly/ quarterly Runway Excursion incidents rate - involving any aircraft [eg per 10,000 departures]
Ave + 1/2/3 SD. (annual or 2 yearly reset)
__% (eg 5%) improvement between each annual Mean Rate.
Aerodromes Operator quarterly Runway Excursion incidents rate - involving any aircraft [eg per 10,000 departures]
Ave + 1/2/3 SD. (annual or 2 yearly reset)
__% (eg 5%) improvement between each annual Mean Rate.
Aerodrome Operator quarterly Runway Foreign Object Report (FOR) rate [eg per 10,000 ground movements] Co
nside
ratio
n
Cons
idera
tion
CAA aggregate aerodromes monthly/ quarterly Runway Incursion incidents rate - involving any aircraft [eg per 10,000 departures]
Ave + 1/2/3 SD. (annual or 2 yearly reset)
__% (eg 5%) improvement between each annual Mean Rate.
Aerodromes Operator quarterly Runway Incursion incidents rate - involving any aircraft [eg per 10,000 departures]
Ave + 1/2/3 SD. (annual or 2 yearly reset)
__% (eg 5%) improvement between each annual Mean Rate.
Operator Voluntary Hazard reports rate [per operational personnel per quarter]
Cons
idera
tion
Cons
idera
tion

Safety Indicator Alert level criteria
Target level criteria Safety Indicator Alert level
criteriaTarget level
criteriaSafety Performance Indicator
Alert level criteria
Target level criteria
Safety Performance Indicator
Alert level criteria
Target level criteria
SSP Safety Indicators (Aggregate State) SMS Safety Performance Indicators (Individual Service Provider)High Consequence Indicators (Occurrence/ Outcome-based)
Lower Consequence Indicators (Event/ Activity-based)
High Consequence Indicators (Occurrence/ Outcome-based)
Lower Consequence Indicators (Event/ Activity-based)
Aerodrome Operator quarterly aircraft ground Foreign Object Damage (FOD) incident report rate - involving damage to aircraft [eg per 10,000 ground movements]
Ave + 1/2/3 SD. (annual or 2 yearly reset)
__% (eg 5%) improvement between each annual Mean Rate.
ETC
CAA aggregate ATS quarterly FIR (airspace) serious incidents rate - involving any aircraft [eg per 100,000 flight movements]
Ave + 1/2/3 SD. (annual or 2 yearly reset)
__% (eg 5%) improvement between each annual Mean Rate.
CAA aggregate ATS quarterly FIR TCAS RA incidents rate - involving any aircraft [eg per 100,000 flight movements]
Ave + 1/2/3 SD. (annual or 2 yearly reset)
__% (eg 5%) improvement between each annual Mean Rate.
ATS provider quarterly FIR serious incidents rate - involving any aircraft [eg per 100,000 flight movements]
Ave + 1/2/3 SD. (annual or 2 yearly reset)
__% (eg 5%) improvement between each annual Mean Rate.
ATS Operator quarterly FIR TCAS RA incidents rate - involving any aircraft [eg per 100,000 flight movements]
Ave + 1/2/3 SD. (annual or 2 yearly reset)
__% (eg 5%) improvement between each annual Mean Rate.
CAA aggregate quarterly near miss incident rate [eg per 100,000 flight movements]
Ave + 1/2/3 SD. (annual or 2 yearly reset)
__% (eg 5%) improvement between each annual Mean Rate.
CAA aggregate ATS quarterly FIR Level Bust (LOS) incident rate - involving any aircraft [eg per 100,000 flight movements]
Ave + 1/2/3 SD. (annual or 2 yearly reset)
__% (eg 5%) improvement between each annual Mean Rate.
ATS provider quarterly/ annual near miss incident rate [eg per 100,000 flight movements]
Ave + 1/2/3 SD. (annual or 2 yearly reset)
__% (eg 5%) improvement between each annual Mean Rate.
ATS Operator quarterly FIR Level Bust (LOS) incident rate - involving any aircraft [eg per 100,000 flight movements]
Ave + 1/2/3 SD. (annual or 2 yearly reset)
__% (eg 5%) improvement between each annual Mean Rate.
CAA aggregate ATS Operators annual surveillance Audit LEI% or findings rate (findings per audit)
Cons
idera
tion
Cons
idera
tion ATS provider quarterly/ annual
GPWS/ EGPWS incident rate [eg per 100,000 flight movements]
Ave + 1/2/3 SD. (annual or 2 yearly reset)
__% (eg 5%) improvement between each annual Mean Rate.
ATS Operator Internal QMS annual audit LEI% or findings rate (findings per audit)
Cons
idera
tion
Cons
idera
tion
ATS Operators

Safety Indicator Alert level criteria
Target level criteria Safety Indicator Alert level
criteriaTarget level
criteriaSafety Performance Indicator
Alert level criteria
Target level criteria
Safety Performance Indicator
Alert level criteria
Target level criteria
SSP Safety Indicators (Aggregate State) SMS Safety Performance Indicators (Individual Service Provider)High Consequence Indicators (Occurrence/ Outcome-based)
Lower Consequence Indicators (Event/ Activity-based)
High Consequence Indicators (Occurrence/ Outcome-based)
Lower Consequence Indicators (Event/ Activity-based)
ETC
Other examples - Minimum Separation Infringement, Airspace infringement, Deviation from ATC clearance, Deviation from Airspace
CAA aggregate MRO quarterly Mandatory Defect Reports (MDR) received
Ave + 1/2/3 SD. (annual or 2 yearly reset)
__% (eg 5%) improvement between each annual Mean Rate.
CAA aggregate MRO/ POA/ DOA annual surveillance Audit LEI% or findings rate (findings per audit) C
onsi
dera
tion
Con
side
ratio
n MRO/ POA quarterly rate of component technical warranty claims.
Ave + 1/2/3 SD. (annual or 2 yearly reset)
__% (eg 5%) improvement between each annual Mean Rate.
MRO/ POA/ DOA Internal QMS annual audit LEI% or findings rate (findings per audit).
Con
side
ratio
n
Con
side
ratio
n
CAA aggregate POA/ DOA quarterly rate of operational products which are subject of Airworthiness Directives (ADs) [per product line]
Con
side
ratio
n
Con
side
ratio
n MRO/ POA quarterly rate of component Mandatory/ Major Defect Reports raised.
Con
side
ratio
n
Con
side
ratio
n MRO/ POA/ DOA quarterly final inspection/ testing failure/ rejection rate
Con
side
ratio
n
Con
side
ratio
n
MRO/ POA/ DOA Voluntary Hazard reports rate [per operational personnel per quarter]
Con
side
ratio
n
Con
side
ratio
n
ETC
POA/ DOA/ MRO Organizations
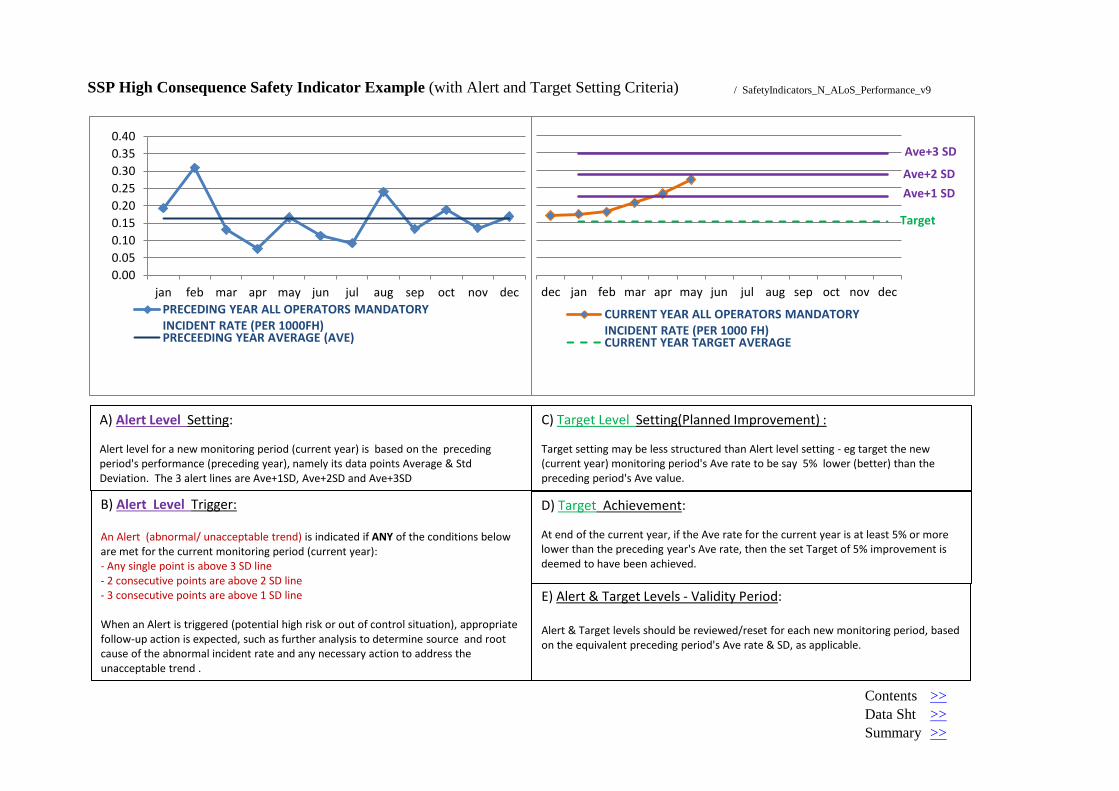
SSP High Consequence Safety Indicator Example (with Alert and Target Setting Criteria) / SafetyIndicators_N_ALoS_Performance_v9
Contents >>Data Sht >>Summary >>
0.000.050.100.150.200.250.300.350.40
jan feb mar apr may jun jul aug sep oct nov decPRECEDING YEAR ALL OPERATORS MANDATORY INCIDENT RATE (PER 1000FH) PRECEEDING YEAR AVERAGE (AVE)
Ave+1 SD Ave+2 SD
Ave+3 SD
Target
dec jan feb mar apr may jun jul aug sep oct nov dec
CURRENT YEAR ALL OPERATORS MANDATORY INCIDENT RATE (PER 1000 FH) CURRENT YEAR TARGET AVERAGE
B) Alert Level Trigger: An Alert (abnormal/ unacceptable trend) is indicated if ANY of the conditions below are met for the current monitoring period (current year): - Any single point is above 3 SD line - 2 consecutive points are above 2 SD line - 3 consecutive points are above 1 SD line When an Alert is triggered (potential high risk or out of control situation), appropriate follow-up action is expected, such as further analysis to determine source and root cause of the abnormal incident rate and any necessary action to address the unacceptable trend .
A) Alert Level Setting: Alert level for a new monitoring period (current year) is based on the preceding period's performance (preceding year), namely its data points Average & Std Deviation. The 3 alert lines are Ave+1SD, Ave+2SD and Ave+3SD
E) Alert & Target Levels - Validity Period: Alert & Target levels should be reviewed/reset for each new monitoring period, based on the equivalent preceding period's Ave rate & SD, as applicable.
C) Target Level Setting(Planned Improvement) : Target setting may be less structured than Alert level setting - eg target the new (current year) monitoring period's Ave rate to be say 5% lower (better) than the preceding period's Ave value.
D) Target Achievement: At end of the current year, if the Ave rate for the current year is at least 5% or more lower than the preceding year's Ave rate, then the set Target of 5% improvement is deemed to have been achieved.

SSP High Consequence Safety Indicator Example (with Alert and Target Setting Criteria)
Mth
All Operators Total FH
All Operators Mandatory Incidents
Incident Rate*
Ave (line) Mth
All Operators Total FH
All Operators Mandatory Incidents
Incident Rate*
Preceding Year Ave
+1SD (line)
Preceding Year Ave
+2SD (line)
Preceding Year Ave
+3SD (line)jan 51,837 10.00 0.19 0.16 dec 53006 9.00 0.17feb 48,406 15.00 0.31 0.16 jan 51635 9.00 0.17 0.23 0.29 0.35 0.15mar 53,354 7.00 0.13 0.16 feb 44295 8 0.18 0.23 0.29 0.35 0.15apr 52,513 4.00 0.08 0.16 mar 48323 10 0.21 0.23 0.29 0.35 0.15may 54,037 9.00 0.17 0.16 apr 47176 11 0.23 0.23 0.29 0.35 0.15jun 52,673 6.00 0.11 0.16 may 47469 13 0.27 0.23 0.29 0.35 0.15jul 54,086 5.00 0.09 0.16 jun 0.23 0.29 0.35 0.15aug 54,043 13.00 0.24 0.16 jul 0.23 0.29 0.35 0.15sep 52,383 7.00 0.13 0.16 aug 0.23 0.29 0.35 0.15oct 53,042 10.00 0.19 0.16 sep 0.23 0.29 0.35 0.15nov 51,353 7.00 0.14 0.16 oct 0.23 0.29 0.35 0.15dec 53,006 9.00 0.17 0.16 nov 0.23 0.29 0.35 0.15
Ave 0.16 dec 0.23 0.29 0.35 0.15SD 0.06
Ave+1SD Ave+2SD Ave+3SD * Rate Calculation:( per 1000 FH) SPI Chart >>>0.23 0.29 0.35 Contents >>>
ALoSP >>>
Current Year
Target (line)
Preceding Year Current year
Current Year Alert Level setting criteria is: Preceding Year Ave + 1/2/3 SD
Current Year Target is say 5% Ave rate improvement over the Ave rate for the
preceding year, which is:0.15
Current Year Alert Levels

SI Alert Level/ Criteria (for 2010)
Alert level Not Breached [Yes/ No]
SI Target level/ criteria (for 2010)
Target Achieved [Yes/ No]
1 CAA aggregate Air Operators monthly accident/ serious incident rate [per 1000 FH]
2009 Average Rate + 1/2/3 SD. (annual reset)
Y
5 % improvement of the 2010 Average Rate over the 2009 Average Rate.
N
2 CAA aggregate Aerodromes monthly ground accident/ serious incidents rate - involving any aircraft [per 10,000 ground movements]
2009 Average Rate + 1/2/3 SD. (annual reset)
Y
3 % improvement of the 2010 Average Rate over the 2009 Average Rate.
Y
3 CAA aggregate ATS monthly FIR serious incidents rate - involving any aircraft [per 100,000 air movements]
2009 Average Rate + 1/2/3 SD. (annual reset)
N
4 % improvement of the 2010 Average Rate over the 2009 Average Rate.
N
SI Alert Level/ Criteria (for 2010)
Alert level Not Breached [Yes/ No]
SI Target level/ criteria (for 2010)
Target Achieved [Yes/ No]
CAA aggregate Air Operators Organization annual surveillance/ audit outcomes
>25% Average LEI; OR any level 1 finding; OR >5 level 2 findings per audit
Y<10% Average LEI; AND <1 level 2 finding per audit
N
CAA annual Air Operator Line Station surveillance inspection Ave LEI% (for each Operator).
>25% Average LEI; OR any level 1 finding; OR >5 level 2 findings per audit
Y <10% Average LEI Y
CAA annual Foreign Air Operators Ramp sampling inspection program.
>25% Average LEI; OR any level 1 finding; OR >5 level 2 findings per audit; OR <25% of Foreign Operators inspected
YNot less than 50% of Foreign Operators to be inspected
N
CAA aggregate Aerodrome Operators Organization annual surveillance/ audit outcomes
>25% Average LEI; OR any level 1 finding; OR >5 level 2 findings per audit
N<10% Average LEI; AND <1 level 2 finding per audit
N
Example: State "X" SSP ALoS Performance Summary (say for Year 2010)High Consequence Safety Indicators
Safety Indicator (SI) Description
Lower Consequence Safety Indicators
Safety Indicator (SI) Description

SI Alert Level/ Criteria (for 2010)
Alert level Not Breached [Yes/ No]
SI Target level/ criteria (for 2010)
Target Achieved [Yes/ No]
Lower Consequence Safety Indicators
Safety Indicator (SI) Description
CAA aggregate ATS Operators Organization annual surveillance/ audit outcomes
>25% Average LEI; OR any level 1 finding; OR >5 level 2 findings per audit
Y<10% Average LEI; AND <1 level 2 finding per audit
Y
CAA aggregate ATS quarterly FIR TCAS RA incidents rate - involving any aircraft [per 10,000 flight movements]
2009 Average Rate + 1/2/3 SD. (annual reset)
Y
5 % improvement of the 2010 Average Rate over the 2009 Average Rate.
N
CAA aggregate D&M/ MRO Organization annual surveillance/ audit outcomes
>25% Average LEI; OR any level 1 finding; OR >5 level 2 findings per audit
Y<10% Average LEI; AND <1 level 2 finding per audit
Y
CAA aggregate AMO (MRO) quarterly rate of component warranty claims due to (Major) technical defects.
2009 Average Rate + 1/2/3 SD. (annual reset)
N
5 % improvement of the 2010 Average Rate over the 2009 Average Rate.
N
Note 1: Other Process Indicators - Apart from above SSP level Safety Indicators, there may be other systems level indicators within each operational areas. Examples would include process or system-specific monitoring indicators in AIR, OPS, AGA etc or indicators associated with performance-based programs such as fatigue risk management or fuel management. Such process or system-specific indicators should rightly be administered as part of the system or process concerned. They may be viewed as specific system or process level indicators which undergird the higher level SSP monitoring safety indicators. They should be addressed within the respective system or process manuals/ SOPs as appropriate. Nevertheless, the criteria for setting alert or target levels for such indicators could preferably be aligned with that of the SSP level safety indicators where applicable.
Note 2: Selection of Indicators & Settings - The combination (or package) of High and Lower Consequence Safety Indicators is to be selected by a State according to the scope of their aviation system. For those Indicators where the suggested Alert or Target levels setting criteria is not applicable, the State may consider any alternate criteria as appropriate. General guidance is to set Alerts and Targets that take into consideration recent historical or current performance.

SI Alert Level/ Criteria (for 2010)
Alert level Not Breached [Yes (4), No (0)]
SI Target level/ criteria (for 2010)
Target Achieved [Yes (3), No (0)]
1 CAA aggregate Air Operators monthly accident/ serious incident rate [per 1000 FH]
2009 Average Rate + 1/2/3 SD. (annual reset)
4
5 % improvement of the 2010 Average Rate over the 2009 Average Rate.
0
2 CAA aggregate Aerodromes monthly ground accident/ serious incidents rate - involving any aircraft [per 10,000 ground movements]
2009 Average Rate + 1/2/3 SD. (annual reset)
4
3 % improvement of the 2010 Average Rate over the 2009 Average Rate.
3
3 CAA aggregate ATS monthly FIR serious incidents rate - involving any aircraft [per 100,000 air movements]
2009 Average Rate + 1/2/3 SD. (annual reset)
0
4 % improvement of the 2010 Average Rate over the 2009 Average Rate.
0
Sub-total 8 Sub-total 3Max 12 Max 9
SI Alert Level/ Criteria (for 2010)
Alert level Not Breached [Yes (2), No (0)]
SI Target level/ criteria (for 2010)
Target Achieved [Yes (1), No (0)]
CAA aggregate Air Operators Organization annual surveillance/ audit outcomes
>25% Average LEI; OR any level 1 finding; OR >5 level 2 findings per audit
2<10% Average LEI; AND <1 level 2 finding per audit
0
CAA annual Air Operator Line Station surveillance inspection Ave LEI% (for each Operator).
>25% Average LEI; OR any level 1 finding; OR >5 level 2 findings per audit
2 <10% Average LEI 1
CAA annual Foreign Air Operators Ramp sampling inspection program.
>25% Average LEI; OR any level 1 finding; OR >5 level 2 findings per audit; OR <25% of Foreign Operators inspected
2Not less than 50% of Foreign Operators to be inspected
0
CAA aggregate Aerodrome Operators Organization annual surveillance/ audit outcomes
>25% Average LEI; OR any level 1 finding; OR >5 level 2 findings per audit
0<10% Average LEI; AND <1 level 2 finding per audit
0
Example: State "X" SSP ALoS Performance Measurement (say for Year 2010)
Safety Indicator (SI) Description
Lower Consequence Safety Indicators
Safety Indicator (SI) Description
High Consequence Safety Indicators

CAA aggregate ATS Operators Organization annual surveillance/ audit outcomes
>25% Average LEI; OR any level 1 finding; OR >5 level 2 findings per audit
2<10% Average LEI; AND <1 level 2 finding per audit
1
CAA aggregate ATS quarterly FIR TCAS RA incidents rate - involving any aircraft [per 10,000 flight movements]
2009 Average Rate + 1/2/3 SD. (annual reset)
2
5 % improvement of the 2010 Average Rate over the 2009 Average Rate.
0
CAA aggregate D&M/ MRO Organization annual surveillance/ audit outcomes
>25% Average LEI; OR any level 1 finding; OR >5 level 2 findings per audit
2<10% Average LEI; AND <1 level 2 finding per audit
1
CAA aggregate AMO (MRO) quarterly rate of component warranty claims due to (Major) technical defects.
2009 Average Rate + 1/2/3 SD. (annual reset)
0
5 % improvement of the 2010 Average Rate over the 2009 Average Rate.
0
Sub-total 12 Sub-total 3Max 16 Max 8
No Alert % 71.4% Target Achieved % 35.3%57.8%
Note 4: Overall Score Interpretation - A SSP with 100% overall performance score implies that the SSP has achieved ALL Target Levels of its Safety Indicators as well as not breached ANY Alert levels of its Safety Indicators. Conversely, a SSP with 0% overall performance score implies that the SSP has not achieved ANY Target Levels of its Safety Indicators as well as having breached ALL Alert levels of its Safety Indicators.
Note 3: Weightage - Alert and Target scores between High and Lower Consequence indicators are weighted (4, 3, 2, 1) as indicated in the respective header columns. High consequence indicator "Alert Not Breached" has highest (4 pt) score whilst Lower consequence indicator "Target Achieved" has lowest (1 pt) score.
Note 2: Indicators & Settings - The combination (or package) of High and Lower Consequence Safety Indicators is to be selected by a State according to the scope of their aviation system. For those Indicators where the suggested Alert or Target levels setting criteria is not applicable, the State may consider any alternate criteria as appropriate. General guidance is to set Alerts and Targets that take into consideration recent historical or current performance
Note 1: Other Process Indicators - Apart from above SSP level Safety Indicators, there may be other systems level indicators within each operational areas. Examples would include process or system-specific monitoring indicators in AIR, OPS, AGA etc or indicators associated with performance-based programs such as fatigue risk management or fuel management. Such process or system-specific indicators should rightly be administered as part of the system or process concerned. They may be viewed as specific system or process level indicators which undergird the higher level SSP monitoring safety indicators. They should be addressed within the respective system or process manuals/ SOPs as appropriate. Nevertheless, the criteria for setting alert or target levels for such indicators should preferably be aligned with that of the SSP level safety indicators where applicable.
Overall ALoS Performance

1
SAFETY PERFORMANCE MEASUREMENT
- QUANTIFYING PERFORMANCE INDICATORS AND AN ACCEPTABLE LEVEL OF
SAFETY
Contents
1 INTRODUCTION .......................................................................................................................... 2
2 WHY MEASURE SAFETY PERFORMANCE ......................................................................... 2
3 HOW TO MEASURE SAFETY PERFORMANCE .................................................................. 2
4 ALERT LEVELS ........................................................................................................................... 5
5 ALERT TRIGGER ........................................................................................................................ 6
6 FOLLOW UP ACTIONS TO AN ALERT .................................................................................. 8
7 TARGET SETTING ...................................................................................................................... 8
8 SPI DATA TABLE AND CHART GENERATION ................................................................... 9
9 ALERT AND TARGET VALIDITY PERIOD ............................................................................ 9
10 WHAT SPIs PACKAGE DO WE NEED ............................................................................. 10
11 MEASURING PERFORMANCE OF A SSP- SMS SPIs PACKAGE ............................ 11
12 ACCEPTABLE LEVEL OF SAFETY PERFORMANCE.................................................. 12
13 CHARACTERISTICS OF AN EFFECTIVE AND VIABLE PACKAGE OF SPIs ......... 12
14 BENEFITS OF HARMONISED SAFETY PERFORMANCE MEASUREMENT. ......... 13
15 CONCLUSION ........................................................................................................................ 13

2
SAFETY PERFORMANCE MEASUREMENT – QUANTIFYING PERFORMANCE
INDICATORS AND AN ACCEPTABLE LEVEL OF SAFETY
1 INTRODUCTION
“Safety Performance Measurement” in the context of this paper essentially refers to the
process of measuring safety related outcomes associated with a given operational system or
organisation. Specifically, it is written in the context of today’s State Safety Programme (SSP)
and Safety Management System (SMS) environment.
2 WHY MEASURE SAFETY PERFORMANCE
Safety management Standards and Recommended Practices (SARPs) had been
progressively introduced by ICAO since 2001. The main framework of these safety
management SARPs are the SSP and SMS. Amongst other requirements, these safety
management provisions had introduced the expectation for States to achieve an acceptable
level of safety performance:
“Each State shall establish an SSP for the management of safety in the State, in order to
achieve an acceptable level of safety performance in civil aviation” – A19, 3.1.1
The active verb here is “to achieve”. It is a good thing that the next immediate clause says:
“The acceptable level of safety performance to be achieved shall be established by the State”
– A19, 3.1.2
So, that “level” which States are supposed to achieve is based on that which States are going
to establish themselves.
Objectively speaking, the expected bottom line (most onerous outcome) from these two
clauses can possibly result in a theoretical scenario like this:
“Show me (a safety management Auditor quoting A19, 3.1.1/ 2) whether you have
achieved (or not achieved) your acceptable level of safety performance. We will just take it
that your own quantum of acceptable level of safety performance (which has been
determined by your State) is reasonable. Now, just show me whether you have achieved it,
or not…”
Even if such a bottom-line question is not coming from your SSP or SMS auditor, any
discerning Accountable Executive or Safety Committee Chairman would probably ask anyway,
sooner or later.
It has been said “You cannot manage what you cannot measure” (Drucker). So, obviously we
must be able to manage and measure safety performance, before anyone can expect us to
achieve it (to whatever level)!
3 HOW TO MEASURE SAFETY PERFORMANCE
To achieve an acceptable level (or any level) of safety performance, an organization will firstly
need to establish a mechanism to measure its safety performance. After that, it will then

3
decide on what is that acceptable level of safety to be achieved, within a given monitoring
period.
Taking into consideration A19, 3.1.1 and 3.1.2 expectations, we will need to ensure a few
characteristics of the safety performance measurement mechanism and indicators which are
to be developed:
a) They should be quantitative and measurable.
b) They should be an expression of the safety performance status of the aviation system or
operational areas.
c) They should have provision for monitoring performance in relation to certain data-based
performance markers.
d) They should collectively be able to give a bottom line measurable performance status.
e) This bottom line performance status should be able to tell whether the planned acceptable
level of safety performance has been achieved or not, at the end of a monitoring period.
Now, do we need to start from scratch to search for such safety performance measurement
mechanisms or indicators? Apparently not. Some aviation quality management systems or
reliability control systems (especially large commercial air operators) have been traditionally
known to utilise technical or reliability related indicators to track the performance of specific
system processes. Examples include engine in-flight shut down rate, component failure rate,
technical delay rate, etc. Hence, the existence of such technical indicators is a good place to
start our appreciation of safety indicator models for SSP and SMS. Thus, within the large
commercial air operators and their AMO/ DMO1 sectors, development of SSP-SMS safety
indicators is a matter of starting with the adaptation of certain existing technical or reliability
related indicators to meet the higher level SSP-SMS expectations.
As for the other sectors of service provider (AGA. ANS, ATO, IGA2) where they may have no
prior experience with Reliability or Quality Control systems indicators; such may then need to
familiarise themselves with fundamental data trending charts for the purpose of developing
SSP-SMS safety performance indicators. Figures 1 and 2 provide an illustration of a common
basic data chart and a continuous data trending chart respectively.
Figure 1: A basic data analysis chart
1 AMO/ DMO – Approved Maintenance Organisation/ Design & Manufacturing Organisation 2 Aerodrome, Air Navigation Services, Approved Training Organisations, International General Aviation
Nu
mb
er
of
rep
ort
ab
le
(MO
R)
incid
en
ts
0.00
1.00
2.00
3.00
4.00
5.00
747-
400
A330
A320
B737
-300
A340
Beta Airline — Year 2009

4
Figure 2: A continuous trending chart
The two figures show a one-time status of reportable incidents for each aircraft type (Figure 1)
and a continuing incidents trending of the airline’s entire fleet (Figure 2). However, these two
charts cannot serve as SSP-SMS safety performance indicator candidates yet, because they
have no built-in performance measures – such as Alert and Target settings. Without such
safety metrics performance measuring pointers or markers, there is no provision for
interpretation and collation of the performance of each indicator (and ultimately the package of
indicators) at the end of a given monitoring period.
We need to convert the (otherwise) qualitative performance of a data trending chart into a
quantitative outcome, by means of measuring (counting) two key safety metrics markers –
Alert avoidance and Target achievement status. It is like interpreting the health of a patient by
just two key parameters – heart rate (low rate achievement) and blood pressure (high
pressure avoidance).
Thus, a safety performance indicator has to be more than just a basic data chart, more than
just a continuous data trending chart. It must have the capability for building in planned
Targets to be achieved as well as Alert levels to be avoided. These two complementary and
parallel markers will then serve to transform a common data trending chart into a safety
performance indicator. By means of these two observable and countable markers, the
performance of a safety indicator is made quantifiable. This quantification process (at end of
monitoring period) is achieved by asking two basic questions:
1) Has the indicator breached its Alert level? [Yes/ No] and
2) Has the indicator achieved its planned Target performance level? [Yes/ No]
These two safety metrics performance markers are somewhat like those little built-in green
pips and red warning flags within the various indicators in an aircraft cockpit. They will serve to
tell the pilot whether he has not achieved his Target EPR3 (required power) or whether he has
an EGT4 Alert (potential engine fire) during his takeoff run; either of which event can mean
aborting the takeoff altogether. These aircraft systems safety indicators are the origin of this
3 EPR – Engine Pressure Ratio 4 EGT – Exhaust Gas Temperature
0.00
Jan Feb Mar Apr May June July Aug Sept Oct Nov Dec
2009 Alpha Airline monthly reportable
incident rate (per 1 000 FH)
0.10
0.20
0.30
0.40
0.50
0.60
0.70
0.80

5
terminology that we use for our SSP-SMS safety performance measurement mechanism
today.
4 ALERT LEVELS
Besides serving as one of the two data trending performance quantifiers, an alert level is
fundamentally the caution light or alarm bell of a Safety Performance Indicator (SPI). Its
common safety metrics terminology is called “Out of Control Criteria (OCC)5”. Breaching an
Alert level implies that a data set has trended into an abnormal/undesirable region (in relation
to its historical performance). In the case of a safety (occurrences) indicator it would mean an
abnormal escalation of the occurrence type being tracked, implying a high risk situation of
subsequent “out of control” occurrence rates. The determination of such an Alert boundary or
level is associated with the recent historical data trending behaviour of the same indicator. The
rationale for this is to ensure that a safety indicator’s current Alert setting has taken into
consideration its own recent historical performance or behaviour. The historical data
performance is specifically measured by means of two characteristics of the historical data set:
a) Average value, and
b) Standard Deviation (SD) value
From these two values (Average and SD), the Alert level for the current (or next) monitoring
period of the safety indicator chart is derived and plotted as follows:
1) Average + 1 SD,
2) Average + 2 SD, and
3) Average + 3 SD
Figure 3 depicts the typical three Alert level lines as derived from the above three [Average +
1/ 2/ 3 SD] values. The “Preceding Year” is the historical data set whilst the “Current Year” is
where the three Alert lines have been plotted, based on the preceding data set.
Figure 3: Alert levels based on historical Average and SD values6
The formula for calculating SD value (part of most spread sheet software, eg Excel) is
“=STDEVP”.
For manual calculation purpose, the SD (Population) formula is:
5 Safety Metrics by Christopher A. Janicak, OCC - pg 47 6 Figure 3 is an extract from ICAO SMM Doc 9859 (3rd Ed, 2013), pg 4-App 4-7
6
√∑
where “x” is the value of each data point, “N” is the number of data points and “µ” is the
average value of all the data points.
A SD is the average deviation of the data set’s collective individual deviations from their Mean.
Hence, if a data set is highly volatile (large deviations), its SD value will be greater than if the
data set was less volatile (smaller deviations). This SD value is the key to our Alert setting
criteria, as it is a volatility measure of the preceding data set. This SD value will automatically
adjust the value and spacing of the 3 Alert lines based on the preceding data’s behaviour.
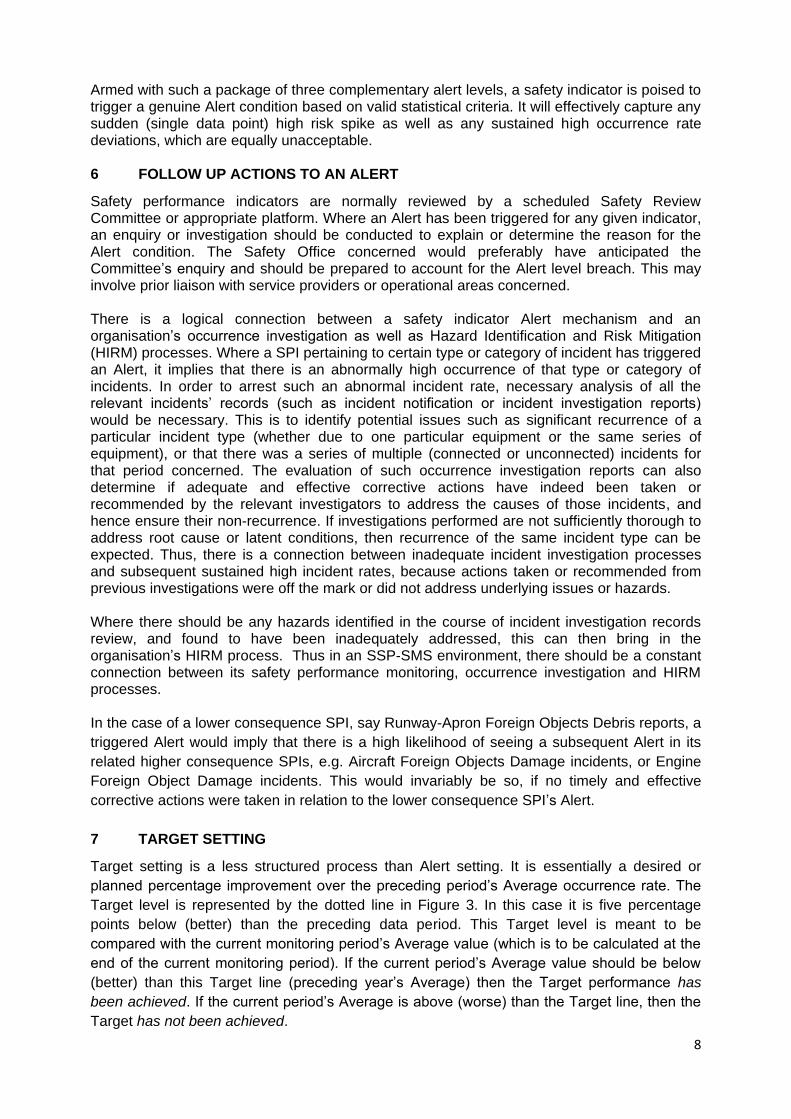
A manual calculation illustration is as follows:
Consider a data set consisting of the following eight values:
These eight data points have the average (mean) of 5:
To calculate the SD (Population), first calculate the difference of each data point from the average, and square the result of each:
Next, calculate the average of these values, and take the square root:
Hence, the SD (Population) for the above illustrative eight values is 2
5 ALERT TRIGGER
An Alert (abnormal/ unacceptable trend) is indicated if ANY of the conditions below are met for the current monitoring period:
a) Any single point is above [Average + 3 SD] line
b) 2 (or more) consecutive points are above [Average + 2 SD] line
c) 3 (or more) consecutive points are above Average + 1 SD] line
These three separate Alert lines establish an equitable criteria to ensure that only a valid Alert situation is captured as such.

7
Criteria (a) captures a situation where a single data point has exceeded the previous Average deviation (from the Mean value) by more than three times. In other words, the occurrence rate during the data point update period (one month, in the case of Figure 3) is more than three times the historical Average deviation (from the Average value). This is obviously unacceptable and hence warrants an Alert to be triggered, even though only one data point is involved. Criteria (b) and (c) are complementary graduated Alert levels to capture a relatively lower quantum of data point deviation beyond the 2 standard deviation and 1 standard deviation Alert levels respectively. In conjunction with their respective lower deviation quantum, the (b) and (c) Alert conditions of “2 (or more) consecutive points” and “3 (or more) consecutive points” are hence provided for. Refer Fig 4 below for an illustration of these 3 Alert conditions.
Figure 4-1, Alert (a):Single point above 3 SD
Figure 4-2, Alert (b):Two (or more) consecutive points above 2 SD
Figure 4-3, Alert (c):Three (or more) consecutive points above 1 SD
8
Armed with such a package of three complementary alert levels, a safety indicator is poised to trigger a genuine Alert condition based on valid statistical criteria. It will effectively capture any sudden (single data point) high risk spike as well as any sustained high occurrence rate deviations, which are equally unacceptable. 6 FOLLOW UP ACTIONS TO AN ALERT
Safety performance indicators are normally reviewed by a scheduled Safety Review Committee or appropriate platform. Where an Alert has been triggered for any given indicator, an enquiry or investigation should be conducted to explain or determine the reason for the Alert condition. The Safety Office concerned would preferably have anticipated the Committee’s enquiry and should be prepared to account for the Alert level breach. This may involve prior liaison with service providers or operational areas concerned. There is a logical connection between a safety indicator Alert mechanism and an organisation’s occurrence investigation as well as Hazard Identification and Risk Mitigation (HIRM) processes. Where a SPI pertaining to certain type or category of incident has triggered an Alert, it implies that there is an abnormally high occurrence of that type or category of incidents. In order to arrest such an abnormal incident rate, necessary analysis of all the relevant incidents’ records (such as incident notification or incident investigation reports) would be necessary. This is to identify potential issues such as significant recurrence of a particular incident type (whether due to one particular equipment or the same series of equipment), or that there was a series of multiple (connected or unconnected) incidents for that period concerned. The evaluation of such occurrence investigation reports can also determine if adequate and effective corrective actions have indeed been taken or recommended by the relevant investigators to address the causes of those incidents, and hence ensure their non-recurrence. If investigations performed are not sufficiently thorough to address root cause or latent conditions, then recurrence of the same incident type can be expected. Thus, there is a connection between inadequate incident investigation processes and subsequent sustained high incident rates, because actions taken or recommended from previous investigations were off the mark or did not address underlying issues or hazards.
Where there should be any hazards identified in the course of incident investigation records review, and found to have been inadequately addressed, this can then bring in the organisation’s HIRM process. Thus in an SSP-SMS environment, there should be a constant connection between its safety performance monitoring, occurrence investigation and HIRM processes. In the case of a lower consequence SPI, say Runway-Apron Foreign Objects Debris reports, a
triggered Alert would imply that there is a high likelihood of seeing a subsequent Alert in its
related higher consequence SPIs, e.g. Aircraft Foreign Objects Damage incidents, or Engine
Foreign Object Damage incidents. This would invariably be so, if no timely and effective
corrective actions were taken in relation to the lower consequence SPI’s Alert.
7 TARGET SETTING
Target setting is a less structured process than Alert setting. It is essentially a desired or
planned percentage improvement over the preceding period’s Average occurrence rate. The
Target level is represented by the dotted line in Figure 3. In this case it is five percentage
points below (better) than the preceding data period. This Target level is meant to be
compared with the current monitoring period’s Average value (which is to be calculated at the
end of the current monitoring period). If the current period’s Average value should be below
(better) than this Target line (preceding year’s Average) then the Target performance has
been achieved. If the current period’s Average is above (worse) than the Target line, then the
Target has not been achieved.

9
There should be an objective rationale for determining the Target quantum of a given SPI,
whether it should be 1%, 5% or 10%. Primarily, it should be correlated to the nature, scope
and aggressiveness of actions taken or planned with regard to the purpose of improving the
safety and reliability performance of the operational process underlying that SPI.
8 SPI DATA TABLE AND CHART GENERATION
In order to generate a SPI trending chart shown in Figure 3, it will be necessary to collate and
annotate the preceding and current data sets on an Excel spreadsheet shown in Figure 5
below:
SSP High Consequence Safety Indicator Example (with Alert and Target Setting Criteria)
Mth
All
Operators
Total FH
All
Operators
Incidents
Incident
Rate*
Ave
(line) Mth
All
Operators
Total FH
All
Operators
Incidents
Incident
Rate*
Preceding
Year Ave
+1SD (line)
Preceding
Year Ave
+2SD (line)
Preceding
Year Ave
+3SD (line)
jan 51,837 10.00 0.19 0.16 dec 53006 9.00 0.17
feb 48,406 15.00 0.31 0.16 jan 51635 9.00 0.17 0.23 0.29 0.35 0.15
mar 53,354 7.00 0.13 0.16 feb 44295 11 0.25 0.23 0.29 0.35 0.15
apr 52,513 4.00 0.08 0.16 mar 48323 13 0.27 0.23 0.29 0.35 0.15
may 54,037 9.00 0.17 0.16 apr 47176 13 0.28 0.23 0.29 0.35 0.15
jun 52,673 6.00 0.11 0.16 may 47469 13 0.27 0.23 0.29 0.35 0.15
jul 54,086 5.00 0.09 0.16 jun 0.23 0.29 0.35 0.15
aug 54,043 13.00 0.24 0.16 jul 0.23 0.29 0.35 0.15
sep 52,383 7.00 0.13 0.16 aug 0.23 0.29 0.35 0.15
oct 53,042 10.00 0.19 0.16 sep 0.23 0.29 0.35 0.15
nov 51,353 7.00 0.14 0.16 oct 0.23 0.29 0.35 0.15
dec 53,006 9.00 0.17 0.16 nov 0.23 0.29 0.35 0.15
Ave 0.16 dec 0.23 0.29 0.35 0.15
SD 0.06
* Rate Calculation:( per 1000 FH)
Ave+1SD Ave+2SD Ave+3SD * Rate Calculation:( per 1000 FH)
0.23 0.29 0.35
Current
Year
Target
(line)
Preceding Year Current year
Current Year Alert Level setting criteria is:
Preceding Year Ave + 1/2/3 SD
Current Year Target is say 5% Ave rate
improvement over the Ave rate for the
preceding year, which is:
0.15
Current Year Alert Levels
Figure: 5 – SPI Data Table7
Such an Excel data sheet is to be annotated with all the necessary data pertaining to the SPI
concerned, namely its preceding and current period’s occurrence numbers, flight hours/ cycles/ movements as applicable. The required formulae for Average, standard deviation (STDEVP), Alert and Target settings are built-in as indicated. The completed table can then
generate the required SPI chart (Figure 3) automatically, with the Excel charting function. 9 ALERT AND TARGET VALIDITY PERIOD
Alert and Target settings are based on a SPI’s recent historical behaviour. With this rationale
in mind, it is apparent that Alert level and Target settings should be updated between
appropriate monitoring periods. This would be especially important where there has been
significant change in the volatility of past data sets (Higher SD value will result in bigger
margins in-between Alert lines and vice versa). Theoretically, Alert level and Target settings
can be recalculated at the end of each monitoring period, say yearly. However, this may not
be the case, depending on factors as the number of data points per monitoring period and the
volatility of those data points. Any major operational environment changes such as new
equipment or additional service providers may deserve a review of Alert levels, Targets or
7 Figure 4 is an extract from ICAO SMM Doc 9859 (3rd Ed, 2013), pg 4-App 4-8

10
even SPI validity. In any case, the validity of Alert levels and Target settings should preferably
not exceed the period of its related historical data points.
10 WHAT SPIs PACKAGE DO WE NEED
For the purpose of SSP-SMS safety performance measurement, an organisation will need to
distinguish a special package of strategic and pertinent safety performance indicators from
other normal business indicators. The normal business indicators or key performance
indicators (KPIs) will continue to be maintained by the organisation for its specific business
purposes and should not be mixed with their SSP-SMS SPIs. The fundamental reason is that
SSP-SMS interaction expects the service provider’s SMS SPIs to be congruent to the SSP
SPIs and hence be subject to the civil aviation authority’s agreement and oversight. Thus, a
service provider’s SMS documentation should address its specific SMS SPIs only.
Selection of a package of SSP-SMS SPIs should be preceded by collating a list of all the
organisation’s existing indicators (including any technical or reliability indicators and KPIs).
Such a document will afford the SPIs selection team a good overview of what are the currently
available indicators and their respective data sources. An illustrative format for maintaining a
bank (tabulation) of potential SSP indicators is shown in Figure 5.
Safety IndicatorAlert level
criteria
Target level
criteria
Safety
Indicator
Alert level
criteria
Target level
criteriaSPI
Alert level
criteria
Target level
criteriaSPI
Alert level
criteria
Target level
criteria
SSP Air Operators High
Consequence SPI No 1
Ave + 1/2/3 SD.
(annual or 2
yearly reset)
__% (eg 5%)
improvement between
each annual Mean Rate.
SSP Lower
Consequence SPI
No 1
Ave + 1/2/3 SD.
(annual or 2
yearly reset)
__% (eg 5%)
improvement
between each
annual Mean Rate.
Air Operator SMS High
Consequence SPI No 1
Ave + 1/2/3 SD.
(annual or 2
yearly reset)
__% (eg 5%)
improvement between
each annual Mean
Rate.
Air Operator SMS
Lower Consequence
SPI No 1
Ave + 1/2/3 SD.
(annual or 2
yearly reset)
__% (eg 5%)
improvement between
each annual Mean
Rate.
Etc
SSP Aerodromes High
Consequence SPI No 1
Ave + 1/2/3 SD.
(annual or 2
yearly reset)
__% (eg 5%)
improvement between
each annual Mean Rate.
SSP Aerodromes
Lower Consequence
SPI No 1
Ave + 1/2/3 SD.
(annual or 2
yearly reset)
__% (eg 5%)
improvement
between each
annual Mean Rate.
Aerodrome SMS High
Consequence SPI No 1
Ave + 1/2/3 SD.
(annual or 2
yearly reset)
__% (eg 5%)
improvement between
each annual Mean
Rate.
Aerodrome SMS
Lower Consequence
SPI No 1
Ave + 1/2/3 SD.
(annual or 2
yearly reset)
__% (eg 5%)
improvement between
each annual Mean
Rate.
Etc
SSP ATS High
Consequence SPI No 1
Ave + 1/2/3 SD.
(annual or 2
yearly reset)
__% (eg 5%)
improvement between
each annual Mean Rate.
SSP ATS Lower
Consequence SPI
No 1
Ave + 1/2/3 SD.
(annual or 2
yearly reset)
__% (eg 5%)
improvement
between each
annual Mean Rate.
ATS SMS High
Consequence SPI No 1
Ave + 1/2/3 SD.
(annual or 2
yearly reset)
__% (eg 5%)
improvement between
each annual Mean
Rate.
ATS SMS Lower
Consequence SPI No 1
Ave + 1/2/3 SD.
(annual or 2
yearly reset)
__% (eg 5%)
improvement between
each annual Mean
Rate.
Etc
SSP AMOs High
Consequence SPI No 1
Ave + 1/2/3 SD.
(annual or 2
yearly reset)
__% (eg 5%)
improvement between
each annual Mean Rate.
SSP AMOs Lower
Consequence SPI
No 1
Ave + 1/2/3 SD.
(annual or 2
yearly reset)
__% (eg 5%)
improvement
between each
annual Mean Rate.
AMO SMS High
Consequence SPI No 1
Ave + 1/2/3 SD.
(annual or 2
yearly reset)
__% (eg 5%)
improvement between
each annual Mean
Rate.
AMO SMS Lower
Consequence SPI No 1
Ave + 1/2/3 SD.
(annual or 2
yearly reset)
__% (eg 5%)
improvement between
each annual Mean
Rate.
Etc
Examples of Safety Indicators (SSP) & Safety Performance Indicators (SMS)
SSP Safety Indicators (Aggregate State) SMS Safety Performance Indicators (Individual Service Provider)
High Consequence Indicators
(Occurrence/ Outcome-based)
Lower Consequence Indicators
(Event/ Activity-based)
High Consequence Indicators
(Occurrence/ Outcome-based)
Lower Consequence Indicators
(Event/ Activity-based)
Air Operators
Aerodrome Operators
ATS Operators
POA/ DOA/ MRO Organizations
Other Aviation Sectors, etc
Figure 5: SPIs tabulation (collation) format8
A package of selected SPIs will need to include High consequence safety related outcome
indicators (accidents, serious/ mandatory incidents). This should then subsequently (later
phase) be supported by Lower consequence indicators (e.g. routine incidents, specific
process/ system/ area indicators, etc). Such High and Lower consequence SPIs are
sometimes termed as lagging and leading indicators. Thereafter, the organisation may also
consider supplementary indicators to monitor safety related organisational behaviour and
activity where appropriate.
8 Figure 5 is an adaptation from ICAO SMM (Doc 9859, 3rd Ed, 2013), pg 4-App 4-3

11
When considering the selection of supplementary behaviour and activity related indicators, an
organisation should well be aware of their constraints. These would include measurement or
quantification viability as well as the possibility of encouraging unwarranted activities or bias,
for the sake of attaining certain targets. Notwithstanding this, there is no doubt that adopting a
mechanism to measure, and hence encourage positive organisational behaviour or safety
culture is something which can be considered as a frontier behavioural SPI in a fully matured
SSP-SMS environment. Further discussion on such a possible organisational safety culture
(risk profile) measurement concept can be found in ICAO Safety Management Manual (SMM)
3rd edition (2013)9. If such an organisational risk profile (ORP) is adopted by a State, it can be
a comprehensive measurement of its service providers’ organisational risk profile. The
aggregate outcome from such an ORP measurement mechanism can then be a
comprehensive behaviour/ activity indicator, to supplement the primary SPIs.
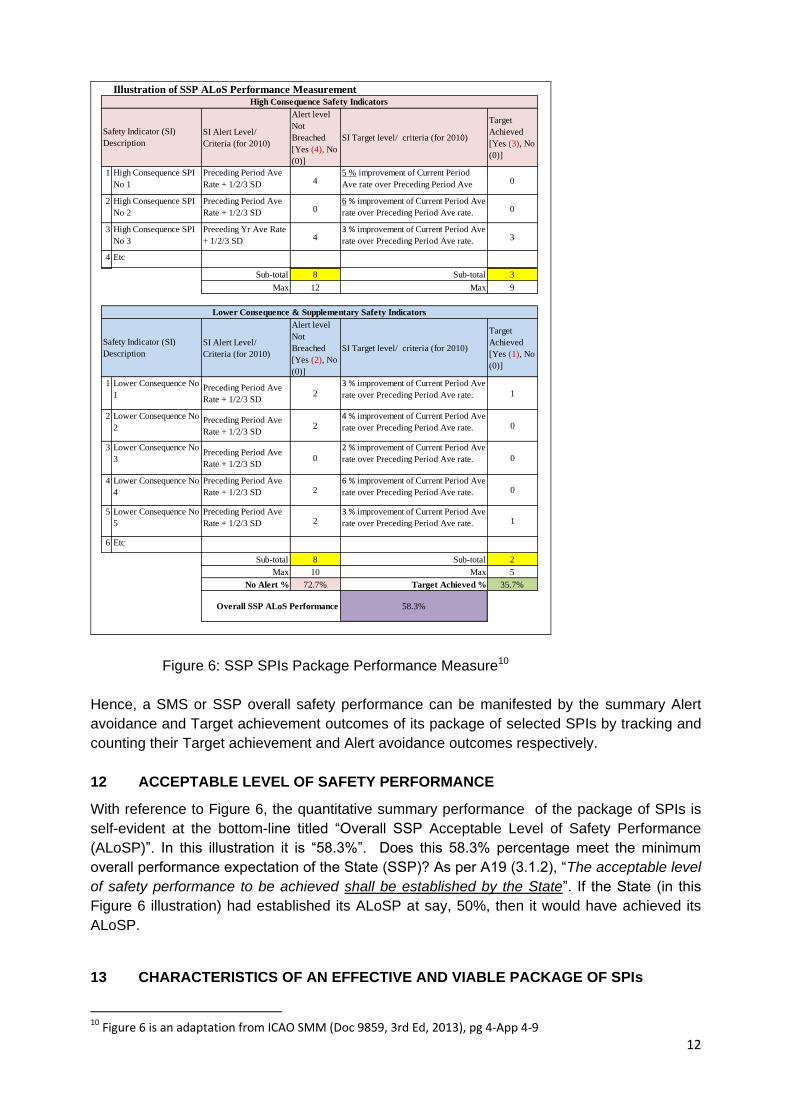
11 MEASURING PERFORMANCE OF A SSP- SMS SPIs PACKAGE
Once a package of selected SPIs is in place, their individual as well as summary performance
can be measured. The outcomes of each SPI’s Alert and Target markers can be in the form of
“YES/ NO” answers, or to be more quantitative, allocation of positive points for achievement of
a Target and avoidance of an Alert. The points system can facilitate weighting between High
consequence, Lower consequence and possibly supplementary indicators. An illustration of a
quantitative performance measure for a package of SSP SPIs is in Figure 6.
9 SMM Doc 9859 (3rd Ed, 2013), App 1 to Chapter 2
12
SI Alert Level/
Criteria (for 2010)
Alert level
Not
Breached
[Yes (4), No
(0)]
SI Target level/ criteria (for 2010)
Target
Achieved
[Yes (3), No
(0)]
1 High Consequence SPI
No 1
Preceding Period Ave
Rate + 1/2/3 SD 45 % improvement of Current Period
Ave rate over Preceding Period Ave
rate.
0
2 High Consequence SPI
No 2
Preceding Period Ave
Rate + 1/2/3 SD 06 % improvement of Current Period Ave
rate over Preceding Period Ave rate. 0
3 High Consequence SPI
No 3
Preceding Yr Ave Rate
+ 1/2/3 SD 43 % improvement of Current Period Ave
rate over Preceding Period Ave rate. 3
4 Etc
Sub-total 8 Sub-total 3
Max 12 Max 9
SI Alert Level/
Criteria (for 2010)
Alert level
Not
Breached
[Yes (2), No
(0)]
SI Target level/ criteria (for 2010)
Target
Achieved
[Yes (1), No
(0)]
1 Lower Consequence No
1Preceding Period Ave
Rate + 1/2/3 SD2
3 % improvement of Current Period Ave
rate over Preceding Period Ave rate. 1
2 Lower Consequence No
2Preceding Period Ave
Rate + 1/2/3 SD2
4 % improvement of Current Period Ave
rate over Preceding Period Ave rate. 0
3 Lower Consequence No
3Preceding Period Ave
Rate + 1/2/3 SD0
2 % improvement of Current Period Ave
rate over Preceding Period Ave rate. 0
4 Lower Consequence No
4
Preceding Period Ave
Rate + 1/2/3 SD 26 % improvement of Current Period Ave
rate over Preceding Period Ave rate. 0
5 Lower Consequence No
5
Preceding Period Ave
Rate + 1/2/3 SD 23 % improvement of Current Period Ave
rate over Preceding Period Ave rate. 1
6 Etc
Sub-total 8 Sub-total 2
Max 10 Max 5
No Alert % 72.7% Target Achieved % 35.7%
58.3%
Illustration of SSP ALoS Performance Measurement High Consequence Safety Indicators
Safety Indicator (SI)
Description
Lower Consequence & Supplementary Safety Indicators
Safety Indicator (SI)
Description
Overall SSP ALoS Performance
Figure 6: SSP SPIs Package Performance Measure10
Hence, a SMS or SSP overall safety performance can be manifested by the summary Alert
avoidance and Target achievement outcomes of its package of selected SPIs by tracking and
counting their Target achievement and Alert avoidance outcomes respectively.
12 ACCEPTABLE LEVEL OF SAFETY PERFORMANCE
With reference to Figure 6, the quantitative summary performance of the package of SPIs is
self-evident at the bottom-line titled “Overall SSP Acceptable Level of Safety Performance
(ALoSP)”. In this illustration it is “58.3%”. Does this 58.3% percentage meet the minimum
overall performance expectation of the State (SSP)? As per A19 (3.1.2), “The acceptable level
of safety performance to be achieved shall be established by the State”. If the State (in this
Figure 6 illustration) had established its ALoSP at say, 50%, then it would have achieved its
ALoSP.
13 CHARACTERISTICS OF AN EFFECTIVE AND VIABLE PACKAGE OF SPIs
10 Figure 6 is an adaptation from ICAO SMM (Doc 9859, 3rd Ed, 2013), pg 4-App 4-9

13
Some questions which an effective package of SPIs should be able to answer positively are
as follows:
a) Do we have a balanced package of safety indicators, measuring High and Lower
consequence safety/quality outcomes primarily?
b) Does each safety indicator have an objective high risk or undesirable trend Alert trigger
criteria?
c) Does each safety indicator have an objective (desired/ planned) Target setting criteria?
d) Would any of these indicators, by virtue of its target or alert settings, inadvertently result
in the creation of unexpected or unwarranted organisational activities or behaviour?
e) Does each safety indicator provide us with a continuous perspective of its current
trending in relation to its recent historical performance?
f) Do we have supplementary indicators measuring organisational safety-related behaviour
or activities which are pertinent to the organisation’s safety culture or risk profile
measurement?
g) Can our package of safety indicators provide us with a bottom line quantitative measure
of our overall organisation safety performance?
h) Will we be able to compare or benchmark the performance of our individual or package
of indicators internally or externally?
i) Are we able to account for the performance of an aggregate safety indicator to its
various individual contributing sources or service providers, when necessary?
14 BENEFITS OF HARMONISED SAFETY PERFORMANCE MEASUREMENT.
Some apparent benefits of adopting objective safety performance measurement mechanisms
as illustrated in this paper (which mechanism is also addressed in ICAO SMM 3rd Edition) are
as follows:
a) Much less subjectivity to the issue of “what is my acceptable level of safety performance”
b) Harmonised SPIs Alert and Target setting criteria based on objective safety metrics
principles.
c) No more plucking of an SPI Alert level out of thin air, or using a “grandfather” alert level.
d) Allow inter-organisation sharing/ benchmarking of SPI performance.
e) Facilitate the overall consolidated (bottom line) safety performance measure of a package
of SMS or SSP SPIs.
15 CONCLUSION
Employing basic safety metrics principles to monitor and measure safety performance is an
objective and reasonable way to go. Without an underlying SPIs quantification mechanism, an
organisation’s safety performance report may just consist of subjective accounts,
interpretations and promises.