
Safety Management for Electric Vehicle Batteries in...
11
EVS26 Los Angeles, California, May 6 - 9, 2012 Safety Management for Electric Vehicle Batteries in a Tropic Environment Nora Martiny 1 , Patrick Osswald 1 , Christian Huber 1 , Andreas Jossen 2 1 TUM CREATE Ltd., 62 Nanyang Drive, Blk N1.2, Level 1-28/29, Singapore 637459 [email protected] 2 Technical University of Munich (TUM), Institute for Electrical Energy Storage Technology Abstract To ensure the safety of a battery system certain measures can be employed. Monitoring the actual battery temperature is crucial to guarantee a safe use of the system while an optimized cooling system for the battery pack helps to improve the liability, prevent safety shut-offs and extend the battery’s lifetime. Additionally, possibilities to monitor the state of health of the battery on a longer time scale are necessary to avoid over-stretching the battery’s capability of storing energy on the one hand and to reduce investment costs on the other hand. This paper deals with different approaches to handle the battery temperature, especially under challenging tropical outside conditions. A temperature distribution model is developed and evaluated using combined data from a sensor matrix and an infrared camera. This method is used for real-time temperature measurements to investigate and monitor the temperature distribution on pouch cells. The simulation of different cooling systems is presented to show the need of a steady temperature distribution within a battery pack. The goal is to avoid excessive load on certain cells, which has a high impact on a safe use of the pack and reduces lifetime significantly. Finally, an approach to characterize the battery thermodynamically is presented. This is expected to be a useful tool to measure and monitor the state of health of a battery and first investigations are shown for different cell chemistries, performed on commercially available full cells. Keywords: battery, battery model, cooling, safety, thermal management 1 Introduction The design of customized energy storage sys- tems for electric vehicles (EVs) is a well- known problem. A highly limited driving range combined with high monetary costs, heavy weight and a time-consuming charging are only some of the challenges that need to be faced within the next years of battery re- search. In the last couple of months news about battery fire in vehicles or already dur- ing shipment have raised the attention to an even more critical topic: battery safety. A recent study issued by the U.S. Department of Transportation Federal Aviation Admin- istration names an average of about 27 % of accidents attributable to lithium battery fire out of all cargo airplane accidents predicted between 2011 and 2020 [1]. The Chevrolet Volt caught fire three weeks after a routine crash test which might have been caused by a coolant leak [2]. Among others, the previ- ously mentioned incidents demand different actions in the field of battery safety from re- searchers. The TUM CREATE Centre for Electro- mobility, Singapore, a joint research program EVS26 International Battery, Hybrid and Fuel Cell Electric Vehicle Symposium 1
Transcript of Safety Management for Electric Vehicle Batteries in...

EVS26Los Angeles, California, May 6 - 9, 2012
Safety Management for Electric Vehicle Batteries in
a Tropic Environment
Nora Martiny1, Patrick Osswald1, Christian Huber1, Andreas Jossen2
1TUM CREATE Ltd., 62 Nanyang Drive, Blk N1.2, Level 1-28/29, Singapore 637459
[email protected] University of Munich (TUM), Institute for Electrical Energy Storage Technology
Abstract
To ensure the safety of a battery system certain measures can be employed. Monitoring theactual battery temperature is crucial to guarantee a safe use of the system while an optimizedcooling system for the battery pack helps to improve the liability, prevent safety shut-offs andextend the battery’s lifetime. Additionally, possibilities to monitor the state of health of thebattery on a longer time scale are necessary to avoid over-stretching the battery’s capability ofstoring energy on the one hand and to reduce investment costs on the other hand.This paper deals with different approaches to handle the battery temperature, especially underchallenging tropical outside conditions. A temperature distribution model is developed andevaluated using combined data from a sensor matrix and an infrared camera. This methodis used for real-time temperature measurements to investigate and monitor the temperaturedistribution on pouch cells. The simulation of different cooling systems is presented to show theneed of a steady temperature distribution within a battery pack. The goal is to avoid excessiveload on certain cells, which has a high impact on a safe use of the pack and reduces lifetimesignificantly. Finally, an approach to characterize the battery thermodynamically is presented.This is expected to be a useful tool to measure and monitor the state of health of a battery andfirst investigations are shown for different cell chemistries, performed on commercially availablefull cells.
Keywords: battery, battery model, cooling, safety, thermal management
1 Introduction
The design of customized energy storage sys-tems for electric vehicles (EVs) is a well-known problem. A highly limited drivingrange combined with high monetary costs,heavy weight and a time-consuming chargingare only some of the challenges that need tobe faced within the next years of battery re-search. In the last couple of months newsabout battery fire in vehicles or already dur-ing shipment have raised the attention to aneven more critical topic: battery safety. Arecent study issued by the U.S. Department
of Transportation Federal Aviation Admin-istration names an average of about 27 % ofaccidents attributable to lithium battery fireout of all cargo airplane accidents predictedbetween 2011 and 2020 [1]. The ChevroletVolt caught fire three weeks after a routinecrash test which might have been caused bya coolant leak [2]. Among others, the previ-ously mentioned incidents demand differentactions in the field of battery safety from re-searchers.
The TUM CREATE Centre for Electro-mobility, Singapore, a joint research program
EVS26 International Battery, Hybrid and Fuel Cell Electric Vehicle Symposium 1
between Technical University of Munich(TUM), Germany, and Nanyang Technolo-gical University (NTU), Singapore, foundedby the Singaporean National Research Foun-dation (NRF), is dealing with all aspects ofelectromobility in an urban, tropic environ-ment. The research ranges from fundamentalinvestigations on new materials for batteriesover vehicle development up to infrastructureand mobility concepts.Talking about battery safety, the tropic en-vironment in Singapore with all-year averagetemperatures between 25 ◦C and 31 ◦C [3]makes temperature monitoring and activecooling systems even more crucial than forareas with moderate climate conditions.High temperatures deplete battery lifetimesignificantly and bear the risk of over-heatingand, in the worst case, a thermal runaway ofthe cell [4]. Reliable active cooling systemsfor the EV’s battery pack as well as perma-nent temperature monitoring are thereforerequired. The latter helps to recognize safetylacks in the cells at an early stage if activecooling systems fail or are not available.
Another important aspect concerning safetyis the state of health (SOH) of the batterycells. Typically, the internal resistanceincreases with the battery age, resulting in ahigher heat generation. This characteristichas to be taken into account for dimensioningthe battery management system properly.High currents and high temperatures duringoperation as well as inaccurate chargingalgorithms can lead to internal short-circuitsin the cells and can cause faster aging or athermal runaway in the worst case. Thismakes SOH determination a crucial safetyaspect. The author’s approach is to usedata gained from temperature and opencircuit voltage monitoring to determine theSOH of the single cells within a battery pack.
The remainder of this paper is organized asfollows: In section 2 the used cell is describedand monitoring techniques together with a 2-dimensional approximation for the tempera-ture distribution on the selected cell are pre-sented. Section 3 evaluates and compares dif-ferent active cooling systems for an EV’s bat-tery pack, while section 4 introduces thermo-dynamic measurement on batteries which isconsidered to be a valuable tool for batterystate determination. The authors finally con-clude the paper in section 5 and give a shortoutlook on next steps.
2 Temperature Measure-ment
In order to gain information on temperaturedistribution and thermal behavior of Li-Ioncells, temperature monitoring needs to be
150
Sensor 1 Sensor 3 Sensor 4
Sensor 8
Sensor 7Sensor 2
Sensor 5 Sensor 6
335
67
99
131
49 37
Al(mm)
B
0
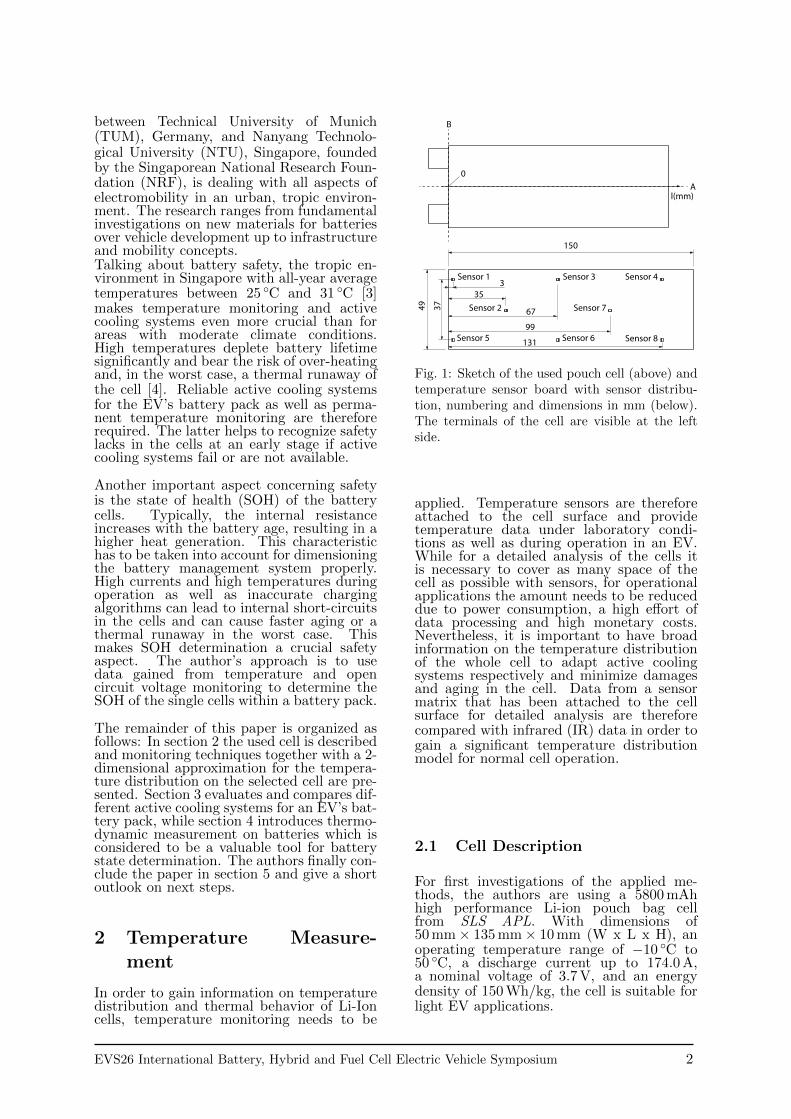
Fig. 1: Sketch of the used pouch cell (above) andtemperature sensor board with sensor distribu-tion, numbering and dimensions in mm (below).The terminals of the cell are visible at the leftside.
applied. Temperature sensors are thereforeattached to the cell surface and providetemperature data under laboratory condi-tions as well as during operation in an EV.While for a detailed analysis of the cells itis necessary to cover as many space of thecell as possible with sensors, for operationalapplications the amount needs to be reduceddue to power consumption, a high effort ofdata processing and high monetary costs.Nevertheless, it is important to have broadinformation on the temperature distributionof the whole cell to adapt active coolingsystems respectively and minimize damagesand aging in the cell. Data from a sensormatrix that has been attached to the cellsurface for detailed analysis are thereforecompared with infrared (IR) data in order togain a significant temperature distributionmodel for normal cell operation.
2.1 Cell Description
For first investigations of the applied me-thods, the authors are using a 5800 mAhhigh performance Li-ion pouch bag cellfrom SLS APL. With dimensions of50 mm × 135 mm × 10 mm (W x L x H), anoperating temperature range of −10 ◦C to50 ◦C, a discharge current up to 174.0 A,a nominal voltage of 3.7 V, and an energydensity of 150 Wh/kg, the cell is suitable forlight EV applications.
EVS26 International Battery, Hybrid and Fuel Cell Electric Vehicle Symposium 2

Fig. 2: Dynamic temperature distribution mea-sured with a matrix of eight TMP112 sensors dur-ing a 12C-5s pulse charging/discharging cycle
2.2 Temperature Sensing
In the first step a matrix of eight temperaturesensors is applied to the surface of the abovedescribed cell. As sensors TMP112 digitaltemperature sensor from Texas Instrumentsare used. The sensors are well feasible forbattery applications due to their low currentconsumption, a wide power supply range,small size and a temperature measurementrange that covers the operating temperaturerange of the battery cell very well (−40 ◦Cto 125 ◦C). The sensor matrix has beenplaced on a board with the dimensions50 mm × 150 mm (W x L). The dimensionsof board and cell as well as the sensordistribution on the board can be seen in Fig.1. The terminals of the cell are visible onthe left side of the cell. From the sensorsdata are transmitted via an I2C bus to amicro-controller and therefrom processedto a PC via USB. The data analysis isperformed by a MATLAB script.Fig. 2 shows the dynamic temperaturedistribution measured by all eight sensorsduring a 12C pulse charging and dischargingcycle. The sensors have first been acclima-tized at 27 ◦C for 2 min. After that, thecell has been charged and discharged withpulses of 5 s duration at 12C for 10 min.It shows that the measured values on allsensors where approximately the same at thebeginning of the cycling. After 10 min themeasured temperature difference betweenthe terminals and the opposite site of thecell is already more than 5.5 K. Differencesbetween sensors along all axes parallel toaxis B are in the range of the specifiedmeasuring inaccuracy of the sensors of 0.5 Kand can therewith be neglected.
2.3 Infrared Imaging
In order to gain information on the tempera-ture distribution between the sensors as well
Fig. 3: Temperature distribution measured withan IR camera along axis A (see Fig. 1) after10 min of a 12C-5s pulse charging/discharging cy-cle
and for verification of the measured values,images have been taken with an infraredcamera at the beginning and at the end of thetest cycle. Fig. 3 shows the static tempera-ture distribution after the 10 min pulse char-ging and discharging test cycle with the ter-minals at the left side. At the right lowercorner of the picture a temperature sensorthat is required for safety monitoring fromthe BaSyTec battery tester can be seen. Dueto the good heat conducting properties ofthe sensing cable combined with a poor ther-mal interface between the sensor and the cell,the temperature at the sensor is significantlylower than the cell temperature.The temperature distribution evaluationalong axis A and its parallel translationsthrough the sensor positions is demonstratedin Fig. 4. Although the influencing tempera-ture sensor from the battery tester can beseen in the diagram as well (green encircledarea), due to the big temperature differenceof over 7 K compared to its surrounding itcan be easily deducted. The diagram showsfurthermore, that in areas where the batterytester’s sensor is not attached (level of sen-sors 1, 3, 4) the quasi-linear characteristic ofthe temperature distribution is pursued. Thepresented data have been filtered with a sim-ple order-5 moving average FIR filter to elim-inate noise that is caused by the inaccuracyof the infrared camera. The filter equation isgiven in eq. (1) as follows:
Tp,filtered =
p+2∑i=p−2
Ti
5(1)
with Tp as the temperature at a position p onaxis A, having p as the distance in pixel fromthe terminals on the IR picture.
EVS26 International Battery, Hybrid and Fuel Cell Electric Vehicle Symposium 3

Fig. 4: Temperature distribution measured withan IR camera along axis A (see Fig. 1) after10 min of a 12C-5s pulse charging/discharging cy-cle, filtered with an order-5 moving average fil-ter. The green circle shows the area where thetemperature sensor of the battery tester influ-enced the IR image (see Fig. 3)
2.4 Temperature DistributionModel
For the development of a first temperaturedistribution model, static temperature dataafter a 10 min pulse charging and dischargingcycle have been collected as described above(see also Fig. 4). After that, the model is ap-plied to dynamic temperature data for eval-uation.
2.4.1 Static Temperature Distribu-tion Model
The static temperature distribution alongaxis A can be approximated by a linear equa-tion
T = αl + Tmeasured − α ∗ lmeasured (2)
where T [◦C] is the temperature at a point l.Tmeasured represents the measured tempera-ture at a defined point lmeasured on axis A,having l as the distance in mm from the ter-minals . The temperature gradient over thedistance l can be approximated with α =−0.027
◦Cmm . Comparing the values gained
from this equation with the measured valuesleads to a discrepancy of less than 0.4 K (lessthan 1 %). This is within the tolerance of thesensor which is defined as ±0.5 K.Looking at the distribution along axis B (seeFig. 1) the values can be assumed as fixed.For any point on this axis the temperaturedifference between any other point on the axisis less than 0.2 K (less than 0.5 %) which iswithin the sensor’s tolerance. This assump-tion is valid for all parallel translations of axisB.
Fig. 5: Comparison of linear approximated dataand measured sensor data
Taking the above mentioned findings intoaccount makes it possible to build a 2-dimensional model of the static surfacetemperature distribution of the mentionedcell by placing only one temperature sensoron the surface.The positioning of the sensor is dependingon the desired application and accuracy ofthe model. If the measured temperature ismeant to give only a rough estimation of thecell temperature condition and to prevent thecell from overheating, placing the sensor onaxis A (see Fig. 1) next to the terminals,where the temperature is highest (compareFig. 3 and Fig. 4) is considered best. As thetemperature distribution in the cell is quasi-linear, for a more precise model that approx-imates the temperature distribution in thewhole cell, the sensor is best positioned inthe middle of the cell in order to minimizethe error in both directions along axis A.
2.4.2 Dynamic Temperature Distri-bution Model
For validation of the linear approach andevaluation of the model for dynamic tempera-ture distributions data from Sensor 7 on thesensing board have been taken to calculatethe values at the positions of the other sen-sors by using eq. (2). Fig. 5 shows the com-parison for sensors 1, 2 and 3.While in the passive state of the battery theapproximation differs from the measured val-ues by about 2.5 K, the measurement curveand the approximated curve match well aftera maximum time of 3 min from the beginningof the pulse cycling for Sensor 1 next to theterminals. The error is less than 0.5 K. Forthe other measurement points the differenceof less than 0.5 K is achieved within a maxi-mum time of 1 min after the beginning of thepulse cycling.For getting a more precise approximation alsofor the passive state of the battery cell, asecond sensor can be placed next to the ter-minals. If the measured temperatures at both
EVS26 International Battery, Hybrid and Fuel Cell Electric Vehicle Symposium 4

sensors are the same, the passive state is as-sumed. Therewith, the temperature on thewhole cell surface can be approximated asequal. In contrast, the active state appliesif the temperatures measured on both sen-sors defer by more than 0.5 K and therewitheq. (2) is valid. In Fig. 5 the red dotted linerepresents this approach for Sensor 2.Although the combined approximation is abetter approach for modeling the tempera-ture distribution with a minimized error, thesecond sensor is not mandatory for safetymonitoring. The linear approximation pro-vides always temperature values that arehigher or equal to the values that have beenmeasured by the sensor matrix. Hence, thelinear approach for modeling the temperaturedistribution or the one-sensor approach with-out distribution modeling are both sufficientif only overheating needs to be avoided.For future applications the described normal-operation temperature distribution modelcan serve as a reference to detect discrepan-cies in real applications that can be an earlyindicator for safety relevant failures. How-ever, the sensor matrix used for this publica-tion needs to be optimized as for power con-sumption, monetary costs and size to makeit suitable for operation.
3 System cooling topology
The need for uniform temperature distribu-tion within the battery pack brings along thedemand for an overall-cooling system. Foran appropriate construction two heat transferproblems have to be taken into account. Dis-sipated heat from the cell needs to be trans-fered to the coolant by convection. Within acooling circuit, the dissipated heat is trans-mitted from the cells to a location where thecoolant needs to be replaced or re-cooled.As the tropical environment is characterizedby ambient temperatures that lie close to orabove operating temperatures, the battery-system needs to be linked to the central ve-hicle cooling unit which already serves thecabin A/C. This second heat transfer prob-lem is already adressed in the field of conven-tional automotive engineering. Therefore inthe following, the focus lies on the first men-tioned problem within the battery pack.For a compact and lightweight battery packstructure and a reliable heat dissipation, theinterface between cells and coolant has to bedesigned very carefully. Therefore, the im-pact of different basic interface designs oncooling efficiency will be evaluated in the fol-lowing section.In order to numerically simulate and eval-uate the efficiency of different setups, basicassumptions concerning the heat dissipationand temperature distribution of single cellshave been made. For the following investiga-tions it is assumed that thermal propertiesof the cell like heat conductivity and heat
Table 1: Simplified thermal properties of cell
Heat capacity [ JkgK ] 1,010.0
Thermal conductivity [ WmK ] 3.0
Thermal contact resistance [m2 KW ] 0.0001
capacity are isotropic and uniform all acrossthe cell. Approximated thermal material pro-perties have been taken from [5] and [6] andare listed in Table 1.The designed CAD-model reflects the actualdimensions and the basic geometric charac-teristics of the cell already known from sec-tion 2. In the following, a module consistingof 12 single cells shall be investigated. Theaverage volumetric rate of heat generation foreach cell has been calculated from experimen-tal data to be approximately 37 kW/m3 dur-ing a 4C discharge. Those data has beencollected by comparing the energy amounttransfered while charging and dischargingand assuming that the noticeable differenceis completely dissipated in form of heat. Ascurrent density and therefore the generatedheat is highest near the terminals and lowestat the remote parts of the cell, a linear one-dimensional distribution between 46 kW/m3
and 28 kW/m3 has been assumed resulting inthe calculated overall average rate.Further simplifications include the assump-tion of adiabatic borders around the moduleand a fixed thermal contact resistance be-tween cells and cooling structure.The numerical thermal module mock-upis used to evaluate different interface set-ups. Fundamental design parameters includearea, geometry and material of the interface,coolant material properties and flow vari-ables. Four selected approaches are mod-eled in ANSYS CFX and presented below.Simulation is carried out steady state withcalculation grids consisting of approximately1 million nodes. To ensure the comparabil-ity of the results, all models are designedto keep the cells within the optimum opera-tional temperature range between 30 ◦C and35 ◦C under constant load. All solid compo-nents besides the cells are defined to be madeof aluminum.
3.1 Simple aircooling
The most obvious way to cool the batterymodule is to use the given structural cas-ing elements as heat transfer areas and by-pass a stream of chilled ambient air. Convec-tive heat transfer can be supported by en-larging the transfer area by attaching coolingpins (Fig. 6). Advantages of the solution liewithin the low complexity, the integral de-sign and low manufacturing costs. Although,the space needed for airflow, additional com-ponents as blowers etc. and the noisy high
EVS26 International Battery, Hybrid and Fuel Cell Electric Vehicle Symposium 5
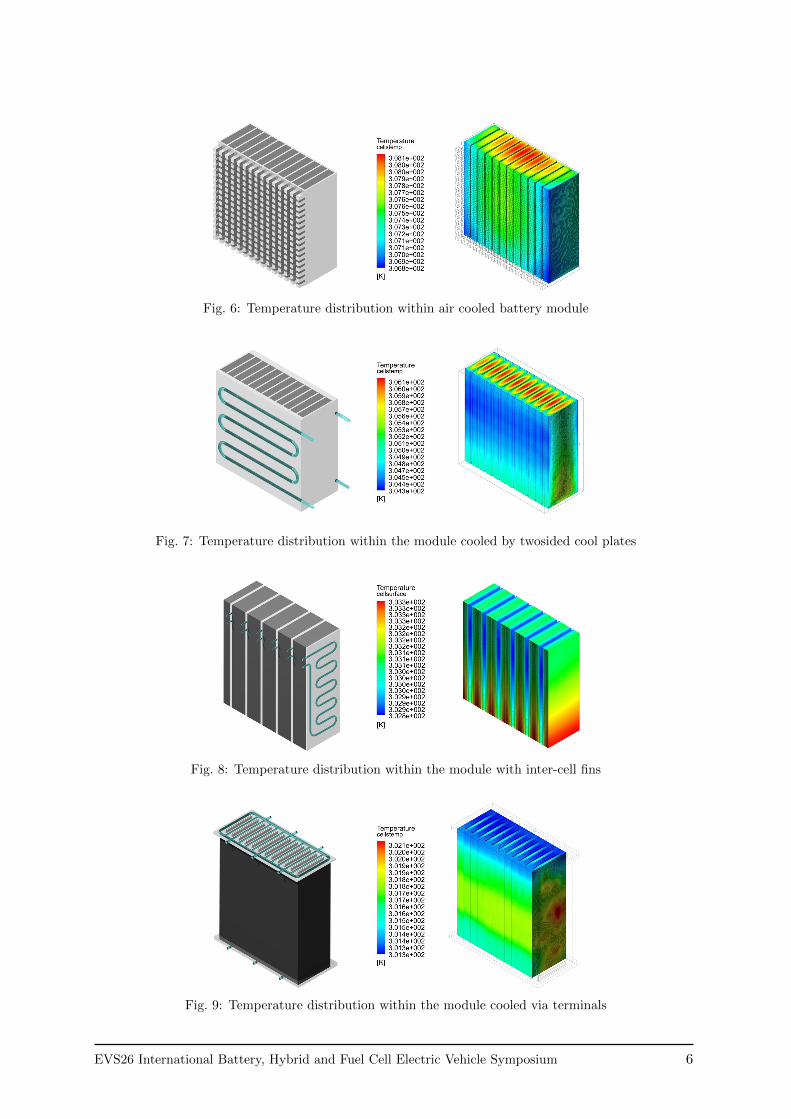
Fig. 6: Temperature distribution within air cooled battery module
Fig. 7: Temperature distribution within the module cooled by twosided cool plates
Fig. 8: Temperature distribution within the module with inter-cell fins
Fig. 9: Temperature distribution within the module cooled via terminals
EVS26 International Battery, Hybrid and Fuel Cell Electric Vehicle Symposium 6

Table 2: Results of CFD simulation
Aircooled Head cooled Liquid fins Conductorcooled
Coolant Air Water-glycol Water-glycol Water-glycolCoolant T [K] 283 300 300 290
Coolant density [ kg
m3 ] 1.247 1044 1044 1044
Coolant mass flow per cell [ gs ] 1.65 1.03 0.78 1.12T max [K] 308.1 306.1 303.3 302.1T min [K] 306.8 304.3 302.8 301.3Delta T [K] 1.3 1.8 0.7 0.8Cooling structure weight [g] 926 1,175 306 742Cooling structure volume [cm3] 342 433 110 267
mass-flow rate are disadvantages of a solelyair cooled model.
3.2 Liquid cooled head end coolingplates
At some extent, heat transfer from the cellis strictly limited by the coolant’s heat capa-city. As liquid coolants feature a heat capa-city that is higher than that of air by ordersof magnitude it is advisable to use them ascoolant instead. Therefore, a 50:50 water gly-col mix is used for the following three liquidcooled setups. The first one is realized by at-taching liquid cooled plates at the cells’ lat-eral edges (Fig. 7).As expected this setup leads to a high heat-flux at the contact planes and creates a con-siderable temperature gradient towards thecells’ center. Due to the large area coolplates, it reflects the heaviest and bulkiestof all presented solutions.
3.3 Liquid cooled interface fins
In order to achieve a more uniform tempera-ture distribution within the module, coolantchannels can be distributed equally spacedbetween the single cells as shown in Fig. 8.While this technique in fact enables an eventemperature distribution, it also comes alongwith significantly increased system weight,higher manufacturing costs and a complexsystem setup. Nevertheless, similar systemsare already used in commercial vehicles as theChevrolet Volt [7].
3.4 Liquid cooled conductor cool-ing
Another approach of cooling the module is touse the metal terminals to thermally connectcells and coolant. For this setup, the termi-nals were modeled as thin metal plates withinthe cell, being connected on its both opposite
sides. As the terminals’ high electric conduc-tivity goes along with a high thermal con-ductivity, heat can be uniformly dissipatedfrom the cell without the need of an addi-tional structure. However, the crucial designchallenge of this setup lies in thermally con-necting coolant and electrical system whileensuring a safe electrical isolation at the sametime. This can be achieved by applying di-electric ceramics or thermo-silicone on theterminals as shown in Fig. 9. Unfortunately,this interface represents the bottleneck of thisapproach as thermal conductivity of the di-electric material is significantly below the restof the system setup. Additionally, the con-tact area is limited which makes a higher dif-ference in temperature between coolant andcell necessary.
3.5 Evaluation of simulation results
Table 2 gives an overview of the resultingtemperature distribution within the cells andthe cooling efficiency of the different setups.Besides the thermal characteristics, weightand volume of cooling structure play an im-portant role as well as the overall coolantmass flow per cell.As seen from the acquired simulation data,the type of cell-coolant interface can havesignificant influence on the needed coolingpower. Therefore, it affects the overall effi-ciency of EVs especially when used in high-temperature regions. In those regions, a re-liable cooling system is not only needed toincrease the efficiency but also is a very im-portant safety aspect. Table 2 points outthat, if the complexity can be handled, theinsertition of liquid cooled foms between thecells offers the lightest and most compact so-lution. Another approach that seems verypromising is the joint use of the terminalsfor terminal interface as it combines uniformtemperature distribution with a compact andsimple design that can simultaneously act asstructural stabilization element of the mod-ule. Given the fact that there is only littlepublic documentation on this setup, its pro-
EVS26 International Battery, Hybrid and Fuel Cell Electric Vehicle Symposium 7

Fig. 10: Dependency of the OCV from the SOCfor different LiMO2 cells
perties and in detail-design should be furtherinvestigated by additional tests and physicalprototypes.
4 Thermodynamic measure-ments
As shown in section 2, temperature sensingduring operation is a very important taskto guarantee user’s safety. While thermalmanagement improves safety during the ac-tive use, another aspect of research withinTUM CREATE focuses on the determinationof batteries’ state of health (SOH) as an im-portant measure for overlooking actual bat-tery safety conditions. Thermodynamic mea-surements on batteries are an approach thataddresses the long term behavior and relia-bility of batteries.Due to the fast growing variety of new an-odes, e.g. nano-structured silicon, as wellas new cathode composites like LiMO2 (M= Mn, Co, Ni, Al), reliable possibilities forstate of health (SOH) and state of charge(SOC) determination have to be developed.Thermodynamic measurements seem to bepromising candidates since small changeswithin the battery structure caused by agingor misuse are believed to have a considerableimpact on the calculated profile [8]. Previ-ous research shows that for LiCoO2 half cells[11] as well as for self-made coin cells withdifferent chemistries [9].The profiles have a valuable fingerprint char-acteristic and behave additive, i.e., profilesfor full cells are weighted sums of the re-spected half-cell profiles [9].For an ideal reversible cell, the Gibbs freeenergy change ∆rG can be express by
∆rG = −nFEemf (3)
Fig. 11: Dependency of the OCV from thetemperature for a LiCoO2 full cell at differentSOC
with Eemf as the electromotive force, whichcan be assumed to be equivalent to the opencircuit voltage of the battery at equilibriumand n as the number of exchanged electrons.The authors assume Eemf to be constant foran incremental change δx. The thermody-namic relation between ∆rG and the changeof entropy ∆S can be expressed as
∆rS =∂∆rG
∂T(4)
Measuring the open circuit voltage at differ-ent temperatures allows the calculation of thedifferential charge/discharge entropy accord-ing to
∆rS = nF∂(OCV (x))
∂T(5)
where F is the Faraday constant, OCV (x)the open circuit voltage of the battery inequilibrium at different states of lithiation xin the anode and T is the temperature of thebattery. Hence, the value of ∆S describes thechange of entropy that occurs when a certainamount of δx lithium is intercalated into theanode during charging. At the same time,the same amount of δx lithium is deinterca-lated from the cathode. For discharging, δxlithium is deintercalated from the anode andintercalated into the anode. As it can be seenfrom eq. (5), the entropy change ∆S is pos-itive if the OCV (x) decreases for a certainvalue of x with increasing temperature.The OCV for LiMO2 based batteries de-pends on the state of charge as well as onthe temperature of the battery [10]. Fig.10 shows the occurring change of the OCVfitted on the battery’s SOC for differentcell chemistries which are commercially avail-able. While LiNixCoyAlzO2 shows a lin-ear behavior for the full range, LiCoO2 andLiNixCoyMnz show a small plateau between
EVS26 International Battery, Hybrid and Fuel Cell Electric Vehicle Symposium 8

Fig. 12: OCV relaxation for LiNixCoyAlzO2,LiCoO2 and LiNixCoyMnz cells after temperaturechanges of 10 ◦C for a SOC of 70%
40 % and 20 % SOC before decreasing againlinearly. Fig. 11 shows the OCV’s depen-dency on the temperature at three differentstates of charge for a LiCoO2 battery. TheOCV’s behavior is also linear for this LiCoO2cell and is decreasing for higher tempera-tures. For higher temperatures, the OCVdoes not reach a stable equilibrium due tothe increasing self-discharge of the battery,resulting in inaccurate measurements.
4.1 Experiments
To measure the battery’s OCV as well as thetemperature, an Agilent 34972A with a 20channel multiplexer is used for achieving thenecessary resolution to measure the change ofthe OCV. The batteries are cycled in an Es-pec climate chamber to control the tempera-ture between 5 ◦C and 25 ◦C in steps of 10 ◦C.The cycling is performed by a BaSyTec bat-tery tester. After evaluating the capacityof each cell at a discharge rate of 0.2 C at25 ◦C as recommended by the manufacturer,the cell is fully charged using the constantcurrent-constant voltage (CCCV) method. A0.2 C rate and a constant voltage of 4.2 Vrespectively is applied. Finally, the cells aredischarged with constant steps at a 0.2 C ratefor 15 mins each.After each discharging step, the OCV re-laxation is measured for 45 mins. The volt-age and temperature measurement interval ischosen to be 30 s. After this, the temperatureis decreased by 10 ◦C down to 15 ◦C and theOCV behavior is monitored for 45 mins. Inthe next step, the temperature is decreasedfor a second time down to 5 ◦C and the OCVis measured for another 45 mins. Finally, thecell is heated up to 25 ◦C. To allow the bat-teries to reach an equilibrium state at 25 ◦C,the waiting time is 60 mins before the nextdischarging step is applied.The necessary data for the calculation of the
Fig. 13: Calculated entropy profiles fromLiNixCoyAlzO2, LiCoO2 and LiNixCoyMnz cells
entropy profile can be gained by performingthese measurements until the battery is fullydischarged. The discharged state is definedwhen the amount of mAh taken out of thecell reaches the defined discharge capacity.This is done by the coulomb counting methodand measured with the BaSyTec battery cy-cler. The second criterion for recognizing thedischarged state is if the cell voltage dropsbelow 3.0 V, whichever of the criteria comesfirst. The measurement time can be varied bychanging the relaxation time and focusing oncertain SOC of interest. Since the measure-ment time was only five days and the factthat mainly low temperatures were used, theself-discharge of the battery is neglected.
4.2 Results
Fig. 12 shows an example of the OCV relax-ation for three different cell chemistries at astate of charge of 70%. For an SOC over 60%as well as a temperature of 25 ◦C, the time forthe OCV relaxation is assumed to be enoughto achieve a voltage which can be definedas equilibrium. For lower states of chargeand lower temperatures, the measured timeof 45 mins seems to be insufficient to reach anOCV which can be assumed to be in an equi-librium state. The relaxation curves wherefitted using Origin software to estimate thefinal value of the OCV. These estimationsare in good agreement on OCV relaxationtests performed before. The change of en-tropy from 5% to 0% cannot be determinedprecisely due to the different possible crite-ria for the discharged state even though thetwo previously mentioned definitions were inclose accordance thanks to the calibration ofthe cell capacity before every discharge cycle.The OCV for the LiCoO2 andLiNixMnyCozO2 based cells increase forlower temperatures for the whole range ofSOC. For LiNixCoyAlzO2 the OCV decreasesfor lower temperatures only at a SOC of
EVS26 International Battery, Hybrid and Fuel Cell Electric Vehicle Symposium 9

80%, 60% and smaller than 25% respectively.Therefore, the entropy profile for this cellshows certain areas where the change ofentropy ∆S is > 0.Fig. 13 shows the calculated entropy pro-files for different types of cells. These mea-surements show, that it is possible to up-scale previous measurements to larger cells.Therefore, calculated entropy profiles are apossible way of characterizing different cellchemistries and different cell sizes, eitherfor self-made coin cells or commercial 18650cells. As discussed, changes in the en-tropy profile help to estimate the battery’stemperature excursion during charge and dis-charge [9] and enable the development of atool for SOH prediction of a battery [11].
5 Conclusion & Outlook
Operation in tropic environment brings alongspecial safety relevant challanges in batterypack design of which three are presented inthis paper. An approach for a monitoringtechnique has been given and an approxi-mation of 2D temperature distribution hasbeen derived from an experimental sensorsetup. The obtained data wer used as in-put for numerical thermal models of differ-ent cell/coolant interfaces. CFD analysis hasuncovered significant differences in their effi-cency and supports the selection of a reliableand compact system.As long term operational safety strongly de-pends on the batteries’ state of health, its in-teraction with thermodynamic cell propertieshas been analysed in detail. Therefore, sev-eral test series have been conducted to deter-mine the OCV dependency on temperaturefor different cell types at variant SOC levels.Based on these results entropy profiles havebeen calculated.In order to validate the temperature distri-bution model, the predicted thermal inter-face properties and the coherence of module’sthermal behaviour and cells’ state of health,further tests and physical prototypes are re-quired and will be part of future researchwithin TUM CREATE. Particular attentionshould be paid to investigations concerningthe models’ validity for different cell types,chemistry and geometries. Additional find-ings are likely to be gained by developing ad-vanced sensor techniques and a refined spe-cific numerical simulation model.
Disclaimer
This publication is made possible by the Sin-gapore National Research Foundation (NRF)under its CREATE programme. The viewsexpressed herein are solely the responsibilityof the authors and do not necessarily repre-sent the official views of the Foundation.
References
[1] United States of America. U.S. Depart-ment of Transportation Federal AviationAdministration, Freighter Airplane CargoFire Risk Model, Washington: U.S. Depart-ment of Transportation Federal AviationAdministration, 2011.
[2] Chevrolet Volt Fire Solution ExpectedSoon, Coolant Leak May Be The Cul-prit, http://www.autoguide.com/auto-news/2011/12/chevrolet-volt-fire-solution-expected-soon-coolant-leak-may-be-the-culprit.html, accessed on 2012-01-20.
[3] Weather and Climate in Singapore, Internet:http://www.guidemesingapore.com/relocation/introduction/climate-in-singapore, ac-cessed on 2012-01-20.
[4] A. Jossen and W. Weydanz, ModerneAkkumulatoren richtig einsetzen, ISBN3-939359-11-4, Untermeitingen, Inge Re-ichardt Verlag, 2006.
[5] A. Pesaran and M. Keyser, Thermal Charac-teristics of Selected EV and HEV Batteries,Proceedings of the Annual Battery Confer-ence: Advances and Applications, ISBN 0-7803-6545-3, Long Beach, 2001.
[6] R. Sabbah, R. Kizilel et al, Active vs. passivethermal management of high power lithium-ion packs: Limitations of temperature riseand uniformity of temperature distribution,Journal of Power Sources, ISSN 0378-7753,182(2008), 630-638.
[7] K. Buchholz, Dana helps cool Volt’s bat-tery, SAE Vehicle Elictrification Magazine4(2011).
[8] Y. Reynier, R. Yazami and B. Fultz, Theentropy and enthalpy of lithium intercalationinto graphite, Journal of Power Sources,ISSN 0378-7753, 119-121(2003), 850-855.
[9] V. V. Viswanathan et al. Effect of entropychange of lithium intercalation in cathodesand anodes on Li-ion battery thermal man-agement, Journal of Power Sources, ISSN0378-7753, 195(2010), 3720-3729.
[10] K. Takano et al. Entropy change in lithiumion cells on charge and discharge, Journal ofApplied Electrochemistry, ISSN 0021-8913,32(2002), 251-258.
EVS26 International Battery, Hybrid and Fuel Cell Electric Vehicle Symposium 10

[11] Y. Reynier et al. Entropy of Li intercalationin LixCoO2, Physical Review B, ISSN 1098-0121, 70(2004).
Authors
Nora Martiny graduated in2010 at TUM as electrical engi-neer. Since 2011 she works withTUM CREATE on energy stor-age systems. Her research focuslies on sensing possibilities forsafety monitoring of Li-Ion cells.
Patrick Osswald received hisfinal degree in electrical en-gineering from TUM in 2010.Since 2011 he is working forTUM CREATE, focusing onbattery state determination byusing a thermodynamic ap-proach.
Christian Huber completedhis studies of aerospace engi-neering and business adminis-tration at TUM in 2011. WithinTUM CREATE he now focuseson thermal management of bat-tery packs and thermofluid dy-namic simulation.
Andreas Jossen earned hisdoctorate, dealing with ”Man-agement of photo-voltaic plantsusing energy storage systems” atUniversity of Stuttgart. From1994 he was group leader fordifferent battery related topicswith ZSW, Ulm. Since 2010he is full professor at the Insti-tute for Electrical Energy Stor-age Technology, TUM.
EVS26 International Battery, Hybrid and Fuel Cell Electric Vehicle Symposium 11