Safety Evaluation Testbeds -- An Assessment of Safety ...safety evaluation testbeds -- an assessment...
109
FINAL RESEARCH REPORT SAFETY EVALUATION TESTBEDS -- AN ASSESSMENT OF SAFETY PROJECT PRIORITIZATION IN THE WSDOT I2 PROGRAM Prepared by Venky Shankar, PhD, PE Associate Professor Department of Civil and Environmental Engineering Pennsylvania State University University Park, PA 16802 E-mail: [email protected] Ming-Bang Shyu PhD Candidate Department of Civil and Environmental Engineering Pennsylvania State University University Park, PA 16802 E-mail: [email protected] Sittipan Sittikariya PhD Candidate Department of Civil and Environmental Engineering Pennsylvania State University University Park, PA 16802 E-mail: [email protected] Saiyid Sikder, PhD Senior Assistant Chief Planning Commission Dhaka 1207 Bangladesh Pennsylvania Transportation Institute (PTI) 201 Transportation Research Building Pennsylvania State University University Park, PA 16802 Washington State Department of Transportation Technical Monitor John Milton, Assistant State Design Engineer Design Office Prepared for Washington State Department of Transportation September 2006
Transcript of Safety Evaluation Testbeds -- An Assessment of Safety ...safety evaluation testbeds -- an assessment...

FINAL RESEARCH REPORT
SAFETY EVALUATION TESTBEDS -- AN ASSESSMENT OF
SAFETY PROJECT PRIORITIZATION IN THE WSDOT I2
PROGRAM
Prepared by Venky Shankar, PhD, PE
Associate Professor Department of Civil and Environmental
Engineering Pennsylvania State University
University Park, PA 16802 E-mail: [email protected]
Ming-Bang Shyu PhD Candidate
Department of Civil and Environmental Engineering
Pennsylvania State University University Park, PA 16802 E-mail: [email protected]
Sittipan Sittikariya PhD Candidate
Department of Civil and Environmental Engineering
Pennsylvania State University University Park, PA 16802 E-mail: [email protected]
Saiyid Sikder, PhD Senior Assistant Chief Planning Commission
Dhaka 1207 Bangladesh
Pennsylvania Transportation Institute (PTI)
201 Transportation Research Building
Pennsylvania State University
University Park, PA 16802
Washington State Department of Transportation Technical Monitor John Milton, Assistant State Design Engineer
Design Office
Prepared for Washington State Department of Transportation
September 2006
SAFETY EVALUATION TESTBEDS -- AN ASSESSMENT OF SAFETY PROJECT PRIORITIZATION IN THE WSDOT I2 PROGRAM
2Pennsylvania Transportation Institute, University Park, PA 16802
TECHNICAL REPORT STANDARD TITLE PAGE
1. REPORT NO. 2. GOVERNMENT ACCESSION NO. 3. RECIPIENTS CATALOG NO
WA-RD 654.1
4. TITLE AND SUBTILLE 5. REPORT DATE
September 2006
6. PERFORMING ORGANIZATION CODE
Safety Evaluation Testbeds – An Assessment of Safety Project Prioritization in the WSDOT I2 Program
7. AUTHOR(S) 8. PERFORMING ORGANIZATION REPORT NO.
Venky Shankar, Ming-Bang Shyu, Sittipan Sittikariya and Saiyid Sikder
9. PERFORMING ORGANIZATION NAME AND ADDRESS 10. WORK UNIT NO.
11. CONTRACT OR GRANT NO. The Pennsylvania Transportation Institute Pennsylvania State University 201 Transportation Research Building University Park, PA 16802
12. SPONSORING AGENCY NAME AND ADDRESS 13. TYPE OF REPORT AND PERIOD COVERED
14. SPONSORING AGENCY CODE
Research Office Transportation Building Washington State Department of Transportation 310 Maple Park Avenue SE PO Box 47300 Olympia WA 98504-7300
15. SUPPLEMENTARY NOTES
This study was conducted in cooperation with the U.S. Department of Transportation, Federal Highway Administration.
16. ABSTRACT: This study examines the feasibility of Bayesian and data envelopment techniques for robust identification of safety priorities in the Washington State DOT improvement program. Findings indicate that the methods employed in this study have potential for reliable predictions and identification of safety needs. A case study dataset of high accident locations was used to make this assessment.
17. KEY WORDS 18. DISTRIBUTION STATEMENT
Safety Prioritization, Bayesian Methods, Data Envelopment Analysis
19. SECURITY CLASSIF. (of this report) 20. SECURITY CLASSIF. (of this page) 21. NO. OF PAGES 22. PRICE
None None

SAFETY EVALUATION TESTBEDS -- AN ASSESSMENT OF SAFETY PROJECT PRIORITIZATION IN THE WSDOT I2 PROGRAM
Pennsylvania Transportation Institute, University Park, PA 16802 iii
TABLE OF CONTENTS
EXECUTIVE SUMMARY…………………………………………………………….E-1
BACKGROUND STATEMENT………………………………………………E-2
OBJECTIVES……………………………………………………………..........E-4
BENEFITS AND CONTEXT………………………………………………….E-5
DATA AND METHODOLOGY………………………………………………E-7
FINDINGS, RECOMMENDATIONS AND IMPLEMENTATION PLAN…E-12
INTRODUCTION………………………………………………………………………..1
BACKGROUND STATEMENT…………………………………………………2
OBJECTIVES……………………………………………………………………. 5
BENEFITS AND CONTEXT…………………………………………………….5
STUDY METHODOLOGY………………………………………………………...........8
LITERATURE REVIEW………………………………………………………………..12
ANALYTICAL TECHNIQUES………………………………………………………..18
HIERARCHICAL MODELS……………………………………………………21
DATA ENVELOPMENT ANALYSIS (DEA)………………………………….22
The notion of DEA-based relative safety need…………………………..25
DATA USED FOR THE ANALYSIS…………………………………………………...27
RESULTS AND DISCUSSION…………………………………………………….…..28
CONCLUSIONS AND RECOMMENDATIONS……………………………………...34
REFERENCES…………………………………………………………………………..39
APPENDIX A – Data Envelopment Analysis and Bayesian Prediction Model Results A-1
APPENDIX B – Analytical Techniques………………………………………………A-32

SAFETY EVALUATION TESTBEDS -- AN ASSESSMENT OF SAFETY PROJECT PRIORITIZATION IN THE WSDOT I2 PROGRAM
Pennsylvania Transportation Institute, University Park, PA 16802 iv
LIST OF FIGURES
Figure E-1 Traffic fatality rate trends in the last decade on Washington State Highways…………………………………….E-2
Figure E-2 County-Level Combined Fatality-Disabling
Rates in the 2001-2003 Biennium…………………………………………..E-6
Figure 1 Traffic fatality rate trends in the last decade on Washington State Highways……………………………………….…3
Figure 2 County-Level Combined Fatality-Disabling
Rates in the 2001-2003 Biennium…………………………………………….....6 Figure 3 Analysis Methodology………………………………………………………….10

SAFETY EVALUATION TESTBEDS -- AN ASSESSMENT OF SAFETY PROJECT PRIORITIZATION IN THE WSDOT I2 PROGRAM
Pennsylvania Transportation Institute, University Park, PA 16802 v
LIST OF TABLES
Table 1 Decision Taxonomy of a Typical Safety Evaluation System…………………….8 Table 2 Summary Statistics of key variables………………………………………….....27 Table 3 Summary of Inputs of Greatest Needs (190 Sections)………………………..…30 Table 4 Comparison of Classical Negative Binomial Model and Hierarchical Bayesian Analysis for Overall Accidents (190 sections)……………………………….....32 Table 5 Summary of Predictions Comparisons of Classical Negative Binomial Model and Hierarchical Bayesian Analysis for Overall Accidents (190 sections)………….34 Table A-1-1 Detailed Section-by-Section Characteristics, Part-I……………………....A-2 Table A-1- 2 Detailed Section-by-Section Characteristics, Part-II………………….....A-3 Table A-1- 3 Detailed Section-by-Section Characteristics, Part-III…………………....A-4 Table A-1- 4 Detailed Section-by-Section Characteristics, Part-IV……………..……..A-5 Table A-1- 5 Detailed Section-by-Section Characteristics, Part-V…………………….A-6 Table A-1- 6 Detailed Section-by-Section Characteristics, Part-VI………………..…..A-7 Table A-1- 7 Detailed Section-by-Section Characteristics, Part-VII………………..…A-8 Table A-1- 8 Detailed Section-by-Section Characteristics, Part-VIII………………….A-9

SAFETY EVALUATION TESTBEDS -- AN ASSESSMENT OF SAFETY PROJECT PRIORITIZATION IN THE WSDOT I2 PROGRAM
Pennsylvania Transportation Institute, University Park, PA 16802 vi
Table A-2- 1 Comparison Between DEA Variable-Return-to-Scale Results and Constant- Return-to-Scale Results, Part-I…………………………………...……A-.11 Table A-2- 2 Comparison Between DEA Variable-Return-to-Scale Results and Constant- Return-to-Scale Results, Part-II……………………………………...…A-12 Table A-2- 3 Comparison Between DEA Variable-Return-to-Scale Results and Constant- Return-to-Scale Results, Part-III……………………………………….A-13 Table A-2- 4 Comparison Between DEA Variable-Return-to-Scale Results and Constant- Return-to-Scale Results, Part-IV……………………………………....A-14 Table A-2- 5 Comparison Between DEA Variable-Return-to-Scale Results and Constant- Return-to-Scale Results, Part-V……………………………………….A-15 Table A-2- 6 Comparison Between DEA Variable-Return-to-Scale Results and Constant- Return-to-Scale Results, Part-VI…………………………………...….A-16 Table A-2- 7 Comparison Between DEA Variable-Return-to-Scale Results and Constant- Return-to-Scale Results, Part-VII………………………………………A-17 Table A-2- 8 Comparison Between DEA Variable-Return-to-Scale Results and Constant- Return-to-Scale Results, Part-VIII……………………………………..A-18 Table A-2- 9 Comparison Between DEA Variable-Return-to-Scale Results and Constant- Return-to-Scale Results, Part-IX………………………………………A-19 Table A-2- 10 Comparison Between DEA Variable-Return-to-Scale Results and Constant-Return-to-Scale Results, Part-X……………………………A-20 Table A-2- 11 Comparison Between DEA Variable-Return-to-Scale Results and Constant-Return-to-Scale Results, Part-XI……………………………A-21

SAFETY EVALUATION TESTBEDS -- AN ASSESSMENT OF SAFETY PROJECT PRIORITIZATION IN THE WSDOT I2 PROGRAM
Pennsylvania Transportation Institute, University Park, PA 16802 vii
Table A-2- 12 Comparison Between DEA Variable-Return-to-Scale Results and Constant-Return-to-Scale Results, Part-XII…………………………..A-22 Table A-2- 13 Comparison Between DEA Variable-Return-to-Scale Results and Constant-Return-to-Scale Results, Part-XIII………………………….A-23 Table A-2- 14 Comparison Between DEA Variable-Return-to-Scale Results and Constant-Return-to-Scale Results, Part-XIV………………………….A-24 Table A-2- 15 Comparison Between DEA Variable-Return-to-Scale Results and Constant-Return-to-Scale Results, Part-XV…………………………...A-25 Table A-3- 1 Predictions of Hierarchical Bayesian Analysis
for Overall Accidents, Part-I……………………………………………A-27 Table A-3- 2 Predictions of Hierarchical Bayesian Analysis
for Overall Accidents, Part-II…………………………………………..A-28 Table A-3- 3 Predictions of Hierarchical Bayesian Analysis
for Overall Accidents, Part-III……………………………………….….A-29 Table A-3- 4 Predictions of Hierarchical Bayesian Analysis
for Overall Accidents, Part-IV………………………………………..…A-30 Table A-3- 5 Predictions of Hierarchical Bayesian Analysis
for Overall Accidents, Part-V…………………………………………...A-31

SAFETY EVALUATION TESTBEDS -- AN ASSESSMENT OF SAFETY PROJECT PRIORITIZATION IN THE WSDOT I2 PROGRAM
Pennsylvania Transportation Institute, University Park, PA 16802 E-1
EXECUTIVE SUMMARY
The current Washington State Department of Transportation (WSDOT) method for
evaluating roadway projects for safety upgrades relies on procedures that combine
frequency and severity of accidents at locations in a weighted manner. This is a
reasonable procedure that captures a significant portion of locations deserving of safety
upgrades in a consistent manner. However, what is not apparent from the programming
process is the cause of turnovers of locations from year to year. One main issue
underlying the turnover rate is the reliability of predictions of accident risk. The second
issue related to the turnover rate is one of efficient investment. For example, any given
highway accident corridor needs to be examined in terms of benefits and costs from
safety investments, and how they efficiently relate to performance measure of the
location. To fully optimize the Highway Safety Management System (HSMS) at the
WSDOT, both of the above-mentioned dimensions need to be addressed in conjunction
with one another. Accident occurrence prediction and approaches for establishing
consistent and sustainable safety programs in addressing risk through proper and timely
investment are the main issues researched in this report. To this end, we analyzed a pilot
subset of the WSDOT I2 program that specifically deals with safety needs. We examined
190 sections in the Northwest Region and provide findings related to both predictive
reliability and programming efficiency issues.1 The I2 program is a sub-program within
1 Federal law 23 USC § 409 prohibits the discovery or admission into evidence of “reports, surveys, schedules, lists, or data” compiled or collected for the purpose of highway safety improvement projects that might qualify for federal safety improvement funding.

SAFETY EVALUATION TESTBEDS -- AN ASSESSMENT OF SAFETY PROJECT PRIORITIZATION IN THE WSDOT I2 PROGRAM
Pennsylvania Transportation Institute, University Park, PA 16802 E-2
WSDOT’s “Improvement” category. The I2 program involves capital projects that are
prioritized strictly on safety needs.
BACKGROUND STATEMENT
Motor vehicle accidents continue to be a major cause of death and injury in the United
States. As a consequence, state and federal agencies expend considerable resources in an
effort to improve safety by implementing countermeasures that include improving
highway geometrics, highway signing, and right-of-ways. The goal of WSDOT, the
Washington State Patrol, and the Washington Traffic Safety Commission is to reduce and
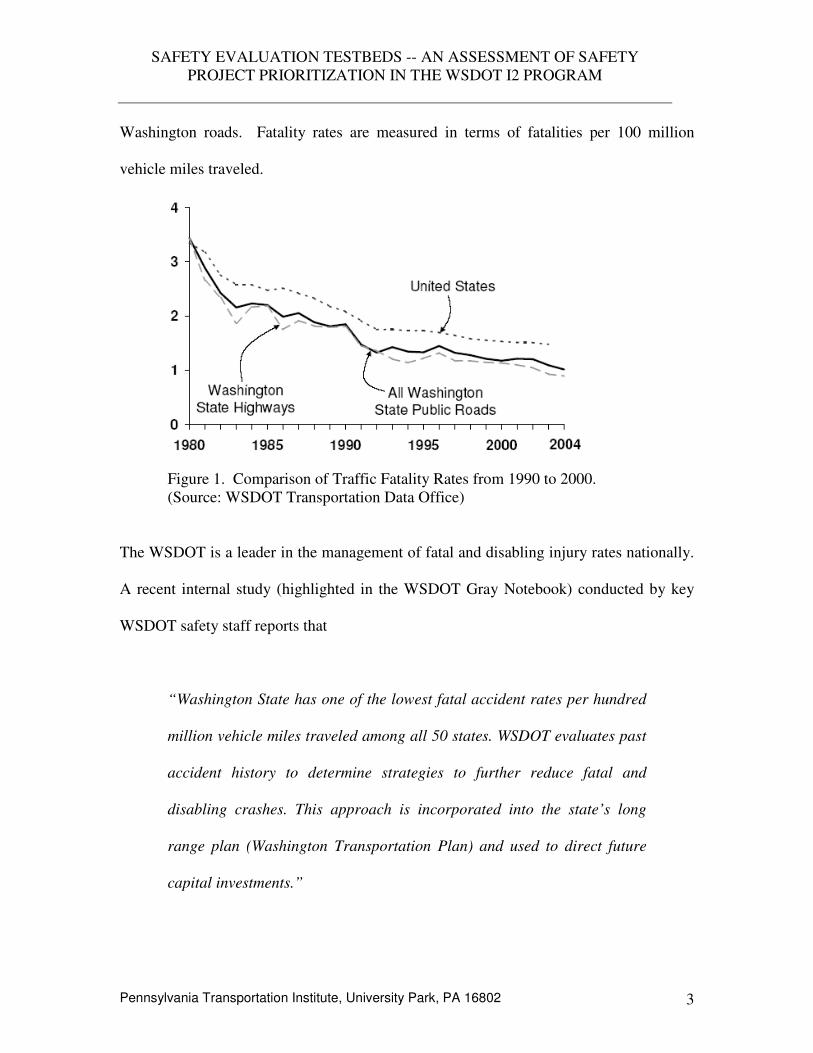
eliminate deaths and disabling injuries on our state’s highways and roads. Figure 1
below shows fatality rate trends for three networks – national, Washington State
highway, and Washington roads. Fatality rates are measured in terms of fatalities per 100
million vehicle miles traveled.
Figure E-1. Comparison of Traffic Fatality Rates from 1990 to 2000. (Provided by: WSDOT Transportation Data Office)

SAFETY EVALUATION TESTBEDS -- AN ASSESSMENT OF SAFETY PROJECT PRIORITIZATION IN THE WSDOT I2 PROGRAM
Pennsylvania Transportation Institute, University Park, PA 16802 E-3
The WSDOT is a leader in the management of fatal and disabling injury rates nationally.
A recent internal study (highlighted in the WSDOT Gray Notebook) conducted by key
WSDOT safety staff reports that
“Washington State has one of the lowest fatal accident rates per hundred
million vehicle miles traveled among all 50 states. WSDOT evaluates past
accident history to determine strategies to further reduce fatal and
disabling crashes. This approach is incorporated into the state’s long
range plan (Washington Transportation Plan) and used to direct future
capital investments.”
In recognition of its practices, the American Association of State Highway and
Transportation Organizations (AASHTO) recognized WSDOT for its proactive approach
to safety. In May 2005, AASHTO presented WSDOT with its Safety Leadership Award.
WSDOT’s approach is based upon a “local, corridor and system-wide perspective.
Working with other safety agencies, WSDOT adopted a strategic safety plan, called
Target Zero. As an outcome, the state has had a 56% decrease in fatal and disabling
crash rates since 1990 even though vehicle miles traveled over that period have increased
by 35%.”
In light of such advances in safety management, the WSDOT is continually improving
the safety management process through approaches that are pro-active. A proactive
SAFETY EVALUATION TESTBEDS -- AN ASSESSMENT OF SAFETY PROJECT PRIORITIZATION IN THE WSDOT I2 PROGRAM
Pennsylvania Transportation Institute, University Park, PA 16802 E-4
approach would improve potentially problematic areas before severe accidents and the
infrastructure damages associated with accidents have occurred. Statistical modeling
provides a proactive approach by developing a relationship between the severity or
frequencies of accidents and information on road geometrics, traffic volumes and
roadside features. The “proactive” capability arises from WSDOT’s ability to predict
accident occurrence and severity using existing infrastructure information. Applying
proactive approaches in the WSDOT I2 program context requires categorization of
accident locations. The Washington State Department of Transportation categorizes
highway accident prevention and reduction locations in the following manner:
High Accident Location (HAL): spot locations less than a mile long with a higher than
average rate of severe accidents in the past 2 years.
Pedestrian Accident Location (PAL): spot locations (0.10 mi or less) that have 4
accidents in a 6-year period.
High Accident Corridor (HAC): sections of state highway one or more miles long, with a
higher than average number of severe accidents over a continuous period of time.
A detailed explanation of WSDOT’s current methodology behind identification of HAL
is provided in a following section on data and methodology in this executive summary.
OBJECTIVES
The objective of this study was to assess the current system of prioritizing and
programming safety projects through WSDOT’s I2 program, with a special focus on

SAFETY EVALUATION TESTBEDS -- AN ASSESSMENT OF SAFETY PROJECT PRIORITIZATION IN THE WSDOT I2 PROGRAM
Pennsylvania Transportation Institute, University Park, PA 16802 E-5
high-accident locations. Pedestrian accident locations and high accident corridors were
not part of this study. However, the extension of the proposed methodology to those
categories is straightforward. Accident risk predictive reliability and identification of
methods for analysis of safety programming efficiency on the basis of multiple safety
performance measures were the major goals of analysis.
BENEFITS AND CONTEXT
The major benefit of this study will be a method to address systematically the
programming of all projects in the state’s I2 program. This includes coverage of collision
prevention and collision reduction sub-programs on a comprehensive basis. In doing so,
WSDOT will be able to implement procedures that prioritize locations in terms of social
costs and benefits, while providing for maximal coverage of locations in terms of
identified and funded improvements. While this is a complex goal to accomplish, the
benefit will be significant. As an example, if one were to consider HALs in each biennial
cycle, over 600 locations are typically identified for improvements. Scoping for
improvements begins with identifying trends in accident histories. Accurate
identification of safety improvement priorities with a high level of certainty maximizes
the efficiency of the scoping process. With WSDOT’s 2005-2015 ten-year plan for
Highway Safety Improvements providing for nearly a billion dollars in targeted safety
enhancements, the I2 process has much to gain from systematically addressing project
turnover in system plans from one biennial cycle to the next. “Turnover” is defined as a
location that repeats as a high-priority accident spot or corridor. The percent of locations

SAFETY EVALUATION TESTBEDS -- AN ASSESSMENT OF SAFETY PROJECT PRIORITIZATION IN THE WSDOT I2 PROGRAM
Pennsylvania Transportation Institute, University Park, PA 16802 E-6
“turning over” from one biennium to the next varies by functional class and region. In
the case of HALs for example, Northwest Region “turnovers” are the highest across three
bienniums (2003-2005 to 2007-2009). Figure 2 shows the “turnover” trend.
Percent of 2003-05 High Accident Locations
Turning Over in 2005-07 and 2007-09 Bienniums
38%
11%
34% 35%
27% 29%
35%
0%
5%10%
15%
20%
25%30%
35%
40%
North
wes
t
North
Cen
tral
Olympic
Sou
thwest
Sou
th C
entra
l
Eas
tern
Sta
te
Tu
rno
ver
(Rep
eat)
Figure E-2. High Accident Location Turnover Trends.
As seen in Figure 2, 38 percent of the Northwest Region HAL network turns over from
the 2003-2005 biennium to the 2007-2009 biennium. The state as whole turns over 35
percent of the 650 high accident locations during the same period, while, North Central
Region turns over the least, 11 percent. The variability in regional turnovers is
attributable to the distribution of urban, high volume locations in the state network.
Regardless of the variability, consistent system-level enhancements that address with a
high level of certainty, necessary safety improvements at properly prioritized HALs also
result in improved project life cycles, thereby enhancing investment efficiency. If the
“turnover” period is limited to two bienniums, approximately 50 percent of HALs
statewide turn over from the 2003-05 biennium to the 2005-07 biennium. The above

SAFETY EVALUATION TESTBEDS -- AN ASSESSMENT OF SAFETY PROJECT PRIORITIZATION IN THE WSDOT I2 PROGRAM
Pennsylvania Transportation Institute, University Park, PA 16802 E-7
mentioned trends emphasize the usefulness of a reliable predictive methodology for
targeting the locations where reductions in societal costs due to accidents would be
greatest.
Another benefit of this study is the development of a composite method that consistently
takes into account information from both the frequency and severity dimensions of
accidents. Incorporating severity will ensure that locations with high societal costs are
targeted for improvement. Such a method can be consistently used throughout
Washington State. This consistency may also substantially reduce the fiscal and
personnel resources which are currently used to collect and analyze roadway and roadside
data.
DATA AND METHODOLOGY
We used 190 roadway sections classified as high-accident locations in the Northwest
Region of WSDOT as our safety evaluation testbed. Information relating to geometrics
and traffic volume was compiled to correlate with the observed accident history and
predicted accident risk. Roadway geometrics included information on number of lanes in
cross section, number of interchanges and intersections in section, number of curves per
mile, presence of a median barrier, and whether or not the highway was divided.

SAFETY EVALUATION TESTBEDS -- AN ASSESSMENT OF SAFETY PROJECT PRIORITIZATION IN THE WSDOT I2 PROGRAM
Pennsylvania Transportation Institute, University Park, PA 16802 E-8
The existing WSDOT programming methodology examines accident histories over a
two-year period to determine high-accident locations. Every odd-numbered year, the
previous two years of accident data are analyzed. For example, in 2005, accident
histories for the 2003-2004 period are assembled and analyzed. The analysis is intended
to provide a list of HALs for the 2007-2009 biennium. The initial analysis of this data
identifies locations on the basis of severity, frequency and accident occurrence proximity.
Within a 0.1-mile interval, if six or more accidents are observed in a two-year period with
a total severity score of 10 points or higher, then, that roadway segment is initially
classified as a severe accident location (SAL). (Severity scores are assigned on a ten-
point scale. An accident that results in property damage only, i.e., the lowest severity, is
assigned one point, while a fatal accident is assigned 10 points. Other severity types such
as possible injury, evident injury and disabling injury are assigned 3, 5 and 9 points
respectively.) Adjacent or overlapping clusters that meet or exceed the above-mentioned
severity and frequency criteria are then combined, and assigned to one of six roadway
categories. Typically, the length of a roadway segment resulting from combining
accident clusters is less than one mile. The six categories include rural and full access
control, two-lane rural and no-full access control, four-lane or wider rural and no-full
access control, urban and full access control, two-lane urban and no-full access control,
and four-lane or wider urban and no-full access control state roadways. Average daily
traffic volumes and severity scores for the accident clusters within each of the six
roadway categories are used to compute severity rates per million vehicle miles. An
average severity rate is computed for each roadway category in order to benchmark the
individual roadway segments within a category. Any roadway segment with accident

SAFETY EVALUATION TESTBEDS -- AN ASSESSMENT OF SAFETY PROJECT PRIORITIZATION IN THE WSDOT I2 PROGRAM
Pennsylvania Transportation Institute, University Park, PA 16802 E-9
clusters exceeding the average severity rate for its category by at least one standard
deviation is then designated as a HAL. A second criterion not involving the computation
of severity rates can also come into play in the identification of HALs. By this criterion,
within a two-year period, if two or more fatal accidents occur on the 0.1-mile roadway
segment, classification as a HAL is warranted.
By description, current methodology is entirely based on histories, and targets a select
group of locations. The select group of locations as mentioned previously have to exceed
the “critical severity rate” criterion whereby the roadway segment severity rate is equal to
or higher than one standard deviation above the average severity rate. The larger the
deviation of a roadway segment’s severity rate from the critical rate, the greater the
segment’s “severity index.” By definition, a HAL’s severity index has a minimum value
of zero and increases as the segment’s severity rates deviates from the critical rate.
The above description highlights several safety performance measures currently in place
in WSDOT’s I2 program. Frequency and severity index are measures directly available
from the HAL identification process. In addition, societal costs of accidents are
computable, using up-to-date costs used by WSDOT for accident severity types. The
cost of a fatal or disabling injury is $1,100,000, with evident injury cost at $70,000,
possible injury cost at $35,000 and property damage at $6,500. In addition to this
measure, accident reductions, preventions and costs of those benefits and associated
benefit cost ratios of potential improvements are useful safety performance measures.
Agency inputs involve costs of improvements and infrastructure components contributing

SAFETY EVALUATION TESTBEDS -- AN ASSESSMENT OF SAFETY PROJECT PRIORITIZATION IN THE WSDOT I2 PROGRAM
Pennsylvania Transportation Institute, University Park, PA 16802 E-10
to the safety outcomes. Infrastructure components can be multivariate – including but not
limited to travel lanes, horizontal curves, interchanges, intersections, presence of
medians, and presence of centerline or median barriers. Traffic volumes are major
contributors to safety deficiencies. In order to address this multidimensional problem, a
methodology that can incorporate multiple outputs and inputs while providing a
consistent benchmark of improvement efficiency is necessary. Toward this end, we
employ data envelopment analysis (DEA). Data envelopment analysis is primarily used
for the analysis of efficiency of investments. When faced with multiple outputs and
multiple inputs, along with multiple decision units, DEA offers a prioritizing method that
ranks decision units in terms of their “relative efficiency.” (In our study, a HAL is the
unit of decision making.) The HALs that perform the best in terms of relative efficiency
are ranked the highest, for example an efficiency score of 100. HALs with efficiency
scores less than 100 follow in descending order of priority. By this definition, one or
more HALs can be ranked as highest in terms of priority. This is a useful property for
WSDOT’s decision making purposes with regard to I2 investments, since several HALs
can simultaneously provide the greatest benefits and resulting investment efficiencies.
The DEA method also has the flexibility of comparing multiple improvement scenarios
for any given HAL. This is particularly useful when agency costs and benefits are
evaluated in terms of benefit cost ratios. Using the DEA method, we can assess if low-
cost improvements can perform with better relative efficiencies than high-cost
improvements. Furthermore, DEA also provides insight on inputs that contribute the
greatest to the relative efficiency of a HAL.

SAFETY EVALUATION TESTBEDS -- AN ASSESSMENT OF SAFETY PROJECT PRIORITIZATION IN THE WSDOT I2 PROGRAM
Pennsylvania Transportation Institute, University Park, PA 16802 E-11
The second major dimension of the HAL identification process is the reliability of the
identification procedure. In our earlier description of the current methodology, we noted
that “turnovers” and HAL identifications were entirely history based. A predictive
method that forecasts at a high level of accuracy expected accident potential is
particularly useful from a pro-active standpoint. We noted that “turnovers” comprise 35
percent of the HAL sample when looking ahead two bienniums in advance. The
remaining 65 percent raises the critical issue of predictability. A method that can
correlate the multivariate infrastructure components to expected accident potential taking
into account uncertainty and variability associated with individual HALs is necessary.
By incorporating uncertainty into the analysis, we can provide “credibility levels” for
predictions of expected accidents for individual HALs. The intent behind this approach
is to establish prediction thresholds acceptable to WSDOT decision makers while
ensuring a high level of accuracy in the prediction process. Toward this end, we
employed Bayesian approaches to make use of their ability to improve risk predictability
of accident count locations. Not only is the Bayesian approach advantageous for high-
frequency accident locations, but also useful for injury-prone locations as well. The
Bayesian method provides predictions of total number of accidents, or number of
accidents by severity type depending on what the need may be, as well as credibility
levels for predictions for every individual HAL. The inputs are multivariate, i.e., several
infrastructure characteristics can be simultaneously used to develop the predictions.
Using a predictive method such as the Bayesian technique safeguards against “regression
to the mean” effects that may influence HAL identification. Regression to the mean is a
phenomenon whereby locations with higher than average accident counts regress to their

SAFETY EVALUATION TESTBEDS -- AN ASSESSMENT OF SAFETY PROJECT PRIORITIZATION IN THE WSDOT I2 PROGRAM
Pennsylvania Transportation Institute, University Park, PA 16802 E-12
lifetime average without intervention. In such cases, treating them as locations with
potential of improvement would appear to be misguided investments.
FINDINGS, RECOMMENDATIONS AND IMPLEMENTATION PLAN
Two main findings emerged from this study. The first finding relates to the usefulness of
data envelopment analysis to the analysis of safety investments within the WSDOT
programming context. This method is especially useful for analyzing the efficiency of a
program in terms of relationship between design inputs and multiple performance
outputs. Multiple performance outputs in a safety context typically include accident
counts, severity index, societal cost of accidents and benefit cost. In combination with
data envelopment analysis, we propose a method that employs hierarchical Bayesian
techniques to improve significantly the predictive reliability of accident risk and hence
more robustly identify sites with safety improvement potential.
Specific findings emerging from the DEA method indicate that up to 50 roadway HALs
ranked as top priority locations, i.e., priority ranking of one. A priority ranking of one for
50 out of 190 locations implies approximately 26 percent of HALs are top priority
locations. With enhanced data collection and multiple improvement alternatives, the
possibility of assigning top priority to a broader set of locations exists. The HB method
for predicting accident counts for the 190 HALs showed that the locations selected will
maintain their observed accident profile at a high level of credibility. Since we noted that

SAFETY EVALUATION TESTBEDS -- AN ASSESSMENT OF SAFETY PROJECT PRIORITIZATION IN THE WSDOT I2 PROGRAM
Pennsylvania Transportation Institute, University Park, PA 16802 E-13
the current HAL methodology is primarily history-based, the prediction method’s
usefulness is in benchmarking the identification of HALs. As such, it should be noted
from this study that the methods used are not intended to replace WSDOT methodology
per se; rather, they are used as part of a parallel process to ensure current methodology is
robust. The main advantage of the methods used in this study is to suggest broader
coverage of top priority locations, where history-based methods are limited in their
capabilities. It is hence recommended that the methods used in this study be employed as
supplementary tools systemwide to maximize opportunities for I2 efficiency, while
maintaining current methodology. Details on the predictive accuracy our methods and
suggestions for improving the accuracy are noted below.
In a safety context, at the very least, typical design inputs relate to number of lanes,
horizontal curvature, number of intersections and interchanges in the corridor. Such data
are widely available and relatively straightforward and simple to collect and maintain.
Using basic design inputs such as those described above, we were able to identify the
design element of greatest need for a particular location. To be sure, a comprehensive set
of design inputs are necessary to accurately identify contributing factors. As a systematic
recourse to identification of a broader set of safety needs, a second finding emerged.
This relates to the usefulness of predictive methodologies for WSDOT. In reality,
historical data is currently used to determine what investments are required at specified
high-accident locations. A hierarchical Bayesian (HB) approach to the issue of
predicting accident propensities allows us to quantify the “degree of credibility” in our
estimates of accidents at the high-accident locations. This methodology has shown the

SAFETY EVALUATION TESTBEDS -- AN ASSESSMENT OF SAFETY PROJECT PRIORITIZATION IN THE WSDOT I2 PROGRAM
Pennsylvania Transportation Institute, University Park, PA 16802 E-14
potential to be accurate in its predictions. We benchmarked the HB method against a
traditional prediction method, namely the negative binomial (NB) model. The NB model
has been widely used nationally and internationally in the safety literature as a predictive
tool for estimating accident potential. With a very limited set of design inputs, the HB
method improves prediction several-fold, with approximately 48 percent of locations
estimated with accident predictions that are within 5 percent of observed counts.
Comparatively, the NB method could only predict 13 percent of the locations at the 5
percent error margin. If the margin of prediction error is increased to 10 percent, then the
HB method predicts 67 percent of locations correctly while the NB method predicts only
23 percent.
Some recommendations also emerged from this study. First and foremost is the
recommendation to test this methodology on the entire WSDOT safety programming
network to examine the robustness of prioritization under multiple performance criteria.
We propose that extensions to this study involve a full-fledged benefit-cost analysis of
proposed safety improvements. In concert, it is also recommended that a data
envelopment approach be used to incorporate benefit cost into the efficiency analysis.
We excluded benefit cost from this analysis for the reason that information on benefit
cost is incomplete. For example, it was not clear as to how many improvement
alternatives were considered for individual HALs. It is proposed that accident reduction
factors be used to estimate safety benefits accurately first, and then benefit costs resulting
from that analysis be used as a performance output in a DEA analysis. Second, one can
then extend this methodology to the broader programming framework to include cross-

SAFETY EVALUATION TESTBEDS -- AN ASSESSMENT OF SAFETY PROJECT PRIORITIZATION IN THE WSDOT I2 PROGRAM
Pennsylvania Transportation Institute, University Park, PA 16802 E-15
program decision requirements such as preservation and improvement simultaneously.
Such a step would be recommended once robustness and reliability of the DEA method
are established within the I2 program at the statewide level. We also determined based
on the limited dataset provided to us that using a societal cost approach that separates
fatal accidents from disabling accidents may result in a priority scheme that could be
different. Currently, WSDOT values disabling and fatal accidents equally for priority
purposes; the reason being a fatal accident by weight of its societal cost could potentially
skew priority schemes toward historically fatal locations.
Some recommendations for a vision for WSDOT’s future safety programming efforts are
in order. The issue of programming “turnover” raises interesting responses stemming
from this research. WSDOT is actively pursuing prediction efforts to improve efficiency
in investments. The qualitative sense from the preliminary findings from this study using
the NB and HB techniques for safety prediction indicate that a prediction accuracy of 80
to 85 percent at a 10 percent error margin is a reasonable goal for WSDOT to strive for.
We base this expectation on findings from the “visual benchmark models,” which for the
most part rely on information gathered from WSDOT’s SR View. As such, when one
factors in the added value of information from geometrics and roadside inventory
databases, the improvements in WSDOT’s predictive capabilities could be significant.
The second recommendation issue in order is a plan for future work related to this
research that will significantly benefit WSDOT’s ongoing prediction efforts. A series of
actions is recommended below to this purpose:
SAFETY EVALUATION TESTBEDS -- AN ASSESSMENT OF SAFETY PROJECT PRIORITIZATION IN THE WSDOT I2 PROGRAM
Pennsylvania Transportation Institute, University Park, PA 16802 E-16
1. Develop region-by-region “visual benchmark models” using hierarchical Bayesian
techniques and using variables currently used in this research. By doing so, WSDOT
can establish prediction baselines that are aggressive but using minimal data
collection effort.
2. Integrate current geometric, roadside and weather information from WSDOT’s
databases to establish a consistent statewide database for use in advanced prediction
schemes to be benchmarked against the visual benchmark models such as those
developed in this study. Perform a benchmark analysis region-by-region so as to
ensure regional flexibility in the identification of critical safety projects.
3. Establish region-by-region data envelopment analysis methods to systematically
stratify project prioritization schemes that take into account a multitude of decision
making criteria such as accident counts, benefit-cost ratios of recommended safety
treatments and severity indices to develop a programmatically robust prioritization
list.
4. Apply the HB and DEA methods to critical I2 programming areas such as interstates,
high accident locations, high accident corridors and at-grade intersections. By
applying the methodologies to a broader set of I2 programs, a consistent list of safety
performance measures can be identified for benchmarking I2 investment efficiencies
on a statewide basis.
5. Data integration for the purpose of interstates, high accident locations, high accident
corridors and at-grade intersections will require spatial scales that vary by area of
application. For example, for HALs, the spatial scale is 0.1 miles with a rolling 0.01-
mile window, while HACs will be determined on the basis of one-mile scales with

SAFETY EVALUATION TESTBEDS -- AN ASSESSMENT OF SAFETY PROJECT PRIORITIZATION IN THE WSDOT I2 PROGRAM
Pennsylvania Transportation Institute, University Park, PA 16802 E-17
0.5-mile rolling windows. Interstates will require a combination of methods based on
both HAL and HAC procedures, while at-grade intersections will involve localized
windows specific to intersections and their vicinities. Data requirements relating to
modeling will also vary between at-grade intersection and highway prioritization
programs.

SAFETY EVALUATION TESTBEDS -- AN ASSESSMENT OF SAFETY PROJECT PRIORITIZATION IN THE WSDOT I2 PROGRAM
Pennsylvania Transportation Institute, University Park, PA 16802 1
INTRODUCTION
The purpose of this report is to provide the Washington DOT a resource to prioritize
transportation improvement projects from a safety management perspective. The report
presents a methodology that is able to compare and contrast the geometric features of
different collision locations and is able to identify the location specific factors
contributing most to the occurrence of collisions. The methodology provides for
collision predictions thus enabling the development of a priority list of locations that
require safety improvements.
The current Washington State Department of Transportation (WSDOT) method for
evaluating roadway projects for safety upgrades relies on procedures that combine
frequency and severity of accidents at locations in a weighted manner. This is a
reasonable procedure that captures a significant portion of locations deserving of safety
upgrades in a consistent manner. However, what is not apparent from the programming
process is the cause of turnovers of locations from year to year. “Turnover” is defined
as a location that repeats as a high-priority accident spot or corridor. The percent
of locations “turning over” from one biennium to the next varies by functional class
and region. One main issue underlying the turnover rate is the reliability of predictions
of accident risk. The second issue related to the turnover rate is one of efficient
investment. Any given highway accident corridor needs to be examined in terms of
benefits and costs from safety investments, and how they efficiently relate to
performance of the location. To fully optimize the Highway Safety Management System
(HSMS) at the WSDOT, both of the above-mentioned dimensions need to be addressed
simultaneously. Accident occurrence prediction and approaches for establishing

SAFETY EVALUATION TESTBEDS -- AN ASSESSMENT OF SAFETY PROJECT PRIORITIZATION IN THE WSDOT I2 PROGRAM
Pennsylvania Transportation Institute, University Park, PA 16802 2
consistent and sustainable safety programs in addressing risk through proper and timely
investment are the main issues researched in this report. To this end, we analyzed a pilot
subset of the WSDOT I2 program that specifically deals with safety needs. The I2
program targets locations on the state network primarily for safety improvements. The I2
program is a sub-program within WSDOT’s “Improvement” category. The I2 program
involves capital projects that are prioritized strictly on safety needs. In WSDOT
parlance, the I2 program is also referred to as the safety improvement program. We
examined 190 sections in the Northwest Region and provide findings related to both
predictive reliability and programming efficiency issues.2
BACKGROUND STATEMENT
Motor vehicle accidents continue to be a major cause of death and injury in the United
States. As a consequence, state and federal agencies expend considerable resources in an
effort to improve safety by implementing countermeasures that include improving
highway geometrics, highway signing, and the roadside. The goal of WSDOT, the
Washington State Patrol, and the Washington Traffic Safety Commission is to reduce and
eliminate deaths and disabling injuries on our state’s highways and roads. Figure 1
shows fatality rate trends for three networks – national, Washington State highway, and
2 Federal law 23 USC § 409 prohibits the discovery or admission into evidence of “reports, surveys, schedules, lists, or data” compiled or collected for the purpose of highway safety improvement projects that might qualify for federal safety improvement funding.
SAFETY EVALUATION TESTBEDS -- AN ASSESSMENT OF SAFETY PROJECT PRIORITIZATION IN THE WSDOT I2 PROGRAM
Pennsylvania Transportation Institute, University Park, PA 16802 3
Washington roads. Fatality rates are measured in terms of fatalities per 100 million
vehicle miles traveled.
Figure 1. Comparison of Traffic Fatality Rates from 1990 to 2000. (Source: WSDOT Transportation Data Office)
The WSDOT is a leader in the management of fatal and disabling injury rates nationally.
A recent internal study (highlighted in the WSDOT Gray Notebook) conducted by key
WSDOT safety staff reports that
“Washington State has one of the lowest fatal accident rates per hundred
million vehicle miles traveled among all 50 states. WSDOT evaluates past
accident history to determine strategies to further reduce fatal and
disabling crashes. This approach is incorporated into the state’s long
range plan (Washington Transportation Plan) and used to direct future
capital investments.”
SAFETY EVALUATION TESTBEDS -- AN ASSESSMENT OF SAFETY PROJECT PRIORITIZATION IN THE WSDOT I2 PROGRAM
Pennsylvania Transportation Institute, University Park, PA 16802 4
In recognition of its practices, the American Association of State Highway and
Transportation Organizations (AASHTO) recognized WSDOT for its proactive approach
to safety. In May 2005, AASHTO presented WSDOT with its Safety Leadership Award.
WSDOT’s approach is based on a “local, corridor and system-wide perspective.”
Working with other safety agencies, WSDOT adopted a strategic safety plan, called
Target Zero. “As an outcome, the state has had a 56% decrease in fatal and disabling
crash rates since 1990 even though vehicle miles traveled over that period have increased
by 35%.”
In light of such advances in safety management, the WSDOT is continually improving
the safety management process through approaches that are pro-active. A proactive
approach would improve potentially problematic areas before severe accidents occur.
Statistical modeling provides a proactive approach by developing a relationship between
the severity or frequencies of accidents and information on road geometrics, traffic
volumes and roadside features. The “proactive” capability arises from WSDOT’s ability
to predict accident occurrence and severity using existing infrastructure information.
Applying proactive approaches in the WSDOT I2 program context requires
categorization of accident locations. The Washington State Department of
Transportation categorizes highway accident prevention and reduction locations in the
following manner:
High Accident Location (HAL): spot locations less than a mile long with a higher than
average rate of severe accidents in the past 2 years.

SAFETY EVALUATION TESTBEDS -- AN ASSESSMENT OF SAFETY PROJECT PRIORITIZATION IN THE WSDOT I2 PROGRAM
Pennsylvania Transportation Institute, University Park, PA 16802 5
Pedestrian Accident Location (PAL): spot locations (0.10 mi or less) that have 4
accidents in a 6-year period.
High Accident Corridor (HAC): sections of state highway one or more miles long, with a
higher than average number of severe accidents over a continuous period of time.
A detailed explanation of WSDOT’s current methodology behind identification of HAL
is provided in a following section on data and methodology.
OBJECTIVES
The objective of this study was to assess the current system of prioritizing and
programming safety projects through WSDOT’s I2 program, with a special focus on
high-accident locations. Pedestrian accident locations and high accident corridors were
not part of this study. However, the extension of the proposed methodology to those
categories is straightforward. Accident risk prediction reliability and identification of
methods for assessment of safety programming efficiency on the basis of multiple safety
performance measures were the major goals of this analysis.
BENEFITS AND CONTEXT
The major benefit of this study will be a method to address systematically the
programming of all projects in the state’s I2 program. This includes coverage of collision
prevention and collision reduction sub-programs on a comprehensive basis. In doing so,
WSDOT will be able to implement procedures that prioritize locations in terms of social
costs and benefits, while providing for maximal coverage of locations in terms of

SAFETY EVALUATION TESTBEDS -- AN ASSESSMENT OF SAFETY PROJECT PRIORITIZATION IN THE WSDOT I2 PROGRAM
Pennsylvania Transportation Institute, University Park, PA 16802 6
identified and funded improvements. While this is a complex goal to accomplish, the
benefit will be significant. As an example, if one were to consider HALs in each biennial
cycle, over 650 locations are typically identified for improvements. Scoping for
improvements begins with identifying trends in accident histories. Accurate
identification of safety improvement priorities with a high level of certainty maximizes
the efficiency of the scoping process. With WSDOT’s 2005-2015 ten-year plan for
Highway Safety Improvements providing for nearly a billion dollars in targeted safety
enhancements, the I2 process has much to gain from systematically addressing project
turnover in system plans from one biennial cycle to the next. “Turnover” is defined as a
location that repeats as a high-priority accident spot or corridor. The percent of locations
“turning over” from one biennium to the next varies by functional class and region. In
the case of HALs for example, among all six regions, Northwest Region “turnovers” are
the highest across three bienniums (2003-2005 to 2007-2009), as shown in Figure 2.
Percent of 2003-05 High Accident Locations
Turning Over in 2005-07 and 2007-09 Bienniums
38%
11%
34% 35%
27% 29%
35%
0%
5%10%
15%
20%
25%30%
35%
40%
North
wes
t
North
Cen
tral
Olympic
Sou
thwest
Sou
th C
entra
l
Eas
tern
Sta
te
Tu
rno
ver
(Rep
eat)
Figure 2. High Accident Location Turnover Trends.

SAFETY EVALUATION TESTBEDS -- AN ASSESSMENT OF SAFETY PROJECT PRIORITIZATION IN THE WSDOT I2 PROGRAM
Pennsylvania Transportation Institute, University Park, PA 16802 7
As seen in Figure 2, 38 percent of the Northwest Region HAL network turns over from
the 2003-2005 biennium to the 2007-2009 biennium. The state as whole turns over 35
percent of the 650 high accident locations during the same period, while, North Central
Region turns over the least, 11 percent. The variability in regional turnovers is
attributable to the distribution of urban, high volume locations in the state network.
Regardless of the variability, consistent system-level enhancements that address with a
high level of certainty, necessary safety improvements at properly prioritized HALs also
result in improved project life cycles, thereby enhancing investment efficiency. If the
“turnover” period is limited to two bienniums, approximately 50 percent of HALs
statewide turn over from the 2003-05 biennium to the 2005-07 biennium. The above
mentioned trends emphasize the usefulness of a reliable predictive methodology for
targeting the locations where reductions in societal costs due to accidents would be
greatest.
Another benefit of this study is the development of a composite method that consistently
takes into account information from both the frequency and severity dimensions of
accidents. Incorporating severity will ensure that locations with high societal costs are
targeted for improvement. Such a method can be consistently used throughout
Washington State. This consistency may also substantially reduce the fiscal and
personnel resources which are currently used to collect and analyze roadway and roadside
data.

SAFETY EVALUATION TESTBEDS -- AN ASSESSMENT OF SAFETY PROJECT PRIORITIZATION IN THE WSDOT I2 PROGRAM
Pennsylvania Transportation Institute, University Park, PA 16802 8
STUDY METHODOLOGY
We present here the general methodological approach to the assessment of WSDOT’s
safety programming process. In so doing, we recommend a composite framework that
embodies the strengths of proven techniques such as Bayesian prediction and data
envelopment analysis. To describe the methodology further, a brief description of the
decision-making context of WSDOT’s programming process is first necessary. Key
activities relating to data, personnel, analytical and decision making issues are described.
Table 1 below provides a brief overview of these activities.
Table 1. Decision Processes in a Typical Safety Evaluation System Local Policy
Establishes policy and responsibilities for units within WSDOT as well as counties and local administration boards
Data Collection
Provides information to support decisions for identifying critical safety inventory, needs, and countermeasures, and monitoring the results of safety decisions (system performance)
Data Analysis
Converts field data into usable information to assist decision makers in identifying safety needs and countermeasures, and monitoring the results of their decisions
System Output
Presents analyzed and processed data in a format that is usable for decision makers
Project Prioritizing and
Program Development
Includes final prioritizing of transportation safety needs, selecting cost effective solutions, and adopting safety policies, standards, procedures and programs
Program Implementation
Carries out funded projects resulting in safety enhancements as well as educational, enforcement, and emergency programs
Performance Monitoring Measures and analyzes results of transportation safety decisions, countermeasures, and programs; provides information from which “base year,” efforts are forecast and evaluated and future work programs are developed
Annual Safety Report
Reports, on an annual basis, the results of safety system work efforts, expenditures, and system performance

SAFETY EVALUATION TESTBEDS -- AN ASSESSMENT OF SAFETY PROJECT PRIORITIZATION IN THE WSDOT I2 PROGRAM
Pennsylvania Transportation Institute, University Park, PA 16802 9
The scope of this report concentrates on Data Collection, Data Analysis, System Output
and Project Prioritization (excluding project development) steps. It is recognized that
within the project prioritization step, several sub programs will be involved, including
interstates, high-accident locations and corridors, at-grade intersections, pedestrian
locations, intersection improvements to reduce the risk of collisions, rural roadside safety
improvements and corridor improvements for passing lane safety. To incorporate these
issues into a framework that is eventually suitable for an on-going, long-term evaluation
of WSDOT’s I2 program, we present Figure 3 that follows. Figure 3 is a composite
framework that employs in a parallel manner the strengths of Bayesian and data
envelopment analysis methods as they relate to the various goals of the safety
programming process. We note here that the main contribution of Bayesian
methodologies lies in the predictive aspects of accident risks, i.e., identification of sites
with promise. The data envelopment analysis procedure contributes mainly to the
ranking of sites with promise on the basis of multiple performance criteria. To fully
integrate the Bayesian and data envelopment techniques, feedback loops need to be
established, which we discuss in the findings section of this document. As mentioned
previously, this study is a safety evaluation testbed analysis, not a full-blown analysis of
the entire I2 program at the WSDOT. As such, the study focuses on the feasibility,
reliability and relevance of the framework presented in Figure 3.

SAFETY EVALUATION TESTBEDS -- AN ASSESSMENT OF SAFETY PROJECT PRIORITIZATION IN THE WSDOT I2 PROGRAM
Pennsylvania Transportation Institute, University Park, PA 16802 10
Figure 3 Analysis Methodology
The framework in figure 3 can be broken down into predictive and historical components
– the Bayesian method constituting the predictive component and data envelopment
analysis constituting the historical component. The main idea behind this composite
Data Collection for
190 Candidate Sections
Employ Frequentist and Bayesian
Methods for Accident Frequency
Identify Safety Performance
Outputs
Establish Credibility Intervals for
Frequency Estimates
Employ Data Envelopment Analysis
on Performance Outputs
Identify Significant
Design Factors
Establish Priority Rankings for
190 Candidate Sections
History-Based Analysis
Predictive Analysis

SAFETY EVALUATION TESTBEDS -- AN ASSESSMENT OF SAFETY PROJECT PRIORITIZATION IN THE WSDOT I2 PROGRAM
Pennsylvania Transportation Institute, University Park, PA 16802 11
approach is to maximize information that is historical as well as pro-active. With
historical data, information on accident counts and severity is available. In addition,
societal costs of accidents are also available. The WSDOT also computes the severity
index of sites using an average severity rate as a baseline for comparison. By making use
of historical information mentioned above in conjunction with computed severity indices,
a method to prioritize sites allowing for the possibility that multiple sites can be ranked
with equal importance, can be explored. Such an approach is beneficial in the context of
fiscally constrained programming, in order to maximize the set of improvement locations
under consideration, as well as the set of improvement choices for those locations. For
example, two locations with identical priorities may require very different levels of
investment. By pursuing investments that target locations with similar priorities, but with
potentially greater returns at a smaller scale of investment, the potential for prioritization
coverage in terms of locations addressed is also enhanced.
Historical information is of limited insight into how sites’ accident potential changes over
time. By correlating geometric and traffic volume data with observed accident counts,
predictive models that estimate accident risk in upcoming bienniums are necessary. The
usefulness of predictive models lies in their ability to predict with a high level of
credibility the expected risk, while making use of limited data. Data collection,
maintenance and continued collection in future years are significant resource issues. In
this light, an objective of this study is to examine the level of predictive accuracy that can
be achieved with commonly available geometric and traffic volume data. The main
benefit from a programming standpoint is the identification of turnovers – sites that

SAFETY EVALUATION TESTBEDS -- AN ASSESSMENT OF SAFETY PROJECT PRIORITIZATION IN THE WSDOT I2 PROGRAM
Pennsylvania Transportation Institute, University Park, PA 16802 12
repeat over multiple bienniums. To complete the decision loop, a re-ranking of sites
using estimated counts is necessary. By comparing priorities based on history as well as
predictive models, WSDOT decision makers can visualize where safety improvement
potential is greatest.
In summary, by ranking sites in order of priority, and determining how many of these
sites continue to be turnovers over multiple bienniums, the WSDOT is better positioned
to make judicious investments in safety while maximizing spatial coverage of their high
accident locations.
LITERATURE REVIEW
A review of accident modeling literature reflects the variety of methods that have been
used to model accidents. The conventional method to model accidents is using linear
regression to model accident rates, a continuous number (for example Mulinazzi and
Michael 1969; Shah 1968). This is a straightforward method that models the number of
accidents per million vehicle miles (known as accident rate) for a given roadway
segment. Research identified that linear regression has many drawbacks, such as lack of
distributional properties to describe random event counts (frequencies) such as vehicle
accidents. Furthermore, if linear regression is used to model accident counts as opposed
to rates, then the estimated parameters associated with contributing factors are biased and
inconsistent. In such a situation, predictions would be incorrect. One alternative to

SAFETY EVALUATION TESTBEDS -- AN ASSESSMENT OF SAFETY PROJECT PRIORITIZATION IN THE WSDOT I2 PROGRAM
Pennsylvania Transportation Institute, University Park, PA 16802 13
model accident frequencies is to use count models such as Poisson and negative binomial
(and their suitable variations) models.
More recent methods used for modeling accident frequencies include models such as the
Poisson and negative binomial (see for example Shankar, Mannering and Barfield 1995;
Poch and Mannering 1996; Milton and Mannering 1998) and the zero inflated Poisson
and zero inflated negative binomial (for example Shankar, Milton, and Mannering 1997).
The Poisson model, while possessing desirable statistical properties (that linear
regression lacks), is not suitable for overdispersed data. Accident data are overdispersed.
Due to overdispersion, the variance of counts exceeds the mean, thereby violating the
property of equality between variance and the mean inherent in the Poisson model. As a
result, employment of Poisson model for overdispersed data results in underestimation of
coefficient variances and likelihood of accidents. Shankar et al 1995 showed that the
negative binomial model incorporates overdispersion and thus avoids the underestimation
of coefficient variances and likelihoods.
Emerging research in Bayesian methods has shown that the predictive power of
hierarchical Bayesian techniques may be superior to the classical frequentist approaches
mentioned in the literature described above. Frequentist approaches involve the
development of accident likelihoods based on observed data. Bayesian approaches
incorporate subjectivity in addition to information from observed data. Subjectivity in
Bayesian approaches typically involves judgments on the nature of coefficients
associated with accident risk factors. The transportation safety field is not without

SAFETY EVALUATION TESTBEDS -- AN ASSESSMENT OF SAFETY PROJECT PRIORITIZATION IN THE WSDOT I2 PROGRAM
Pennsylvania Transportation Institute, University Park, PA 16802 14
precedent in the application of Bayesian methods, much less other fields such as
pavement engineering. Hossain, Chowdhury and Gisi (2002) present a project
prioritization process for the Kansas Department of Transportation (KDOT) using a
pavement structural attribute termed Pavement Structural Evaluation (PSE).
Maritime traffic safety has evidenced the use of Bayesian methods (Or and Kahraman
2002). In assessing the safety of land-borne traffic particularly, Davis and Yang (2001)
use Hierarchical Bayes methods combined with an induced exposure model in order to
identify intersections where the crash risk for a given driver subgroup is relatively higher
than that for other groups. Abdel-Aty and Pande (2005) identify freeway loop detector
data patterns that potentially precede traffic accidents in order to establish a link between
real-time traffic flow parameters and accident occurrence. They employ a Bayesian
classifier based methodology, probabilistic neural network (PNN) to illustrate the
predictive power of Bayesian-based techniques. Perhaps the most relevant and
contemporarily useful work in recent years in the field of transportation safety comes
from the research of McNab (2003, 2004). In 2003, McNab presented a Bayesian
hierarchical methodology to model and analyze accident and injury surveillance data. The
objective of that work was to help develop programs to address high risk regions for
preventive programs. In 2004, McNab presented yet another study within which,
analysis of accident and injury variations, risk factor effects, random spatial effects and
age effects can be considered simultaneously. The modeling techniques provided
extended scope and flexibility in accommodating spatial effects as well as nonlinear age
effects.

SAFETY EVALUATION TESTBEDS -- AN ASSESSMENT OF SAFETY PROJECT PRIORITIZATION IN THE WSDOT I2 PROGRAM
Pennsylvania Transportation Institute, University Park, PA 16802 15
There has been considerable discussion in the literature related to the identification of
sites with promise and ranking of those sites. Perhaps the most compelling work to date
emanates from the collection of research embodied in Hauer, Harwood, Council and
Griffith (2002), Elvik (2004), and Hauer, Allery, Kononov and Griffith (2004). In the
latter body of work, the authors discuss in a methodical manner the development of a
program of local safety improvements. The finding they present is of great relevance to
this study. The authors conclude that sites at which the most accidents or the most
severity-weighed accidents are expected, lead to the most cost-effective projects. Along
a parallel theme, Geurts, Wets, Brijs and Vanhoof (2004) conclude that variability exists
in the identification and ranking of “accident blackspot sites." They show that use of
estimates instead of historical count values on the other hand do have important
consequences for the selection and ranking of black spots. They conclude this is
important not only for the number of accident locations that will receive a different
ranking order but also for the effect on the type of accident locations that are selected as
dangerous. We believe the above-mentioned bodies of work are of eminent value to the
study being undertaken in this report. Hence, the methodology presented in our report
parallels this thinking, but builds on this body of work by employing state-of-the-art
analysis techniques such as hierarchical Bayes and data envelopment analysis.
Integrating Bayesian and data envelopment analysis methods in the safety context is
without precedent in the reported literature.

SAFETY EVALUATION TESTBEDS -- AN ASSESSMENT OF SAFETY PROJECT PRIORITIZATION IN THE WSDOT I2 PROGRAM
Pennsylvania Transportation Institute, University Park, PA 16802 16
Other studies of relevance in the Bayesian perspective include work on the estimation of
benefits of safety improvements. Clarke and Sarasua (2003) employed a Bayesian
approach to develop crash reduction factors (CRFs) for specific countermeasures.
Rimiller, Ivan and Garrick (2003) apply empirical Bayesian methodology to estimate
impacts of left-turn treatments. A comparison of empirical Bayes and frequentist
methods to predict sites with promise is shown in Saccomano, Grossi, Greco and
Mehmood (2001). Davis (2001), Melcher, Dixon, Washington and Wu (2001), Hanley,
Gibby and Ferrara (2000), and Persaud, McGee, Lyon and Lord (2003) extensively
discuss various aspects of safety benefits estimation using Bayesian techniques. The
studies finds that fewer sites are identified using the empirical Bayes approach suggesting
significant cost savings in safety investments. This body of work is of value for on-
going, long-term extension of the research conducted in this report.
Finally, from a pure modeling standpoint, perhaps the most relevant contemporary work
in the comparison of empirical Bayes and full Bayes research comes in the form of a
study done by Miaou and Lord (2003). The authors examine classic issues of relevance
to safety modelers, such as functional forms, parametric restrictions and goodness-of-fit
measures.
We also discuss here extant literature on the application of data envelopment analysis to
the field of transportation. The discussion is oriented toward the assessment of efficiency
of transportation infrastructure operation. As such, insights related to this topic are of
direct relevance to the safety programming issues considered in this report. Alder and

SAFETY EVALUATION TESTBEDS -- AN ASSESSMENT OF SAFETY PROJECT PRIORITIZATION IN THE WSDOT I2 PROGRAM
Pennsylvania Transportation Institute, University Park, PA 16802 17
Berechman (2001) mention that the relative efficiency and quality of airports seems to
play a strong role in airlines' decision making regarding choice of hub locations.
Previous studies of airport quality and efficiency have focused on passenger responses to
surveys. The Alder-Berechman article describes the development of a model to
determine airport quality and efficiency based on the responses of the airlines. Several
European and non-European airports were the subject of the questionnaire which was
designed to measure factors such as delay data, runway capacity, local labor force
availability and costs and the reliability of air traffic control.
Francis and Humphreys (2002) present a paper that examines how benchmarking is being
used by airport managers as a means for internal performance comparison and
improvement. Drawing on interviews with airport managers and a questionnaire survey
of the world's top 200 busiest passenger airports, the paper discusses the nature,
prevalence and consequences of current benchmarking practices in airports. Also
included is a review of the literature on airport benchmarking and a discussion of the
characteristics and relevance of best practice benchmarking.
Pels, Nijkamp and Rietveld (2003) consider the efficiencies of European airports and
estimate production frontiers for these airports using both stochastic frontier and data
envelopment analyses. They argue that European airports, on average, are inefficient and
that airline inefficiency contributes significantly to airport inefficiency in terms of air
passenger movements. The authors find that the average European airport operates under
constant returns to scale in producing air transport movements and under increasing

SAFETY EVALUATION TESTBEDS -- AN ASSESSMENT OF SAFETY PROJECT PRIORITIZATION IN THE WSDOT I2 PROGRAM
Pennsylvania Transportation Institute, University Park, PA 16802 18
returns to scale in producing passenger movements. These operating characteristics are
statistically tested in a stochastic frontier model.
Odeck (2005) uses data envelopment analysis to investigate target achievements of the
Norwegian Public Roads Administration (NPRA) charged with traffic safety services.
The data envelopment framework is used to measure growth in target achievements.
They find that technological progress contributes most to growth in target achievements.
This is a particularly useful finding for the study at hand. Technological progress at
WSDOT can include improved data collection and maintenance services, technological
improvements in decision models as well as improvements in the interfaces between
people, process and technology. Technological progress involves a cultural shift in
decision making – one that balances history-based decision making with predictive
decision making.
ANALYTICAL TECHNIQUES
We present in this section a brief discussion of hierarchical Bayesian and data
envelopment methods. Hierarchical Bayesian methods are discussed first followed by
data envelopment methods.
Bayesian methods explicitly use probability to quantify uncertainty. After fitting a
probability model to data, Bayesian inference summarizes the result by a probability
distribution on unobserved quantities such as the parameters of the model, or predictions
SAFETY EVALUATION TESTBEDS -- AN ASSESSMENT OF SAFETY PROJECT PRIORITIZATION IN THE WSDOT I2 PROGRAM
Pennsylvania Transportation Institute, University Park, PA 16802 19
for new observations. Unobserved quantities in our study include parameters
(coefficients) associated with accident risk factors, as well as predictions of accidents at
high-accident locations. For example, one will be able to say that “on State Route 2, the
location with milepost limits 0.00 to 0.19, and length of 0.19 miles, is expected to have at
a 97.5 percent credibility level, no more than 26 biennial accidents.” This is a probability
statement on the predicted or estimated accident count at the stated location on State
Route 2. Similarly, one can also make probability statements on the parameters
(coefficients) associated with accident risk factors. Parameters (coefficients) are some
measure of the marginal impact of risk factors on accident counts. One cannot say for
sure that the marginal impact of intersections on accident counts is exactly a 10 percent
increase for each intersection added to the network. Clearly, judgment and experience
say that intersections increase exposure and hence would increase accident likelihoods.
As such, it is reasonable to state the marginal impact of intersections in terms of
“credibility levels.” For example, the statement “the addition of each intersection to the
network results in a 10 percent increase in accident counts at the 50 percent credibility
level” suggests that the probability of the impact being a 10-percent increase is 50
percent. In other words, this statement quantifies the level of uncertainty underlying the
increase in accident counts as a result of the addition of an intersection to the network.
These probability statements are conditioned on the observed data. The Bayesian
approach to inference specifies two distributions:
• a prior distribution P(θ) for the parameters that reflects knowledge about θ before
seeing the data. The “prior” is a definition of the statistical model before
observing the data.

SAFETY EVALUATION TESTBEDS -- AN ASSESSMENT OF SAFETY PROJECT PRIORITIZATION IN THE WSDOT I2 PROGRAM
Pennsylvania Transportation Institute, University Park, PA 16802 20
• a distribution P(y|θ) for the data given parameters,
The posterior distribution combines these distributions, and reflects knowledge about θ
being updated after seeing the data:
∫=
dyPyP
PyPyP
)()|(
)()|()|(
θθ
θθθ
The posterior is a definition of the statistical model after observing the data.
Predictive Distribution
A future observation y~ (in our case, accident counts at a given location) may be predicted
using a predictive distribution )|~( yyP based on the posterior distribution as follows:
θθθ dyPyPyyP )|()|~()|~( ∫=
Importantly, this accounts for the uncertainty in the estimation of θ, the set of coefficients
associated with various accident risk factors.
The advantage of Bayesian approaches is directly quantifying uncertainty when
predictive models with many parameters are considered. This is especially the case in
traffic safety programming where roadway geometrics, traffic factors and environmental
conditions play a dominant role. Human factors are not easily measurable in terms of
their association with traffic accidents. For example, measuring seat belt use for various
geographic regions, or drunk driving over long periods of time requires an inordinate
amount of surveys. Moreover, predicting how human factors change over time is
challenging. Hence, maintaining over the long-term, sustainable sources of human
factors information is an expensive proposition at state departments of transportation.
Hence, to develop a predictive paradigm that maximizes predictive power with easily
SAFETY EVALUATION TESTBEDS -- AN ASSESSMENT OF SAFETY PROJECT PRIORITIZATION IN THE WSDOT I2 PROGRAM
Pennsylvania Transportation Institute, University Park, PA 16802 21
available DOT data, the Bayesian paradigm gives freedom to set up complex models by
supplying a conceptually simple method. Although a realistic model may require many
parameters, interest usually focuses on a smaller number of parameters, such as
intersections and interchanges, horizontal curves, average daily traffic, presence of
median barriers, whether highways are divided or not, roadway cross section, etc. Such
data are readily available and viewable in digital format on WSDOT media.
HIERARCHICAL MODELS
The Bayesian approach shows its greatest practical advantage in hierarchical models.
Assume that data are collected from many groups of roadway sections that have observed
accident, roadway and traffic characteristics. Roadway geometrics in particular will be
somewhat similar across sections. Rather than making inferences separately for each
group, usually it is desirable to combine the information from the various groups in order
to better understand the phenomenon under study.
Since there might be substantial variability between the groups, a natural way to approach
the problem is to build a two-stage “hierarchical model” as follows:
• a set of first level models for clusters or groups of observed data. These models
are sometimes known as individual models.

SAFETY EVALUATION TESTBEDS -- AN ASSESSMENT OF SAFETY PROJECT PRIORITIZATION IN THE WSDOT I2 PROGRAM
Pennsylvania Transportation Institute, University Park, PA 16802 22
• a second level model for the parameters of the first level models. This model is
sometimes known as a structural model, or population distribution, and its
parameters are called hyperparameters.
Hierarchical models avoid overfitting the data by using the population distribution to
structure dependence in the parameters. This is to say that the statistical model
developed will not be confined in its predictive accuracy to the sample at hand. The
predictive power can be extended to samples not used for estimation. A detailed
description of the hierarchical poisson gamma model is provided in appendix B.
DATA ENVELOPMENT ANALYSIS (DEA)
Data envelopment analysis is a linear programming based technique for measuring the
relative performance of decision units where the presence of multiple inputs and outputs
makes comparisons feasible. A decision unit in our case is a roadway section under
consideration for safety improvement. A roadway section can be viewed as a source of
multiple decision options. For example, a section where runoff the road accidents are
significant can be analyzed for a) guardrail placement, or b) horizontal curvature
improvement. In this case, each improvement alternative is viewed as a separate decision
option for the section under consideration. In this sense, DEA can allow decision makers
comparisons between various improvement options for a single roadway section. The
other advantage of DEA is that not all roadway sections are required to have the same set
of improvement options. For example, section “a” can be analyzed with two
SAFETY EVALUATION TESTBEDS -- AN ASSESSMENT OF SAFETY PROJECT PRIORITIZATION IN THE WSDOT I2 PROGRAM
Pennsylvania Transportation Institute, University Park, PA 16802 23
improvement options under consideration, while section “b” can be analyzed with four
improvement options under consideration. A third advantage of the DEA approach is it
allows for the incorporation of multiple inputs and multiple outputs in the decision
making process. For example, in the traffic safety programming context, the inputs are
AADT, number of lanes, number of horizontal curves, number of interchanges, and
number of intersections. Outputs are accident occurrence, severity index and societal
costs as used in this analysis. Ideally, one would use some measure of agency benefit
such as accident reductions and benefit cost ratios. These were not readily available from
WSDOT databases, so we adapt the DEA methodology to determine areas of greatest
need for improvement first. This is to say for example, that section “a” has horizontal
curvature as the area of greatest need, while section “b” has intersection improvement as
the area of greatest need. Greatest need is determined by the analysis of relative
contribution of a roadway characteristic to a section’s accident related outputs such as
accident counts, societal costs and severity index.
The issue of DEA-based efficiency in the traffic safety programming would ideally refer
to efficiency in agency improvement investments as they relate to agency benefits. As
mentioned previously, since this information was not available, we propose a method to
identify areas of greatest need section-by-section first and then recommend using
Bayesian methodology to estimate accident reduction benefits for those improvements.
Hence the application of DEA methodology in this report should be viewed as an
approach to prioritize the nature of the section-specific need as well as rank the sections
in terms of overall need. DEA-based efficiency in this perspective takes an alternative

SAFETY EVALUATION TESTBEDS -- AN ASSESSMENT OF SAFETY PROJECT PRIORITIZATION IN THE WSDOT I2 PROGRAM
Pennsylvania Transportation Institute, University Park, PA 16802 24
meaning. A section with an efficiency rating of 100 percent implies it is a section
deserving of highest safety improvement priority. In this sense, a higher efficiency rating
indicates a level of poorer safety -- given the inputs such as roadway geometrics and
traffic volumes, accident-related outputs are occurring at the highest production levels.
It should be noted that the used measures of output such as accident occurrence, societal
cost and severity index are measures of agency costs. Likewise, with the exception of
AADT, the other inputs are measures of agency investment that relate to accident
occurrence. Ideally, one should analyze the expected number of accident reductions as a
measure of efficiency of investment. Since section-specific information on accident
reduction was not available, we use multiple outputs that relate to the accident
occurrence, severity index, and societal costs. In this sense, the inputs are viewed as
disinvestments. That is, greater the weight of a particular input, the greater disinvestment
due to higher efficiencies in a non-desirable outcome such as accident occurrence,
severity index or societal cost. Naturally, the recommendation associated with inputs
with higher weights is to minimize their contribution. One way for example to minimize
an input’s contribution is to eliminate it – removal of a horizontal curve. This is a cost-
prohibitive investment; as a result, alternatives may arise, such as reducing the sharpness
of a horizontal curve, for example. Average daily traffic is for the most part an
uncontrollable input, even though it has an impact on accident occurrence, societal cost
and severity indexes. Addition of lanes may appear to decrease the impact of traffic
volumes; however, the issue of latent demand remains as a counter-productive effect.
The advantage with the DEA method is it is non-parametric, meaning it imposes no

SAFETY EVALUATION TESTBEDS -- AN ASSESSMENT OF SAFETY PROJECT PRIORITIZATION IN THE WSDOT I2 PROGRAM
Pennsylvania Transportation Institute, University Park, PA 16802 25
distributional assumptions; however it is sensitive to measurement errors. One must be
careful in the choice of inputs and the measurement of inputs. It should also be noted that
although non-stochastic, the type of DEA employed in this study allows us to determine
in a ballpark sense the input of greatest need section-by-section. This then allows us to
identify potentially more safety initiatives with the consideration set of horizontal curve
mitigation, cross-section width mitigation (number of lanes) and interchange and
intersection mitigation. The locations used in this study for the most part, are amenable
to the above-mentioned types of improvements. On a statewide network, one would have
to define a broader array of potential agency investments toward safety and use those as
inputs for full-fledged safety analysis. To comparatively address the issue of relative
safety need, DEA measures the relative safety ranking of the roadway sections under
consideration. As safety need is an indicator of higher societal cost, locations ranking
high by DEA will indicate high safety needs, in relation to all locations considered in the
analysis.
The notion of DEA-based relative safety need
Relative safety need is a notion developed in this analysis to indicate the relationship of
multiple safety outputs to multiple safety inputs. A need by definition implies a safety
output(s) results in preventable or reducible societal costs. Technically, these outputs are
a measure of a location’s “unsafety.” Several safety inputs can contribute to these costs,
namely, ADT, number of lanes, horizontal curves, or interchanges and intersections. If
two locations are identical in their safety characteristics, and one location has a higher

SAFETY EVALUATION TESTBEDS -- AN ASSESSMENT OF SAFETY PROJECT PRIORITIZATION IN THE WSDOT I2 PROGRAM
Pennsylvania Transportation Institute, University Park, PA 16802 26
“unsafety” output, then it is reasonable to prioritize the location with the higher output
over the other. This notion is applied in the use of DEA for our analysis. A reasonable
measure for relative safety need is:
inputsofsumWeighted
outputsofsumWeightedSafetyNeed Relative =
Relative Safety Need (RSN) can be mathematically expressed as:
1...
...
2211
2211≤
+++
+++=
ijijj
rjrjjj
xvxvxv
yuyuyuRSN
Where,
RSNj is relative safety need for roadway section “j”
ur = weight of output r, for example, weight of accident count, severity index or
societal cost
yrj = amount of output r from unit j, for example, accident count, severity index value,
or societal cost value
vi = weight of input i, for example, weight of horizontal curves, interchanges and
intersections, ADT,or cross section width
xij = amount of input i to unit j, for example, number of horizontal curves, number of
interchanges and intersections, ADT value, or number of lanes
Relative safety need is usually constrained to the range [0,1]. Two versions of DEA are
utilized in this analysis. One of these calculates relative safety needs on constant return to
scale, and the other allows variable return to scale. In brief, the Charnes, Cooper and
Rhode (CCR) version calculates relative safety needs on constant returns to scale, while,
the Banker, Charnes and Cooper (BCC) version evaluates relative safety needs on

SAFETY EVALUATION TESTBEDS -- AN ASSESSMENT OF SAFETY PROJECT PRIORITIZATION IN THE WSDOT I2 PROGRAM
Pennsylvania Transportation Institute, University Park, PA 16802 27
variable returns to scale. Variable returns to scale implies a less restrictive form of safety
needs calculation, with the practical implication being a potentially larger set of priorities
in terms of locations covered. The analytical structure of the above-mentioned DEA
versions is presented in detail in appendix B.
DATA USED FOR THE ANALYSIS
The data used for this analysis was derived from the Washington Sate Department of
Transportation (WSDOT) I2 prioritization database provided by Northwest Region staff.
There were 320 road sections in the original dataset. The lengths of sections vary from
0.01 mile to 1.52 miles. For the analysis purpose, sections whose lengths are less the
0.05 miles were ignored. Therefore, a total of 190 sections were analyzed. Table 2
provides summary statistics for the 190 sections.
Table 2. Summary Statistics of Key Variables.
Variable Mean Std.Dev. Minimum Maximum
Property Damage only (2-Yr Counts) 31.92 31.66 1 202
Possible Injury (2-Yr Counts) 15.82 15.79 0 123
Evident Injury (2-Yr Counts) 5.26 5.28 0 47
Disabling Injury (2-Yr Counts) 0.91 1.34 0 11
Fatality (2-Yr Counts) 0.11 0.33 0 2
Total Accidents (2-Yr Counts) 54.03 51.56 6 354
Societal Costs Per Pear 1,054,584 1,050,518 56,000 8,471,500
Severity Index 1.98 2.55 0 17.30
Annual Average Daily Traffic 19,551 12,172 963 57,030
Length in miles 0.271 0.204 0.06 1.39
No. of Lanes 3.78 1.10 2 6
No. of Horizontal Curves 0.72 0.74 0 3
No. of Interchanges / Intersections 1.94 1.41 0 10
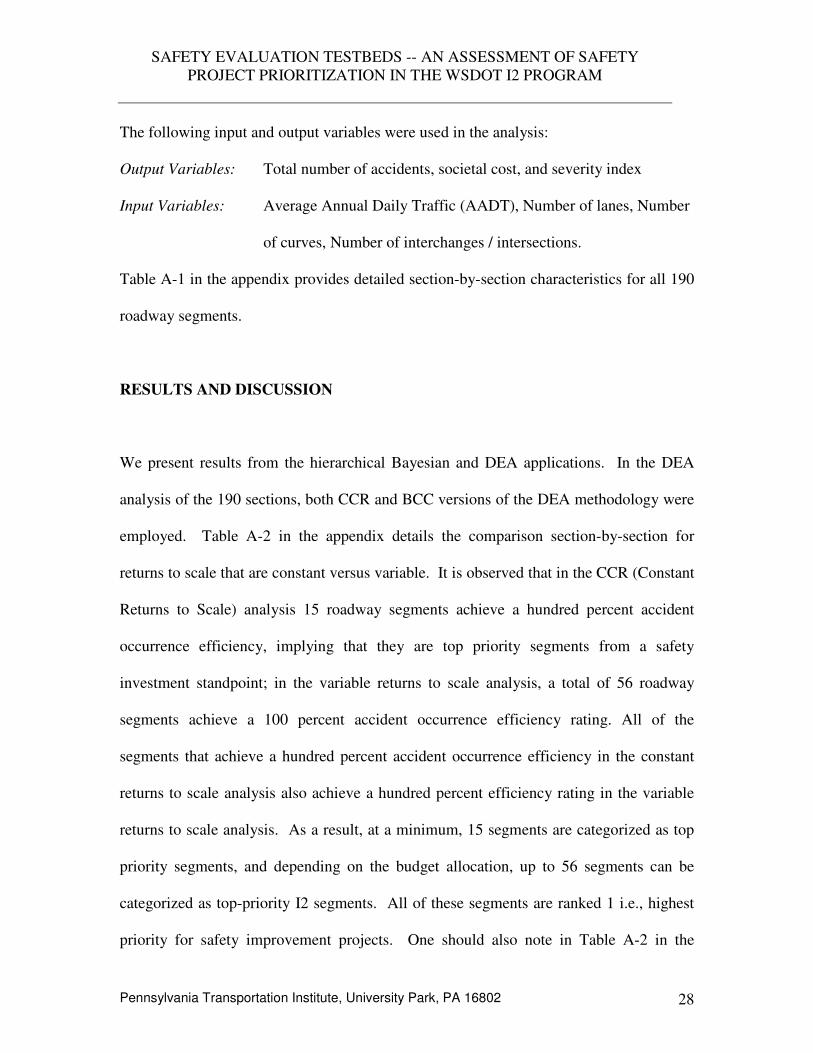
SAFETY EVALUATION TESTBEDS -- AN ASSESSMENT OF SAFETY PROJECT PRIORITIZATION IN THE WSDOT I2 PROGRAM
Pennsylvania Transportation Institute, University Park, PA 16802 28
The following input and output variables were used in the analysis:
Output Variables: Total number of accidents, societal cost, and severity index
Input Variables: Average Annual Daily Traffic (AADT), Number of lanes, Number
of curves, Number of interchanges / intersections.
Table A-1 in the appendix provides detailed section-by-section characteristics for all 190
roadway segments.
RESULTS AND DISCUSSION
We present results from the hierarchical Bayesian and DEA applications. In the DEA
analysis of the 190 sections, both CCR and BCC versions of the DEA methodology were
employed. Table A-2 in the appendix details the comparison section-by-section for
returns to scale that are constant versus variable. It is observed that in the CCR (Constant
Returns to Scale) analysis 15 roadway segments achieve a hundred percent accident
occurrence efficiency, implying that they are top priority segments from a safety
investment standpoint; in the variable returns to scale analysis, a total of 56 roadway
segments achieve a 100 percent accident occurrence efficiency rating. All of the
segments that achieve a hundred percent accident occurrence efficiency in the constant
returns to scale analysis also achieve a hundred percent efficiency rating in the variable
returns to scale analysis. As a result, at a minimum, 15 segments are categorized as top
priority segments, and depending on the budget allocation, up to 56 segments can be
categorized as top-priority I2 segments. All of these segments are ranked 1 i.e., highest
priority for safety improvement projects. One should also note in Table A-2 in the

SAFETY EVALUATION TESTBEDS -- AN ASSESSMENT OF SAFETY PROJECT PRIORITIZATION IN THE WSDOT I2 PROGRAM
Pennsylvania Transportation Institute, University Park, PA 16802 29
appendix that as the rankings increase beyond the value of one, the priority of the
segment decreases.
We also note that the areas of greatest need for the ranked segments vary depending on
the relative weights of the inputs. As mentioned previously, higher the relative input,
higher the relative importance of that roadway characteristic. Average daily traffic is not
a controllable input for the most part, although it contributes to the overall safety
efficiency rating. Keeping that in mind, the relevant inputs in terms of greatest need are
a) number of horizontal curves, b) number of interchanges, and c) number of
interchanges. These needs are summarized in table 3 below. As noted in table 3,
roadway cross section is noted as area of highest need in 91 sections, while number of
horizontal curves is noted as the area of highest need in 138 sections. Furthermore, total
number of interchanges and intersections in section is noted as area of highest need in 31
sections. The last variable refers specifically to the at-grade intersection sub-program of
WSDOT’s I2 program. It should also be noted that sections may have more than one
area of highest need. Hence the total number of sections identified may include sections
with multiple improvement needs. This findings highlights the fact that DEA can be used
to examine as a ballpark method, more than one safety improvement need for any given
section. The various improvement possibilities are directly a function of the variety of
roadway characteristics that are used to examine safety efficiency ratings in the I2
program.

SAFETY EVALUATION TESTBEDS -- AN ASSESSMENT OF SAFETY PROJECT PRIORITIZATION IN THE WSDOT I2 PROGRAM
Pennsylvania Transportation Institute, University Park, PA 16802 30
Table 3 Summary of Inputs of Greatest Needs (190 Sections)
Inputs Number of Sections
Average Daily Traffic 84
Total No. of Lanes 91
Total No. of Horizontal Curves 138
No. of Interchanges / Intersections 31
Once an initial estimate of safety needs is conducted through DEA and sites ranked in
terms of safety priority, a similar analysis can be conducted using Bayesian predictive
methods to align the results. The Bayesian methods are more powerful for the
identification of safety risk as well as identifying safety improvements. However the
Bayesian analysis unlike the DEA approach is not well suited for examining multiple
outputs in a single analysis. We hence employed the Bayesian approach to benchmark its
predictive efficiency versus the classical negative binomial. Inputs including categorical
variables such as presence of barriers, presence of divided highway sections as well as
interactions are used in addition to the inputs as those in the DEA analysis. The Bayesian
model thus is a more refined model, but fairly minimal in data demands. The predictive
variable used in the Bayesian analysis was number of biennial accidents in a section.
Tables 4 and 5 below summarize the benchmarked results.
Table 4 shows the statistically significant effects affecting biennial accident occurrence
for the 190 sections. The overdispersion effect is significant indicating that an
overdispersion model is appropriate for safety prediction. It is also noted that the
hierarchical Poisson with gamma prior agrees closely with the classical negative

SAFETY EVALUATION TESTBEDS -- AN ASSESSMENT OF SAFETY PROJECT PRIORITIZATION IN THE WSDOT I2 PROGRAM
Pennsylvania Transportation Institute, University Park, PA 16802 31
binomial; however, the mainly useful result from the Bayesian analysis is the credibility
intervals associated with the coefficient values. As expected, some variability exists
between the 50th percentile credibility and 97.5th percentile credibility estimates of the
coefficients in the model. Some variables such as the horizontal curve indicators are
statistically insignificant in the sample used for analysis in this testbed. We retain these
variables so to be able to test their significance in a large context, applied to the entire
state network of highways.
Both the classical negative binomial and the hierarchical poisson with gamma prior are
based on measured variables that are mainly obtained from WSDOT’s SR View database.
As such, these models should be viewed as “benchmark” models against which
alternative prediction schemes should be calibrated in terms of their predictive accuracy.
The benchmark models developed here are mainly “visual” in the source of their data –
that is, variables other than traffic volumes are measured visually from SR View. Hence,
we use the term “visual benchmark models” to refer to the prediction schemes used in
this safety evaluation testbeds.

SAFETY EVALUATION TESTBEDS -- AN ASSESSMENT OF SAFETY PROJECT PRIORITIZATION IN THE WSDOT I2 PROGRAM
Pennsylvania Transportation Institute, University Park, PA 16802 32
Table 4 Comparison of Classical Negative Binomial Model and Hierarchical Bayesian Analysis for Overall Accidents (190 sections)
Negative Binomial
Model
Hierarchical Bayesian Poisson with
Gamma Prior
Est. Coeff.
(Std. Error)
T-
statistic
Est. Coeff.
(Std. Error)
T-
statistic
Credibility
Percentiles of
Coefficient
50 % 97.5%
Constant -2.741 (0.376)
-7.300 -2.939 (0.118)
-25.013 -2.912 -2.766
Natural logarithm of Per-Lane-AADT
0.665 (0.044)
15.071 0.682 (0.017)
39.738 0.649 0.710
Lengths of sections in miles 1.463 (0.161)
9.072 1.365 (0.363)
3.759 1.404 1.917
Number of Interchanges / Intersections in the sections
0.061 (0.0245)
2.442 0.075 (0.053)
1.417 0.067 0.263
Curve indicator 1 (1 if the No. of horizontal curves per mile >= 2 and <= 7; 0 otherwise)
-0.039 (0.062)
-0.629 -0.030 (0.062)
-0.488 -0.032 0.092
Curve indicator 2 (1 if the No. of horizontal curves per mile > 7; 0 otherwise)
-0.149 (0.086)
-1.729 -0.148 (0.102)
-1.441 -0.140 0.030
Interaction variable 1 between undivided roadway and barrier (1 if roadway is undivided and there is no barrier; 0 otherwise)
0.425 (0.113)
3.749 0.482 (0.124)
3.881 0.490 0.733
Interaction variable 2 between undivided roadway and barrier (1 if roadway is undivided and there is a barrier; 0 otherwise)
0.194 (0.124)
1.565 0.288 (0.114)
2.537 0.284 0.519
Interaction variable 3 between divided roadway and barrier (1 if roadway is divided and there is a barrier; 0 otherwise)
0.537 (0.132)
4.057 0.615 (0.128)
4.817 0.615 0.868
Alpha
0.126 (0.014)
8.893 0.146 (0.018)
8.109 6.841 8.544
Restricted log-likelihood (Constant only)
-5,037.859
Log-likelihood at convergence -968.3092
The usefulness of visual benchmark models for large-scale systemwide programming is
the development of a consistent baseline against which predictions with a wider array of
data can be measured. As such, the visual benchmark models represent a bare minimum
predictive capability that WSDOT can achieve by solely relying on SR View data. To
date, WSDOT’s methods have mainly relied on classical negative binomial models to
SAFETY EVALUATION TESTBEDS -- AN ASSESSMENT OF SAFETY PROJECT PRIORITIZATION IN THE WSDOT I2 PROGRAM
Pennsylvania Transportation Institute, University Park, PA 16802 33
predict safety levels on its highways. The use of Bayesian methods on a statewide
network is computationally demanding, considering the vast array of data that WSDOT
has at its disposal to use in the development of advanced prediction models. This
research attempts to establish basic procedures for systematically testing the suitability of
Bayesian techniques for benchmarking future advancements in WSDOT’s safety
prediction capabilities. The evidence so far shows that promise exists in significantly
improving WSDOT’s safety prediction capabilities.
We compare the predictive outputs from the classical and Bayesian analyses for the 190
road sections used in the evaluation of the safety testbed. Table 5 summarizes the
findings below. The HB (Bayesian) method reports 48.15 percent of all segments within
5% absolute error, where absolute error is defined as the absolute percent difference
between observed and predicted accident counts. Comparatively, the classical NB
approach predicts 13.17 percent of all 190 segments within the five percent margin. If
we increase the acceptability of prediction error to 10%, the HB captures 67.08% or more
than two-thirds of all sections while the classical NB only improves to 22.63%. What
this shows as a preliminary result is the “visual benchmark model” using HB techniques
establishes a viable prediction baseline compared to classical methods. This is a
significant return to investment for WSDOT in terms of SRView, as well as implications
of SRView and related databases for improved precision in safety programming.

SAFETY EVALUATION TESTBEDS -- AN ASSESSMENT OF SAFETY PROJECT PRIORITIZATION IN THE WSDOT I2 PROGRAM
Pennsylvania Transportation Institute, University Park, PA 16802 34
Table 5 Summary of Predictions Comparisons of Classical Negative Binomial Model and Hierarchical Bayesian Analysis for Overall Accidents (190 sections)
The Difference between Observed
and Predicted Overall Accidents
Negative Binomial
Model
Hierarchical Bayesian
Analysis
Under or equal to 5 % 13.17 % 48.15 %
Under or equal to 10 % 22.63 % 67.08 %
A detailed section-by-section hierarchical Bayesian analysis of all 190 sections is
provided in table A-3 in the appendix. In table A-3, the reader will note credibility
intervals for the predicted variable, namely number of biennial accidents. For example,
in table A-3, the reader will note that state route 2, milepost limits 14.50 to 15.11, with
length 0.61 miles is expected to have at a 97.5 percent credibility level no more than 197
biennial accidents.
Prediction from Hierarchical Bayesian Analysis
Route Beginning Milepost
Ending Milepost
Length Actual Overall
Accidents
50% Credible Interval
75% Credible Interval
97.5% Credible Interval
Mean of Predictions
2 14.50 15.11 0.61 181 177 185 197 177
The mean predicted biennial count for the same section is 177 whereas the observed
biennial count is 181. We find this to be a very useful result for WSDOT decision
makers since it allows decision makers to set acceptability limits based on credibility
intervals. Such a method in combination with the DEA approach described earlier allows
for decision making feedback loops to make the I2 program robust.
CONCLUSIONS AND RECOMMENDATIONS
Two main findings emerged from this study. The first finding relates to the usefulness of
data envelopment analysis to the analysis of safety investments within the WSDOT

SAFETY EVALUATION TESTBEDS -- AN ASSESSMENT OF SAFETY PROJECT PRIORITIZATION IN THE WSDOT I2 PROGRAM
Pennsylvania Transportation Institute, University Park, PA 16802 35
programming context. This method is especially useful for analyzing the efficiency of a
program in terms of relationships between design inputs and multiple performance
outputs. Multiple performance outputs in a safety context typically include accident
counts, severity index, societal cost of accidents and benefit cost. We excluded benefit
cost from this analysis for the reason that information on benefit cost is incomplete. It is
proposed that accident reduction factors be used to estimate safety benefits accurately
first, and then benefit costs resulting from that analysis be used as a performance output
in a DEA analysis. In a safety context, at the very least, typical design inputs relate to
number of lanes, horizontal curvature, number of intersections and interchanges in the
corridor. Such data are widely available and easy to collect and maintain. Using basic
design inputs such as those described above, we were able to identify the design element
of greatest need for a particular location. Evidently, more design inputs are necessary to
fully relate to the entire menu of design investments that are usually determined based on
engineering judgments by WSDOT staff. As a systematic recourse to identification of a
broader set of safety needs, a second finding emerged. This relates to the usefulness of
predictive methodologies for WSDOT. Currently, WSDOT proposes to use frequentist
methods such as the negative binomial model to determine crash location propensities
and base its high-accident corridor and location prioritization schemes. In reality,
historical data is currently used to determine what investments are required at specified
high-accident corridor locations. The limitation with both approaches mentioned above
is that the degree of uncertainty inherent in decision making is not accounted for. A
Bayesian approach to the issue of predicting crash propensities using a hierarchical
methodology allows us to quantify the “degree of credibility” in our estimates of crash

SAFETY EVALUATION TESTBEDS -- AN ASSESSMENT OF SAFETY PROJECT PRIORITIZATION IN THE WSDOT I2 PROGRAM
Pennsylvania Transportation Institute, University Park, PA 16802 36
risk at the high-accident locations. This methodology has shown the potential to be more
accurate in its predictions compared to the classical negative binomial approach. As we
mentioned earlier, with a very limited set of design inputs, the hierarchical Bayesian
approach improves prediction several-fold, with approximately 48 percent of locations
estimated with crash risks that are within 5% of observed risk. Comparatively, the
classical approach could only predict within 5% error 13% of the locations. If the margin
of prediction error is increased to 10%, then the Bayesian approach predicts 67 percent of
locations correctly while the classical approach predicts only 23%.
Some recommendations also emerged from this study. First and foremost is the
recommendation to test this methodology embodied in this report on the entire WSDOT
safety programming network to examine the robustness of prioritization under multiple
performance criteria. Second, one can then extend this methodology to the broader
programming framework to include cross-program decision requirements such as
preservation and improvement simultaneously. We also determined based on the limited
dataset provided to us that using a societal cost approach that separates fatal accidents
from disabling accidents may result in a priority scheme that could be different.
Currently, WSDOT values disabling and fatal accidents equally for priority purposes; the
reason being a fatal accident by weight of its societal cost could potentially skew priority
schemes toward historically fatal locations. More research needs to be done to examine
the sensitivity of the WSDOT programming system to fatality and disabling injury costs
being treated independently.

SAFETY EVALUATION TESTBEDS -- AN ASSESSMENT OF SAFETY PROJECT PRIORITIZATION IN THE WSDOT I2 PROGRAM
Pennsylvania Transportation Institute, University Park, PA 16802 37
Some recommendations for a vision for WSDOT’s future safety programming efforts are
in order. The issue of programming “turnover” raises interesting responses stemming
from this research. WSDOT is actively pursuing prediction efforts to minimize variability
in regional programming turnover so as to improve efficiency in investments. The
qualitative sense from the preliminary findings from this study using the classical and
Bayesian techniques for safety prediction indicates that programming efficiency can be
increased. Given the turnover trend of 50 percent in the 2005-2007 biennium and 35
percent in the 2007-2009 biennium, it can be noticed that 50 percent of HALs in the
2005-2007 biennium will be non-repeating new locations, i.e., locations that do not turn
over. In the 2007-2009 biennium, the non-repeating location percentage is expected to
increase to 65 percent, since 35 percent is expected to be turnovers. So, one objective
that can be systematically addressed is the objective of maximizing the predictability of
turnovers over multiple bienniums. The second objective of safety programming relates
to regional variability in turnovers. The Northwest Region will turn over 38 percent in
the 2007-2009 biennium, while the North Central Region will turn over 11 percent in the
same biennium. This is a variability of 27 percent in turnover from the region with the
highest turnover to one with the lowest turnover. To enhance geographic equity in safety
programming and proper identification of locations across regions, the methods
presented in this study offer potential in terms of minimizing regional turnover
variability.
We base this expectation on findings from the “visual benchmark models,” which for the
most part rely on information gathered from WSDOT’s SR View. As such, when one

SAFETY EVALUATION TESTBEDS -- AN ASSESSMENT OF SAFETY PROJECT PRIORITIZATION IN THE WSDOT I2 PROGRAM
Pennsylvania Transportation Institute, University Park, PA 16802 38
factors in the added value of information from geometrics and roadside inventory
databases, the improvements in WSDOT’s predictive capabilities could be significant.
The second recommendation issue in order is a plan for future work related to this
research that will significantly benefit WSDOT’s ongoing prediction efforts. A series of
actions is recommended below to this purpose:
1. Develop region-by-region “visual benchmark models” using hierarchical
Bayesian techniques and using variables currently used in this research. By doing
so, WSDOT can establish prediction baselines that are aggressive but using
minimal data collection effort.
2. Integrate current geometric, roadside and weather information from WSDOT’s
databases to establish a consistent statewide database for use in advanced
prediction schemes to be benchmarked against the visual benchmark models such
as those developed in this study. Perform a benchmark analysis region-by-region
so as to ensure regional flexibility in the identification of critical safety projects.
3. Establish region-by-region data envelopment analysis methods to systematically
stratify project prioritization schemes that take into account a multitude of
decision making criteria such as accident counts, benefit-cost ratios of
recommended safety treatments and cross-program constraints to develop a
programmatically robust prioritization list.
SAFETY EVALUATION TESTBEDS -- AN ASSESSMENT OF SAFETY PROJECT PRIORITIZATION IN THE WSDOT I2 PROGRAM
Pennsylvania Transportation Institute, University Park, PA 16802 39
REFERENCES
Abdel-Aty, M. and Pande, A. (2005) Identifying crash propensity using specific traffic
speed conditions, Journal of Safety Research, 36(1), 97-108.
Adler N. and Berechman J. (2001) Measuring airport quality from the airlines’ viewpoint:
an application of data envelopment analysis, Transport Policy, 8(3), 171-181.
Banker, R.D., Charnes, A. and Cooper, W.W. (1984) Some models for estimating
technical and scale inefficiencies in Data Envelopment Analysis, Management Science
30, 1079-1092.
Bowlin, W.F. (1998) Measuring performance: an introduction to data envelopment
analysis (DEA), The Journal of Cost Analysis and Management, fall, 3-27, School of
Business, Southern Utah University, Utah.
Charnes, A., Cooper, W.W. and Rhodes, E. (1978) Measuring efficiency of decision
making units, European Journal of Operations Research, 2, 429-444.
Clarke, D.B. and Sarasua, W.A. (2003) Fatal crashes on rural secondary highways, Final
Report, FHWA-SC-03-04.

SAFETY EVALUATION TESTBEDS -- AN ASSESSMENT OF SAFETY PROJECT PRIORITIZATION IN THE WSDOT I2 PROGRAM
Pennsylvania Transportation Institute, University Park, PA 16802 40
Davis, G.A. and Yang, S. (2001) Bayesian identification of high-risk intersections for
older drivers via Gibbs sampling, Transportation Research Record, 1746, 84-89.
Davis, G.A. (2001) Development and testing of methods for estimating the impact of
safety improvements, Final Report, MN/RC-2001-08.
Elvik, R. (2004) Traffic Safety: In Handbook of Transportation Engineering,
McGraw-Hill, New York.
Farrell, M. J. (1957) The measurement of productive efficiency, Journal of the Royal
Statistical Society, 120(3), 253–281.
Francis, G. and Humphreys I. (2002) The benchmarking of airport efficiency, Journal of
Air Transport Management, 8, 239-247.
Geurts, K., Wets, G., Brijs, T. and Vanhoof, K. (2004) Identification and ranking of black
spots: sensitivity analysis, Transportation Research Record, 1897, 34-42.
Greene, W.H. (2003) Econometric Analysis, Fifth Edition, Prentice Hall.
Hanley, K.E., Gibby, A.R. and Ferrara, T.C. (2000) Analysis of accident-reduction
factors on California state highways, Transportation Research Record, 1717, 37-45.

SAFETY EVALUATION TESTBEDS -- AN ASSESSMENT OF SAFETY PROJECT PRIORITIZATION IN THE WSDOT I2 PROGRAM
Pennsylvania Transportation Institute, University Park, PA 16802 41
Hauer, E., Harwood, D.W., Council, F.M. and Griffith, M.S. (2002) Estimating safety by
the empirical Bayes method: a tutorial, Transportation Research Record, 1784, 126-
131.
Hauer, E, Allery, B.K., Kononov, J, and Griffith, M.S. (2004) How best to rank sites with
promise, Transportation Research Record, 1897, 48-54.
Hossain, M., Chowdhury, T. and Gisi, A.J. (2002) Bayesian regression methodology for
project prioritization, International Journal of Pavement Engineering, 3(3), 185-195.
Insightful Corporation (2003) S+Bayes User Manual, Seattle, Washington.
Karlaftis, M.G. (2002) A DEA approach for evaluating the efficiency and effectiveness
of urban transit systems, European Journal of Operational Research, 152, 354–364.
MacNab, Y.C. (2004) Bayesian spatial and ecological models for small-area accident and
injury analysis, Accident Analysis and Prevention, 36(6), 1019-1028.
MacNab, Y.C. (2003) A Bayesian hierarchical model for accident and injury
surveillance, Accident Analysis and Prevention, 35(1), 91-102.

SAFETY EVALUATION TESTBEDS -- AN ASSESSMENT OF SAFETY PROJECT PRIORITIZATION IN THE WSDOT I2 PROGRAM
Pennsylvania Transportation Institute, University Park, PA 16802 42
Melcher, D.J., Dixon, K.K., Washington, S. and Wu, C-H. (2001) Feasibility of
“subjective” engineering assessments of road safety improvements: Bayesian analysis
development, Transportation Research Record, 1758, 36-43.
Miaou, S.P. and Lord, D. (2003) Modeling traffic crash-flow relationships for
intersections: dispersion parameter, functional form, and Bayes versus empirical Bayes
methods, Transportation Research Record, 1840, 31-40.
Milton, J.C. and Mannering, F.L. (1996) The relationship between highway geometrics,
traffic related elements and motor vehicle accidents, Final Research Report, WA-RD
403.1,Washington State Department of Transportation, Washington.
Odeck, J. (2005) Identifying traffic safety best practice: an application of DEA and
Malmquist indices, The International Journal of Management Science, In press.
Or, L. and Kahraman, I. (2002) A simulation of the accident risk in the Istanbul Channel,
International Journal of Emergency Management, 1(2), 110-124.
Pels, E; Nijkamp, P; Rietveld, P (2003) Inefficiencies and scale economies of European
airport operations, Transportation Research Part E: Logistics and Transportation
Review, 39, 341-361.

SAFETY EVALUATION TESTBEDS -- AN ASSESSMENT OF SAFETY PROJECT PRIORITIZATION IN THE WSDOT I2 PROGRAM
Pennsylvania Transportation Institute, University Park, PA 16802 43
Persaud, B., McGee, H., Lyon, C. and Lord, D. (2003) Development of a procedure for
estimating expected safety effects of a contemplated traffic signal installation,
Transportation Research Record, 1840, 96-103.
Poch, M. and Mannering, F.L. (1996) Negative binomial analysis of intersection-accident
frequencies, Journal of Transportation Engineering, 122(3), 105-113.
Rimiller, J., Ivan, J. and Garrick, N. (2003) Estimating benefits from specific highway
safety improvements: phase III, safety benefits from left turn treatment, Final Report,
JHR 03-290.
Sacccomano, F.F., Grossi, R., Greco, D. and Mehmood, A. (2001) Identifying black spots
along highway SS107 in southern Italy using two models, Journal of Transportation
Engineering, 127(6), 515-522.
Shankar, V.N., Mannering, F.L. and Barfield, W. (1995) Effect of roadway geometrics
and environmental conditions on rural accident frequencies, Accident Analysis and
Prevention, 27(3), 371-389.
Washington State Department of Transportation (2000) Local Agency Safety
Management System, Washington.

SAFETY EVALUATION TESTBEDS -- AN ASSESSMENT OF SAFETY PROJECT PRIORITIZATION IN THE WSDOT I2 PROGRAM
Pennsylvania Transportation Institute, University Park, PA 16802
THIS PAGE INTENTIONALLY LEFT BLANK

SAFETY EVALUATION TESTBEDS -- AN ASSESSMENT OF SAFETY PROJECT PRIORITIZATION IN THE WSDOT I2 PROGRAM
Pennsylvania Transportation Institute, University Park, PA 16802 A-1
APPENDIX A – Data Envelopment Analysis and Bayesian Prediction Model Results
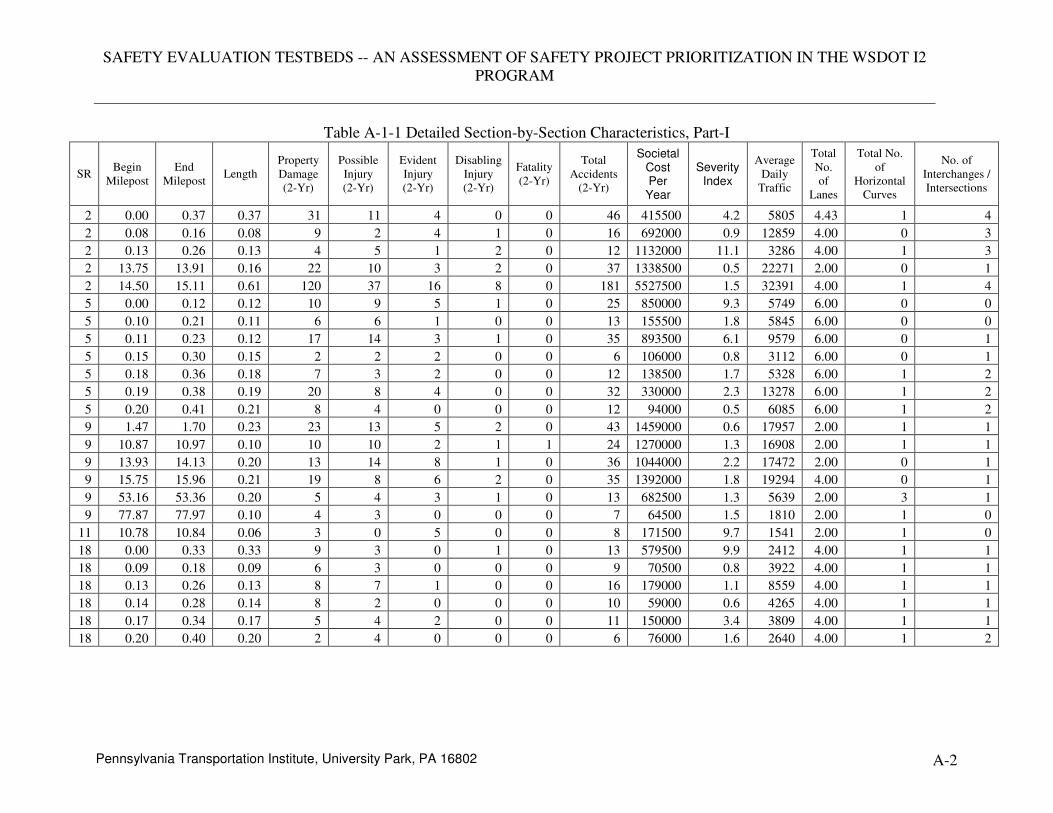
SAFETY EVALUATION TESTBEDS -- AN ASSESSMENT OF SAFETY PROJECT PRIORITIZATION IN THE WSDOT I2 PROGRAM
Pennsylvania Transportation Institute, University Park, PA 16802 A-2
Table A-1-1 Detailed Section-by-Section Characteristics, Part-I
SR Begin
Milepost End
Milepost Length
Property Damage (2-Yr)
Possible Injury (2-Yr)
Evident Injury (2-Yr)
Disabling Injury (2-Yr)
Fatality (2-Yr)
Total Accidents
(2-Yr)
Societal Cost Per Year
Severity Index
Average Daily
Traffic
Total No. of
Lanes
Total No. of
Horizontal Curves
No. of Interchanges / Intersections
2 0.00 0.37 0.37 31 11 4 0 0 46 415500 4.2 5805 4.43 1 4
2 0.08 0.16 0.08 9 2 4 1 0 16 692000 0.9 12859 4.00 0 3
2 0.13 0.26 0.13 4 5 1 2 0 12 1132000 11.1 3286 4.00 1 3
2 13.75 13.91 0.16 22 10 3 2 0 37 1338500 0.5 22271 2.00 0 1
2 14.50 15.11 0.61 120 37 16 8 0 181 5527500 1.5 32391 4.00 1 4
5 0.00 0.12 0.12 10 9 5 1 0 25 850000 9.3 5749 6.00 0 0
5 0.10 0.21 0.11 6 6 1 0 0 13 155500 1.8 5845 6.00 0 0
5 0.11 0.23 0.12 17 14 3 1 0 35 893500 6.1 9579 6.00 0 1
5 0.15 0.30 0.15 2 2 2 0 0 6 106000 0.8 3112 6.00 0 1
5 0.18 0.36 0.18 7 3 2 0 0 12 138500 1.7 5328 6.00 1 2
5 0.19 0.38 0.19 20 8 4 0 0 32 330000 2.3 13278 6.00 1 2
5 0.20 0.41 0.21 8 4 0 0 0 12 94000 0.5 6085 6.00 1 2
9 1.47 1.70 0.23 23 13 5 2 0 43 1459000 0.6 17957 2.00 1 1
9 10.87 10.97 0.10 10 10 2 1 1 24 1270000 1.3 16908 2.00 1 1
9 13.93 14.13 0.20 13 14 8 1 0 36 1044000 2.2 17472 2.00 0 1
9 15.75 15.96 0.21 19 8 6 2 0 35 1392000 1.8 19294 4.00 0 1
9 53.16 53.36 0.20 5 4 3 1 0 13 682500 1.3 5639 2.00 3 1
9 77.87 77.97 0.10 4 3 0 0 0 7 64500 1.5 1810 2.00 1 0
11 10.78 10.84 0.06 3 0 5 0 0 8 171500 9.7 1541 2.00 1 0
18 0.00 0.33 0.33 9 3 0 1 0 13 579500 9.9 2412 4.00 1 1
18 0.09 0.18 0.09 6 3 0 0 0 9 70500 0.8 3922 4.00 1 1
18 0.13 0.26 0.13 8 7 1 0 0 16 179000 1.1 8559 4.00 1 1
18 0.14 0.28 0.14 8 2 0 0 0 10 59000 0.6 4265 4.00 1 1
18 0.17 0.34 0.17 5 4 2 0 0 11 150000 3.4 3809 4.00 1 1
18 0.20 0.40 0.20 2 4 0 0 0 6 76000 1.6 2640 4.00 1 2

SAFETY EVALUATION TESTBEDS -- AN ASSESSMENT OF SAFETY PROJECT PRIORITIZATION IN THE WSDOT I2 PROGRAM
Pennsylvania Transportation Institute, University Park, PA 16802 A-3
Table A-1- 2 Detailed Section-by-Section Characteristics, Part-II
SR Begin
Milepost End
Milepost Length
Property Damage (2-Yr)
Possible Injury (2-Yr)
Evident Injury (2-Yr)
Disabling Injury (2-Yr)
Fatality (2-Yr)
Total Accidents
(2-Yr)
Societal Cost Per Year
Severity Index
Average Daily
Traffic
Total No. of Lanes
Total No. of
Horizontal Curves
No. of Interchanges
/ Intersections
18 14.55 14.76 0.21 11 9 5 1 0 26 853000 0.2 23026 2.00 0 1
18 2.61B 0.16 0.28 25 15 5 1 0 46 1000000 0.6 20702 4.00 0 1
20 26.59 26.83 0.24 4 1 2 2 1 10 1594500 0.2 9633 2.00 2 1
20 31.25 31.70 0.45 65 23 9 0 0 97 890000 1.5 18481 3.67 2 4
20 53.24 53.34 0.10 1 4 3 2 0 10 1170500 0.4 11450 4.00 1 1
20 58.67 58.96 0.29 6 4 3 3 1 17 2185500 0.0 18073 2.00 2 1
20 59.39 59.70 0.31 36 10 4 0 0 50 413000 0.2 18073 3.65 1 2
20 59.73 59.94 0.21 27 7 4 2 0 40 1333500 1.4 20440 4.00 1 1
96 1.09 1.26 0.17 15 22 5 0 0 42 592500 1.7 21720 4.00 0 2
96 1.35 1.51 0.16 20 10 6 1 0 37 930000 0.6 25424 4.00 0 1
96 2.18 2.51 0.33 38 22 3 2 0 65 1596500 1.0 28585 4.00 0 1
99 0.09 0.19 0.10 7 2 0 0 0 9 56000 2.9 2300 4.00 0 2
99 8.05 8.27 0.22 37 13 3 1 0 54 936000 3.2 18111 4.00 0 1
99 8.87 10.26 1.39 202 123 26 2 1 354 5103500 8.0 18936 4.00 0 5
99 10.29 10.79 0.50 73 33 9 1 0 116 1589000 3.0 18936 4.00 1 4
99 10.86 10.97 0.11 11 10 5 0 0 26 370500 0.6 18936 4.00 1 2
99 11.18 11.48 0.30 30 12 6 1 0 49 995000 1.0 18936 4.00 0 2
99 11.62 12.02 0.40 48 20 5 0 0 73 656500 2.5 18936 4.00 0 1
99 12.90 13.21 0.31 60 37 7 2 0 106 2055000 1.8 29960 4.00 0 1
99 13.65 13.80 0.15 28 24 4 0 0 56 634000 1.3 29960 4.00 0 2
99 13.99 14.39 0.40 26 20 6 2 0 54 1623000 0.3 30589 4.00 1 3
99 15.26 15.58 0.32 64 34 13 1 1 113 2209500 4.1 29960 4.00 1 1
99 16.40 16.78 0.38 36 15 10 2 0 63 1695500 1.3 25122 4.00 0 2
99 17.43 17.75 0.32 26 13 11 4 0 54 2663000 3.0 25122 5.00 0 1
99 18.26 18.45 0.19 22 8 4 0 0 34 336000 0.8 18577 5.00 1 1
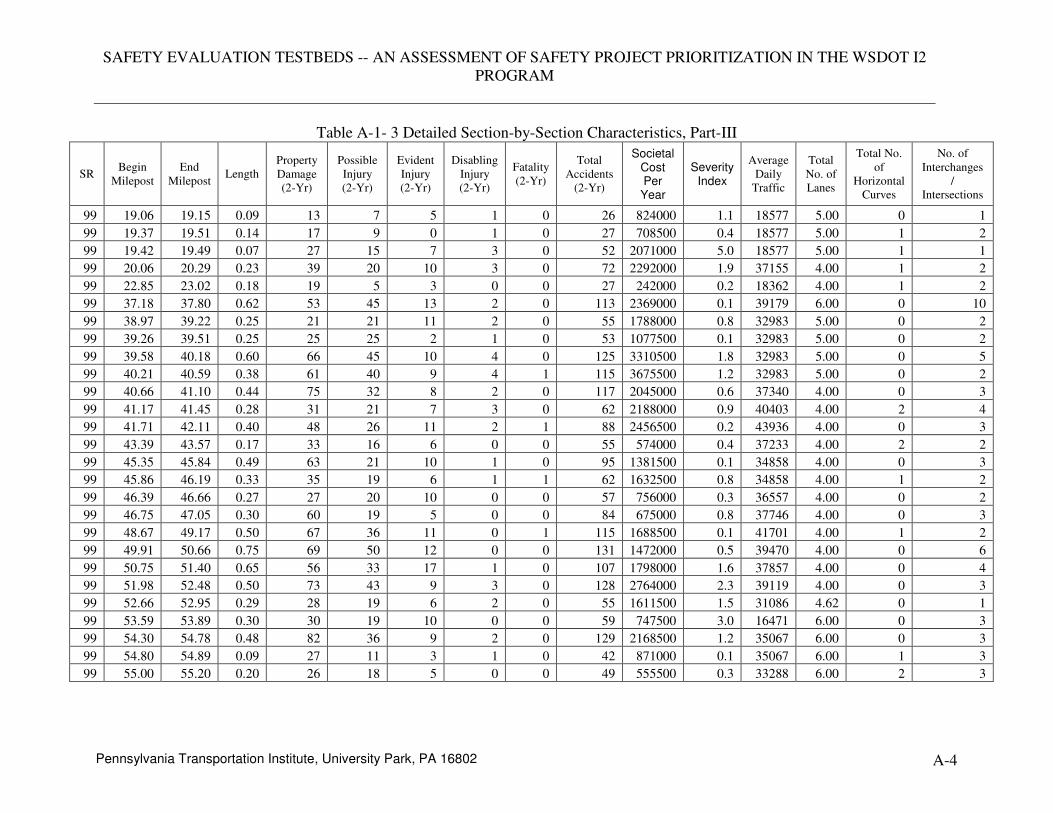
SAFETY EVALUATION TESTBEDS -- AN ASSESSMENT OF SAFETY PROJECT PRIORITIZATION IN THE WSDOT I2 PROGRAM
Pennsylvania Transportation Institute, University Park, PA 16802 A-4
Table A-1- 3 Detailed Section-by-Section Characteristics, Part-III
SR Begin
Milepost End
Milepost Length
Property Damage (2-Yr)
Possible Injury (2-Yr)
Evident Injury (2-Yr)
Disabling Injury (2-Yr)
Fatality (2-Yr)
Total Accidents
(2-Yr)
Societal Cost Per Year
Severity Index
Average Daily
Traffic
Total No. of Lanes
Total No. of
Horizontal Curves
No. of Interchanges
/ Intersections
99 19.06 19.15 0.09 13 7 5 1 0 26 824000 1.1 18577 5.00 0 1
99 19.37 19.51 0.14 17 9 0 1 0 27 708500 0.4 18577 5.00 1 2
99 19.42 19.49 0.07 27 15 7 3 0 52 2071000 5.0 18577 5.00 1 1
99 20.06 20.29 0.23 39 20 10 3 0 72 2292000 1.9 37155 4.00 1 2
99 22.85 23.02 0.18 19 5 3 0 0 27 242000 0.2 18362 4.00 1 2
99 37.18 37.80 0.62 53 45 13 2 0 113 2369000 0.1 39179 6.00 0 10
99 38.97 39.22 0.25 21 21 11 2 0 55 1788000 0.8 32983 5.00 0 2
99 39.26 39.51 0.25 25 25 2 1 0 53 1077500 0.1 32983 5.00 0 2
99 39.58 40.18 0.60 66 45 10 4 0 125 3310500 1.8 32983 5.00 0 5
99 40.21 40.59 0.38 61 40 9 4 1 115 3675500 1.2 32983 5.00 0 2
99 40.66 41.10 0.44 75 32 8 2 0 117 2045000 0.6 37340 4.00 0 3
99 41.17 41.45 0.28 31 21 7 3 0 62 2188000 0.9 40403 4.00 2 4
99 41.71 42.11 0.40 48 26 11 2 1 88 2456500 0.2 43936 4.00 0 3
99 43.39 43.57 0.17 33 16 6 0 0 55 574000 0.4 37233 4.00 2 2
99 45.35 45.84 0.49 63 21 10 1 0 95 1381500 0.1 34858 4.00 0 3
99 45.86 46.19 0.33 35 19 6 1 1 62 1632500 0.8 34858 4.00 1 2
99 46.39 46.66 0.27 27 20 10 0 0 57 756000 0.3 36557 4.00 0 2
99 46.75 47.05 0.30 60 19 5 0 0 84 675000 0.8 37746 4.00 0 3
99 48.67 49.17 0.50 67 36 11 0 1 115 1688500 0.1 41701 4.00 1 2
99 49.91 50.66 0.75 69 50 12 0 0 131 1472000 0.5 39470 4.00 0 6
99 50.75 51.40 0.65 56 33 17 1 0 107 1798000 1.6 37857 4.00 0 4
99 51.98 52.48 0.50 73 43 9 3 0 128 2764000 2.3 39119 4.00 0 3
99 52.66 52.95 0.29 28 19 6 2 0 55 1611500 1.5 31086 4.62 0 1
99 53.59 53.89 0.30 30 19 10 0 0 59 747500 3.0 16471 6.00 0 3
99 54.30 54.78 0.48 82 36 9 2 0 129 2168500 1.2 35067 6.00 0 3
99 54.80 54.89 0.09 27 11 3 1 0 42 871000 0.1 35067 6.00 1 3
99 55.00 55.20 0.20 26 18 5 0 0 49 555500 0.3 33288 6.00 2 3

SAFETY EVALUATION TESTBEDS -- AN ASSESSMENT OF SAFETY PROJECT PRIORITIZATION IN THE WSDOT I2 PROGRAM
Pennsylvania Transportation Institute, University Park, PA 16802 A-5
Table A-1- 4 Detailed Section-by-Section Characteristics, Part-IV
SR Begin
Milepost End
Milepost Length
Property Damage (2-Yr)
Possible Injury (2-Yr)
Evident Injury (2-Yr)
Disabling Injury (2-Yr)
Fatality (2-Yr)
Total Accidents
(2-Yr)
Societal Cost Per Year
Severity Index
Average Daily
Traffic
Total No. of Lanes
Total No. of
Horizontal Curves
No. of Interchanges
/ Intersections
104 24.65 24.74 0.09 7 2 0 1 0 10 556000 1.7 5468 4.00 1 1
104 26.43 26.52 0.09 13 12 2 1 1 29 1314000 0.9 23537 4.00 1 1
164 0.31 1.07 0.76 94 44 19 5 0 162 4169500 4.0 21929 4.00 3 3
164 1.09 1.34 0.25 37 18 9 0 0 64 718500 1.1 32535 4.00 1 1
164 1.78 2.14 0.36 42 16 7 3 0 68 2133500 1.3 32535 4.00 1 1
164 2.24 2.41 0.17 22 10 2 1 1 36 1306000 0.1 29875 4.00 1 1
167 0.00 0.16 0.16 19 6 3 0 0 28 259500 1.5 12900 2.00 1 1
167 0.09 0.19 0.10 8 2 1 0 0 11 91500 0.3 5964 2.00 1 2
167 0.14 0.28 0.14 12 2 1 0 0 15 103500 1.4 5741 2.00 1 2
167 0.15 0.31 0.16 6 5 0 0 0 11 105500 0.1 7180 2.00 1 2
167 0.16 0.33 0.17 11 8 1 0 0 20 205500 0.5 12890 2.00 1 2
167 0.19 0.36 0.17 15 6 0 1 0 22 650000 5.9 5399 2.00 1 2
167 25.70 26.67 0.97 124 67 10 1 0 202 2369500 1.1 50999 4.00 2 3
167 26.84 27.28 0.44 66 37 6 0 1 110 1540500 0.5 37257 4.00 1 4
169 11.35 11.53 0.18 27 6 4 0 0 37 316000 1.4 10127 2.00 0 1
181 5.32 5.62 0.30 59 21 5 2 0 87 1707000 0.9 30057 4.00 0 2
181 5.83 5.98 0.15 35 9 3 1 0 48 860000 1.2 25354 4.00 1 1
181 7.62 7.80 0.18 28 16 3 1 0 48 961500 0.6 34219 4.00 0 1
181 9.68 9.84 0.16 25 19 1 0 0 45 440000 0.1 30930 4.00 1 1
202 0.13 0.34 0.21 43 16 6 0 0 65 604000 0.5 37943 4.00 3 3
202 2.66 2.73 0.07 17 2 0 0 0 19 86000 0.0 7980 2.00 1 2
202 6.76 7.06 0.30 44 8 3 2 0 57 1440500 1.0 19320 3.20 1 6
202 7.17 7.26 0.09 12 6 2 0 0 20 206000 1.1 8909 3.00 1 3
202 7.28 7.43 0.15 27 4 2 0 0 33 216000 0.1 17818 4.00 1 4
202 7.45 7.57 0.12 32 12 5 1 0 50 968500 3.4 17818 4.00 0 1
202 7.63 7.80 0.17 17 12 3 0 0 32 358500 0.7 17818 4.00 1 2
202 8.14 8.35 0.19 40 20 7 0 0 67 697500 2.3 25821 4.00 0 2

SAFETY EVALUATION TESTBEDS -- AN ASSESSMENT OF SAFETY PROJECT PRIORITIZATION IN THE WSDOT I2 PROGRAM
Pennsylvania Transportation Institute, University Park, PA 16802 A-6
Table A-1- 5 Detailed Section-by-Section Characteristics, Part-V
SR Begin
Milepost End
Milepost Length
Property Damage (2-Yr)
Possible Injury (2-Yr)
Evident Injury (2-Yr)
Disabling Injury (2-Yr)
Fatality (2-Yr)
Total Accidents
(2-Yr)
Societal Cost Per Year
Severity Index
Average Daily
Traffic
Total No. of Lanes
Total No. of
Horizontal Curves
No. of Interchanges
/ Intersections
202 13.00 13.13 0.13 7 7 7 0 0 21 371000 0.5 11011 2.00 0 1
202 24.46 24.68 0.22 3 4 5 1 0 13 741500 0.4 5621 2.00 3 0
204 2.05 2.35 0.30 20 14 1 0 1 36 837500 0.2 22177 4.00 1 2
405 0.00 0.39 0.39 15 12 4 0 0 31 385000 7.9 6325 5.00 2 1
405 0.06 0.12 0.06 8 3 1 0 0 12 109000 1.7 4627 5.00 1 1
405 0.12 0.24 0.12 13 9 2 0 0 24 261500 1.2 12926 5.00 1 1
405 0.15 0.31 0.16 11 3 4 0 0 18 215500 2.9 6735 5.00 1 1
405 0.16 0.32 0.16 18 13 3 0 0 34 379000 3.7 11091 5.00 1 1
405 0.19 0.38 0.19 7 4 1 0 0 12 123500 0.3 7383 5.00 1 1
509 0.00 0.44 0.44 37 24 4 1 0 66 1161000 8.7 12661 4.00 1 1
509 0.00 0.50 0.50 5 0 0 0 1 6 515000 0.6 5380 4.00 1 1
509 0.11 0.22 0.11 3 3 1 0 1 8 594000 0.3 9469 4.00 0 1
509 19.85 20.32 0.47 30 15 10 0 0 55 677500 0.0 20372 2.00 1 2
515 0.36 0.59 0.23 25 14 1 0 0 40 352500 0.1 25267 4.00 0 1
515 0.91 1.27 0.36 86 39 11 2 0 138 2298000 4.3 28282 4.00 0 1
515 3.99 4.23 0.24 25 14 1 1 0 41 852500 0.3 25756 4.00 0 1
515 4.75 5.20 0.45 50 27 10 1 0 88 1447500 0.9 27154 4.00 0 2
516 1.79 2.14 0.34 42 16 6 1 0 65 1101000 0.5 30814 4.00 1 3
516 4.90 6.04 1.14 170 73 12 1 1 257 3177500 0.6 26817 4.00 3 7
516 7.09 7.72 0.63 120 56 10 0 0 186 1665000 2.7 28175 4.00 3 4
516 10.53 10.80 0.27 24 13 4 2 0 43 1429500 1.2 26479 4.00 0 1
516 11.99 12.19 0.20 35 12 4 0 0 51 445000 0.0 29477 4.00 0 1
518 0.00 0.21 0.21 12 5 2 1 0 20 688500 4.2 7007 4.00 1 1
518 0.05 0.11 0.06 13 4 0 0 0 17 109000 7.6 2537 4.00 0 1

SAFETY EVALUATION TESTBEDS -- AN ASSESSMENT OF SAFETY PROJECT PRIORITIZATION IN THE WSDOT I2 PROGRAM
Pennsylvania Transportation Institute, University Park, PA 16802 A-7
Table A-1- 6 Detailed Section-by-Section Characteristics, Part-VI
SR Begin
Milepost End
Milepost Length
Property Damage (2-Yr)
Possible Injury (2-Yr)
Evident Injury (2-Yr)
Disabling Injury (2-Yr)
Fatality (2-Yr)
Total Accidents
(2-Yr)
Societal Cost Per Year
Severity Index
Average Daily
Traffic
Total No. of Lanes
Total No. of
Horizontal Curves
No. of Interchanges
/ Intersections
519 0.34 0.51 0.17 44 13 2 1 0 60 924500 2.2 17558 4.00 0 3
520 0.00 0.22 0.22 13 7 1 0 1 22 694000 1.2 14149 4.00 1 1
520 0.01 0.21 0.20 41 6 5 0 0 52 390500 0.4 28159 4.00 1 1
520 0.06 0.17 0.11 6 3 4 0 1 14 700500 2.9 7953 4.00 1 1
520 0.14 0.28 0.14 8 4 1 0 0 13 126500 0.7 6997 4.00 1 1
520 0.20 0.40 0.20 8 4 1 0 0 13 126500 0.9 6483 4.00 1 1
520 0.23 0.46 0.23 29 13 3 1 0 46 912000 3.5 16129 4.00 2 1
522 0.00 0.31 0.31 4 4 1 1 0 10 614500 2.9 4600 2.00 2 1
522 4.09 4.51 0.42 68 25 14 0 0 107 1096500 0.6 48050 5.00 1 1
522 6.61 7.68 1.07 143 58 47 11 0 259 8471500 0.6 57030 6.00 2 3
522 16.50 16.60 0.10 14 13 1 0 0 28 302000 1.5 11610 2.00 0 1
522 16.60 16.80 0.20 20 7 2 1 0 30 747500 0.8 11610 2.00 0 1
523 0.49 0.56 0.07 14 13 5 0 0 32 432000 0.3 25684 4.00 0 5
523 0.86 1.13 0.27 27 22 1 1 0 51 998500 0.6 25684 4.00 0 6
524 4.06 4.48 0.42 61 31 8 1 0 101 1485500 0.2 32626 4.00 1 2
524 4.49 5.24 0.75 120 48 22 2 0 192 2915000 1.5 32626 4.00 1 5
524 5.57 5.96 0.39 52 17 11 1 0 81 1311000 2.2 24493 4.00 2 3
524 6.69 6.81 0.12 16 8 7 1 0 32 915500 2.3 14825 2.00 1 1
524 7.43 7.61 0.18 7 9 7 0 0 23 406000 0.1 17006 2.00 0 1
524 9.44 9.68 0.24 24 5 6 0 0 35 354500 0.4 17686 2.00 0 1
524 0.00B 0.08 0.20 11 6 2 0 0 19 203000 5.0 3265 2.00 0 2
525 0.00 0.52 0.52 9 1 3 1 0 14 642000 14.3 2193 3.00 1 2
525 0.15 0.30 0.15 7 5 1 0 0 13 141000 5.9 2895 3.00 1 1
525 3.43 4.27 0.84 88 50 12 2 1 153 3029000 2.2 23022 3.00 0 2
525 8.08 8.28 0.20 14 8 1 0 0 23 214500 0.5 9359 4.00 2 1
526 0.08 0.17 0.09 26 11 2 1 0 40 835500 3.2 14624 4.00 0 0
526 0.12 0.25 0.13 5 7 2 0 0 14 202500 3.1 5412 4.00 0 1

SAFETY EVALUATION TESTBEDS -- AN ASSESSMENT OF SAFETY PROJECT PRIORITIZATION IN THE WSDOT I2 PROGRAM
Pennsylvania Transportation Institute, University Park, PA 16802 A-8
Table A-1- 7 Detailed Section-by-Section Characteristics, Part-VII
SR Begin
Milepost End
Milepost Length
Property Damage (2-Yr)
Possible Injury (2-Yr)
Evident Injury (2-Yr)
Disabling Injury (2-Yr)
Fatality (2-Yr)
Total Accidents
(2-Yr)
Societal Cost Per Year
Severity Index
Average Daily
Traffic
Total No. of Lanes
Total No. of
Horizontal Curves
No. of Interchanges
/ Intersections
526 0.32 0.40 0.08 6 4 4 0 0 14 218000 0.5 10249 4.00 1 2
526 4.35 4.52 0.17 31 21 4 0 0 56 590500 0.2 41665 4.00 1 1
527 1.52 1.66 0.14 9 7 6 1 0 23 844500 0.8 15987 2.00 1 1
527 2.24 2.84 0.60 99 47 10 1 0 157 1944500 4.5 20791 4.00 1 4
527 3.64 3.99 0.35 62 25 9 1 0 97 1416000 1.9 35834 4.00 0 2
527 5.50 5.60 0.10 27 14 4 1 0 46 956000 0.8 30667 4.00 0 1
527 6.54 6.71 0.17 43 18 5 1 0 67 1106500 2.1 28569 4.00 1 1
527 8.79 8.94 0.15 20 16 1 0 0 37 372500 1.2 15487 2.00 1 2
527 10.31 10.55 0.24 54 11 9 0 0 74 647000 2.1 26557 5.00 1 2
528 0.01 0.50 0.49 62 19 9 3 0 93 2311000 1.2 29200 4.00 0 3
529 0.19 0.67 0.48 51 20 10 2 0 83 1828000 9.0 6874 2.00 0 4
529 0.73 1.03 0.30 30 16 7 0 0 53 597500 2.7 15275 4.00 0 3
529 6.63 6.69 0.06 30 6 3 0 0 39 292500 0.9 19604 4.00 0 2
531 1.41 1.56 0.15 4 4 3 1 0 12 679500 17.3 963 2.00 1 1
536 4.49 4.92 0.43 35 18 3 2 0 58 1517500 0.4 12646 2.00 2 2
536 5.13 5.34 0.21 20 9 0 1 0 30 717500 0.4 10560 2.00 1 1
538 0.27 0.69 0.42 56 26 10 3 0 95 2448000 2.2 25427 4.00 0 1
538 1.21 1.31 0.10 23 16 7 0 0 46 576500 1.9 20580 4.00 0 1
538 2.18 2.39 0.21 8 4 4 0 2 18 1224000 3.6 6953 2.00 1 0
539 0.02 0.75 0.73 132 60 17 0 0 209 1998500 0.6 44159 4.00 0 4
547 7.30 7.40 0.10 2 2 4 0 0 8 171000 6.8 1919 2.00 1 0
599 0.00 0.20 0.20 13 3 2 0 0 18 156500 2.6 5963 4.00 1 1
900 9.75 9.86 0.11 15 7 5 1 0 28 830000 1.3 17307 5.00 1 2
900 9.99 10.15 0.16 15 1 1 0 0 17 95000 0.0 5761 2.00 0 2
900 10.20 10.34 0.14 8 5 1 1 0 15 644000 2.1 5761 2.00 0 4
900 10.40 10.56 0.16 14 10 2 2 0 28 1282000 2.9 11522 2.00 0 5

SAFETY EVALUATION TESTBEDS -- AN ASSESSMENT OF SAFETY PROJECT PRIORITIZATION IN THE WSDOT I2 PROGRAM
Pennsylvania Transportation Institute, University Park, PA 16802 A-9
Table A-1- 8 Detailed Section-by-Section Characteristics, Part-VIII
SR Begin
Milepost End
Milepost Length
Property Damage (2-Yr)
Possible Injury (2-Yr)
Evident Injury (2-Yr)
Disabling Injury (2-Yr)
Fatality (2-Yr)
Total Accidents
(2-Yr)
Societal Cost Per Year
Severity Index
Average Daily
Traffic
Total No. of Lanes
Total No. of
Horizontal Curves
No. of Interchanges
/ Intersections
900 10.78 11.01 0.23 14 13 3 1 0 31 867000 1.3 16673 4.00 2 2
900 10.99 11.12 0.13 26 9 4 0 0 39 365500 0.5 23142 4.00 0 2
900 11.14 11.32 0.18 46 17 4 0 0 67 565500 0.4 38770 4.00 1 1
900 16.11 16.28 0.17 10 8 1 1 0 20 702500 1.9 8678 2.00 1 1
900 21.33 21.48 0.15 26 12 4 0 0 42 418000 3.7 12602 4.00 1 3
908 3.83 4.19 0.36 48 30 3 0 0 81 766500 0.1 35965 4.00 0 2
908 6.49 6.66 0.17 15 7 4 1 0 27 797500 5.7 5788 2.00 1 2

SAFETY EVALUATION TESTBEDS -- AN ASSESSMENT OF SAFETY PROJECT PRIORITIZATION IN THE WSDOT I2 PROGRAM
Pennsylvania Transportation Institute, University Park, PA 16802 A-10
THIS PAGE INTENTIONALL LEFT BLANK

SAFETY EVALUATION TESTBEDS -- AN ASSESSMENT OF SAFETY PROJECT PRIORITIZATION IN THE WSDOT I2 PROGRAM
Pennsylvania Transportation Institute, University Park, PA 16802 A-11
Table A-2- 1 Comparison Between DEA Variable-Return-to-Scale Results and Constant-Return-to-Scale Results, Part-I Outputs Weights Inputs Weights
SR Begin
Milepost End
Milepost Length
Return to
Scale
ACC Occurrence
Rankings Societal Costs
Severity Index
Total Accidents
Average Daily
Traffic
Total No. of Lanes
Total No. of Horizontal
Curves
No. of Interchanges / Intersections
CRS 0.4341 91 0.0000 0.0075 7.4538 9.8190 0.0000 0.0000 0.0000 2 0.00 0.37 0.37
VRS 0.5685 155 0.0000 0.0000 7.6957 6.2232 0.0344 0.2140 0.0000
CRS 0.2108 189 12.2421 0.0000 0.0000 2.5679 0.0000 0.0597 0.1403 2 0.08 0.16 0.08
VRS 0.5680 156 12.2421 0.0000 0.0000 1.5244 0.0740 0.3347 0.1201
CRS 0.8670 20 7.4837 0.0000 0.0000 11.7728 0.0000 0.3217 0.0000 2 0.13 0.26 0.13
VRS 0.8678 64 7.4837 0.0000 0.0000 11.4803 0.0000 0.3385 0.0000
CRS 0.7868 28 6.3291 0.0000 0.0000 0.0000 0.2195 0.9899 0.5610 2 13.75 13.91 0.16
VRS 1.0000 1 6.3291 0.0000 0.0000 0.0000 0.2613 0.5445 0.4775
CRS 1.0000 1 1.5326 0.0000 0.0000 0.2964 0.2079 0.0000 0.0000 2 14.50 15.11 0.61
VRS 1.0000 1 1.5326 0.0000 0.0000 0.0000 0.2456 0.0176 0.0000
CRS 1.0000 1 0.0000 0.1075 0.0000 0.3884 0.1601 1.9129 1.7618 5 0.00 0.12 0.12
VRS 1.0000 1 0.0000 0.0973 1.3525 0.4053 0.1599 9389051.3452 13891691.4274
CRS 0.5157 66 0.0000 0.0000 27.2308 4.8919 0.0831 0.0190 2.7162 5 0.10 0.21 0.11
VRS 0.9431 58 6.5877 0.1714 15.5343 1.4694 0.1416 0.6202 0.3990
CRS 0.5970 49 2.2621 0.1248 0.0000 0.0000 0.1381 0.9498 0.1715 5 0.11 0.23 0.12
VRS 0.7389 82 9.4813 0.0000 0.0000 1.8585 0.0902 0.4080 0.1464
CRS 0.1747 201 34.5766 0.5210 8.8810 15.4927 0.0000 1.6951 0.1546 5 0.15 0.30 0.15
VRS 0.8634 65 79.8752 0.0001 0.0267 13.5463 0.0000 0.4974 0.2608
CRS 0.1255 229 0.0000 0.0282 28.0861 10.7038 0.0000 0.0000 0.0000 5 0.18 0.36 0.18
VRS 0.4312 216 59.3457 0.0023 0.7622 4.2938 0.0492 0.2168 0.0435
CRS 0.1948 192 0.0000 0.0000 11.0625 0.8726 0.0107 0.0037 0.3645 5 0.19 0.38 0.19
VRS 0.4003 227 0.0000 0.0000 11.0625 1.1431 0.0546 0.2086 0.0989
CRS 0.1062 236 0.0000 0.0292 29.0696 9.3722 0.0000 0.0000 0.0000 5 0.20 0.41 0.21
VRS 0.4236 219 78.2087 0.0319 3.4295 0.9828 0.0654 0.2662 0.1183
CRS 0.5400 61 5.7232 0.0239 0.0000 1.7751 0.1383 0.0000 0.1645 9 1.47 1.70 0.23
VRS 1.0000 1 2.7509 0.0000 4.3322 0.0000 0.4648 0.0036 0.0668

SAFETY EVALUATION TESTBEDS -- AN ASSESSMENT OF SAFETY PROJECT PRIORITIZATION IN THE WSDOT I2 PROGRAM
Pennsylvania Transportation Institute, University Park, PA 16802 A-12
Table A-2- 2 Comparison Between DEA Variable-Return-to-Scale Results and Constant-Return-to-Scale Results, Part-II Outputs Weights Inputs Weights
SR Begin
Milepost End
Milepost Length
Return to
Scale
ACC Occurrence
Rankings Societal Costs
Severity Index
Total Accidents
Average Daily
Traffic
Total No. of Lanes
Total No. of Horizontal
Curves
No. of Interchanges / Intersections
CRS 0.5030 72 5.9116 0.0875 0.0000 0.0000 0.3729 0.0000 0.2543 9 10.87 10.97 0.10
VRS 1.0000 1 5.7462 0.0159 1.7396 0.0000 0.5000 0.0000 0.0000
CRS 0.7528 30 4.5889 0.1975 0.0000 0.0000 0.2882 1.8493 0.4236 9 13.93 14.13 0.20
VRS 1.0000 1 2.1139 0.2835 1.1389 0.0000 0.3186 1.7537 0.3627
CRS 0.6251 44 6.0858 0.0000 0.0000 1.5495 0.0376 0.5266 0.3254 9 15.75 15.96 0.21
VRS 0.8117 71 6.0858 0.0000 0.0000 1.1781 0.0934 0.4402 0.2277
CRS 0.4881 78 12.4125 0.0000 0.0000 6.2700 0.0554 0.0000 0.2692 9 53.16 53.36 0.20
VRS 1.0000 1 9.9110 0.0025 5.3978 0.0000 0.5000 0.0000 0.0000
CRS 0.8178 26 0.0000 0.0000 50.5714 13.8546 0.2801 0.0000 8.1315 9 77.87 77.97 0.10
VRS 1.0000 1 0.7828 0.0040 49.9640 0.0000 0.3718 0.2563 0.2563
CRS 1.0000 1 0.0000 0.1031 0.0000 37.0084 0.0000 0.0000 2.5433 11 10.78 10.84 0.06
VRS 1.0000 1 0.0000 0.1031 0.0000 34.7676 0.0090 0.0425 103263727.3048
CRS 0.6360 43 13.6215 0.0069 0.0000 9.0267 0.0000 0.1669 0.4513 18 0.00 0.33 0.33
VRS 0.7474 81 10.0188 0.0000 8.5683 7.5634 0.0199 0.3704 0.2302
CRS 0.1346 222 0.0000 0.1311 35.2072 10.2956 0.0000 0.0000 0.2920 18 0.09 0.18 0.09
VRS 0.5935 146 6.5526 0.0066 36.9800 1.3771 0.0916 0.3730 0.1657
CRS 0.1797 198 0.0000 0.0000 22.1250 1.6102 0.0197 0.0069 0.6725 18 0.13 0.26 0.13
VRS 0.5338 173 7.5961 0.1872 14.0175 1.2385 0.0824 0.3355 0.1490
CRS 0.1365 221 0.0000 0.0000 35.4000 4.0402 0.0000 0.0000 0.6979 18 0.14 0.28 0.14
VRS 0.5886 149 27.6263 0.0358 27.8284 1.3658 0.0909 0.3700 0.1643
CRS 0.2242 178 0.0000 0.1561 15.0977 5.6017 0.0000 0.2648 0.3611 18 0.17 0.34 0.17
VRS 0.5951 143 19.0795 0.0166 19.4883 1.3809 0.0919 0.3741 0.1662
CRS 0.1320 226 0.0000 0.0541 53.8932 21.6023 0.0000 0.0000 0.0000 18 0.20 0.40 0.20
VRS 0.6203 131 8.6744 0.0480 49.8762 7.5208 0.0636 0.3348 0.0313
CRS 0.5014 74 9.9314 0.0000 0.0000 0.0000 0.2195 0.9899 0.5610 18 14.55 14.76 0.21
VRS 1.0000 1 7.7812 0.3963 1.8687 0.0000 0.3717 0.2565 0.2565
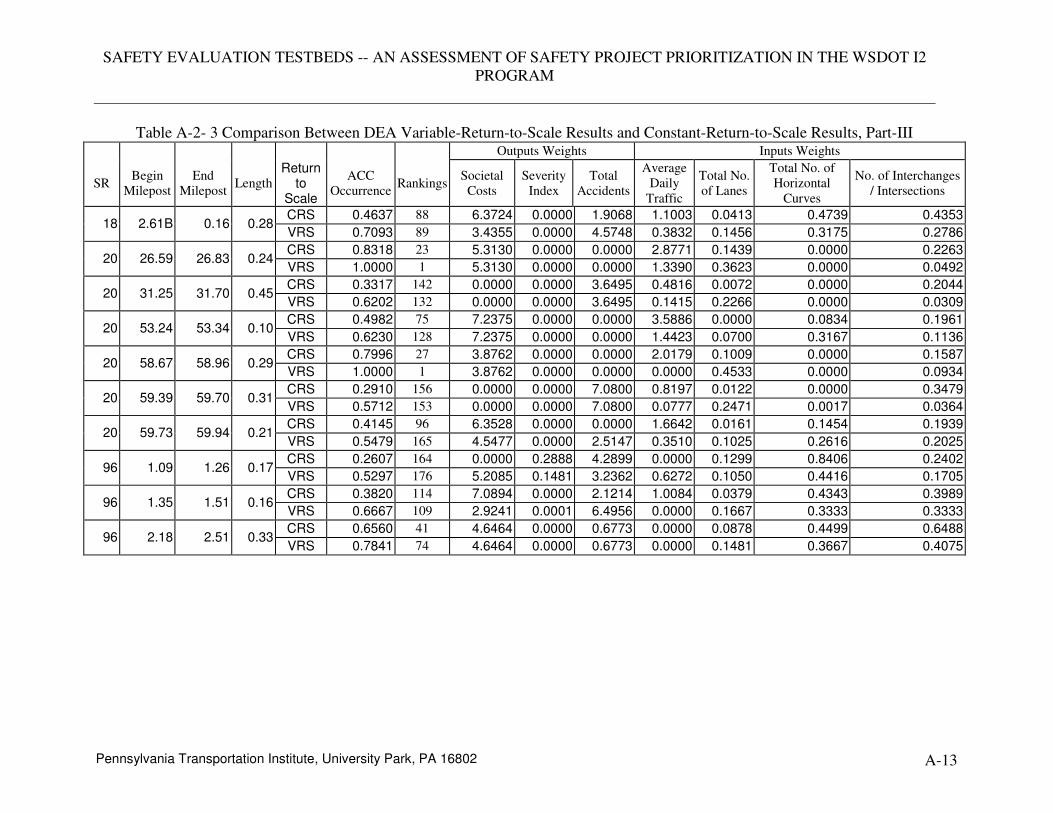
SAFETY EVALUATION TESTBEDS -- AN ASSESSMENT OF SAFETY PROJECT PRIORITIZATION IN THE WSDOT I2 PROGRAM
Pennsylvania Transportation Institute, University Park, PA 16802 A-13
Table A-2- 3 Comparison Between DEA Variable-Return-to-Scale Results and Constant-Return-to-Scale Results, Part-III Outputs Weights Inputs Weights
SR Begin
Milepost End
Milepost Length
Return to
Scale
ACC Occurrence
Rankings Societal
Costs Severity
Index Total
Accidents
Average Daily
Traffic
Total No. of Lanes
Total No. of Horizontal
Curves
No. of Interchanges / Intersections
CRS 0.4637 88 6.3724 0.0000 1.9068 1.1003 0.0413 0.4739 0.4353 18 2.61B 0.16 0.28
VRS 0.7093 89 3.4355 0.0000 4.5748 0.3832 0.1456 0.3175 0.2786
CRS 0.8318 23 5.3130 0.0000 0.0000 2.8771 0.1439 0.0000 0.2263 20 26.59 26.83 0.24
VRS 1.0000 1 5.3130 0.0000 0.0000 1.3390 0.3623 0.0000 0.0492
CRS 0.3317 142 0.0000 0.0000 3.6495 0.4816 0.0072 0.0000 0.2044 20 31.25 31.70 0.45
VRS 0.6202 132 0.0000 0.0000 3.6495 0.1415 0.2266 0.0000 0.0309
CRS 0.4982 75 7.2375 0.0000 0.0000 3.5886 0.0000 0.0834 0.1961 20 53.24 53.34 0.10
VRS 0.6230 128 7.2375 0.0000 0.0000 1.4423 0.0700 0.3167 0.1136
CRS 0.7996 27 3.8762 0.0000 0.0000 2.0179 0.1009 0.0000 0.1587 20 58.67 58.96 0.29
VRS 1.0000 1 3.8762 0.0000 0.0000 0.0000 0.4533 0.0000 0.0934
CRS 0.2910 156 0.0000 0.0000 7.0800 0.8197 0.0122 0.0000 0.3479 20 59.39 59.70 0.31
VRS 0.5712 153 0.0000 0.0000 7.0800 0.0777 0.2471 0.0017 0.0364
CRS 0.4145 96 6.3528 0.0000 0.0000 1.6642 0.0161 0.1454 0.1939 20 59.73 59.94 0.21
VRS 0.5479 165 4.5477 0.0000 2.5147 0.3510 0.1025 0.2616 0.2025
CRS 0.2607 164 0.0000 0.2888 4.2899 0.0000 0.1299 0.8406 0.2402 96 1.09 1.26 0.17
VRS 0.5297 176 5.2085 0.1481 3.2362 0.6272 0.1050 0.4416 0.1705
CRS 0.3820 114 7.0894 0.0000 2.1214 1.0084 0.0379 0.4343 0.3989 96 1.35 1.51 0.16
VRS 0.6667 109 2.9241 0.0001 6.4956 0.0000 0.1667 0.3333 0.3333
CRS 0.6560 41 4.6464 0.0000 0.6773 0.0000 0.0878 0.4499 0.6488 96 2.18 2.51 0.33
VRS 0.7841 74 4.6464 0.0000 0.6773 0.0000 0.1481 0.3667 0.4075

SAFETY EVALUATION TESTBEDS -- AN ASSESSMENT OF SAFETY PROJECT PRIORITIZATION IN THE WSDOT I2 PROGRAM
Pennsylvania Transportation Institute, University Park, PA 16802 A-14
Table A-2- 4 Comparison Between DEA Variable-Return-to-Scale Results and Constant-Return-to-Scale Results, Part-IV Outputs Weights Inputs Weights
Return to
Scale
ACC Occurrence
Rankings Societal Costs
Severity Index
Total Accidents
Average Daily
Traffic
Total No. of Lanes
Total No. of Horizontal
Curves
No. of Interchanges / Intersections
SR Begin
Milepost End
Milepost Length
VRS 0.6852 102 14.1192 0.0000 0.0000 1.8972 0.0921 0.4165 0.1494
CRS 0.4738 84 0.0000 0.2070 15.7215 24.7957 0.0000 1.5304 0.0000 99 0.09 0.19 0.10
VRS 1.0000 1 8.6075 0.0514 31.2277 24.7957 0.0000 0.6843 0.0000
CRS 0.5439 59 4.0289 0.1734 0.0000 0.0000 0.1828 1.1730 0.2687 99 8.05 8.27 0.22
VRS 0.7747 77 1.5858 0.1280 2.7209 0.5600 0.1479 0.6868 0.2305
CRS 1.0000 1 0.0000 0.0000 1.0000 1.9963 0.0000 0.0565 0.0674 99 8.87 10.26 1.39
VRS 1.0000 1 0.4026 0.0247 0.5600 2.9315 0.0052 38834.1389 0.0011
CRS 0.3942 106 0.0000 0.0000 3.0517 0.4786 0.0071 0.0000 0.2031 99 10.29 10.79 0.50
VRS 0.6100 135 0.0000 0.0000 3.0517 0.1073 0.2118 0.0016 0.0289
CRS 0.1488 218 0.0000 0.0000 13.6154 0.8062 0.0120 0.0000 0.3421 99 10.86 10.97 0.11
VRS 0.5000 192 2.9599 0.0076 11.7904 0.0000 0.2500 0.0000 0.0000
CRS 0.3418 136 7.7805 0.0000 0.6224 1.0152 0.0299 0.4027 0.2716 99 11.18 11.48 0.30
VRS 0.6005 138 5.3693 0.0000 2.6684 1.3779 0.0695 0.2892 0.1321
CRS 0.6375 42 0.0000 0.0000 4.8493 1.2520 0.0154 0.0053 0.5229 99 11.62 12.02 0.40
VRS 0.8169 70 0.0000 0.0000 4.8493 0.7310 0.1189 0.2565 0.2815
CRS 0.8724 19 3.4937 0.0000 0.5093 0.0000 0.0953 0.4724 0.6189 99 12.90 13.21 0.31
VRS 0.9199 61 3.4937 0.0000 0.5093 0.0000 0.1481 0.3667 0.4075
CRS 0.2917 155 0.0000 0.0000 6.3214 0.0000 0.1094 0.0000 0.2813 99 13.65 13.80 0.15
VRS 0.5571 161 0.0000 0.0000 6.3214 0.0000 0.1517 0.1396 0.1967
CRS 0.3026 149 5.2197 0.0000 0.0000 1.0284 0.0514 0.0000 0.0809 99 13.99 14.39 0.40
VRS 0.5170 183 3.3397 0.0000 2.3611 0.0501 0.2165 0.0172 0.0300
CRS 0.8660 22 0.9746 0.0289 1.9646 0.0000 0.1494 0.0000 0.4026 99 15.26 15.58 0.32
VRS 0.8719 63 0.7311 0.0000 2.5353 0.0000 0.1733 0.0000 0.3070

SAFETY EVALUATION TESTBEDS -- AN ASSESSMENT OF SAFETY PROJECT PRIORITIZATION IN THE WSDOT I2 PROGRAM
Pennsylvania Transportation Institute, University Park, PA 16802 A-15
Table A-2- 5 Comparison Between DEA Variable-Return-to-Scale Results and Constant-Return-to-Scale Results, Part-V Outputs Weights Inputs Weights
SR Begin
Milepost End
Milepost Length
Return to
Scale
ACC Occurrence
Rankings Societal Costs
Severity Index
Total Accidents
Average Daily
Traffic
Total No. of Lanes
Total No. of Horizontal
Curves
No. of Interchanges / Intersections
CRS 0.5197 65 4.9965 0.0000 0.0000 0.9230 0.0376 0.3917 0.2214 99 16.40 16.78 0.38
VRS 0.6571 112 4.9965 0.0000 0.0000 0.8739 0.0693 0.3265 0.1689
CRS 1.0000 1 3.1812 0.0000 0.0000 1.1353 0.0370 0.5258 0.3149 99 17.43 17.75 0.32
VRS 1.0000 1 2.9775 0.0213 0.0000 0.0000 0.0000 1.5396 1.0000
CRS 0.2932 152 0.0000 0.0000 10.4118 1.2362 0.0152 0.0053 0.5163 99 18.26 18.45 0.19
VRS 0.4650 208 0.0000 0.0000 10.4118 0.3142 0.1006 0.1778 0.2170
CRS 0.3648 125 9.6953 0.0000 0.7756 1.3502 0.0398 0.5356 0.3612 99 19.06 19.15 0.09
VRS 0.6240 127 10.2809 0.0000 0.0000 1.0922 0.0866 0.4081 0.2111
CRS 0.1906 193 11.9570 0.0000 0.0000 1.4401 0.0139 0.1258 0.1678 99 19.37 19.51 0.14
VRS 0.4050 222 7.6654 0.0000 4.7058 0.7813 0.0902 0.1530 0.0707
CRS 0.6781 39 3.5826 0.0248 0.0000 1.2135 0.0463 0.1710 0.2020 99 19.42 19.49 0.07
VRS 0.6921 97 3.4433 0.0316 0.0000 0.6739 0.0683 0.2419 0.1972
CRS 0.4917 77 3.2819 0.0590 0.0000 0.0000 0.0968 0.2624 0.1752 99 20.06 20.29 0.23
VRS 0.6208 130 3.5589 0.0195 0.0000 0.0000 0.2063 0.0612 0.0568
CRS 0.1558 211 0.0000 0.0000 13.1111 0.8128 0.0121 0.0000 0.3449 99 22.85 23.02 0.18
VRS 0.5000 192 0.4720 0.0010 12.9317 0.0000 0.2500 0.0000 0.0000
CRS 0.3095 146 3.5760 0.0000 0.0000 0.0000 0.1667 0.0554 0.0000 99 37.18 37.80 0.62
VRS 0.3926 233 3.5760 0.0000 0.0000 0.0000 0.1419 0.0535 0.0149
CRS 0.4775 82 4.7380 0.0000 0.0000 0.4109 0.0596 0.3988 0.2321 99 38.97 39.22 0.25
VRS 0.5759 151 4.7380 0.0000 0.0000 0.4722 0.0781 0.2778 0.1681
CRS 0.2966 151 5.8143 0.0000 1.7398 0.6421 0.0241 0.2766 0.2540 99 39.26 39.51 0.25
VRS 0.4873 205 2.5705 0.0000 4.4955 0.2322 0.0984 0.2048 0.1869
CRS 0.5699 54 2.5590 0.0000 0.0000 0.0000 0.1214 0.2470 0.0786 99 39.58 40.18 0.60
VRS 0.6112 134 2.5590 0.0000 0.0000 0.0691 0.1672 0.0569 0.0248
CRS 0.9817 15 2.3049 0.0000 0.0000 0.4109 0.0596 0.3988 0.2321 99 40.21 40.59 0.38
VRS 1.0000 1 2.3049 0.0000 0.0000 0.0000 0.0000 1.8800 0.5000

SAFETY EVALUATION TESTBEDS -- AN ASSESSMENT OF SAFETY PROJECT PRIORITIZATION IN THE WSDOT I2 PROGRAM
Pennsylvania Transportation Institute, University Park, PA 16802 A-16
Table A-2- 6 Comparison Between DEA Variable-Return-to-Scale Results and Constant-Return-to-Scale Results, Part-VI Outputs Weights Inputs Weights
SR Begin
Milepost End
Milepost Length
Return to
Scale
ACC Occurrence
Rankings Societal Costs
Severity Index
Total Accidents
Average Daily
Traffic
Total No. of Lanes
Total No. of Horizontal
Curves
No. of Interchanges / Intersections
CRS 0.5054 70 1.7532 0.0000 1.7451 0.0000 0.0941 0.1716 0.2079 99 40.66 41.10 0.44
VRS 0.6394 118 0.0000 0.0000 3.0256 0.0000 0.1744 0.0558 0.1008
CRS 0.3968 104 3.7610 0.0318 0.0000 0.0000 0.2500 0.0000 0.0000 99 41.17 41.45 0.28
VRS 0.5349 172 2.5197 0.0000 1.9939 0.0000 0.2186 0.0129 0.0249
CRS 0.5862 50 3.4486 0.0000 0.0000 0.0000 0.1683 0.3424 0.1089 99 41.71 42.11 0.40
VRS 0.6556 113 3.4486 0.0000 0.0000 0.0000 0.2281 0.0938 0.0292
CRS 0.2865 157 0.0000 0.0000 6.4364 0.0000 0.1094 0.0000 0.2813 99 43.39 43.57 0.17
VRS 0.5254 179 0.0000 0.0000 6.4364 0.0000 0.2235 0.0000 0.0530
CRS 0.3862 111 0.0000 0.0000 3.7263 0.0000 0.0854 0.0000 0.2195 99 45.35 45.84 0.49
VRS 0.5903 148 0.0000 0.0000 3.7263 0.0000 0.2294 0.0108 0.0275
CRS 0.3472 133 1.5614 0.0590 3.7220 0.0000 0.1195 0.0000 0.2610 99 45.86 46.19 0.33
VRS 0.5449 166 0.0000 0.0000 5.7097 0.0000 0.2214 0.0122 0.0510
CRS 0.2969 150 0.0000 0.0000 6.2105 0.0000 0.1094 0.0000 0.2812 99 46.39 46.66 0.27
VRS 0.5601 158 0.0000 0.0000 6.2105 0.0000 0.1517 0.1396 0.1967
CRS 0.3415 137 0.0000 0.0000 4.2143 0.0000 0.0854 0.0000 0.2195 99 46.75 47.05 0.30
VRS 0.5706 154 0.0000 0.0000 4.2143 0.0000 0.2294 0.0108 0.0275
CRS 0.5990 48 0.0000 0.0000 3.0783 0.0000 0.1094 0.0000 0.2812 99 48.67 49.17 0.50
VRS 0.6792 106 0.0000 0.0000 3.0783 0.0000 0.1375 0.0000 0.2250
CRS 0.3701 120 0.0000 0.0000 2.7023 0.0000 0.2500 0.0000 0.0000 99 49.91 50.66 0.75
VRS 0.6050 136 0.0000 0.0000 2.7023 0.0000 0.2119 0.0099 0.0254
CRS 0.3869 109 4.7116 0.0000 0.0000 0.0000 0.1518 0.3088 0.0982 99 50.75 51.40 0.65
VRS 0.5955 140 0.0000 0.0000 3.3084 0.0000 0.2232 0.0105 0.0268
CRS 0.6595 40 3.0649 0.0000 0.0000 0.0000 0.1683 0.3424 0.1089 99 51.98 52.48 0.50
VRS 0.7024 91 3.0649 0.0000 0.0000 0.0000 0.2281 0.0938 0.0292
CRS 0.6248 45 5.2354 0.0000 0.0263 0.0000 0.0811 0.4604 0.6252 99 52.66 52.95 0.29
VRS 0.7172 86 5.2569 0.0000 0.0000 0.0000 0.1328 0.3587 0.3862

SAFETY EVALUATION TESTBEDS -- AN ASSESSMENT OF SAFETY PROJECT PRIORITIZATION IN THE WSDOT I2 PROGRAM
Pennsylvania Transportation Institute, University Park, PA 16802 A-17
Table A-2- 7 Comparison Between DEA Variable-Return-to-Scale Results and Constant-Return-to-Scale Results, Part-VII Outputs Weights Inputs Weights
SR Begin
Milepost End
Milepost Length
Return to
Scale
ACC Occurrence
Rankings Societal Costs
Severity Index
Total Accidents
Average Daily
Traffic
Total No. of Lanes
Total No. of Horizontal
Curves
No. of Interchanges / Intersections
CRS 0.2792 159 0.0000 0.2300 1.8602 0.0000 0.1056 0.7950 0.1221 99 53.59 53.89 0.30
VRS 0.4849 206 5.6115 0.0000 3.0292 1.1432 0.0570 0.2388 0.1092
CRS 0.4863 79 2.6197 0.0000 0.9040 0.5078 0.0179 0.2001 0.1934 99 54.30 54.78 0.48
VRS 0.5408 169 0.4353 0.0000 2.4384 0.3640 0.0610 0.1318 0.1366
CRS 0.1602 209 4.3156 0.0000 4.6887 0.4830 0.0123 0.0546 0.1916 99 54.80 54.89 0.09
VRS 0.3389 240 1.3110 0.0000 7.2925 0.0403 0.1497 0.0108 0.0221
CRS 0.1788 199 0.0000 0.0000 7.2245 0.5138 0.0077 0.0000 0.2181 99 55.00 55.20 0.20
VRS 0.3469 238 0.0000 0.0000 7.2245 0.0474 0.1506 0.0010 0.0222
CRS 0.3969 103 15.2365 0.0000 0.0000 6.5180 0.0000 0.0792 0.2959 104 24.65 24.74 0.09
VRS 0.6327 119 15.2365 0.0000 0.0000 2.3938 0.0758 0.3334 0.1339
CRS 0.3815 115 6.4471 0.0000 0.0000 0.4125 0.0342 0.2367 0.4562 104 26.43 26.52 0.09
VRS 0.5298 175 6.4471 0.0000 0.0000 0.4952 0.0820 0.2914 0.1763
CRS 0.9214 16 2.0318 0.0000 0.0000 1.2188 0.0609 0.0000 0.0959 164 0.31 1.07 0.76
VRS 0.9315 59 2.0318 0.0000 0.0000 1.6280 0.0000 0.0000 0.1247
CRS 0.4638 87 0.0000 0.0000 5.5312 0.0000 0.1166 0.0000 0.5335 164 1.09 1.34 0.25
VRS 0.6162 133 0.0000 0.0000 5.5312 0.0000 0.1608 0.1481 0.2086
CRS 0.6180 47 2.7832 0.0000 1.5570 0.0000 0.0696 0.1583 0.5634 164 1.78 2.14 0.36
VRS 0.6878 99 3.6304 0.0000 0.4462 0.0000 0.1237 0.2361 0.2690
CRS 0.3720 118 6.4866 0.0000 0.0000 0.0000 0.0595 0.2297 0.5323 164 2.24 2.41 0.17
VRS 0.5271 177 0.0000 0.0000 9.8333 0.0000 0.1608 0.1481 0.2086
CRS 0.3209 144 0.0000 0.1235 10.3012 0.0000 0.2295 0.0000 0.5409 167 0.00 0.16 0.16
VRS 1.0000 1 0.2320 0.0477 11.6492 0.0000 0.5000 0.0000 0.0000

SAFETY EVALUATION TESTBEDS -- AN ASSESSMENT OF SAFETY PROJECT PRIORITIZATION IN THE WSDOT I2 PROGRAM
Pennsylvania Transportation Institute, University Park, PA 16802 A-18
Table A-2- 8 Comparison Between DEA Variable-Return-to-Scale Results and Constant-Return-to-Scale Results, Part-VIII Outputs Weights Inputs Weights
SR Begin
Milepost End
Milepost Length
Return to
Scale
ACC Occurrence
Rankings Societal Costs
Severity Index
Total Accidents
Average Daily
Traffic
Total No. of Lanes
Total No. of Horizontal
Curves
No. of Interchanges / Intersections
CRS 0.0988 238 0.0000 0.0320 31.8729 9.5624 0.0000 0.0000 0.0000 167 0.09 0.19 0.10
VRS 1.0000 1 2.6592 0.0138 31.1190 0.0000 0.5000 0.0000 0.0000
CRS 0.1432 219 0.0000 0.0229 22.8421 9.9335 0.0000 0.0000 0.0000 167 0.14 0.28 0.14
VRS 1.0000 1 2.3571 0.0634 20.8254 0.0000 0.5000 0.0000 0.0000
CRS 0.0820 241 0.0000 0.0000 32.1818 7.9429 0.0000 0.0000 0.0000 167 0.15 0.31 0.16
VRS 1.0000 1 4.7516 0.0557 30.0982 0.0000 0.5000 0.0000 0.0000
CRS 0.1341 223 0.0000 0.1918 16.0024 0.0000 0.1490 0.0000 0.3510 167 0.16 0.33 0.17
VRS 1.0000 1 10.5469 0.2667 10.8116 0.0000 0.5000 0.0000 0.0000
CRS 0.4753 83 5.7219 0.0951 0.0000 0.0000 0.5000 0.0000 0.0000 167 0.19 0.36 0.17
VRS 1.0000 1 1.5626 0.0766 6.8921 0.0000 0.5000 0.0000 0.0000
CRS 0.8211 25 0.0000 0.0000 1.7525 0.0000 0.0854 0.0000 0.2195 167 25.70 26.67 0.97
VRS 0.8503 66 0.0000 0.0000 1.7525 0.0000 0.1122 0.0000 0.1837
CRS 0.3667 123 0.0000 0.0000 3.2182 0.0000 0.0700 0.0000 0.1800 167 26.84 27.28 0.44
VRS 0.5945 145 0.0000 0.0000 3.2182 0.0000 0.2209 0.0104 0.0265
CRS 0.4446 90 0.0000 0.3387 5.0306 0.0000 0.2598 1.6812 0.4805 169 11.35 11.53 0.18
VRS 1.0000 1 0.0000 0.0000 9.5676 2.2059 0.1375 0.5943 0.3332
CRS 0.5075 68 4.2137 0.0000 0.6142 0.0000 0.1008 0.4331 0.2985 181 5.32 5.62 0.30
VRS 0.6511 116 0.7537 0.0000 3.4510 0.1124 0.1348 0.1795 0.2008
CRS 0.3690 122 0.6854 0.0000 6.8619 1.0849 0.0165 0.0000 0.4516 181 5.83 5.98 0.15
VRS 0.5653 157 0.0000 0.0000 7.3750 0.0000 0.1608 0.1481 0.2086
CRS 0.4062 99 7.5039 0.0000 1.0938 0.0000 0.1167 0.5365 0.5334 181 7.62 7.80 0.18
VRS 0.7000 92 0.0000 0.0000 7.3750 0.0000 0.1683 0.2633 0.3267
CRS 0.3261 143 0.0000 0.0000 7.8667 0.0000 0.1101 0.0000 0.5595 181 9.68 9.84 0.16
VRS 0.5557 162 0.0000 0.0000 7.8667 0.0000 0.1608 0.1481 0.2086

SAFETY EVALUATION TESTBEDS -- AN ASSESSMENT OF SAFETY PROJECT PRIORITIZATION IN THE WSDOT I2 PROGRAM
Pennsylvania Transportation Institute, University Park, PA 16802 A-19
Table A-2- 9 Comparison Between DEA Variable-Return-to-Scale Results and Constant-Return-to-Scale Results, Part-IX Outputs Weights Inputs Weights
SR Begin
Milepost End
Milepost Length
Return to
Scale
ACC Occurrence
Rankings Societal Costs
Severity Index
Total Accidents
Average Daily
Traffic
Total No. of Lanes
Total No. of Horizontal
Curves
No. of Interchanges / Intersections
CRS 0.2642 162 0.0000 0.0000 5.4462 0.0000 0.0854 0.0000 0.2195 202 0.13 0.34 0.21
VRS 0.5265 178 0.0000 0.0000 5.4462 0.0000 0.2294 0.0000 0.0274
CRS 0.1325 225 0.0000 0.0000 18.6316 0.9818 0.0146 0.0000 0.4167 202 2.66 2.73 0.07
VRS 1.0000 1 8.6043 0.0000 17.0042 0.0000 0.5000 0.0000 0.0000
CRS 0.3418 135 5.8809 0.0000 0.0000 0.4264 0.2674 0.0000 0.0000 202 6.76 7.06 0.30
VRS 0.6250 126 1.1069 0.0041 5.0158 0.0000 0.3125 0.0000 0.0000
CRS 0.1215 231 0.0000 0.0174 17.3607 6.4014 0.0000 0.0000 0.0000 202 7.17 7.26 0.09
VRS 0.6667 109 1.0760 0.0180 16.8871 0.0000 0.3333 0.0000 0.0000
CRS 0.1132 233 0.0000 0.0000 10.7273 0.4832 0.0072 0.0000 0.2051 202 7.28 7.43 0.15
VRS 0.5000 192 1.1654 0.0209 10.3861 0.0000 0.2500 0.0000 0.0000
CRS 0.5712 53 3.8366 0.1651 0.0000 0.0000 0.1828 1.1730 0.2687 202 7.45 7.57 0.12
VRS 0.7773 76 1.5843 0.1279 2.7183 0.5616 0.1483 0.6888 0.2311
CRS 0.1861 196 0.0000 0.0000 11.0625 0.8191 0.0122 0.0000 0.3476 202 7.63 7.80 0.17
VRS 0.5000 192 0.3066 0.0039 10.8891 0.0000 0.2500 0.0000 0.0000
CRS 0.3849 113 0.0000 0.1957 2.9059 0.0000 0.1299 0.8406 0.2402 202 8.14 8.35 0.19
VRS 0.5963 139 0.0000 0.0690 4.4451 0.0755 0.1553 0.2311 0.1722
CRS 0.2502 169 15.5605 0.0000 5.3697 1.5516 0.0548 0.6112 0.5908 202 13.00 13.13 0.13
VRS 1.0000 1 12.5204 0.1934 5.9836 0.0000 0.4022 0.1957 0.1957
CRS 0.8307 24 0.9147 0.0000 25.0507 7.1894 0.1457 0.0000 4.1704 202 24.46 24.68 0.22
VRS 1.0000 1 11.0867 0.0014 0.7910 0.0000 0.5000 0.0000 0.0000
CRS 0.2145 184 4.7768 0.0000 5.1897 0.7159 0.0182 0.0809 0.2839 204 2.05 2.35 0.30
VRS 0.5000 192 0.5196 0.0006 9.3271 0.0000 0.2500 0.0000 0.0000

SAFETY EVALUATION TESTBEDS -- AN ASSESSMENT OF SAFETY PROJECT PRIORITIZATION IN THE WSDOT I2 PROGRAM
Pennsylvania Transportation Institute, University Park, PA 16802 A-20
Table A-2- 10 Comparison Between DEA Variable-Return-to-Scale Results and Constant-Return-to-Scale Results, Part-X Outputs Weights Inputs Weights
SR Begin
Milepost End
Milepost Length
Return to
Scale
ACC Occurrence
Rankings Societal Costs
Severity Index
Total Accidents
Average Daily
Traffic
Total No. of Lanes
Total No. of Horizontal
Curves
No. of Interchanges / Intersections
CRS 0.3865 110 0.0000 0.0318 8.5475 7.1806 0.0000 0.0000 0.2036 405 0.00 0.39 0.39
VRS 0.4353 213 0.0000 0.0000 11.4194 3.5416 0.0442 0.1680 0.0504
CRS 0.1691 206 0.0000 0.0926 24.8571 9.1332 0.0000 0.0000 0.2590 405 0.06 0.12 0.06
VRS 0.5354 171 1.2683 0.0015 28.9448 1.2422 0.0827 0.3365 0.1495
CRS 0.2358 174 0.0000 0.0000 14.7500 1.4087 0.0173 0.0060 0.5883 405 0.12 0.24 0.12
VRS 0.4633 209 0.0000 0.0000 14.7500 1.0886 0.0595 0.2611 0.1947
CRS 0.2126 186 0.0000 0.1279 12.3704 4.3512 0.0000 0.2056 0.2805 405 0.14 0.29 0.15
VRS 0.5180 181 18.9083 0.0000 10.2071 1.4882 0.0742 0.3109 0.1422
CRS 0.3500 131 0.0000 0.0000 10.4118 1.4756 0.0181 0.0063 0.6163 405 0.14 0.29 0.15
VRS 0.5150 184 0.0000 0.0000 10.4118 1.1282 0.0616 0.2706 0.2018
CRS 0.1368 220 0.0000 0.0000 29.5000 2.8267 0.0000 0.0148 0.6193 405 0.19 0.38 0.19
VRS 0.5050 187 25.6448 0.0308 18.1990 1.1718 0.0780 0.3174 0.1410
CRS 0.6970 37 2.5706 0.0437 1.4349 0.6856 0.0774 0.1809 0.3572 509 0.00 0.44 0.44
VRS 0.6976 93 2.5516 0.0438 1.4462 0.6925 0.0763 0.1713 0.3696
CRS 0.3639 128 14.2618 0.0000 0.0000 2.1138 0.0513 0.7184 0.4439 509 0.11 0.22 0.11
VRS 0.8303 68 14.2618 0.0000 0.0000 2.0840 0.1107 0.4797 0.2111
CRS 0.3667 123 0.0000 0.0000 6.4364 0.0000 0.1400 0.0000 0.3600 509 19.85 20.32 0.47
VRS 1.0000 1 0.0120 0.0000 6.4302 0.0000 0.5000 0.0000 0.0000
CRS 0.3067 148 0.0000 0.0000 8.8500 1.0992 0.0135 0.0047 0.4591 515 0.36 0.59 0.23
VRS 0.6733 108 0.0000 0.0000 8.8500 0.0000 0.1683 0.2633 0.3267
CRS 1.0000 1 0.0000 0.0094 2.4612 0.0000 0.1022 0.0933 0.5911 515 0.91 1.27 0.36
VRS 1.0000 1 0.3606 0.0148 2.1506 0.0000 0.0000 0.3710 1.0000
CRS 0.3642 127 7.3916 0.0000 2.2118 1.0025 0.0377 0.4318 0.3966 515 3.99 4.23 0.24
VRS 0.6767 107 0.0000 0.0000 8.6341 0.0000 0.1683 0.2633 0.3267
CRS 0.4679 86 2.3905 0.0000 2.3796 0.0000 0.1188 0.2167 0.2625 515 4.75 5.20 0.45
VRS 0.6532 114 0.0000 0.0000 4.0227 0.0000 0.1517 0.1396 0.1967

SAFETY EVALUATION TESTBEDS -- AN ASSESSMENT OF SAFETY PROJECT PRIORITIZATION IN THE WSDOT I2 PROGRAM
Pennsylvania Transportation Institute, University Park, PA 16802 A-21
Table A-2- 11 Comparison Between DEA Variable-Return-to-Scale Results and Constant-Return-to-Scale Results, Part-XI Outputs Weights Inputs Weights
SR Begin
Milepost End
Milepost Length
Return to
Scale
ACC Occurrence
Rankings Societal
Costs Severity
Index Total
Accidents
Average Daily
Traffic
Total No. of Lanes
Total No. of Horizontal
Curves
No. of Interchanges / Intersections
CRS 0.2675 160 0.8467 0.0000 4.8468 0.0000 0.0876 0.0000 0.2165 516 1.79 2.14 0.34
VRS 0.5308 174 0.0000 0.0000 5.4462 0.0000 0.2269 0.0107 0.0272
CRS 0.5839 51 5.9262 0.0000 0.0000 0.0000 0.0972 0.5219 0.6112 516 10.53 10.80 0.27
VRS 0.7482 80 5.9262 0.0000 0.0000 0.5546 0.1163 0.3993 0.2775
CRS 0.3696 121 0.0000 0.0000 6.9412 0.0000 0.0894 0.0000 0.6423 516 11.99 12.19 0.20
VRS 0.7100 88 0.0000 0.0000 6.9412 0.0000 0.1683 0.2633 0.3267
CRS 0.4183 94 11.9909 0.0061 0.0000 5.2259 0.0000 0.0966 0.2613 518 0.00 0.21 0.21
VRS 0.6227 129 11.4734 0.0000 1.1953 2.2653 0.0715 0.3093 0.1263
CRS 1.0000 1 0.0000 0.1316 0.0000 19.8281 0.0295 3.5902 0.0000 518 0.05 0.11 0.06
VRS 1.0000 1 0.0000 0.1316 0.0000 22.4793 0.0000 3.9365 0.0000
CRS 0.2918 154 4.3380 0.2394 0.0000 0.0000 0.1294 0.8904 0.1607 519 0.34 0.51 0.17
VRS 0.5521 164 5.1716 0.0000 2.5702 1.2540 0.0633 0.2632 0.1203
CRS 0.2642 163 12.2068 0.0000 0.0000 2.0384 0.0197 0.1781 0.2375 520 0.00 0.22 0.22
VRS 0.5174 182 9.5350 0.0000 3.5219 1.3386 0.0671 0.2750 0.1244
CRS 0.3776 117 0.0000 0.0000 6.8077 1.0227 0.0152 0.0000 0.4341 520 0.01 0.21 0.20
VRS 0.5780 150 0.0000 0.0000 6.8077 0.0000 0.1608 0.1481 0.2086
CRS 0.3895 107 12.0935 0.0000 0.0000 5.0763 0.0000 0.0617 0.2304 520 0.06 0.17 0.11
VRS 0.6011 137 12.0935 0.0000 0.0000 2.1677 0.0686 0.3019 0.1213
CRS 0.1528 214 0.0000 0.0000 27.2308 1.6845 0.0207 0.0072 0.7035 520 0.14 0.28 0.14
VRS 0.5525 163 56.6583 0.0343 3.5390 1.2819 0.0853 0.3472 0.1542
CRS 0.1551 212 0.0000 0.0000 27.2308 1.7124 0.0209 0.0073 0.7143 520 0.20 0.40 0.20
VRS 0.5590 160 46.6592 0.0875 6.1143 1.2969 0.0863 0.3513 0.1561
CRS 0.4321 92 0.7099 0.0000 7.1075 1.3158 0.0200 0.0000 0.5478 520 0.23 0.46 0.23
VRS 0.5362 170 0.0000 0.0000 7.6956 0.0695 0.2360 0.0000 0.0363
CRS 0.4961 76 13.7860 0.0000 0.0000 7.0786 0.0626 0.0000 0.3039 522 0.00 0.31 0.31
VRS 1.0000 1 8.1001 0.1323 1.0231 0.0000 0.5000 0.0000 0.0000

SAFETY EVALUATION TESTBEDS -- AN ASSESSMENT OF SAFETY PROJECT PRIORITIZATION IN THE WSDOT I2 PROGRAM
Pennsylvania Transportation Institute, University Park, PA 16802 A-22
Table A-2- 12 Comparison Between DEA Variable-Return-to-Scale Results and Constant-Return-to-Scale Results, Part-XII Outputs Weights Inputs Weights
SR Begin
Milepost End
Milepost Length
Return to
Scale
ACC Occurrence
Rankings Societal Costs
Severity Index
Total Accidents
Average Daily Traffic
Total No. of Lanes
Total No. of Horizontal
Curves
No. of Interchanges /
Intersections
CRS 0.7230 34 0.0000 0.0000 3.3084 0.0000 0.0676 0.0000 0.6622 522 4.09 4.51 0.42
VRS 0.7255 84 0.0000 0.0000 3.3084 0.0000 0.0719 0.0000 0.6405
CRS 1.0000 1 0.8346 0.0000 0.2260 0.0000 0.0953 0.0000 0.1428 522 6.61 7.68 1.07
VRS 1.0000 1 1.0000 0.0000 0.0000 0.0018 0.0003 0.0007 0.3317
CRS 0.4121 97 0.0000 0.4673 3.7800 0.0000 0.3169 2.3849 0.3662 522 16.50 16.60 0.10
VRS 1.0000 1 0.2563 0.6516 0.1710 0.0000 0.3882 0.2237 0.2237
CRS 0.4728 85 11.3331 0.0000 0.0000 1.9045 0.0777 0.8082 0.4569 522 16.60 16.80 0.20
VRS 1.0000 1 11.3331 0.0000 0.0000 1.8302 0.1628 0.6976 0.3018
CRS 0.0904 240 0.0000 0.0000 11.0625 0.0000 0.2136 0.0000 0.0291 523 0.49 0.56 0.07
VRS 0.5000 192 10.6211 0.1481 4.5793 0.0000 0.2500 0.0000 0.0000
CRS 0.1957 191 8.4842 0.0000 0.0000 0.0000 0.2500 0.0831 0.0000 523 0.86 1.13 0.27
VRS 0.5000 192 0.2235 0.0227 6.6640 0.0000 0.2500 0.0000 0.0000
CRS 0.5260 63 0.0000 0.0000 3.5050 0.0000 0.1094 0.0000 0.2813 524 4.06 4.48 0.42
VRS 0.6298 121 0.0000 0.0000 3.5050 0.0000 0.1826 0.0584 0.1056
CRS 0.5662 56 2.4265 0.0000 0.3043 0.0000 0.2500 0.0000 0.0000 524 4.49 5.24 0.75
VRS 0.7207 85 0.0000 0.0000 1.8437 0.0000 0.2201 0.0021 0.0235
CRS 0.3368 140 1.2765 0.0483 3.0430 0.0000 0.0948 0.0000 0.2070 524 5.57 5.96 0.39
VRS 0.5599 159 0.0000 0.0054 4.3183 0.0607 0.2197 0.0017 0.0305
CRS 0.4545 89 3.0037 0.1038 4.8309 0.0000 0.2674 0.0000 0.4652 524 6.69 6.81 0.12
VRS 1.0000 1 0.1469 0.0548 9.4936 0.0000 0.5000 0.0000 0.0000
CRS 0.2519 167 8.8810 0.0000 8.8404 0.0000 0.2375 0.4333 0.5249 524 7.43 7.61 0.18
VRS 1.0000 1 15.8601 0.0936 3.5482 0.0000 0.3895 0.2210 0.2210
CRS 0.3646 126 0.0000 0.0000 10.1143 0.0000 0.2187 0.0000 0.5625 524 9.44 9.68 0.24
VRS 1.0000 1 0.2670 0.0040 9.9853 0.0000 0.3951 0.2097 0.2097

SAFETY EVALUATION TESTBEDS -- AN ASSESSMENT OF SAFETY PROJECT PRIORITIZATION IN THE WSDOT I2 PROGRAM
Pennsylvania Transportation Institute, University Park, PA 16802 A-23
Table A-2- 13 Comparison Between DEA Variable-Return-to-Scale Results and Constant-Return-to-Scale Results, Part-XIII Outputs Weights Inputs Weights
SR Begin
Milepost End
Milepost Length
Return to
Scale
ACC Occurrence
Rankings Societal Costs
Severity Index
Total Accidents
Average Daily
Traffic
Total No. of Lanes
Total No. of Horizontal
Curves
No. of Interchanges / Intersections
CRS 0.8846 18 0.0000 0.2000 0.0000 9.3602 0.2321 2.4386 0.0000 524 0.00B 0.08 0.20
VRS 1.0000 1 0.0000 0.2000 0.0000 7.7317 0.2787 0.9829 0.0000
CRS 0.7240 33 0.0000 0.0699 0.0000 2.6784 0.0664 0.6978 0.0000 525 0.00 0.52 0.52
VRS 0.7496 79 10.3932 0.0149 0.0000 8.4696 0.0440 0.5422 0.0000
CRS 0.3635 129 0.0000 0.1058 10.2313 6.1542 0.0000 0.2909 0.3967 525 0.15 0.30 0.15
VRS 0.6975 94 0.0000 0.0000 27.2308 6.6740 0.0832 0.3166 0.0949
CRS 1.0000 1 2.5116 0.0000 0.2359 0.0000 0.1539 0.6395 0.2691 525 3.43 4.27 0.84
VRS 1.0000 1 2.7799 0.0000 0.0140 0.0000 0.1850 0.5937 0.2225
CRS 0.2520 166 0.0000 0.0000 15.3913 1.5430 0.0230 0.0000 0.6549 525 8.08 8.28 0.20
VRS 0.5021 190 0.0000 0.0000 15.3913 0.2114 0.2332 0.0000 0.0327
CRS 1.0000 1 0.3519 0.0000 8.5429 0.0000 0.2500 0.6397 7.0464 526 0.08 0.17 0.09
VRS 1.0000 1 0.3686 0.0000 8.5280 1.2333 0.1743 0.0000 904237.2269
CRS 0.4039 101 0.0000 0.3226 0.0000 0.0000 0.2020 1.6580 0.1922 526 0.12 0.25 0.13
VRS 0.9048 62 41.8346 0.0000 0.0000 2.0539 0.1275 0.5916 0.2952
CRS 0.0916 239 2.4220 0.0000 23.7097 0.9371 0.0135 0.0012 0.3881 526 0.32 0.40 0.08
VRS 0.5000 192 1.5441 0.0254 23.9599 0.0000 0.2500 0.0000 0.0000
CRS 0.4058 100 0.0000 0.0000 6.3214 0.0000 0.1241 0.0000 0.5037 526 4.35 4.52 0.17
VRS 0.5908 147 0.0000 0.0000 6.3214 0.0000 0.1608 0.1481 0.2086
CRS 0.3392 138 9.7063 0.0405 0.0000 1.8911 0.1473 0.0000 0.1753 527 1.52 1.66 0.14
VRS 1.0000 1 1.6392 0.0108 12.7430 0.0000 0.5000 0.0000 0.0000
CRS 0.5336 62 0.0000 0.0241 2.0103 0.0000 0.0745 0.0000 0.1755 527 2.24 2.84 0.60
VRS 0.6804 104 0.0000 0.0028 2.2264 0.0592 0.2144 0.0017 0.0298
CRS 0.5052 71 0.0000 0.0000 3.6495 0.0000 0.1094 0.0000 0.2812 527 3.64 3.99 0.35
VRS 0.6802 105 0.0000 0.0000 3.6495 0.0000 0.1517 0.1396 0.1967
CRS 0.4017 102 7.5878 0.0000 1.1061 0.0000 0.0963 0.4754 0.6148 527 5.50 5.60 0.10
VRS 0.6933 95 0.0000 0.0000 7.6957 0.0000 0.1683 0.2633 0.3267

SAFETY EVALUATION TESTBEDS -- AN ASSESSMENT OF SAFETY PROJECT PRIORITIZATION IN THE WSDOT I2 PROGRAM
Pennsylvania Transportation Institute, University Park, PA 16802 A-24
Table A-2- 14 Comparison Between DEA Variable-Return-to-Scale Results and Constant-Return-to-Scale Results, Part-XIV Outputs Weights Inputs Weights
SR Begin
Milepost End
Milepost Length
Return to Scale
ACC Occurrence
Rankings Societal Costs
Severity Index
Total Accidents
Average Daily
Traffic
Total No. of Lanes
Total No. of Horizontal
Curves
No. of Interchanges / Intersections
CRS 0.4858 80 0.0000 0.0559 4.6634 0.0000 0.1573 0.0000 0.3707 527 6.54 6.71 0.17
VRS 0.6261 123 0.0000 0.0000 5.2836 0.0000 0.1757 0.0541 0.1902
CRS 0.2551 165 0.0000 0.1008 8.4101 0.0000 0.1490 0.0000 0.3510 527 8.79 8.94 0.15
VRS 1.0000 1 0.3462 0.0492 8.8568 0.0000 0.5000 0.0000 0.0000
CRS 0.3783 116 0.0000 0.0000 4.7838 0.7200 0.0107 0.0000 0.3056 527 10.31 10.55 0.24
VRS 0.4781 207 0.0000 0.0000 4.7838 0.2770 0.0893 0.1184 0.1530
CRS 0.5514 58 3.6657 0.0000 0.0000 0.0000 0.1683 0.3424 0.1089 528 0.01 0.50 0.49
VRS 0.6512 115 3.6657 0.0000 0.0000 0.4071 0.1547 0.1522 0.0576
CRS 1.0000 1 0.3689 0.1023 0.0000 0.0000 0.5000 2.4581 0.0000 529 0.19 0.67 0.48
VRS 1.0000 1 0.0000 0.1111 0.0000 0.0000 0.5000 8.1539 0.0000
CRS 0.3183 145 0.0000 0.2557 2.0681 0.0000 0.1339 1.0079 0.1548 529 0.73 1.03 0.30
VRS 0.5424 168 0.0000 0.0000 6.6792 1.3922 0.0665 0.2541 0.1204
CRS 0.2215 179 0.0000 0.0000 9.0769 0.8143 0.0100 0.0035 0.3401 529 6.63 6.69 0.06
VRS 0.5135 185 0.0000 0.0000 9.0769 1.3067 0.0565 0.2709 0.1623
CRS 1.0000 1 0.0000 0.0578 0.0000 59.2212 0.0000 0.0000 0.0000 531 1.41 1.56 0.15
VRS 1.0000 1 0.6551 0.0548 0.0000 0.3314 0.0106 0.0146 0.9587
CRS 0.5743 52 5.5825 0.0000 0.0000 2.0874 0.1044 0.0000 0.1642 536 4.49 4.92 0.43
VRS 1.0000 1 0.0288 0.0000 6.0719 0.1573 0.4261 0.0000 0.0565
CRS 0.3612 130 3.3483 0.0000 8.4537 0.9981 0.1042 0.0000 0.6068 536 5.13 5.34 0.21
VRS 1.0000 1 0.6935 0.0011 11.1016 0.0000 0.5000 0.0000 0.0000
CRS 1.0000 1 3.3979 0.0000 0.0675 0.0000 0.1375 0.7308 0.4498 538 0.27 0.69 0.42
VRS 1.0000 1 3.4606 0.0000 0.0000 0.2845 0.1254 0.4059 0.3714
CRS 0.3877 108 0.0000 0.0000 7.6957 1.2084 0.0148 0.0051 0.5047 538 1.21 1.31 0.10
VRS 0.6933 95 0.0000 0.0000 7.6957 0.0000 0.1683 0.2633 0.3267

SAFETY EVALUATION TESTBEDS -- AN ASSESSMENT OF SAFETY PROJECT PRIORITIZATION IN THE WSDOT I2 PROGRAM
Pennsylvania Transportation Institute, University Park, PA 16802 A-25
Table A-2- 15 Comparison Between DEA Variable-Return-to-Scale Results and Constant-Return-to-Scale Results, Part-XV Outputs Weights Inputs Weights
SR Begin
Milepost End
Milepost Length
Return to Scale
ACC Occurrence
Rankings Societal Costs
Severity Index
Total Accidents
Average Daily Traffic
Total No. of Lanes
Total No. of Horizontal
Curves
No. of Interchanges / Intersections
CRS 1.0000 1 6.1656 0.0303 0.0000 0.0000 0.4207 0.1585 3.9726 538 2.18 2.39 0.21
VRS 1.0000 1 6.9211 0.0000 0.0000 1.9833 0.3695 0.0192 11057881.1419
CRS 0.6967 38 0.0000 0.0000 1.6938 0.0000 0.0700 0.0000 0.1800 539 0.02 0.75 0.73
VRS 0.7791 75 0.0000 0.0000 1.6938 0.0000 0.1584 0.0506 0.0916
CRS 0.9106 17 1.5646 0.0000 42.8525 13.4805 0.2732 0.0000 7.8197 547 7.30 7.40 0.10
VRS 1.0000 1 0.8013 0.0011 43.2146 0.0000 0.3390 0.3219 0.3219
CRS 0.2207 181 0.0000 0.0000 19.6666 3.0407 0.0000 0.0159 0.6661 599 0.00 0.20 0.20
VRS 0.5736 152 0.0000 0.0000 19.6667 1.7713 0.0846 0.3233 0.1532
CRS 0.2306 175 10.2066 0.0000 0.0000 1.4878 0.0144 0.1300 0.1733 900 9.75 9.86 0.11
VRS 0.4254 218 7.8622 0.0000 2.9040 1.0576 0.0530 0.2173 0.0983
CRS 0.1578 210 0.0000 0.0000 20.8235 9.8993 0.0000 0.0000 0.0000 900 9.99 10.15 0.16
VRS 1.0000 1 9.2190 0.0000 18.6695 0.0000 0.5000 0.0000 0.0000
CRS 0.2420 172 9.7710 0.0000 0.0000 1.5392 0.0770 0.0000 0.1211 900 10.78 11.01 0.23
VRS 0.5000 192 0.5509 0.0007 10.7652 0.0000 0.2500 0.0000 0.0000
CRS 0.2109 188 0.0000 0.0000 9.0769 0.7751 0.0095 0.0033 0.3237 900 10.99 11.12 0.13
VRS 0.5060 186 0.0000 0.0000 9.0769 0.0000 0.1517 0.1396 0.1967
CRS 0.4855 81 0.0000 0.0000 5.2836 0.0000 0.1294 0.0000 0.4825 900 11.14 11.32 0.18
VRS 0.6261 123 0.0000 0.0000 5.2836 0.0000 0.1757 0.0541 0.1902
CRS 0.3948 105 11.0066 0.0459 0.0000 2.4961 0.1944 0.0000 0.2313 900 16.11 16.28 0.17
VRS 1.0000 1 0.0630 0.0319 16.5353 0.0000 0.5000 0.0000 0.0000
CRS 0.2196 182 0.0000 0.0978 5.3785 0.0000 0.1175 0.0000 0.1766 900 21.33 21.48 0.15
VRS 0.5024 189 0.0000 0.0000 8.4286 0.1943 0.2133 0.0077 0.0320
CRS 0.4219 93 0.0000 0.0000 4.3704 0.0000 0.1094 0.0000 0.2813 908 3.83 4.19 0.36
VRS 0.6321 120 0.0000 0.0000 4.3704 0.0000 0.1517 0.1396 0.1967
CRS 0.5136 67 5.2950 0.0880 0.0000 0.0000 0.5000 0.0000 0.0000 908 6.49 6.66 0.17
VRS 1.0000 1 6.0499 0.0749 0.0469 0.0000 0.5000 0.0000 0.0000

SAFETY EVALUATION TESTBEDS -- AN ASSESSMENT OF SAFETY PROJECT PRIORITIZATION IN THE WSDOT I2 PROGRAM
Pennsylvania Transportation Institute, University Park, PA 16802 A-26
THIS PAGE INTENTIONALL LEFT BLANK

SAFETY EVALUATION TESTBEDS -- AN ASSESSMENT OF SAFETY PROJECT PRIORITIZATION IN THE WSDOT I2 PROGRAM
Pennsylvania Transportation Institute, University Park, PA 16802 A-27
Table A-3- 1 Predictions of Hierarchical Bayesian Analysis for Overall Accidents, Part-I Prediction from Hierarchical Bayesian
Analysis
Route Beginning
Milepost
Ending
Milepost Length
Actual
Overall
Accidents 50%
Credible
Interval
75%
Credible
Interval
97.5%
Credible
Interval
Mean of
Predictions
2 0.00 0.37 0.37 46 41 45 51 41
2 0.08 0.16 0.08 16 19 22 26 19
2 0.13 0.26 0.13 12 11 13 15 11
2 13.75 13.91 0.16 37 41 45 50 41
2 14.50 15.11 0.61 181 177 185 197 177
5 0.00 0.12 0.12 25 19 22 25 20
5 0.10 0.21 0.11 13 13 14 18 13
5 0.11 0.23 0.12 35 29 32 37 29
5 0.15 0.30 0.15 6 8 9 11 8
5 0.18 0.36 0.18 12 13 15 18 13
5 0.19 0.38 0.19 32 30 34 39 31
5 0.20 0.41 0.21 12 13 16 19 14
9 1.47 1.70 0.23 43 45 50 56 46
9 10.87 10.97 0.1 24 27 31 36 28
9 13.93 14.13 0.2 36 39 43 49 39
9 15.75 15.96 0.21 35 36 39 45 36
9 53.16 53.36 0.2 13 16 18 22 16
9 77.87 77.97 0.1 7 8 9 12 8
11 10.78 10.84 0.06 8 8 9 11 8
18 0.00 0.33 0.33 13 11 13 15 11
18 0.09 0.18 0.09 9 8 10 12 8
18 0.13 0.26 0.13 16 15 17 21 15
18 0.14 0.28 0.14 10 9 11 13 9
18 0.17 0.34 0.17 11 10 12 14 10
18 0.20 0.40 0.2 6 7 9 11 7
18 14.55 14.76 0.21 26 32 35 41 32
18 2.61B 0.16 0.28 46 44 48 54 44
20 26.59 26.83 0.24 10 16 18 22 16
20 31.25 31.70 0.45 97 93 99 109 93
20 53.24 53.34 0.1 10 11 13 16 12

SAFETY EVALUATION TESTBEDS -- AN ASSESSMENT OF SAFETY PROJECT PRIORITIZATION IN THE WSDOT I2 PROGRAM
Pennsylvania Transportation Institute, University Park, PA 16802 A-28
Table A-3- 2 Predictions of Hierarchical Bayesian Analysis for Overall Accidents, Part-II Prediction from Hierarchical Bayesian
Analysis
Route Beginning
Milepost
Ending
Milepost Length
Actual
Overall
Accidents 50%
Credible
Interval
75%
Credible
Interval
97.5%
Credible
Interval
Mean of
Predictions
20 58.67 58.96 0.29 17 23 27 31 24
20 59.39 59.70 0.31 50 50 54 61 50
20 59.73 59.94 0.21 40 40 44 50 40
96 1.09 1.26 0.17 42 42 46 52 42
96 1.35 1.51 0.16 37 38 42 48 39
96 2.18 2.51 0.33 65 64 69 78 65
99 0.09 0.19 0.1 9 9 10 13 9
99 8.05 8.27 0.22 54 50 55 62 51
99 8.87 10.26 1.39 354 352 364 384 352
99 10.29 10.79 0.5 116 110 117 127 110
99 10.86 10.97 0.11 26 25 29 33 26
99 11.18 11.48 0.3 49 48 53 60 49
99 11.62 12.02 0.4 73 69 74 83 70
99 12.90 13.21 0.31 106 100 106 115 100
99 13.65 13.80 0.15 56 55 60 67 55
99 13.99 14.39 0.4 54 56 61 68 57
99 15.26 15.58 0.32 113 105 111 122 105
99 16.40 16.78 0.38 63 63 68 76 63
99 17.43 17.75 0.32 54 54 58 66 54
99 18.26 18.45 0.19 34 34 37 43 34
99 19.06 19.15 0.09 26 27 30 35 27
99 19.37 19.51 0.14 27 28 31 36 28
99 19.42 19.49 0.07 52 45 49 55 45
99 20.06 20.29 0.23 72 70 76 84 71
99 22.85 23.02 0.18 27 28 31 35 28
99 37.18 37.80 0.62 113 115 122 133 115
99 38.97 39.22 0.25 55 55 59 67 55
99 39.26 39.51 0.25 53 53 58 66 53
99 39.58 40.18 0.6 125 124 131 142 124
99 40.21 40.59 0.38 115 109 115 126 109
99 40.66 41.10 0.44 117 115 122 132 115
99 41.17 41.45 0.28 62 63 68 76 64
99 41.71 42.11 0.4 88 89 95 104 89
99 43.39 43.57 0.17 55 50 55 62 51
99 45.35 45.84 0.49 95 95 102 112 96
99 45.86 46.19 0.33 62 63 69 77 63
99 46.39 46.66 0.27 57 58 63 70 59
99 46.75 47.05 0.3 84 84 90 99 84
99 48.67 49.17 0.5 115 114 121 132 114
99 49.91 50.66 0.75 131 134 142 154 134
99 50.75 51.40 0.65 107 109 116 126 109
99 51.98 52.48 0.5 128 126 133 144 126
99 52.66 52.95 0.29 55 55 59 67 55
99 53.59 53.89 0.3 59 54 58 65 54
99 54.30 54.78 0.48 129 123 130 141 123
99 54.80 54.89 0.09 42 41 45 51 41
99 55.00 55.20 0.2 49 47 52 58 47
104 24.65 24.74 0.09 10 11 13 16 11
104 26.43 26.52 0.09 29 30 33 38 30
164 0.31 1.07 0.76 162 157 166 178 158
164 1.09 1.34 0.25 64 63 68 76 63
164 1.78 2.14 0.36 68 68 73 81 68
164 2.24 2.41 0.17 36 38 42 48 38
167 0.00 0.16 0.16 28 28 31 36 28

SAFETY EVALUATION TESTBEDS -- AN ASSESSMENT OF SAFETY PROJECT PRIORITIZATION IN THE WSDOT I2 PROGRAM
Pennsylvania Transportation Institute, University Park, PA 16802 A-29
Table A-3- 3 Predictions of Hierarchical Bayesian Analysis for Overall Accidents, Part-III Prediction from Hierarchical Bayesian
Analysis
Route Beginning
Milepost
Ending
Milepost Length
Actual
Overall
Accidents 50%
Credible
Interval
75%
Credible
Interval
97.5%
Credible
Interval
Mean of
Predictions
167 0.09 0.19 0.1 11 12 14 17 13
167 0.14 0.28 0.14 15 15 17 21 15
167 0.15 0.31 0.16 11 14 16 20 14
167 0.16 0.33 0.17 20 22 25 30 23
167 0.19 0.36 0.17 22 20 23 27 20
167 25.70 26.67 0.97 202 201 211 225 202
167 26.84 27.28 0.44 110 109 116 125 109
169 11.35 11.53 0.18 37 37 41 47 38
181 5.32 5.62 0.3 87 84 90 98 84
181 5.83 5.98 0.15 48 47 51 58 47
181 7.62 7.80 0.18 48 49 54 60 49
181 9.68 9.84 0.16 45 45 49 56 45
202 0.13 0.34 0.21 65 59 65 72 60
202 2.66 2.73 0.07 19 21 24 28 21
202 6.76 7.06 0.3 57 58 63 71 59
202 7.17 7.26 0.09 20 22 24 29 22
202 7.28 7.43 0.15 33 34 38 44 35
202 7.45 7.57 0.12 50 46 50 56 46
202 7.63 7.80 0.17 32 33 36 42 33
202 8.14 8.35 0.19 67 64 69 76 64
202 13.00 13.13 0.13 21 24 28 33 25
202 24.46 24.68 0.22 13 16 18 22 16
204 2.05 2.35 0.3 36 38 42 49 39
405 0.00 0.39 0.39 31 25 28 33 26
405 0.06 0.12 0.06 12 9 11 13 9
405 0.12 0.24 0.12 24 21 23 27 21
405 0.15 0.31 0.16 18 17 20 24 18
405 0.16 0.32 0.16 34 31 34 39 31
405 0.19 0.38 0.19 12 14 16 20 14
509 0.00 0.44 0.44 66 57 62 69 58
509 0.11 0.22 0.11 8 12 14 17 12
509 19.85 20.32 0.47 55 59 64 72 59
515 0.36 0.59 0.23 40 41 46 52 42
515 0.91 1.27 0.36 138 127 135 145 128
515 3.99 4.23 0.24 41 42 47 53 43
515 4.75 5.20 0.45 88 86 92 101 87
516 1.79 2.14 0.34 65 62 66 74 62

SAFETY EVALUATION TESTBEDS -- AN ASSESSMENT OF SAFETY PROJECT PRIORITIZATION IN THE WSDOT I2 PROGRAM
Pennsylvania Transportation Institute, University Park, PA 16802 A-30
Table A-3- 4 Predictions of Hierarchical Bayesian Analysis for Overall Accidents, Part-IV Prediction from Hierarchical Bayesian
Analysis
Route Beginning
Milepost
Ending
Milepost Length
Actual
Overall
Accidents 50%
Credible
Interval
75%
Credible
Interval
97.5%
Credible
Interval
Mean of
Predictions
516 10.53 10.80 0.27 43 44 49 55 45
516 11.99 12.19 0.2 51 51 55 62 51
518 0.00 0.21 0.21 20 18 20 24 18
518 0.05 0.11 0.06 17 11 12 15 11
519 0.34 0.51 0.17 60 56 60 67 56
520 0.00 0.22 0.22 22 23 25 30 23
520 0.01 0.21 0.2 52 49 53 60 49
520 0.06 0.17 0.11 14 13 15 19 14
520 0.14 0.28 0.14 13 13 15 18 13
520 0.20 0.40 0.2 13 13 16 19 14
520 0.23 0.46 0.23 46 40 43 50 40
522 0.00 0.31 0.31 10 13 15 18 13
522 4.09 4.51 0.42 107 104 111 121 104
522 6.61 7.68 1.07 259 258 269 285 258
522 16.50 16.60 0.1 28 30 33 39 30
522 16.60 16.80 0.2 30 33 36 42 33
523 0.49 0.56 0.07 32 35 39 45 35
523 0.86 1.13 0.27 51 53 58 66 54
524 4.06 4.48 0.42 101 98 105 115 98
524 4.49 5.24 0.75 192 190 199 213 190
524 5.57 5.96 0.39 81 79 84 93 79
524 6.69 6.81 0.12 32 33 37 43 34
524 7.43 7.61 0.18 23 28 31 36 28
524 9.44 9.68 0.24 35 39 43 49 39
524 0.00B 0.08 0.2 19 20 22 26 20
525 0.00 0.52 0.52 14 14 17 20 15
525 0.15 0.30 0.15 13 11 13 15 11
525 3.43 4.27 0.84 153 152 160 173 152
525 8.08 8.28 0.2 23 22 25 30 23
526 0.08 0.17 0.09 40 36 40 45 36
526 0.12 0.25 0.13 14 14 16 20 14
526 0.32 0.40 0.08 14 16 18 22 16
526 4.35 4.52 0.17 56 56 61 69 57
527 1.52 1.66 0.14 23 27 30 35 27
527 2.24 2.84 0.6 157 150 158 170 150
527 3.64 3.99 0.35 97 95 101 110 95
527 5.50 5.60 0.1 46 46 50 57 46
527 6.54 6.71 0.17 67 63 68 76 63
527 8.79 8.94 0.15 37 39 43 50 39
527 10.31 10.55 0.24 74 69 74 82 69
528 0.01 0.50 0.49 93 92 98 108 93
529 0.19 0.67 0.48 83 79 85 93 79
529 0.73 1.03 0.3 53 51 56 63 52
529 6.63 6.69 0.06 39 37 41 47 38
531 1.41 1.56 0.15 12 9 11 13 10
536 4.49 4.92 0.43 58 59 64 72 59
536 5.13 5.34 0.21 30 32 36 41 32
538 0.27 0.69 0.42 95 90 96 106 91
538 1.21 1.31 0.1 46 44 48 54 44
538 2.18 2.39 0.21 18 21 24 28 21
539 0.02 0.75 0.73 209 208 216 231 207
547 7.30 7.40 0.1 8 9 10 13 9
599 0.00 0.20 0.2 18 15 17 20 15
900 9.75 9.86 0.11 28 27 30 35 27
900 9.99 10.15 0.16 17 20 23 27 20

SAFETY EVALUATION TESTBEDS -- AN ASSESSMENT OF SAFETY PROJECT PRIORITIZATION IN THE WSDOT I2 PROGRAM
Pennsylvania Transportation Institute, University Park, PA 16802 A-31
Table A-3- 5 Predictions of Hierarchical Bayesian Analysis for Overall Accidents, Part-V Prediction from Hierarchical Bayesian
Analysis
Route Beginning
Milepost
Ending
Milepost Length
Actual
Overall
Accidents 50%
Credible
Interval
75%
Credible
Interval
97.5%
Credible
Interval
Mean of
Predictions
900 10.78 11.01 0.23 31 32 35 40 32
900 10.99 11.12 0.13 39 39 43 49 40
900 11.14 11.32 0.18 67 66 71 79 66
900 16.11 16.28 0.17 20 23 26 31 24
900 21.33 21.48 0.15 42 39 43 49 39
908 3.83 4.19 0.36 81 81 87 95 81
908 6.49 6.66 0.17 27 23 26 31 24
SAFETY EVALUATION TESTBEDS -- AN ASSESSMENT OF SAFETY PROJECT PRIORITIZATION IN THE WSDOT I2 PROGRAM
Pennsylvania Transportation Institute, University Park, PA 16802 A-32
APPENDIX B – ANALYTICAL TECHNIQUES

SAFETY EVALUATION TESTBEDS -- AN ASSESSMENT OF SAFETY PROJECT PRIORITIZATION IN THE WSDOT I2 PROGRAM
Pennsylvania Transportation Institute, University Park, PA 16802 A-33
Hierarchical Poisson Model
The hierarchical Poisson model follows a two-level structure illustrated by the following
example. Suppose there are “k” total roadway sections in Washington. Associated with
each section “i” is a Poisson parameter λi, i = 1, 2, …, n that determines the biennial
accident rate. We use biennial counts and an exposure variable of two years to determine
annual rates. Biennial rates are used for the purpose of biennial programming. The rates
λi, i = 1, 2, …, n, are called “individual parameters” and correspond to individual section
intensity rates.
The individual parameters may be predicted by section-level covariates through a link
function as a linear combination with regression coefficients β. The regression
coefficient β0 is a constant intercept. These regression parameters are known as
“structural parameters”, or “population parameters”. The analysis of the population
parameters is appropriate when groups, clusters, or correlated observations are present in
the data, and/or when over dispersion exists. Usually an additional parameter describes
the “overdispersion” effect prevalent in accident counts.
Individual Models
The level 1 model specifies the distributions of the observed data vector (z1, z2, …, zk)
given the individual parameters λi’s:.
zi|λI ~ Poisson(ei, λi), i = 1, 2, …, k

SAFETY EVALUATION TESTBEDS -- AN ASSESSMENT OF SAFETY PROJECT PRIORITIZATION IN THE WSDOT I2 PROGRAM
Pennsylvania Transportation Institute, University Park, PA 16802 A-34
where the parameter λi is the rate, and ei is called the exposure of the ith group (in this
case two years since we are computing average annual rates), and zi is the accident count
for the ith section.
Population Model
A popular population model is the Gamma distribution, conjugate to the Poisson. In this
model, the individual Poisson parameters λi follow a Gamma distribution
λi|ζ, µi ~ Gamma(ζ, ζ/µi), i = 1, 2, …, k
where ζ > 0 corresponds to an unobserved prior count, not necessarily an integer, and µi
is the mean of the Gamma distribution. When there are roadway characteristics
),...,,( 110 −= irii
T
i xxxx
available for prediction, the mean µi is usually modeled through the link equation
βµ T
ii x=log
which is usually referred to as the log-linear model. Using the gamma conjugate prior
and the likelihood function of the observed data, we can postulate a posterior that
accommodates overdispersion akin to a negative binomial model in the frequentist sense.
Comparisons of the predictions can then be made between the classical negative binomial
and Hierarchical Poisson with Gamma conjugate prior.

SAFETY EVALUATION TESTBEDS -- AN ASSESSMENT OF SAFETY PROJECT PRIORITIZATION IN THE WSDOT I2 PROGRAM
Pennsylvania Transportation Institute, University Park, PA 16802 A-35
Data envelopment analysis (DEA)
Data envelopment analysis is a fractional programming model that can include multiple
outputs and inputs without recourse to a priori weights (as in index number approaches)
and without requiring explicit specification of functional relations between inputs and
outputs (as in regression approaches). It computes a scalar measure of efficiency and
determines efficient levels of inputs and outputs for the organizations under evaluation.
Data envelopment analysis (DEA) was first introduced in the literature in 1978 (Charnes
et al. 1978).
Charnes, Cooper, and Rhodes (CCR) Version:
Following the concept of relative efficiency, Charnes, Cooper and Rhodes (1978)
developed the following model, which is often called CCR (abbreviated term of Charnes,
Cooper and Rhodes) version of DEA model:
Model 1: Maximize: h0 =
∑∑
=
=
m
i ii
s
r rr
xv
yu
1 0
1 0;
Subject to, 1
1
1 ≤∑∑
=
=
m
i iji
s
r rjr
xv
yu; j = 1, 2, 3, .........., n
ε>∑ =
m
i ii
r
xv
u
1 0
; r = 1, 2, 3, ........., s
ε>∑ =
m
i ii
i
xv
v
1 0
; i = 1, 2, 3, ........., m
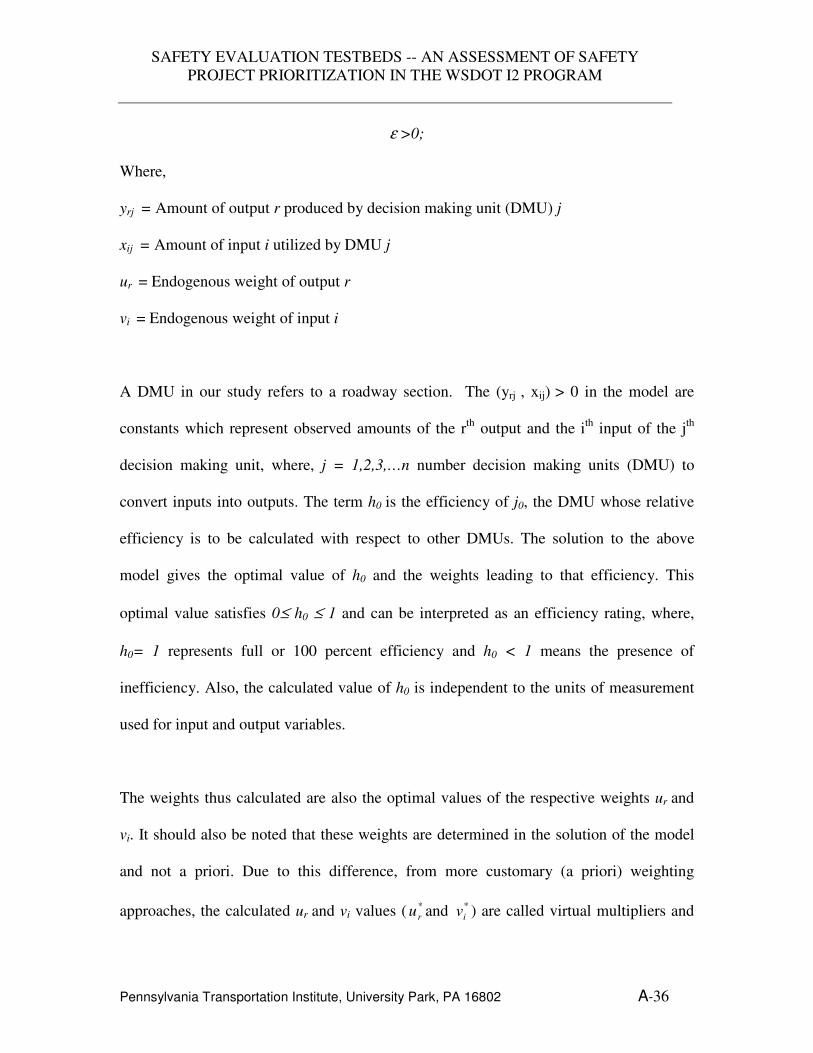
SAFETY EVALUATION TESTBEDS -- AN ASSESSMENT OF SAFETY PROJECT PRIORITIZATION IN THE WSDOT I2 PROGRAM
Pennsylvania Transportation Institute, University Park, PA 16802 A-36
ε >0;
Where,
yrj = Amount of output r produced by decision making unit (DMU) j
xij = Amount of input i utilized by DMU j
ur = Endogenous weight of output r
vi = Endogenous weight of input i
A DMU in our study refers to a roadway section. The (yrj , xij) > 0 in the model are
constants which represent observed amounts of the rth output and the ith input of the jth
decision making unit, where, j = 1,2,3,…n number decision making units (DMU) to
convert inputs into outputs. The term h0 is the efficiency of j0, the DMU whose relative
efficiency is to be calculated with respect to other DMUs. The solution to the above
model gives the optimal value of h0 and the weights leading to that efficiency. This
optimal value satisfies 0≤ h0 ≤ 1 and can be interpreted as an efficiency rating, where,
h0= 1 represents full or 100 percent efficiency and h0 < 1 means the presence of
inefficiency. Also, the calculated value of h0 is independent to the units of measurement
used for input and output variables.
The weights thus calculated are also the optimal values of the respective weights ur and
vi. It should also be noted that these weights are determined in the solution of the model
and not a priori. Due to this difference, from more customary (a priori) weighting
approaches, the calculated ur and vi values ( *
ru and *
iv ) are called virtual multipliers and

SAFETY EVALUATION TESTBEDS -- AN ASSESSMENT OF SAFETY PROJECT PRIORITIZATION IN THE WSDOT I2 PROGRAM
Pennsylvania Transportation Institute, University Park, PA 16802 A-37
interpreted in DEA so that they yield a virtual output, Y0 =Σ*
ru yr0 (summed over r = 1, 2,
3, …, s), and a virtual input X0 =Σ*
iv xi0 (summed over i = 1, 2, 3, …, m), which allows
to compute the efficiency ratio h0 = Y0 / X0.
The calculated value of h0 (which is *
0h ), is the highest rating that the data allow for a
DMU. No other choice of *
ru and *
iv can yield a higher value *
0h and satisfy the
constraints of model 1. These constraints make this a relative evaluation with:
1
1
1 =∑∑
=
=
m
i iji
s
r rjr
xv
yu, for some j as a condition of optimality.
For each of the j = 1, 2, 3, ...., n number of DMUs similar efficiency evaluations can be
obtained by positioning them in the functional form as DMU0, one by one, while also
subjecting them in the constraints. An important point is that DEA calculates relative
efficiency of any DMU with respect to other DMUs in the set by the above optimization
applied to the data. Therefore, the optimization implies that for any DMU0 being
evaluated, the evaluation will be effected by reference to the subset of j = 1, 2, 3, ..., n
DMUs for which:
1
1
*
1
*
=∑∑
=
=
m
i iki
s
r rkr
xv
yu, kε K ...(3)
The stars (*) indicate that these values of ur and vi are optimal; and therefore, make h0
maximal for DMU0. Also, kε K indicates the subset of DMUs that have attained the value

SAFETY EVALUATION TESTBEDS -- AN ASSESSMENT OF SAFETY PROJECT PRIORITIZATION IN THE WSDOT I2 PROGRAM
Pennsylvania Transportation Institute, University Park, PA 16802 A-38
of unity, which is the maximum value allowed by the constraints. These kε K DMUs have
attained the efficiency value of unity (efficient DMUs) with the same *
ru and *
iv that are
the best for DMU0 (Bowlin, 1998).
The model described above is a fractional linear program. To solve the model it is
necessary to convert-it into linear form so that the methods of linear programming can be
applied. In the objective function it can be observed that while maximizing a fraction or
ratio it is the relative magnitudes of the numerator and denominator that are of interest
rather than their individual values. It is thus possible to achieve the same effect by setting
the denominator equal to a constant and maximizing the numerator. The resulting linear
programming (LP) model is shown below (model 2):
Model 2: Maximize, ∑=
=s
r
rr yuh1
00
Subject to, ∑=
m
i
ii xv1
0 = 1
∑=
s
r
rjr yu1
- ∑=
m
i
iji xv1
≤ 0,
vi , ur ≥ ε >0, r∀ , i
The solution to this LP provides a measure of the relative efficiency of the target unit and
the weights leading to that efficiency. These weights are the most favorable ones from the
point of view of the target unit. To obtain the efficiencies of the entire set of units it is
necessary to solve a linear program focusing on each unit in turn. Clearly as the objective

SAFETY EVALUATION TESTBEDS -- AN ASSESSMENT OF SAFETY PROJECT PRIORITIZATION IN THE WSDOT I2 PROGRAM
Pennsylvania Transportation Institute, University Park, PA 16802 A-39
function is varying from problem to problem the weights obtained for each target unit
may be different. In solving each linear program the solution technique will attempt to
make the efficiency of the target unit as large as possible. This search procedure will
terminate when either the efficiency of the target unit or the efficiency of one or more
other units hits the upper limit of 1. Thus for an inefficient unit at least one other unit will
be efficient with the target unit's set of weights. These efficient units are known as the
peer group for the inefficient unit. It is sometimes useful to scale the data on the peer
units so that a better comparison of the inefficient unit with the peer units can be made.
Input data of the peer units are to be scaled in such a way so that each peer unit may use
no more of an input than the inefficient unit. The solution to the DEA model thus
provides a relative efficiency measure for each unit in the set, a subset of peer units for
each inefficient unit, and a set of targets for each inefficient unit.
The dual of the linear program, presented above in Model 2, provides useful information
and knowledge regarding the mechanism of efficiency estimation and significance of the
parameters. It also involves fewer constraints than the primal and hence generally
preferred to solve. The dual is shown below in Model 3.
Model 3: o
Min θλθ ,
Subject to, ∑+−j
jrjro yy λ ≥ 0, r =1, 2, ………,m
j
j
ijio xx λθ ∑− ≥ 0, i =1, 2, …………,k

SAFETY EVALUATION TESTBEDS -- AN ASSESSMENT OF SAFETY PROJECT PRIORITIZATION IN THE WSDOT I2 PROGRAM
Pennsylvania Transportation Institute, University Park, PA 16802 A-40
Here θ provides efficiency score of the o-th unit (Farrell 1957). Each of the constraint of
Model 3 is associated with either the inputs or the outputs. Using the principle of
complementary slackness, from the results of Model 2 and Model 3 the following sets of
identities can be obtained at optimum solution which imply that the values of the weight
factors ur and vi provide the shadow prices for the relevant output and input respectively.
The identities demonstrate that values of the weight factors provide the effect of marginal
change in constraint boundary on the value of DMU’s efficiency.
0=
+− ∑
j
jrjror yyu λ , r =1, 2, ……,m
0=
− ∑ j
j
ijioi xxv λθ , i =1, 2, ……,k
Banker, Charnes, and Cooper (BCC) Version:
Another version of DEA that is in common use is the Banker, Charnes, and Cooper
(1984) abbreviated as the BCC version of DEA. The primary difference between the
CCR and BCC versions is that the CCR version bases the evaluation on constant returns
to scale and the BCC version allows variable returns to scale.
The BCC version of DEA can be expressed as:
Model 4: Maximize, ∑=
=s
r
rr yuh1
00 - u0
SAFETY EVALUATION TESTBEDS -- AN ASSESSMENT OF SAFETY PROJECT PRIORITIZATION IN THE WSDOT I2 PROGRAM
Pennsylvania Transportation Institute, University Park, PA 16802 A-41
Subject to, ∑=
m
i
ii xv1
0 = 1
∑=
s
r
rjr yu1
- ∑=
m
i
iji xv1
- u0 ≤ 0,
vi , ur ≥ ε >0, r∀ , i
In this model, the optimal value of u0 (*
ru ), indicates the return to scale possibilities. An
*
ru < 0 implies local increasing returns to scale. If *
ru = 0, this implies local constant
returns to scale and an *
ru >0 implies local decreasing returns to scale.
As formulated here the BCC model allows variable returns to scale and measures only
technical efficiency for each DMU. This implies that for a DMU to be considered as CCR
efficient, it must be both scale and technically efficient. For a DMU to be considered
BCC efficient, it only needs to be technically efficient.