Safety Belt Use in Maine 2007 · Safety Belt Use in Maine, 2007 4 Prepared for the Bureau of...
31
Safety Belt Use in Maine 2007 November 2007 Survey Research Center
Transcript of Safety Belt Use in Maine 2007 · Safety Belt Use in Maine, 2007 4 Prepared for the Bureau of...

Safety Belt Use in Maine 2007
November 2007 Survey Research Center

Safety Belt Use in Maine 2007
Al Leighton and Jen Dodge
Survey Research Center, Muskie School of Public Service University of Southern Maine
November 30, 2007
Submitted to:
Bureau of Highway Safety
State of Maine 164 State House Station
Augusta, Maine 04333-0164

Safety Belt Use in Maine, 2007
Table of Contents
ACKNOWLEDGMENTS .................................................................................................................. 4
EXECUTIVE SUMMARY ................................................................................................................. 5
INTRODUCTION............................................................................................................................ 10
METHODOLOGY........................................................................................................................... 11
Road sections selected as observation sites............................................................... 12
Sampling .......................................................................................................................... 12
Weighting ......................................................................................................................... 12
Observation times and days .......................................................................................... 12
Observer training ............................................................................................................ 13
OBSERVATION STUDY FINDINGS ............................................................................................. 14
Overview: Compliance with the law .............................................................................. 14
Gender differences.......................................................................................................... 14
Seating position .............................................................................................................. 14
Urban/rural differences................................................................................................... 14
Type of vehicle ................................................................................................................ 14
Passenger use related to use by driver ........................................................................ 15
Comparison with other states........................................................................................ 15
Day of the week ............................................................................................................... 15
Time of day ...................................................................................................................... 15
Weather conditions ......................................................................................................... 15
Comparison of 2007 with 2005 and 2006 ...................................................................... 15
Summary ....................................................................................................................................... 16
2 Prepared for the Bureau of Highway Safety, Department of Public Safety, State of Maine; by Survey Research Center, Muskie School of Public Service, University of Southern Maine, Portland, Maine November, 2007

Safety Belt Use in Maine, 2007
End Notes...................................................................................................................................... 17
List of Tables ................................................................................................................................ 18
Tables 1-11 .................................................................................................................................... 19
History of Occupant Protection Laws ........................................................................................ 28
2006 Observation Form ............................................................................................................... 29
3 Prepared for the Bureau of Highway Safety, Department of Public Safety, State of Maine; by Survey Research Center, Muskie School of Public Service, University of Southern Maine, Portland, Maine November, 2007
Safety Belt Use in Maine, 2007
4 Prepared for the Bureau of Highway Safety, Department of Public Safety, State of Maine; by Survey Research Center, Muskie School of Public Service, University of Southern Maine, Portland, Maine November 2007
ACKNOWLEDGMENTS
We would like to thank several people who were helpful in conducting this study. Lauren Stewart, Director,
Bureau of Highway Safety worked with us on behalf of the Maine Bureau of Highway Safety. Gerry
Audibert and Ed Beckwith at the Maine Department of Transportation provided all of the traffic data and
location information for each of the observation sites. We especially want to express our appreciation for
all of the efforts of Bill Leaf and Katie Ledingham at the Preusser Research Group in Trumbull,
Connecticut. Their attention to detail regarding the data analysis and training of observers were crucial to
the success of the project.
Finally, we thank the tremendous contributions of the Survey Research Center observers: Margaret
Gormley, Tom Buchanan, Sharleen Garvey, Sandra Graham, Tim Hayes, Jan Johnson, Anita Linnell,
Cheryl Saliwanchik-Brown, and Sue Schier.
Al Leighton, Jen Dodge
Survey Research Center
Muskie School of Public Service
University of Southern Maine

Prepared for the Bureau of Highway Safety, Department of Public Safety, State of Maine; by Survey Research Center, Muskie School of Public Service, University of Southern Maine, Portland, Maine November, 2007
Safety Belt Use in Maine, 2007
5
EXECUTIVE SUMMARY
Since 1986, the Maine Bureau of Highway Safety has periodically had an observation study of safety belt
use in Maine conducted to determine the level of compliance in the state. For the year 2007, the Survey
Research Center (SRC) at the Muskie School of Public Service, University of Southern Maine, with
assistance from the Preusser Research Group of Trumbull, Connecticut, conducted the study and
produced this report of the findings. Research results from this study provide the official measure of belt
use in Maine, and provide valuable information regarding the success of the state’s efforts to educate the
public about the importance of safety belt use. Furthermore, increased seatbelt use can lead to additional
funding from the National Highway Traffic Safety Administration (NHTSA).
In 2007, in order to obtain an accurate measure of change in use rates over time, observations were
recorded at the same 120 sites as the previous two years. In the vast majority of cases (over 90%),
observations were conducted on the same day of the week and at the same time of day as in 2005 and
2006; frequently, the same observer went to the same site. A probability based sampling method was
utilized to select the 120 segments to be observed. Among the locations chosen were sites on I-95, I-295,
and the Maine Turnpike. As a result, all types of roads and traffic were observed. As in all prior studies,
visual observations were made to determine the extent of use.
In the past three years and again this year, the observations were done immediately after a major
campaign to raise awareness of Maine’s seatbelt laws. Radio ads about seatbelt use received heavy air
play in many parts of the state. In addition, many police departments conducted a coordinated and highly
visible enforcement campaign. While we speculated in the past that these steps might temporarily lead to
an increased use rate, at least during the time of the campaign and shortly after, a sub-sample test done
during the 2005 observation study found that effect to be relatively minor.
In 1998 NHTSA developed new methods and standardized guidelines for measuring seat belt use. As a
result, use rates can now be compared between states more accurately than was the case in the past.
This study meets all of the applicable NHTSA criteria. It also follows the NHTSA guidelines regarding
sample selection. Under these guidelines, sites selected must represent 85% of the state’s population; in
Maine, that requires sampling from the 10 counties with the highest population. See Table 11 for the list of
counties studied.
Road sections selected as observation sites. Observations of seatbelt use were conducted at 120 sites
from the 10 counties (see Table 11 for a full list of towns selected). Sites were selected following a
probability-based sampling procedure developed by the Preusser Research Group and approved by

Prepared for the Bureau of Highway Safety, Department of Public Safety, State of Maine; by Survey Research Center, Muskie School of Public Service, University of Southern Maine, Portland, Maine November, 2007
Safety Belt Use in Maine, 2007
6
NHTSA on July 26, 2004. Restraint use was recorded for 23,462 drivers and front seat passengers in
18,192 vehicles (in the 2006 study, 18,027 vehicles and 22,464 occupants were recorded).
Sampling and estimating protocols. In 1998, NHTSA began to institute new standardized sampling and
estimating protocols for all states to follow in their safety belt use studies. These procedures were
developed to ensure comparability among findings from state to state. The new estimation formulae are
intended to provide each state with very precise estimates of their statewide belt use rates. These
formulae provide a statistically sound method to calculate weights that will help adjust sample data to
better reflect the volume and types of traffic found in all roads in a state, not just those selected for
observation. Since 2004, Maine’s sampling procedures have been based primarily on traffic data known
as the Daily Vehicle Miles Traveled (DVMT) for each county in the State. These data provide a measure of
the volume of traffic at each road segment in Maine.
One of the results of adopting new estimation methods is that the findings since 2004 are not entirely
comparable to those from previous years. Different methods can produce different results, which is why
NHTSA has adopted the new standardized methods. We support the use of the new estimation approach
and NHTSA’s efforts to bring consistency and uniformity to all of the states but remind readers that,
because of these changes, results from this year’s study are not quite equivalent to those conducted prior
to 2004.
Subgroup analyses. This report includes findings from several subgroups, such as for different seating
positions, type of vehicle, etc. We urge readers to keep in mind that some of these groups have lower
numbers and, therefore, the point estimates of their use rates are less precise than those for the entire
sample.

Prepared for the Bureau of Highway Safety, Department of Public Safety, State of Maine; by Survey Research Center, Muskie School of Public Service, University of Southern Maine, Portland, Maine November, 2007
Safety Belt Use in Maine, 2007
7
OBSERVATION STUDY FINDINGS
Overview: Compliance with the law. The overall restraint use continued to increase in 2007, to 79.8%.
In 2002, the statewide use rate was only 59%. By 2006, that rate had increased to 77.2%. As in 2005 and
2006, passengers have a higher rate of safety belt use than the drivers. Table A shows changes in the
rates for drivers and passengers for all 3 years.
Table A
Comparison of seat belt usage rates statewide:
Occupants Observed 2007 Study
2006 Study
2005 Study
All Drivers 79.4% 76.7% 75.2%
All Front Passenger Seat Occupants 80.4% 79.7% 78.4%
Gender differences. Women in particular show substantial compliance with seatbelt laws. Table B shows
gender differences for 2007, 2006 and 2005.
Table B Comparison of seat belt usage rates by male and female:
Gender 2007 Study
2006 Study
2005 Study
Male Driver 75.5%
72.0% 71.5%
Female Driver 85.1%
83.6% 80.8%
Male Passenger 70.1%
67.2% 69.3%
Female Passenger 85.0%
86.6% 83.7%

Prepared for the Bureau of Highway Safety, Department of Public Safety, State of Maine; by Survey Research Center, Muskie School of Public Service, University of Southern Maine, Portland, Maine November, 2007
Safety Belt Use in Maine, 2007
8
Passengers’ use of safety belts related to use by driver. As with prior studies, belt use of passengers
is strongly correlated with the practices of the drivers. When drivers use their safety belts, other occupants
of the vehicle (who are most likely friends or family of the driver) are nearly three times as likely to use
their belts than they are when the driver is not using a belt (92.3% vs. 35.9%).
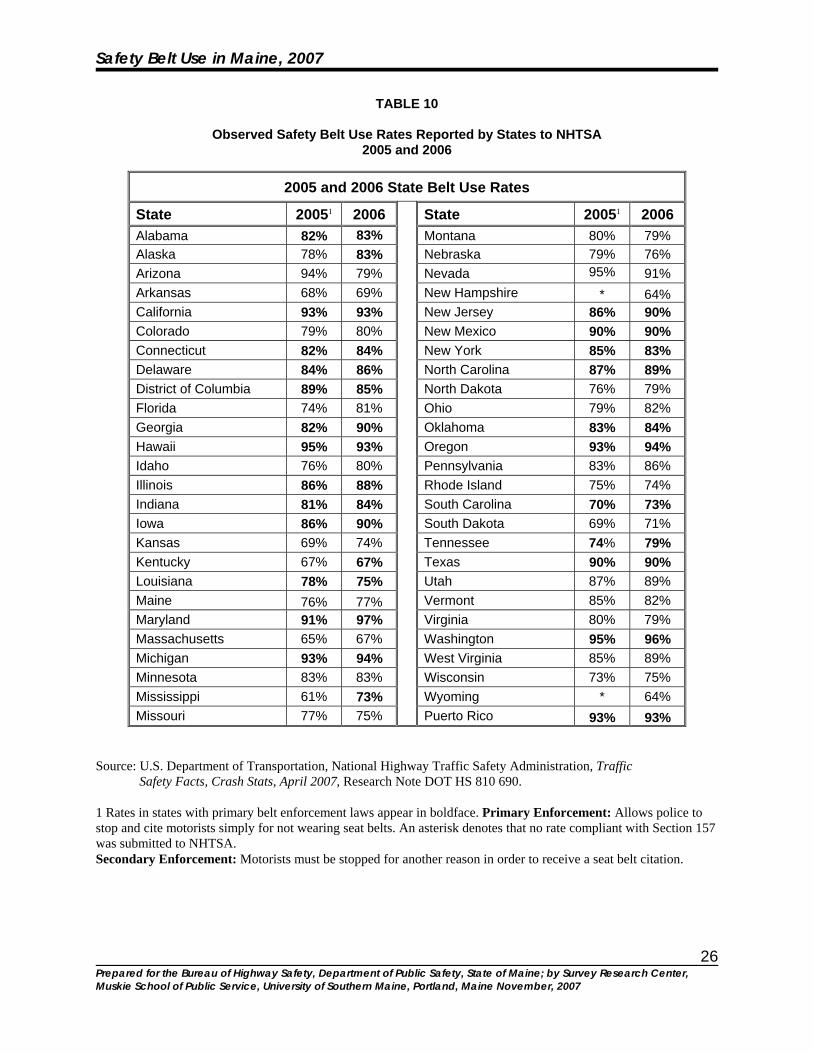
Comparison with other states. While Maine’s safety belt use has improved considerably since 1995,
other states have increased as well1. As a result, the state is still near the bottom nationally. In 1995,
Maine’s rate of only 50% was the fifth from the bottom of a list of all 50 states, the District of Colombia,
and Puerto Rico. By 1997, Maine’s use rate had risen only to number 352, and by 2006, Maine had
dropped to number 37, when only 13 states reported lower use rates. Because NHTSA has not yet
released the 2007 use rates for all states, it is not possible to report where Maine now stands but it most
likely will remain among the country’s lower rates.
Type of vehicle. As has been the case in every study conducted in Maine, people in pickup trucks have
the lowest use rates, at 68.6%. This is a substantial increase from the 39.7% reported in 2002, but
continues to be an area where considerable improvement is still possible. Vans, SUVs, and cars have use
rates of 83.6, 82.6 and 82.1%, respectively. Values for all vehicle types show increases of 2 – 5% from
2006 except SUVs, which show a slight decline from the 83.5% observed last year.
SUMMARY
Safety belt use in Maine has increased markedly since 1991, when only a third of people aged 16 and
over were belted. (Another change in study methods should be noted here: In all of the studies conducted
during the 1990s, information for all vehicle occupants, including children, was recorded, as well as the
estimated age of each individual. Children are no longer included for observations, nor is age estimated.
See SRC’s report “Child Safety Seat Use in Maine 2007” for details regarding current safety seat and seat
belt use among children in Maine.) While the new rate of 79.8% is encouraging, it appears that some
groups, particularly males, still have room for a great deal of improvement.
The impact of safety belt use is significant. Research published by NHTSA in 2003 stated that, when
properly used, lap/shoulder safety belts reduce the risk of fatal injury to front-seat passenger car
occupants by 45%; they reduce the risk of moderate-to-critical injury by 50%. The safety effect is even
greater for light truck occupants, where safety belts reduce the risk of fatal injury by 60% and moderate-to-
critical injury by 65%. The same study estimates that nearly 15,000 lives were saved by using safety belts
in the year 2003.3 It is research findings such as these that provide much of the impetus for continuing
efforts to increase seatbelt use in Maine and the nation.

Prepared for the Bureau of Highway Safety, Department of Public Safety, State of Maine; by Survey Research Center, Muskie School of Public Service, University of Southern Maine, Portland, Maine November, 2007
Safety Belt Use in Maine, 2007
9
This year’s study, like last year’s, was conducted immediately after a massive enforcement and publicity
campaign meant to increase safety belt usage. The rest of this report describes how the 2007 study was
implemented and presents the key findings. It also shows comparisons between 2007 and some of the
earlier studies. The project was conducted thanks to a contract between the Bureau of Highway Safety,
Department of Public Safety, State of Maine, and the Survey Research Center at the Muskie School of
Public Service, University of Southern Maine (USM), along with a subcontract between USM and the
Preusser Research Group in Trumbull, Connecticut.
Portland, Maine
November 30, 2007

Prepared for the Bureau of Highway Safety, Department of Public Safety, State of Maine; by Survey Research Center, Muskie School of Public Service, University of Southern Maine, Portland, Maine November, 2007
Safety Belt Use in Maine, 2007
10
INTRODUCTION The impact of seatbelt use is substantial. Research reported by NHTSA in 1996 found that three out of
every five people who die in vehicle crashes would have survived if they had been wearing their safety
belts. At that time, it was found that average hospitalization costs were nearly $5,000 less for people
injured in crashes and hospitalized if they were wearing their safety belts at the time of the crash.4
Nationally, about 81% of all motorists now use their safety belts.5
Prior to 1996, when mandatory seatbelt laws for adults went into effect, Maine motorists used their
seatbelts at a rate only about half of the national rate.6 In November 1995, Maine voters narrowly
approved a referendum establishing a secondary enforcement law requiring almost all people to wear
safety belts or use child restraint devices. Since then, use rates in Maine have improved a great deal. The
study here reports on results from an observation study conducted in 2007, several years after the last
major change in seatbelt laws in the state (although it should be noted that this year, Maine’s legislature
passed a primary enforcement law. While it didn’t go into effect until September 20, 2007 and ticketing
won’t begin until April 1, 2008, awareness of the new law seems high and may have contributed to higher
use rates). The data contained in this report are used to provide the Bureau of Highway Safety and the
National Highway Traffic Safety Administration with the current use rates and a measure of changing use
patterns over time.
The research project was conducted by the Survey Research Center of the Muskie School of Public
Service at the University of Southern Maine, under a contract with the Maine Bureau of Highway Safety,
Department of Public Safety, State of Maine. The study was designed to determine the rate of safety
restraint use in Maine as part of the development of a statewide comprehensive highway safety plan as
required by NHTSA. It incorporates the standardized design requirements developed by NHTSA in an
effort to ensure reliability and comparability of findings between each of the states.

Prepared for the Bureau of Highway Safety, Department of Public Safety, State of Maine; by Survey Research Center, Muskie School of Public Service, University of Southern Maine, Portland, Maine November, 2007
Safety Belt Use in Maine, 2007
11
METHODOLOGY
In 2004, a number of methodological changes were introduced in the observation study. These include the
selection of road segments for observation, instead of controlled intersections; observation of moving
vehicles, rather than stopped vehicles; observations on the Maine Turnpike and Interstates; and the end of
the practice of recording use for infants, children and young teenagers (and the related practice of
estimating ages of occupants). All of these changes have continued this year. While all previous studies
have met NHTSA guidelines and represent the official state use rates, the effect of these changes means
that direct comparisons may not be entirely accurate between studies conducted prior to 2004 and those
conducted since. The following is a description of the changes that were implemented and their potential
impact.
The biggest change in protocols in 2004 was that of sampling from all road segments on all types of roads
rather than only selecting controlled intersections, as had been the practice up until 2004. It is possible
that only recording cars and trucks at traffic signals is not representative of all traffic in the state. For
instance, it may be that people traveling on roads with enough traffic to warrant a traffic signal are more
likely to buckle up than those on less busy sections of roads. Or it might be that, where there are red lights
to slow traffic down, people feel less need to use their belts. In either case, the presence of a traffic signal
might affect use rates at each site; recording usage only at signalized intersections could affect the
statewide measure of use. Similarly, including traffic on highways affects the results. A great deal of
Maine’s traffic is on the turnpike and interstates. Not including any of that traffic, which may have different
use patterns, potentially impacted use rates measured. With the new protocols, the presence of traffic
lights and absence of highway driving is no longer a factor in the estimates reported.
The next most significant change that took effect in 2004 was the observation of moving vehicles. Here it
must be stated that recording use of occupants in moving cars and trucks is more difficult than observing
stopped vehicles. There are several factors that make it harder—tinted windows, glare of sunlight, dark
seatbelts on dark clothing, etc., not to mention the speed of cars on some roads. We suspect this may
lead to slightly higher estimates of use.
In addition to these methodological adjustments, another important factor is the highly advertised and
visible awareness and enforcement campaign that was conducted immediately before the study was
begun. While this seems to have the effect of at least temporarily boosting people’s likelihood of using
safety belts, the 2005 “mini survey” before the campaign began found the impact to be relatively minor.

Prepared for the Bureau of Highway Safety, Department of Public Safety, State of Maine; by Survey Research Center, Muskie School of Public Service, University of Southern Maine, Portland, Maine November, 2007
Safety Belt Use in Maine, 2007
12
Road sections selected as observation sites. Observation sites must allow the opportunity for a
reasonably representative flow of multi-purpose traffic, while allowing observers a safe viewing position
from which to observe and record belt use of occupants in each vehicle. Observers were given
descriptions of the road segment to observe (e.g., “Auburn, on Minot Avenue, between Heath Lane and
Garfield Road”). They were also told which direction of traffic to observe. They then were able to find the
most advantageous spot on the road segment from which to observe. They were instructed to only include
vehicles that had actually passed through the first identifier of the description (in the example above, the
intersection of Minot Avenue and Heath Lane). Observations were conducted from a single point on each
segment. In all, observations of 18,192 passenger vehicles and the use or nonuse of 23,462 occupants
were recorded. A list of the towns and cities selected appears as Table 11.
Sampling. The sites to be observed were selected by the Preusser Research Group of Trumbull, Conn.
The sampling design was developed to ensure compliance with NHTSA’s standardized guidelines. The
sampling process was designed to provide a confidence level of 95% with an acceptable margin of error of
plus or minus 5%. This resulted in a final sample size of 120 road segments. Road segments were
selected with probability of selection being proportional to the traffic volume measured in average daily
vehicle-miles traveled (DVMT) on each road segment, according to Maine Department of Transportation
data. Again, in 2007, the same 120 sites were observed as in 2004 through 2006.
Weighting. Consistent with NHTSA guidelines, the data were weighted to reflect the sampling design and
the average traffic volume at the selected road segments. The weighting simply adjusts the actual number
of vehicles observed to reflect the expected number of vehicles, based on the traffic volume where the
segment is located, and combines the site data in a way that represents statewide traffic volumes.
Observation times and days. Observations were made at 120 locations throughout the state for 45
minutes each, on a structured schedule of observation times and days that would maximize the
opportunity to study variations in restraint use by time and by day of week. Road segments were randomly
assigned to a day and time for observations, although consideration had to be given for trips to locations
that required lengthy travel times. Each day and time had an equal probability of selection. All
observations were done during daylight hours. Approximately 90% of the 2007 observations were done on
the same day and time as the 2004 through 2006 observations. For those few that were done on a
different day or time (due to weather, schedules, etc), they were done at comparable times. For instance,
a site that was observed in 2006 on Tuesday morning could be done this year on Wednesday or Thursday
morning, but not on Saturday morning, because travel patterns may be different on the weekend.
Many roads have two or more lanes of traffic. In those cases, the observation period was divided by the
number of lanes, and each lane was observed for the proportional length of time. For example, a road with

Prepared for the Bureau of Highway Safety, Department of Public Safety, State of Maine; by Survey Research Center, Muskie School of Public Service, University of Southern Maine, Portland, Maine November, 2007
Safety Belt Use in Maine, 2007
13
three lanes would require that each lane be observed for 15 minutes (three lanes times 15 minutes each
equals 45 minutes, the full observation period).
Observation assignments were made across a schedule of time slots that began at 7:00 a.m. and ended
at 5:45 p.m. They were conducted from June 6 to July 6, 2007 (Note: only one site was observed after
July 4th; all other observations were conducted prior to the holiday).
Observer training. Observers were trained by Katie Ledingham from the Preusser Research Group. They
were trained to observe proper shoulder belt use (vs. improper or no use) of the driver and, if present, a
right front seat passenger judged to be age 16 or older. Observations were made for private passenger
vehicles only. These were the same methods used in Maine in previous years and in numerous other
seatbelt observation efforts. The training involved written material, oral presentation, and field practice.
The field practice was conducted on Forest Avenue in Portland, near the SRC office. The practice
observations were crucial. Results were reviewed and analyzed for accuracy and consistency; no
observers were allowed to begin until their practice observations met training standards.

Prepared for the Bureau of Highway Safety, Department of Public Safety, State of Maine; by Survey Research Center, Muskie School of Public Service, University of Southern Maine, Portland, Maine November, 2007
Safety Belt Use in Maine, 2007
14
OBSERVATION STUDY FINDINGS
Overview: Compliance with the law. The latest use figures show a higher proportion of Maine’s
population buckling up, 79.8% overall. They also show some improvement in categories that had declined
from 2005 to 2006 (males and people in pickup trucks). However, for the second year in a row, some
categories declined from last year’s rates. Use rates for female passengers dropped from 86.6% in 2006
to 85.0% in 2007, and those in SUVs declined from 83.5% last year to 82.6% this year. And even with the
new higher overall rate, Maine still ranks low compared to most other states.7 In order to raise rates
relative to other states, it seems likely that Maine will still require an on-going effort of education and
enforcement or legislative changes.
Gender differences. Female use rate has been consistently higher than that of males; that pattern
continues in 2007. While 85.4% of all female occupants were restrained, only 74.9% of males were using
their seatbelts. For the first time, we found a drop in one of the female subgroups (female passengers, as
reported above). As has been the case in every previous study done in Maine, males continue to lag
behind females in seatbelt use.
Seating position. Overall, there is little difference in use rates by seating position within vehicles. In 2007,
79.4% of drivers were using seatbelts and 80.4% of passengers were using theirs.
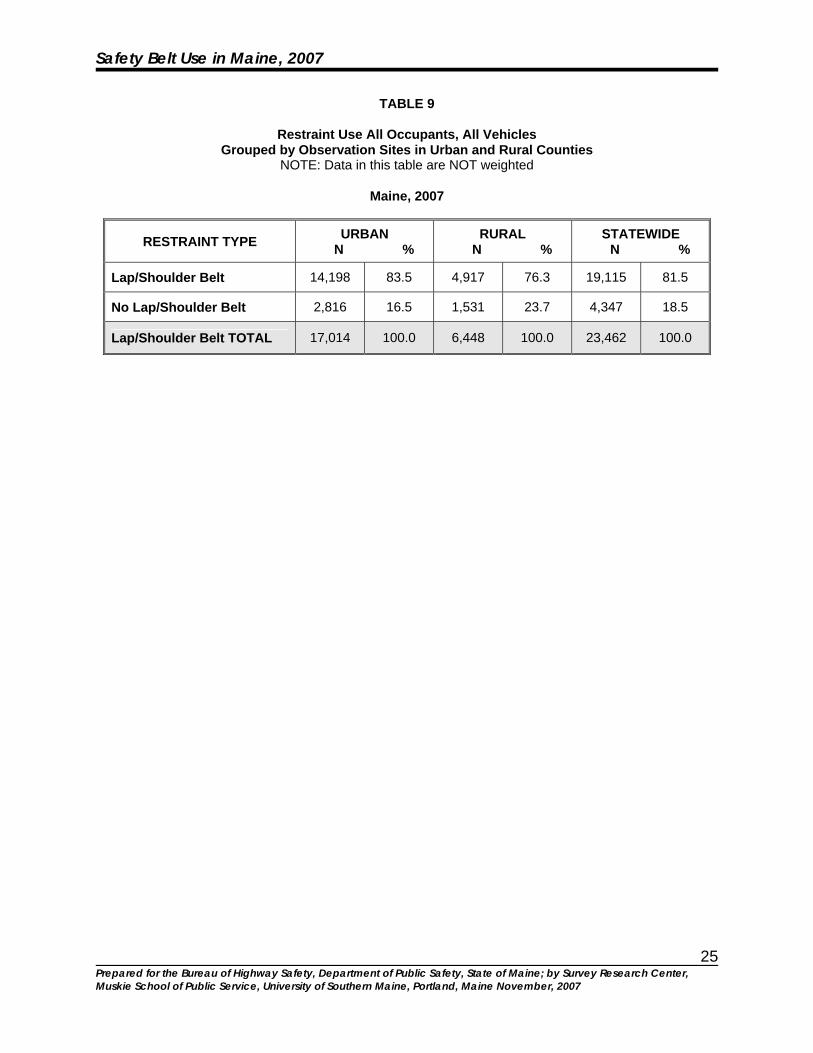
Urban/rural differences. The belt use rate in urban counties (Androscoggin, Cumberland, Kennebec,
Penobscot, and York) continues to be higher than in rural counties, at 83% and 76% respectively. The gap
between the two areas continues to narrow, however, with the difference dropping to less than 10
percentage points for the first time (Note: due to the statistical difficulties of weighting data by ten different
counties, various road types and traffic volume at all road segments, these data are not weighted). In a
reflection of changing population patterns in the state, 62% of the segments selected were in the 5 urban
counties. Due to the higher traffic volume in those areas, 73% of vehicles observed were in urban
counties, and 27% were in the rural counties.
Type of vehicle. There is one clear difference in driver safety belt use rates according to the type of
vehicle the driver is operating. At 68.6%, drivers of pickup trucks have a considerably lower use rate than
any of the other types of vehicles (see Table 7). It is likely that the selection of a vehicle and the decision
of whether to buckle up or not are both related to gender, age, lifestyle and other factors so this may not
be a surprising finding; it certainly has been consistent over the years.
Passenger use related to use by driver. As in all prior studies, buckling up is a friend and family affair.
When drivers use their safety belts, other occupants of the vehicle (who are most likely friends or family of
Prepared for the Bureau of Highway Safety, Department of Public Safety, State of Maine; by Survey Research Center, Muskie School of Public Service, University of Southern Maine, Portland, Maine November, 2007
Safety Belt Use in Maine, 2007
15
the driver) are nearly three times as likely to use their belts as they are when the driver is not using a belt
92.3% vs. 35.9%; see Table 8.
Comparison with other states. While Maine’s use rate has improved since 2002, other states have also
improved.8 The net result is that Maine may have actually declined in national standings. As of this writing,
NHTSA has not released 2007 rates so Table 10 only reports changes in use rates from 2005 to 2006.
While final comparisons between states can not yet be made, the 2006 findings in Table 10 suggest that
Maine will likely still be near the middle or bottom when the state by state listing for 2007 is complete.
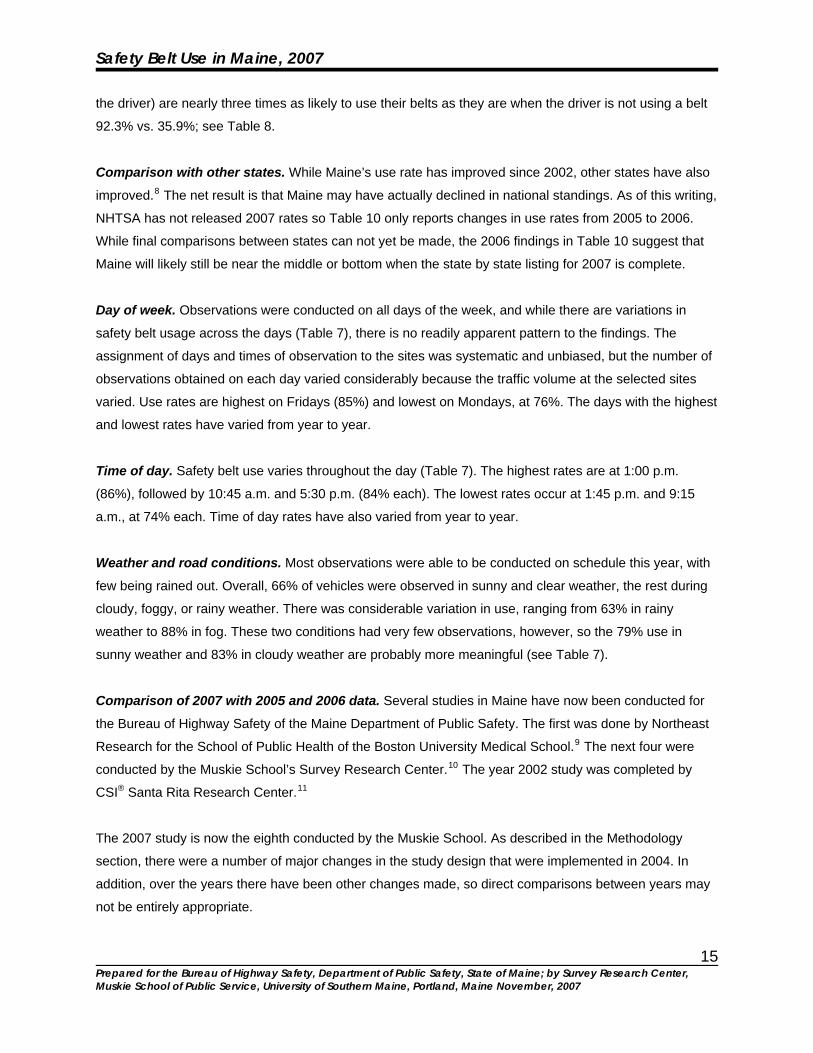
Day of week. Observations were conducted on all days of the week, and while there are variations in
safety belt usage across the days (Table 7), there is no readily apparent pattern to the findings. The
assignment of days and times of observation to the sites was systematic and unbiased, but the number of
observations obtained on each day varied considerably because the traffic volume at the selected sites
varied. Use rates are highest on Fridays (85%) and lowest on Mondays, at 76%. The days with the highest
and lowest rates have varied from year to year.
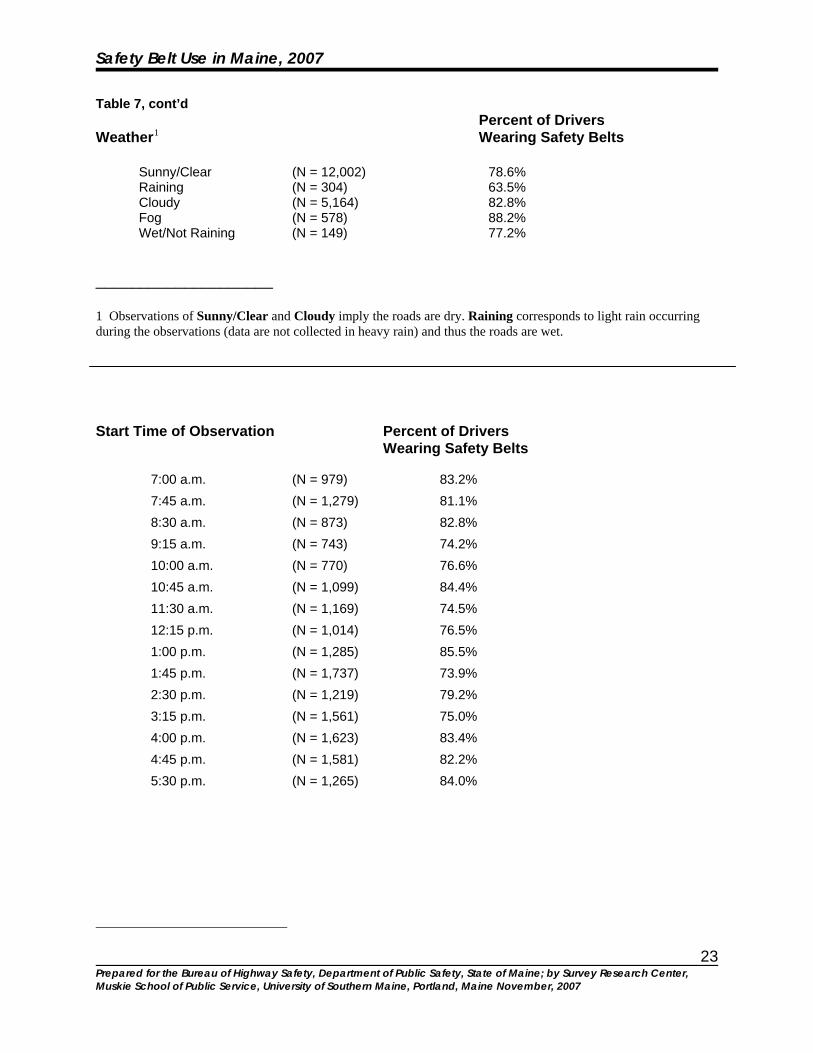
Time of day. Safety belt use varies throughout the day (Table 7). The highest rates are at 1:00 p.m.
(86%), followed by 10:45 a.m. and 5:30 p.m. (84% each). The lowest rates occur at 1:45 p.m. and 9:15
a.m., at 74% each. Time of day rates have also varied from year to year.
Weather and road conditions. Most observations were able to be conducted on schedule this year, with
few being rained out. Overall, 66% of vehicles were observed in sunny and clear weather, the rest during
cloudy, foggy, or rainy weather. There was considerable variation in use, ranging from 63% in rainy
weather to 88% in fog. These two conditions had very few observations, however, so the 79% use in
sunny weather and 83% in cloudy weather are probably more meaningful (see Table 7).
Comparison of 2007 with 2005 and 2006 data. Several studies in Maine have now been conducted for
the Bureau of Highway Safety of the Maine Department of Public Safety. The first was done by Northeast
Research for the School of Public Health of the Boston University Medical School.9 The next four were
conducted by the Muskie School’s Survey Research Center.10 The year 2002 study was completed by
CSI® Santa Rita Research Center.11
The 2007 study is now the eighth conducted by the Muskie School. As described in the Methodology
section, there were a number of major changes in the study design that were implemented in 2004. In
addition, over the years there have been other changes made, so direct comparisons between years may
not be entirely appropriate.

Prepared for the Bureau of Highway Safety, Department of Public Safety, State of Maine; by Survey Research Center, Muskie School of Public Service, University of Southern Maine, Portland, Maine November, 2007
Safety Belt Use in Maine, 2007
16
In 2002, overall compliance stood at approximately 59%. At that time, the rate for people over 18 was also
59%. Beginning in 2004, only adults were recorded (although it is likely that some mid- to older teens were
inadvertently included). The rate for 2005 had increased to 76% and to 77% in 2006. Now, in 2007, the
use rate has increased again to almost 80%.
Continuing a shift that first occurred in 2004, passengers have a higher rate of belt use (80%) than drivers
(79%). In 2006, 80% of adult passengers were restrained while 77% of drivers used seatbelts. In 2005, the
respective figures were 78% and 75%.
A comparison of male drivers to female drivers over the three studies shows some improvement among
males. For the year 2005, male drivers had a use rate of 72% and females had a rate of 81%. In 2006, the
comparable figures were 72% for males and 84% for females. The 2007 results show male drivers
improving to 76% and female drivers increasing slightly to 85%. While the “gender gap” has narrowed over
the earlier studies, it continues to exist through the current year.
During the early to mid-nineties, seatbelt use in Maine increased substantially. By 1997, however, that
trend had ended. From then through 2002, there was no overall increase and even some declines in
certain areas. The years of increase correspond to a time when a number of changes were made in
seatbelt laws in the state—in 1989, the law was expanded to require all occupants age 4 to 19 to use
restraints. In 1993, fines for violations were increased. And most importantly, in 1995, a statewide
referendum requiring all adults 19 and older to use safety belts was passed. From 1995 through 2006,
there were no major revisions to Maine’s belt laws.
SUMMARY
Safety restraint use has increased significantly in Maine, doubling from a rate of only 36% in 1991 to just
under 80% in 2007. Much of the early increase has probably been a direct result of changes in laws
governing seatbelt use. The biggest increase has been among males, although men remain consistently
behind women in usage.
In 2006, for the first time, use rates declined in some categories; 2007 also saw some declines. It is likely
that further media campaigns, education, and law enforcement efforts will be necessary to increase the
current use level. The 2008 study will be the first to measure the impact of the new primary enforcement
law. Future studies may help to establish if additional legal incentives are necessary to ensure that
Maine’s higher level of safety in passenger vehicles will be maintained.

Prepared for the Bureau of Highway Safety, Department of Public Safety, State of Maine; by Survey Research Center, Muskie School of Public Service, University of Southern Maine, Portland, Maine November, 2007
Safety Belt Use in Maine, 2007
17
ENDNOTES 1 U.S. Department of Transportation, National Highway Traffic Safety Administration, Traffic Safety Facts Crash Stats, April 2007, Research Note, DOT HS 810 690. 2 Al Leighton and Erika Ziller, Safety Belt Use in Maine 1998, Edmund S. Muskie Institute of Public Affairs, University of Southern Maine, prepared for the Bureau of Highway Safety, Department of Public Safety, State of Maine, April 1999. 3 U.S. Department of Transportation, National Highway Traffic Safety Administration, Traffic Safety Facts 2003, Occupant Protection, DOT HS 809 765. 4 U.S. Department of Transportation, National Highway Traffic Safety Administration, Three of five unbelted motorists in fatal crashes would have survived, study reports, (press release 9/96), Feb. 15, 1996. 5 U.S. Department of Transportation, National Highway Traffic Safety Administration, Traffic Safety Facts Crash Stats, April 2007, Research Note, DOT HS 810 690. 6 Suzanne K. Hart, Child Restraint Device and Safety Belt Use in Maine, 1991, Edmund S. Muskie Institute of Public Affairs, University of Southern Maine, prepared for the Bureau of Highway Safety, Department of Public Safety, State of Maine, August 1992; and Deidre Hungerford, David Kovenock, and James Sorg, Maine Seat Belt Use Observation Study, February, 1986: Preliminary Summary, Northeast Research, Orono, Maine, 1986. 7 U.S. Department of Transportation, National Highway Traffic Safety Administration, Traffic Safety Facts 2005, Research Note, DOT HS 809 970. 8 U.S. Department of Transportation, National Highway Traffic Safety Administration, Traffic Safety Facts 2005, Research Note, DOT HS 809 970. 9 Deidre Hungerford, David Kovenock, and James Sorg, Maine Seat Belt Use Observation Study, February, 1986: Preliminary Summary, Northeast Research, Orono, Maine, 1986. 10 Al Leighton, Erika Ziller and Suzanne K. Hart, Safety Belt Use in Maine 1991, 1995, 1997, 1998, Edmund S. Muskie Institute of Public Affairs, University of Southern Maine, prepared for the Bureau of Highway Safety, Department of Public Safety, State of Maine, 1992, 1995, 1997, 1999. 11 Ash Bose, Safety Belt Use in Maine 2002, CSI Santa Rita Research Center, Communication Software, Inc., Arizona, December, 2002.

Prepared for the Bureau of Highway Safety, Department of Public Safety, State of Maine; by Survey Research Center, Muskie School of Public Service, University of Southern Maine, Portland, Maine November, 2007
Safety Belt Use in Maine, 2007
18
List of Tables 2006 Maine Safety Belt Use Observation Study
Table 1: Restraint Use, All Persons
Table 2: All Persons, by seating position
Table 3: Restraint Use, Males
Table 4: Males, by seating position
Table 5: Restraint Use, Females
Table 6: Females, by seating position
Table 7: Percentage of drivers wearing safety belts under selected conditions:
• Type of vehicle
• Day of the week
• Weather
• Time of observation
Table 8: Passenger belt use/nonuse compared to Driver belt use/nonuse
Table 9: Restraint use All Occupants, All Vehicles, by Urban and Rural Counties
Table 10: Observed safety belt use rates reported to NHTSA by states
Table 11: Locations of intersections at which observations were conducted

Prepared for the Bureau of Highway Safety, Department of Public Safety, State of Maine; by Survey Research Center, Muskie School of Public Service, University of Southern Maine, Portland, Maine November, 2007
Safety Belt Use in Maine, 2007
19
TABLE 1
Restraint Use in Passenger Vehicles Statewide
Maine, 2007
All Persons
All Persons
Lap/Shoulder 79.8%
No Restraint 20.2%
No. Vehicles = 18,192; No. Persons = 23,462
TABLE 2
Restraint Use in Passenger Vehicles
Statewide By Seating Position
Maine, 2007
All Persons
Driver Passenger
Lap/Shoulder 79.4% Lap/Shoulder 80.4%
No Restraint 20.6% No Restraint 19.6%
N = 17,924 N = 5,538
Prepared for the Bureau of Highway Safety, Department of Public Safety, State of Maine; by Survey Research Center, Muskie School of Public Service, University of Southern Maine, Portland, Maine November, 2007
Safety Belt Use in Maine, 2007
20
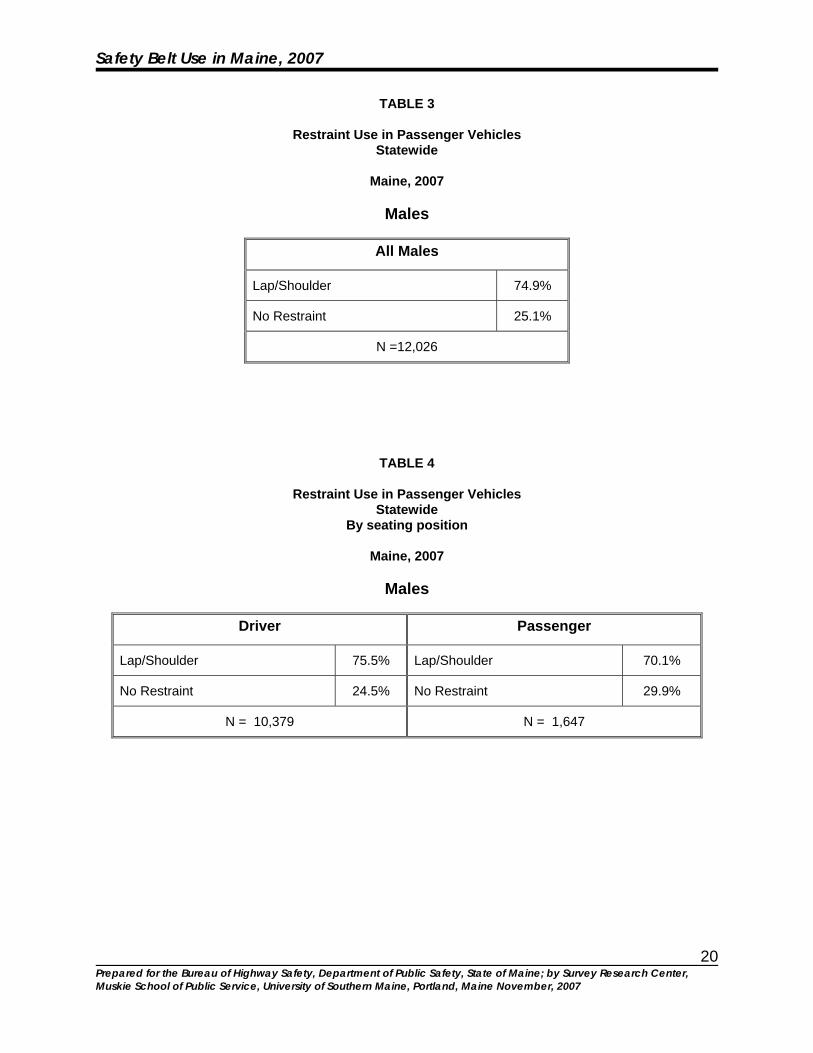
TABLE 3
Restraint Use in Passenger Vehicles Statewide
Maine, 2007
Males
All Males
Lap/Shoulder 74.9%
No Restraint 25.1%
N =12,026
TABLE 4
Restraint Use in Passenger Vehicles Statewide
By seating position
Maine, 2007
Males
Driver Passenger
Lap/Shoulder 75.5% Lap/Shoulder 70.1%
No Restraint 24.5% No Restraint 29.9%
N = 10,379 N = 1,647

Prepared for the Bureau of Highway Safety, Department of Public Safety, State of Maine; by Survey Research Center, Muskie School of Public Service, University of Southern Maine, Portland, Maine November, 2007
Safety Belt Use in Maine, 2007
21
TABLE 5
Restraint Use in Passenger Vehicles Statewide
Maine, 2007
Females
All Females
Lap/Shoulder 85.4%
No Restraint 14.6%
N = 11,130
TABLE 6
Restraint Use in Passenger Vehicles Statewide
By seating position
Maine, 2007
Females
Driver Passenger
Lap/Shoulder 85.1% Lap/Shoulder 85.0%
No Restraint 14.9% No Restraint 15.0%
N = 7,359 N = 3,771

Prepared for the Bureau of Highway Safety, Department of Public Safety, State of Maine; by Survey Research Center, Muskie School of Public Service, University of Southern Maine, Portland, Maine November, 2007
Safety Belt Use in Maine, 2007
22
TABLE 7
Percentage of Drivers Wearing Safety Belts Under Selected Conditions
Statewide
Maine, 2007
Type of Vehicle
Vehicle Type Belt Use Car (N = 9,344) 82.1% SUV (N = 3,763) 82.6% Van (N = 1,537) 83.6% Truck (N = 3,280) 68.6%
Day of the Week
(Note: data in the rest of this table Percent of Drivers are not weighted) Wearing Safety Belts Monday (N = 2,546) 76.5%
Tuesday (N = 2,349) 81.8% Wednesday (N = 2,992) 77.9% Thursday (N = 3,021) 80.4% Friday (N = 2,463) 84.6% Saturday (N = 2,846) 79.9% Sunday (N = 1,980) 77.6%
Prepared for the Bureau of Highway Safety, Department of Public Safety, State of Maine; by Survey Research Center, Muskie School of Public Service, University of Southern Maine, Portland, Maine November, 2007
Safety Belt Use in Maine, 2007
23
Table 7, cont’d Percent of Drivers Weather1 Wearing Safety Belts
Sunny/Clear (N = 12,002) 78.6% Raining (N = 304) 63.5% Cloudy (N = 5,164) 82.8% Fog (N = 578) 88.2% Wet/Not Raining (N = 149) 77.2%
____________________ 1 Observations of Sunny/Clear and Cloudy imply the roads are dry. Raining corresponds to light rain occurring during the observations (data are not collected in heavy rain) and thus the roads are wet.
Start Time of Observation Percent of Drivers Wearing Safety Belts
7:00 a.m. (N = 979) 83.2% 7:45 a.m. (N = 1,279) 81.1% 8:30 a.m. (N = 873) 82.8% 9:15 a.m. (N = 743) 74.2% 10:00 a.m. (N = 770) 76.6% 10:45 a.m. (N = 1,099) 84.4% 11:30 a.m. (N = 1,169) 74.5% 12:15 p.m. (N = 1,014) 76.5% 1:00 p.m. (N = 1,285) 85.5% 1:45 p.m. (N = 1,737) 73.9% 2:30 p.m. (N = 1,219) 79.2% 3:15 p.m. (N = 1,561) 75.0% 4:00 p.m. (N = 1,623) 83.4% 4:45 p.m. (N = 1,581) 82.2% 5:30 p.m. (N = 1,265) 84.0%

Prepared for the Bureau of Highway Safety, Department of Public Safety, State of Maine; by Survey Research Center, Muskie School of Public Service, University of Southern Maine, Portland, Maine November, 2007
Safety Belt Use in Maine, 2007
24
TABLE 8
Passenger belt use/nonuse compared to Driver belt use/nonuse
NOTE: Data in this table are NOT weighted
Maine, 2007
When the driver IS wearing a belt
Driver Passenger
Lap/Shoulder 92.3%NOT APPLICABLE
No Restraint 7.7%
N = Not Applicable N = 4,564
When the driver is NOT wearing a belt Driver Passenger
Lap/Shoulder 35.9%NOT APPLICABLE
No Restraint 64.1%
N = Not Applicable N = 905
Prepared for the Bureau of Highway Safety, Department of Public Safety, State of Maine; by Survey Research Center, Muskie School of Public Service, University of Southern Maine, Portland, Maine November, 2007
Safety Belt Use in Maine, 2007
25
TABLE 9
Restraint Use All Occupants, All Vehicles Grouped by Observation Sites in Urban and Rural Counties
NOTE: Data in this table are NOT weighted
Maine, 2007
RESTRAINT TYPE URBAN N %
RURAL N %
STATEWIDE N %
Lap/Shoulder Belt 14,198 83.5 4,917 76.3 19,115 81.5
No Lap/Shoulder Belt 2,816 16.5 1,531 23.7 4,347 18.5
Lap/Shoulder Belt TOTAL 17,014 100.0 6,448 100.0 23,462 100.0
Prepared for the Bureau of Highway Safety, Department of Public Safety, State of Maine; by Survey Research Center, Muskie School of Public Service, University of Southern Maine, Portland, Maine November, 2007
Safety Belt Use in Maine, 2007
26
TABLE 10
Observed Safety Belt Use Rates Reported by States to NHTSA 2005 and 2006
2005 and 2006 State Belt Use Rates
State 20051 2006 State 20051 2006 Alabama 82% 83% Montana 80% 79% Alaska 78% 83% Nebraska 79% 76% Arizona 94% 79% Nevada 95% 91% Arkansas 68% 69% New Hampshire * 64% California 93% 93% New Jersey 86% 90% Colorado 79% 80% New Mexico 90% 90% Connecticut 82% 84% New York 85% 83% Delaware 84% 86% North Carolina 87% 89% District of Columbia 89% 85% North Dakota 76% 79% Florida 74% 81% Ohio 79% 82% Georgia 82% 90% Oklahoma 83% 84% Hawaii 95% 93% Oregon 93% 94% Idaho 76% 80% Pennsylvania 83% 86% Illinois 86% 88% Rhode Island 75% 74% Indiana 81% 84% South Carolina 70% 73% Iowa 86% 90% South Dakota 69% 71% Kansas 69% 74% Tennessee 74% 79% Kentucky 67% 67% Texas 90% 90% Louisiana 78% 75% Utah 87% 89% Maine 76% 77% Vermont 85% 82% Maryland 91% 97% Virginia 80% 79% Massachusetts 65% 67% Washington 95% 96% Michigan 93% 94% West Virginia 85% 89% Minnesota 83% 83% Wisconsin 73% 75% Mississippi 61% 73% Wyoming * 64% Missouri 77% 75%
Puerto Rico 93% 93%
Source: U.S. Department of Transportation, National Highway Traffic Safety Administration, Traffic Safety Facts, Crash Stats, April 2007, Research Note DOT HS 810 690. 1 Rates in states with primary belt enforcement laws appear in boldface. Primary Enforcement: Allows police to stop and cite motorists simply for not wearing seat belts. An asterisk denotes that no rate compliant with Section 157 was submitted to NHTSA. Secondary Enforcement: Motorists must be stopped for another reason in order to receive a seat belt citation.

Prepared for the Bureau of Highway Safety, Department of Public Safety, State of Maine; by Survey Research Center, Muskie School of Public Service, University of Southern Maine, Portland, Maine November, 2007
Safety Belt Use in Maine, 2007
27
TABLE 11 Maine 2007 Observation Sites List
1.Cumberland County (18) 1. Portland (4) 2. Freeport (3) 3. Westbrook (3) 4. South Portland (2) 5. Casco (1) 6. Cumberland (1) 7. Gray (1) 8. Raymond (1) 9. Scarborough (1) 10. Windham (1) 2. York (16) 1. Saco (3) 2. Biddeford (2) 3. Kittery (2) 4. North Berwick (2) 5. Wells (2) 6. Acton (1) 7. Eliot (1) 8. Lyman (1) 9. Sanford (1) 10. Shapleigh (1) 3. Penobscot (15) 1. Bangor (5) 2. Brewer (1) 3. Carmel (1) 4. Hermon (1) 5. Holden (1) 6. Howland (1) 7. Mattawamkeag (1) 8. Millinocket (1) 9. Old Town (1) 10. Orono (1) 11. Plymouth (1)
4. Kennebec (13) 1. Augusta (2) 2. Sidney (2) 3. Waterville (2) 4. China (1) 5. Hallowell (1) 6. Monmouth (1) 7. Oakland (1) 8. Pittston (1) 9. Readfield (1) 10. West Gardiner (1) 5. Androscoggin (12) 1. Auburn (3) 2. Lewiston (3) 3. Sabattus (3) 4. Livermore Falls (1) 5. Poland (1) 6. Turner (1) 6. Aroostook (12) 1. Caribou (3) 2. Ashland (1) 3. Fort Fairfield (1) 4. Hodgdon (1) 5. Limestone (1) 6. Masardis (1) 7. Sherman (1) 8. Van Buren (1) 9. Wade (1) 10. Woodland (1)
7. Hancock (9)
1. Bar Harbor (1) 2. Ellsworth (2) 3. Stonington (2) 4. Bucksport (1) 5. Dedham (1) 6. Deer Isle (1) 7. Township 28 (1) 8. Oxford (9) 1. Fryeburg (3) 2. Greenwood (1) 3. Hebron (1) 4. Norway (1) 5. Rumford (1) 6. Sumner (1) 7. West Paris (1) 9. Somerset (9) 1. Fairfield (2) 2. Anson (1) 3. Caratunk (1) 4. Harmony (1) 5. Madison (1) 6. Norridgewock (1) 7. Pittsfield (1) 8. Starks (1) 10.Knox (7) 1. Rockport (3) 2. Rockland (2) 3. S. Thomaston (1) 4. Thomaston (1)

Prepared for the Bureau of Highway Safety, Department of Public Safety, State of Maine; by Survey Research Center, Muskie School of Public Service, University of Southern Maine, Portland, Maine November, 2007
Safety Belt Use in Maine, 2007
28
History of Occupant Protection Laws
EFFECTIVE DATES LAWS 09-20-07 Primary enforcement law takes effect; ticketing to begin on April 1, 2008. 01-01-03 The operator is responsible for ensuring that a child (from 40 pounds but less than 80
pounds and less than 8 years of age) is properly secured in a federally approved child restraint system.
09-19-97 The operator is responsible for securing persons under age 18 in a safety belt/seat. Persons
18 years and older are responsible for securing themselves. 09-19-97 A law enforcement officer may take enforcement action against an operator or passenger
18 years or age or older who fails to wear a seat belt only if the officer detains the operator for a suspected violation of another law. The requirement that the operator must receive a fine for the other violation in order to be subject to a penalty for the seat belt violation has been deleted.
01-01-95 With the implementation of Title 29A, the child safety seat law and seat belt law were
combined into one law. 12-27-95 A statewide referendum requiring adults 19 and older to use safety belts passed on
11-07-95. The law could be enforced only if the police officer had detained the operator of a motor vehicle for a suspected violation of another law.
07-94 Driver made responsible for securing children under 4 years in a child safety seat. 10-13-93 Penalty changed from fine of $25 for first violation and $50 for each subsequent violation for
those aged 0 to 4 to traffic infraction (up to $500 fine). 10-13-93 Penalty changed from fine of $25 for first violation and $200 for each subsequent violation
for those 4 to 19 to traffic infraction (up to $500 fine). 09-29-87 Children aged 4 to 13 years must be secured in a child safety seat or safety belt. 09-30-89 Law expanded to include children 4 to 16 years. 10-09-91 Law expanded to include persons 4 to 19 years. 09-23-83 Children aged 0 to 4 years must be secured in a child safety seat.

Maine Seat Belt Observation Form SITE NUMBER:__________ SITE:______________________________________________________ NOTES:________________________________________________________________________________ WEATHER CONDITIONS DATE: _______ - _______ - _______ DAY OF WEEK: _________________ 1 Clear / Sunny 4 Fog 2 Light Rain 5 Clear but Wet 3 Cloudy DIRECTION OF TRAFFIC FLOW (Circle one): N S E W START TIME:_____________ (Observation period will last exactly 45 minutes) DRIVER PASSENGER DRIVER PASSENGER
Veh. #
Vehicle C = car T = truck S = suv V = van
Sex M = male F = female U = unsure
Use + = yes - = no U = unsure
Sex M = male F = female U = unsure
Use + = yes - = no U = unsure
Veh. #
Vehicle C = car T = truck S = suv V = van
Sex M = male F = female U = unsure
Use + = yes - = no U = unsure
Sex M = male F = female U = unsure
Use + = yes - = no U = unsure
1 36
2 37
3 38
4 39
5 40
6 41
7 42
8 43
9 44
10 45
11 46
12 47
13 48
14 49
15 50
16 51
17 52
18 53
19 54
20 55
21 56
22 57
23 58
24 59
25 60
26 61
27 62
28 63
29 64
30 65
31 66
32 67
33 68
34 69
35 70 MAINE SEAT BELT SURVEY
FORM 2004 Page:_______ of________