NIGHT SEAT BELT ENFORCEMENT DEMONSTRATION PROGRAM AND EVALUATION

Safety Belt Enforcement in Tennessee
Annual Report to the Tennessee General Assembly
Dave Mitchell, Commissioner April 2008


Table of Contents
Introduction 1
Convictions 7
Safety Belts 9
Child Restraint Devices 15
Citations 21
Safety Belts 23
Child Restraint Devices 27
Supplemental Information 31
Observed Safety Belt Usage 33
Safety Belt Usage in Tennessee Traffic Crashes 34
Attachments 37
Tennessee Code Annotated § 55-9-602 39
Tennessee Code Annotated § 55-9-603 45
Traffic Safety Facts: Crash Stats, April 2007 51
Survey of Safety Belt and Motorcycle Helmet Usage in Tennessee 55
Tennessee Department of Health Population Projections 79


Introduction


Safety Belt Enforcement in Tennessee Annual Report to the Tennessee General Assembly
in Compliance with Tennessee Code Annotated § 55-9-603
Executive Summary This report contains a study conducted for the Tennessee General Assembly in compliance with Tennessee Code Annotated § 55-9-603 (k), to supply data collected for the previous five (5) years relating to violations of the Safety Belt Usage law. Chapter 893 of the “Public Acts of 2004” changed Tennessee’s law relating to safety belt usage in passenger vehicles, from a “secondary” to a “primary” use law effective July 1, 2004. Included in the Public Act was a requirement for the Tennessee Department of Safety to file an annual report by March 1 of each year to the 104th, 105th, and 106th sessions of the General Assembly. The report is to “include the number of persons cited for violations of this section, their race, ethnicity, sex, age, and any other information the department deems relevant.” In compliance with this legislative directive, the Tennessee Department of Safety’s Research, Planning & Development Section reviewed various data from the Driver History, Trooper Ticket, and Crash Analysis Reporting System databases. Since Tennessee does not have a statutory uniform citation law, statewide data is not available on the number of citations issued by all law enforcement agencies for traffic violations. A review was conducted of all “convictions” reported to the Department’s Financial Responsibility Division by court clerks, for fiscal years 2002-2003 through 2006-2007. Due to delays in reporting convictions to the Department, and posting convictions to the Driver History file, the data is more complete utilizing fiscal year (FY) information, rather than calendar year (CY) information for both statewide convictions and Tennessee Highway Patrol-issued citations. However, the safety belt convictions contained in the Driver History file include only those convictions reported to the Department of Safety by the court clerks. Traffic crash restraint usage by vehicle occupants is also based upon fiscal year data. However, given the significant delay in processing and keying crash reports, crash data contained in this report since 2005 is considered preliminary. Statewide safety belt convictions reported to the Department of Safety (all agencies) increased from 22,299 in FY 02-03 to 58,004 in FY 06-07, a 160% increase. In FY 06-07, adult drivers between the ages of 25-34 represented approximately 28.0% of all those convicted. White adult males were the most frequently convicted in all five years, representing 56.3% of all adult drivers in this period and 78.0% of adult male drivers in FY 06-07. Black males were the next highest group convicted, representing 10.9% of all adult drivers and 16.9% of adult male drivers in FY 06-07. Of all adult drivers, males were the prominent sex convicted, with 72% in FY 06-07 compared to 28% for females. White females were most often convicted of the female adult drivers, with 80.5% in FY 06-07. The next highest group was black females, representing 16.9% of adult female drivers.

In FY 06-07, adult passengers convicted of safety belt violations represented only 1.4% of all safety belt convictions reported to the department. Generally over the five-year period, adult passengers followed nearly the same percentage distributions for sex and race. Citations issued by commissioned officers of the Tennessee Highway Patrol were analyzed for fiscal years 2002-2003 through 2006-2007. Tennessee Highway Patrol citations issued for safety belt violations decreased from 29,900 in FY 02-03 to 29,023 in FY 03-04. In FY 04-05, there was a large increase to 48,620 and then another increase during FY 05-06 to 51,655. During FY 06-07, citations decreased to 43,525. From FY 02-03 to FY 06-07, Trooper citations issued for these violations increased 46%. Adult drivers between the ages of 25-34 were the most frequently ticketed group throughout the five-year period, averaging approximately 27%. In FY 06-07, of all adult male drivers, white males received 87.7% of Trooper safety belt citations. Of all adult drivers, white males received 65.5% of these citations. Black males were the next highest group with an average of 8.4% of all male drivers and 6.3% of all drivers. Hispanic males received 2.9% of THP-issued citations for male drivers and 2.2% of citations for all drivers. Convictions involving child restraint device (CRD) violations were also analyzed for this report. After steadily decreasing for four years, CRD convictions reported to the Department of Safety increased from 2,694 in FY 05-06 to 4,898 in FY 06-07. Unlike safety belt convictions reported, the majority of CRD convictions were received by females, who made up 59.3%. White females were the predominant race and gender for both convictions involving children 3 and under, as well as those involving children ages 4-15. In FY 06-07, white females accounted for 31.8% of all CRD convictions. Black females were the next highest group with 22.8%. For males, white males represented 22.1% of all convictions, with black males coming in second at 10.8%. Citations issued by THP for CRD violations showed a small increase over the five-year period. These citations grew from 4,100 in FY 02-03 to a five-year high of 5,724 in FY 04-05. Since then CRD citations have decreased to 4,303 in FY 06-07, a reduction of 25%. Adult drivers between the ages of 20-29 were the most frequently ticketed group, averaging approximately 41%. As was the case with CRD convictions, females received the majority of CRD citations, ranging from 55.8% on FY 02-03 to 56.2% in FY 06-07. White females accounted for an average of 75.8% of the females ticketed during the five-year period. White males made up an average of 72.6% of male drivers ticketed from FY 02-03 to FY 06-07. The National Highway Traffic Safety Administration (NHTSA) funds Safety Restraint Usage Surveys each year in every State and U.S. Territory, through the various Governors’ Highway Safety Offices. The results are analyzed and published by the National Center for Statistics and Analysis (NCSA). The NCSA established uniform survey criteria, and data analysis methodologies to ensure each state and territory’s data were comparable.
4
In the July 2007 Survey of Safety Belt And Motorcycle Helmet Usage In Tennessee published by the University of Tennessee Center for Transportation Research, Tennessee’s survey results indicated an overall increase of 1.6% from 2006 to 2007 (78.6% to 80.2%). This is the first time Tennessee has crossed the 80% threshold for safety belt usage. Usage rates are expected to continue to increase as a result of targeted enforcement efforts and the implementation of the primary enforcement provision of the current law. Ultimately, laws governing the use of seat belts are intended to help reduce fatalities and injuries on Tennessee roads. Therefore, traffic crash data has also been examined and submitted in this report. Caution must be used when reviewing crash data, since FY 05-06 and FY 06-07 data are not complete. This is the result of a new crash database and process being implemented in late 2002, which has caused delays in keying data. However, one fact is known: over the last five years, over 59% of vehicle occupants fatally injured in Tennessee traffic crashes, were still not restrained! During the five-year period, police reported safety restraint usage by vehicle occupants in traffic crashes increased. In FY 02-03, police reported that 6.0% of vehicle occupants involved in traffic crashes were not restrained. This percentage decreased each year from 6.0% in FY 02-03 to 4.2% in FY 05-06. However, the data for FY 06-07 is still preliminary and may not be all the crashes that occurred in Tennessee. When comparing FY 02-03 to FY 05-06, the numbers indicate a reduction in all injury categories for the percentage of unrestrained drivers: No Injury = 4.0% to 3.2%; Possible Injury = 9.5% to 8.4%; Non-Incapacitating Injury = 19.6% to 16.3%; Incapacitating Injury = 35.6% to 29.0%; and, Fatal Injury = 65.3% to 54.0%. Study results suggest that safety belt usage has risen significantly over the past five years by approximately 10.5%, while the number of statewide convictions and THP-issued citations have fluctuated but remained steady. In conviction and Trooper citation data, age, race, and sex appear to maintain stability in the proportion of each across the study period. There does not appear to be any signs of profiling in the enforcement of this law, based upon age, race, or sex. Background The Tennessee General Assembly passed Chapter 893 of the “Public Acts of 2004” that among other things, changed Tennessee’s safety belt usage law from a “secondary” to a “primary” enforcement law. This change was effective July 1, 2004, and now allows law enforcement officers to stop a vehicle and issue a safety belt ticket to a driver or passenger in a passenger vehicle (up to 8,500 pounds gross vehicle weight rating). Previously, a vehicle had to be stopped and a citation issued for another offense before an officer could issue a ticket for a safety belt violation. Also included in Chapter 893 was an addition to Tennessee Code Annotated § 55-9-603, known as subsection (k), that requires the Tennessee Department of Safety to file an annual report that contains safety belt ticket data for the previous five years. This report must contain safety belt ticket data that includes the age, race, sex, and other information on persons receiving such tickets.
5

The study and report presented here complies with this requirement, but extends beyond the basic information and data analysis. We also reviewed data from the National Highway Traffic Safety Administration’s National Center for Statistics and Analysis, and Tennessee traffic crash data for the previous five years. Moreover, this report contains a section that examines convictions and citations for child restraint devices (CRDs) for the previous five years. Scope and Approach Tennessee does not have a statutorily mandated Uniform Traffic Citation program. This means that traffic tickets issued by local law enforcement officers are not reported to a central state database. The only statewide ticket information available is that of citations issued by the Tennessee Highway Patrol. The Trooper Ticket database contains information on each citation issued by State Troopers. Overall THP citation data for both seat belt and child restraint devices, including data involving age, race, and sex will be included for the five-year period as required in Chapter 893. Due to the lack of a mandated Uniform Traffic Citation, the best source of data on convictions for safety belt violations comes from the Driver History database. It includes convictions, which originate from citations issued by all law enforcement agencies. When drivers are convicted of traffic offenses, court clerks are required to report convictions to the Department of Safety for posting on a driver’s record. The General Assembly authorized TDOS to include any other information deemed relevant to safety belt violations; therefore, this report will examine several other data sources. Information on surveys of safety belt usage rates as reported by NHTSA’s National Center for Statistics and Analysis is included, allowing comparison of usage in Tennessee as compared to other states. Usage of safety belts by occupants of vehicles involved in traffic crashes as reported by law enforcement officers throughout the state is also included as is data on violations involving child restraint devices. Finally, all information contained in the report has been updated and revised with the most recent data available as of March 2008.
6

Convictions


Convictions Reported by Court Clerks to Tennessee Department of Safety
Safety Belt Convictions Safety belt convictions reported by court clerks to the Department of Safety were analyzed to determine the numbers and percentages by occupant type, age, race, and sex.
Safety Belt Convictions Reported by Court Clerks
0
10,000
20,000
30,000
40,000
50,000
60,000
70,000
FY 02-03 FY 03-04 FY 04-05 FY 05-06 FY 06-07
Person Type In each fiscal year from FY 02-03 to FY 06-07, the overwhelming majority of safety belt convictions reported to the Driver History database were for drivers. For purposes of this report, the assumption was made that drivers were ticketed at rates comparable to the convictions. Over the past five years, approximately 96% of safety belt convictions each year were for drivers, with the percentage of convictions for passengers increasing each year from 2.6% in FY 02-03 to 3.8% in FY 06-07 (Table 1). Age Data regarding the age of drivers convicted of safety belt violations shows a relatively normal distribution in FY 06-07, with the majority of drivers (63.4%) convicted falling into the 21-44 years category. There was a slight decrease in the percentage of drivers age 21-44 convicted over the five-year period from 65.5% in FY 02-03 to 63.4% in FY 06-07. Furthermore, drivers between the ages of 15-24 also saw a decrease in convictions, falling from 38.3% in FY 02-03 to 34.4% in FY 06-07. Of adults age 25 and older, drivers between ages 25-34 represented the highest percentage of convictions with an average of approximately 27.9% over the five-year period.
9

Safety Belt Convictions - Drivers Only FY 2006-2007
02,0004,0006,0008,000
10,00012,00014,00016,000
15 Yea
rs an
d Und
er
16 Yea
rs
17 Yea
rs
18 Yea
rs
19 Yea
rs
20 Yea
rs
21-24 Yea
rs
25-34 Year
s
35-44 Year
s
45-54 Year
s
55-64 Year
s
65-74 Year
s
75 Y
ears
and O
lder
Unknow
n
Safety Belt Convictions Reported by Court Clerks
Table 1
Source: FY 02-03 through FY 03-04 - Driver History File - January 11, 2005
FY 02-03 FY 03-04 FY 04-05 FY 05-06 FY 06-07 Driver
15 Years and Under 8 0.04% 6 0.03% 16 0.05% 34 0.07% 35 0.06% 16 Years 148 0.68% 125 0.63% 382 1.24% 375 0.80% 456 0.82% 17 Years 449 2.07% 369 1.87% 671 2.19% 818 1.74% 927 1.66% 18 Years 843 3.88% 860 4.35% 1,853 6.04% 2,358 5.02% 2,672 4.79% 19 Years 1,307 6.02% 1,233 6.24% 1,928 6.28% 2,456 5.23% 2,902 5.20% 20 Years 1,293 5.95% 1,153 5.84% 1,785 5.81% 2,338 4.98% 2,681 4.81%
21-24 Years 4,273 19.67% 3,818 19.33% 5,805 19.33% 7,960 16.96% 9,526 17.08% 25-34 Years 6,277 28.89% 5,580 28.24% 8,221 26.78% 13,424 28.60% 15,625 28.02% 35-44 Years 3,685 16.96% 3,450 17.46% 5,244 17.08% 8,394 17.88% 10,221 18.33% 45-54 Years 2,093 9.63% 1,882 9.53% 3,002 9.78% 5,199 11.08% 6,503 11.66% 55-64 Years 945 4.35% 948 4.80% 1,307 4.26% 2,419 5.15% 3,044 5.46% 65-74 Years 325 1.50% 257 1.30% 374 1.22% 669 1.43% 928 1.66%
75 Years and Older 79 0.36% 75 0.38% 1 0.00% 344 0.73% 68 0.12% Unknown 0 0.00% 0 0 110 0.36% 148 0.32% 183 0.33%
Total 21,725 100% 19,756 100% 30,699 100% 46,936 100% 55,771 100% Passenger
15 Years and Under 0 0.00% 1 0.14% 6 0.41% 67 1.57% 15 0.67% 16 Years 28 4.88% 22 3.13% 112 7.75% 656 15.38% 245 10.97% 17 Years 78 13.59% 63 8.97% 171 11.83% 984 23.08% 349 15.63% 18 Years 97 16.90% 67 9.54% 112 7.75% 246 5.77% 150 6.72% 19 Years 54 9.41% 59 8.40% 105 7.26% 205 4.81% 120 5.37% 20 Years 38 6.62% 39 5.56% 82 5.67% 196 4.60% 117 5.24%
21-24 Years 93 16.20% 115 16.38% 253 17.50% 513 12.03% 344 15.41% 25-34 Years 83 14.46% 184 26.21% 297 20.54% 678 15.90% 403 18.05% 35-44 Years 60 10.45% 75 10.68% 174 12.03% 391 9.17% 279 12.49% 45-54 Years 30 5.23% 52 7.41% 93 6.43% 202 4.74% 145 6.49% 55-64 Years 12 2.09% 17 2.42% 34 2.35% 69 1.62% 47 2.10% 65-74 Years 0 0.00% 7 1.00% 6 0.41% 10 0.23% 16 0.72%
75 Years and Older 1 0.17% 1 0.14% 0 0.00% 32 0.75% 1 0.04% Unknown 0 0.00% 0 0.00% 1 0.07% 15 0.35% 2 0.09%
Total 574 100% 702 100% 1,446 100% 4,264 100% 2,233 100% Overall Total 22,299 20,458 32,145 51,200 58,004
FY 04-05 - Driver History File - March 28, 2006 FY 05-06 - FY 06-07 - Driver History File - February 29, 2008
10
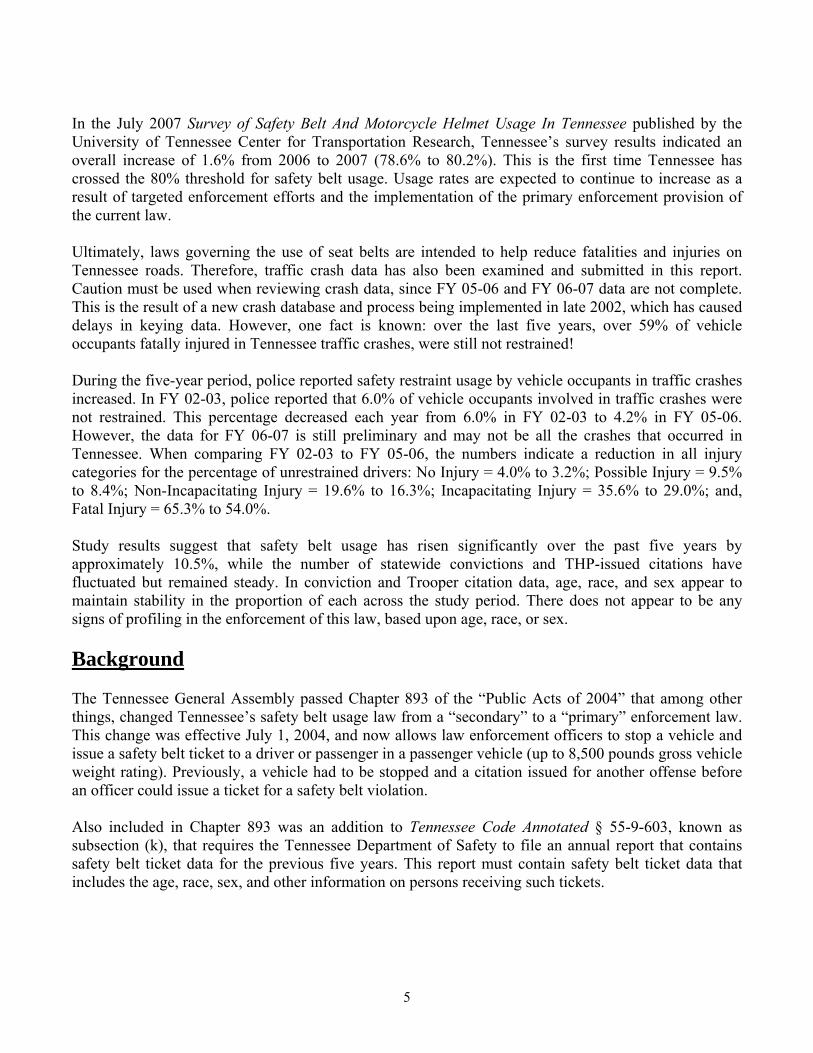
Sex and Race The majority of all convictions reported to the Department were males. In FY 06-07, males represented an average of 72% of the drivers convicted, and 63.4% of the passengers. The chart below illustrates the percentage of males versus females for all convictions reported, both drivers and passengers. Conviction data indicating driver and passenger ethnicity and gender can be found in Table 2.
Percentage of Safety Belt Convictions By Sex
29.5% 29.3% 28.9% 25.4% 27.8%
69.9% 70.1% 70.4% 74.3% 71.6%
FY 02-03 FY 03-04 FY 04-05 FY 05-06 FY 06-07
Female Male
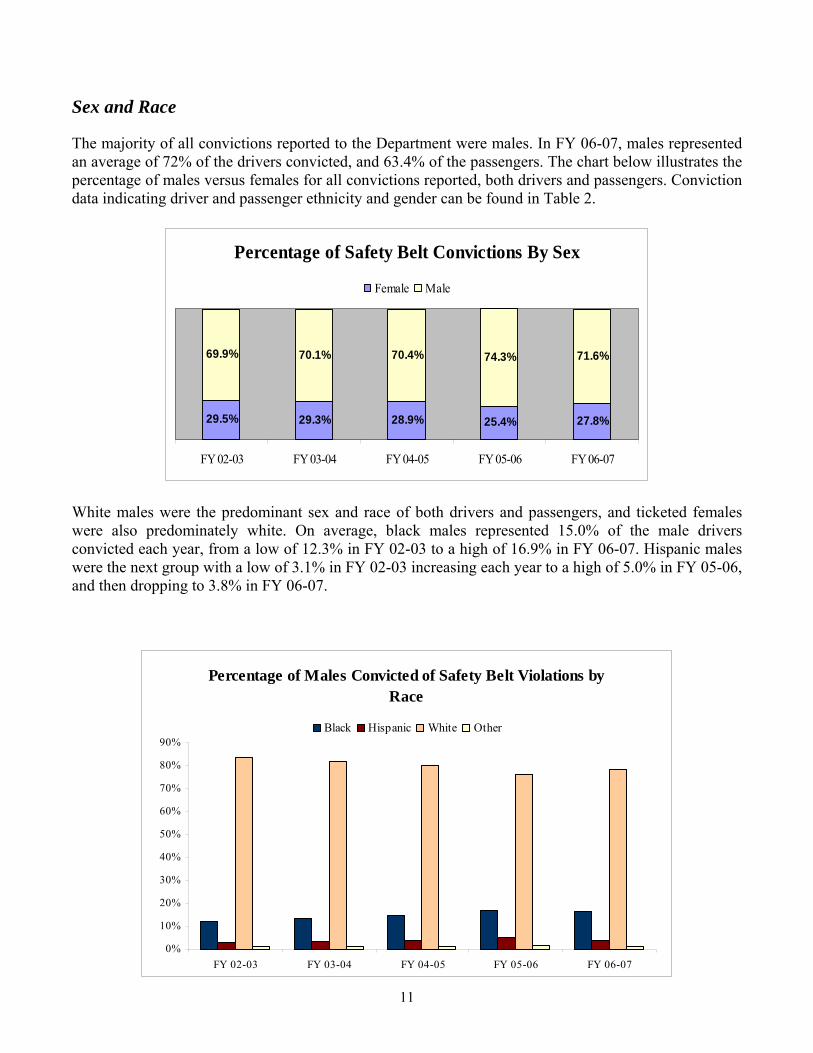
White males were the predominant sex and race of both drivers and passengers, and ticketed females were also predominately white. On average, black males represented 15.0% of the male drivers convicted each year, from a low of 12.3% in FY 02-03 to a high of 16.9% in FY 06-07. Hispanic males were the next group with a low of 3.1% in FY 02-03 increasing each year to a high of 5.0% in FY 05-06, and then dropping to 3.8% in FY 06-07.
Percentage of Males Convicted of Safety Belt Violations by Race
0%
10%
20%
30%
40%
50%
60%
70%
80%
90%
FY 02-03 FY 03-04 FY 04-05 FY 05-06 FY 06-07
Black Hispanic White Other
11

These percentages may reflect the growing number of Hispanic and black males of driving age in the state of Tennessee. Population projections from the Tennessee Department of Health show that these two groups are rising as a percentage of the population, while the percentage of white males is decreasing slightly.
Population Trend for Whites of Driving Age 2003 - 2007
80%
81%
82%
83%
84%
2003 2004 2005 2006 2007
Population Trend for Blacks of Driving Age 2003 - 2007
14%
15%
16%
17%
18%
2003 2004 2005 2006 2007
Population Trend for Hispanics of Driving Age 2003 - 2007
0%
1%
2%
3%
4%
2003 2004 2005 2006 2007
White females represented 82.3% of the female drivers convicted over the last five years, with black females averaging 15.1%. The percentages of white, black, and Hispanic females convicted of safety belt violations all remained relatively consistent for the five-year period.
Percentage of Females Convicted of Safety Belt Violations by Race
0%
10%
20%
30%
40%
50%
60%
70%
80%
90%
FY 02-03 FY 03-04 FY 04-05 FY 05-06 FY 06-07
Black Hispanic White Other
12

Safety Belt Convictions Reported By Court Clerks by Type, Sex, and Race Table 2
Source: FY 01-02 through FY 03-04 - Driver History File - January 11, 2005
FY 02-03 FY 03-04 FY 04-05 FY 05-06 FY 06-07 Drivers
Female 6,390 29.4% 5,735 29.0% 8,816 28.7% 11,892 24.8% 15,353 27.5% Asian 17 0.3% 22 0.4% 26 0.3% 7 0.1% 46 0.3% Black 877 13.7% 825 14.4% 1,253 14.2% 1,012 8.5% 2,590 16.9%
Hispanic 67 1.0% 70 1.2% 118 1.3% 102 0.9% 240 1.6% Indian 13 0.2% 17 0.3% 13 0.1% 1 0.0% 23 0.1% White 5,394 84.4% 4,777 83.3% 7,366 83.6% 10,676 89.8% 12,361 80.5% Other 22 0.3% 24 0.4% 40 0.5% 94 0.8% 93 0.6%
Male 15,201 70.0% 13,897 70.3% 21,691 70.7% 35,882 74.9% 40,138 72.0% Asian 62 0.4% 57 0.4% 118 0.5% 67 0.2% 209 0.5% Black 1,870 12.3% 1,905 13.7% 3,227 14.9% 3,157 8.8% 6,766 16.9%
Hispanic 469 3.1% 487 3.5% 845 3.9% 1,406 3.9% 1,516 3.8% Indian 29 0.2% 31 0.2% 43 0.2% 15 0.0% 68 0.2% White 12,683 83.4% 11,329 81.5% 17,362 80.0% 30,764 85.7% 31,297 78.0% Other 88 0.6% 88 0.6% 96 0.4% 473 0.6% 282 0.7%
Unknown Sex 134 124 192 127 279 Total 21,725 19,756 30,699 47,901 55,770
Passengers Female 192 33.4% 255 36.3% 486 33.6% 1,356 31.6% 794 35.6%
Asian 1 0.5% 1 0.4% 6 1.2% 1 0.1% 3 0.4% Black 23 12.0% 22 8.6% 53 10.9% 96 7.1% 67 8.4%
Hispanic 3 1.6% 1 0.4% 4 0.8% 14 1.0% 9 1.1% Indian 0 0.0% 1 0.4% 1 0.2% 0 0.0% 1 0.1% White 162 84.4% 225 88.2% 419 86.2% 1,230 90.7% 713 89.8% Other 3 1.6% 5 2.0% 3 0.6% 15 1.1% 1 0.1%
Male 376 65.5% 445 63.4% 948 65.6% 2,905 67.8% 1,415 63.4% Asian 5 1.3% 3 0.7% 7 0.7% 3 0.1% 7 0.5% Black 32 8.5% 50 11.2% 118 12.4% 208 7.2% 140 9.9%
Hispanic 12 3.2% 14 3.1% 54 5.7% 115 4.0% 45 3.2% Indian 2 0.5% 1 0.2% 1 0.1% 0 0.0% 4 0.3% White 324 86.2% 376 84.5% 761 80.3% 2,534 87.2% 1,206 85.2% Other 1 0.3% 1 0.2% 7 0.7% 45 1.5% 13 0.9%
Unknown Sex 6 2 12 26 22 Total 574 702 1,446 4,287 2,231
FY 04-05 - Driver History File - March 28, 2006 FY 05-06 - FY 06-07 - Driver History File - February 29, 2008
13


Child Restraint Convictions Child restraint device (CRD) convictions reported by the court clerks to the Department of Safety were also analyzed to determine the numbers and percentages by age, race, and sex.
Child Restraint Device Convictions Reported by Court Clerks
0
1,000
2,000
3,000
4,000
5,000
6,000
FY 02-03 FY 03-04 FY 04-05 FY 05-06 FY 06-07
Type Violations of CRD law (TCA § 55-9-602) are divided into two categories: (1) violations involving children three years of age and younger, and (2) violations involving children ages four through fifteen. In each year, more convictions were reported for violations involving children three years of age and younger, with the percentage of convictions for this group increasing from 52.6% in FY 02-03 to 69.3% in FY 06-07.
Child Restraint Device Convictions Reported by Type
47.4% 45.0% 38.1%57.9%
30.7%
52.6% 55.0% 61.9%42.1%
69.3%
0%
20%
40%
60%
80%
100%
FY 02-03 FY 03-04 FY 04-05 FY 05-06 FY 06-07
CRD Co nvict ion s - Ag es 4 t hr oug h 15 CRD Co nv ict ion s - Ag e 3 and Un der
15

Age In the past five fiscal years, an average of 69% of drivers convicted for CRD violations – ages 4 through 15 were between the ages 20 and 39, and an average of 74.6% of drivers convicted for CRD violations – ages 3 and under also fell into this age group. For drivers between the ages 20-39, convictions for CRD violations rose from 70.3% in FY 02-03 to 74% in FY 06-07. There was a marked decrease, however, in the percentage of drivers age 30-39 convicted over the five-year period from 30.8% in FY 02-03 to 26% in FY 06-07. That this age group represents the majority of convictions for CRD convictions is not surprising, as this is the age group during which most adults begin families, and would therefore be transporting children.
CRD Convictions - Age 3 and Under FY 2006-2007
0
500
1,000
1,500
2,000
?15-
19Y
ears
20-2
9Y
ears
30-3
9Y
ears
40-4
9Y
ears
50-5
9Y
ears
60-6
9Y
ears
70 Y
ears
and
Old
er
Unk
now
n
CRD Convictions - Ages 4 - 15 FY 2006-2007
0
200
400
600
800
?15-
19Y
ears
20-2
9Y
ears
30-3
9Y
ears
40-4
9Y
ears
50-5
9Y
ears
60-6
9Y
ears
70 Y
ears
and
Old
er
Unk
now
n
16

Child Restraint Device Convictions Reported by Driver Age Table 3
Source: Driver History February 29, 2008
FY 02-03 FY 03-04 FY 04-05 FY 05-06 FY06-07
CRD Convictions - Ages 4 through 15 ≤15-19 Years 130 6.54% 130 7.95% 99 7.57% 286 8.93% 86 5.73%
20-29 Years 623 31.32% 512 31.31% 465 35.58% 1,165 36.39% 623 41.48% 30-39 Years 714 35.90% 590 36.09% 443 33.89% 1,067 33.33% 462 30.76% 40-49 Years 331 16.64% 254 15.54% 195 14.92% 436 13.62% 211 14.05% 50-59 Years 116 5.83% 101 6.18% 68 5.20% 162 5.06% 80 5.33% 60-69 Years 63 3.17% 42 2.57% 30 2.30% 58 1.81% 35 2.33%
70 Years and Older 8 0.40% 4 0.24% 5 0.38% 19 0.59% 5 0.33% Unknown 4 0.20% 2 0.12% 2 0.15% 8 0.25% 0 0.00%
Total 1,989 47.42% 1,635 44.98% 1,307 38.06% 3,201 57.86% 1,502 30.67% CRD Convictions - Age 3 and Under
≤15-19 Years 157 7.12% 160 8.00% 149 7.01% 170 7.29% 263 7.74% 20-29 Years 1,036 46.98% 950 47.50% 1,031 48.47% 1,164 49.94% 1,729 50.91% 30-39 Years 577 26.17% 507 25.35% 562 26.42% 560 24.02% 810 23.85% 40-49 Years 287 13.02% 232 11.60% 260 12.22% 270 11.58% 388 11.43% 50-59 Years 99 4.49% 95 4.75% 91 4.28% 113 4.85% 133 3.92% 60-69 Years 44 2.00% 40 2.00% 27 1.27% 38 1.63% 59 1.74%
70 Years and Older 3 0.14% 11 0.55% 3 0.14% 8 0.34% 12 0.35% Unknown 2 0.09% 5 0.25% 4 0.19% 8 0.34% 2 0.06%
Total 2,205 52.58% 2,000 55.02% 2,127 61.94% 2,331 42.14% 3,396 69.33%
FY Total 4,194 3,635 3,434 5,532 4,898
Sex and Race Unlike safety belt convictions, the majority of all CRD convictions reported to the Department of Safety were females. In FY 06-07, females represented nearly 59% of all CRD convictions reported. The chart below illustrates the percentage of males versus females for all convictions reported.
CRD Convictions by Sex
58.5% 58.5% 55.7% 55.2% 58.6%
40.7% 40.5% 43.1% 44.7% 40.3%
0%10%20%30%40%50%60%70%80%90%
100%
FY 02-03 FY 03-04 FY 04-05 FY 05-06 FY 06-07
Female Male
17

Both male and female violators of the CRD laws were predominately white. As was reported with safety belt convictions, the percentage of both black and Hispanic drivers convicted for CRD violations has shown a slight increase over the five-year period.
Males Convicted of CRD Violations by Race
0%
10%
20%
30%
40%
50%
60%
70%
FY 02-03 FY 03-04 FY 04-05 FY 05-06 FY 06-07
Black Hispanic White Other
Females Convicted of CRD Violations by Race
0%
10%
20%
30%
40%
50%
60%
70%
80%
FY 02-03 FY 03-04 FY 04-05 FY 05-06 FY 06-07
Black Hispanic White Other
18

CRD Convictions Reported by Type, Sex, and Race
Table 4
FY 02-03 FY 03-04 FY 04-05 FY 05-06 FY 06-07 CRD Convictions - Ages 4-15
Female 1,158 58.2% 956 58.5% 713 54.6% 1,719 53.8% 827 55.5%
Black 234 20.2% 212 22.2% 157 22.0% 320 18.6% 236 28.5%
Hispanic 30 2.6% 29 3.0% 29 4.1% 40 2.3% 45 5.4%
White 876 75.6% 701 73.3% 516 72.4% 1,345 78.2% 529 64.0%
Other 18 1.6% 14 1.5% 11 1.5% 14 0.8% 17 2.1%
Male 824 41.4% 669 40.9% 581 44.5% 1,474 46.2% 654 43.9%
Black 124 15.0% 92 13.8% 95 16.4% 179 12.1% 112 17.1%
Hispanic 68 8.3% 55 8.2% 61 10.5% 129 8.8% 103 15.7%
White 610 74.0% 500 74.7% 408 70.2% 1,125 76.3% 426 65.1%
Other 22 2.7% 22 3.3% 17 2.9% 41 2.8% 13 2.0%
Unknown Sex 7 10 13 0 10
Total 1,989 1,635 1,307 3,193 1,491
CRD Convictions - Age 3 and Under
Female 1,297 58.8% 1,171 58.5% 1,200 56.4% 1,330 57.1% 2,039 60.0%
Black 453 34.9% 415 35.4% 392 32.7% 353 26.5% 879 43.1%
Hispanic 48 3.7% 46 3.9% 73 6.1% 51 3.8% 104 5.1%
White 775 59.8% 687 58.7% 718 59.8% 907 68.2% 1,025 50.3%
Other 21 1.6% 23 2.0% 17 1.4% 19 1.4% 31 1.5%
Male 885 40.1% 805 40.2% 900 42.3% 994 42.7% 1,317 38.8%
Black 216 24.4% 180 22.4% 213 23.7% 193 19.4% 414 31.4%
Hispanic 144 16.3% 143 17.8% 174 19.3% 143 14.4% 214 16.2%
White 501 56.6% 466 57.9% 496 55.1% 631 63.5% 653 49.6%
Other 24 2.7% 16 2.0% 17 1.9% 27 2.7% 36 2.7%
Unknown Sex 23 27 27 4 40
Total 2,205 2,003 2,127 2,328 3,396 Source: Driver History File – February 29, 2008
19


Citations


Citations Issued by the Tennessee Highway Patrol (THP) THP-Issued Citations for Safety Belt Violations The chart below illustrates the number of safety belt citations issued by the THP over the last five years. Over the last five fiscal years, there was a significant increase in the number of safety belt citations issued. This increase can be attributed to the new “primary” use law that became effective July 1, 2004.
Safety Belt Citations Issued by THP
0
10,000
20,000
30,000
40,000
50,000
60,000
FY 02-03 FY 03-04 FY 04-05 FY 05-06 FY 06-07
THP Citations Issued for Safety Belt Violations By Person Type and Age
Table 5 FY 02-03 FY 03-04 FY 04-05 FY 05-06 FY 06-07
Driver15 Years and Under 88 0.3% 83 0.3% 80 0.2% 40 0.1% 29 0.1%
16 Years 525 1.8% 473 1.7% 554 1.2% 426 0.9% 342 0.9% 17 Years 972 3.3% 757 2.7% 1,106 2.4% 882 1.8% 619 1.5% 18 Years 1,495 5.1% 1,472 5.2% 2,366 5.2% 2,356 4.9% 1,946 4.9% 19 Years 1,573 5.4% 1,523 5.4% 2,529 5.6% 2,433 5.1% 2,069 5.2% 20 Years 1,643 5.6% 1,420 5.1% 2,223 4.9% 2,336 4.9% 1,893 4.7%
21-24 Years 5,305 18.2% 5,210 18.5% 7,907 17.4% 7,940 16.6% 6,503 16.3% 25-34 Years 8,186 28.1% 8,036 28.6% 12,689 27.9% 13,364 28.0% 11,217 28.1% 35-44 Years 4,975 17.0% 4,852 17.3% 8,217 18.1% 9,159 19.2% 7,654 19.1% 45-54 Years 2,637 9.0% 2,485 8.8% 4,742 10.4% 5,181 10.9% 4,718 11.8% 55-64 Years 1,151 3.9% 1,137 4.0% 1,974 4.3% 2,414 5.1% 2,069 5.2% 65-74 Years 387 1.3% 325 1.2% 612 1.3% 666 1.4% 592 1.5%
75 Years and Older 141 0.5% 160 0.6% 225 0.5% 276 0.6% 239 0.6% Unknown 103 0.4% 162 0.6% 240 0.5% 219 0.5% 96 0.2%
Total 29,181 28,095 45,464 47,692 39,986 Passenger
15 Years and Under 9 1.3% 17 1.8% 53 1.7% 56 1.4% 65 1.8% 16 Years 107 14.9% 136 14.7% 503 15.9% 595 15.0% 636 18.0% 17 Years 137 19.1% 217 23.4% 651 20.6% 900 22.7% 891 25.2% 18 Years 58 8.1% 67 7.2% 217 6.9% 238 6.0% 190 5.4% 19 Years 47 6.5% 43 4.6% 148 4.7% 200 5.0% 146 4.1% 20 Years 37 5.1% 45 4.8% 152 4.8% 182 4.6% 115 3.2%
21-24 Years 89 12.4% 94 10.1% 398 12.6% 484 12.2% 389 11.0% 25-34 Years 95 13.2% 135 14.5% 468 14.8% 633 16.0% 523 14.8% 35-44 Years 75 10.4% 97 10.5% 299 9.5% 362 9.1% 329 9.3% 45-54 Years 47 6.5% 50 5.4% 168 5.3% 192 4.8% 159 4.5% 55-64 Years 15 2.1% 16 1.7% 58 1.8% 67 1.7% 55 1.6% 65-74 Years 1 0.1% 2 0.2% 13 0.4% 30 0.8% 22 0.6%
75 Years and Older 0 0.0% 2 0.2% 2 0.1% 4 0.1% 13 0.4% Unknown 2 0.3% 7 0.8% 26 0.8% 20 0.5% 6 0.2%
Total 719 928 3,156 3,963 3,539 Overall Total 29,900 29,023 48,620 51,655 43,525
Source: Trooper Ticket File 28 Feb 2008.
23

Person Type THP citations followed the statewide conviction pattern with the overwhelming majority issued to drivers. Over the five year period, drivers received almost of 94% of all THP citations issued. However, when comparing FY 03-04 and FY 04-05, the percentage of citations issued to passengers more than doubled, from 3.2% to 6.5% and continued to increase, reaching 8.1% in FY 06-07. Again, this can be attributed to the new safety belt legislation which became effective July 1, 2004. The graphs below illustrate the trends for citations issued by THP over the past five years based on the type of safety belt violation.
Adult Driver Riding Improperly Restrained (117)
010,00020,00030,00040,00050,000
FY02-03 FY 03-04 FY 04-05 FY 05-06 FY 06-07
Adult Passenger Riding Improperly Restrained (118)
0500
1,0001,5002,0002,500
FY02-03 FY 03-04 FY 04-05 FY 05-06 FY 06-07
Drivers Or Passengers 16 - 17 Years Old Riding Improperly Restrained (129/130)
0500
1,0001,500
2,000
FY02-03 FY 03-04 FY 04-05 FY 05-06 FY 06-07
Drivers With A Learner's Permit or Intermediate License Allow ing Minors Age 4 - 16 To Ride
Improperly Restrained (119)
050
100150200
FY 05-06 FY 06-07
24

Age Similar to the pattern of convictions in each of the last five years, over 63% of the drivers issued safety belt citations in FY 06-07 by THP were between the ages of 21-44. Drivers between the ages of 15-24 saw an 18% decrease in the number of citations issued by THP from 16,413 in FY 05-06 to 13,401 in FY 06-07. Of drivers age 25 and older, those between ages 25-34 were issued over 28% of the citations, more than any other age group.
Safety Belt Citations Issued by THP FY 2006-2007
0
2,000
4,000
6,000
8,000
10,000
12,000
14,000
15 Y
ears
and
Und
er
16 Y
ears
17 Y
ears
18 Y
ears
19 Y
ears
20 Y
ears
21-2
4 Y
ears
25-3
4 Y
ears
35-4
4 Y
ears
45-5
4 Y
ears
55-6
4 Y
ears
65-7
4 Y
ears
75 Y
ears
and
Old
er
Unk
now
n
Sex and Race Males accounted for more than 70% of the drivers ticketed, increasing slightly from 74.9% in FY 02-03 to 75.1% in FY 06-07. Table 6 on the next page shows the numbers and percentages of THP citations for safety belt violations by type, sex, and race. Of the male drivers receiving citations from Troopers, white males received almost 85% over the five-year period, black males received 9.4%, and Hispanic males received 3.9%. Of the female drivers receiving citations from Troopers, white females received 89.6% over the five-year period, black females received 8.6%, and Hispanic females received 0.7%.
Percentage of THP Safety Belt Citations Issued to Male Drivers by Race
0%
10%
20%
30%
40%
50%
60%
70%
80%
90%
100%
FY02-03 FY 03-04 FY 04-05 FY 05-06 FY 06-07
White Black Hispanic Other
25

THP-Issued Safety Belt Citations By Type, Sex, and Race
Table 6
FY 02-03 FY 03-04 FY 04-05 FY 05-06 FY 06-07 Drivers
Female 7,305 25.0% 6,890 24.5% 11,162 24.6% 11,863 24.9% 9,938 24.9% Asian 16 0.2% 5 0.1% 9 0.1% 7 0.1% 8 0.1% Black 677 9.3% 704 10.2% 944 8.5% 1,015 8.6% 757 7.6%
Hispanic 58 0.8% 56 0.8% 76 0.7% 65 0.5% 75 0.8% Indian 4 0.1% 2 0.0% 3 0.0% 1 0.0% 1 0.0% White 6,463 88.5% 6,050 87.8% 9,994 89.5% 10,679 90.0% 9,021 90.8% Other 87 1.2% 73 1.1% 136 1.2% 96 0.8% 76 0.8%
Male 21,859 74.9% 21,178 75.4% 34,268 75.4% 35,768 75.0% 30,016 75.1% Asian 63 0.3% 20 0.1% 51 0.1% 67 0.2% 36 0.1% Black 2,103 9.6% 2,241 10.6% 3,486 10.2% 3,153 8.8% 2,514 8.4%
Hispanic 906 4.1% 907 4.3% 1,448 4.2% 1,393 3.9% 866 2.9% Indian 5 0.0% 4 0.0% 12 0.0% 15 0.0% 10 0.0% White 18,430 84.3% 17,573 83.0% 28,615 83.5% 30,663 85.7% 26,320 87.7% Other 352 1.6% 433 2.0% 656 1.9% 477 1.3% 270 0.9%
Unknown Sex 17 27 34 61 32 Total Drivers 29,181 28,095 45,464 47,692 39,986
Passengers Female 224 31.2% 286 30.8% 1,015 32.2% 1,252 31.6% 1,055 29.8%
Asian 4 1.8% 0 0.0% 2 0.2% 1 0.1% 0 0.0% Black 16 7.1% 26 9.1% 85 8.4% 87 6.9% 60 5.7%
Hispanic 3 1.3% 0 0.0% 10 1.0% 11 0.9% 6 0.6% Indian 0 0.0% 0 0.0% 0 0.0% 0 0.0% 0 0.0% White 195 87.1% 250 87.4% 898 88.5% 1,138 90.9% 980 92.9% Other 6 2.7% 10 3.5% 20 2.0% 15 1.2% 9 0.9%
Male 495 68.8% 642 69.2% 2,137 67.7% 2,707 68.3% 2,481 70.1% Asian 12 2.4% 2 0.3% 7 0.3% 3 0.1% 3 0.1% Black 31 6.3% 48 7.5% 216 10.1% 197 7.3% 168 6.8%
Hispanic 24 4.8% 22 3.4% 110 5.1% 108 4.0% 82 3.3% Indian 0 0.0% 0 0.0% 0 0.0% 0 0.0% 0 0.0% White 417 84.2% 548 85.4% 1,755 82.1% 2,356 87.0% 2,207 89.0% Other 11 2.2% 22 3.4% 49 2.3% 43 1.6% 21 0.8%
Unknown Sex 0 0 4 4 3 Total Passengers 719 928 3,156 3,963 3,539 Total Citations 29,900 29,023 48,620 51,655 43,525
Source: Trooper Ticket File 28 Feb 2008
26

THP-Issued Citations for Child Restraint Device (CRD) Violations The graph below illustrates the number of CRD citations issued by the THP over the last five years. The graph shows that CRD citations issued by THP have steadily decreased since FY 04-05.
Child Restraint Device Citations Issued by Tennessee Highway Patrol
01,0002,0003,0004,0005,0006,0007,000
FY 02-03 FY 03-04 FY 04-05 FY 05-06 FY 06-07
Table 7 shows the number of THP citations issued by type (3 years of age and under/4-15 years of age) and age.
THP-Issued Child Restraint Device Citations Table 7
FY 02-03 FY 03-04 FY 04-05 FY 05-06 FY 06-07
CRD Citations - Ages 4 through 15 ≤15-19 Years 174 7.87% 171 8.58% 304 9.51% 286 9.01% 216 8.71%
20-29 Years 693 31.33% 662 33.22% 1,120 35.03% 1,154 36.35% 858 34.58% 30-39 Years 791 35.76% 687 34.47% 1,085 33.94% 1,067 33.61% 830 33.45% 40-49 Years 312 14.10% 289 14.50% 438 13.70% 427 13.45% 350 14.11% 50-59 Years 156 7.05% 111 5.57% 157 4.91% 158 4.98% 137 5.52% 60-69 Years 68 3.07% 43 2.16% 66 2.06% 58 1.83% 70 2.82%
70 Years and Older 17 0.77% 28 1.40% 24 0.75% 17 0.54% 19 0.77% Unknown 1 0.05% 2 0.10% 3 0.09% 8 0.25% 1 0.04%
Total 2,212 53.95% 1,993 51.46% 3,197 55.85% 3,175 58.12% 2,481 57.66%
CRD Citations - Age 3 and Under ≤15-19 Years 140 7.42% 141 7.50% 174 6.89% 166 7.26% 151 8.29%
20-29 Years 907 48.04% 946 50.32% 1227 48.56% 1136 49.65% 896 49.18% 30-39 Years 480 25.42% 478 25.43% 670 26.51% 552 24.13% 471 25.85% 40-49 Years 216 11.44% 188 10.00% 311 12.31% 268 11.71% 197 10.81% 50-59 Years 87 4.61% 65 3.46% 88 3.48% 112 4.90% 74 4.06% 60-69 Years 44 2.33% 36 1.91% 22 0.87% 38 1.66% 16 0.88%
70 Years and Older 12 0.64% 26 1.38% 28 1.11% 8 0.35% 16 0.88% Unknown 2 0.11% 0 0.00% 7 0.28% 8 0.35% 1 0.05%
Total 1,888 46.05% 1,880 48.54% 2,527 44.15% 2,288 41.88% 1,822 42.34% FY Total 4,100 3,873 5,724 5,463 4,303
Source: Trooper Ticket File 28 Feb 2008.
27

Type Unlike convictions reported by court clerks, CRD citations issued by THP were nearly split in half by type, with citations involving children ages 4-15 as a slight majority of the citations issued in FY 06-07. The graph below illustrates the trends for citations issued by THP over the past five years based on the type of CRD violation.
THP-Issued CRD Citations by Type
0500
1,0001,5002,0002,5003,0003,500
FY 02-03 FY 03-04 FY 04-05 FY 05-06 FY 06-07
Child Restraint Violations - Ages 4 through 15Child Restraint Violations - Age 3 and Under
Age Similar to the pattern of convictions, over the last five years, 71% of the drivers issued CRD citations by THP were between the ages of 20-39. This is plausible, as this age group is the most likely to have children of an age to require use of child restraint devices. Drivers age 20-29 comprised almost half of the citations issued involving children age 3 and under.
CRD Citations - Ages 4 - 15 FY 2006-2007
0200400600
8001,000
≤15-
19Y
ears
20-2
9Y
ears
30-3
9Y
ears
40-4
9Y
ears
50-5
9Y
ears
60-6
9Y
ears
70 Y
ears
and
Old
er
Unk
now
n
CRD Citations - Age 3 and Under FY 2006-2007
0200
400600
8001000
≤15-
19Y
ears
20-2
9Y
ears
30-3
9Y
ears
40-4
9Y
ears
50-5
9Y
ears
60-6
9Y
ears
70 Y
ears
and
Old
er
Unk
now
n
28

Sex and Race Following a pattern similar to CRD convictions, THP issued slightly more citations to females than males for violations involving child restraints. In FY 06-07, females represented a little over 56% of all CRD citations issued. The first graph below illustrates the percentage of males vs. females for all citations issued. Of females ticketed, white females accounted for an annual average of 75.9% over the five-year period, black females about 20%, and Hispanic females 2.6%. The percentages of drivers cited for CRD violations has remained relatively constant among racial and gender categories. Table 8 on the next page shows citations issued by type, sex, and race.
CRD Citations by Sex
55.8% 55.6% 52.9% 55.2% 56.2%
44.2% 44.3% 47.0% 44.6% 43.6%
0%
20%
40%
60%
80%
100%
FY 02-03 FY 03-04 FY 04-05 FY 05-06 FY 06-07
Female Male
Males Cited By THP for CRD Violations By Race
0%
20%
40%
60%
80%
FY 02-03 FY 03-04 FY 04-05 FY 05-06 FY 06-07
Black Hispanic White Other
Females Cited By THP for CRD Violations By Race
0%
20%
40%
60%
80%
FY 02-03 FY 03-04 FY 04-05 FY 05-06 FY 06-07
Black Hispanic White Other
29
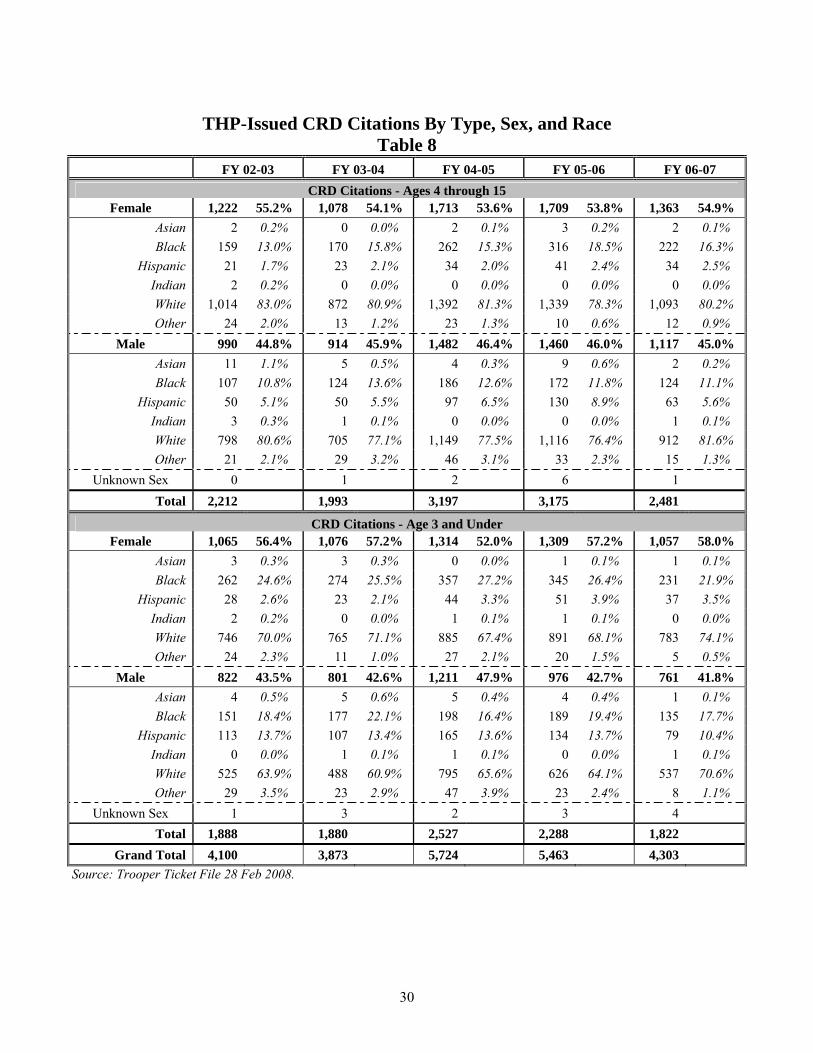
THP-Issued CRD Citations By Type, Sex, and Race
Table 8 FY 02-03 FY 03-04 FY 04-05 FY 05-06 FY 06-07
CRD Citations - Ages 4 through 15 Female 1,222 55.2% 1,078 54.1% 1,713 53.6% 1,709 53.8% 1,363 54.9%
Asian 2 0.2% 0 0.0% 2 0.1% 3 0.2% 2 0.1% Black 159 13.0% 170 15.8% 262 15.3% 316 18.5% 222 16.3%
Hispanic 21 1.7% 23 2.1% 34 2.0% 41 2.4% 34 2.5% Indian 2 0.2% 0 0.0% 0 0.0% 0 0.0% 0 0.0% White 1,014 83.0% 872 80.9% 1,392 81.3% 1,339 78.3% 1,093 80.2% Other 24 2.0% 13 1.2% 23 1.3% 10 0.6% 12 0.9%
Male 990 44.8% 914 45.9% 1,482 46.4% 1,460 46.0% 1,117 45.0% Asian 11 1.1% 5 0.5% 4 0.3% 9 0.6% 2 0.2% Black 107 10.8% 124 13.6% 186 12.6% 172 11.8% 124 11.1%
Hispanic 50 5.1% 50 5.5% 97 6.5% 130 8.9% 63 5.6% Indian 3 0.3% 1 0.1% 0 0.0% 0 0.0% 1 0.1% White 798 80.6% 705 77.1% 1,149 77.5% 1,116 76.4% 912 81.6% Other 21 2.1% 29 3.2% 46 3.1% 33 2.3% 15 1.3%
Unknown Sex 0 1 2 6 1 Total 2,212 1,993 3,197 3,175 2,481
CRD Citations - Age 3 and Under Female 1,065 56.4% 1,076 57.2% 1,314 52.0% 1,309 57.2% 1,057 58.0%
Asian 3 0.3% 3 0.3% 0 0.0% 1 0.1% 1 0.1% Black 262 24.6% 274 25.5% 357 27.2% 345 26.4% 231 21.9%
Hispanic 28 2.6% 23 2.1% 44 3.3% 51 3.9% 37 3.5% Indian 2 0.2% 0 0.0% 1 0.1% 1 0.1% 0 0.0% White 746 70.0% 765 71.1% 885 67.4% 891 68.1% 783 74.1% Other 24 2.3% 11 1.0% 27 2.1% 20 1.5% 5 0.5%
Male 822 43.5% 801 42.6% 1,211 47.9% 976 42.7% 761 41.8% Asian 4 0.5% 5 0.6% 5 0.4% 4 0.4% 1 0.1% Black 151 18.4% 177 22.1% 198 16.4% 189 19.4% 135 17.7%
Hispanic 113 13.7% 107 13.4% 165 13.6% 134 13.7% 79 10.4% Indian 0 0.0% 1 0.1% 1 0.1% 0 0.0% 1 0.1% White 525 63.9% 488 60.9% 795 65.6% 626 64.1% 537 70.6% Other 29 3.5% 23 2.9% 47 3.9% 23 2.4% 8 1.1%
Unknown Sex 1 3 2 3 4 Total 1,888 1,880 2,527 2,288 1,822
Grand Total 4,100 3,873 5,724 5,463 4,303 Source: Trooper Ticket File 28 Feb 2008.
30

Supplemental Information


Safety Belt Surveys The National Highway Traffic Safety Administration commissions and funds standardized safety belt usage surveys each year in every State and U.S. Territory through the various Governors’ Highway Safety Offices. In Tennessee, the University of Tennessee’s Center for Transportation Research conducts the survey and publishes its findings in Survey of Safety Belt and Motorcycle Helmet Usage In Tennessee. Results of the surveys are analyzed by the National Center for Statistics and Analysis, and then published in the U.S. Department of Transportation’s “Traffic Safety Facts – Crash Stats.” The chart below shows the survey results for Tennessee for calendar years 2003 through 2007. As a result of the primary enforcement provision that went into effect July 1, 2004, there has been an increase in the usage rate from 74.4% in 2005 to 80.2% in 2007, and this trend is expected to continue. Copies of the above-referenced publications can be found as attachments.
2003 2004 2005 20062007
68.5%72.0% 74.4% 78.6% 80.2%
Tennessee Safety Belt Usage Rates
33

Tennessee Traffic Crashes During the five-year period, police reported safety restraint usage by vehicle occupants in traffic crashes increased. In FY 02-03, police reported that 6.0% of vehicle occupants involved in traffic crashes were not restrained. This percentage decreased significantly over the years to 4.2% in FY 06-07. When comparing FY 02-03 to FY 06-07, the numbers indicate a significant reduction in all injury categories for the percentage of unrestrained drivers: No Injury = 4.0% to 2.5%; Possible Injury = 9.5% to 7.9%; Non-Incapacitating Injury = 19.6% to 17.9%; Incapacitating Injury = 35.6% to 29.6%; and, Fatal Injury = 65.3% to 55.6%. Overall, over the past five years the statistics show a continuing increase in safety restraint usage by vehicle occupants involved in traffic crashes (Table 9).
Percentage of Unrestrained Occupants In Tennessee Traffic Crashes by Injury Severity
0%
10%
20%
30%
40%
50%
60%
70%
FY 02-03 FY 03-04 FY 04-05 FY 05-06 FY 06-07
Fatal Injury Incapacitating Injury Non-Incapacitating InjuryPossible Injury No Injury
34

Vehicle Occupant Restraint Usage in Traffic Crashes By Injury Severity Table 9
FY 02-03 FY 03-04 FY 04-05 FY 05-06 FY 06-07 Total
No Injury
No Restraint 11,851 4.0% 11,183 4.2% 13,242 3.4% 12,097 3.2% 8,345 2.5% 56,718 3.4%
Restraint 284,473 96.0% 257,781 95.8% 380,816 96.6% 370,822 96.8% 320,535 97.5% 1,614,427 96.6%
Possible Injury
No Restraint 3,372 9.5% 3,720 10.6% 3,756 7.6% 4,047 8.4% 2,704 7.9% 14,789 8.5%
Restraint 32,005 90.5% 31,451 89.4% 45,884 92.4% 44,265 91.6% 31,357 92.1% 160,088 91.5%
Non-Incapacitating Injury
No Restraint 3,583 19.6% 4,084 20.4% 3,778 15.9% 3,648 16.3% 2,951 17.9% 14,930 17.4%
Restraint 14,680 80.4% 15,898 79.6% 20,040 84.1% 18,750 83.7% 13,544 82.1% 70,903 82.6%
Incapacitating Injury
No Restraint 1,827 35.6% 1,984 31.8% 2,007 27.3% 2,037 29.0% 1,608 29.6% 7,813 30.8%
Restraint 3,309 64.4% 4,262 68.2% 5,341 72.7% 4,981 71.0% 3,818 70.4% 17,572 69.2%
Fatal Injury
No Restraint 558 65.3% 532 59.4% 675 54.7% 651 54.0% 649 55.6% 2,551 59.3%
Restraint 296 34.7% 364 40.6% 558 45.3% 555 46.0% 519 44.4% 1,748 40.7%
Total
No Restraint 21,191 6.0% 21,503 6.5% 23,458 4.9% 22,480 4.9% 16,257 4.2% 96,801 4.9%
Restraint 334,763 94.0% 309,756 93.5% 452,639 95.1% 439,373 95.1% 369,773 95.8% 1,864,738 95.1%
Source: TN Dept of Safety Crash Reporting System, 10 Mar 2008.
35


Attachments


Attachment 1
Tennessee Code Annotated § 55-9-602


Child Passenger Restraint Systems—Violations—Penalties (a) (1) Any person transporting any child, under one (1) year of age, or any child, weighing twenty pounds (20 lbs.) or less, in a motor vehicle upon a road, street or highway of Tennessee is responsible for the protection of the child and properly using a child passenger restraint system in a rear facing position, meeting federal motor vehicle safety standards in the rear seat if available or according to the child safety restraint system or vehicle manufacturer's instructions. (2) Notwithstanding the provisions of § 55-9-603, any person transporting any child, one (1) through three (3) years of age weighing greater than twenty pounds (20 lbs.), in a motor vehicle upon a road, street or highway of Tennessee is responsible for the protection of the child and properly using a child passenger restraint system in a forward facing position, meeting federal motor vehicle safety standards in the rear seat if available or according to the child safety restraint system or vehicle manufacturer's instructions. (3) Notwithstanding the provisions of § 55-9-603, any person transporting any child, four (4) through eight (8) years of age and measuring less than four feet, nine inches (4′ 9″) in height, in a passenger motor vehicle upon a road, street or highway of Tennessee is responsible for the protection of the child and properly using a belt positioning booster seat system, meeting federal motor vehicle safety standards in the rear seat if available or according to the child safety restraint system or vehicle manufacturer's instructions. (4) (A) If a child is not capable of being safely transported in a conventional child passenger restraint system as provided for in this subsection (a), a specially modified, professionally manufactured restraint system meeting the intent of this subsection (a) shall be in use; provided, however, that the provisions of this subdivision (a)(4) shall not be satisfied by use of the vehicle's standard lap or shoulder safety belts independent of any other child passenger restraint system. A motor vehicle operator who is transporting a child in a specially modified, professionally manufactured child passenger restraint system shall possess a copy of the physician's signed prescription that authorizes the professional manufacture of the specially modified child passenger restraint system. (B) A person shall not be charged with a violation of this subsection (a) if such person presents a copy of the physician's prescription in compliance with the provisions of this subdivision (a)(4) to the arresting officer at the time of the alleged violation. (C) A person charged with a violation of this subsection (a) may, on or before the court date, submit a copy of the physician's prescription and evidence of possession of a specially modified, professionally manufactured child passenger restraint system to the court. If the court is satisfied that compliance was in effect at the time of the violation, the charge for violating the provisions of this subsection (a) may be dismissed. (b) All passenger vehicle rental agencies doing business in the state of Tennessee shall make available at a reasonable rate to those renting such vehicles an approved restraint as described in subsection (a). (c) (1) A violation of this section is a Class C misdemeanor.
41

(2) In addition to or in lieu of the penalty imposed under subdivision (c)(1), persons found guilty of a first offense of violating this section may be required to attend a court approved offenders' class designed to educate offenders on the hazards of not properly transporting children in motor vehicles. A fee may be charged for such classes sufficient to defray all costs of providing such classes. (d) Any incorporated municipality may by ordinance adopt by reference any of the provisions of this section, it being the legislative intent to promote the protection of children wherever and whenever possible. (e) Prior to the initial discharge of any newborn child from a health care institution offering obstetrical services, such institution shall inform the parent that use of a child passenger restraint system is required by law. Further, the health care institution shall distribute to the parent related information provided by the department of safety. (f) (1) There is established within the general fund a revolving special account to be known as the child safety fund, hereinafter referred to as the “fund.” (2) All fines imposed by this section shall be sent by the clerk of the court to the state treasurer for deposit in the fund. (3) Any unencumbered funds and any unexpended balance of this fund remaining at the end of any fiscal year shall not revert to the general fund, but shall be carried forward until expended in accordance with the provisions of this section and § 55-9-610. (4) Interest accruing on investments and deposits of the fund shall be returned to the fund and remain a part of the fund. (5) Disbursements from, investments of and deposits to the fund shall be administered and invested pursuant to the provisions of title 9, chapter 4, part 5. (6) The state treasurer may deduct reasonable service charges from the fund pursuant to procedures established by the state treasurer and the commissioner of finance and administration. (7) The department of health is authorized, pursuant to duly promulgated rules and regulations, to determine equitable distribution of the moneys in the fund to those entities that are best suited for child passenger safety system distribution. Funds distributed pursuant to the provisions of this section shall only be used for the purchase of child passenger safety systems to be loaned or given to the parent or guardian. (g) (1) (A) Notwithstanding the provisions of § 55-9-603, any person transporting any child, nine (9) through twelve (12) years of age, or any child through twelve (12) years of age, measuring four feet, nine inches (4′ 9″) or more in height, in a passenger motor vehicle upon a road, street or highway of Tennessee is responsible for the protection of the child and properly using a seat belt system meeting federal motor vehicle safety standards. It is recommended that any such child be placed in the rear seat if available.
42
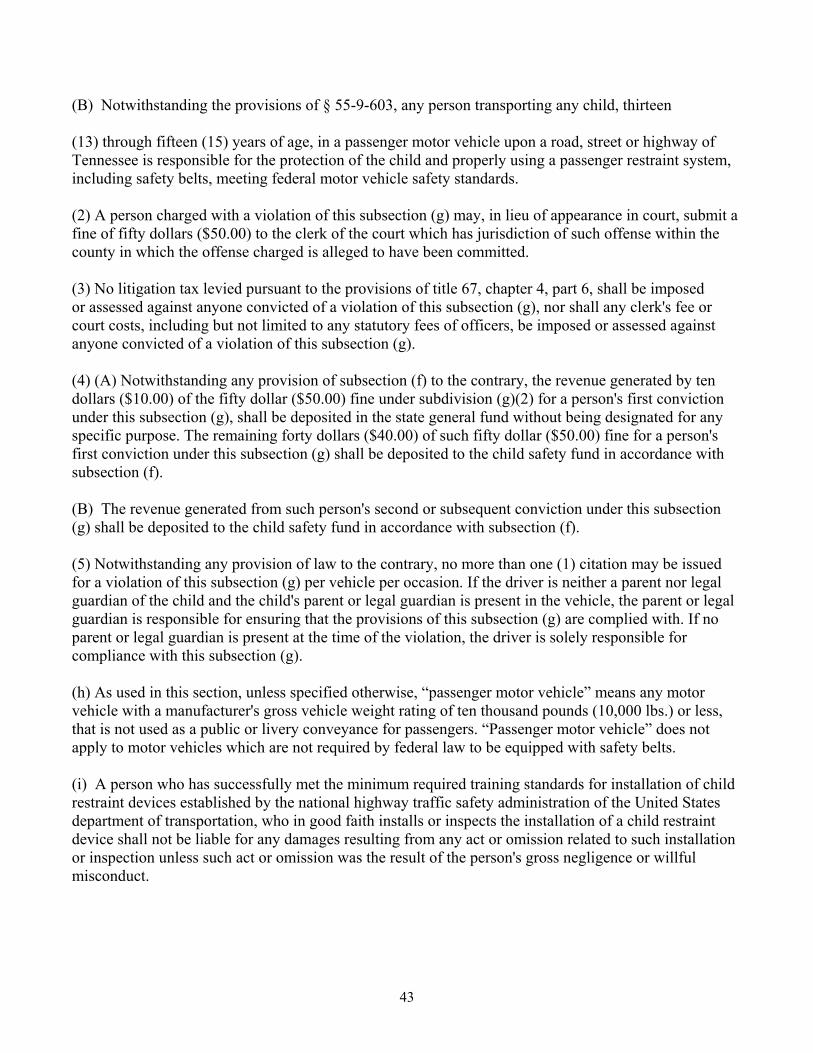
(B) Notwithstanding the provisions of § 55-9-603, any person transporting any child, thirteen (13) through fifteen (15) years of age, in a passenger motor vehicle upon a road, street or highway of Tennessee is responsible for the protection of the child and properly using a passenger restraint system, including safety belts, meeting federal motor vehicle safety standards. (2) A person charged with a violation of this subsection (g) may, in lieu of appearance in court, submit a fine of fifty dollars ($50.00) to the clerk of the court which has jurisdiction of such offense within the county in which the offense charged is alleged to have been committed. (3) No litigation tax levied pursuant to the provisions of title 67, chapter 4, part 6, shall be imposed or assessed against anyone convicted of a violation of this subsection (g), nor shall any clerk's fee or court costs, including but not limited to any statutory fees of officers, be imposed or assessed against anyone convicted of a violation of this subsection (g). (4) (A) Notwithstanding any provision of subsection (f) to the contrary, the revenue generated by ten dollars ($10.00) of the fifty dollar ($50.00) fine under subdivision (g)(2) for a person's first conviction under this subsection (g), shall be deposited in the state general fund without being designated for any specific purpose. The remaining forty dollars ($40.00) of such fifty dollar ($50.00) fine for a person's first conviction under this subsection (g) shall be deposited to the child safety fund in accordance with subsection (f). (B) The revenue generated from such person's second or subsequent conviction under this subsection (g) shall be deposited to the child safety fund in accordance with subsection (f). (5) Notwithstanding any provision of law to the contrary, no more than one (1) citation may be issued for a violation of this subsection (g) per vehicle per occasion. If the driver is neither a parent nor legal guardian of the child and the child's parent or legal guardian is present in the vehicle, the parent or legal guardian is responsible for ensuring that the provisions of this subsection (g) are complied with. If no parent or legal guardian is present at the time of the violation, the driver is solely responsible for compliance with this subsection (g). (h) As used in this section, unless specified otherwise, “passenger motor vehicle” means any motor vehicle with a manufacturer's gross vehicle weight rating of ten thousand pounds (10,000 lbs.) or less, that is not used as a public or livery conveyance for passengers. “Passenger motor vehicle” does not apply to motor vehicles which are not required by federal law to be equipped with safety belts. (i) A person who has successfully met the minimum required training standards for installation of child restraint devices established by the national highway traffic safety administration of the United States department of transportation, who in good faith installs or inspects the installation of a child restraint device shall not be liable for any damages resulting from any act or omission related to such installation or inspection unless such act or omission was the result of the person's gross negligence or willful misconduct.
43

(j) Notwithstanding any provisions of this part to the contrary, for any child transported by child care agencies licensed by the department of human services pursuant to title 71, chapter 3, part 5 and transported pursuant to the rules and regulations of such department, such rules and regulations shall remain effective until the department amends such rules and regulations; provided, however, that the department shall either promulgate rules consistent with the provisions of this part or promulgate rules exceeding, based on applicable federal regulations or standards, the provisions of this part no later than January 1, 2007. (k) (1) The failure to use a child restraint system shall not be admissible into evidence in a civil action; provided, however, that evidence of a failure to use a child restraint system, as required by this section, may be admitted in a civil action as to the causal relationship between noncompliance and the injuries alleged, if the following conditions have been satisfied: (A) The plaintiff has filed a products liability claim; (B) The defendant alleging noncompliance with this section shall raise this defense in its answer or timely amendment thereto in accordance with the rules of civil procedure; and (C) Each defendant seeking to offer evidence alleging noncompliance with this section has the burden of proving noncompliance with this section, that compliance with this section would have reduced injuries and the extent of the reduction of such injuries. (2) Upon request of any party, the trial judge shall hold a hearing out of the presence of the jury as to the admissibility of such evidence in accordance with the provisions of this subsection (k) and the Tennessee Rules of Evidence. (3) Notwithstanding any provision of this subsection (k) to the contrary, if a party to the civil action is not the parent or legal guardian, then evidence of a failure to use a child restraint system, as required by this section, may be admitted in such action as to the causal relationship between noncompliance and the injuries alleged. [Acts 1963, ch. 102, §§ 1, 2; 1977, ch. 114, §§ 1, 2; T.C.A., § 59-930; Acts 1981, ch. 86, §§ 1, 2; 1985, ch. 183, § 1; T.C.A., § 55-9-214; Acts 1986, ch. 866, §§ 2, 3; 1989, ch. 564, §§ 2-6, 9; 1989, ch. 591, § 113; 1995, ch. 112, §§ 1, 2; 2000, ch. 945, § 1; 2001, ch. 463, §§ 1, 2; 2003, ch. 299, §§ 1-9; 2004, ch. 809, § 1; 2005, ch. 55, §§ 1, 2.]
44

Attachment 2
Tennessee Code Annotated § 55-9-603


Use of Safety Belts In Passenger Vehicles—Violations—Penalties (a) (1) No person shall operate a passenger motor vehicle on any highway, as defined § 55-8-101(22), in this state unless such person and all passengers four (4) years of age or older are restrained by a safety belt at all times the vehicle is in forward motion. (2) No person four (4) years of age or older shall be a passenger in a passenger motor vehicle on any highway, as defined in § 55-8-101(22), in this state, unless such person is restrained by a safety belt at all times the vehicle is in forward motion. (b) (1) The provisions of this section shall apply only to the operator and all passengers occupying the front seat of a passenger motor vehicle. (2) If the vehicle is equipped with a rear seat which is capable of folding, the provisions of this section shall only apply to front seat passengers and the operator if the back seat is in the fold down position. (c) As used in this section, unless specified otherwise, “passenger car” or “passenger motor vehicle” means any motor vehicle with a manufacturer's gross vehicle weight rating of eight thousand five hundred pounds (8,500 lbs.) or less, that is not used as a public or livery conveyance for passengers. “Passenger car” or “passenger motor vehicle” does not apply to motor vehicles which are not required by federal law to be equipped with safety belts. (d) (1) A violation of this section is a Class C misdemeanor. All proceeds from the fines imposed by this subsection (d) shall be deposited in the state general fund and designated for the exclusive use of the division of vocational rehabilitation to assist eligible handicapped individuals as defined in § 49-11-602 (3) who have been severely injured in motor vehicle accidents. (2) A person charged with a violation of this section may, in lieu of appearance in court, submit a fine of ten dollars ($10.00) for a first violation, and twenty dollars ($20.00) on second and subsequent violations to the clerk of the court which has jurisdiction of such offense within the county in which the offense charged is alleged to have been committed. (3) (A) Notwithstanding subdivision (d)(2) to the contrary, a person charged with a violation of subsection (i) may, in lieu of appearance in court, submit a fine of twenty dollars ($20.00) to the clerk of the court which has jurisdiction of such offense within the county in which the offense charged is alleged to have been committed. (B) Notwithstanding any provision of subdivision (d)(1) to the contrary, the revenue generated by ten dollars ($10.00) of the twenty dollar ($20.00) fine under subdivision (d)(3)(A) for a person's first conviction under subsection (i) shall be deposited in the state general fund without being designated for any specific purpose. The remaining ten dollars ($10.00) of such twenty dollar ($20.00) fine for such person's first conviction under subsection (i) shall be deposited in the state general fund and designated for the exclusive use of the division of vocational rehabilitation in accordance with subdivision (d)(1).
47

(C) The revenue generated from such person's second or subsequent conviction under subsection (i) shall be deposited in the state general fund and designated for the exclusive use of the division of vocational rehabilitation in accordance with subdivision (d)(1). (e) No clerk's fee nor court costs, including, but not limited to, any statutory fees of officers, shall be imposed or assessed against anyone convicted of a violation of this section. No litigation tax levied pursuant to the provisions of title 67, chapter 4, part 6, shall be imposed or assessed against anyone convicted of a violation of this section. (f) (1) A law enforcement officer observing a violation of this section shall issue a citation to the violator, but shall not arrest or take into custody any person solely for a violation of this section. (2) The department of safety shall not report any convictions under this section except for law enforcement or governmental purposes. (g) In no event shall a violation of this section be assigned a point value for suspension or revocation of a license by the department of safety, nor shall such violation be construed as any other offense under the provisions of this title. (h) This section does not apply to: (1) A passenger or operator with a physically disabling condition whose physical disability would prevent appropriate restraint in such safety seat or safety belt; provided, that such condition is duly certified in writing by a physician who shall state the nature of the handicap, as well as the reason such restraint is inappropriate; (2) A passenger motor vehicle operated by a rural letter carrier of the United States postal service while performing the duties of a rural letter carrier; (3) Salespersons or mechanics employed by an automobile dealer who, in the course of their employment, test-drive a motor vehicle, if such dealership customarily test-drives fifty (50) or more motor vehicles a day, and if such test-drives occur within one (1) mile of the location of the dealership; (4) Utility workers, water, gas and electric meter readers in the course of their employment; (5) A newspaper delivery motor carrier service while performing the duties of a newspaper delivery motor carrier service; provided, that this exemption shall only apply from the time of the actual first delivery to the customer until the last actual delivery to the customer; (6) A vehicle in use in a parade if operated at less than fifteen miles per hour (15 mph); (7) A vehicle in use in a hayride if operated at less than fifteen miles per hour (15 mph); or (8) A vehicle crossing a highway from one field to another if operated at less than fifteen miles per hour (15 mph).
48

(i) (1) Notwithstanding any provision of this section to the contrary, no person between sixteen (16) years of age and up to and through the age of seventeen (17) years of age, shall operate a passenger motor vehicle, or be a passenger therein, unless such person is restrained by a safety belt at all times the vehicle is in forward motion. (2) Notwithstanding subdivision (b)(1), the provisions of this subsection (i) shall apply to all occupants between sixteen (16) years of age and eighteen (18) years of age occupying any seat in a passenger motor vehicle. (3) Notwithstanding subdivision (f)(1), a law enforcement officer observing a violation of this subsection (i) shall issue a citation to the violator, but shall not arrest or take into custody any person solely for a violation of this subsection (i). (j) Notwithstanding the provisions of subsection (b), no person with a learner permit or an intermediate driver license shall operate a passenger motor vehicle in this state unless such person and all passengers between the ages of four (4) and seventeen (17) years of age are restrained by a safety belt at all times the vehicle is in forward motion. (k) The department of safety shall file a report by March 1 of each year to the 104th, 105th, and 106th general assembly on data collected for the prior five (5) years by the department relating to violations of this section. Such data shall include the number of persons cited for violations of this section, their race, ethnicity, sex, age, and any other information the department deems relevant. [Acts 1986, ch. 866, §§ 3, 4, 7, 8, 11; 1989, ch. 591, § 113; 1994, ch. 661, §§ 2, 4; 2000, ch. 700, § 3; 2000, ch. 945, §§ 2-4; 2004, ch. 893, §§ 1-5.]
49


Attachment 3
Traffic Safety Facts: Crash Stats April 2007


NHTSA’s National Center for Statistics and Analysis 400 Seventh Street SW., Washington, DC 20590
DOT HS 810 690 A Brief Statistical Summary April 2007 (Revised Data)
Seat Belt Use in 2006 ─ Use Rates in the States and Territories
In 2006, seat belt use in the United States ranged
from 63.5 percent in New Hampshire and Wyoming
to 96.3 percent in Washington. These results are from
probability-based observational surveys conducted by
50 States and U.S. Territories in accordance with
criteria established by the National Highway Traffic
Safety Administration to ensure reliable results.
Compliance with the criteria is verified annually by
NHTSA’s National Center for Statistics and Analysis.
The 2006 surveys also found the following:
• Eleven States and Territories achieved use rates
of 90 percent or higher — Washington,
Michigan, Oregon, California, Puerto Rico,
Hawaii, Nevada, Maryland, Texas, Georgia, and
New Jersey.
• Jurisdictions with stronger belt enforcement laws
continue to exhibit generally higher use rates than
those with weaker laws. Mississippi strengthened
its belt law to a “primary” enforcement law,
effective May 2006. This State saw a jump in use
from 60.8 percent in 2005 to 73.6 percent in
2006. Alaska and Kentucky also passed primary
laws that took effect in 2006.
Seat belt use rates in the States, U.S. Territories, the
District of Columbia, and nationwide from 2000-
2006 are listed in the following table. States provided
the 2006 seat belt use rates in response to grant
requirements under 23 U.S.C. §§ 402, 406. The
agency has continued the use of uniform survey
criteria developed under the Transportation Equity
Act for the 21st Century (available at 23 CFR Part
1340) in order to determine the acceptability of a
State’s survey process and submitted seat belt use
rates. Rates in jurisdictions with primary belt
enforcement during the calendar year of the survey
are shaded in the table. However, the law might not
have taken effect when the survey was conducted.
The 2003 rate for New Hampshire was not reported
by the State. It was obtained by Preusser Research
Group using methods compliant with 23 CFR Part
1340.
National Seat Belt Use Rate
Seat belt use nationwide was 81 percent in 2006, as
measured by NHTSA’s National Occupant Protection
Use Survey (NOPUS). NOPUS provides NHTSA’s
official measure of nationwide use because it is the
only probability-based observational survey of seat
belt use in the United States. Additionally, NOPUS
does not employ sampling frame exemptions allowed
of the States and Territories in Section 157 (namely,
the omission of up to 15 percent of low-population
areas and the permission to observe data solely in
vehicles stopped at stop signs or stoplights), and so
provides a more accurate measure of nationwide use
than would be obtained by combining the use rates
from the States and Territories.

NHTSA’s National Center for Statistics and Analysis 400 Seventh Street SW., Washington, DC 20590
Table: Seat Belt Use in States, U.S. Territories, and Nationwide, 2000-2006
State or U.S.
Territory 2000 2001 2002 2003 2004 2005 2006
Reduction in Nonuse
2005-2006
Alabama 70.6% 79.4% 78.7% 77.4% 80.0% 81.8% 82.9% 6%
Alaska 61.0% 62.6% 65.8% 78.9% 76.7% 78.4% 83.2% 22%
Arizona 75.2% 74.4% 73.7% 86.2% 95.3% 94.2% 78.9% -264%
Arkansas 52.4% 54.5% 63.7% 62.8% 64.2% 68.3% 69.3% 3%
California 88.9% 91.1% 91.1% 91.2% 90.4% 92.5% 93.4% 12%
Colorado 65.1% 72.1% 73.2% 77.7% 79.3% 79.2% 80.3% 5%
Connecticut 76.3% 78.0% 78.0% 78.0% 82.9% 81.6% 83.5% 10%
Delaware 66.1% 67.3% 71.2% 74.9% 82.3% 83.8% 86.1% 14%
Dist. Of Columbia 82.6% 83.6% 84.6% 84.9% 87.1% 88.8% 85.4% -30%
Florida 64.8% 69.5% 75.1% 72.6% 76.3% 73.9% 80.7% 26%
Georgia 73.6% 79.0% 77.0% 84.5% 86.7% 89.9% 90.0% 1%
Hawaii 80.4% 82.5% 90.4% 91.8% 95.1% 95.3% 92.5% -60%
Idaho 58.6% 60.4% 62.9% 71.7% 74.0% 76.0% 79.8% 16%
Illinois 70.2% 71.4% 73.8% 80.1% 83.0% 86.0% 87.8% 13%
Indiana 62.1% 67.4% 72.2% 82.3% 83.4% 81.2% 84.3% 16%
Iowa 78.0% 80.9% 82.4% 86.8% 86.4% 87.1% 89.6% 19%
Kansas 61.6% 60.8% 61.3% 63.6% 68.3% 69.0% 73.5% 15%
Kentucky 60.0% 61.9% 62.0% 65.5% 66.0% 66.7% 67.2% 2%
Louisiana 68.2% 68.1% 68.6% 73.8% 75.0% 77.7% 74.8% -13%
Maine NA NA NA NA 72.3% 75.8% 77.2% 6%
Maryland 85.0% 82.9% 85.8% 87.9% 89.0% 91.1% 91.1% 0%
Massachusetts 50.0% 56.0% 51.0% 61.7% 63.3% 64.8% 66.9% 6%
Michigan 83.5% 82.3% 82.9% 84.8% 90.5% 92.9% 94.3% 20%
Minnesota 73.4% 73.9% 80.1% 79.4% 82.1% 83.9% 83.3% -4%
Mississippi 50.4% 61.6% 62.0% 62.2% 63.2% 60.8% 73.6% 33%
Missouri 67.7% 67.9% 69.4% 72.9% 75.9% 77.4% 75.2% -10%
Montana 75.6% 76.3% 78.4% 79.5% 80.9% 80.0% 79.0% -5%
Nebraska 70.5% 70.2% 69.7% 76.1% 79.2% 79.2% 76.0% -15%
Nevada 78.5% 74.5% 74.9% 78.7% 86.6% 94.8% 91.2% -69%
New Hampshire NA NA NA 49.6% NA NA 63.5% NA
New Jersey 74.2% 77.6% 80.5% 81.2% 82.0% 86.0% 90.0% 29%
New Mexico 86.6% 87.8% 87.6% 87.2% 89.7% 89.5% 89.6% 1%
New York 77.3% 80.3% 82.8% 84.6% 85.0% 85.0% 83.0% -13%
North Carolina 80.5% 82.7% 84.1% 86.1% 86.1% 86.7% 88.5% 14%
North Dakota 47.7% 57.9% 63.4% 63.7% 67.4% 76.3% 79.0% 11%
Ohio 65.3% 66.9% 70.3% 74.7% 74.1% 78.7% 81.7% 14%
Oklahoma 67.5% 67.9% 70.1% 76.7% 80.3% 83.1% 83.7% 4%
Oregon 83.6% 87.5% 88.2% 90.4% 92.6% 93.3% 94.1% 12%
Pennsylvania 70.7% 70.5% 75.7% 79.0% 81.8% 83.3% 86.3% 18%
Rhode Island 64.4% 63.2% 70.8% 74.2% 76.2% 74.7% 74.0% -3%
South Carolina 73.9% 69.6% 66.3% 72.8% 65.7% 69.7% 72.5% 9%
South Dakota 53.4% 63.3% 64.0% 69.9% 69.4% 68.8% 71.3% 8%
Tennessee 59.0% 68.3% 66.7% 68.5% 72.0% 74.4% 78.6% 16%
Texas 76.6% 76.1% 81.1% 84.3% 83.2% 89.9% 90.4% 5%
Utah 75.7% 77.8% 80.1% 85.2% 85.7% 86.9% 88.6% 13%
Vermont 61.6% 67.4% 84.9% 82.4% 79.9% 84.7% 82.4% -15%
Virginia 69.9% 72.3% 70.4% 74.6% 79.9% 80.4% 78.7% -9%
Washington 81.6% 82.6% 92.6% 94.8% 94.2% 95.2% 96.3% 23%
West Virginia 49.8% 52.3% 71.6% 73.6% 75.8% 84.9% 88.5% 24%
Wisconsin 65.4% 68.7% 66.1% 69.8% 72.4% 73.3% 75.4% 8%
Wyoming 66.8% NA 66.6% NA 70.1% NA 63.5% NA
Nationwide 71% 73% 75% 79% 80% 82% 81% -6%
Puerto Rico 87.0% 83.1% 90.5% 87.1% 90.1% 92.5% 92.7% 3%
Note: Rates in jurisdictions with primary belt enforcement during the calendar year of the survey are shaded.
For questions regarding the above reported data, contact Donna Glassbrenner at 202-366-3962, or Jianqiang Ye at 202-366-3603. This issue of
Crash•Stats and other general information on highway traffic safety may be accessed online at www-nrd.nhtsa.dot.gov/departments/nrd-
30/ncsa/AvailInf.html

Attachment 4
Survey of Safety Belt and Motorcycle Helmet Usage In Tennessee
2007


SURVEY OF SAFETY BELT AND MOTORCYCLE HELMET USAGE
IN TENNESSEE
FISCAL YEAR 2007 FINAL REPORT
Prepared by:
The University of Tennessee Center for Transportation Research
Matthew A. Cate, P.E. Research Associate III
September 18, 2007

SURVEY OF SAFETY BELT AND MOTORCYCLE HELMET USAGE IN TENNESSEE
FISCAL YEAR 2007 FINAL REPORT
MATTHEW A. CATE
Since 1986, the University of Tennessee Center for Transportation Research has conducted a statewide survey once each year during which both safety belt and motorcycle helmet use data are gathered simultaneously. The sample design, data collection techniques, and estimation procedures for the surveys were developed in accordance with the National Highway Traffic Safety Administration’s (NHTSA’s) “Guidelines for State Observational Surveys of Safety Belt and Motorcycle Helmet Use,” published in the June 29, 1992, Federal Register with the guideline revisions agreed upon at the June 1998 Region IV Workshop on Safety Belt Use Surveys held in Atlanta. Detailed information on the sample design (including site selection), survey conduct (including data collection), and statistical procedures for estimation can be found in the April 2007 report “Documentation of Tennessee Observational Surveys of Safety Belt and Motorcycle Helmet Use” and are summarized below.
Survey Design
A multi-stage area probability sampling approach is used in the survey. In the first stage, an appropriate number of primary sampling units are randomly selected. The primary sampling unit for the Tennessee survey is the “county” and 16 counties were selected for inclusion in the survey.
In the second stage, sampling of individual route segments in each of the counties is performed. All route segments in a county with an average daily traffic (ADT) of 500 or more make-up the “target” population and are identified from the Tennessee Roadway Information Management System (TRIMS) files. The qualifying route segments from each of the survey counties are stratified into six groupings using TRIMS functional classification data. For a given county, segments are randomly chosen from each of these six strata. The number of segments chosen from each stratum is proportional to the county’s estimated annual vehicle miles of travel (VMT) in each stratum. The proportional allocation of the segments across the various roadway groupings assures that the final sample is representative of the urban and rural mix in the county, as well as the mix of roadway functional types.
As per NHTSA guidelines and to achieve the required level of precision, a total of 440 roadway segments comprise the target sample. This number is based on NHTSA guidelines for “second stage sample size.” Forty percent of these sample sites (176 sites) are allocated to the state’s 4 largest counties, with each of these counties receiving one-fourth of this total number, or 44 sites. The remaining 60 percent (264 sites) are evenly divided among the 12 smaller counties in the survey, i.e., 22 sample sites per county.
An observational site is a homogeneous segment of roadway, generally ranging in length from 0.5 to 5 miles. A typical segment is approximately 1 mile in length.
Survey Of Safety Belt And Motorcycle Helmet Usage In Tennessee The University of Tennessee Fiscal Year 2007 Final Report Center for Transportation Research September 18, 2007 page 2
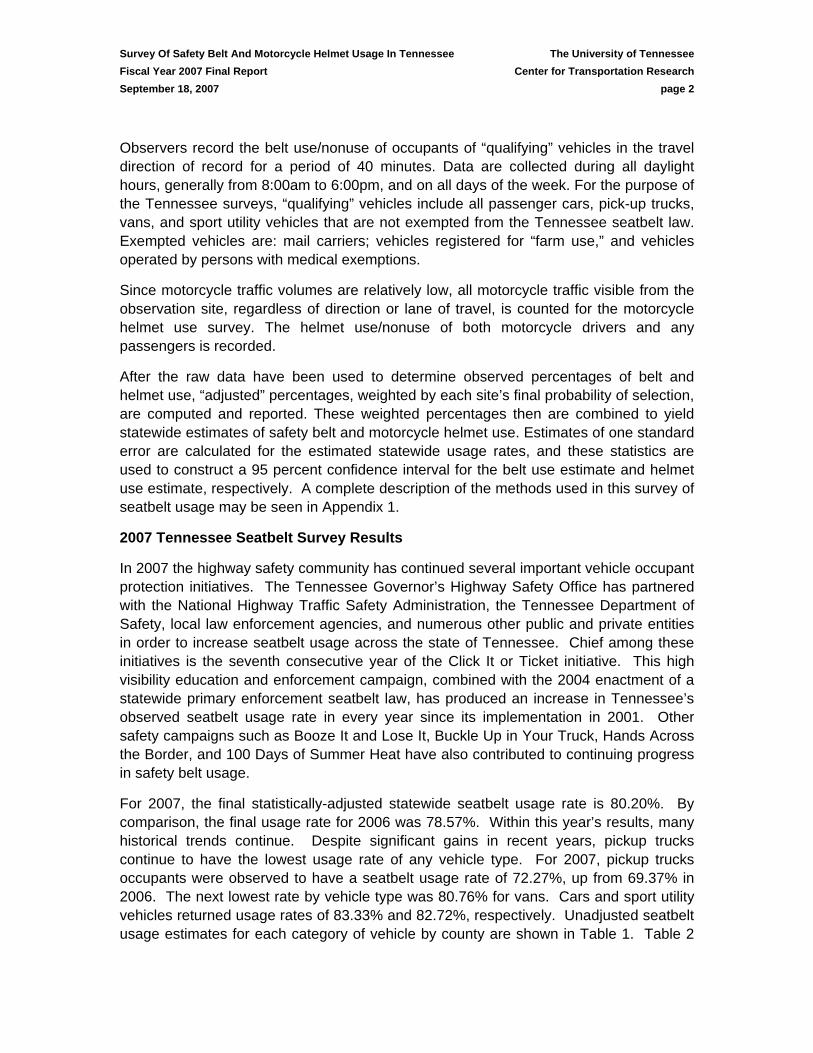
Observers record the belt use/nonuse of occupants of “qualifying” vehicles in the travel direction of record for a period of 40 minutes. Data are collected during all daylight hours, generally from 8:00am to 6:00pm, and on all days of the week. For the purpose of the Tennessee surveys, “qualifying” vehicles include all passenger cars, pick-up trucks, vans, and sport utility vehicles that are not exempted from the Tennessee seatbelt law. Exempted vehicles are: mail carriers; vehicles registered for “farm use,” and vehicles operated by persons with medical exemptions.
Since motorcycle traffic volumes are relatively low, all motorcycle traffic visible from the observation site, regardless of direction or lane of travel, is counted for the motorcycle helmet use survey. The helmet use/nonuse of both motorcycle drivers and any passengers is recorded.
After the raw data have been used to determine observed percentages of belt and helmet use, “adjusted” percentages, weighted by each site’s final probability of selection, are computed and reported. These weighted percentages then are combined to yield statewide estimates of safety belt and motorcycle helmet use. Estimates of one standard error are calculated for the estimated statewide usage rates, and these statistics are used to construct a 95 percent confidence interval for the belt use estimate and helmet use estimate, respectively. A complete description of the methods used in this survey of seatbelt usage may be seen in Appendix 1.
2007 Tennessee Seatbelt Survey Results
In 2007 the highway safety community has continued several important vehicle occupant protection initiatives. The Tennessee Governor’s Highway Safety Office has partnered with the National Highway Traffic Safety Administration, the Tennessee Department of Safety, local law enforcement agencies, and numerous other public and private entities in order to increase seatbelt usage across the state of Tennessee. Chief among these initiatives is the seventh consecutive year of the Click It or Ticket initiative. This high visibility education and enforcement campaign, combined with the 2004 enactment of a statewide primary enforcement seatbelt law, has produced an increase in Tennessee’s observed seatbelt usage rate in every year since its implementation in 2001. Other safety campaigns such as Booze It and Lose It, Buckle Up in Your Truck, Hands Across the Border, and 100 Days of Summer Heat have also contributed to continuing progress in safety belt usage.
For 2007, the final statistically-adjusted statewide seatbelt usage rate is 80.20%. By comparison, the final usage rate for 2006 was 78.57%. Within this year’s results, many historical trends continue. Despite significant gains in recent years, pickup trucks continue to have the lowest usage rate of any vehicle type. For 2007, pickup trucks occupants were observed to have a seatbelt usage rate of 72.27%, up from 69.37% in 2006. The next lowest rate by vehicle type was 80.76% for vans. Cars and sport utility vehicles returned usage rates of 83.33% and 82.72%, respectively. Unadjusted seatbelt usage estimates for each category of vehicle by county are shown in Table 1. Table 2

Survey Of Safety Belt And Motorcycle Helmet Usage In Tennessee The University of Tennessee Fiscal Year 2007 Final Report Center for Transportation Research September 18, 2007 page 3
shows the final adjusted usage rates by vehicle type and county, as well as the final statewide usage rate of 80.20% (± 1.29%) for all vehicle types. The statewide motorcycle helmet usage in 2007 was 99.43% (±0.56%). Table 3 shows the motorcycle helmet usage by county. To further illustrate the recent progress brought about in increasing seatbelt usage across the state of Tennessee by both the Click-It-Or-Ticket campaign and passage of a primary seatbelt enforcement law, Table 4 shows annual usage rates for all vehicles, passenger cars, pickup trucks, vans, and sport utility vehicles since 2000.

Survey Of Safety Belt And Motorcycle Helmet Usage In Tennessee The University of Tennessee Fiscal Year 2007 Final Report Center for Transportation Research September 18, 2007 page 4

Survey Of Safety Belt And Motorcycle Helmet Usage In Tennessee The University of Tennessee Fiscal Year 2007 Final Report Center for Transportation Research September 18, 2007 page 5
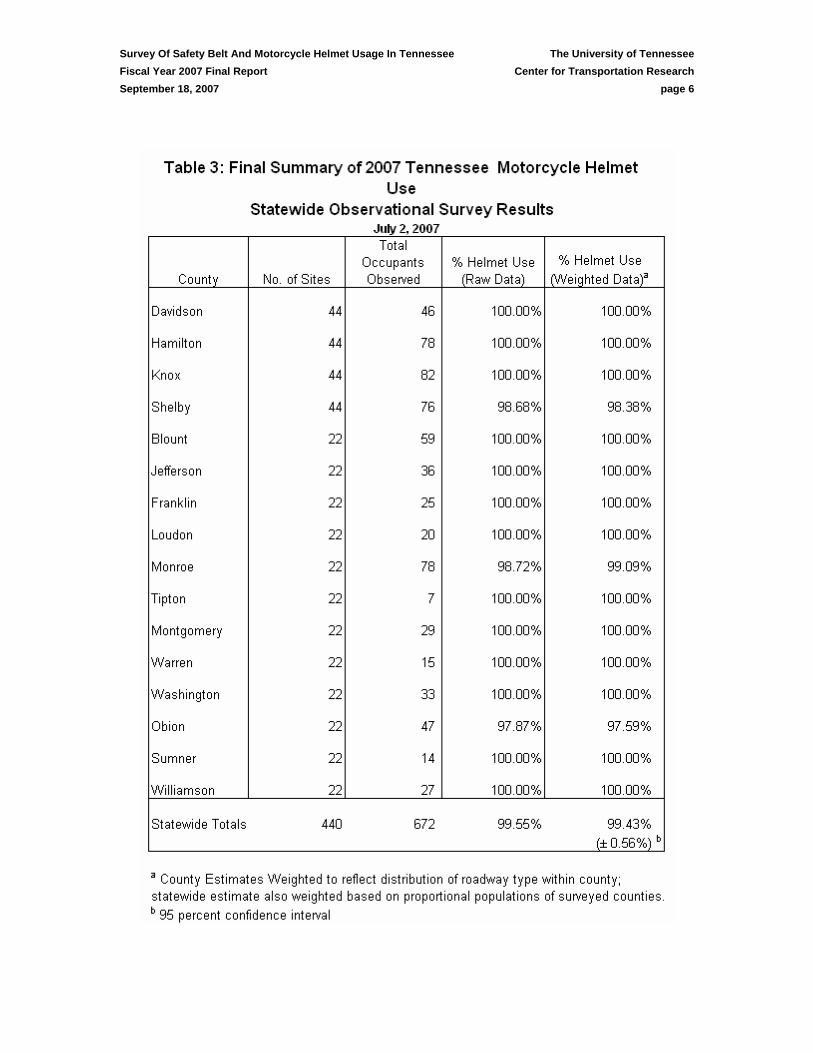
Survey Of Safety Belt And Motorcycle Helmet Usage In Tennessee The University of Tennessee Fiscal Year 2007 Final Report Center for Transportation Research September 18, 2007 page 6

Survey Of Safety Belt And Motorcycle Helmet Usage In Tennessee The University of Tennessee Fiscal Year 2007 Final Report Center for Transportation Research September 18, 2007 page 7
Table 4: Tennessee Seatbelt Usage, 2000-2007
Survey YearPassenger
CarsPickup Trucks Vans
Sport Utility Vehicles All Vehicles
2000 64.2% 39.3% 68.5% 73.0% 59.0%2001 73.5% 53.9% 70.4% 75.9% 68.3%2002 71.0% 53.0% 71.8% 73.6% 66.7%2003 72.5% 55.0% 71.3% 75.4% 68.4%2004 76.1% 57.5% 75.7% 77.3% 72.0%2005 78.2% 62.6% 77.3% 79.5% 74.4%2006 82.1% 69.4% 80.0% 82.0% 78.6%2007 83.3% 72.3% 80.8% 82.7% 80.2%
Figure 1: Tennessee Seatbelt Usage, 2000-2007
35.0%
40.0%
45.0%
50.0%
55.0%
60.0%
65.0%
70.0%
75.0%
80.0%
85.0%
1999 2000 2001 2002 2003 2004 2005 2006 2007 2008
Year
Usa
ge R
ate Cars
Pickup TrucksVansSUVsAll Vehicles
Figure 1: Tennessee Seatbelt Usage, 2000-2007

Survey Of Safety Belt And Motorcycle Helmet Usage In Tennessee The University of Tennessee Fiscal Year 2000 Final Report Center for Transportation Research September 17, 2007 page 8
Appendix 1: Survey Methodology

Exhibit 1
DOCUMENTATION OF TENNESSEE OBSERVATIONAL SURVEYS OF
SAFETY BELT AND MOTORCYLE HELMET USE
Project Agency: University of Tennessee
Prepared by: Dr. Stephen H. Richards
Executive Director Center for Transportation Research
Dr. Tommy Wright Adjunct Associate Professor of Statistics
Department of Statistics
Matthew Cate Senior Research Associate
Center for Transportation Research
revised April 18, 2007

Rev. 4/18/07
Executive Summary
University of Tennessee Transportation Center conducts a statewide survey once each
year in late summer, at which time both safety belt and motorcycle helmet use data are gathered
simultaneously. The sample design, data collection techniques, and estimation procedures for the
surveys were developed in accordance with NHTSA “Guidelines for State Observational
Surveys of Safety Belt and Motorcycle Helmet Use,” published in the June 29, 1992 Federal
Register with the guideline revisions agreed upon at the June 1998 Region IV Workshop on
Safety Belt Use Surveys held in Atlanta.
A multi-stage area probability sampling approach is used in the survey. In the first stage,
an appropriate number of primary sampling units is randomly selected. The primary sampling
unit for the Tennessee survey is the “county” and 16 counties were selected for inclusion in the
survey.
In the second stage, sampling of individual route segments in each of the counties is
performed. All route segments in a county with an ADT of 500 or more make-up the “target”
population and are identified from the TRIMS files. The qualifying route segments from each of
the survey counties are stratified into 6 groupings using TRIMS functional classification data.
For a given county, segments are randomly chosen from each of these six strata. The number of
segments chosen from each stratum is proportional to the county’s estimated annual VMT in
each stratum. The proportional allocation of the segments across the various roadway groupings
assures that the final sample is representative of the urban and rural mix in the county, as well as
the mix of roadway functional types.
As per NHTSA guidelines and to achieve the required level of precision, a total of 440
roadway segments comprise the sample. This number is based on NHTSA guidelines for “second
stage sample size.” Forty percent of these sample sites (176 sites) are allocated to the state’s 4
largest counties, with each of these counties receiving one-fourth (44) of this total number, or 44

Rev. 4/18/07
sites. The remaining 60 percent (264 sites) are evenly divided among the 12 smaller counties in
the survey, i.e., 22 sample sites per county.
An observational site is a homogeneous segment of roadway, generally ranging in length
from 0.5 to 5 miles. A typical segment is approximately 1 mile in length. Observers record the
belt use/nonuse of occupants of “qualifying” vehicles in the travel direction of record for period
of 40 minutes. Data are collected during all daylight hours, generally from 8:00am to 6:00pm,
and on all days of the week. For the purpose of the Tennessee surveys, “qualifying” vehicles
include all passenger automobiles (passenger cars, pick-up trucks, vans, and sport utility
vehicles) which are not exempted from the Tennessee law. Exempted vehicles are: mail carriers;
vehicles registered for “farm use,” and vehicles operated by persons with medical exemptions.
Since motorcycle traffic volumes are relatively low, all motorcycle traffic visible from
the observation site, regardless of direction or lane of travel, is counted for the motorcycle
helmet use survey. The helmet use/nonuse of both motorcycle drivers and any passengers is
recorded.
After the raw data has been used to determine observed percentages of belt use and
helmet, “adjusted” percentages, weighted by each site’s final probability of selection, are
computed and reported. These weighted percentages then are combined to yield statewide
estimates of safety belt and motorcycle helmet use. Estimates of one standard error are calculated
for the estimated statewide usage rates, and these statistics are used to construct a 95 percent
confidence interval for the belt use estimate and helmet use estimate, respectively.

Rev. 4/18/07
Introduction
Following is a detailed description of the methodology employed in the State of
Tennessee observational surveys of safety belt and motorcycle helmet use. The sample design,
data collection techniques, and estimation procedures for the surveys were developed in
accordance with NHTSA “Guidelines for State Observational Surveys of Safety Belt and
Motorcycle Helmet Use,” published in the June 29, 1992 Federal Register with the guideline
revisions agreed upon at the June 1998 Region IV Workshop on Safety Belt Use Surveys held in
Atlanta. Under the Tennessee plan, a statewide survey is conducted once each year in the
summer, at which time both safety belt and motorcycle helmet use data are gathered
simultaneously. This annual survey is designed, and is currently administered, analyzed and
documented by the University of Tennessee Center for Transportation Research. The primary
contact person at the Center is Mr. Matthew Cate (865/974-5255, [email protected] ).
The sampling procedures described herein utilize data from the Tennessee Roadway
Information Management System compiled by the Tennessee Department of Transportation
(TDOT), and from the Tennessee Statistical Abstract published annually by the University of
Tennessee Center for Business and Economic Research. The TRIMS files include estimates of
Average Daily Traffic (ADT) and Vehicle Miles of Travel by road class and county. The
Tennessee Statistical Abstract presents population data by county as well as county road mileage
by functional roadway classification.
The TRIMS files also provide a ‘population” of observational sites for the surveys.
TRIMS contains data on the entire 84,000-mile road system in Tennessee, including Interstate
Highways and Expressways, Principal and Minor Arterials, Major and Minor Collectors, and
Local Roads. As part of these data, each roadway is broken down into several “control-sections,”
which vary from less than a mile to a few miles in length. These route segments tend to be
homogeneous with regard to traffic volumes, land use, function, speeds, etc. Segment beginning

Rev. 4/18/07
and ending termini, functional classification, location of intersecting roadways and an ADT
estimate are recorded in the TRIMS files for each control-section.
Sample Design
A multi-stage area probability sampling approach is used in the survey. In the first stage,
an appropriate number of primary sampling units is randomly selected. The primary sampling
unit for the Tennessee survey is the “county.” Tennessee has a total of 95 counties; however, the
least populated counties which collectively comprise approximately 15 percent of the State’s
population are excluded from the sampling process. (County population is the measure of
sampling unit size for the purpose of defining the initial set of sampling units to be considered.)
Table 1 shows a listing of Tennessee’s 95 counties ranked using current Census data from least
to most populous. The 47 counties which have been included in the sampling population as per
the above criterion are identified in Table 1, as well as the 48 least populated counties which
have been excluded from the sampling population.
From the sampling population, a sample of 16 counties is selected. The number of
counties (16) in the survey sample is based on the fact that Tennessee has a total of 47 counties
in its sampling unit population. Applying NHTSA guidelines to this number of sampling units,
16 is an appropriate number to achieve the desired level of accuracy in belt use estimation. The
16 county sample is chosen using a two-step procedure. First, the 4 largest counties (Shelby,
Davidson, Knox and Hamilton) comprising approximately 40 percent of the state’s population
are automatically placed into the 16 county sample. Then, 12 additional counties are selected
from the remaining 43 county population to complete the survey sample, with probability for
selection proportional to the population of the county. “Population weighting” is used together
with random number generation to select the 12 smaller counties into the 16-county sample; the
selection is done with replacement.

Rev. 4/18/05
Table 1: 2000 Census Population
County Population % Total Cumulative
% TotalPickett 4,945 0.1% 0.1%Van Buren 5,508 0.1% 0.2%Moore 5,740 0.1% 0.3%Hancock 6,786 0.1% 0.4%Trousdale 7,259 0.1% 0.5%Perry 7,631 0.1% 0.7%Lake 7,954 0.1% 0.8%Clay 7,976 0.1% 0.9%Houston 8,088 0.1% 1.1%Jackson 10,984 0.2% 1.3%Meigs 11,086 0.2% 1.5%Lewis 11,367 0.2% 1.7%Sequatchie 11,370 0.2% 1.9%Decatur 11,731 0.2% 2.1%Bledsoe 12,367 0.2% 2.3%Stewart 12,370 0.2% 2.5%Cannon 12,826 0.2% 2.7%Grundy 14,332 0.3% 3.0%Crockett 14,532 0.3% 3.2%Chester 15,540 0.3% 3.5%Polk 16,050 0.3% 3.8%Benton 16,537 0.3% 4.1%Fentress 16,625 0.3% 4.4%Wayne 16,842 0.3% 4.7%DeKalb 17,423 0.3% 5.0%Johnson 17,499 0.3% 5.3%Unicoi 17,667 0.3% 5.6%Smith 17,712 0.3% 5.9%Union 17,808 0.3% 6.2%Humphreys 17,929 0.3% 6.5%Morgan 19,757 0.3% 6.9%Haywood 19,797 0.3% 7.2%Overton 20,118 0.4% 7.6%Macon 20,386 0.4% 8.0%Grainger 20,659 0.4% 8.3%Scott 21,127 0.4% 8.7%Hickman 22,295 0.4% 9.1%White 23,102 0.4% 9.5%McNairy 24,653 0.4% 9.9%Henderson 25,522 0.4% 10.4%Hardin 25,578 0.4% 10.8%Marshall 26,767 0.5% 11.3%Lauderdale 27,101 0.5% 11.8%Marion 27,776 0.5% 12.3%Hardeman 28,105 0.5% 12.7%Rhea 28,400 0.5% 13.2%Fayette 28,806 0.5% 13.8%Giles 29,447 0.5% 14.3%

Rev. 4/18/07
Table 1 Continued: 2000 Census Population
County Population % Total Cumulative
% TotalCarroll 29,475 0.5% 14.8%Claiborne 29,862 0.5% 15.3%Henry 31,115 0.5% 15.9%Lincoln 31,340 0.6% 16.4%Obion 32,450 0.6% 17.0%Cocke 33,565 0.6% 17.6%Weakley 34,895 0.6% 18.2%Cheatham 35,912 0.6% 18.8%Dyer 37,279 0.7% 19.5%Bedford 37,586 0.7% 20.1%Warren 38,276 0.7% 20.8%Monroe 38,961 0.7% 21.5%Loudon 39,086 0.7% 22.2%Franklin 39,270 0.7% 22.9%Campbell 39,854 0.7% 23.6%Lawrence 39,926 0.7% 24.3%Dickson 43,156 0.8% 25.0%Jefferson 44,294 0.8% 25.8%Cumberland 46,802 0.8% 26.6%Coffee 48,014 0.8% 27.5%Gibson 48,152 0.8% 28.3%McMinn 49,015 0.9% 29.2%Tipton 51,271 0.9% 30.1%Roane 51,910 0.9% 31.0%Hawkins 53,563 0.9% 31.9%Robertson 54,433 1.0% 32.9%Carter 56,742 1.0% 33.9%Hamblen 58,128 1.0% 34.9%Putnam 62,315 1.1% 36.0%Greene 62,909 1.1% 37.1%Maury 69,498 1.2% 38.3%Sevier 71,170 1.3% 39.6%Anderson 71,330 1.3% 40.8%Bradley 87,965 1.5% 42.4%Wilson 88,809 1.6% 43.9%Madison 91,837 1.6% 45.6%Blount 105,823 1.9% 47.4%Washington 107,198 1.9% 49.3%Williamson 126,638 2.2% 51.5%Sumner 130,449 2.3% 53.8%Montgomery 134,768 2.4% 56.2%Sullivan 153,048 2.7% 58.9%Rutherford 182,023 3.2% 62.1%Hamilton 307,896 5.4% 67.5%Knox 382,032 6.7% 74.2%Davidson 569,891 10.0% 84.2%Shelby 897,472 15.8% 100.0%
Tennessee 5,689,283

Rev. 4/18/07
Once the 16 survey counties have been chosen, second stage sampling of individual route
segments in each of the counties is performed. The qualifying route segments comprising the
sampling population are identified from the TRIMS files. All route segments in a county with an
ADT of 500 vehicles per day (vpd) or more make-up the route segment population. (In the
interest of efficiency and cost, very low volume segments with daily traffic volumes less than
500 vpd have been excluded from consideration.) The qualifying route segments from the 16
counties collectively constitute the set of observational sites from which the survey sites are then
selected. The qualifying route segments from the 47 counties collectively constitute the “target
population” of observational sites.
The qualifying route segments from each of the survey counties are stratified into the
following 6 groupings using TRIMS functional classification data:
1. Urban Interstate, Freeway or Expressway; 2. Rural Interstate; 3. Urban Other Principal or Minor Arterial; 4. Rural Other Principal or Minor Arterial; 5. Urban Major or Minor Collector/Local; and, 6. Rural Major or Minor Collector/Local.
For a given county, segments are randomly chosen from each of these six strata. The number of
segments chosen from each stratum is proportional to the county’s estimated annual VMT in
each stratum. The proportional allocation of the segments across the various roadway groupings
assures that the final sample is representative of the urban and rural mix in the county, as well as
the mix of roadway functional types.
As per NHTSA guidelines and to achieve the required level of precision, a total of 440
roadway segments comprise the sample. This number is based on NHTSA guidelines for “second
stage sample size.” Forty percent of these sample sites (176 sites) are allocated to the state’s 4
largest counties, with each of these counties receiving one-fourth (44) of this total number, or 44
sites. The remaining 60 percent (264 sites) are evenly divided among the 12 smaller counties in
the survey, i.e., 22 sample sites per county. In addition, one alternate site per county per roadway
classification will be identified. (This represents an additional 96 sites which can be used as

Rev. 4/18/07
substitute sites in the event that a primary site is unusable, e.g. it is closed for roadwork.) The
sample sites within each stratum are selected with replacement.
Data Collection
An observational site is a homogeneous segment of roadway, generally ranging in length
from 0.5 to 5 miles. A typical segment is approximately 1 mile in length. (The longer segments
tend to be in rural areas where there are few intersections and/or driveways.) At each
observational site, a direction of travel is randomly selected (by the equivalent of a coin toss) to
be the travel direction of record. Proceeding in this direction from the beginning point of the
segment, the observer is instructed to position himself or herself at the first intersection,
(preferably the first controlled intersection) within the segment.
The observer finds a safe spot to stand just beyond the edge of the roadway at or very
near the intersection. From this vantage point the observer records the belt use/nonuse of
occupants of “qualifying” vehicles in the travel direction of record. If there are multiple lanes in
the travel direction of record, only vehicles traveling in the outermost lane are sampled. In the
rare event that traffic is too heavy to count every vehicle in the survey lane, observers are
instructed to count every second or third vehicle, whichever is appropriate.
For the purpose of the Tennessee surveys, “qualifying” vehicles include all passenger
vehicles (passenger cars, pick-up trucks, vans, and sport utility vehicles) which are not exempted
from the Tennessee law. Exempted vehicles are: mail carriers; vehicles registered for “farm use,”
and vehicles operated by persons with medical exemptions. It will be possible through visual
observation to identify and not survey vehicles in the first two exempted categories (mail carriers
and registered farm vehicles). Vehicles in the third category (driver physically unable to wear
belt) will not be recognizable, and therefore these vehicles will be included in the survey sample.
(The numbers of such vehicles is very small and their inclusion in the sample is expected to be
insignificant.)
The shoulder belt use/nonuse of all front seat, outboard occupants of “qualifying”
vehicles is recorded, including children. Children four years of age and younger are counted, and

Rev. 4/18/07
if they are wearing a shoulder belt or are restrained in a proper child restraint device, they are
counted as “belted.”
Since motorcycle traffic volumes are relatively low, all motorcycle traffic visible from
the observation site, regardless of direction or lane of travel, is counted for the motorcycle
helmet use survey. The helmet use and nonuse of both motorcycle drivers and any passengers are
recorded.
The observation period at each site is 40 minutes. Observation periods are scheduled to
begin at the following times: 8:00am; 9:00am; 10:00am; 11:00am; 12:00 noon; 1:00pm; 2:00pm;
3:00pm; 4:00pm; and 5:00pm. Actual observation time periods will begin at these times, or as
close as practical to these times, i.e., as soon the observer can get positioned at the site.
Observers are instructed to commence counting with the first vehicle which arrives at the site
after the time period begins, and to cease counting at the precise end of the 40-minute time
period.
Data are collected during all daylight hours, generally from 8:00am to 6:00pm, and on all
days of the week. In assigning observation time periods to individual sites, the sites are first
clustered according to travel time proximity. Those sites within a reasonable driving distance,
i.e., approximately 25 minutes, are grouped together. A cluster is then randomly assigned to a
day or days of the week. Then, the sites within the cluster are randomly assigned to the
consecutive observation time periods within that day or days.
If an observation site cannot be surveyed because of construction activities, safety
concerns, or some other legitimate reason, the site is abandoned. The observer is instructed to
travel to the next assigned site and resume the survey at the appropriate time. Then, after all the
sites within the cluster are completed, the observer travels to a pre-selected alternate site (with
the same characteristics as the abandoned site), and he/she surveys this site beginning in the next
available time period. As noted previously, alternate sites are selected during the initial sampling
process.

Rev. 4/18/07
The surveys will continue during mild inclement weather. In the event of severe
inclement weather, the surveys are discontinued until such time as the weather eases. Then, the
surveys are resumed according to the original schedule. After the remaining sites in a cluster
have been surveyed, the observer returns to the missed site(s), and he/she surveys the site(s)
beginning in the next consecutive time period.
Estimation
Based on the data collected, appropriate statistical computations are performed to
estimate the percentage of seatbelt and helmet use for each county and for the state as whole.
After the raw data have been used to determine observed percentages of belt use and helmet,
“adjusted” percentages, weighted by each site’s final probability of selection, are computed and
reported. These weighted percentages then are combined to yield statewide estimates of safety
belt and motorcycle helmet use. Estimates of one standard error are calculated for the estimated
statewide usage rates, and these statistics are used to construct a 95 percent confidence interval
for the belt use estimate and helmet use estimate, respectively.
Site Dependent Adjustments
For each site in the survey, the number of belted and un-belted passengers observed for
each class of vehicles are counted. In addition, the observed number of helmeted and non-
helmeted motorcycle riders are recorded. Because data are collected only on the outermost lane
for seatbelt use, the observed seatbelt use data are adjusted to reflect the number of lanes at each
site. Consequently, for each site, the number of belted, jlcksB , and un-belted, jlcksU , passengers is
given by:
jlcksjlcks bnB ×= and
jlcksjlcks unU ×=
Where s = the site identifier k = roadway functional class c = county identifier l = identifies the county level (described later in the section on statewide weighting) j = the vehicle type (i.e. passenger car, pick-up truck, van/mini-van or sport utility) b = number of observed belted passengers u = number of observed un-belted passengers

Rev. 4/18/07
n = number of lanes in the outbound direction
Since data for helmet use are collected for all lanes of travel on all approaches, an adjustment for
the number of lanes at a site is not applied to helmet use data.
The next step is to weight the observed belt and helmet use counts proportional to the
number of roadway segments within a county.
County Wide Weighting
County wide weighting is conducted for each vehicle type observed. Because the
procedures for each type of vehicle are exactly the same and for purposes of simplification, the
remainder of this discussion will illustrate the procedure for weighting passenger cars.
For each county, the roadway segments can be classified into 6 functional categories:
1. Urban Interstate, Freeway or Expressway; 2. Rural Interstate; 3. Urban Other Principal or Minor Arterial; 4. Rural Other Principal or Minor Arterial; 5. Urban Major or Minor Collector/Local; and, 6. Rural Major or Minor Collector/Local.
Belt use data are collected for a sample of roadway segments within a county. To
estimate the county wide use, the observed data are weighted to reflect the probability of being
included in the survey. Consequently for a given county, the average number of observed belted,
jlckB , and total users, jlckT , is given by:
S
BB
S
ljlcks
jlck
∑== 1 and
S
UB
S
TT
S
sjlcksjlcks
S
sjlcks
jlck
∑∑==
+== 11
Where S = the number of sites in a given class s = the site identifier k = roadway functional class c = county identifier l = identifies the county level (described later in the section on statewide weighting) j = the vehicle type (i.e. passenger car, pick-up truck, van/mini-van or sport utility) B = number of observed belted passengers adjusted for the number of lanes U = number of observed un-belted passengers adjusted for the number of lanes

Rev. 4/18/07
The usage for the entire county is calculated by multiplying the average number of
observed belted, jlckB , and total users, jlckT , by the number of segments in a given class for a
given county, mck:
jlckk
ckjlc BmB ×=∑=
6
1
ˆ and
jlckk
ckjlc TmT ×=∑=
6
1
ˆ
Thus if we had the following distribution of roadway segments: Number in
Class County Sample1 5 52 44 63 25 14 0 05 26 86 78 2
Then for class 2,
6262524232221
2jlcjlcjlcjlcjlcjlc
jlc
BBBBBBB
+++++=
and for the county,
654321 7826025445ˆjlcjlcjlcjlcjlcjlcjlc BBBBBBB ×+×+×+×+×+×=
With the estimation of jlcB̂ and jlcT̂ , the weighted seatbelt usage for a particular vehicle
type in a given county is defined as:
jlc
jlcjlc T
BX ˆ
ˆˆ =
Given county wide estimates of seatbelt use, statewide estimates are calculated based on
the probability of the county being selected for the survey.
State Wide Weighting
The probability of a county being selected for inclusion in the survey is based on 2000
census population. The 4 most populated counties are automatically included and 12 more
counties are selected from the remaining counties (43) which account for 85% of the state of
Tennessee’s population. Therefore, two strata of counties can be created – Level 1 for the 4 most
populated counties and Level 2 for the remaining 43. Level 1 has only four counties and all four

Rev. 4/18/07
counties are surveyed so the entire population is known. Consequently, the population mean and
variance are known. Meanwhile, for Level 2 only a sample of counties is used so the population
statistics are estimated with the sample statistics.
Level 1 Counties
Shelby Davidson Knox Hamilton
Level 2 Counties
Anderson Coffee Henry Montgomery Tipton Bedford Cumberland Jefferson Obion Warren Blount Dickson Lawrence Putnam Washington Bradley Dyer Lincoln Roane Weakley Campbell Franklin Loudon Robertson Williamson Carter Gibson Madison Rutherford Wilson Cheatham Greene Maury Sevier Claiborne Hamblen McMinn Sullivan Cocke Hawkins Monroe Sumner
Given seatbelt use estimates for the level 1 and 2 counties, a statewide usage rate can be
estimated for a given vehicle type, j. For the level 1, the estimates of belt use are given by:
141312111ˆˆˆˆˆ
jjjjj BBBBB +++= and
141312111ˆˆˆˆˆ
jjjjj TTTTT +++= .
However, only 12 Level 2 counties are included in the survey, so county wide estimates
are adjusted to approximate the Level 2 wide usage:
∑=
=12
1
22 12
ˆˆ
c c
cjj z
BB and
∑=
=12
1
22 12
ˆˆ
c c
cjj z
TT
where zc ≡ probability of being chosen , or
∑=
=
= 43
1
c
cc
cc
population
populationz
Thus the statewide usage is estimated by the sum of the usage in the level 1 and 2 counties, or
21ˆˆˆ
jjj BBB += and
21ˆˆˆ
jjj TTT += so that

Rev. 4/18/07
j
jj T
BX ˆ
ˆˆ =
Variance of Statewide Estimates
The variance for the statewide estimate of belt usage is given by:
( ) ( ) ( )
( ) ( ){ }2ˆ,ˆ
2ˆ,ˆ
2ˆ
2ˆ
22ˆ
2ˆ2
2ˆ,ˆ
2ˆ,ˆ
21
212ˆ
2ˆ
2
21
212ˆ
2ˆ2
21
2
ˆˆˆˆ
2
ˆ
ˆ2ˆ
22112121
22112121
21
21
ˆ2ˆˆ1
ˆˆˆˆ
2ˆˆˆˆ
ˆˆ1
jjjjjjjj
jjjjjjjj
jj
jj
j
jj
TBTBjTTjBBj
TBTBjj
jjTT
jj
jjBB
jj
TTBB
T
BX
XXT
TTBB
TTBB
TT
σσσσσσ
σσσσσσ
σ
σσ
+−+++=
⎪⎭
⎪⎬⎫
⎪⎩
⎪⎨⎧
++
+−+⎟
⎟⎠
⎞⎜⎜⎝
⎛
+
+++
+=
=
=
+
+
The variance of the belted passengers and total passengers for Levels 1 and 2 are given
by:
)14(4
4
ˆˆ
4
1
11
2ˆ
1 −
⎟⎟⎠
⎞⎜⎜⎝
⎛−
=∑=c
jcj
B
BB
jσ and
)112(12
ˆˆ12
12
2
2ˆ
2 −
⎟⎟⎠
⎞⎜⎜⎝
⎛−
=∑=c
jc
cj
B
Bz
B
jσ
)14(4
4
ˆˆ
4
1
11
2ˆ
1 −
⎟⎟⎠
⎞⎜⎜⎝
⎛−
=∑=c
jcj
T
TT
jσ and
)112(12
ˆˆ12
12
2
2ˆ
2 −
⎟⎟⎠
⎞⎜⎜⎝
⎛−
=∑=c
jc
cj
T
Tz
T
jσ
meanwhile the covariances are given by
)14(4
4
ˆˆ
4
ˆˆ
4
1
11
11
2ˆ,ˆ
11 −
⎟⎟⎠
⎞⎜⎜⎝
⎛−⎟
⎟⎠
⎞⎜⎜⎝
⎛−
=∑=c
jcj
jcj
TB
TT
BB
jjσ and
)112(12
ˆˆ
ˆˆ12
12
22
2
2ˆ,ˆ
22 −
⎟⎟⎠
⎞⎜⎜⎝
⎛−⎟
⎟⎠
⎞⎜⎜⎝
⎛−
=∑=c
jc
cjj
c
cj
TB
Tz
TB
zB
jjσ
Confidence intervals
With estimates of the statewide safety belt usage and its variance, the 95% confidence
interval is given by 2ˆ96.1ˆ..
jXjXIC σm=

Attachment 5
Tennessee Department of Health Population Projections


Taken from “Tennessee Population Projections, 2000-2010” published online at http://health.state.tn.us/statistics/PdfFiles/HispanicPopProj_0703Full.pdf by Tennessee Department of Health, Office of Policy, Planning and Assessment, Division of Health Statistics 2008.
81

82
82

83
83

84
84

Taken from “Tennessee Population Projections, 2000-2010” published online at http://health.state.tn.us/statistics/PdfFiles/PopProj_2000-2010Full.pdf by Tennessee Department of Health, Office of Policy, Planning and Assessment, Division of Health Statistics 2008.
85

Prepared By:
Tennessee Department of Safety Research, Planning, and Development
Division Menzler-Nix Building, 1150 Foster Avenue
Nashville, TN 37243


![NIGHT SEAT BELT ENFORCEMENT DEMONSTRATION PROGRAM AND EVALUATION [NIGHT SEAT BELT ENFORCEMENT: NHTSA Contract - DTNH22-05-R-05094] Preusser Research Group,](https://static.fdocuments.us/doc/165x107/5a4d1acb7f8b9ab05996f8c0/night-seat-belt-enforcement-demonstration-program-and-evaluation-night-seat.jpg)