Safe Kids Kansas
56
Safe Kids Kansas Report on Unintentional Injuries in Kansas Children
Transcript of Safe Kids Kansas

Safe Kids Kansas Report on
Unintentional
Injuries in Kansas
Children

1
1Demographic
Report Preparation
Dan Dao, M.P.H Epidemiologist Kansas Injury Prevention and Disability Program Bureau of Health Promotion, KDHE Report Supervision Ghazala Perveen, M.B.B.S, Ph.D., M.P.H Director of Science and Surveillance/Health Officer II Bureau of Health Promotion, KDHE Lori Haskett Director of Injury Prevention and Disability Program Bureau of Health Promotion, KDHE Contact Information For additional information please contact Cherie Sage Director of Safe Kids Kansas Bureau of Health Promotion, KDHE Daina Hodges Outreach Coordinator Safe Kids Kansas Bureau of Health Promotion, KDHE Bureau of Health Promotion Kansas Department of Health and Environment 1000 SW Jackson STE 230 Topeka, KS 66612 Phone: (785) 291‐3742
Created April 2012

Table of Contents Introduction ............................................................................................................................................................ 3 Executive Summary ............................................................................................................................................. 3 Demographic Data ............................................................................................................................................... 5
Emergency Department Data ............................................................................................................................... 14 Hospital Discharge Data ........................................................................................................................................ 19 Mortality Data ....................................................................................................................................................... 38 Appendix ................................................................................................................................................................... i

3
3Demographic
Introduction EXECUTIVE SUMMARY Preventable injury remains the leading killer of Kansas children ages 1‐14, taking more lives than any other cause including chronic diseases, homicide and suicide1. Injuries among children, unlike many diseases such as cancers, can be prevented. A helmet while biking or participating in another wheeled sport on a child can prevent a traumatic brain injury (TBI), and possibly death. A correctly used car seat or seatbelt can keep a child from being ejected during a car crash. Simple injury prevention strategies have the potential to save childrens lives. Here are some key findings described in this report. Among children 0‐14 years old:
Motor vehicle crashes are the leading cause of unintentional injury death.
Falls are the leading cause of unintentional injury hospital discharge and emergency department visits.
From 2007‐2008 there were 50,525 unintentional injury emergency department visits.
From 2005‐2009 there were 4,290 unintentional injury hospital discharges.
From 2000‐2010 there were 629 unintentional injury deaths. The purpose of this document is to provide an overview and brief summaries of analysis of unintentional injury in children ages 0‐14 in Kansas. Please refer to the appendix for information regarding databases, injury coding and basic statistics.
1 CDC ‐ Fatal Injury Data ‐ WISQARS ‐ Injury. (2011, January 1).CDC‐ WISQARS ‐ Injury. Retrieved January 11, 2012, from http://www.cdc.gov/injury/wisqars/fatal.html

Demographic Data:
GEOGRAPHIC ANALYSIS: In order to gain a greater understanding of how causes of unintentional injury relate to a child’s location, data is reviewed regarding region as well as population density (see page 5). The regions are those defined by the Kansas Trauma Program: Northcentral, Northeast, Northwest, Southcentral, Southeast and Southwest (Table DD1). Population density refers to the number of persons residing per square mile. There are five levels of population density: frontier, rural, densely‐settled rural, suburban, and urban (Table DD2).
Table DD1. Population of Kansas Children by Trauma Region, Kansas 2009
Trauma Region
Children 0‐14 years old
Count % of Children 0‐14 years old
Northcentral 24,170 4.1%
Northeast 293,385 49.9%
Northwest 15,658 2.7%
Southcentral 179,991 30.6%
Southeast 35,758 6.1%
Southwest 39,561 6.7%
Total 588,523 100.0% Source: 2009 U.S. Census Bureau Data
Most children in Kansas 0‐14 years old in 2009 resided in the Northeast and Southcentral Trauma Regions. These regions contain larger cities such as Topeka, Lawrence, Kansas City, and Overland Park in the Northeast Trauma Region, and Wichita for the Southcentral Trauma Region. These two regions account for 80% of the Kansas child population 0‐14 years old in 2009 (Table DD1).
Table DD2. Population of Kansas Children by Population Density, Kansas 2009
Population Density
All Persons Per Square Mile
Children 0‐14 years old
Count % of Children 0‐14 years old
Frontier 0.0‐5.9 21,342 3.6%
Rural 6.0‐19.9 49,972 8.5%
DSR 20.0‐39.9 94,289 16.0%
Semi‐Urban 40.0‐149.9 89,295 15.2%
Urban 150.0+ 333,625 56.7%
Total 588,523 100.0% Source: 2009 U.S. Census Bureau Data
Referring to 2009 Census data, the majority of Kansas children 0‐14 years old resided in Urban communities (57 percent) (Table DD2). Only 12.1 percent of children resided in Frontier and Rural communities (Table DD2).

5
5Demographic

Table DD3. Population of Children 0‐14 years old in Kansas by Trauma Region, Kansas 2009
Trauma Region County Population 0‐14
years old % of Population 0‐14
years old
Northcentral Clay 1,690 6.99%
Cloud 1,599 6.62%
Dickinson 3,776 15.62%
Ellsworth 905 3.74%
Jewell 417 1.73%
Lincoln 561 2.32%
Mitchell 1,083 4.48%
Osborne 612 2.53%
Ottawa 1,216 5.03%
Republic 717 2.97%
Saline 11,042 45.68%
Smith 552 2.28%
Total 24,170 100.00%
Northeast County Population 0‐14
years old % of Population 0‐14
years old
Anderson 1,668 0.57%
Atchison 3,309 1.13%
Brown 2,054 0.70%
Chase 560 0.19%
Coffey 1,666 0.57%
Doniphan 1,323 0.45%
Douglas 17,464 5.95%
Franklin 5,547 1.89%
Geary 7,153 2.44%
Jackson 2,964 1.01%
Jefferson 3,386 1.15%
Johnson 115,833 39.48%
Leavenworth 15,646 5.33%
Linn 1,791 0.61%
Lyon 6,387 2.18%
Marshall 1,923 0.66%
Miami 6,762 2.30%
Morris 1,046 0.36%
Nemaha 2,110 0.72%
Osage 3,172 1.08%
Pottawatomie 4,604 1.57%
Riley 11,649 3.97%
Shawnee 36,198 12.34%
Wabaunsee 1,393 0.47%
Washington 1,051 0.36%
Wyandotte 36,726 12.52%
Total 293,385 100.00%

7
7Demographic
Table DD3. Population of Children 0‐14 years old in Kansas by Trauma Region, Kansas 2009
Northwest County Population 0‐14
years old % of Population 0‐14
years old
Cheyenne 419 2.68%
Decatur 423 2.70%
Ellis 4,678 29.88%
Gove 458 2.93%
Graham 364 2.32%
Logan 449 2.87%
Ness 492 3.14%
Norton 843 5.38%
Phillips 930 5.94%
Rawlins 338 2.16%
Rooks 928 5.93%
Rush 508 3.24%
Russell 1,158 7.40%
Sheridan 465 2.97%
Sherman 1,067 6.81%
Thomas 1,375 8.78%
Trego 491 3.14%
Wallace 272 1.74%
Total 15,658 100.00%
Southcentral County Population 0‐14
years old % of Population 0‐14
years old
Barber 808 0.45%
Barton 5,569 3.09%
Butler 13,836 7.69%
Comanche 341 0.19%
Cowley 6,809 3.78%
Edwards 616 0.34%
Harper 1,087 0.60%
Harvey 7,045 3.91%
Kingman 1,392 0.77%
Kiowa 405 0.23%
Marion 2,125 1.18%
McPherson 5,397 3.00%
Pawnee 1,110 0.62%
Pratt 1,792 1.00%
Reno 12,332 6.85%
Rice 1,924 1.07%
Sedgwick 111,758 62.09%
Stafford 794 0.44%
Sumner 4,851 2.70%
Total 179,991 100.00%
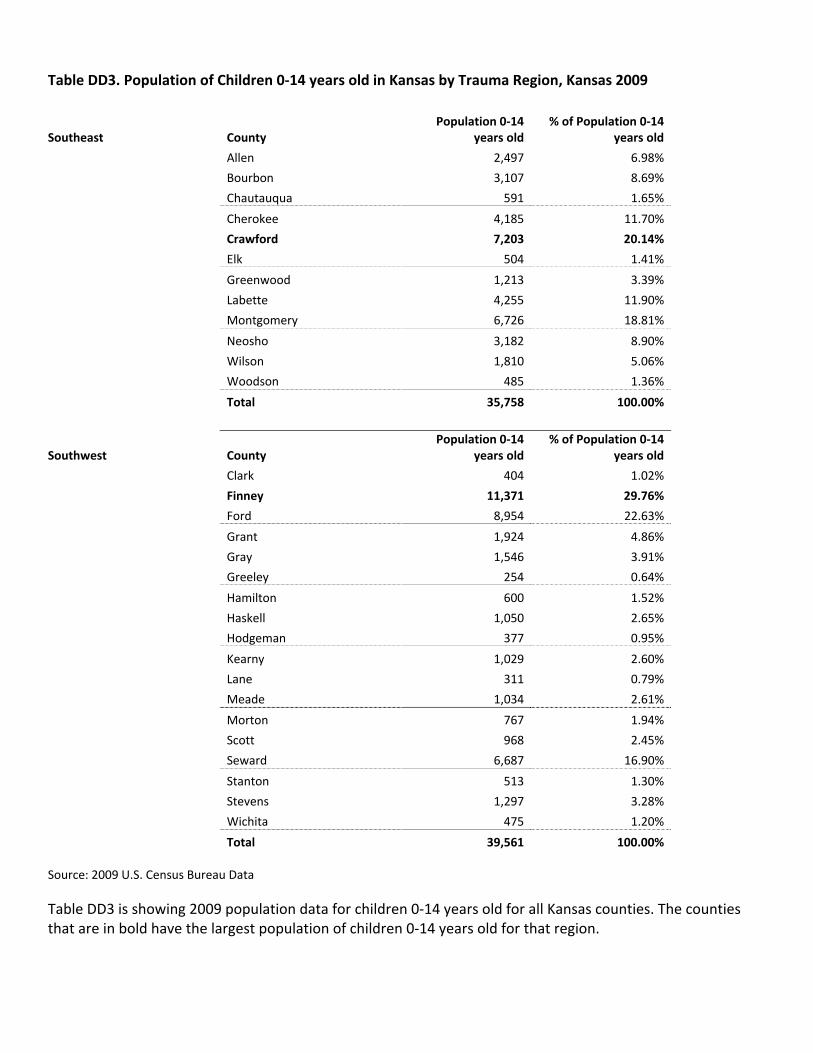
Table DD3. Population of Children 0‐14 years old in Kansas by Trauma Region, Kansas 2009
Southeast County Population 0‐14
years old % of Population 0‐14
years old
Allen 2,497 6.98%
Bourbon 3,107 8.69%
Chautauqua 591 1.65%
Cherokee 4,185 11.70%
Crawford 7,203 20.14%
Elk 504 1.41%
Greenwood 1,213 3.39%
Labette 4,255 11.90%
Montgomery 6,726 18.81%
Neosho 3,182 8.90%
Wilson 1,810 5.06%
Woodson 485 1.36%
Total 35,758 100.00%
Southwest County Population 0‐14
years old % of Population 0‐14
years old
Clark 404 1.02%
Finney 11,371 29.76%
Ford 8,954 22.63%
Grant 1,924 4.86%
Gray 1,546 3.91%
Greeley 254 0.64%
Hamilton 600 1.52%
Haskell 1,050 2.65%
Hodgeman 377 0.95%
Kearny 1,029 2.60%
Lane 311 0.79%
Meade 1,034 2.61%
Morton 767 1.94%
Scott 968 2.45%
Seward 6,687 16.90%
Stanton 513 1.30%
Stevens 1,297 3.28%
Wichita 475 1.20%
Total 39,561 100.00% Source: 2009 U.S. Census Bureau Data
Table DD3 is showing 2009 population data for children 0‐14 years old for all Kansas counties. The counties that are in bold have the largest population of children 0‐14 years old for that region.

9
9Demographic
RACE Table DD4. Racial Makeup of Children 0‐14 years old by Trauma Region, Kansas 2009
Trauma Region Race Group
Population 0‐14 years
old
% of Population 0‐14 years old by Trauma
Region Northcentral White Non‐Hispanic 20,500 84.8% Hispanic 2,199 9.1% African American Non‐Hispanic 1,020 4.2% Other 451 1.9%
Total 24,170 100.0%
Northeast White Non‐Hispanic 214,168 73.0% Hispanic 36,809 12.5% African American Non‐Hispanic 29,693 10.1% Other 12,715 4.4%
Total 293,385 100.0%
Northwest White Non‐Hispanic 14,231 90.9% Hispanic 1,001 6.4% African American Non‐Hispanic 286 1.8% Other 140 0.9%
Total 15,658 100.0%
Southcentral White Non‐Hispanic 129,232 71.8% Hispanic 26,646 14.8% African American Non‐Hispanic 16,418 9.1% Other 7,695 4.3%
Total 179,991 100.0%
Southeast White Non‐Hispanic 30,862 86.3% African American Non‐Hispanic 1,906 5.3% Hispanic 1,855 5.2% Other 1,135 3.2%
Total 35,758 100.0%
Southwest Hispanic 21,859 55.3% White Non‐Hispanic 16,209 41.0% African American Non‐Hispanic 810 2.1% Other 683 1.7%
Total 39,561 100.0%
Kansas Overall White Non‐Hispanic 425,202 72.2% Hispanic 90,369 15.4% African American Non‐Hispanic 50,133 8.5% Other 22,819 3.9%
Total 588,523 100.0%
Source: 2009 U.S. Census Bureau Note: Other race includes: Native American Non‐Hispanic, Asian or Pacific Islander Non‐Hispanic

Figure DD1. Racial Make‐Up of Children 0‐14 years old in Kansas by Trauma Region,
Kansas 2009
72%
15%
9%4%
Kansas Overall
White Non Hispanic
Hispanic
African American Non Hispanic
Other
85%
9%
4% 2%
Northcentral
White NonHispanic
Hispanic
African AmericanNon Hispanic
Other73%
14%
10%
4%
Northeast
White NonHispanic
Hispanic
African AmericanNon Hispanic
Other

11
11Demographic
Source: 2009 U.S. Census Bureau Note: Other race includes: Native American Non‐Hispanic, Asian or Pacific Islander Non‐Hispanic
The overall racial makeup of children 0‐14 years old in Kansas is fairly consistent across all regions (Table DD4, Figure DD1). A majority of the children living in Kansas in 2009 were White (72%, n=425,202); the second highest racial group were Hispanics (15%, n=90,369). Most of the regions in Kansas had the same racial makeup for children, predominately White with Hispanics being the largest minority race group. The one exception is the Southwest Region in which half of all children ages 14 years and younger were Hispanic (55%, n=21,859).
55%
41%
2% 2%
Southwest
Hispanic
White NonHispanic
African AmericanNon Hispanic
Other
91%
6%
2% 1%
Northwest
White NonHispanic
Hispanic
African AmericanNon Hispanic
Other72%
15%
9%
4%
Southcentral
White NonHispanic
Hispanic
African AmericanNon Hispanic
Other
Figure DD1. Racial Make‐Up of Children 0‐14 years old in Kansas by Trauma
Region, Kansas 2009
87%
5%5% 3%
Southeast
White NonHispanic
African AmericanNon Hispanic
Hispanic
Other

Table DD5. Racial Makeup of Children 0‐14 years old by Population Density, Kansas 2009
Population Density Race Population 0‐14 years old
% of Population 0‐14 years old by Population
Density Frontier White Non‐Hispanic 18,012 84.4% Hispanic 2,846 13.3% African American Non‐Hispanic 271 1.3% Other 213 1.0%
Total 21,342 100.0%
Rural White Non‐Hispanic 43,233 86.5% Hispanic 4,815 9.6% African American Non‐Hispanic 1,149 2.3% Other 775 1.6%
Total 49,972 100%
Densely Settled‐Rural White Non‐Hispanic 64,716 68.6% Hispanic 24,211 25.7% African American Non‐Hispanic 3,198 3.4% Other 2,164 2.3%
Total 94,289 100%
Semi‐Urban White Non‐Hispanic 72,479 81.2% Hispanic 8,452 9.5% African American Non‐Hispanic 5,943 6.7% Other 2,421 2.7%
Total 89,295 100%
Urban White Non‐Hispanic 226,762 68.0% Hispanic 50,045 15.0% African American Non‐Hispanic 39,572 11.9% Other 17,246 5.2%
Total 333,625 100%
Kansas Overall White Non‐Hispanic 425,202 72.2% Hispanic 90,369 15.4% African American Non‐Hispanic 50,133 8.5% Other 22,819 3.9%
Total 588,523 100.0%
Source: 2009 U.S. Census Bureau Note: Other race includes: Native American Non‐Hispanic, Asian or Pacific Islander Non‐Hispanic
When looking at the racial makeup of different population densities most show similar racial distributions in children as compared to the state among children ages 0‐14 years old in 2009 (Table DD5). Densely settled rural communities had the highest percentage of Hispanic children (26%, n=24,211). Urban communities were still predominantly White but had much higher proportions of Hispanic and African American Non‐Hispanic children.

13
13Demographic
ECONOMIC MAKEUP Table DD6. Percentage of Children (18 years old and younger) and Adults Living in Poverty by Trauma Region, Kansas 2009
Trauma Region
% Living in Poverty All
Ages
% Living in Poverty Under
18 years old
Northcentral 12.1% 17.3%
Northeast 12.8% 15.7%
Northwest 12.5% 15.8%
Southcentral 12.9% 17.4%
Southeast 17.8% 25.7%
Southwest 13.6% 19.2%
Kansas Overall 13.2% 17.1%
2009 U.S. Census Bureau1
According to the US Census2 overall 17.1% of all children (18 years and younger) in Kansas were living in poverty in 2009 (Table DD6). Most of the regions have 15% to 19% of children living in poverty with the exception of the Southeast Trauma Region where roughly one quarter of the children (25.7%) were living in poverty. The Southeast Trauma Region also has the highest rate of poverty among all ages, 17.8%.
Table DD7. Percentage of Children (18 years old and younger) and Adults living in Poverty by Population Density, Kansas 2009
Population Density
% Living in Poverty All
Ages
% Living in Poverty Under 18 years old
Frontier 13.0% 18.8%
Densely‐Settled Rural 14.1% 19.3%
Rural 12.0% 16.9%
Semi‐Urban 14.7% 17.4%
Urban 12.7% 16.3%
Kansas Overall 13.2% 17.1%
2009 U.S. Census Bureau1
The overall rate of poverty in Kansas was 13.2% for all ages in 2009 (Table DD7). When looking at population density regions, the highest prevalence of poverty among children was seen in those living in densely‐settled rural communities (19.3%).
2 About saipe.s. census bureau. (n.d.). Retrieved from http://www.census.gov/did/www/saipe/about/index.html

Emergency Department Visits
Quick Facts: From 2007‐2008 there were 50,525 unintentional injury emergency department visits (UIEDV) among
children ages 0‐14 years old. 58% of all UIEDV were male (n=29,433) and 42% were female (n=21,087).
Highest UIEDV rate was in children ages one to four years old.
Falls are the leading cause of UIEDV.
Traumatic Brain Injury (TBI) UIEDV rate was highest in children under the age of one.
BY AGE
Table ED1. Age‐Specific Unintentional Injury Emergency Department Visits (UIEDV) Rates Kansas 2007‐2008
Age Group (Years) # UIEDV
Population Size 0‐14 years old
2007‐2008 UIEDV Rate* Lower 95% CI Upper 95% CI
<1 2,102 82,851 2,537.1 2,428.6 2,645.5
1‐4 18,177 315,816 5,755.6 5,671.9 5,839.2
5‐9 14,274 382,737 3,729.5 3,668.3 3,790.6
10‐14 15,972 376,501 4,242.2 4,176.4 4,308.0
0‐14 50,525 1,157,905 4,363.5 4,325.4 4,401.5 Source: 2007‐2008 Emergency Department Database, Kansas Hospital Association. 2007‐2008 U.S. Census Bureau. *Rate per 100,000 population
Unintentional injury emergency department visit rates were highest in children between the ages of one and four years (5,755.6 UIEDV visits per 100,000 population, 95% CI: 5,671.9‐5,839.2) from 2007 to 2008, (Figure ED1 and Table ED1). The lowest rate was among children under the age of one year (2,537.1 UIEDV visits per 100,000 population, 95% CI: 2,428.6‐2,645.5).
2,537.1
5,755.6
3,729.5
4,242.2
0
1000
2000
3000
4000
5000
6000
7000
<1 1‐4 5‐9 10‐14
UIEDV Rate per 100,000 population
Age Group
Figure ED1. Age‐Specific Unintentional Injury Emergency Department Visit (UIEDV) Rates
Kansas 2007‐2008

15
15Emergency Department Visits
Table ED2. Age‐Specific Top Five Causes of Unintentional Injury Emergency Department Visits (UIEDV)
Kansas 2007‐2008
Age Group (Years) Cause # of UIEDV % Total UIEDV by Age
Group <1 Falls 951 45% Struck By/Against 249 12% Other Specified 170 8% Natural / Environmental 134 6% Fire / Burn 116 6% All Other 482 23%
Total 2,102 100%
1‐4 Falls 7,094 39% Struck by/Against 2,811 15% Natural / Environmental 1,845 10% Other Specified 1,564 9% Cut / Pierce 1,091 6% All Other 3,772 21%
Total 18,177 100%
5‐9 Falls 4,986 35% Struck by/Against 2,986 21% Cut / Pierce 1,326 9% Natural / Environmental 1,230 9% Other Specified 984 7% All Other 2,762 19%
Total 14,274 100%
10‐14 Falls 4,552 29% Struck by / Against 4,211 26% Overexertion 1,581 10% Cut / Pierce 1,482 9% Natural / Environmental 749 5% Other Pedal Cyclist 681 4% All Other 2,716 17%
Total 15,972 100%
0‐14 Falls 17,583 35% Struck by/Against 10,257 20% Cut / Pierce 3,974 8% Natural / Environmental 3,958 8% Other Specified 3,392 7% All Other 11,361 22%
Total 50,525 100%
Source: 2007‐2008 Emergency Department Database, Kansas Hospital Association.
Falls were the leading cause of UIEDV visits among children ages 0‐14 years old from 2007 to 2008 (35%, n=17,583). Struck by/Against was the second leading cause of UIEDV visits (20%, n=10,257) (Table ED2 and Figure ED2).

Figure ED2. Age‐Specific Top 5 Causes of Unintentional Injury Emergency Department Visits Kansas 2007‐2008
*N/EV: Natural/Environmental Source: 2007‐2008 Emergency Department Database, Kansas Hospital Association.
Falls35%
Struck by/ Against20%
Cut / Pierce8%
N/EV*8%
Other Specified
7%
All Others22%
0‐14 years old
Falls 45%
Struck By/
Against12%
Other Specified
8%
N/EV*6%
Fire / Burn6%
All Others23%
<1 years old
Falls39%
Struck by/ Against15%
N/EV*10%
Other Specified
9%
Cut / Pierce6%
All Others21%
1‐4 years old
Falls35%
Struck by/ Against21%
Cut / Pierce9%
N/EV*9%
Other Specified
7%
All Others19%
5‐9 years old
Falls29%
Struck by / Against26%
Overexertion10%
Cut / Pierce9%
N/EV*5%
Other Pedal Cyclist4%
All Others17%
10‐14

17
17Emergency Department Visits
TRAUMATIC BRAIN INJURY
Table ED3. Age‐Specific Traumatic Brain Injury (TBI) Related Unintentional Injury Emergency Department Visit (UIEDV) Rates, Kansas 2007‐2008
Age Group (Years) # TBI Related
UIEDV
Population Size 0‐14 years old
2007‐2008 TBI Related
UIEDV Rate* Lower 95% CI Upper 95% CI <1 467 82,851 563.7 512.5 614.8
1‐4 1,718 315,816 544.0 518.3 569.7
5‐9 858 382,737 224.2 209.2 239.2
10‐14 827 376,501 219.7 204.7 234.6
0‐14 3,870 1,157,905 334.2 323.7 344.8
*Rate per 100,000 population Source: 2007‐2008 Emergency Department Database, Kansas Hospital Association. 2007‐2008 U.S. Census Bureau.
TBI related UIEDV rates were much higher among younger children from 2007 to 2008 (Figure ED3 and Table ED3). Children under the age of one year (563.7 TBI related UIEDV visit per 100,000 population, 95% CI: 512.5‐614.8) and children between the ages of one and four years (544.0 TBI related UIEDV per 100,000 population, 95% CI: 518.3‐569.7) had statistically higher rates than those between the ages five to nine years (224.2 TBI related UIEDV per 100,000 population, 95% CI: 209.2‐239.2) and ten to fourteen years (219.7 TBI related UIEDV per 100,000 population, 95% CI: 204.7‐234.6).
563.7544
224.2 219.7
0
100
200
300
400
500
600
700
<1 1‐4 5‐9 10‐14
TBI R
elated
UIEDV Rate per 100,000 population
Age Group
Figure ED3. Age‐Specific Truamatic Brain Injury (TBI) Related Unintentional Injury Emergency Department Visit (UIEDV)
Rates, Kansas 2007‐2008

Table ED4. Unintentional Injury Emergency Department Visits (UIEDV) Cause with the Highest Prevelance of Traumatic Brain Injury (TBI), Kansas 2007‐2008
Cause # UIEDVW/ TBI
# UIEDV W/O TBI Total # UIEDV
% UIEDV W/TBI
Falls 2,291 15,292 17,583 13%
Struck By/Against 1,079 9,178 10,257 11%
Motor Vehicle Crash 154 1,366 1,520 10%
Other Transportation 67 633 700 10%
Other Pedal Cyclist 134 1,332 1,466 9%
All Other 145 18,854 18,999 1%
Total 3,870 46,655 50,525 8%
*For more information on Other Transportation see appendix xiii. Source: 2007‐2008 Emergency Department Database, Kansas Hospital Association.
From 2007 to 2008 among children 0‐14 years old, 8% of all UIEDV in Kansas involved a TBI. The cause with the highest prevalence of TBI was falls in which 13% of all UIEDV included a TBI (Table ED4).
19
Hospital Discharge 19
HOSPITAL DISCHARGES Quick Facts:
From 2005 to 2009 o There were 4,290 unintentional injury hospital discharges (UIHD) among children 0‐14 years
old. 62% of all UIHD were males (n=2,680) and 38% (n=1,596) were females. o Younger age children (under age one year and ages one to four years) are more likely to have
unintentional injury hospital discharges (UIHD) compared to older groups. o Falls are the leading cause of UIHD.
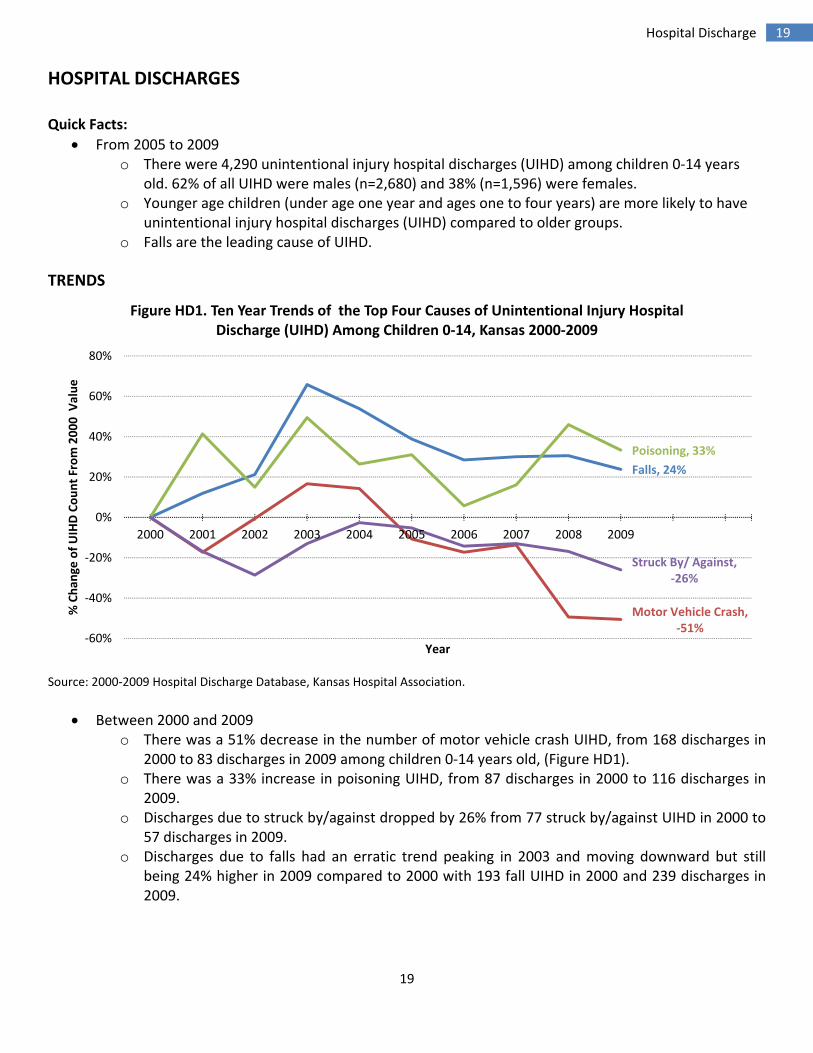
TRENDS
Source: 2000‐2009 Hospital Discharge Database, Kansas Hospital Association.
Between 2000 and 2009 o There was a 51% decrease in the number of motor vehicle crash UIHD, from 168 discharges in
2000 to 83 discharges in 2009 among children 0‐14 years old, (Figure HD1). o There was a 33% increase in poisoning UIHD, from 87 discharges in 2000 to 116 discharges in
2009. o Discharges due to struck by/against dropped by 26% from 77 struck by/against UIHD in 2000 to
57 discharges in 2009. o Discharges due to falls had an erratic trend peaking in 2003 and moving downward but still
being 24% higher in 2009 compared to 2000 with 193 fall UIHD in 2000 and 239 discharges in 2009.
Falls, 24%
Motor Vehicle Crash, ‐51%
Poisoning, 33%
Struck By/ Against, ‐26%
‐60%
‐40%
‐20%
0%
20%
40%
60%
80%
2000 2001 2002 2003 2004 2005 2006 2007 2008 2009
% Chan
ge of UIHD Count From 2000 V
alue
Year
Figure HD1. Ten Year Trends of the Top Four Causes of Unintentional Injury Hospital Discharge (UIHD) Among Children 0‐14, Kansas 2000‐2009

BY AGE
Table HD1. Age‐Specific Unintentional Injury Hospital Discharge (UIHD) Rates, Kansas 2005‐2009
Age Group (Years) # UIHD
Population Size 0‐14 years old
2005‐2009 UIHD Rate* Lower 95% CI Upper 95% CI <1 412 202,412 203.5 183.9 223.2
1‐4 1,538 783,689 196.3 186.4 206.1
5‐9 1,045 946,016 110.5 103.8 117.2
10‐14 1,295 943,747 137.2 129.7 144.7
0‐14 4,290 2,875,864 149.2 144.7 153.6
*Rate per 100,000 population Source: 2005‐2009 Hospital Discharge Database, Kansas Hospital Association. 2005‐2009 U.S. Census Bureau.
Among children 0‐14 years old, from 2005 to 2009, the age group with highest rate of UIHD was children under the age of one year (203.5 UIHDs per 100,000 population, 95% CI: 183.9‐223.2) and children between the ages of one and four years (196.3 UIHDs per 100,000 population, 95% CI: 186.4‐206.1), Figure HD2 and Table HD1. Both of these groups had statistically significant higher rates than those in the five to nine age group (110.5 UIHD per 100,000 population, 95% CI: 103.8‐117.2) and those in the ten to fourteen age group (137.2 UIHD per 100,000 population, 95% CI: 129.7‐144.7).
203.5196.3
110.5
137.2
0
50
100
150
200
250
<1 1‐4 5‐9 10‐14
Unintentional Injury Related
HD Rate per 100,000
population
Age Group
Figure HD2. Age‐Specific Unintentional Injury HospitalDischarge (UIHD) Rates, Kansas 2005‐2009
21
Hospital Discharge 21
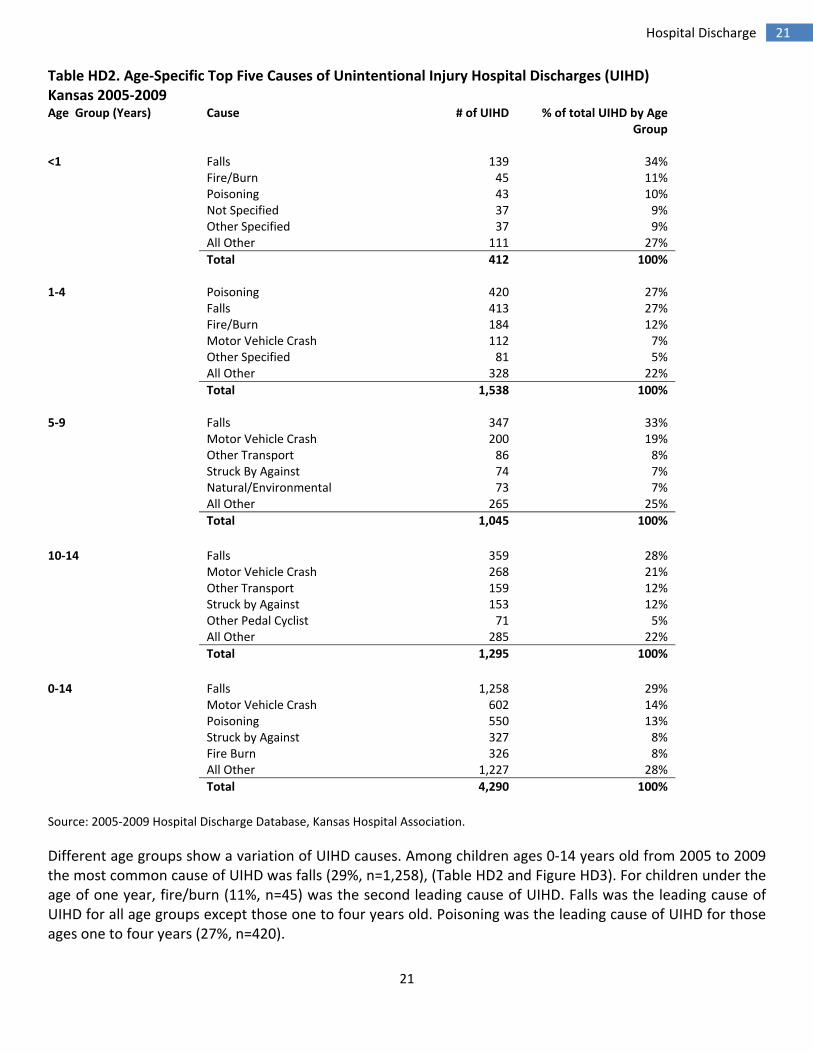
Table HD2. Age‐Specific Top Five Causes of Unintentional Injury Hospital Discharges (UIHD) Kansas 2005‐2009 Age Group (Years) Cause # of UIHD % of total UIHD by Age
Group <1 Falls 139 34% Fire/Burn 45 11% Poisoning 43 10% Not Specified 37 9% Other Specified 37 9% All Other 111 27%
Total 412 100% 1‐4 Poisoning 420 27% Falls 413 27% Fire/Burn 184 12% Motor Vehicle Crash 112 7% Other Specified 81 5% All Other 328 22%
Total 1,538 100% 5‐9 Falls 347 33% Motor Vehicle Crash 200 19% Other Transport 86 8% Struck By Against 74 7% Natural/Environmental 73 7% All Other 265 25%
Total 1,045 100%
10‐14 Falls 359 28% Motor Vehicle Crash 268 21% Other Transport 159 12% Struck by Against 153 12% Other Pedal Cyclist 71 5% All Other 285 22%
Total 1,295 100%
0‐14 Falls 1,258 29% Motor Vehicle Crash 602 14% Poisoning 550 13% Struck by Against 327 8% Fire Burn 326 8% All Other 1,227 28%
Total 4,290 100%
Source: 2005‐2009 Hospital Discharge Database, Kansas Hospital Association.
Different age groups show a variation of UIHD causes. Among children ages 0‐14 years old from 2005 to 2009 the most common cause of UIHD was falls (29%, n=1,258), (Table HD2 and Figure HD3). For children under the age of one year, fire/burn (11%, n=45) was the second leading cause of UIHD. Falls was the leading cause of UIHD for all age groups except those one to four years old. Poisoning was the leading cause of UIHD for those ages one to four years (27%, n=420).

Figure HD3. Age‐Specific Top Five Causes of Unintentional Injury Hospital Discharges Kansas 2005–2009
*N/EV: Natural/Environmental Source: 2005‐2009 Hospital Discharge Database, Kansas Hospital Association.
Falls 29%
MVTC14%
Poisoning13%
Struck by Against8%
Fire Burn7%
All Others29%
0‐14 years old
Falls 34%
Fire/Burn11%Poisoning
10%
Not Specified
9%
Other Specified
9%
All Others27%
<1 years old
Poisoning27%
Falls27%
Fire/Burn12%
MVTC7%
Other Specified
5%
All Others22%
1‐4 years old
Falls33%
MVTC19%
Other Transport
8%
Struck By Against7%
Natural Environme
ntal7%
All Others26%
5‐9 years old
Falls28%
MVTC21%
Other Transport
12%
Struck by Against12%
Other Pedal Cyclist 5%
All Others22%
10‐14 years old
23
Hospital Discharge 23
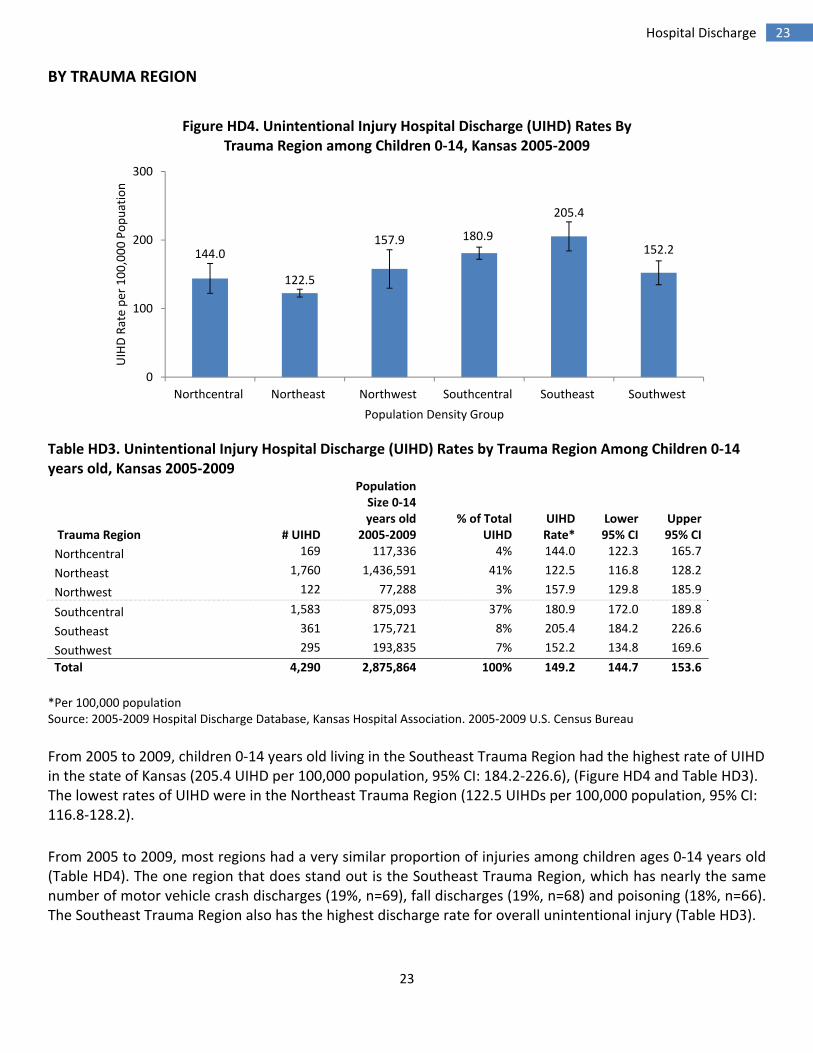
BY TRAUMA REGION
Table HD3. Unintentional Injury Hospital Discharge (UIHD) Rates by Trauma Region Among Children 0‐14 years old, Kansas 2005‐2009
Trauma Region # UIHD
Population Size 0‐14 years old
2005‐2009 % of Total
UIHD UIHD Rate*
Lower 95% CI
Upper 95% CI
Northcentral 169 117,336 4% 144.0 122.3 165.7
Northeast 1,760 1,436,591 41% 122.5 116.8 128.2
Northwest 122 77,288 3% 157.9 129.8 185.9
Southcentral 1,583 875,093 37% 180.9 172.0 189.8
Southeast 361 175,721 8% 205.4 184.2 226.6
Southwest 295 193,835 7% 152.2 134.8 169.6
Total 4,290 2,875,864 100% 149.2 144.7 153.6
*Per 100,000 population Source: 2005‐2009 Hospital Discharge Database, Kansas Hospital Association. 2005‐2009 U.S. Census Bureau
From 2005 to 2009, children 0‐14 years old living in the Southeast Trauma Region had the highest rate of UIHD in the state of Kansas (205.4 UIHD per 100,000 population, 95% CI: 184.2‐226.6), (Figure HD4 and Table HD3). The lowest rates of UIHD were in the Northeast Trauma Region (122.5 UIHDs per 100,000 population, 95% CI: 116.8‐128.2).
From 2005 to 2009, most regions had a very similar proportion of injuries among children ages 0‐14 years old (Table HD4). The one region that does stand out is the Southeast Trauma Region, which has nearly the same number of motor vehicle crash discharges (19%, n=69), fall discharges (19%, n=68) and poisoning (18%, n=66). The Southeast Trauma Region also has the highest discharge rate for overall unintentional injury (Table HD3).
144.0
122.5
157.9 180.9
205.4
152.2
0
100
200
300
Northcentral Northeast Northwest Southcentral Southeast Southwest
UIHD Rate per 100,000 Popuation
Population Density Group
Figure HD4. Unintentional Injury Hospital Discharge (UIHD) Rates By Trauma Region among Children 0‐14, Kansas 2005‐2009

Table HD4. Top Five Causes of Unintentional Injury Hospital Discharges (UIHD) by Trauma Region Among Children 0‐14 years old, Kansas 2005‐2009
Trauma Region Cause # of UIHD % of total UIHD by
Trauma Region Northcentral Falls 47 28% Motor Vehicle Crash 29 17% Poisoning 22 13% Struck By Against 15 9% Other Transportation 13 8% All Other 43 25%
Total 169 100%
Northeast Falls 508 29% Motor Vehicle Crash 235 13% Fire/Burn 194 11% Poisoning 193 11% Struck By Against 136 8% All Other 494 28%
Total 1,760 100%
Northwest Falls 42 34% Motor Vehicle Crash 24 20% Struck By Against 11 9% Other Specified 8 7%
Fire/Burn 7 6% Poisoning 7 6% All Other 23 19%
Total 122 100%
Southcentral Falls 508 32% Poisoning 237 15% Motor Vehicle Crash 204 13% Struck By Against 116 7% Other Transport 96 6% All Other 422 27%
Total 1,583 100%
Southeast Falls 69 19% Motor Vehicle Crash 68 19% Poisoning 66 18% Other Transport 30 8% Natural / Environmental 27 7% All Other 101 28%
Total 361 100%

25
Hospital Discharge 25
Southwest Falls 84 28% Motor Vehicle Crash 42 14% Fire / Burn 29 10% Poisoning 25 8%
Natural / Environmental 23 8% Other Transport 23 8% Struck By Against 23 8% All Other 46 16%
Total 295 100%
Source: 2005‐2009 Hospital Discharge Database, Kansas Hospital Association.
BY POPULATION DENSITY
Table HD5. Unintentional Injury Hospital Discharge (UIHD) Rates by Population Density Among Children 0‐14 years old , Kansas 2005‐2009
Population Density Group # of UIHD
Population Size 0‐14 years old
2005‐2009 % of Total
UIHD UIHD Rate*
Lower 95% CI
Upper 95% CI
Urban 2,234 1,633,184 52% 136.8 131.1 142.5
Semi‐Urban 661 431,241 15% 153.3 141.6 165.0
Densely Settled Rural 755 464,799 18% 162.4 150.8 174.0
Rural 446 241,585 10% 184.6 167.5 201.7
Frontier 194 105,055 5% 184.7 158.7 210.7
Total 4,290 2,875,864 100% 149.2 144.7 153.6 *Per 100,000 population Source: 2005‐2009 Hospital Discharge Database, Kansas Hospital Association. 2005‐2009 U.S. Census Bureau
136.8
153.3162.4
184.6 184.7
0
100
200
300
Urban Semi‐Urban Densely SettledRural
Rural Frontier
UIHD Rate per 100,000 Popuation
Population Density Group
Figure HD5. Unintentional Injury Hospital Discharge (UIHD) Rates By Population Density among Children 0‐14, Kansas 2005‐2009

From 2005 to 2009, children ages 0‐14 years old living in Urban areas had lower discharge rates for unintentional injury (136.8 UIHD per 100,000 population, 95% CI: 131.1‐142.5) compared to those living in Frontier areas (184.7 UIHD per 100,000 population, 95% CI: 158.7‐210.7), Figure HD5 and Table HD5. Frontier and Rural groups have very similar rates, while Urban and Semi‐Urban have similar rates. Table HD6. Top Five Causes of Unintentional Injury Hospital Discharges (UIHD) by Population Density Group Among Children 0‐14 years old, Kansas 2005‐2009 Population Density Group
Cause # of UIHD
% of Total UIHD byPopulation Density
Frontier Falls 48 25% Motor Vehicle Crash 35 18% Struck by/Against 20 10% Other Transportation 16 8% Poisoning 16 8% All Others 59 30%
Total 194 100% Rural Falls 112 25% Motor Vehicle Crash 75 17% Poisoning 52 12% Other Transportation 47 11% Natural/Environmental 32 7% All Others 128 29%
Total 446 100% Densely Settled Rural Falls 191 25% Motor Vehicle Crash 112 15% Poisoning 98 13% Struck by/Against 62 8% Other Transportation 61 8% All Others 231 31%
Total 755 100% Semi‐Urban Falls 188 28% Motor Vehicle Crash 103 16% Poisoning 97 15% Struck by/Against 51 8% Other Transportation 47 7% All Others 175 27%
Total 661 100% Urban Falls 719 32% Motor Vehicle Crash 287 13% Poisoning 277 12% Fire/Burn 189 8%
Struck by/Against 168 8% All Others 594 27%
Total 2,234 100% Source: 2005‐2009 Hospital Discharge Database, Kansas Hospital Association.
27
Hospital Discharge 27
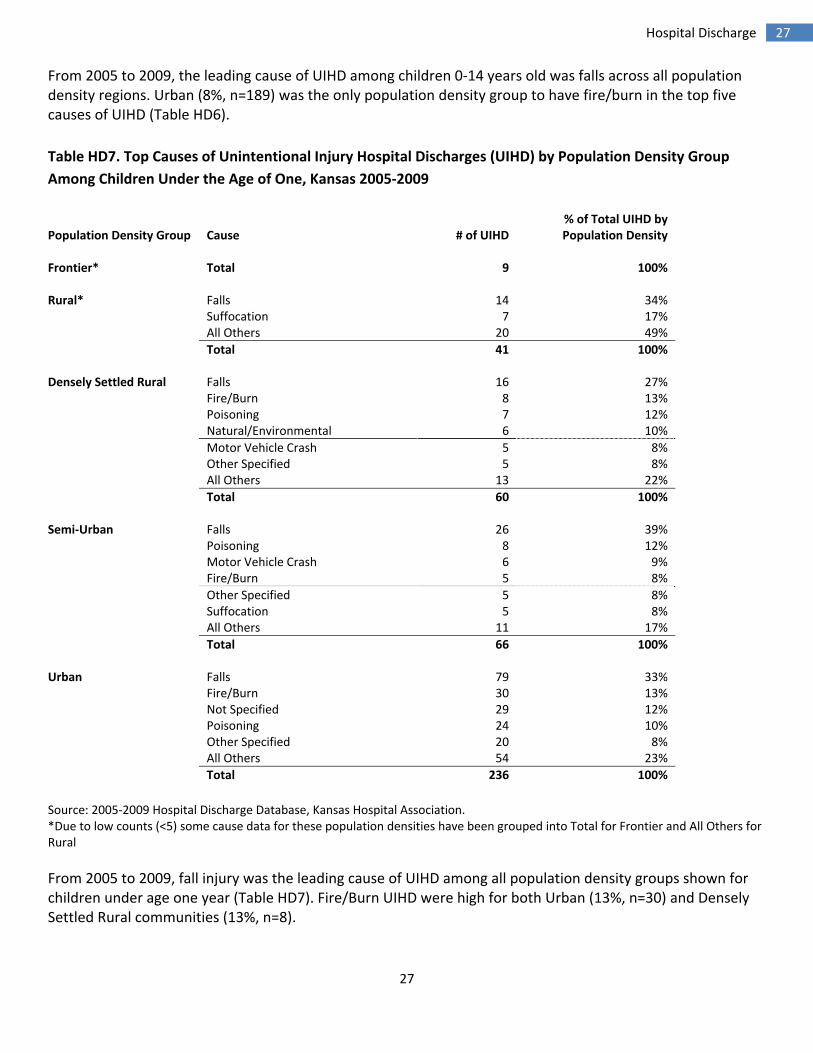
From 2005 to 2009, the leading cause of UIHD among children 0‐14 years old was falls across all population density regions. Urban (8%, n=189) was the only population density group to have fire/burn in the top five causes of UIHD (Table HD6).
Table HD7. Top Causes of Unintentional Injury Hospital Discharges (UIHD) by Population Density Group
Among Children Under the Age of One, Kansas 2005‐2009
Population Density Group
Cause # of UIHD
% of Total UIHD byPopulation Density
Frontier* Total 9 100% Rural* Falls 14 34% Suffocation 7 17% All Others 20 49%
Total 41 100% Densely Settled Rural Falls 16 27% Fire/Burn 8 13% Poisoning 7 12% Natural/Environmental 6 10%
Motor Vehicle Crash 5 8% Other Specified 5 8% All Others 13 22%
Total 60 100% Semi‐Urban Falls 26 39% Poisoning 8 12% Motor Vehicle Crash 6 9% Fire/Burn 5 8%
Other Specified 5 8% Suffocation 5 8% All Others 11 17%
Total 66 100% Urban Falls 79 33% Fire/Burn 30 13% Not Specified 29 12% Poisoning 24 10% Other Specified 20 8% All Others 54 23%
Total 236 100%
Source: 2005‐2009 Hospital Discharge Database, Kansas Hospital Association. *Due to low counts (<5) some cause data for these population densities have been grouped into Total for Frontier and All Others for Rural
From 2005 to 2009, fall injury was the leading cause of UIHD among all population density groups shown for children under age one year (Table HD7). Fire/Burn UIHD were high for both Urban (13%, n=30) and Densely Settled Rural communities (13%, n=8).

Table HD8. Top Causes of Unintentional Injury Hospital Discharges (UIHD) by Population Density Group Among Children 1‐4 years old, Kansas 2005‐2009
Population Density Group Cause # of UIHD % of Total UIHD byPopulation Density
Frontier* Poisoning 13 27% Falls 9 19% Fire/Burn 8 17% All Others 18 37%
Total 48 100%
Rural Poisoning 40 30% Falls 34 25% Fire/Burn 14 10% Other Specified 10 7% Motor Vehicle Crash 8 6% All Others 29 21%
Total 135 100%
Densely Settled Rural Poisoning 77 29% Falls 53 20% Fire/Burn 33 12% Motor Vehicle Crash 24 9% Natural/Environmental 21 8% All Others 57 22%
Total 265 100%
Semi‐Urban Poisoning 70 29% Falls 64 27% Fire/Burn 30 12% Motor Vehicle Crash 21 9% Struck By/Against 13 5% All Others 43 18%
Total 241 100%
Urban Falls 253 30% Poisoning 220 26% Fire/Burn 99 12% Motor Vehicle Crash 56 7% Other Specified 44 5% All Others 177 21%
Total 849 100%
Source: 2005‐2009 Hospital Discharge Database, Kansas Hospital Association. *Due to low counts (<5) some cause data for Frontier have been grouped into All Others
From 2005 to 2009, poisoning was the leading cause of UIHD among children 1‐4 across all population groups, except in urban region where fall injury was the leading cause for UIHD (Table HD8).

29
Hospital Discharge 29
Table HD9. Top Causes of Unintentional Injury Hospital Discharges (UIHD) by Population Density Group Among Children 5‐9 years old, Kansas 2005‐2009
Population Density Group Cause # of UIHD % of Total UIHD byPopulation Density
Frontier* Falls 11 24% Motor Vehicle Crash 11 24% Other Transportation 6 13% All Others 17 38%
Total 45 100%
Rural Falls 28 28% Motor Vehicle Crash 18 18% Other Transportation 16 16% Natural/Environmental 13 13% Poisoning 7 7% All Others 19 19%
Total 101 100%
Densely Settled Rural Falls 63 31% Motor Vehicle Crash 46 22% Struck By/Against 21 10% Other Transportation 17 8% Natural/Environmental 16 8% All Others 43 21%
Total 206 100%
Semi‐Urban Falls 47 33% Motor Vehicle Crash 30 21% Other Transportation 13 9% Natural/Environmental 12 8% Poisoning 9 6% All Others 32 22%
Total 143 100%
Urban Falls 198 36% Motor Vehicle Crash 95 17% Fire/Burn 43 8% Struck by/Against 41 7% Other Transportation 34 6% All Others 139 25%
Total 550 100%
Source: 2005‐2009 Hospital Discharge Database, Kansas Hospital Association. *Due to low counts (<5) some cause data Frontier has been grouped into All Others for Frontier
From 2005 to 2009, falls were the leading cause of UIHD among children ages five to nine years old (Table HD9). “Other transportation” ranked in the top five causes of UIHD for three population density groups; Frontier, Rural, and Semi‐Urban (appendix viii).

Table HD10. Top Causes of Unintentional Injury Hospital Discharges (UIHD) by Population Density Group Among Children 10‐14 years old, Kansas 2005‐2009
Population Density Group Cause # of UIHD % of Total UIHD byPopulation Density
Frontier Falls 24 26% Motor Vehicle Crash 19 21% Struck By/Against 14 15% Other Transportation 10 11% Natural/Environmental 6 7% All Others 19 21%
Total 92 100%
Rural Motor Vehicle Crash 47 28% Falls 36 21% Other Transportation 29 17% Struck By/Against 13 8% Natural/Environmental 11 7% All Others 33 20%
Total 169 100%
Densely Settled Rural Falls 59 26% Other Transportation 41 18% Motor Vehicle Crash 37 17% Struck By/Against 20 9% Other Pedal Cyclist 13 6% All Others 54 24%
Total 224 100%
Semi‐Urban Falls 51 24% Motor Vehicle Crash 46 22% Other Transportation 30 14% Struck By/Against 29 14%
Natural/Environmental 10 5% Other Pedal Cyclist 10 5% Poisoning 10 5% All Others 25 12%
Total 211 100%
Urban Falls 189 32% Motor Vehicle Crash 119 20% Struck By/Against 77 13% Other Transportation 49 8% Other Pedal Cyclist 40 7% All Others 125 21%
Total 599 100%
Source: 2005‐2009 Hospital Discharge Database, Kansas Hospital Association.
From 2005 to 2009, fall injuries was the leading cause of UIHD among four of the five population density groups for children ages 10‐14 years old (Table HD10). “Other Transportation” UIHD, was the second leading cause of injury in densely settled rural communities (18, n=41), narrowly surpassing motor vehicle crashes.
31
Hospital Discharge 31
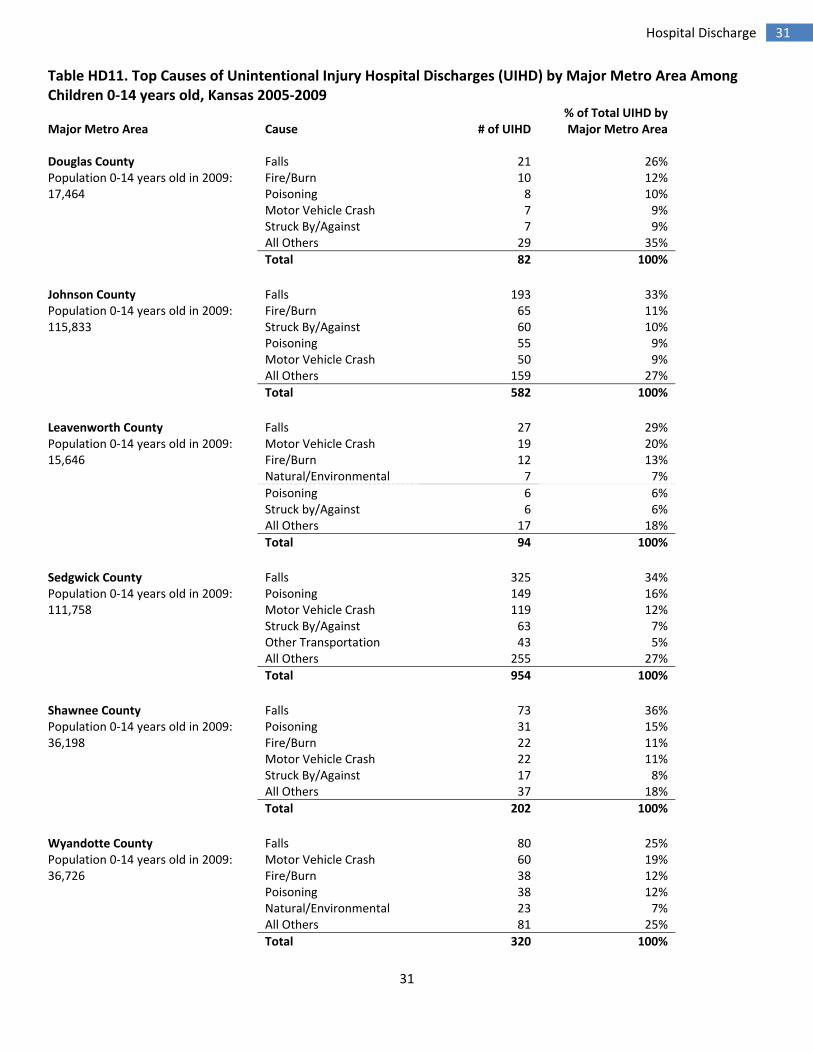
Table HD11. Top Causes of Unintentional Injury Hospital Discharges (UIHD) by Major Metro Area Among Children 0‐14 years old, Kansas 2005‐2009
Major Metro Area Cause # of UIHD % of Total UIHD byMajor Metro Area
Douglas County Falls 21 26%Population 0‐14 years old in 2009: Fire/Burn 10 12%17,464 Poisoning 8 10% Motor Vehicle Crash 7 9% Struck By/Against 7 9% All Others 29 35%
Total 82 100%
Johnson County Falls 193 33%Population 0‐14 years old in 2009: Fire/Burn 65 11%115,833 Struck By/Against 60 10% Poisoning 55 9% Motor Vehicle Crash 50 9% All Others 159 27%
Total 582 100%
Leavenworth County Falls 27 29%Population 0‐14 years old in 2009: Motor Vehicle Crash 19 20%15,646 Fire/Burn 12 13% Natural/Environmental 7 7%
Poisoning 6 6% Struck by/Against 6 6% All Others 17 18%
Total 94 100%
Sedgwick County Falls 325 34%Population 0‐14 years old in 2009: Poisoning 149 16%111,758 Motor Vehicle Crash 119 12% Struck By/Against 63 7% Other Transportation 43 5% All Others 255 27%
Total 954 100%
Shawnee County Falls 73 36%Population 0‐14 years old in 2009: Poisoning 31 15%36,198 Fire/Burn 22 11% Motor Vehicle Crash 22 11% Struck By/Against 17 8% All Others 37 18%
Total 202 100%
Wyandotte County Falls 80 25%Population 0‐14 years old in 2009: Motor Vehicle Crash 60 19%36,726 Fire/Burn 38 12% Poisoning 38 12% Natural/Environmental 23 7% All Others 81 25%
Total 320 100%

Source: 2005‐2009 Hospital Discharge Database, Kansas Hospital Association. 2005‐2009 U.S. Census Bureau.
In 2009, major metro areas include the five counties with the largest child populations of 0‐14 year olds. Hospital discharges for fire/burn injury was prevalent as one of the top five causes within all of these major metro areas except Sedgwick County (Table HD11). By comparison, for the entire state the prevalence of Fire/Burn is only 8%.

33
Hospital Discharge 33
Table HD12. Unintentional Injury Hospital Discharges (UIHD) Rates By County Among Children 0‐14 years old*, Kansas 2005‐2009
County Name # of UIHDs
Population Size 0‐14 years old
2005‐2009 UIHD Rate** Lower 95% CI Upper 95% CI Atchison 34 16,407 207.2 143.5 289.6
Barton 38 26,785 141.9 100.4 194.7
Bourbon 46 14,940 307.9 225.4 410.7
Butler 115 64,127 179.3 146.6 212.1
Cherokee 40 20,824 192.1 137.2 261.6
Cowley 73 34,132 213.9 167.6 268.9
Crawford 81 35,726 226.7 180.1 281.8
Dickinson 23 17,544 131.1 83.1 196.7
Douglas 82 86,859 94.4 75.1 117.2
Ellis 46 22,991 200.1 146.5 266.9
Finney 80 55,816 143.3 113.7 178.4
Ford 59 44,572 132.4 100.8 170.7
Franklin 51 27,129 188.0 140.0 247.2
Geary*** 26 35,054 74.2 48.5 108.7
Harvey 56 33,059 169.4 128.0 220.0
Jackson 25 13,994 178.6 115.6 263.7
Johnson 582 563,035 103.4 95.0 111.8
Labette 43 20,983 204.9 148.3 276.0
Leavenworth 94 75,150 125.1 101.1 153.1
Lyon 41 34,839 117.7 84.5 159.7
Marion 25 10,566 236.6 153.1 349.3
McPherson 44 26,174 168.1 122.1 225.7
Miami 56 32,003 175.0 132.2 227.2
Montgomery 45 32,882 136.9 99.8 183.1
Neosho 31 15,370 201.7 137.0 286.3
Osage 27 15,574 173.4 114.2 252.2
Pottawatomie 25 21,693 115.2 74.6 170.1
Reno 100 59,910 166.9 134.2 199.6
Rice 23 9,330 246.5 156.3 369.9
Riley*** 55 55,893 98.4 74.1 128.1
Saline 76 55,458 137.0 108.0 171.5
Sedgwick 954 546,442 174.6 163.5 185.7
Seward 44 32,886 133.8 97.2 179.6
Shawnee 202 176,618 114.4 98.6 130.1
Sumner 65 24,084 269.9 208.3 344.0
Wilson 20 8,875 225.4 137.7 348.0
Wyandotte 320 185,080 172.9 154.0 191.8
*Counties with less than 20 Unintentional Injury Hospital Discharges from 2005‐2009 are excluded due to unstable rates **Per 100,000 Population ***For low rate caveats see appendix ii Source: 2005‐2009 Hospital Discharge Database, Kansas Hospital Association. 2005‐2009 U.S. Census Bureau

Bourbon County has the highest rate of UIHD of all counties (307.9 UIHD per 100,000, 95% CI: 225.4‐410.7) that had qualifying numbers to calculate rates among children 0‐14 years old from 2005 to 2009, (Table HD12). Geary and Riley County had the lowest rates (74.2 UIHDs per 100,000 and 98.4 UIHDs per 100,000, respectively). It is important to remember the role of confidence intervals when comparing counties. Figure HD6 shows that even though a county may have a much higher rate than Kansas average it may not be statistically different. For more information on confidence intervals please see appendix iii. The counties in purple are all significantly lower. Overall, most counties in Kansas are very close to the state average with five counties having rates that are statistically lower (Geary, Riley, Douglas, Johnson, Shawnee)* and seven counties having rates that are statistically higher (Sedgwick, Cowley, Crawford, Rice, Sumner, Bourbon, Wyandotte) than the state rate. When reviewing county level data it is important to recognize that although there are variations between
counties, the purpose in presenting these data is not to compare but rather to help understand the burden of
the problem in their populations. The counties, themselves, vary in a number of ways, including in their
demographic characteristics (e.g., age distribution), social, economic and cultural characteristics, as well as
external stressors (e.g., economic downturn, job loss, poverty), and other factors.
*For caveats about these low rates please see appendix ii

35
Hospital Discharge 35
Source: 2005‐2009 Hospital Discharge Database, Kansas Hospital Association. 2005‐2009 U.S. Census Bureau. Note: Not all counties are shown due to numbers being too low to calculate reliable rates.
0 100 200 300
County Specific UIHD Rate
Bourbon
Sumner
Rice
Marion
Crawford
Wilson
Cowley
Atchison
Labette
Neosho
Ellis
Cherokee
Franklin
Butler
Jackson
Miami
Sedgwick
Osage
Wyandotte
Harvey
McPherson
Reno
Kansas average
Finney
Barton
Saline
Montgomery
Seward
Ford
Dickinson
Leavenworth
Lyon
Pottawatomie
Shawnee
Johnson
Riley
Douglas
Geary
Among Children 0‐14 years old, Kansas 2005‐2009
Figure HD6. County Specific Unintentional Injury Hospital Discharge (UIHD) Rates
Kansas average
Below average*
Not different than average
Higher than average*
*Statistically Significant

TRAUMATIC BRAIN INJURY
Table HD13. Age‐Specific Traumatic Brain Injury Related Unintentional Injury Hospital Discharge (UIHD)
Rates Kansas 2005‐2009
Age Group (Years) TBI Related
UIHD
Population Size 0‐14 years old
2005‐2009 TBI Related UIHD Rate* Lower 95% CI Upper 95% CI
<1 155 202,412 76.6 64.5 88.61‐4 263 783,689 33.6 29.5 37.65‐9 262 946,016 27.7 24.3 31.010‐14 329 943,747 34.9 31.1 38.6
0‐14 1,009 2,875,864 35.1 32.9 37.2 *Rate per 100,000 population Source: 2005‐2009 Hospital Discharge Database, Kansas Hospital Association. 2005‐2009 U.S. Census Bureau.
From 2005 to 2009, children under the age of one year had the highest rate of TBI related UIHD (76.6 TBI related UIHDs per 100,000, 95% CI: 64.5‐88.6) Table HD13 and Figure HD7. Children under age one had a rate that was significantly higher than all three other age groups.
76.6
33.6
27.7
34.9
0.0
20.0
40.0
60.0
80.0
<1 1‐4 5‐9 10‐14
TBI R
elated
UIHD Rate per 100,000 population
Age Group
Figure HD7. Age‐Specific Traumatic Brain Injury Related Unintentional Injury Hospital Discharge (UIHD) Rates
Kansas 2005‐2009
37
Hospital Discharge 37
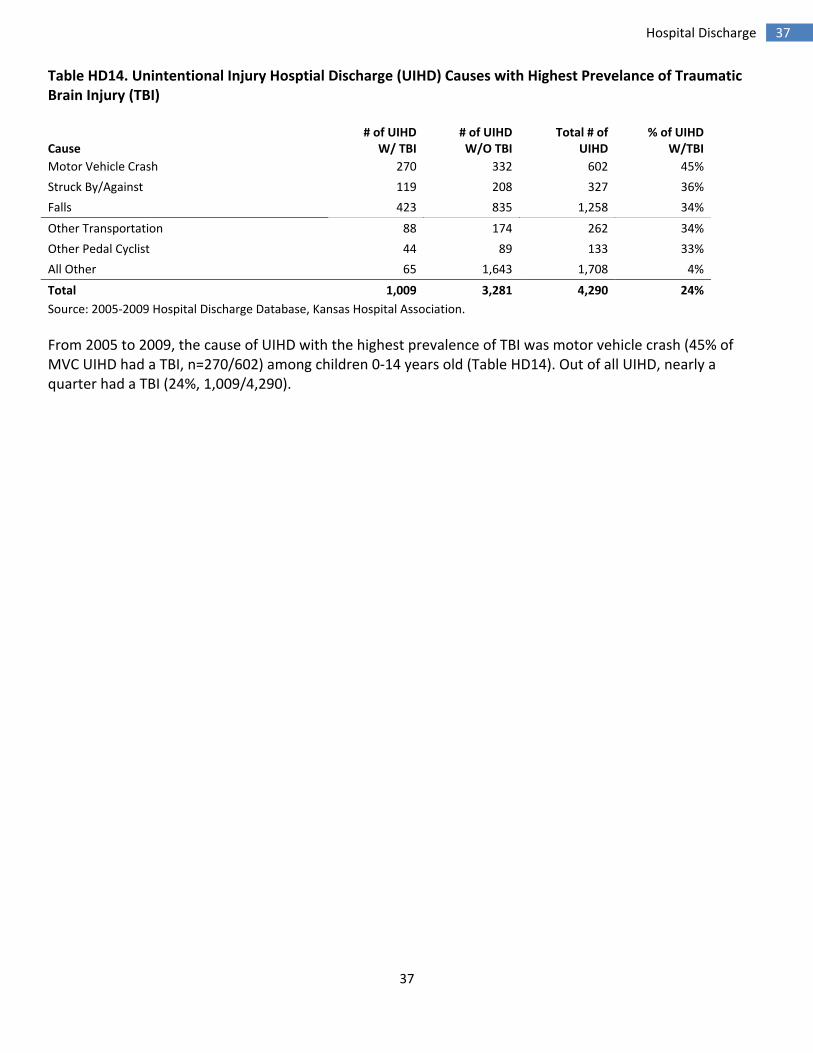
Table HD14. Unintentional Injury Hosptial Discharge (UIHD) Causes with Highest Prevelance of Traumatic Brain Injury (TBI)
Cause # of UIHD
W/ TBI # of UIHD W/O TBI
Total # of UIHD
% of UIHD W/TBI
Motor Vehicle Crash 270 332 602 45%
Struck By/Against 119 208 327 36%
Falls 423 835 1,258 34%
Other Transportation 88 174 262 34%
Other Pedal Cyclist 44 89 133 33%
All Other 65 1,643 1,708 4%
Total 1,009 3,281 4,290 24%
Source: 2005‐2009 Hospital Discharge Database, Kansas Hospital Association.
From 2005 to 2009, the cause of UIHD with the highest prevalence of TBI was motor vehicle crash (45% of MVC UIHD had a TBI, n=270/602) among children 0‐14 years old (Table HD14). Out of all UIHD, nearly a quarter had a TBI (24%, 1,009/4,290).

MORTALITY Mortality data was grouped in 10 years (2000‐2009) to have sufficient sample for examination of mortality due to different injuries among children ages 0‐14 years.
Quick Facts:
From 2000 to 2009 o There were 629 unintentional injury deaths (UID) in children 0‐14 years old. 61% of these
deaths occurred in males (n=389) while 38% occurred in females (n=240). o The leading cause of UID was motor vehicle crashes in children 0‐14 years old (38%, n=340). o Children living in Northeast Trauma Region of Kansas were the least likely to suffer an UID,
while children living in Southwest Trauma Region were the most likely to suffer a UID, among children 0‐14 years old.
o Children 0‐14 years living in Frontier communities in Kansas were the most likely to suffer a UID while children living in Urban communities were the least likely to suffer a UID.
BY AGE
34.7
13.3
5.9
9.1
0
5
10
15
20
25
30
35
40
45
<1 1‐4 5‐9 10‐14
UID Rate per 100,000 population
Age Group
Figure MD1. Age‐Specific Unintentional Injury Death (UID) Rate, Kansas 2000‐2009
39
39Mortality
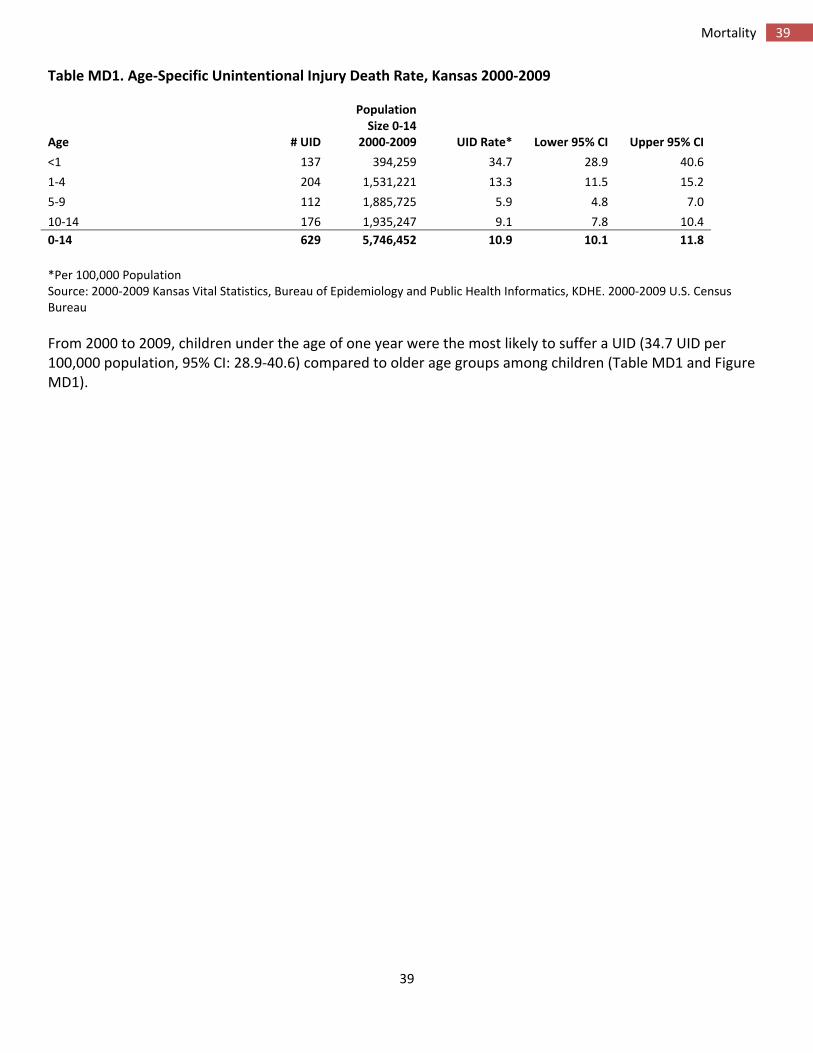
Table MD1. Age‐Specific Unintentional Injury Death Rate, Kansas 2000‐2009
Age # UID
Population Size 0‐14
2000‐2009 UID Rate* Lower 95% CI Upper 95% CI
<1 137 394,259 34.7 28.9 40.6
1‐4 204 1,531,221 13.3 11.5 15.2
5‐9 112 1,885,725 5.9 4.8 7.0
10‐14 176 1,935,247 9.1 7.8 10.4
0‐14 629 5,746,452 10.9 10.1 11.8
*Per 100,000 Population Source: 2000‐2009 Kansas Vital Statistics, Bureau of Epidemiology and Public Health Informatics, KDHE. 2000‐2009 U.S. Census Bureau
From 2000 to 2009, children under the age of one year were the most likely to suffer a UID (34.7 UID per 100,000 population, 95% CI: 28.9‐40.6) compared to older age groups among children (Table MD1 and Figure MD1).

Table MD2. Age‐Specific Top Five Causes of Unintentional Injury Deaths (UID), Kansas 2000‐2009 Age Group (Years) Cause # of UID % of Total UID by Age <1 Suffocation 78 57% Motor Vehicle Crash 15 11% Drowning 11 8% Fall 8 6% Other specified, classifiable 7 5% All Other 18 13%
Total 137 100%
1‐4 Motor Vehicle Crash 55 27% Drowning 48 24% Fire/Hot Object or Substance 34 17% Suffocation 19 9% Pedestrian 11 5% All Other 37 18%
Total 204 100%
5‐9 Motor Vehicle Crash 53 47% Fire/Hot object or substance 16 14% Drowning 9 8% Suffocation 7 6% Other Land Transport 7 6% All Other 20 18%
Total 112 100%
10‐14 Motor Vehicle Crash 117 66% Fire/Hot Object or Substance 10 6% Drowning 8 5% Other Land Transport 7 4% Suffocation 7 4% All Other 27 15%
Total 176 100%
0‐14 Motor Vehicle Crash 240 38% Suffocation 113 18% Drowning 73 12% Fire/Hot Object or Substance 64 10% Pedestrian 20 3% All Other 119 19%
Total 629 100%
Source: 2000‐2009 Kansas Vital Statistics, Bureau of Epidemiology and Public Health Informatics, KDHE
From 2000 to 2009, motor vehicle crashes were the leading cause of death in children 0‐14 years old (Table MD2 and Figure MD2). More than half of all UID of children under age one year were attributed to suffocation (57%, n=78). Suffocation deaths are most often attributed to unsafe sleep environments3. Drowning was the third leading cause of UID among children 0‐14 years old and was within the top three causes of death for all age groups.
3 CDC Online Newsroom ‐ Press Release: October 19, 2011. (2011, October 19).CDC Online Newsroom: October 19, 2011. Retrieved January 6, 2012, from http://www.cdc.gov/media/releases/2011/p1019_infantsleep_recs.html

41
41Mortality
Figure MD2. Age‐Specific Causes of Unintentional Injury Deaths (UID) Kansas 2000–2009
Source: 2000‐2009 Kansas Vital Statistics, Bureau of Epidemiology and Public Health Informatics, KDHE
Motor Vehicle Crash38%
Suffocation18%
Drowning12%
Fire/Hot Object or Substance
10%
Pedestrian3%
All Other19%
0‐14 years old
Suffocation57%
Motor Vehicle Crash11%
Drowning 8%
Fall6%
Other specified, classifiable
5% All Other13%
<1 years old
Motor Vehicle Crash27%
Drowning24%Fire/Hot
Object or Substance
17%
Suffocation9%
Pedestrian5%
All Other18%
1‐4 years old
Motor Vehicle Crash47%
Fire/Hot object or substance
14%
Drowning8%
Suffocation
6%
Other Land
Transport6%
All Other19%
5‐9 years old
Motor Vehicle Crash66%
Fire/Hot Object or Substance
6%
Drowning5%
Other Land
Transport4%
Suffocation
4%All Other15%
10‐14 years old

BY TRAUMA REGION
Table MD3. Unintentional Injury Death (UID) Rates by Trauma Region Among Children 0‐14 years old Kansas 2000‐2009
Trauma Region # of UID
Population Size 0‐14 years old
2000‐2009 % of Total UID UID
Rate* Lower 95% CI
Upper 95% CI
Northcentral 28 242,551 4% 11.5 7.3 15.8
Northeast 247 2,830,112 49% 8.7 7.6 9.8
Northwest 31 164,070 3% 18.9 12.2 25.5
Southcentral 188 1,758,091 31% 10.7 9.2 12.3
Southeast 48 361,454 6% 13.3 9.8 17.6
Southwest 87 390,174 7% 22.3 17.6 27.0
Total 629 5,746,452 100% 10.9 10.1 11.8 *Per 100,000 population. Source: 2000‐2009 Kansas Vital Statistics, Bureau of Epidemiology and Public Health Informatics, KDHE. 2000‐2009 U.S. Census Bureau
From 2000 to 2009, the Southwest Trauma Region of Kansas had the highest UID rate among children 0‐14 years (22.3 UID per 100,000 population, 95% CI: 17.6‐27.0) as shown in Table MD3 and Figure MD3. Whereas the Northeast Trauma Region had the lowest UID rate (8.7 UID per 100,000 population, 95% CI: 7.6‐9.8). The Southwest Trauma Region consists of Frontier and Rural areas which may affect injury outcomes such as deaths due to the amount of time it takes to reach a health care facility or definitive care.
11.5
8.7
18.9
10.7
13.3
22.3
0
5
10
15
20
25
30
Northcentral Northeast Northwest Southcentral Southeast Southwest
UID Rate per 100,000 Popuation
Population Density Group
Figure MD3. Unintentional Injury Death (UID) Rates By Trauma Region Among Children 0‐14 years old, Kansas 2000‐2009

43
43Mortality
BY POPULATION DENSITY
Table MD4. Unintentional Injury Death (UID) Rates by Population Density Among Children 0‐14 years old Kansas 2000‐2009
Population Density # of UID
Population Size 0‐14 years old
2000‐2009 % of Total UID UID
Rate* Lower 95% CI
Upper 95% CI
Urban 271 3,206,008 43% 8.5 7.4 9.5
Semi‐Urban 106 861,839 17% 12.3 10.0 14.6
Densely Settled Rural 117 943,846 19% 12.4 10.1 14.6
Rural 88 507,386 14% 17.3 13.9 21.4
Frontier 47 227,373 7% 20.7 15.2 27.5
Total 629 5,746,452 100% 10.9 10.1 11.8 *Per 100,000 population Source: 2000‐2009 Kansas Vital Statistics, Bureau of Epidemiology and Public Health Informatics, KDHE. 2000‐2009 U.S. Census Bureau.
From 2000 to 2009, Frontier communities had highest UID rate among children 0‐14 years (20.7 UID per 100,000 population, 95% CI: 15.2‐27.5) compared to Urban communities (8.5 UID per 100,000 population, 95% CI: 7.4‐9.5). There were no statistically significant differences between rates for Semi‐urban, Densely‐Settled Rural and Rural communities.
8.5
12.3 12.4
17.3
20.7
0
5
10
15
20
25
30
Urban Semi‐Urban Densely SettledRural
Rural Frontier
UID Rates per 100,000 Popuation
Population Density Group
Figure MD4. Unintentional Injury Death (UID) Rates By Population Density Among Children 0‐14 years old, Kansas 2000‐2009

TRAUMATIC BRAIN INJURY
Table MD5. Age‐Specific Traumatic Brain Injury (TBI) Related Unintentional Injury Death (UID) Kansas 2000‐2009
Age (Years) # of TBI
Related UID
Population Size 0‐14 years old
2000‐2009 TBI Related UID Rate* Lower 95% CI Upper 95% CI
<1 21
394,259 5.3 3.3 8.1
1‐4 55 1,531,221 3.6 2.7 4.7
5‐9 43 1,885,725 2.3 1.7 3.1
10‐14 84 1,935,247 4.3 3.5 5.4
0‐14 203 5,746,452 3.5 3.0 4.0
*Per 100,000 population Source: 2000‐2009 Kansas Vital Statistics, Bureau of Epidemiology and Public Health Informatics, KDHE. 2000‐2009 U.S. Census Bureau.
From 2000 to 2009, TBI related UID rate (4.3 TBI related UID per 100,000 population, 95% CI: 3.5‐5.4) was higher among children ages 10‐14 years as compared to those who were between the ages of five and nine years (2.3 TBI related UID per 100,000 population, 95% CI: 1.7‐3.1) as shown in Table MD5 and Figure MD5.
5.3
3.6
2.3
4.3
0
2
4
6
8
<1 1‐4 5‐9 10‐14
TBI R
elated
UID Rate per 100,000 population
Age Group
Figure MD5. Age‐Specific Traumatic Brain Injury (TBI) Related Unintentional Injury Death (UID) Rates
Kansas 2000‐2009

45
45Mortality
Table MD6. Unintentional Injury Death (UID) Cause with Highest Prevelance of Tramautic Brain Injury (TBI) Among Children 0‐14 years old , Kansas 2000‐2009
Cause* # Deaths W/ TBI
#Deaths W/O TBI Total Deaths
% Deaths W/ TBI
Pedestrian, other 5 15 20 75%
Motor vehicle traffic 95 145 240 60%
Other land transport 9 8 17 47%
Fall 9 7 16 44%
All Others 308 28 336 8%
Total 426 203 629 32% *For causes in which the # of deaths with or without TBI was lower than five were added to All Others Source: 2000‐2009 Kansas Vital Statistics, Bureau of Epidemiology and Public Health Informatics, KDHE
From 2000 to 2009, 32% of all unintentional injury deaths among children 0‐14 years old involved a traumatic brain injury. Seventy‐Five percent of these children who suffered a pedestrian UID had a TBI (n=5/20), Table MD6. Sixty percent of all children who died of a motor vehicle crash had a TBI (n=95/240). Safety measures such as correct car seat use or proper seat belt use and use of helmets while biking or participating in other wheeled sports can reduce the risk of TBI dramatically.


i
iAppendix
Analysis Notes: Throughout this report you will find various statistical measures. The following are short descriptions of each type of measure. All data were analyzed using SAS 9.2. Databases: The three databases used for the purposes of this document are the hospital discharge database, the emergency department database, and the mortality database. Please see appendix ix for detailed information. Counts: Counts are the actual number of events that occur. Counts can give you an idea of the size and scope of an issue. Larger communities though will have much larger counts than small communities based on the population size. To compare communities it is best to use rates. Not all counts are provided; counts below five are not given in this report for confidentiality and protection of individual identity. Percentages: Percentages are used in this report to describe the proportion of certain characteristics of an injury, such as age, cause, and traumatic brain injuries. Rates: Age‐Specific rates are calculated by dividing the number of events by the population in that specific age group. By using rates, two differently sized communities/regions can be compared to each other. Note that rates in which the number of events is below 20 are not calculated as rates calculated for numbers less than 20 are inaccurate and scientifically unreliable. Age‐specific rates are calculated by dividing the number of events by the population of children in Kansas ages 0‐14 years old or by Kansas subpopulation of interest. Population denominators are taken from estimates produced by the U.S. Census Bureau. To be consistent with other KHDE publications, 2000‐2009 midyear population estimates produced for each year are used, rather than using the most recent estimate. For example, a 2005 rate will be based on the Kansas population estimate published in 2005 (2005 vintage), rather than using the most recent 2005 population estimate (2009 vintage). For 2001, the 2002 vintage estimates were used. For 2000, the census 2000 populations were used. Cause Coding: Causes are determined by using an injury matrix that is recommended by Safe States Alliance. This is a system that uses the diagnosis code (ED data and HD data) and underlying cause (Mortality Database) to give a cause and intent to an injury. This report only looks at unintentional injury deaths among children 0‐14 years old. Further information on the coding and the matrix can be found in the appendix. Data are selected and coded for hospital discharges according to the Consensus Recommendations for Using Hospital Discharge Data for Injury Surveillance from the Safe States Alliance. This method codes injuries based on e‐codes using the injury matrix provided by the CDC (appendix v). Data for emergency department is similar to hospital discharge but closely follows the selection method from State Injury Indicators: Instructions for Preparing 2005 Data from the Centers for Disease Control and Prevention. Mortality Data is coded using the ICD‐10 injury matrix provided by the CDC (appendix vii). This is similar to the method described in Instructions for Preparing 2005 Data but uses a different coding scheme.

Possible Explanations for Low Rates: Low rates in Geary and Riley County may be due to the fact there are a very high number of military families living in this area. Military families are more likely to use military hospitals (federal) for care than community hospitals thus excluding these cases from our analysis and potentially decreasing the injury rates in these areas. Another possible consideration of this data is proximity of Northeast counties to Children’s Mercy Hospital in Kansas City, Missouri. Due to its location many children in the Northeast Kansas counties may receive care from this hospital and are not recorded in the Kansas hospital discharge database. Children’s Mercy is a leading caregiver for children in the Midwest. Children from Kansas, Nebraska, Missouri, and Iowa receive care there. This affects all children in Kansas but we believe especially children in Northeast Kansas.
Confidence Intervals:
Confidence Intervals are a range around an estimate that shows how precise a measurement is. By comparing confidence intervals you can make a quick statistical comparison of two estimates. Confidence intervals around rates are calculated using the methods described in the Technical Appendix from Vital Statistics of United States 1999 Mortality from National Center for Health Statistics (NCHS). This method uses a normal distribution for confidence intervals of events of 100 or more and poisson distribution for events below 100. The method used to calculate confidence intervals for death rates is used for calculation of confidence intervals for hospital discharge and emergency department visit rates. Interpreting Confidence Intervals:
In public health we try to make comparisons between two groups such as, was Group A healthier than Group B. Group A and B can be anything from counties and towns to races and age groups. We can measure being healthier by looking at smoking status, physical activity, and seat belt use. Confidence intervals are one of the tools we can use to tell if two groups are actually different. In this report many numbers and rates are provided. The rates and numbers in this report are estimates of the true rate and numbers in the community. In a perfect world we would be able to obtain true value for a question like “how many children went to the emergency department due to snake bites last year?” but many things can happen that make this impossible such as missing information, lost records, and miscoding. These things add random error to an estimate. Although these numbers are the most accurate we can provide there is room for random error in any estimate. We must account for random error before we can say that two groups are different. One way to measure random error is to estimate a confidence interval. What is a confidence Interval? The confidence interval is a range (interval) around our estimate that says this range has “a 95% probability of covering the true value”. The size of a confidence interval can be affected by two things; the size of the sample and the variance (the variability of a sample). If the variance is unchanging by increasing the size of a sample it makes the confidence interval smaller. Therefore if two samples have the same variance the sample with the larger size will always have a smaller confidence interval. A sample refers to whatever groups you are comparing. In this report our samples are counties, age groups, and population density regions.

iii
iiiAppendix
How do I interpret a confidence Interval? Two scenarios are provided as examples using the chart on the next page. This chart (EX1) shows the rate of unintentional injury deaths of population density groups and the confidence interval of those rates. The line at the top of the blue bar is the visual representation of the confidence interval, the top of the line is the highest value of the confidence interval (upper limit) and the bottom of the line is the lowest value of the confidence interval (lower limit). Sample size affects the size of the confidence interval. Frontier communities which have a smaller population have a large confidence interval and urban communities who have a much larger population and a correspondingly smaller confidence interval. When confidence intervals around estimates of rates for two groups overlap that means that there is a chance that both groups have the same exact value of the rate. If this is true then we say that they are not statistically different. When two confidence intervals around estimates of rates for two groups do not overlap, they cannot share the same value of rate, so they are statistically different.
Scenario 1 From 2000‐2009, was the rate of unintentional injury death in Frontier communities higher than in Urban communities? We can compare these groups by chart or table. Looking at the chart you can see that there is a large gap between the two confidence intervals and that they don’t overlap. Looking at the table you see that the confidence interval (7.4‐9.5) around the unintentional injury death (UID) rate for the Urban communities does
0
5
10
15
20
25
30
Urban Semi‐UrbanDensely
Settled RuralRural Frontier
Lower 95% CI 7.4 10.0 10.1 13.9 15.2
Rate 8.5 12.3 12.4 17.3 20.7
Upper 95% CI 9.5 14.6 14.6 21.4 27.5
Unintentional Injury Death Rate per 100,000
Popuation
Population Density Group
EX1. Unintentional Injury Death Rate By Population Density Among Children 0‐14, Kansas 2000‐2009

not overlap that for Frontier communities (15.2‐27.5). So these two groups have a statistically significant difference in the UID rate. Frontier communities have a higher unintentional injury death rate than Urban. Scenario 2 From 2000‐2009, was the rate of unintentional injury death in Semi‐Urban communities higher than in Densely Settled Rural Communities? Again we can look at the chart or table. Looking at the chart the confidence intervals around the UID rate overlap. If we did not have labels it would almost be impossible to tell the two groups apart. Looking at the table the intervals are nearly exact. The Semi‐urban interval is (10.0‐14.6) and Densely Settled Rural is (10.1‐14.6). Since the confidence intervals around the UID rate for Semi‐Urban and Densely Settled Rural communities overlap we can safely say that there is no statistically significant difference among UID rate or rates are similar. Semi‐Urban does not have a higher rate than Densely‐Settled Rural and vice versa. A Word of Caution: The confidence interval is a good measure of statistical significance but not that same as a statistical test. Sometimes two groups will have overlapping confidence intervals but have a statistically significant difference nonetheless. In most situations this statistical test is not necessary but extra analysis can be done if requested or needed. Information for interpreting confidence Intervals was adapted from: Aschengrau, A., & Seage III, G. (2008). Essentials of epidemiology in public health. (2 ed., pp. 307‐341). Sudbury, Massachussets: Jones and Bartlett Publishers. Guidelines for using confidence intervals for public health assessment. (2002, January 8). Retrieved from http://www.doh.wa.gov/data/guidelines/worddocs/CI_guidelines.pdf

v
vAppendix
External Cause of Injury Mortality Matrix for ICD‐9 Unintentional Cause ICD‐9 E‐Code
All injury E800‐E869, E880‐E929
Cut/pierce E920.0‐.9
Drowning/submersion E830.0‐.9, E832.0‐.9, E910.0‐.9
Fall E880.0‐E886.9, E888
Fire/burn E890.0‐E899, E924.0‐.9
Fire/flame E890.0‐E899
Hot object/substance E924.0‐.9
Firearm E922.0‐.3,.8, .9
Machinery E919 (.0‐.9)
Motor vehicle traffic E810‐E819 (.0‐.9)
Occupant E810‐E819 (.0,.1)
Motorcyclist E810‐E819 (.2,.3)
Pedal cyclist E810‐E819 (.6)
Pedestrian E810‐E819 (.7)
Unspecified E810‐E819 (.9)
Pedal cyclist, other E800‐E807 (.3), E820‐E825 (.6), E826.1,.9, E827‐E829(.1)
Pedestrian, other E800‐807(.2), E820‐E825(.7), E826‐E829(.0)
Transport, other E800‐E807 (.0,.1,.8,.9), E820‐E825 (.0‐.5,.8,.9), E826.2‐.8, E827‐E829 (.2‐.9), E831.0‐.9, E833.0‐E845.9
Natural/environmental E900.0‐E909, E928.0‐.2
Bites and stings E905.0‐.6,.9, E906.0‐.4,.5,.9
Overexertion* E927.0‐.4,.8‐.9
Poisoning E850.0‐E869.9
Struck by, against E916‐E917.9
Suffocation E911‐E913.9
Other specified and
classifiable*
E846‐E848, E914‐E915, E918, E921.0‐.9, E922.4,.5, E923.0‐.9, E925.0‐E926.9, E928(.3‐.7), E929.0‐.5
Other specified, not elsewhere classifiable
E928.8, E929.8
Unspecified E887, E928.9, E929.9
Adapted from CDC Table4 *Codes in bold are for morbidity coding only.
4 Cdc‐code groupings ‐ wisqars ‐ injury. (2011, August 23). Retrieved from http://www.cdc.gov/injury/wisqars/ecode_matrix.html
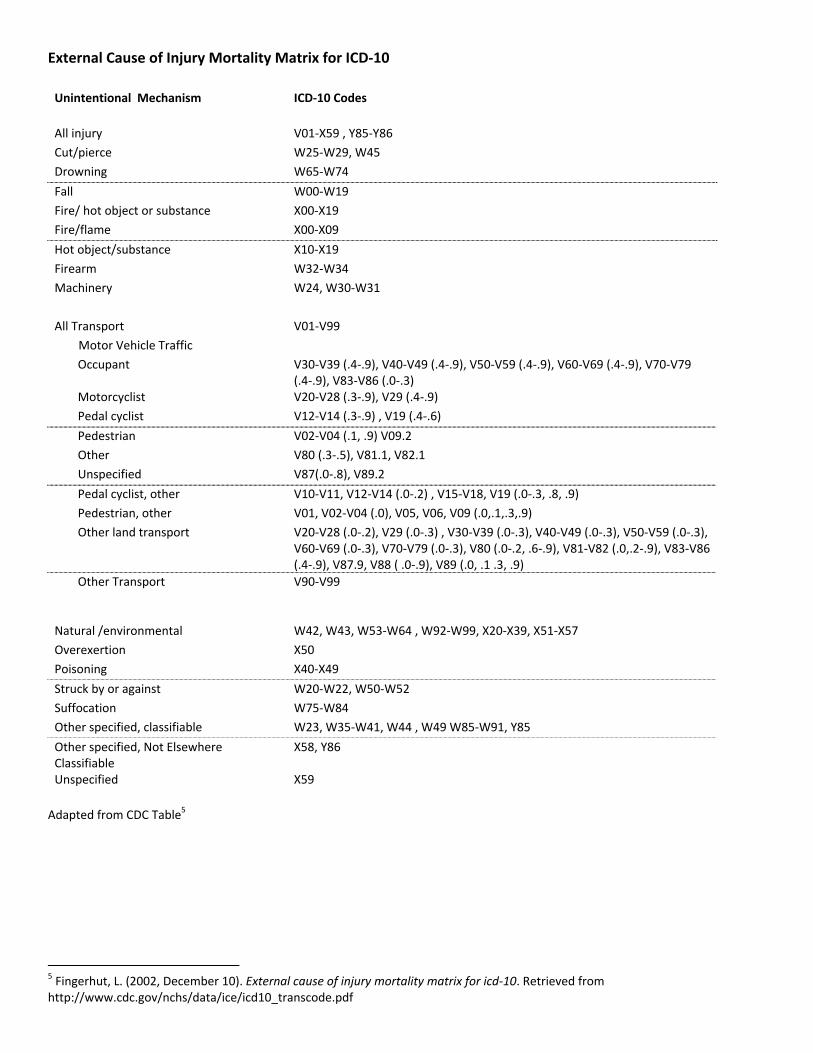
External Cause of Injury Mortality Matrix for ICD‐10 Unintentional Mechanism ICD‐10 Codes
All injury V01‐X59 , Y85‐Y86
Cut/pierce W25‐W29, W45
Drowning W65‐W74
Fall W00‐W19
Fire/ hot object or substance X00‐X19
Fire/flame X00‐X09
Hot object/substance X10‐X19
Firearm W32‐W34
Machinery W24, W30‐W31
All Transport V01‐V99
Motor Vehicle Traffic
Occupant V30‐V39 (.4‐.9), V40‐V49 (.4‐.9), V50‐V59 (.4‐.9), V60‐V69 (.4‐.9), V70‐V79 (.4‐.9), V83‐V86 (.0‐.3)
Motorcyclist V20‐V28 (.3‐.9), V29 (.4‐.9)
Pedal cyclist V12‐V14 (.3‐.9) , V19 (.4‐.6)
Pedestrian V02‐V04 (.1, .9) V09.2
Other V80 (.3‐.5), V81.1, V82.1
Unspecified V87(.0‐.8), V89.2
Pedal cyclist, other V10‐V11, V12‐V14 (.0‐.2) , V15‐V18, V19 (.0‐.3, .8, .9)
Pedestrian, other V01, V02‐V04 (.0), V05, V06, V09 (.0,.1,.3,.9)
Other land transport V20‐V28 (.0‐.2), V29 (.0‐.3) , V30‐V39 (.0‐.3), V40‐V49 (.0‐.3), V50‐V59 (.0‐.3), V60‐V69 (.0‐.3), V70‐V79 (.0‐.3), V80 (.0‐.2, .6‐.9), V81‐V82 (.0,.2‐.9), V83‐V86 (.4‐.9), V87.9, V88 ( .0‐.9), V89 (.0, .1 .3, .9)
Other Transport V90‐V99
Natural /environmental W42, W43, W53‐W64 , W92‐W99, X20‐X39, X51‐X57
Overexertion X50
Poisoning X40‐X49
Struck by or against W20‐W22, W50‐W52
Suffocation W75‐W84
Other specified, classifiable W23, W35‐W41, W44 , W49 W85‐W91, Y85
Other specified, Not Elsewhere Classifiable
X58, Y86
Unspecified X59
Adapted from CDC Table5
5 Fingerhut, L. (2002, December 10). External cause of injury mortality matrix for icd‐10. Retrieved from http://www.cdc.gov/nchs/data/ice/icd10_transcode.pdf

vii
viiAppendix
ICD‐9 Detailed Causes: (Emergency Department Visits and Hospital Discharges)
ICD‐9 Causes Selected Exact Mechanisms6
Cut / Pierce Accident caused by other specified cutting and piercing instrument or object
Accident caused by knives, swords, and daggers Accident caused by unspecified cutting and piercing instrument or object
Accident caused by other hand tools or implements
Accident caused by powered household appliances and implements
Falls Other accidental fall from one level to another
Accidental fall from playground equipment
Fall from other slipping, tripping, or stumbling
Unspecified fall Accidental fall from bed
Fire/Burn Accident caused by hot liquids and vapors including steam
Accident caused by other hot substance or object Accident caused by hot (boiling) tap water Ignition of highly inflammable material
Accident caused by controlled fire not in building or structure
Motor Vehicle Crash All crashes occurred in traffic (roads)
Other Motor Vehicle (MV) crash with unmoving motor vehicle injuring driver of motor vehicle other than motorcyclist
MV crash with pedestrian injuring the pedestrian
MV crash due to loss of control, without collision on the highway injuring the passenger in the motor vehicle other than a motorcyclist
MV traffic accident with non‐motor transport vehicle injuring the pedal cyclist
Natural/Environmental Dog bite Other specified injury caused by animal
Bite of venomous arthropod (spider)
Accident due to abandonment or neglect of infant and helpless person
Bite of non‐venomous arthropod (spider)
Poisoning Accidental poisoning by agents primarily affecting cardiovascular system (heart, blood, and blood vessels)
Accidental poisoning by other specified tranquilizers Accidental poisoning by antidepressants Accidental poisoning by anticonvulsant and anti‐Parkinsonism drugs
Other Pedal Cyclist Pedal cyclist accident injuring the pedal cyclist
Other Pedestrian Other motor vehicle non‐traffic accident of other and unspecified nature injuring the other specified person
CO poisoning, jumping/falling/pushed by a car, hit by object thrown from a car
Other Transport Non‐traffic accidents involving other off‐road motor vehicle (i.e. All Terrain Vehicle) injuring the driver other than a motorcycle
Accident involving animal being ridden injuring the rider of the animal
Non‐traffic accident involving other off‐road motor vehicle injuring the motorcyclist
Non‐traffic accident involving other off‐road motor vehicle injuring the passenger in the motor vehicle other than a motorcycle
Non traffic accident involving other off‐road motor vehicle injuring a unspecified person
6 (2005). 2006 coder's desk reference. (3 ed.). Ingenix.

Other Specified
Foreign body accidentally entering other orifice (ear, urinary system, reproductive organs, and stomach and intestine)
Caught accidentally between objects Accident caused by air gun Accident caused by fireworks Accidents involving other vehicles, not elsewhere classifiable
Struck By/Against Other accident caused by striking against or being struck by accidentally by objects or persons Striking against or struck accidentally by objects or persons in sports Struck by falling object Strike against or struck accidentally by other object in sports with subsequent fall Strike against or struck accidentally by other stationary object without subsequent fall
Special Focus: Other Transport
Other transport injuries are mentioned frequently in this document. Other transport injuries are made up of accidents that occur off of a public highway. All terrain vehicles (ATVs) make up a significant proportion of these injuries. From 2005‐2009 there was 545 other transport unintentional hospital discharges among those 0‐14 years old. Using methodology from the University of West Virginia7 it is predicted that 47% (n=545) of all other transport injuries were ATV accidents. 20% of these injuries (n=106) were due to an animal being ridden.
ICD‐10 Detailed Causes (Deaths)
ICD‐10 Causes Selected Exact Mechanisms8
Falls Unspecified fall
Fire/Burn Exposure to uncontrolled fire in building or structure
Motor Vehicle Crash Other Motor Vehicle (MV) crash with unmoving motor vehicle injuring driver of motor vehicle other
Car occupant injured in collision with car, pick‐up truck or van, injuring passenger Car occupant injured in non‐collision transport accident, injuring passenger Pedestrian injured in collision with car, pick‐up truck or van in a traffic accident Car occupant injured in collision with fixed or stationary object, injuring passenger Car occupant injured in collision with heavy transport vehicle or bus, injuring passenger
Suffocation Accidental suffocation and strangulation in bed Other accidental hanging and strangulation Inhalation and ingestion of other objects causing obstruction of respiratory tract
Drowning Drowning and submersion while in swimming pool
Unspecified drowning and submersion
Drowning and submersion while in bath‐tub
Drowning and submersion while in natural water
Pedestrian Pedestrian injured in collision with car, pick‐up truck or van, non‐traffic
Other land transport Driver of all‐terrain or other off‐road vehicle injured in non‐traffic accident
7 Jim Helmkamp. (2007, October). Death and injury from ATV and bicycle crashes: A 5‐year comparison of national prevalence and cost estimates among children and adults. Retrieved from http://www.atvsafetynet.org/helmkamp.pdf 8 Icd‐10 version:2010. (n.d.). Retrieved from http://apps.who.int/classifications/icd10/browse/2010/en

ix
ixAppendix
Database Information
Database Who’sCounted?
CodingSystemUsed
YearsProvidedInthisReport Howtouse:
Emergency Department Database* Kansas Hospital Association**
A person who is admittedfor less than 24 hours to a non‐federal, short stay community or general hospital who is reporting emergency department visits to Kansas Hospital Association.
ICD‐9 2007‐2008 At this time ED data can only be provided statewide. This database provides a good view of less serious injuries in Kansas.
Hospital Discharge Database* Kansas Hospital Association**
A person who is admitted for at least 24 hours to a non‐federal, short stay community or general hospital who is reporting hospital discharge data to Kansas Hospital Association.
ICD‐9 2005‐2009 This database is most commonly referred to in this report due to its size and completeness. The HD database provides information for communities and regions and more in depth analysis of serious injuries.
Mortality Database Kansas Department of Health and Environment
Any persons who dies in the state of Kansas, and also Kansans who die outside of the state.
ICD‐10 2000‐2010 Although this database is the most complete, the numbers of deaths in Kansas are often too low to report (less than five). This database provides a look at fatal injuries at a state and region level.
*Special Focus, Unlinked Data:
The records in the Kansas emergency department and hospital discharge database are not unique. Records are not unique when they are unlinked. Suppose someone breaks their arm and goes to the emergency department but is then transferred to another emergency department due to a complication. In a linked system this one event can be tied together and counted as one event but with an unlinked system these are counted as two separate events. Serious injuries can inflate the counts if the person is transferred more than once. This is why we refer to events as hospital discharges (not unique). ** Federal and specialty hospitals in Kansas do not report their discharges and emergency department visits to these databases.