
Safe Harbor Statement - Church & Dwight Co., Inc.
137
Transcript of Safe Harbor Statement - Church & Dwight Co., Inc.


2
Safe Harbor Statement
01. WHO WE ARE
02. CATEGORY TRENDS
03. HOW WE DELIVER
04. HOW WE RUN THE COMPANY
05. FINANCIALS
3
01. WHO WE ARE
4
5
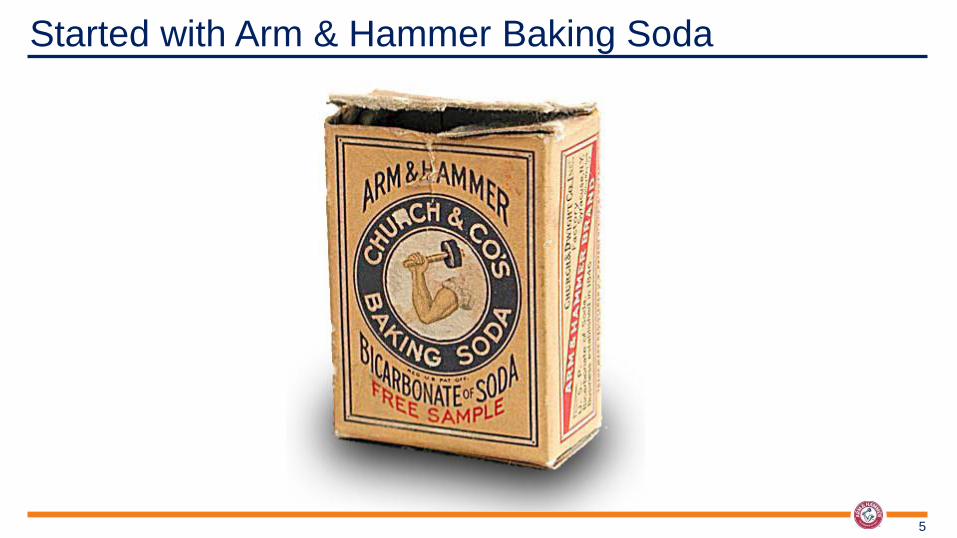
Started with Arm & Hammer Baking Soda

$3.5 Billion Diversified CPG Company
6

7
10 Power Brands
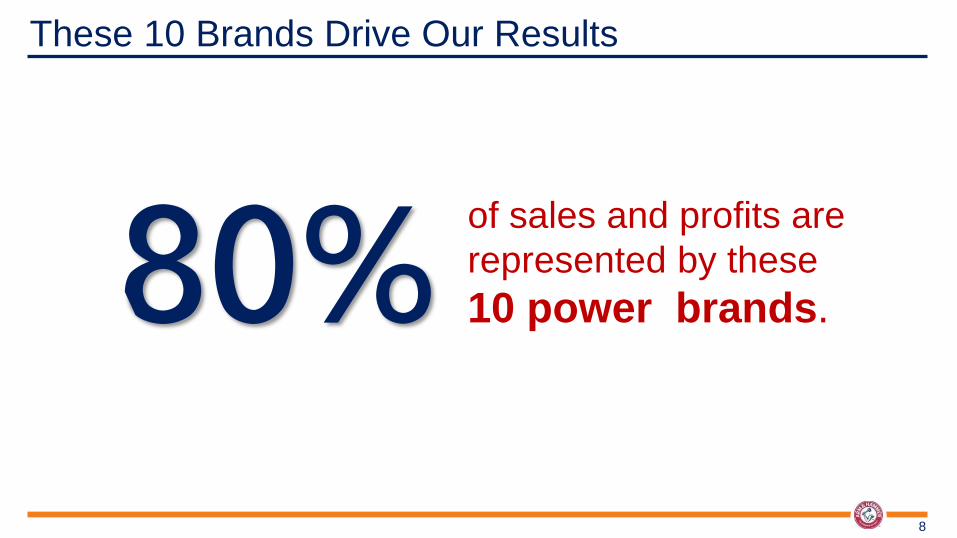
These 10 Brands Drive Our Results
8
80% of sales and profits are
represented by these
10 power brands.
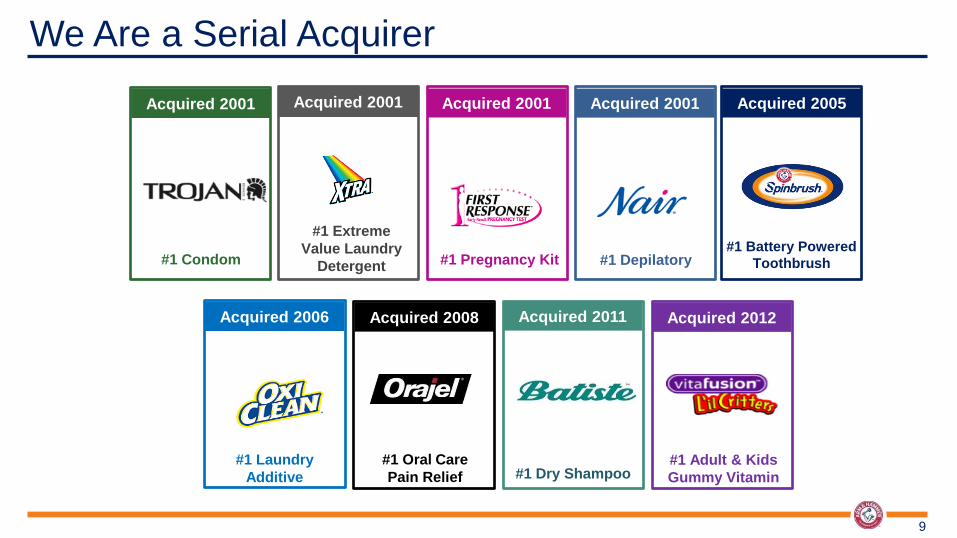
We Are a Serial Acquirer
9
#1 Condom
Acquired 2001 Acquired 2001
#1 Extreme
Value Laundry
Detergent
Acquired 2001
#1 Pregnancy Kit
Acquired 2001
#1 Depilatory
Acquired 2005
#1 Battery Powered
Toothbrush
Acquired 2006
#1 Laundry
Additive
#1 Oral Care
Pain Relief
Acquired 2008
#1 Dry Shampoo
Acquired 2011
#1 Adult & Kids
Gummy Vitamin
Acquired 2012
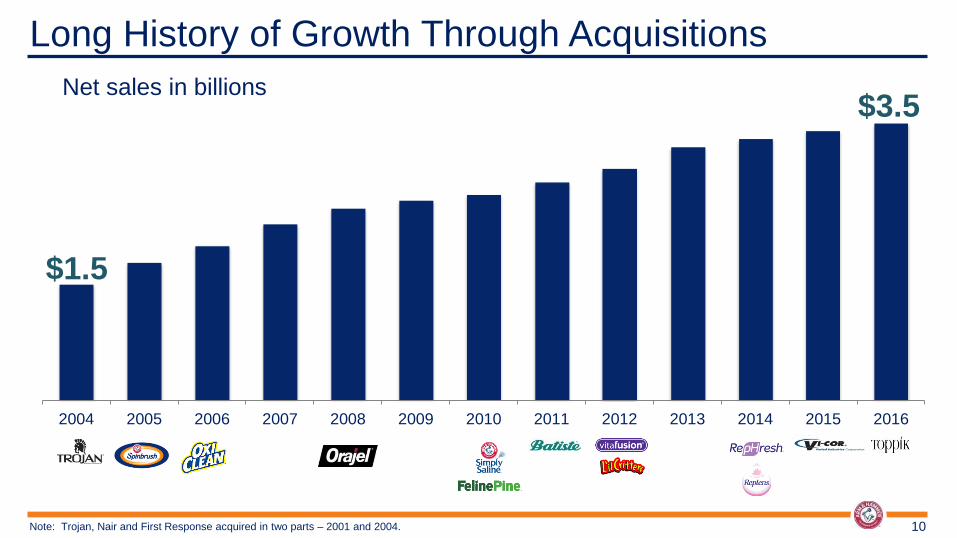
Long History of Growth Through Acquisitions
10
Net sales in billions
$1.5
$3.5
2004 2005 2006 2007 2008 2009 2010 2011 2012 2013 2014 2015 2016
Note: Trojan, Nair and First Response acquired in two parts – 2001 and 2004.
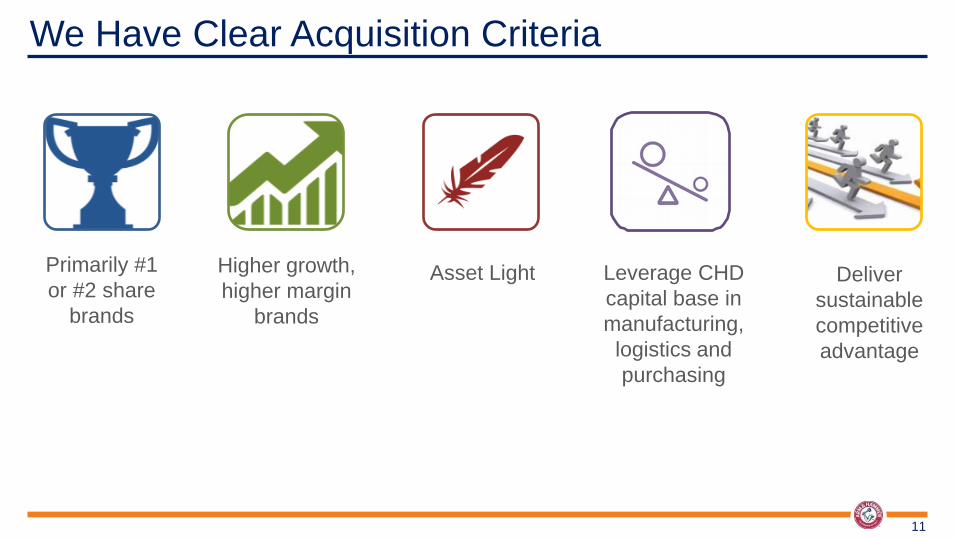
We Have Clear Acquisition Criteria
11
Higher growth,
higher margin
brands
Primarily #1
or #2 share
brands
Deliver
sustainable
competitive
advantage
Asset Light Leverage CHD
capital base in
manufacturing,
logistics and
purchasing
12
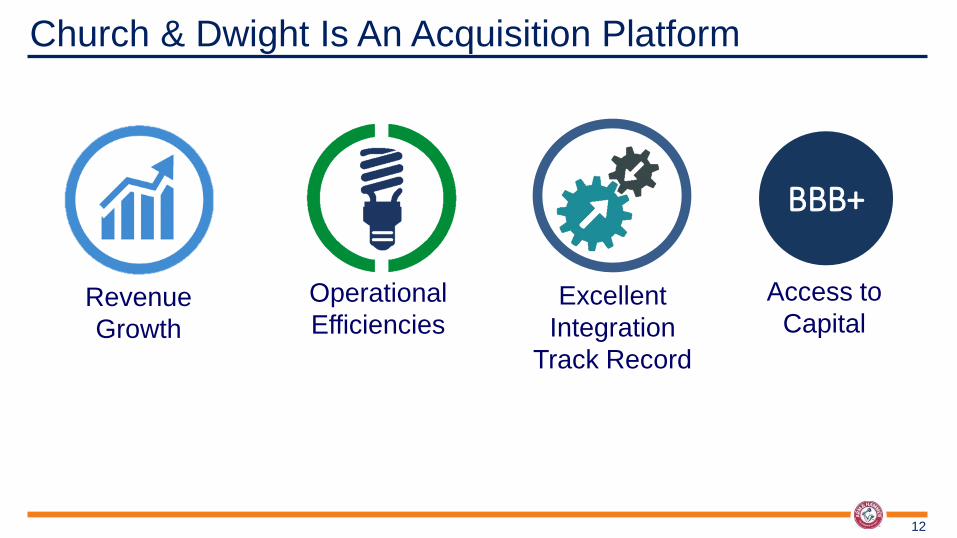
Church & Dwight Is An Acquisition Platform
Access to
Capital Revenue
Growth
Operational
Efficiencies Excellent
Integration
Track Record
BBB+

We Are Primarily a U.S. Company
13
82% of Church & Dwight is based in the United States.

Our Portfolio Is Balanced & Diversified
14
A well-balanced portfolio of household and personal care.
Personal Care 44%
Household 48%
Specialty Products
8%

We Operate in the Land of Giants
15
$65.3
$55.5
$18.2 $15.2
$12.2
$5.8 $3.5
P&G Unilever Kimberly Clark Colgate Reckitt Clorox Church & Dwight
Source: 2016 SEC Filings and Corporate Websites
2016 Net Sales ($ billions)
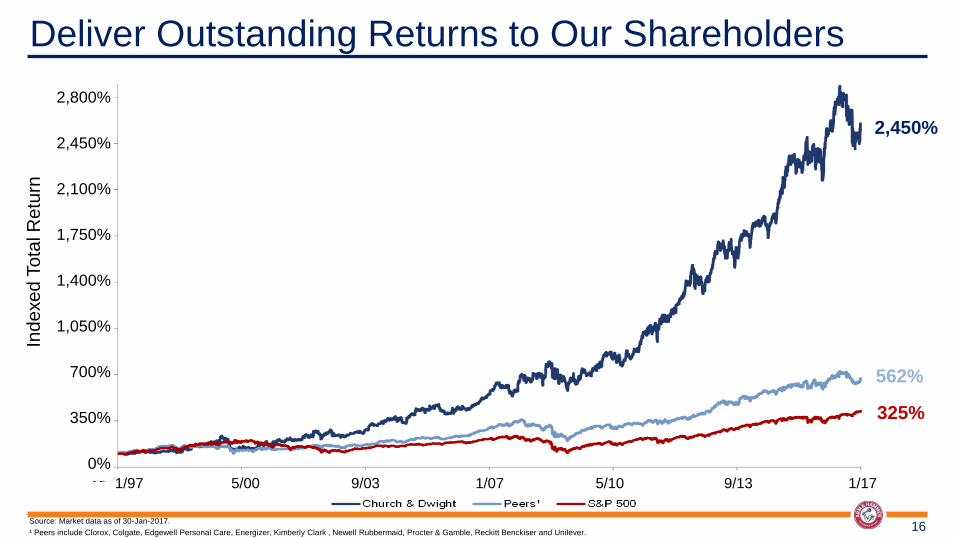
Deliver Outstanding Returns to Our Shareholders
16 Source: Market data as of 30-Jan-2017.
¹ Peers include Clorox, Colgate, Edgewell Personal Care, Energizer, Kimberly Clark , Newell Rubbermaid, Procter & Gamble, Reckitt Benckiser and Unilever.
2,800%
2,450%
2,100%
1,750%
1,400%
1,050%
700%
350%
0%
Ind
exe
d T
ota
l R
etu
rn
1/97 5/00 9/03 1/07 5/10 9/13 1/17
2,450%
562%
325%
02. CATEGORY
TRENDS
17

Unit Dose Driving
Laundry Category Growth

Laundry Detergent is ~25% of Global Net Sales
19
Net Sales:
$3.5B
25%
Laundry
Detergent: ~25%

U.S. Unit Dose Category Trend
20
57.4%
30.6%
18.9% 21.3% 21.2%
15.8%
26.4%
19.2% 14.5%
Source: Nielsen Total U.S. AOC
2013 2014 2015 2016 2016 2017
Q1 Q2 Q3 Q4 YTD
Unit
Dose

Unit Dose Increases YOY to 16% of Total Laundry Category
21
2015 2016
75% Liquid
14% Unit Dose
89% All Other
Source: Nielsen Total U.S. AOC
11% Powder
16% Unit Dose
74% Liquid
10% Powder

Arm & Hammer Unit Dose Trends
22 Source: Nielsen Total U.S. AOC
19.7%
-29.8%
-2.4%
35.3% 29.1%
2013 2014 2015 2016 2017 YTD

Unit Dose Market Share
23
Unit Dose Market Share
2015 2016 2017 YTD
Procter & Gamble 81.0 80.6 80.9
3.7 4.0 3.8
Sun Products 9.3 10.8 10.6
Henkel 2.8 1.6 1.5
Source: Nielsen Total U.S. AOC
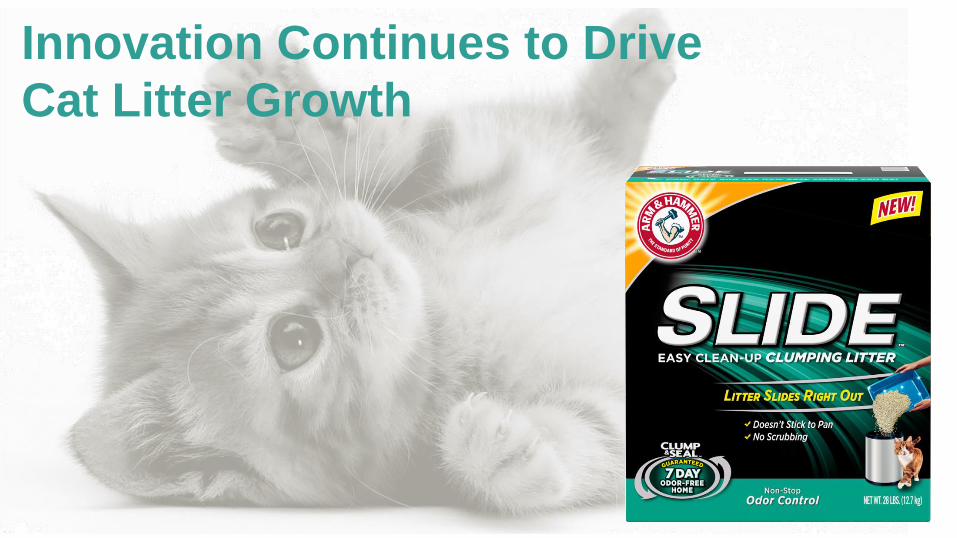
Innovation Continues to Drive
Cat Litter Growth
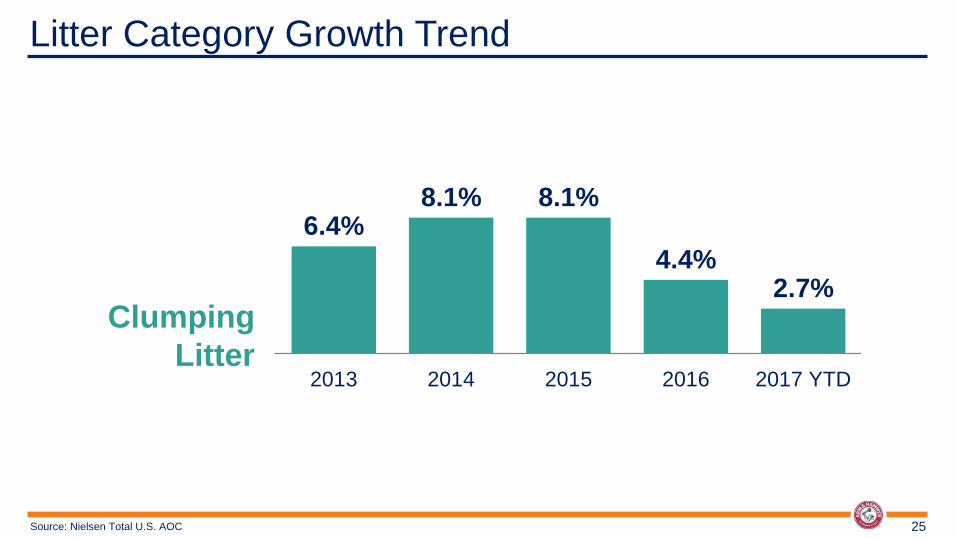
Litter Category Growth Trend
25 Source: Nielsen Total U.S. AOC
6.4% 8.1% 8.1%
4.4% 2.7%
2013 2014 2015 2016 2017 YTD
Clumping
Litter

2006 2007 2008 2009 2010 2011 2012 2013 2014 2015 2016
Retail Sales
26 Source: Neilson Retail Sales for 2011 – 2016
Driven by Consumer Insights
We Have Grown Through Innovation

Adult Conversion to
Gummies Continues to
Drive Category Growth
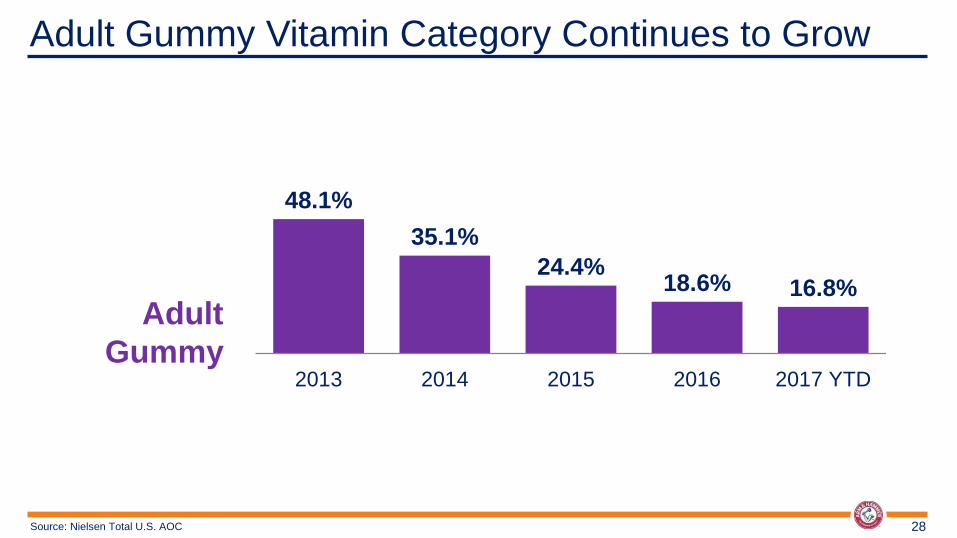
Adult Gummy Vitamin Category Continues to Grow
28 Source: Nielsen Total U.S. AOC
48.1%
35.1%
24.4% 18.6% 16.8%
2013 2014 2015 2016 2017 YTD
Adult
Gummy
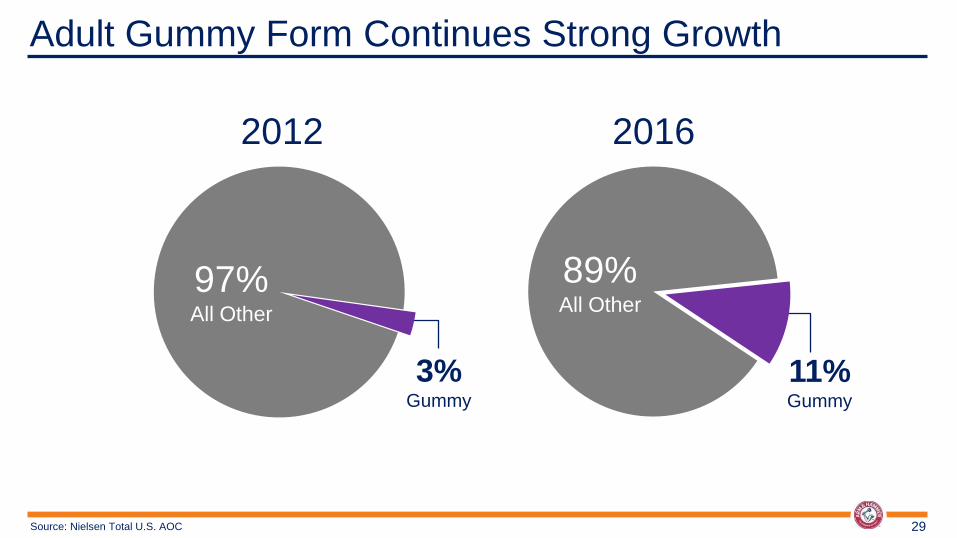
Adult Gummy Form Continues Strong Growth
29
2012 2016
97% All Other
3% Gummy
11% Gummy
89% All Other
Source: Nielsen Total U.S. AOC
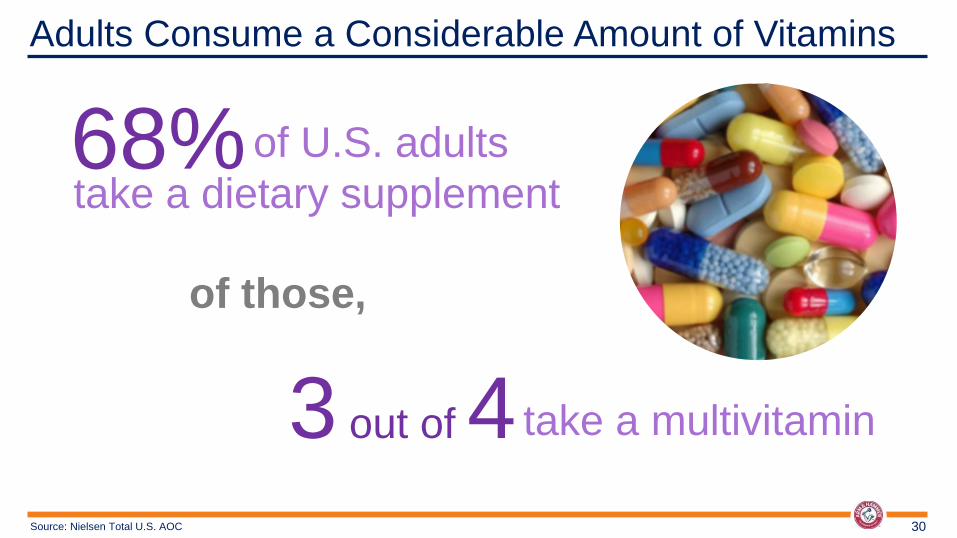
Adults Consume a Considerable Amount of Vitamins
30 Source: Nielsen Total U.S. AOC
take a multivitamin 3 out of 4
68% of U.S. adults
take a dietary supplement
of those,
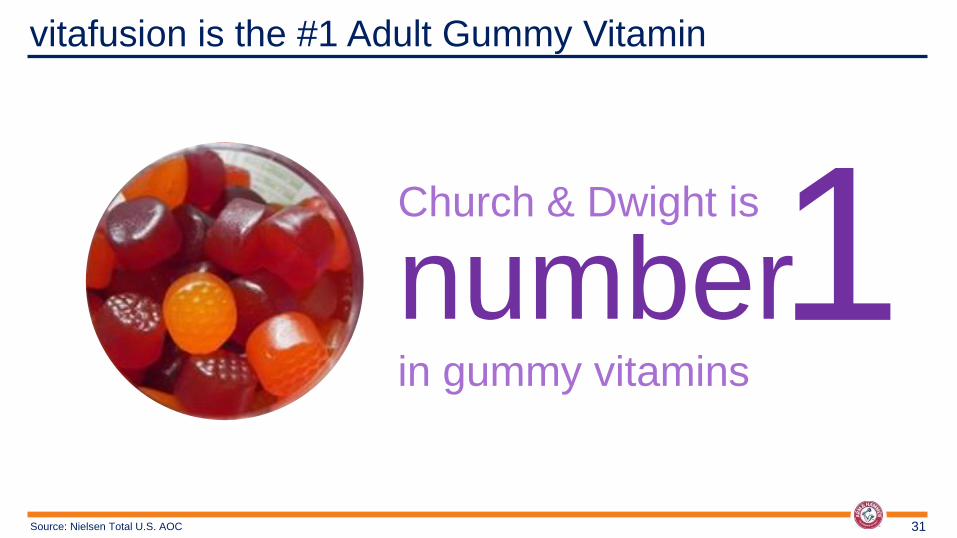
vitafusion is the #1 Adult Gummy Vitamin
31 Source: Nielsen Total U.S. AOC
Church & Dwight is
number in gummy vitamins
1

The Condom
Category is
Beginning to
Shift to Online 32

Measured Channel Growth
33
-2.6%
0.0%
-1.4% -1.5%
-3.3%
Condoms
2013 2014 2015 2016 2017 YTD
Source: Nielsen Total U.S. AOC
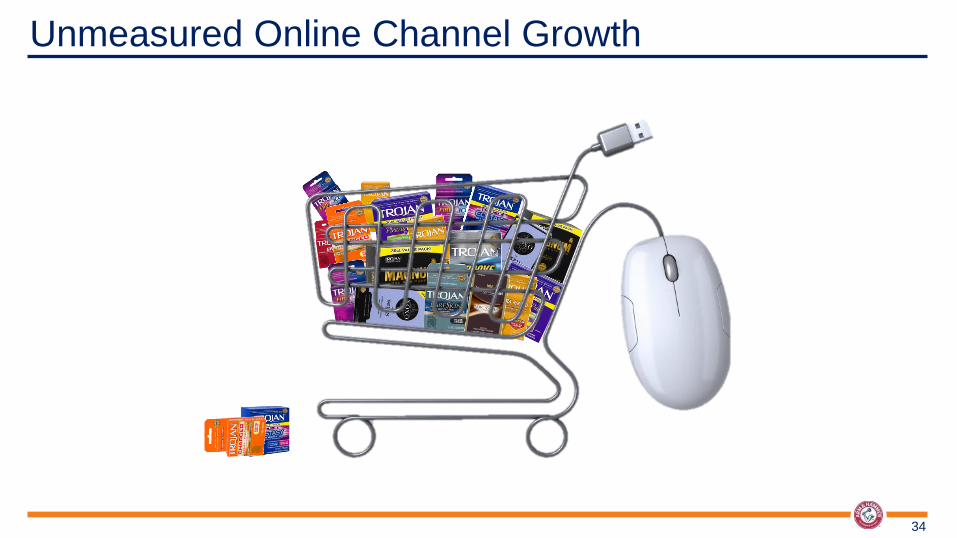
Unmeasured Online Channel Growth
34

Dry Shampoo is
the Fastest Growing
Segment of Haircare
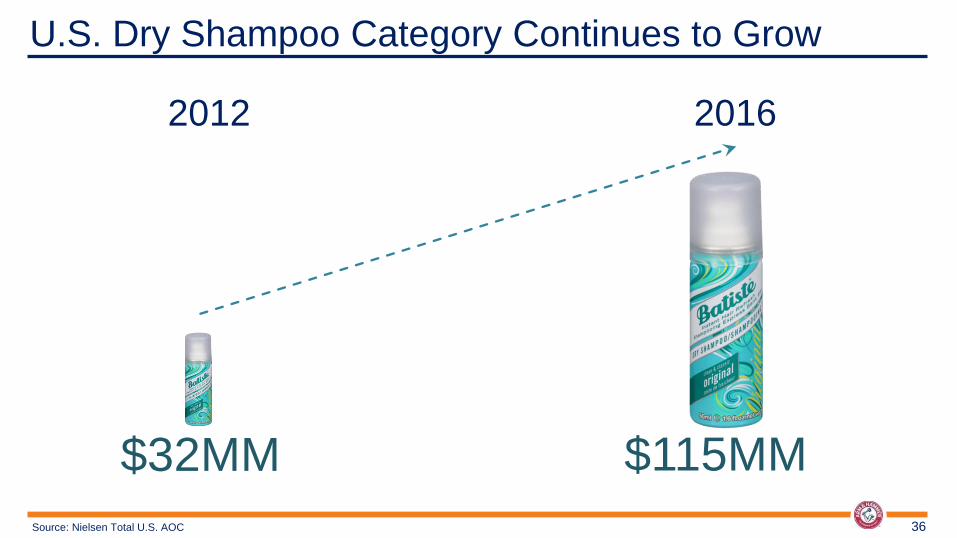
U.S. Dry Shampoo Category Continues to Grow
36 Source: Nielsen Total U.S. AOC
$115MM $32MM
2012 2016
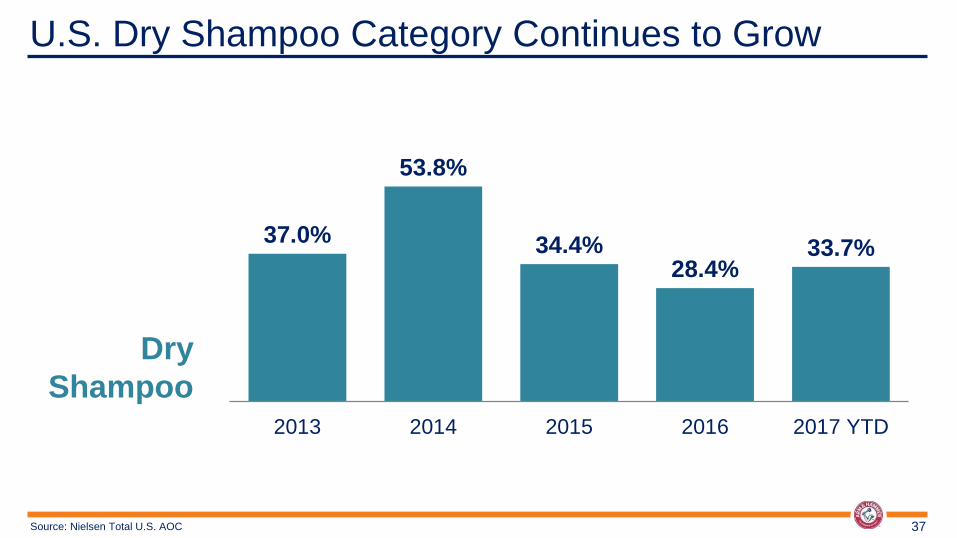
U.S. Dry Shampoo Category Continues to Grow
37 Source: Nielsen Total U.S. AOC
37.0%
53.8%
34.4% 28.4%
33.7%
2013 2014 2015 2016 2017 YTD
Dry
Shampoo

Dry Shampoo Growth is Ahead of Us
38
#1 Dry Shampoo in the U.S. and the U.K.
Source: Nielsen 12/19/16
U.S. Population: 324 million
Retail Category: $115 million
U.K. Population: 65 million
Retail Category: $63 million

Significant Growth Opportunity in the Dry Shampoo Category
39 Source: MRI Doublebase 2016*, ̂ Mintel 2013, ~Lightspeed GMI/Mintel January 2016
There are 125 million women 18+ in the U.S.
66% of women don’t wash their hair every day.
13% of women 18+ use dry shampoo.

03. HOW WE DELIVER
40

Diversified Product Portfolio
Build Power Brand Shares
Drive International Growth
Focus on Gross Margin
Growth Through Acquisitions
“Best in Class” Free Cash Flow Conversion
Superior Overhead Management
Simple Incentive Compensation
TSR Drivers Deliver Results
41
1.
2.
3.
4.
5.
6.
7.
8.
Diversified Product
Portfolio 1
42

Diversified Product Portfolio
43
Our Unique Product Portfolio Has Both Value and Premium Products
Premium:
60%
Value:
40%
Build Power Brand
Shares 2
44

45
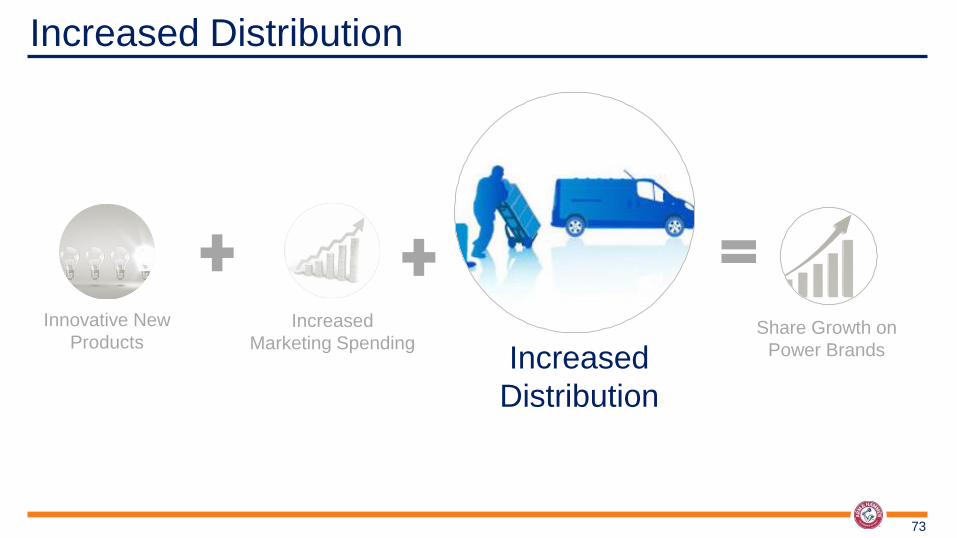
Consistent Share Growth Formula
Build Power Brand Shares
Innovative
New Products
Increased
Marketing
Spending
Increased
Distribution
Share Growth on
Power Brands

46
Innovative New Products
Innovative
New
Products
Increased
Marketing
Spending
Increased
Distribution
Share Growth on
Power Brands

47
ARM & HAMMER 3-IN-1 Power Paks Baking soda freshness with OxiClean stain fighters.
Deep Cleaning
Liquid Detergent
Fresh Scent
Booster
OxiClean™
Stain Fighters
2017 ARM & HAMMER Launch

48
2017 LITTER Launches
SLIDE Easy Clean-Up Clumping Litter
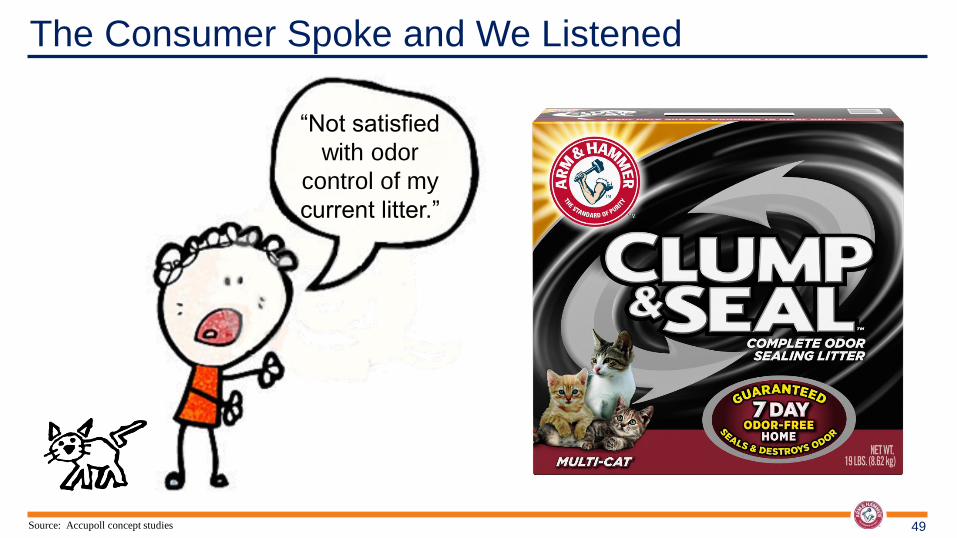
The Consumer Spoke and We Listened
49
“Not satisfied
with odor
control of my
current litter.”
Source: Accupoll concept studies

The Consumer Spoke and We Listened
50
“I didn’t realize
scooping was
not enough to
control bacterial
odors.”
Source: Accupoll concept studies

The Consumer Spoke and We Listened
51 Source: Accupoll concept studies
“Cleaning the
litter box is a
nightmare.”
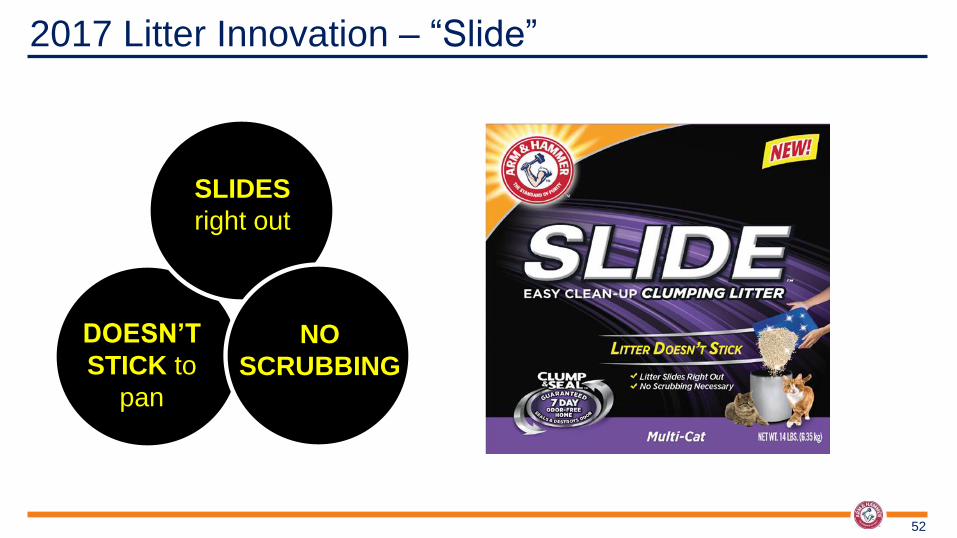
2017 Litter Innovation – “Slide”
52
SLIDES
right out
NO
SCRUBBING
DOESN’T
STICK to
pan

53

54
2017 VITAMIN Launches
VITAFUSION ENERGY Supports energy productions
L’IL CRITTERS
Twisted Fruits & Fruit ‘n Honey

55
vitafusion Simply Good Made with real honey and real fruit juice .
2017 VITAMIN Launches
56
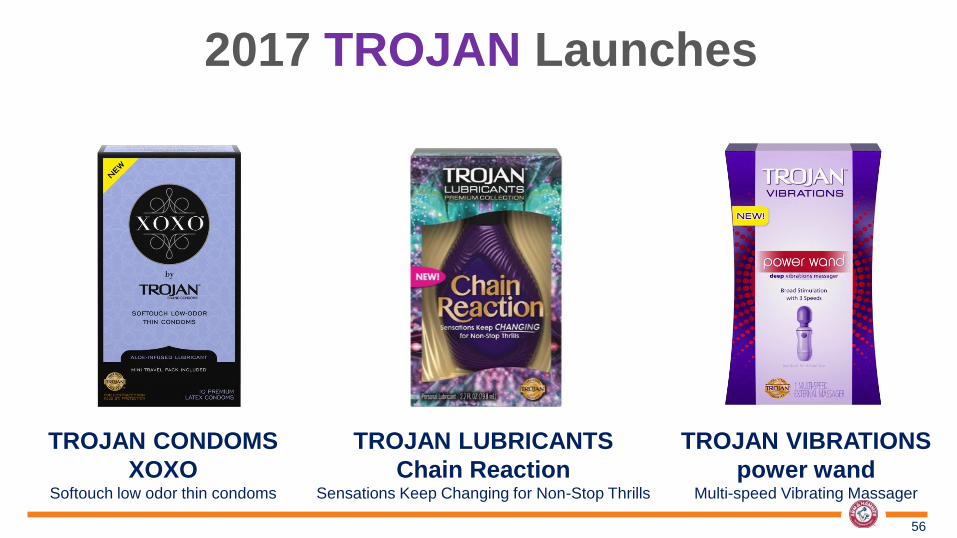
2017 TROJAN Launches
TROJAN CONDOMS
XOXO Softouch low odor thin condoms
TROJAN LUBRICANTS
Chain Reaction Sensations Keep Changing for Non-Stop Thrills
TROJAN VIBRATIONS
power wand Multi-speed Vibrating Massager

2017 TROJAN Innovation – “XOXO”
57
THIN
ALOE
INFUSED
lubricant
SOFTOUCH

Condoms are Not Just Purchased by Men
58
1 in 3 condom
purchases are by
women.

XOXO Launches New Advertising Campaign
59
#trustyourself
60
The First Time on Network Television

61
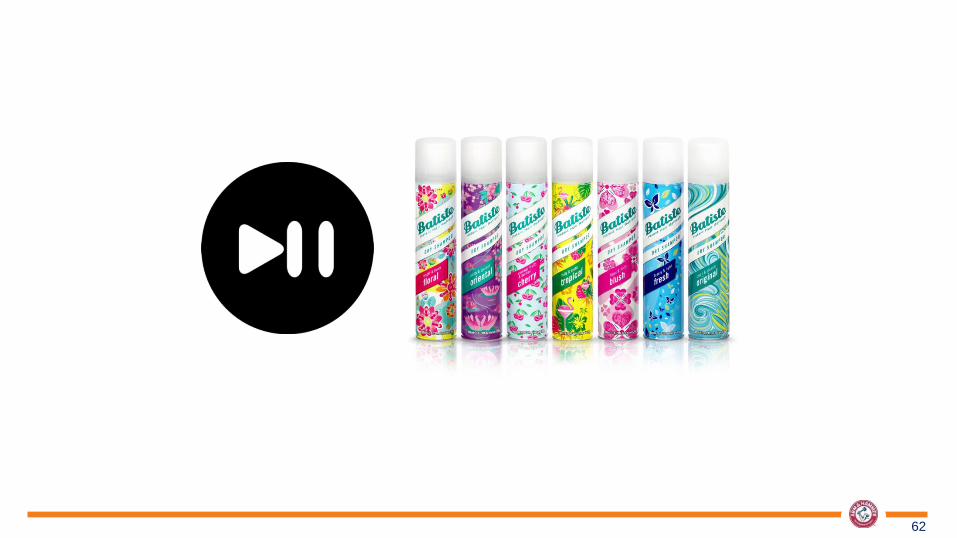
2017 DRY SHAMPOO Launches
Same formulation, but with
“barely there” fragrance
that won’t compete with
perfume.
On-trend fragrance
profile bursting with
juicy pomegranate &
jasmine.
clean & light
bare vibrant & fruity
neon
62

63
OxiClean New claims, new packaging, new formula.
2017 OXICLEAN LAUNDRY DETERGENT Restage

64
Increased Marketing Spending
Innovative New
Products Increased
Marketing
Spending
Increased
Distribution
Share Growth on
Power Brands

65 Source: Kantar, Oct 15 – Sept 16
12. Glaxo SmithKline
18. Church & Dwight
20. Clorox
22. Kimberly-Clark
23. S.C. Johnson
26. Campbell Soup
29. Colgate-Palmolive
CHD is 18th Largest U.S. Advertiser
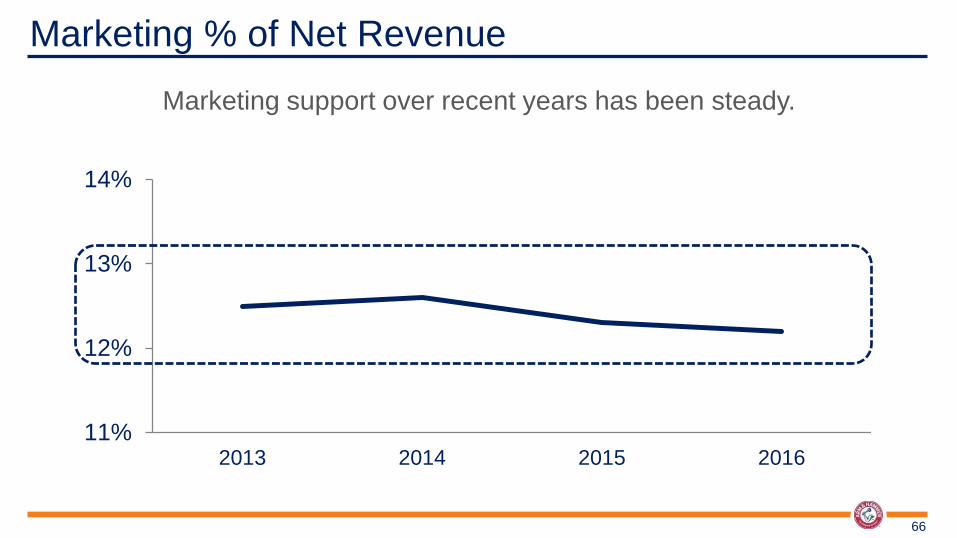
Marketing % of Net Revenue
66
Marketing support over recent years has been steady.
11%
12%
13%
14%
2013 2014 2015 2016

Dollars Continue to Shift to Digital
67
Digital:
28%
TV / Radio / Print:
72% TV / Radio / Print:
87% Digital:
13%
2011 2016

68
E-Commerce
Growth

E-Commerce Expanding Around the World
69
3%
7% 7% 8% 10%
16%
30%
Mexico France Australia U.S. Canada UK China
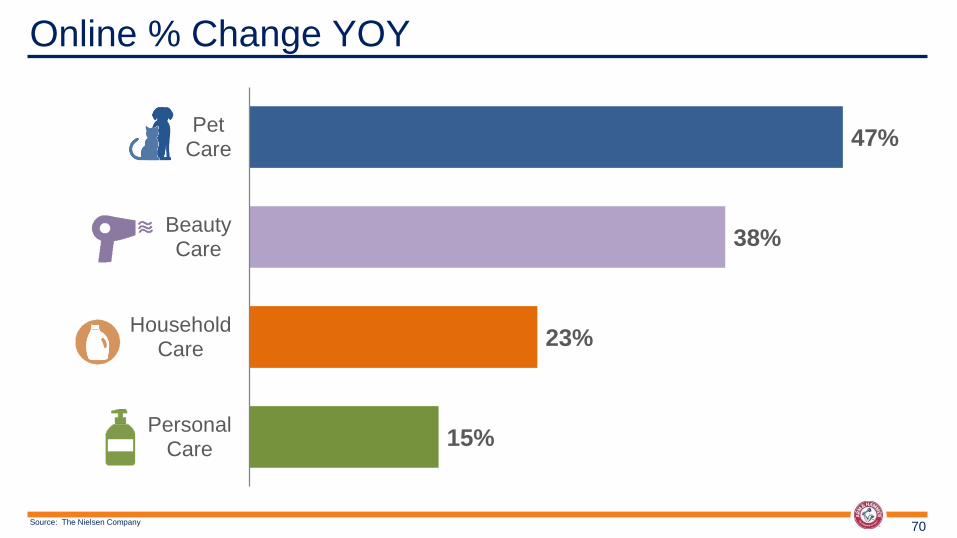
Online % Change YOY
70
15%
23%
38%
47%
PersonalCare
HouseholdCare
BeautyCare
PetCare
Source: The Nielsen Company

Church & Dwight Online Sales
71
<1% 1%
2%
~3%
2014 2015 2016 2017E

Church & Dwight’s Largest Online Growers YOY
72
91%
98%
112%
291%
445%
CONDOMS
VITAFUSION
REPHRESH
CLUMPING LITTER
A&H LIQUID DETERGENT
2015 vs. 2016
73
Increased Distribution
Increased
Marketing Spending Increased
Distribution
Share Growth on
Power Brands
Innovative New
Products
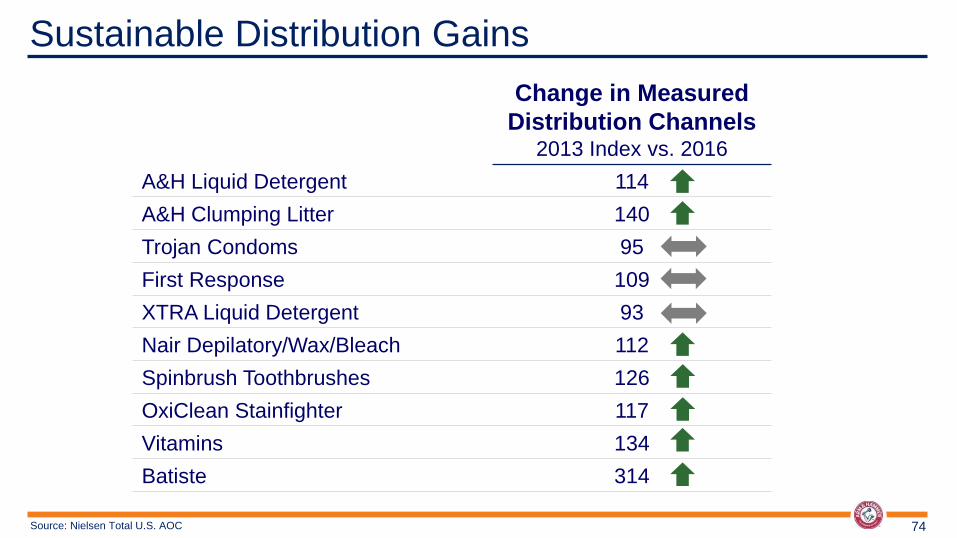
Change in Measured
Distribution Channels 2013 Index vs. 2016
A&H Liquid Detergent 114
A&H Clumping Litter 140
Trojan Condoms 95
First Response 109
XTRA Liquid Detergent 93
Nair Depilatory/Wax/Bleach 112
Spinbrush Toothbrushes 126
OxiClean Stainfighter 117
Vitamins 134
Batiste 314
Sustainable Distribution Gains
74 Source: Nielsen Total U.S. AOC
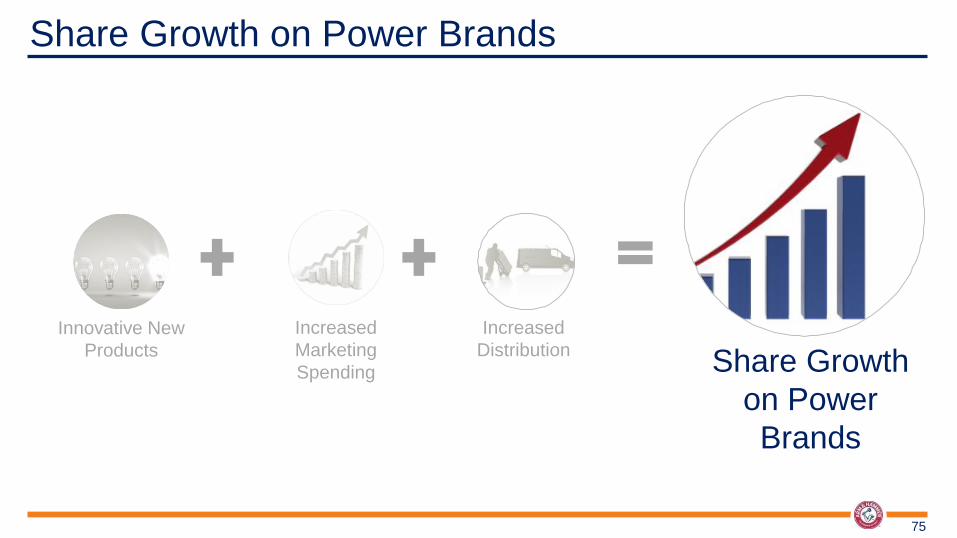
75
Share Growth on Power Brands
Innovative New
Products
Increased
Marketing
Spending
Increased
Distribution Share Growth
on Power
Brands
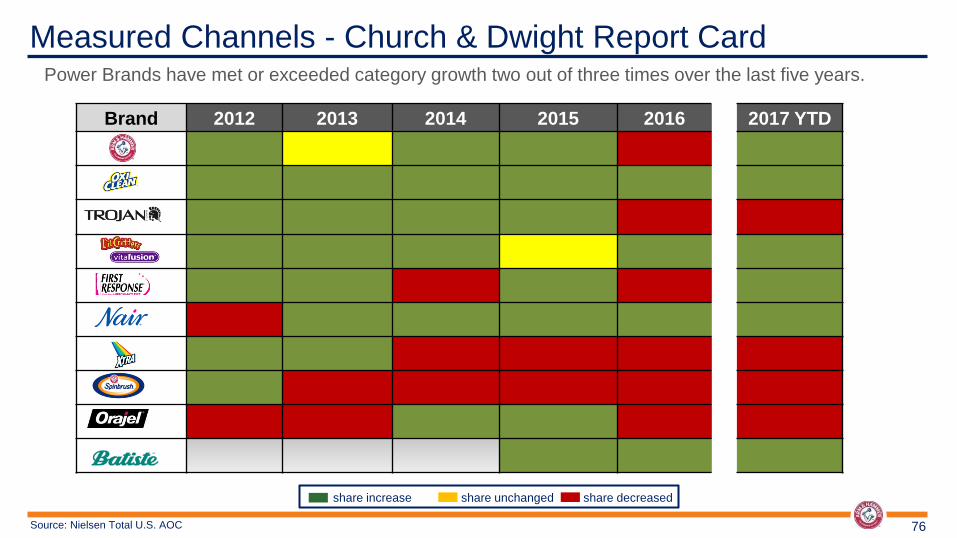
Measured Channels - Church & Dwight Report Card
76
Brand 2012 2013 2014 2015 2016 2017 YTD
Source: Nielsen Total U.S. AOC
share increase share unchanged share decreased
Power Brands have met or exceeded category growth two out of three times over the last five years.

Drive International
Growth 3
77

Where Are We Located Outside the U.S.?
78
denotes regional
headquarters

2016 Opened New Offices in Panama and Singapore
79
denotes regional
headquarters
denotes new office
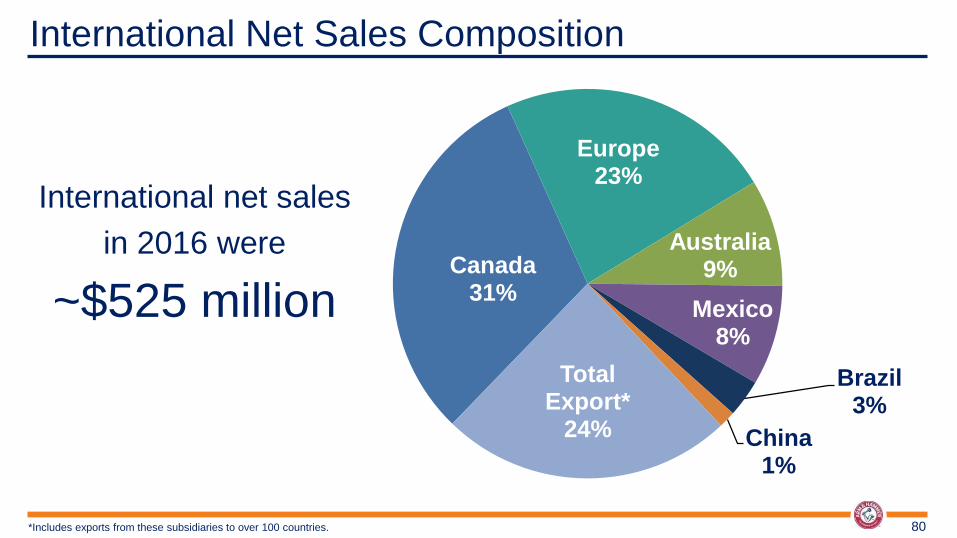
International Net Sales Composition
81% United States
Canada 31%
Europe 23%
Australia 9%
Mexico 8%
Brazil 3%
China 1%
Total Export*
24%
80
International net sales
in 2016 were
~$525 million
*Includes exports from these subsidiaries to over 100 countries.
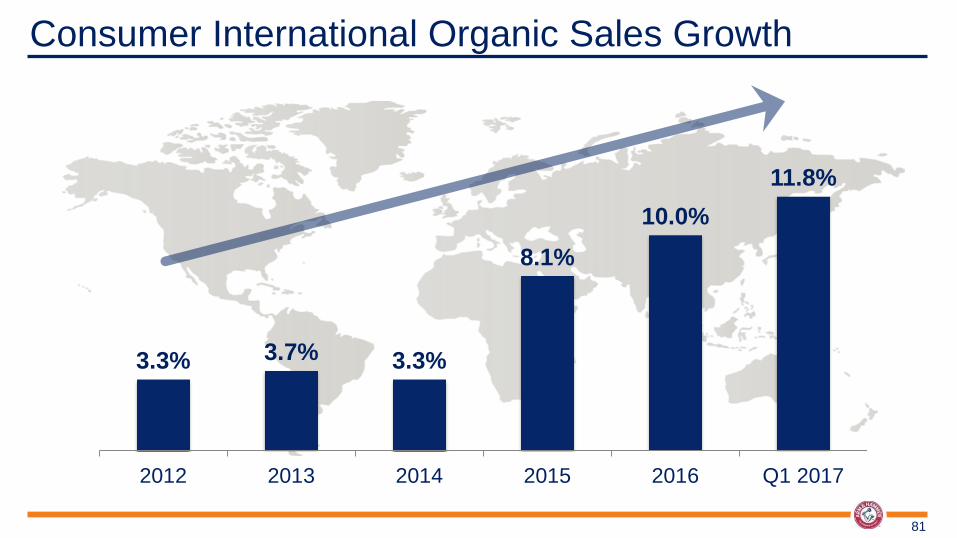
Consumer International Organic Sales Growth
81
3.3% 3.7% 3.3%
8.1%
10.0%
11.8%
2012 2013 2014 2015 2016 Q1 2017
What is our Long Term Vision?
82
Today, consumer international is a
$500 million business that we see
growing to a $1 billion business.

Focus on Gross
Margin 4
83
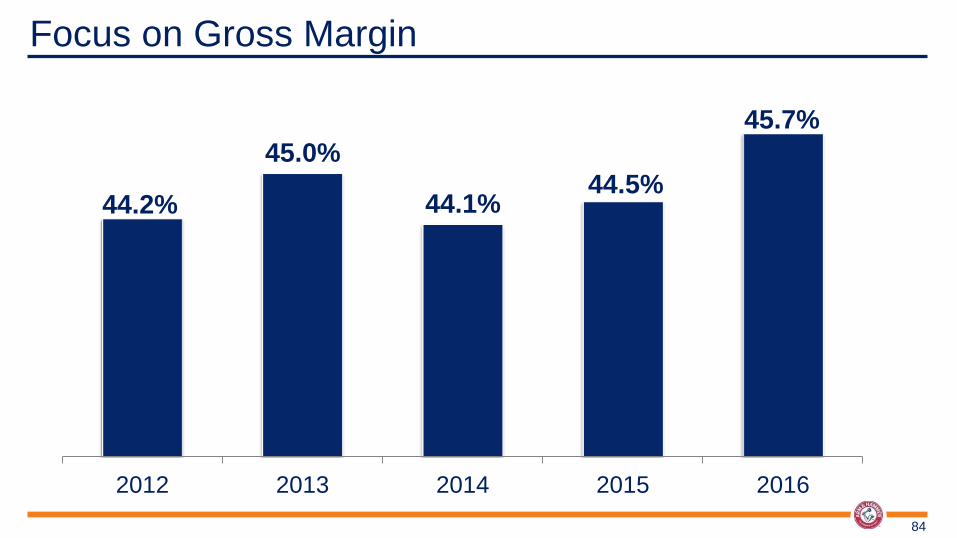
Focus on Gross Margin
84
44.2%
45.0%
44.1% 44.5%
45.7%
2012 2013 2014 2015 2016

Key Gross Margin Growth Drivers
85
Good to Great Cost
Optimization
Supply Chain
Optimization
Acquisition Synergies
New Products
86
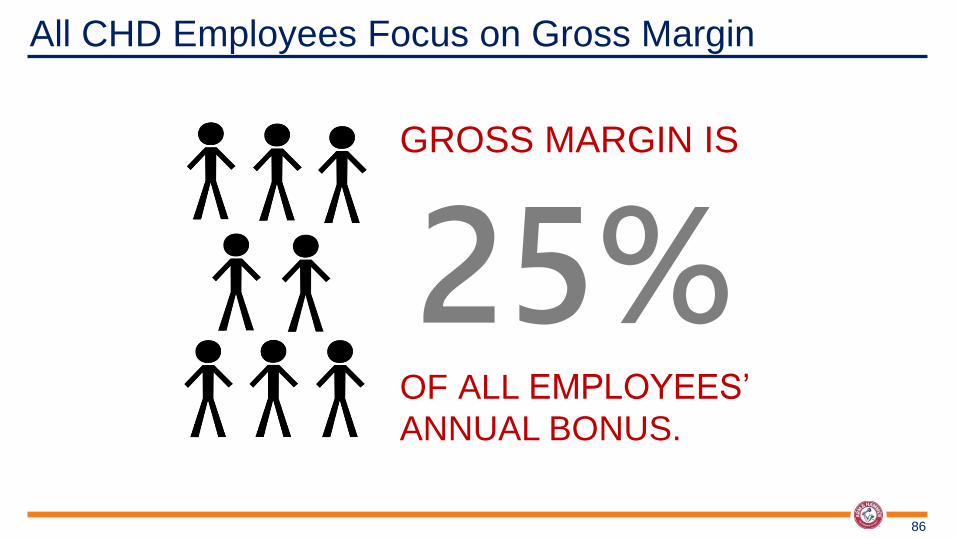
All CHD Employees Focus on Gross Margin
25% GROSS MARGIN IS
OF ALL EMPLOYEES’
ANNUAL BONUS.

Growth Through
Acquisitions 5
87

Acquisition Criteria
88
Primarily #1 or #2 share brands
Higher growth, higher margin brands
Asset Light
Leverage CHD capital base in manufacturing,
logistics and purchasing
Deliver sustainable competitive advantage
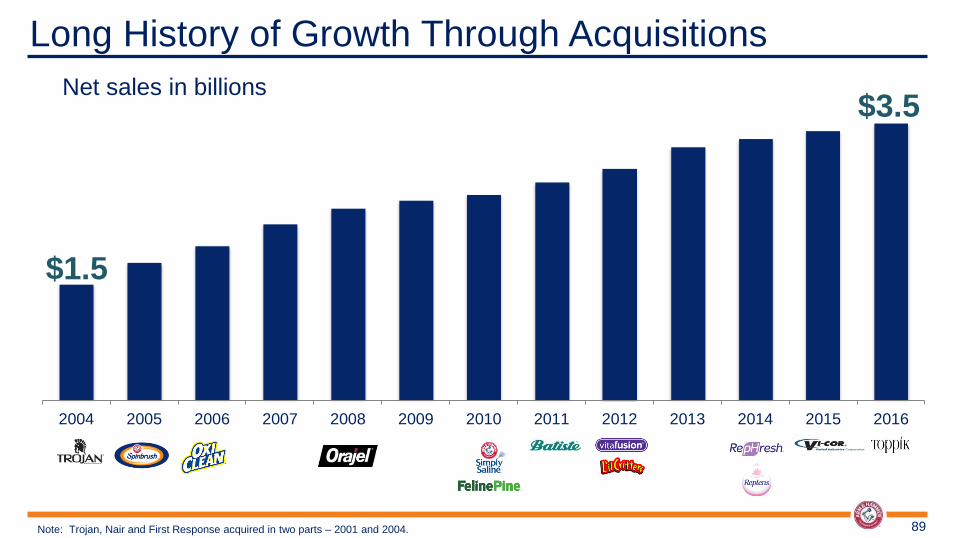
Long History of Growth Through Acquisitions
89
Net sales in billions
$1.5
$3.5
2004 2005 2006 2007 2008 2009 2010 2011 2012 2013 2014 2015 2016
Note: Trojan, Nair and First Response acquired in two parts – 2001 and 2004.
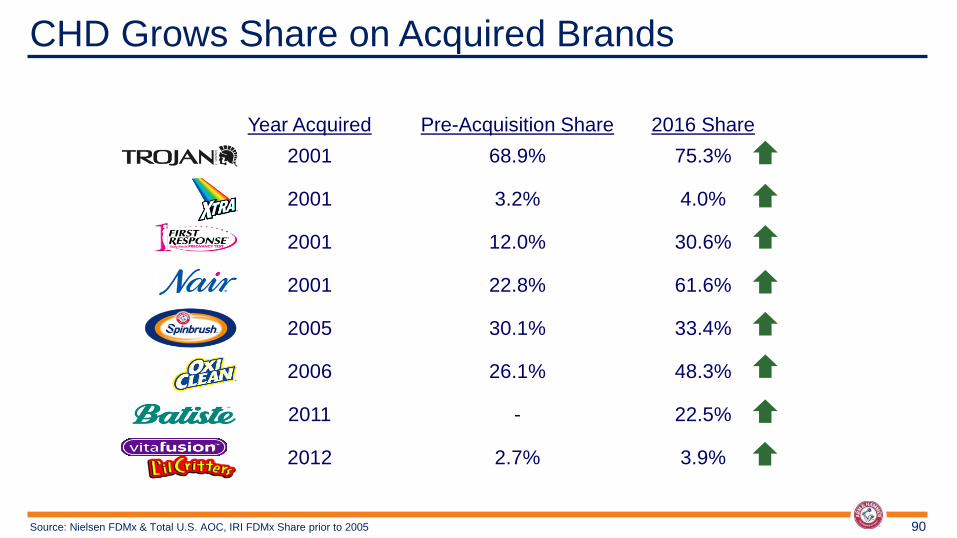
Year Acquired Pre-Acquisition Share 2016 Share
2001 68.9% 75.3%
2001 3.2% 4.0%
2001 12.0% 30.6%
2001 22.8% 61.6%
2005 30.1% 33.4%
2006 26.1% 48.3%
2011 - 22.5%
2012 2.7% 3.9%
Source: Nielsen FDMx & Total U.S. AOC, IRI FDMx Share prior to 2005
CHD Grows Share on Acquired Brands
90

Viviscal is the #1 non-drug hair care supplement brand
mainly sold in the U.S. and the U.K. with annual 2016
sales of $44 million.
2017 Bolt-On Acquisition
91
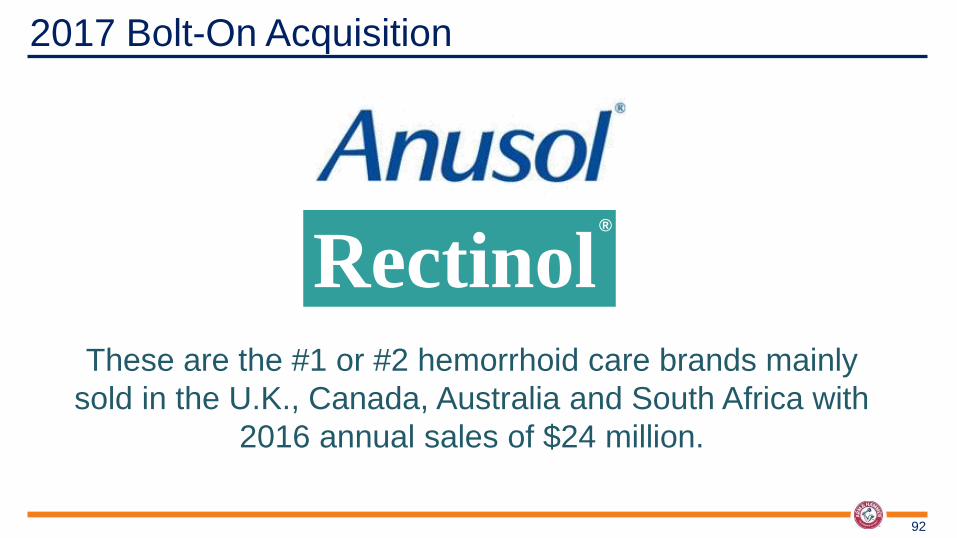
Rectinol
These are the #1 or #2 hemorrhoid care brands mainly
sold in the U.K., Canada, Australia and South Africa with
2016 annual sales of $24 million.
2017 Bolt-On Acquisition
92
®

Agro BioSciences is a leader in developing custom probiotic
products for poultry, cattle and swine. This business is
complementary to the Company’s animal productivity business
with trailing annual sales of approximately $11 million.
2017 Bolt-On Acquisition
93
®

“Best in Class” Free
Cash Flow Conversion 6
94

“Best in Class” FCF Conversion
95 Source : Bloomberg. See appendix.
Year Average 2007-2016
92%
99%
101%
102%
104%
106%
107%
112%
116%
122%
0% 20% 40% 60% 80% 100% 120% 140%
KO
PEP
PG
CPB
CLX
Consumer Staples Average
KMB
CL
K
CHDChurch & Dwight
Kellogg
Colgate
Kimberly Clark
Consumer Staples
Average
Clorox
Campbell’s
Procter & Gamble
Pepsi
Coca-Cola

Superior Overhead
Management 7
96
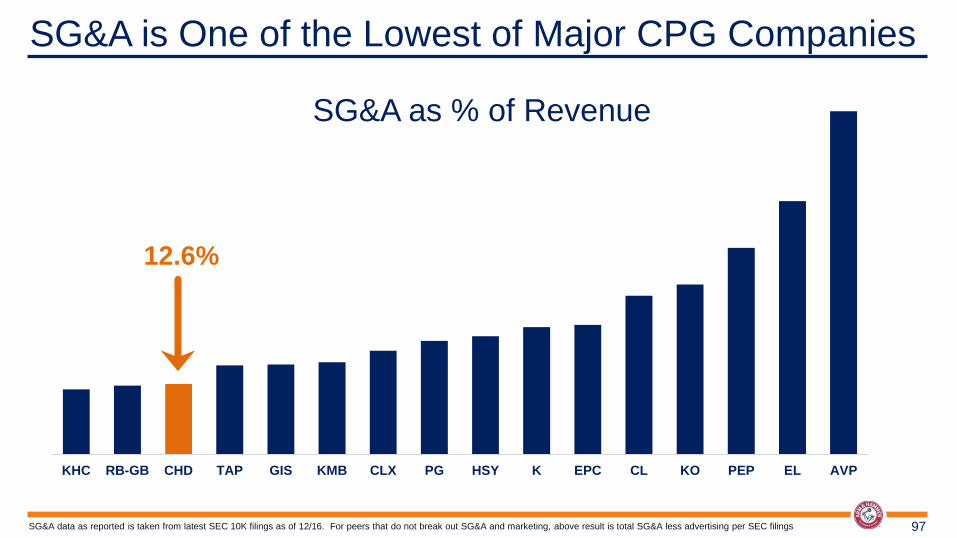
SG&A data as reported is taken from latest SEC 10K filings as of 12/16. For peers that do not break out SG&A and marketing, above result is total SG&A less advertising per SEC filings
SG&A is One of the Lowest of Major CPG Companies
97
SG&A as % of Revenue
12.6%
KHC RB-GB CHD TAP GIS KMB CLX PG HSY K EPC CL KO PEP EL AVP
SG&A as % of Revenue
Simple Incentive
Compensation 8
98
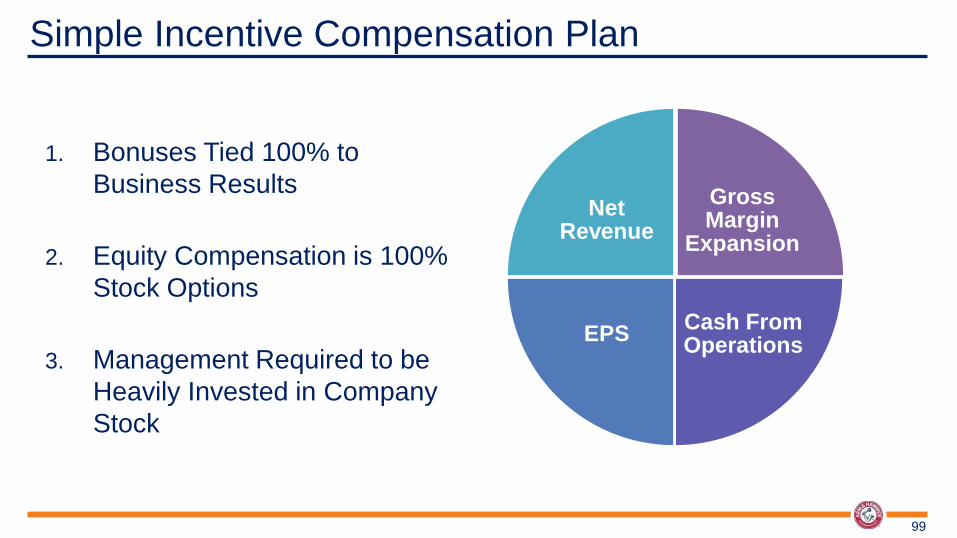
1. Bonuses Tied 100% to
Business Results
2. Equity Compensation is 100%
Stock Options
3. Management Required to be
Heavily Invested in Company
Stock
99
Simple Incentive Compensation Plan
Gross Margin
Expansion
Cash From Operations
EPS
Net Revenue

04. HOW WE RUN
THE COMPANY
100
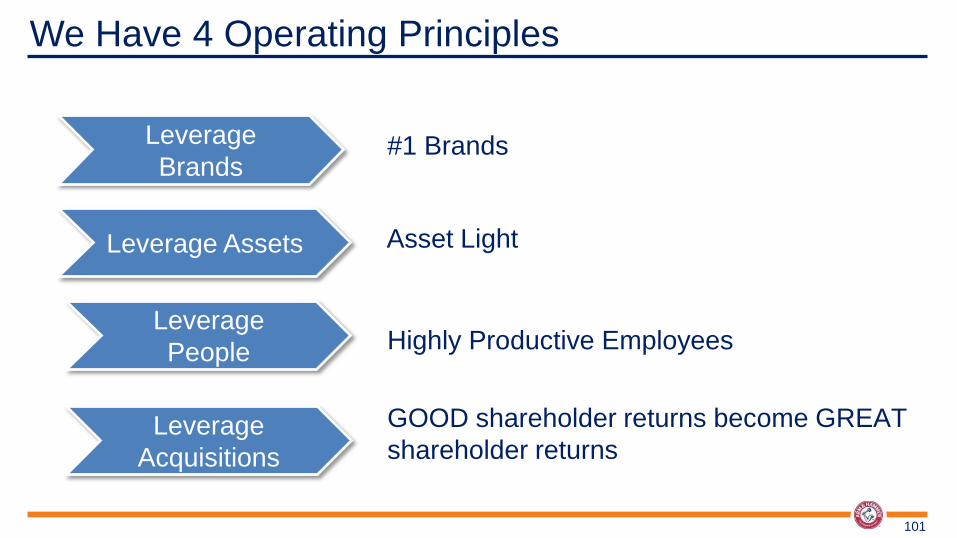
We Have 4 Operating Principles
101
Highly Productive Employees
Asset Light
Leverage
People
Leverage Assets
Leverage
Acquisitions
GOOD shareholder returns become GREAT
shareholder returns
Leverage
Brands #1 Brands

Evergreen Model
102
TSR Model
Organic Net Sales Growth +3.0%
Gross Margin +25 bps
Marketing FLAT
SG&A -25 bps
Operating Margin ∆ +50 bps
EPS Growth 8%
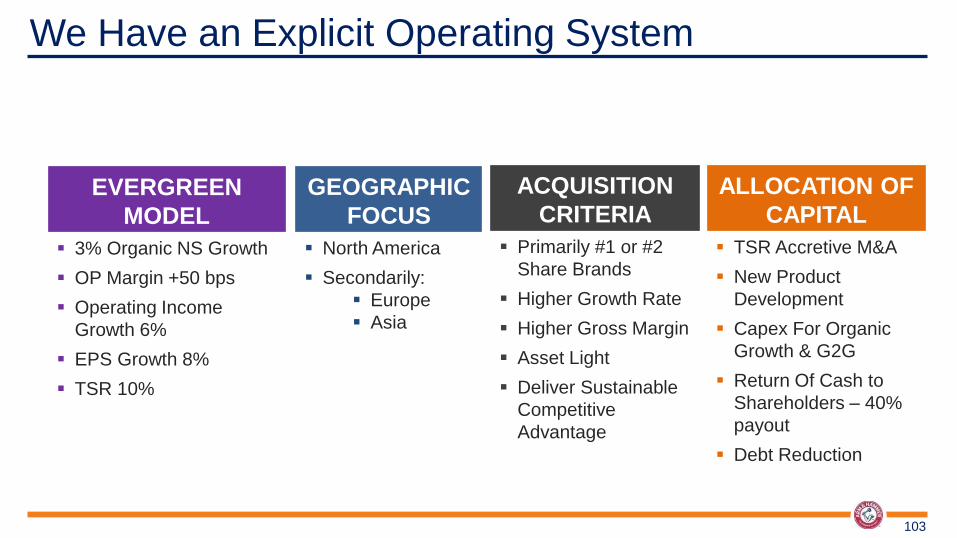
GEOGRAPHIC
FOCUS
North America
Secondarily:
Europe
Asia
We Have an Explicit Operating System
103
EVERGREEN
MODEL
3% Organic NS Growth
OP Margin +50 bps
Operating Income
Growth 6%
EPS Growth 8%
TSR 10%
ALLOCATION OF
CAPITAL
TSR Accretive M&A
New Product
Development
Capex For Organic
Growth & G2G
Return Of Cash to
Shareholders – 40%
payout
Debt Reduction
ACQUISITION
CRITERIA
Primarily #1 or #2
Share Brands
Higher Growth Rate
Higher Gross Margin
Asset Light
Deliver Sustainable
Competitive
Advantage

05. FINANCIALS
104
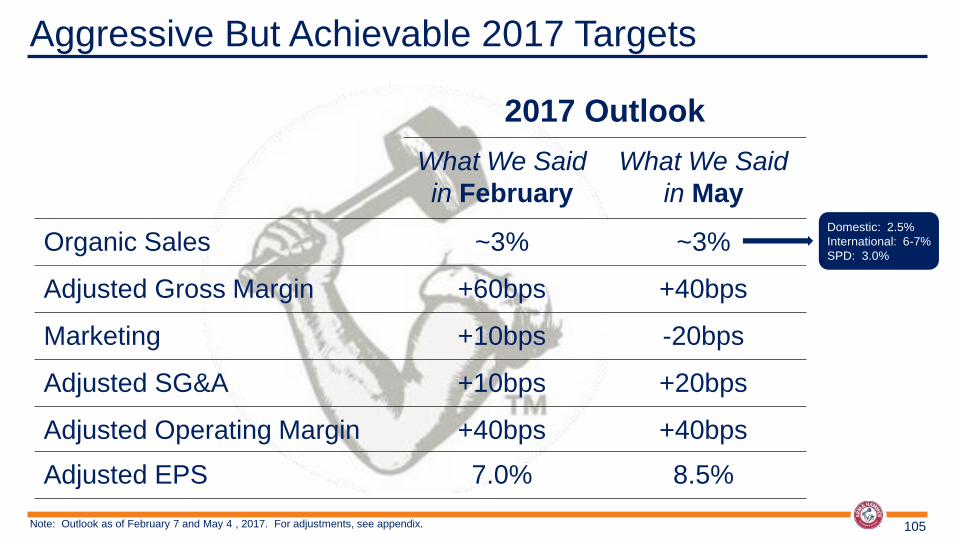
Note: Outlook as of February 7 and May 4 , 2017. For adjustments, see appendix.
Aggressive But Achievable 2017 Targets
105
2017 Outlook
What We Said
in February
What We Said
in May
Organic Sales ~3% ~3%
Adjusted Gross Margin +60bps +40bps
Marketing +10bps -20bps
Adjusted SG&A +10bps +20bps
Adjusted Operating Margin +40bps +40bps
Adjusted EPS 7.0% 8.5%
Domestic: 2.5%
International: 6-7%
SPD: 3.0%

CHD Consistent Solid Organic Sales Growth
106
5.2%
1.9%
3.5% 3.6% 3.2% ~3.0%
2012 2013 2014 2015 2016 2017E
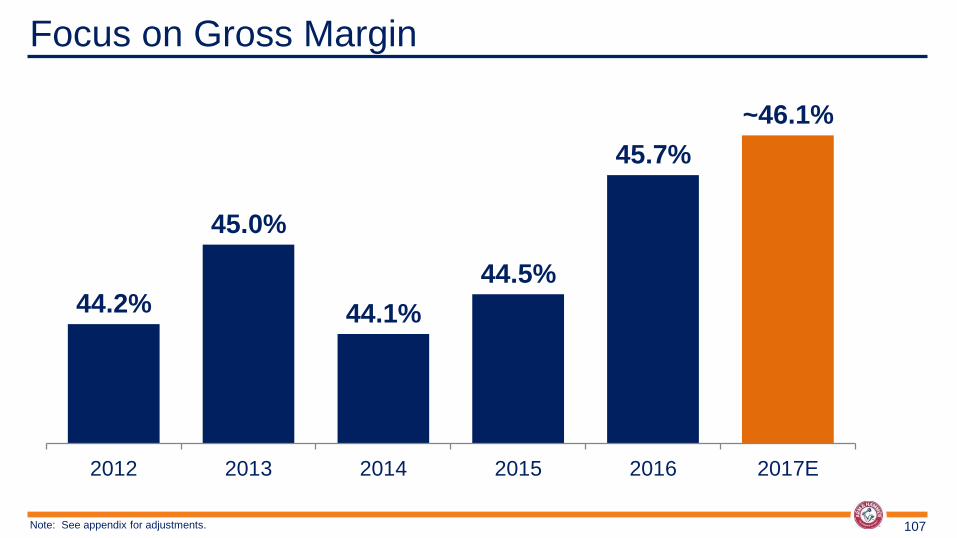
Focus on Gross Margin
107
44.2%
45.0%
44.1%
44.5%
45.7%
~46.1%
2012 2013 2014 2015 2016 2017E
Note: See appendix for adjustments.

Consistent Marketing Spend
108
12.2%
12.5% 12.6%
12.3% 12.2% ~12.0%
2012 2013 2014 2015 2016 2017E
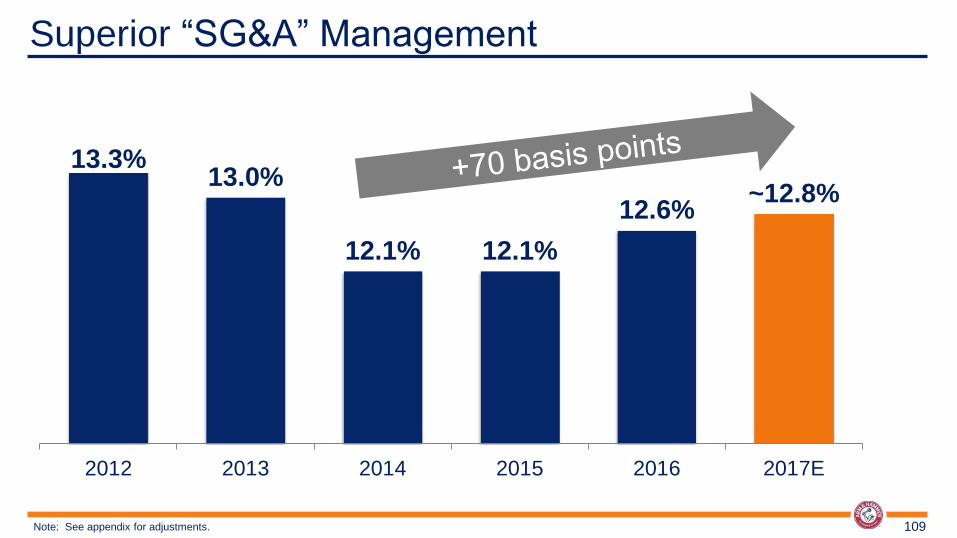
Superior “SG&A” Management
109
13.3% 13.0%
12.1% 12.1%
12.6% ~12.8%
2012 2013 2014 2015 2016 2017E
Note: See appendix for adjustments.

“SG&A” Flat Excluding Amortization
110
12.4% 12.1%
11.0% 10.9% 11.3% ~11.2%
2012 2013 2014 2015 2016 2017E
Flat
Note: See appendix for adjustments.

Adjusted Operating Margin %
111
18.7%
19.5% 19.4%
20.1%
20.9% ~21.3%
2012 2013 2014 2015 2016 2017E
Operating profit expansion driven by gross margin.
Note: See appendix for adjustments.
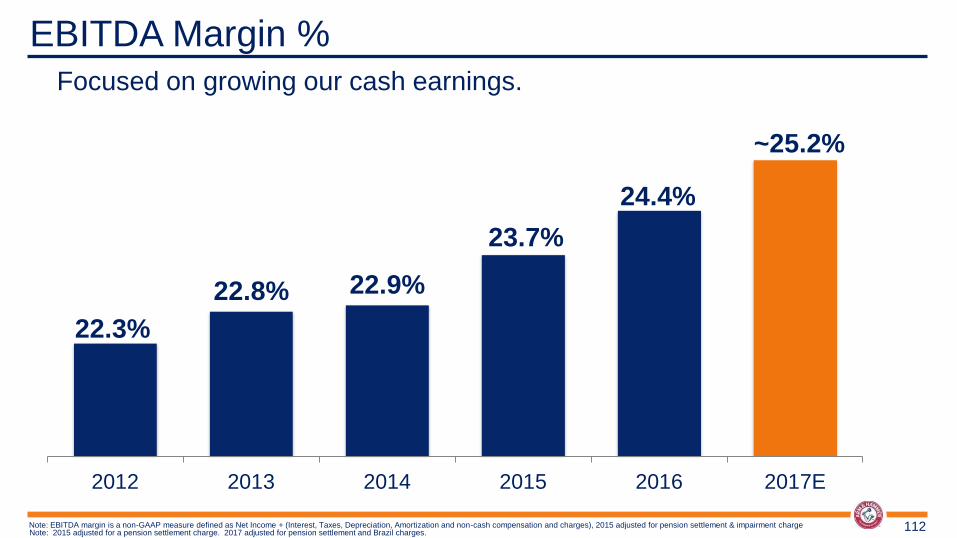
EBITDA Margin %
112
22.3%
22.8% 22.9%
23.7%
24.4%
~25.2%
2012 2013 2014 2015 2016 2017E
Note: EBITDA margin is a non-GAAP measure defined as Net Income + (Interest, Taxes, Depreciation, Amortization and non-cash compensation and charges), 2015 adjusted for pension settlement & impairment charge
Focused on growing our cash earnings.
Note: 2015 adjusted for a pension settlement charge. 2017 adjusted for pension settlement and Brazil charges.

Consistent Strong Adjusted EPS Growth
113
$1.23 $1.40
$1.51 $1.62 $1.77
~ $1.92
2012 2013 2014 2015 2016 2017E
11% 14%
8% 8% 9%
8.5%
See Appendix for 2015 & 2016 reconciliation.
Note: 2017 outlook includes a $0.01 negative impact from foreign exchange and excludes impairment from UK pension settlement, Brazil charges and adoption of new stock option accounting.
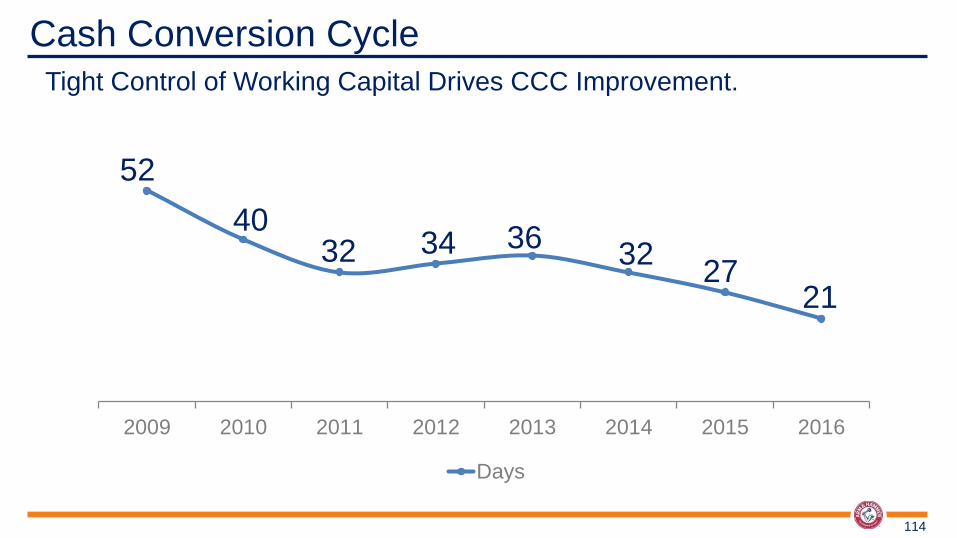
Tight Control of Working Capital Drives CCC Improvement.
Cash Conversion Cycle
114
52
40 32 34 36
32 27
21
2009 2010 2011 2012 2013 2014 2015 2016
Days
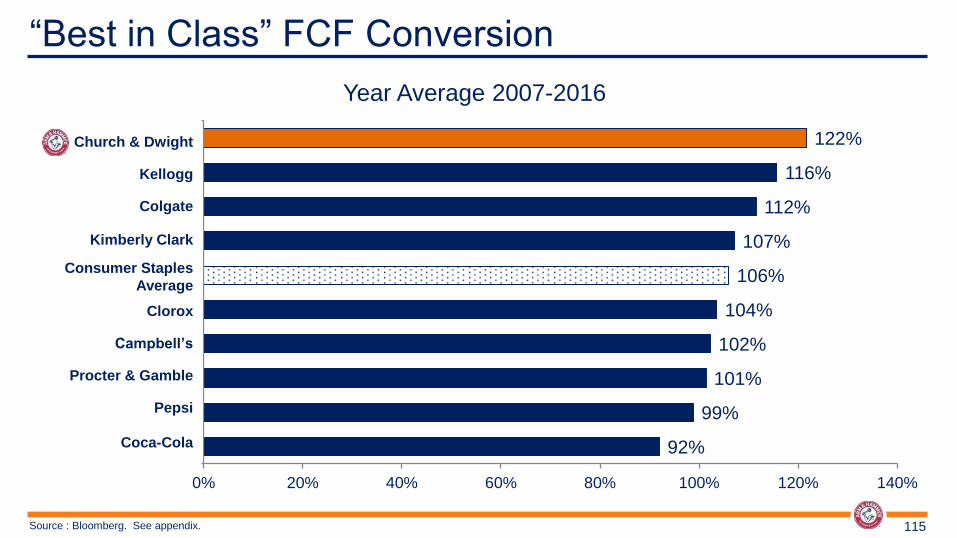
“Best in Class” FCF Conversion
115 Source : Bloomberg. See appendix.
Year Average 2007-2016
92%
99%
101%
102%
104%
106%
107%
112%
116%
122%
0% 20% 40% 60% 80% 100% 120% 140%
KO
PEP
PG
CPB
CLX
Consumer Staples Average
KMB
CL
K
CHDChurch & Dwight
Kellogg
Colgate
Kimberly Clark
Consumer Staples
Average
Clorox
Campbell’s
Procter & Gamble
Pepsi
Coca-Cola
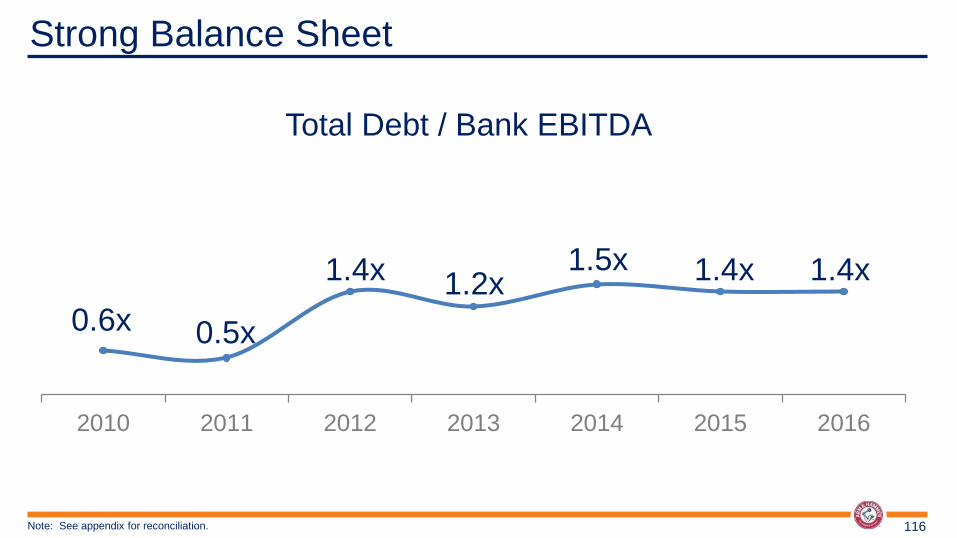
2010 2011 2012 2013 2014 2015 2016
0.6x
Total Debt / Bank EBITDA
0.5x
1.4x 1.2x 1.5x
Strong Balance Sheet
116
1.4x
Note: See appendix for reconciliation.
1.4x
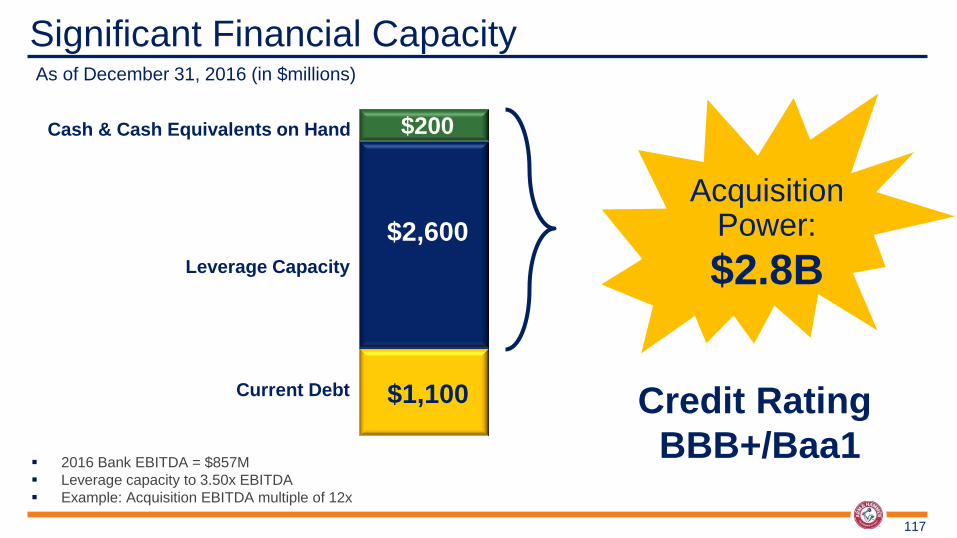
$1,100
$2,600
$200
Current Debt
Leverage Capacity
Cash & Cash Equivalents on Hand
Acquisition Power:
$2.8B
2016 Bank EBITDA = $857M
Leverage capacity to 3.50x EBITDA
Example: Acquisition EBITDA multiple of 12x
Credit Rating
BBB+/Baa1
Significant Financial Capacity
117
As of December 31, 2016 (in $millions)

Prioritized Uses of Free Cash Flow
118
1. TSR-Accretive M&A
2. New Product Development
3. Capex For Organic Growth & G2G
4. Return Of Cash To Shareholders
5. Debt Reduction
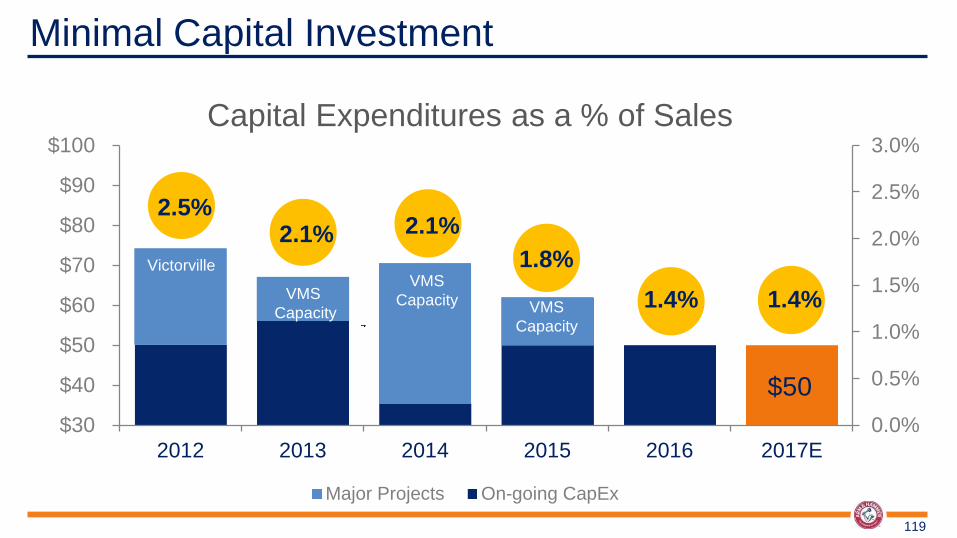
0.0%
0.5%
1.0%
1.5%
2.0%
2.5%
3.0%
$30
$40
$50
$60
$70
$80
$90
$100
2012 2013 2014 2015 2016 2017E
Major Projects On-going CapEx
Victorville
VMS
Capacity
VMS
Capacity
2.5% 2.1% 2.1%
1.8%
1.4% 1.4%
Minimal Capital Investment
119
Capital Expenditures as a % of Sales
VMS
Capacity
$50


Reconciliations www.churchdwight.com
121

Church & Dwight Co., Inc.’s Reconciliation of Non-GAAP Measures:
The following pages provide definitions of the non-GAAP measures used in this presentation and
reconciliations of these non-GAAP measures to the most directly comparable GAAP measures. These
non-GAAP financial measures should not be considered in isolation from or as a substitute for the
comparable GAAP measures, but rather as supplemental information to more fully understand our
business results. The following non-GAAP measures may not be the same as similar measures
provided by other companies due to differences in methods of calculation and items and events being
excluded.
The measures provided are (1) organic sales growth, (2) adjusted EPS, (3) adjusted SG&A, (4) adjusted
operating profit and margin, (5) free cash flow, (6) free cash flow as a percentage of net income, and (7)
Total Debt to Bank EBITDA.
As described in more detail below, we believe these measures provide useful perspective of underlying
business trends and results and provide a more comparable measure of year over year results.
Reconciliation of Non-GAAP Measures
122

Organic Sales Growth:
The presentation provides information regarding organic sales growth, namely net sales growth
excluding the effect of acquisitions, divestitures, the change in customer shipping arrangements, foreign
exchange rate changes, the impact of an information systems upgrade, a discontinued product line and
the change in the fiscal calendar for three foreign subsidiaries, from year-over-year comparisons.
Management believes that the presentation of organic sales growth is useful to investors because it
enables them to assess, on a consistent basis, sales trends related to products that were marketed by
the Company during the entirety of relevant periods excluding the change in customer shipping
arrangements and the SAP Conversion, without the effect of the change in the fiscal calendar and
foreign exchange rate changes that are out of the control of, and do not reflect the performance of,
management.
Reconciliation of Non-GAAP Measures
123
Reconciliation of Non-GAAP Measures
124
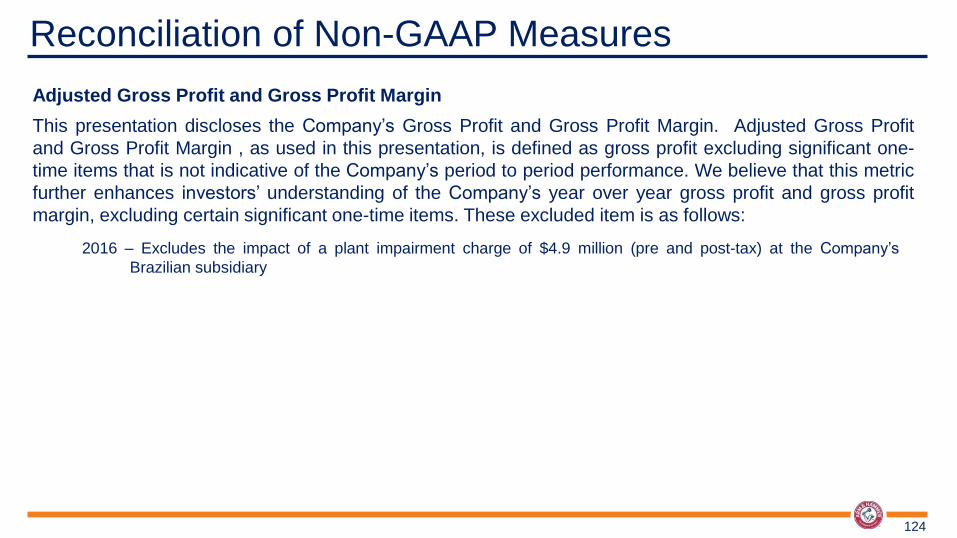
Adjusted Gross Profit and Gross Profit Margin
This presentation discloses the Company’s Gross Profit and Gross Profit Margin. Adjusted Gross Profit
and Gross Profit Margin , as used in this presentation, is defined as gross profit excluding significant one-
time items that is not indicative of the Company’s period to period performance. We believe that this metric
further enhances investors’ understanding of the Company’s year over year gross profit and gross profit
margin, excluding certain significant one-time items. These excluded item is as follows:
2016 – Excludes the impact of a plant impairment charge of $4.9 million (pre and post-tax) at the Company’s
Brazilian subsidiary
Reconciliation of Non-GAAP Measures
125
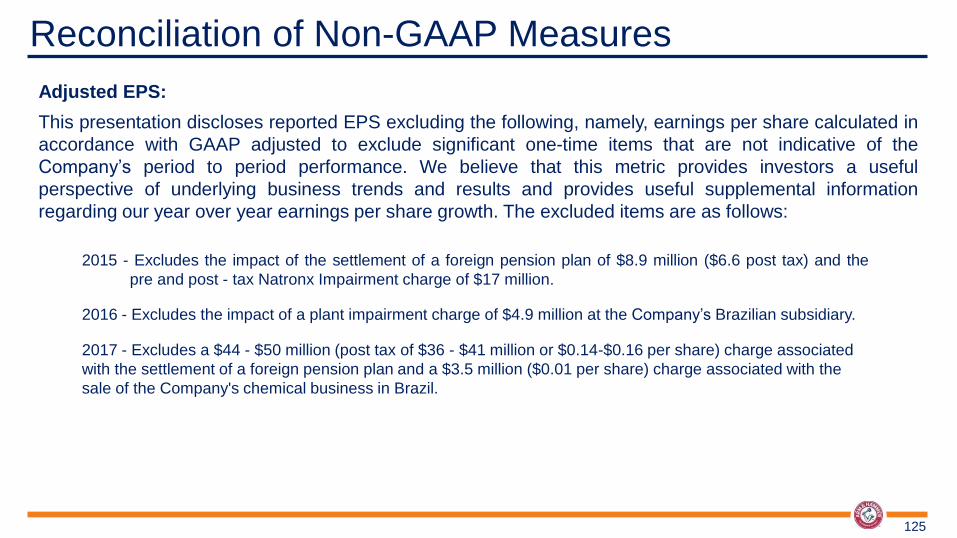
Adjusted EPS:
This presentation discloses reported EPS excluding the following, namely, earnings per share calculated in
accordance with GAAP adjusted to exclude significant one-time items that are not indicative of the
Company’s period to period performance. We believe that this metric provides investors a useful
perspective of underlying business trends and results and provides useful supplemental information
regarding our year over year earnings per share growth. The excluded items are as follows:
2015 - Excludes the impact of the settlement of a foreign pension plan of $8.9 million ($6.6 post tax) and the
pre and post - tax Natronx Impairment charge of $17 million.
2016 - Excludes the impact of a plant impairment charge of $4.9 million at the Company’s Brazilian subsidiary.
2017 - Excludes a $44 - $50 million (post tax of $36 - $41 million or $0.14-$0.16 per share) charge associated
with the settlement of a foreign pension plan and a $3.5 million ($0.01 per share) charge associated with the
sale of the Company's chemical business in Brazil.
Reconciliation of Non-GAAP Measures
126
Adjusted SG&A:
This presentation discloses the Company’s SG&A expenses as a percent of net sales. Adjusted SG&A, as
used in this presentation, is defined as selling, general and administrative expenses excluding significant
one-time items that is not indicative of the Company’s period to period performance. We believe that this
metric further enhances investors’ understanding of the Company’s year over year expenses, excluding
certain significant one-time items. These excluded items are as follows:
2015 - Excludes the impact of the settlement of a foreign pension plan of $8.9 million ($6.6 post tax).
2017 - Excludes the impact of the settlement of a foreign pension plan of $44 - $50 million ($36 - $41 post tax).

Reconciliation of Non-GAAP Measures
127
Adjusted Operating Profit and Margin:
The presentation discloses Operating Income and margin (a GAAP measure) and Adjusted Operating
Income and margin (a non-GAAP measure) which excludes significant one time items. We believe that
excluding the significant one-time items provides a useful measure of the Company’s ongoing operating
performance growth. These items are:
2015 - Excludes the impact of the settlement of a foreign pension plan of $8.9 million ($6.6 post tax).
2016 - Excludes the impact of a plant impairment charge of $4.9 million at the Company’s Brazilian subsidiary.
2017 - Excludes the impact of the settlement of a foreign pension plan of $44 - $50 million ($36 - $41 post tax).
Reconciliation of Non-GAAP Measures
128
Free Cash Flow:
Free cash flow (a non-GAAP measure) is defined as cash from operating activities (a GAAP measure) less
capital expenditures (a GAAP measure). Management views free cash flow as an important measure
because it is one factor in determining the amount of cash available for dividends and discretionary
investment.
Free Cash Flow as Percent of Net Income:
Free cash flow as percent of net income is defined as the ratio of free cash flow to net income.
Management views this as a measure of how effective the Company manages its cash flow relating to
working capital and capital expenditures.

Reconciliation of Non-GAAP Measures
129
Total Debt to Bank EBITDA:
Total Debt to Bank EBITDA is a ratio used in our debt agreements. Bank EBITDA (a non-GAAP measure)
is a form of adjusted EBITDA, and represents earnings from Income (a GAAP measure), excluding interest
income, interest expense, and before income taxes, depreciation, and amortization (EBITDA) and certain
other adjustments per the Company’s Credit Agreement.
Total Debt is defined as short and long term debt as defined by GAAP, plus items that are classified as debt
by the Company’s credit agreement. These items include Letters of Credit, Capital and Synthetic Lease
Obligations, and certain Guarantees.
Management believes the presentation of Total Debt to Bank EBITDA provides additional useful information
to investors about liquidity and our ability to service existing debt.

Total Company Organic Sales Reconciliation
130
System Calendar/ Shipping
Year Reported FX Acq/Div Disc. Ops. Upgrade Other Terms Organic
2016 2.9% 0.9% 1.2% 0.0% 0.0% 0.0% 0.0% 3.2%
2015 2.9% 2.7% -2.0% 0.0% 0.0% 0.0% 0.0% 3.6%
2014 3.2% 0.5% -0.2% 0.0% 0.0% 0.0% 0.0% 3.5%
2013 9.3% 0.5% -7.6% 0.0% -0.3% 0.0% 0.0% 1.9%
2012 6.3% 0.8% -3.1% 0.0% 0.6% 0.6% 0.0% 5.2%
2011 6.2% -1.0% -1.2% 0.8% -0.3% -0.6% 0.2% 4.1%
2010 2.7% -1.1% 0.5% 0.0% 0.0% 0.0% 0.9% 3.0%
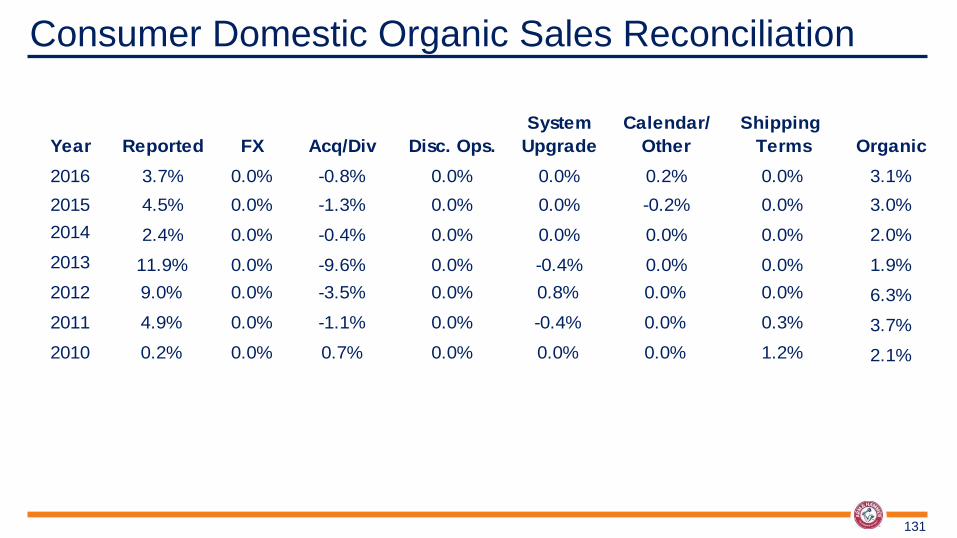
Consumer Domestic Organic Sales Reconciliation
131
System Calendar/ Shipping
Year Reported FX Acq/Div Disc. Ops. Upgrade Other Terms Organic
2016 3.7% 0.0% -0.8% 0.0% 0.0% 0.2% 0.0% 3.1%
2015 4.5% 0.0% -1.3% 0.0% 0.0% -0.2% 0.0% 3.0%
2014 2.4% 0.0% -0.4% 0.0% 0.0% 0.0% 0.0% 2.0%
2013 11.9% 0.0% -9.6% 0.0% -0.4% 0.0% 0.0% 1.9%
2012 9.0% 0.0% -3.5% 0.0% 0.8% 0.0% 0.0% 6.3%
2011 4.9% 0.0% -1.1% 0.0% -0.4% 0.0% 0.3% 3.7%
2010 0.2% 0.0% 0.7% 0.0% 0.0% 0.0% 1.2% 2.1%

Consumer International Organic Sales Reconciliation
132
System Calendar/ Shipping
Year Reported FX Acq/Div Disc. Ops. Upgrade Other Terms Organic
2016 4.8% 6.8% -1.6% 0.0% 0.0% 0.0% 0.0% 10.0%
2015 -6.4% 15.5% -0.9% 0.0% 0.0% 0.0% 0.0% 8.1%
2014 0.5% 2.7% 0.1% 0.0% 0.0% 0.0% 0.0% 3.3%
2013 4.5% 2.3% -3.1% 0.0% 0.0% 0.0% 0.0% 3.7%
2012 0.2% 3.3% -3.1% 0.0% 0.0% 2.9% 0.0% 3.3%
2011 14.7% -5.4% -1.9% 0.0% 0.0% -3.3% 0.0% 4.1%
2010 12.8% -5.9% 0.2% 0.0% 0.0% 0.0% 0.0% 7.1%
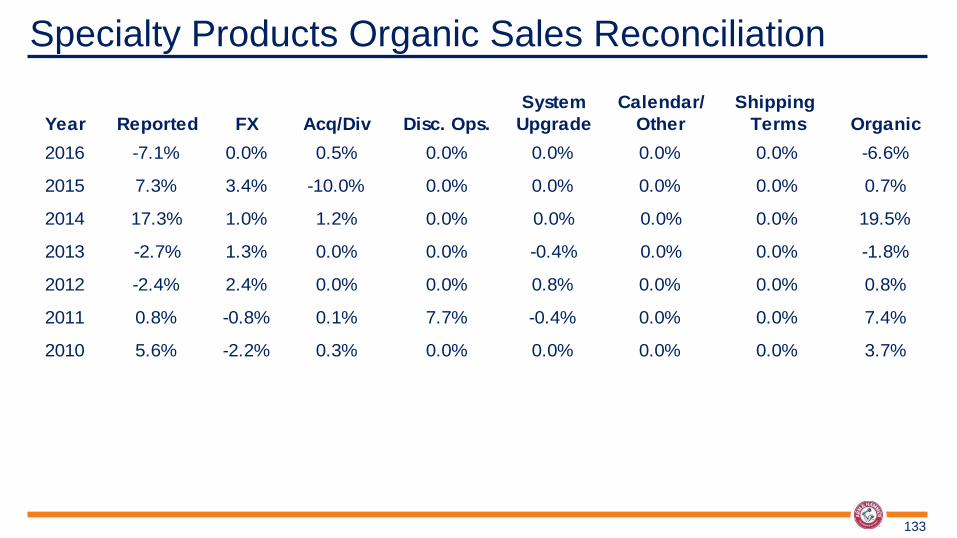
Specialty Products Organic Sales Reconciliation
133
System Calendar/ Shipping
Year Reported FX Acq/Div Disc. Ops. Upgrade Other Terms Organic
2016 -7.1% 0.0% 0.5% 0.0% 0.0% 0.0% 0.0% -6.6%
2015 7.3% 3.4% -10.0% 0.0% 0.0% 0.0% 0.0% 0.7%
2014 17.3% 1.0% 1.2% 0.0% 0.0% 0.0% 0.0% 19.5%
2013 -2.7% 1.3% 0.0% 0.0% -0.4% 0.0% 0.0% -1.8%
2012 -2.4% 2.4% 0.0% 0.0% 0.8% 0.0% 0.0% 0.8%
2011 0.8% -0.8% 0.1% 7.7% -0.4% 0.0% 0.0% 7.4%
2010 5.6% -2.2% 0.3% 0.0% 0.0% 0.0% 0.0% 3.7%

134
Church & Dwight Co., Inc. and Subsidiaries
Reported and Adjusted Non Gaap Reconciliation
For the year ending December 31,
2017 2016 2015
Adjusted Gross Margin Reconciliation
Gross Margin - Reported 45.5%
Brazil Charge 0.2%
Gross Margin - Adjusted (non-gaap) 45.7%
Adjusted SG&A Reconciliation
SG&A - Reported 14.4% 12.4%
Pension Settlement Charge -1.6% -0.3%
Brazil Charge 0.0% 0.0%
SG&A - Adjusted (non-gaap) 12.8% 12.1%
Adjusted Operating Profit Margin Reconciliation
Operating Profit Margin - Reported 19.7% 20.7% 19.9%
Pension Settlement Charge 1.6% 0.0% 0.3%
Brazil Charge 0.0% 0.2% 0.0%
Operating Profit Margin - Adjusted (non-gaap) 21.3% 20.9% 20.1%
Adjusted EPS Reconciliation
EPS - Reported $1.75 - $1.77 $ 1.75 $ 1.54
Pension Settlement Charge $0.16 - $0.14 $ - $ 0.02
Brazil Charge $0.01 $ 0.02 $ -
Natronx Charge $ - $ - $ 0.06
EPS - Adjusted (non-gaap) $1.92 $ 1.77 $ 1.62
2015 - Excludes the impact of the settlement of a foreign pension plan of $8.9 million ($6.6 post tax, $0.02 per share) and the pre and post tax Natronx Impairment charge of $17 million ($0.06 per share).
2016 - Excludes $4.9 million (pre and post tax, $0.02 per share) plant impairment charge at the Company's Brazilian subsidiary
2017 - Excludes a $44 - $50 million (post tax of $36 - $41 million or $0.14-$0.16 per share) charge associated with the settlement of a foreign pension plan and
a $3.5 million ($0.01 per share) charge associated with the sale of the Company's chemical business in Brazil.
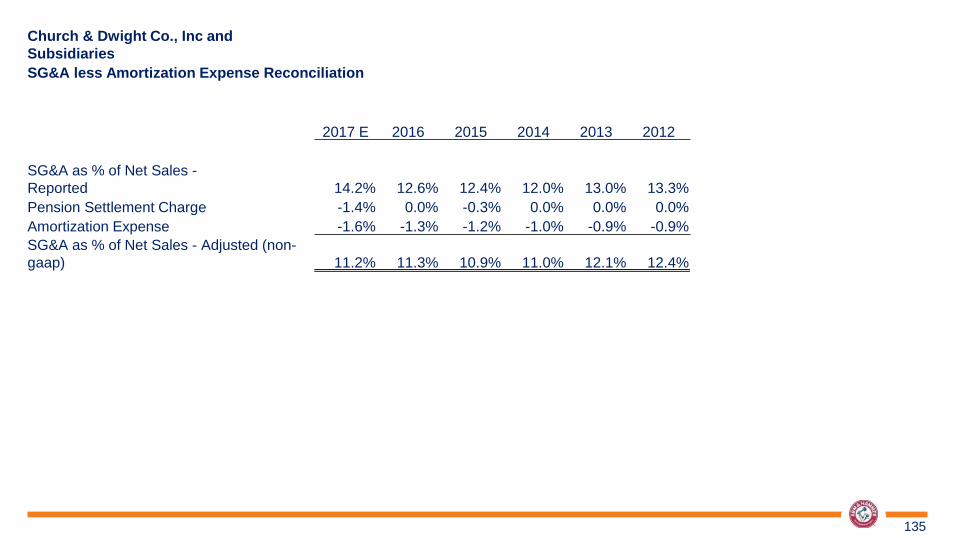
135
Church & Dwight Co., Inc and
Subsidiaries
SG&A less Amortization Expense Reconciliation
2017 E 2016 2015 2014 2013 2012
SG&A as % of Net Sales -
Reported 14.2% 12.6% 12.4% 12.0% 13.0% 13.3%
Pension Settlement Charge -1.4% 0.0% -0.3% 0.0% 0.0% 0.0%
Amortization Expense -1.6% -1.3% -1.2% -1.0% -0.9% -0.9%
SG&A as % of Net Sales - Adjusted (non-
gaap) 11.2% 11.3% 10.9% 11.0% 12.1% 12.4%

136
Church & Dwight Co., Inc
Historic Free Cash Flow Conversion
As Reported 2007 2008 2009 2010 2011 2012 2013 2014 2015 2016 Average
Cash From Operations $ 248.7 $ 336.2 $ 400.9 $ 428.5 $ 437.8 $ 523.6 $ 499.6 $ 540.3 $ 606.1 $ 655.3
Capital Expenditures $ 48.9 $ 98.3 $ 135.4 $ 63.8 $ 76.6 $ 74.5 $ 67.1 $ 70.5 $ 61.8 $ 49.8
Free Cash Flow (FCF) $ 199.8 $ 237.9 $ 265.5 $ 364.7 $ 361.2 $ 449.1 $ 432.5 $ 469.8 $ 544.3 $ 605.5
Net Income $ 169.0 $ 195.2 $ 243.5 $ 270.7 $ 309.6 $ 349.8 $ 394.4 $ 413.9 $ 410.4 $ 459.0
FCF as % of Net Income 118% 122% 109% 135% 117% 128% 110% 114% 133% 132% 122%

Church & Dwight Co., Inc
Total Debt to Bank EBITDA Reconciliation
($ in millions)
2016 2015 2014 2013 2012 2011 2010
Total Debt as Presented (1) 1,120.1$ 1,050.0$ 1,086.6$ 797.3$ 895.6$ 246.7$ 333.3$
Other Debt per Covenant (2) 79.3 83.5 88.0 90.3 79.1 45.9 11.7
Total Debt per Credit Agreement 1,199.4$ 1,133.5$ 1,174.6$ 887.6$ 974.7$ 292.6$ 345.0$
Net Cash from Operations 655.3$ 606.1$ 540.3$ 499.6$ 523.6$ 437.8$ 428.5$
Interest Paid 25.6 29.0 25.7 26.4 9.7 9.2 29.3
Current Tax Provision 222.0 201.0 198.3 192.3 179.5 125.6 108.7
Excess Tax Benefits on Option Exercises 30.0 15.8 18.5 13.1 14.6 12.1 7.3
Change in Working Capital and other Liabilities (75.7) (38.6) (13.5) 16.1 (75.4) 11.0 (31.6)
Adjustments for Significant Acquisitions/Dispositions (net) - - - - 46.8 3.9 6.8
Adjusted EBITDA (per Credit Agreement) 857.2$ 813.3$ 769.3$ 747.5$ 698.8$ 599.6$ 549.0$
Ratio 1.4 1.4 1.5 1.2 1.4 0.5 0.6
Notes:
(1)Net of Deferred Financing Costs per ASC 2015-03, "Simplifying the Presentation of Debt Issuance Costs"
(2) Includes Letters of Credit, Capital and Synthetic Lease Obligations, and certain Guarantees.
137


