
SAE International® - Carnegie Mellon...
170
SAE International® technology profiles Downloaded from SAE International by Eric Anderson, Thursday, September 10, 2015
-
Upload
hoangkhuong -
Category
Documents
-
view
215 -
download
0
Transcript of SAE International® - Carnegie Mellon...
SAE International® technology profiles
Downloaded from SAE International by Eric Anderson, Thursday, September 10, 2015

Automotive 2030 – North America | i
Automotive 2030 –North America
T-127 book.indb 1 8/24/11 9:22 AM
Downloaded from SAE International by Eric Anderson, Thursday, September 10, 2015

ii | Automotive 2030 – North America
Other SAE books of interest:
Alternative Cars in the 21st CenturyBy Robert Q. Riley(Product Code: R-227)
World History of the AutomobileBy Erik Eckermann(Product Code: R-272)
Meeting the Technology Management Challenges in the Automotive IndustryBy Ashok B. Boghani and Andrew Brown(Product Code: R-258)
For more information or to order a book, contact SAE International at 400 Commonwealth Drive, Warrendale, PA 15096-0001, USA; phone 877-606-7323 (U.S. and Canada only) or 724-776-4970 (outside U.S. and Canada); fax 724-776-0790; email [email protected];website http://books.sae.org.
T-127 book.indb 2 8/24/11 9:22 AM
Downloaded from SAE International by Eric Anderson, Thursday, September 10, 2015

Automotive 2030 – North America | iii
Warrendale, Pennsylvania USA
Automotive 2030 –North AmericaBy Bruce Morey
T-127 book.indb 3 8/24/11 9:22 AM
Copyright © 2011 SAE International eISBN: 978-0-7680-7341-6
Downloaded from SAE International by Eric Anderson, Thursday, September 10, 2015

iv | Automotive 2030 – North America
400 Commonwealth DriveWarrendale, PA 15096-0001 USA E-mail: [email protected]: 877-606-7323 (inside USA and Canada) 724-776-4970 (outside USA)Fax: 724-776-0790
Copyright © 2011 SAE International. All rights reserved.No part of this publication may be reproduced, stored in a retrieval system, distributed, or transmitted, in any form or by any means without the prior written permission of SAE. For permission and licensing requests, contact SAE Permissions, 400 Commonwealth Drive, Warrendale, PA 15096-0001 USA; email: [email protected]; phone: 724-772-4028; fax: 724-772-9765.
ISBN 978-0-7680-5727-0SAE Order No. T-127DOI 10.4271/T-127
Information contained in this work has been obtained by SAE International from sources believed to be reliable. However, neither SAE International nor its authors guarantee the accuracy or completeness of any information published herein and neither SAE International nor its authors shall be responsible for any errors, omissions, or damages arising out of use of this information. This work is published with the understanding that SAE International and its authors are supplying information, but are not attempting to render engineering or other professional services. If such services are required, the assistance of an appropriate professional should be sought.
To purchase bulk quantities, please contact:SAE Customer ServiceE-mail: [email protected]: 877-606-7323 (inside USA and Canada) 724-776-4970 (outside USA)Fax: 724-776-0790
Visit the SAE Bookstore at http://store.sae.org
Library of Congress Cataloging-in-Publication Data
Morey, Bruce.Automotive 2030, North America / by Bruce Morey.p. cm.ISBN 978-0-7680-5727-01. Automobiles--Technological innovations--North America. 2. Automobiles--United States--Design and construction--Forecasting. I. Title. TL22.M67 2011629.201’12--dc23 2011031017
T-127 book.indb 4 8/24/11 9:22 AM
Downloaded from SAE International by Eric Anderson, Thursday, September 10, 2015

Automotive 2030 – North America | v
Executive SummaryThis book projects how cars might evolve by 2030. It does so by looking at key technical trends evident in the present. The mega-trends this books looks at in detail are better fuel economy, alternative sources of fuel, and automated driving.
The first chapter summarizes key developments in vehicle technologies. This base sets the stage for the future. Chapters 2, 3, and 4 look at trends and predict the fu-ture of technologies that have been with us since the beginning of the automotive age—internal combustion engines, transmissions, vehicle bodies, and materials. The theme in these chapters is that as fuel prices and availability continue to worry us all, engineers will refine these technologies to deliver better fuel economy. New valve technologies; widespread use of boosted, downsized engines; and direct fuel injec-tion will deliver engines with better fuel economy, possibly as much as 30% greater. Downsizing cars will result in greater fuel economy. Materials that are more light-weight will contribute some as well. However, there is a limit. These technologies still require liquid fuels, which at present mostly come from petroleum.
To stretch fuel economy even more, gasoline-electric hybrids represent a truly new stream of technical developments, covered in Chapter 5. This chapter clearly shows that not only do gasoline-electric hybrids recover “lost” energy from brak-ing, but they also enable engineers to more carefully match the most economical operating points of internal-combustion engines to move the car. Mild hybrid technologies, such as electric-motor-assisted starts coupled with idle-stop tech-nologies, will likely become standard in all new cars, possibly as early as 2016.
However important these technologies are, they stretch current fuel supplies—they do not replace them. That is the subject of Chapters 6, 7, and 8. These delve
T-127 book.indb 5 8/24/11 9:22 AM
Downloaded from SAE International by Eric Anderson, Thursday, September 10, 2015

vi | Automotive 2030 – North America
into practical technologies for eventually replacing oil. The book examines elec-tric battery vehicles, electric plug-ins and range-extended vehicles, and fuel cells that use pure hydrogen. The key issues for electric vehicles are cost and weight of batteries and the electrical infrastructure to recharge them. Fuel cell vehicle engi-neering has advanced substantially in the period leading to the present. The key issues for hydrogen fuel cell vehicles are cost and durability of fuel cells, and the hydrogen infrastructure to refuel them. Given trends examined in this book, it is hard to predict either of them establishing themselves as widespread alternatives to gasoline before 2030. Nor can we predict that either will “win” after 2030. This book argues, from a purely technical viewpoint, that the jury is out on both.
The other mega-trend examined is the emergence of the smart car. Newer, afford-able sensors including imaging, sonar, and radar, coupled with cheap and power-ful computers, should enable affordable autonomous driving by 2030. However, key indicators that would signal this move, such as the low take rate of adaptive cruise control, argue otherwise. Outside of safety features, human drivers appear to be squeamish about transferring control to a robotic car. Adding communica-tion infrastructure elements to create a smart environment, while elegant techni-cally, requires more investment than the U.S. can probably contemplate in the period leading up to 2030. The most we might expect is a mandate for vehicle-to-vehicle communication devices motivated by safety concerns. This trend should develop—or not—by 2020. However, one scenario is the emergence of automated controls in the form of a Safe Guardian. This smart car intervenes only in the case of imminent danger.
The conclusion of this book is that the period leading up to 2030 is a period of expectant development. We are preparing the North American automotive world for a truly new driving experience to come after 2030. Reading this book will help prepare you and let you form your own opinions about what that might be.
T-127 book.indb 6 8/24/11 9:22 AM
Downloaded from SAE International by Eric Anderson, Thursday, September 10, 2015

Automotive 2030 – North America | vii
ContentsAcknowledgments __________________________________________________________________________________________viii
Chapter One The Automotive World in North America Today _______________ 1Chapter Two Steady March of Conventional Engines_____________________ 17Chapter Three Vehicle Technologies and Transmissions ____________________ 39Chapter Four Vehicles on a Diet—Using Lighter, Stronger Materials ________ 51Chapter Five Gasoline / Electric Hybrids _______________________________ 67Chapter Six The Electric Car ________________________________________ 85Chapter Seven Plug-ins and Range-Extended Electric Vehicles _____________ 101Chapter Eight Fuel Cell Cars _________________________________________ 107Chapter Nine Safety and Context—Cars Get Smart _____________________ 127Chapter Ten People, Human Nature, and Choices ______________________ 139Chapter Eleven Putting it all Together __________________________________ 149
About the Author _____________________________________ 159
T-127 book.indb 7 8/24/11 9:22 AM
Downloaded from SAE International by Eric Anderson, Thursday, September 10, 2015

viii | Automotive 2030 – North America
AcknowledgmentsA number of people were quite helpful in the production of this book. The individuals that were interviewed and quoted each took time to discuss their particular issue and in most cases reviewed the material to ensure accuracy.
Two people, in particular, went above and beyond in lending their expertise and insight:
Richard Schultz, Managing Director for Automotive Materials with Ducker Worldwide, was kind enough to review all of Chapter 4, Vehicles on a Diet— Using Lighter, Stronger Materials, and explained some of the important nu-ances of automotive materials.
Curtis Collie, Chief Engineer for Engine R&D for IAV, also was helpful in reviewing all of Chapter 2, again pointing out crucial meanings and relation-ships. Our many stimulating discussions about engine development through 2030 were illuminating and added energy to the written word.
T-127 book.indb 8 8/24/11 9:22 AM
Downloaded from SAE International by Eric Anderson, Thursday, September 10, 2015

Automotive 2030 – North America | Chapter 1 | 1
Chapter One
The Automotive World in North America TodayPast is prologue. Before projecting what might happen in the next 20 years, we should take a hard look at the last 20. This will help us understand just how far the automotive world has progressed, as well as realize some of the cusps of his-tory we might be on right now.
Certain themes jump out as evolving in the last 20 years or so. One theme has been our desire in North America for larger vehicles, as long as gas was cheap. During the same period, we have seen cars literally electrify with the advent of gasoline / electric hybrids. In the recent past, new highs in gasoline prices showed the volatil-ity of gas and its shock on the industry. Cars have also become safer and smarter with the help of electronics. Can we make them even safer and even smarter?
In this chapter, let us take a closer look, singly, at what are probably the most im-portant trends. Surprises are hiding in plain sight.
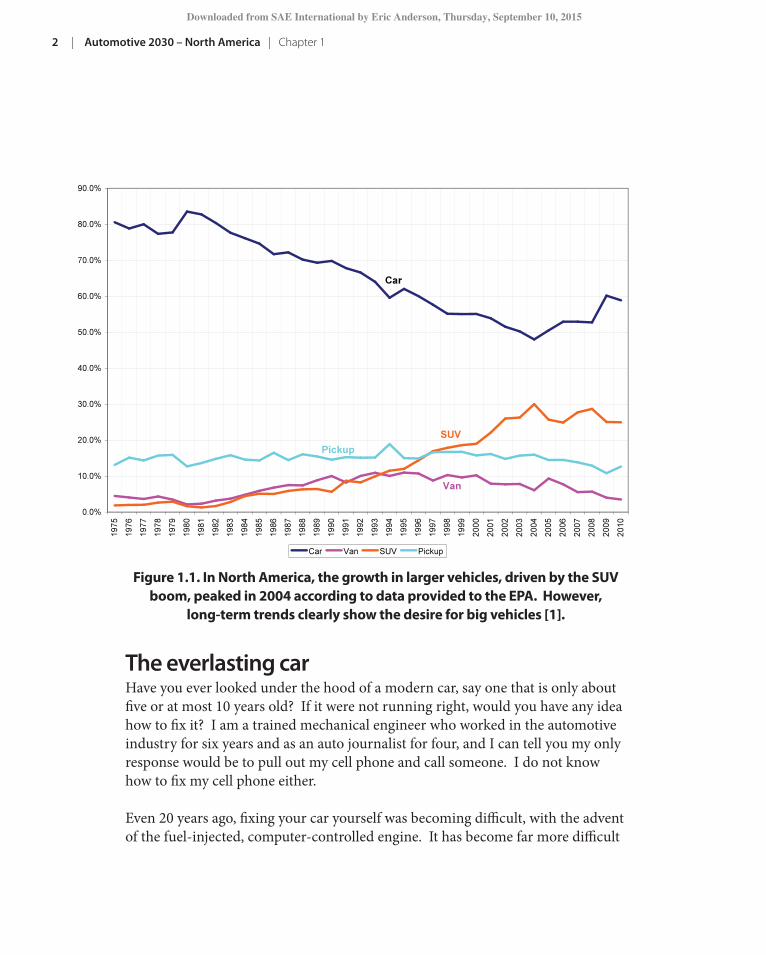
The move to big in North AmericaA key element of the last twenty years is the growth in the physical size of vehicles. While human obesity may have grown in the same period, so have the cars—or rather trucks, vans, and SUVs—we now drive. Figure 1.1 shows both the abso-lute number of vehicles sold in North America and the relative breakout between trucks and cars.
Big is what we wanted in North America. Will that continue in the next 20 years?
T-127 book.indb 1 8/24/11 9:22 AM
Downloaded from SAE International by Eric Anderson, Thursday, September 10, 2015
2 | Automotive 2030 – North America | Chapter 1
The everlasting carHave you ever looked under the hood of a modern car, say one that is only about five or at most 10 years old? If it were not running right, would you have any idea how to fix it? I am a trained mechanical engineer who worked in the automotive industry for six years and as an auto journalist for four, and I can tell you my only response would be to pull out my cell phone and call someone. I do not know how to fix my cell phone either.
Even 20 years ago, fixing your car yourself was becoming difficult, with the advent of the fuel-injected, computer-controlled engine. It has become far more difficult
Figure 1.1. In North America, the growth in larger vehicles, driven by the SUV boom, peaked in 2004 according to data provided to the EPA. However,
long-term trends clearly show the desire for big vehicles [1].
T-127 book.indb 2 8/24/11 9:22 AM
Downloaded from SAE International by Eric Anderson, Thursday, September 10, 2015
Automotive 2030 – North America | Chapter 1 | 3
now that some form of computer has control of most functions in cars. Some lux-ury cars have upwards of 70 of these controllers that individually drive windows, brakes, cruise control, and traction control—not to mention the main job of con-trolling the engine and transmission. Specialized computer-controlled equipment is needed to diagnose and repair our computerized cars.
Our response to not knowing how to fix things is to demand that they never, ever break. That is exactly what we have come to expect from our cars (or SUVs or trucks or vans.) We put the key in, it starts, we drive it, we fill it with gasoline, we park it, and we forget about it — sometimes for a decade. We want an “appliance.” Gone are the “shade tree” mechanics of yesteryear, although racing enthusiasts still exist who convert cars to street dragsters or other kinds of hobby vehicles. Some cars today, if cared for even minimally, could last over 200,000 miles and well over 10 years.
As we will discuss later, even if the trend continues for cars to last even longer (and why would it not given competitive pressures?), today’s durability has pro-found implications on the future. For many of us, the choice of buying a new ve-hicle is more a matter of wanting a new one, not needing one. Some manufactur-ers may have not quite caught onto this yet. What it means to consumers may not be evident either.
Peak oil, gasoline, and fuel economyWhat made the personal automobile possible in the first place was gasoline. Gaso-line was initially an unwanted byproduct of converting crude oil into kerosene for lanterns. When it was put into the internal combustion engine (ICE), voila, it led to the dawn of the personal mobility age.
Even while gasoline prices actually fell for the first 15 of the last 20 years (when adjusted for inflation), concern over fuel economy remained a constant. People retained the memory of high fuel price spikes, especially the big jump in the “sec-ond oil shock” of 1979. The truth about the end of the oil era may be a bit more complicated. The concept of Peak Oil, one method often cited for predicting the end of the petroleum age, was first invented by M. King Hubbert in the 1950s [2]. Hubbert predicted in 1956 that U.S. production of crude oil would peak in 1970, which turned out to be accurate. More worryingly, he predicted that worldwide
T-127 book.indb 3 8/24/11 9:22 AM
Downloaded from SAE International by Eric Anderson, Thursday, September 10, 2015
4 | Automotive 2030 – North America | Chapter 1
oil production would peak in 2000. Other analysts, using similar methods, more optimistically predict world oil production as peaking in 2036. In any case, no one is predicting unlimited supplies forever, even while we may have reached peak oil, though we are not sure.
A few key take-aways are relevant. One is that all the mathematics used to pre-dict the drop in oil production shows that it will decrease slowly at first, then more quickly. There will be some kind of warning. Two is that new technology advancements tend to shift the date for peak oil into the future. After all, Colonel Drake’s first oil well in 1859 was only 69 feet deep but considered technically infea-sible until he invented several key technologies, such as bore-hole casements. To-day’s wells are drilled thousands of feet below the surface in fields that sometimes contain hydrogen sulfide, sand, or water. Finally, point three, natural variations in price due to temporary supply and demand constraints could mask when we have reached peak oil until long after the event.
New fields, especially in deep water miles under the ocean, are only recently acces-sible because of advances in technology. The challenges in deep-water production are sending drills driven by pipes into the ground below two or three miles of sea-water—then drilling tens of thousands more feet horizontally. Every time a spike in world oil prices occurs, oil drillers have added incentive to invest and invent new technologies to wring more out of existing reserves or find new ones. A criti-cal uncertainty in the world today is how much oil may be available in the deep oceans, defined as beyond the continental shelf. The current BP Gulf Oil Spill di-saster in 2010 illustrates both its potential and problems.
Renewable energy sources from corn and soybeans—called first-generation bio-fuels—captured our imagination, especially after 2007 when gas prices spiked. However, these first-generation biofuels will always represent a small fraction of the total supply. In 2009, the U.S. devoted 30% of its corn crop to displace 5% of its gasoline [3]. “Food into fuel” has its limits. To give biofuels a larger share, ad-vocates are looking to cellulosic-derived ethanol, algae, and other technologies for producing biofuels. Many recognize the value of a “drop-in” fuel that mimics the current petroleum-based fuels so engine manufacturers would not need to add the expense of Flex Fuel engines.
T-127 book.indb 4 8/24/11 9:22 AM
Downloaded from SAE International by Eric Anderson, Thursday, September 10, 2015

Automotive 2030 – North America | Chapter 1 | 5
The U.S. Environmental Protection Agency (EPA) is responsible for developing and implementing regulations to ensure that transportation fuel sold in the United States contains a minimum volume of renewable fuel. EPA with refiners, renewable fuel producers, and others collaborated to create the Renewable Fuel Standard (RFS) Program. Legislation expanded the RFS program under the Energy Independence and Security Act (EISA) of 2007. Now, EISA includes diesel, in addition to gasoline. It also increased the required volume of renewable fuel blended into transportation fuel from 9 billion gallons in 2008 to 36 billion gallons by 2022. The EISA act also requires EPA to apply lifecycle greenhouse gas performance standards, ensuring that each category of renewable fuel emits fewer greenhouse gases than the petroleum fuel it replaces. If goals are met, the volume of fuel would represent a significant fraction of transport fuels used in the U.S. when compared with the approximately 140 billion gallons per year (bgy) of gasoline and 60 bgy of diesel fuel used today [3]. The RFS 2 standards effectively place a 15-bgy cap on ethanol from corn starch pro-duction in its 2022 goal of 36 bgy of biofuels. By 2022, it mandates that 16 bgy must come from cellulosic biofuels. A number of companies are advancing this technol-ogy, mostly startups with a sprinkling of more-well-known companies.
A critical uncertainty in the period 2010–2030 is how much biofuels, especially “drop-in” biofuels, will contribute to the nation’s transport fuel supply and at what price. How much will they cost per gallon? While no one is predicting that biofu-els will replace the 200 bgy of transport fuel used, if they replace 15–20% at afford-able prices, what might the effect be on automotive market demand?
Another surprise in the record of gasoline prices goes back to the dawn of the modern mechanized era. Gasoline prices, even during the gas-shocked year of 2008, have never gone out of a certain range, when adjusted for inflation, as shown in Fig. 1.2. The real, inflation-adjusted price of gas in 2009 is actually cheaper than it was in 1919. Is there a limit to how much gasoline prices can rise before drivers begin to modify their behaviors, use less, and therefore drive the prices down? Is $3.50 a gallon in 2010 dollars the “limit of pain”? A number of specula-tions center on the $5.00/gal figure as a psychological threshold.
The price spikes of 1973 and 1979, nevertheless, caused great consternation at the time. One of the results of these earlier spikes was legislation, namely the
T-127 book.indb 5 8/24/11 9:22 AM
Downloaded from SAE International by Eric Anderson, Thursday, September 10, 2015

6 | Automotive 2030 – North America | Chapter 1
Corporate Average Fuel Economy (CAFE) act. This CAFE average, until April 2010, was the sales weighted average fuel economy, expressed in miles per gallon (mpg), of a manufacturer’s fleet of passenger cars or light trucks—well, actually, cars and trucks most of us drive, which is what the government classifies as below 8500 lb gross weight. Even then, that earlier law was aimed primarily at passenger cars, which is what most of us drove when the law was passed. It affected vehicles manufactured for sale in the United States, for any given model year.
The purpose of CAFE was to reduce energy consumption—read imports of for-eign oil—by increasing fuel economy of vehicle fleets. While it has had an impact on what we drive today, the fact that CAFE remained relatively static from 1985 until 2010 has had implications on what we drive—until now. How is that pos-sible? According to a report issued by the National Academy of Sciences in 2002, technical improvements in vehicles between 1975 and 1984 were concentrated on improving fuel economy [5]. This meant the production of lighter-weight vehicles
Figure 1.2. Inflation-adjusted trends of fuel prices in the last 90-plus years [4].
T-127 book.indb 6 8/24/11 9:22 AM
Downloaded from SAE International by Eric Anderson, Thursday, September 10, 2015

Automotive 2030 – North America | Chapter 1 | 7
coupled with more-fuel-efficient engines and drivetrains and better aerodynam-ics. According to the report, fuel economy improved by 62% without any loss of performance in the cars. From 1985 to 2002, fuel economy essentially remained unchanged while vehicles on average became 20% heavier and 25% faster, as mea-sured in 0–60 MPH acceleration. The report came out in 2002 when gasoline prices were the closest to the cheapest in history, when adjusted for inflation.
How else has the legislation affected what we drive? It ingrained in us to put a legislative burden on the manufacturers and get results. “The CAFE program has clearly contributed to increased fuel economy of the nation’s light-duty vehicle fleet during the past 22 years,” stated the 2002 National Academy of Sciences report, al-though it does state that other methods, such as a direct fuel tax or a fuel economy cap-and-trade system might work better. However, none of us wants to pay higher taxes for gasoline. In North America, we would much rather put that burden on the manufacturers rather than pay out of pocket or modify our driving habits.
Following that trend, in 2010 the U.S. government upped the ante. It also changed the rules. Coupled with the price spike in retail gasoline in 2008, fuel economy is back as a top development priority.
Automakers delivered a dramatic jump in fuel economy between 1975 and 1985, as shown in the data of Fig. 1.3, measured by the EPA. A similar dramatic jump will be needed between 2010 and 2016 [6].
The CAFE rules enacted in mid-2010 not only increased the basic average mpg required, but changed it from a fleet average to one that defines mpg based on footprint (wheelbase multiplied by track width). CAFE obligations now vary from OEM to OEM, depending on what they sell, as long as each individual vehicle meets the fuel economy requirements within its footprint. No longer can OEMs trade off fuel economy improvements in small cars for less improvement in large trucks or SUVs as long as they meet an averaged mean. If the system was gamed under the old rules, that game is obsolete.
The practical implications of this are that every vehicle will see more fuel-econo-my features, from the largest truck to the smallest A-class car. The combined fleet
T-127 book.indb 7 8/24/11 9:22 AM
Downloaded from SAE International by Eric Anderson, Thursday, September 10, 2015

8 | Automotive 2030 – North America | Chapter 1
is expected to meet 35.5 mpg by MY 2016, although this is an expectation based on government modeling rather than part of the rule. In setting further prec-edents, the rule also establishes for the first time the U.S. EPA regulation for CO2 emissions. Both NHTSA and EPA claim 35.5 mpg is equivalent to 250 g of CO2 per mile (gCO2/mi.) Another point that many in the industry note is that for the first time, the EPA, NHTSA, and the California Air Resources Board (CARB) have synchronized their regulations, providing a single set of rules for the U.S. Many in the industry would like to see this continue into the next stage of rule-making for 2017–2025.
What does this mean for engineers? It means plenty of work in applying fuel economy features to the full breadth of engines and vehicles in the line-up. It most likely will not simply affect the engine, alone.
Figure 1.3. Fuel economy measurements by EPA since 1975 [6].
T-127 book.indb 8 8/24/11 9:22 AM
Downloaded from SAE International by Eric Anderson, Thursday, September 10, 2015

Automotive 2030 – North America | Chapter 1 | 9
The “new” conventional engineBecause of these requirements, powertrain and engine technology appearing in the years 2010–2016 is somewhat predictable at the time of this writing. “In our world, 2016 is like next month,” remarked Barb Samardzich, Vice President of Powertrain Engineering for Ford, at an SAE International conference in April 2010.
The emerging new normal in today’s engines would have been considered souped-up hot rods or high-end performance cars 20 years ago. By the early 1990s, most new light vehicles had replaced carburetors with indirect fuel injectors, sometimes called port-fuel injection (PFI). With PFI, the air and fuel are mixed in the intake manifold and controlled by computerized electronic control units (ECUs). How-ever, additions such as turbocharging, variable-valve timing (VVT), and direct injection were still rare and considered high-cost performance features. Direct injection uses high-pressure fuel injectors to spray a fuel mist directly into each cylinder, where it is mixed with air and ignited. This improves the engine’s tran-sient response and burn efficiency. Ford, for one, is prominently featuring these technologies in its EcoBoost branded engines. Ford describes fuel as sprayed into the cylinders with direct injection at pressures of up to 2150 pounds per square inch (psi), which is about 35 times more intense than port-fuel injection. Direct injection enables greater compression ratios, which also improves fuel economy. VVT is a technology that changes the timing of the valves during intake and ex-haust as the engine RPM changes, increasing the efficiency of the engine. General
Vehicle type Example Models
Example Model footprint (ft2)
CO2 emissions target (g/mi)
Fuel Economy target (mpg)
Compact car Honda Fit 40 206 41.1Midsize car Ford Fusion 46 230 37.1Full-size car Chrysler 300 53 263 32.6Small SUV 4WD Ford Escape 44 259 32.9Large Pickup Chevy Silverado 67 348 24.7
Table 1.1. Example CO2 emissions and fuel economy CAFE targets for 2016 based on MY 2008 vehicles [7].
T-127 book.indb 9 8/24/11 9:22 AM
Downloaded from SAE International by Eric Anderson, Thursday, September 10, 2015

10 | Automotive 2030 – North America | Chapter 1
Motors has incorporated many of these technologies in its EcoTec engine line-up, as well as Honda’s VTEC, BMW’s Valvetronic, Toyota’s VVTi, and others [8].
Cylinder deactivation (CDA) is another technology offered for fuel economy. It provides a means of actually “turning off ” some of the cylinders of an engine. During highway cruising, fuel economy improves by delivering only the reduced load required to maintain a steady speed.
Added complexity is not confined to the engine alone. Six-speed automatic trans-missions are routinely offered in MY 2010 models, along with low-friction drive axles. Many experts expect them to dominate in North America by 2016 (to meet 2016 CAFE). Dual-clutch transmissions and continuously variable transmissions (CVTs), especially useful for smaller cars, are becoming common and offer about 5–7% or more fuel efficiency compared to standard automatics. ZF offered in 2009 an eight-speed automatic transmission. Electric Power (Assisted) Steering (EPS), electronic throttle control, and more-efficient generators are all technologies to ex-pect by 2016. They reduce parasitic loss by using electricity to actuate mechanisms in the car more efficiently. Although those technologies offer minor contributions to fuel efficiency, the OEMs are using what they can to squeeze out more.
As Erwin Haas, Executive Vice President and Chief Technology Officer of Magna Powertrain describes it, the challenge in meeting CAFE standards by 2016 is in refining the cost of deploying these existing technologies [9]. It is not a question of can it be done, but can it be done at a cost common to the automotive world. Put-ting these technologies in context, Samardzich likes to emphasize that it is all about numbers. “To make a difference it can’t be 1000 units, it can’t be 10,000 units. It has to be millions of units and it has to have a global reach,” she explains. No one seems to doubt achieving these numbers. Expect to see some or all of these on many vehicles by 2016 to meet CAFE regulations. IHS Worldwide provides an esti-mate on which technologies provide the best return for fuel economy (Fig. 1.4).
Added complexity always comes at a price. However, the automotive OEMs have no choice in adopting these technologies to meet the increased CAFE regulation for 2016.
T-127 book.indb 10 8/24/11 9:22 AM
Downloaded from SAE International by Eric Anderson, Thursday, September 10, 2015

Automotive 2030 – North America | Chapter 1 | 11
$600
$500
$400
$300
$200
$100
$00% 1% 2% 3% 4% 5% 6% 7% 8% 9%3% 4% 5% 6% 7%
Cost/Benefit of Competing Technologies
Weight
6-Speed AT
VVT
CVT
GDI
Turbo
DCT
Cyl. Deact.
Lean GDI
Fuel Economy Improvement
Source: CSM Worldwide 2010 Copyright CSM Worldwide, Inc.
Increm
ental Cost o
f Techn
ology
Figure 1.4. In April 2010, CSM Worldwide, now a unit of IHS Automotive, analyzed the cost-benefi t ratios of various powertrain technologies to
improve fuel economy in the standard ICE engine of today. The shaded area shows the biggest bang [10].
The rise of electron mobility and alternatives to gasolineTh ere have been other, more involved technical responses to the perceived energy crisis, such as the now “conventional” electric hybrid.
First introduced in Japan in 1997 and in North America, Europe, and elsewhere in 2000, nothing typifi es the electric hybrid more than the Toyota Prius. In June 2007, the cumulative total of all hybrids from Toyota (including Lexus brand hybrids) topped over 1,000,000 sales worldwide. In the U.S. alone, it reached 1,000,000 cu-mulative units in March 2009 [11]. “One million hybrids in less than nine years in-dicates how quickly American consumers have accepted this important technology,” said Jim Lentz, Toyota Motor Sales president in that press release. “With 10 new hybrid models between 2009 and 2012 in various global markets, we plan to sell one million gas-electric hybrids per year, worldwide, sometime early in the next decade.” Th ey achieved this milestone not only with the now venerable Prius, but also with
T-127 book.indb 11 8/24/11 9:22 AM
Downloaded from SAE International by Eric Anderson, Thursday, September 10, 2015
12 | Automotive 2030 – North America | Chapter 1
six other Toyota and Lexus hybrid vehicles, including the Toyota Prius. That seems like many hybrids—or is it?
In the U.S. alone, approximately 248 Million [12] cars are on the road. Thus, Toyota’s cumulative share in North America is 0.4%. Almost all automotive com-panies offer, or at least talk of offering, hybrids, but their cumulative sales are less than Toyota’s. Compared to the 315 current models offered in North America, J. D. Power notes that as of 2009 there were 15 brands of hybrids offering 28 models [13], up from just five brands offering seven models in 2004. That is impressive growth, but from a small base. Ten years after their introduction, conventional hybrids remain a small percentage of the total market.
That is the reality. What about the mind-share aspect? For a certain segment of environmentally conscious folks, it gets attention. While emerging as a significant trend in the last 10 years, combinations of gasoline- and electric-powered vehicles have actually been around since the dawn of the automobile age. According to one source, Justus Enz of the Electric Storage Battery Company of Philadelphia probably built the first one in 1897 [14], although it was built to augment the pow-er of early gasoline engines of the time, not to save fuel. The question that remains for the majority of rational consumers, who are not trying to make a statement, is how will the electrification of personal mobility play out? Will it be cost effective?
“Conventional internal-combustion-engine vehicles will continue to be market-share leaders for the foreseeable transportation future,” explains David Schutt, Chief Executive Officer of SAE International. “However, hybridization is clearly the interim solution until pure electric vehicles (EVs) become commercially viable in the long-term, but that transition will depend on many variables. For true EVs to be accepted by consumers in any significant volumes, viable onboard energy storage must become a reality.” This means that advanced batteries and ultraca-pacitors will help, according to him. Advanced, true breakthroughs in technolo-gies and materials may be needed for high-volume acceptance. Fuel cells are not ripe yet, as of 2010. They remain too heavy and expensive to be commercially ac-ceptable. However, as we will show in Chapter 8, work is continuing and innova-tions are apace. “Today’s low-volume (fuel cell) programs with commercial fleets will have to sort out the kinks in the technology if vehicle range, cost, and
T-127 book.indb 12 8/24/11 9:22 AM
Downloaded from SAE International by Eric Anderson, Thursday, September 10, 2015

Automotive 2030 – North America | Chapter 1 | 13
long-term durability are to equal or better the current conventional ICE and pe-troleum fuel solution,” he states. “In any case, big government initiatives and in-centives, as well as heavy commercial-sector R&D investment around the world, will be needed to accelerate EV and fuel cell commercialization.”
Safety and intelligence—the computerized carSafety has come a long way. Even though over 33, 900 people died in motor ve-hicle crashes in 2009 [15], without the safety systems we now have in place no doubt many more would have perished. How vehicles are designed and built has certainly contributed to their safety, especially since so many more of us are driv-ing bigger trucks vs. smaller cars. Bigger is safer, with all other things being equal. Other technologies that have made us safer and have become ubiquitous in the last 20 years include seat belts (if they are used), air bags that now include side curtain air bags and rear air bags, antilock braking, and electronic stability control. Currently, antilock brakes are on about 89% of all new cars sold and 99% of light trucks [16], according to the Insurance Institute for Highway Safety.
“Will truly accident-free driving—as some safety advocates are proposing—be pos-sible? This probably will require removing the driver from the equation, since hu-man error—often distracted or inattentive driving—plays a role in a majority of ac-cidents,” points out SAE’s Schutt. He notes that development of autonomous-vehicle technology would be a primary solution. Drivers could select destinations and have cars deliver them without any further input, while making phone calls, checking email, and doing other productive things. The key uncertainty here is both driver acceptance of such technology and the legal liability if an accident occurs.
Electronics provide more than safety. The trend that has risen in the automo-tive industry goes hand-in-hand with the general trend in consumer electronics. Global automotive telematics systems are set to rise to 84.4 million units in 2016, up by a factor of more than four, from 19.3 million in 2008, according to iSup-pli Corporation, a research and advisory firm. “From sending out an automatic distress call after a car crash, to enabling remote diagnosis of engine troubles, telematics can provide enormous benefits to motorists and car makers around the world,” said Anna Buettner, an analyst with iSuppli’s automotive research service in a press release in late 2009. This echoes the general sentiment of the enthusiasts
T-127 book.indb 13 8/24/11 9:22 AM
Downloaded from SAE International by Eric Anderson, Thursday, September 10, 2015

14 | Automotive 2030 – North America | Chapter 1
for these features in automobiles. “For drivers, telematics can enhance safety, con-venience, and connectivity. For (carmakers), telematics can add to and improve car functionality and reduce warranty and after-sales costs.” [17]
Given that we expect the electronics revolution to continue unabated, what ef-fect might it have on the future? This may be the most profound of all changes wrought in the car itself, and might be the most difficult to predict.
The web of connectionFrom oil fields to junk yards, personal transportation resides in an interconnected ecosystem. Perhaps no place like North America has made the car such a central feature of everyday life. The automobile shapes the landscape and the infrastruc-ture created for it, especially the Eisenhower-era interstate highway system. What are prominent by their absence in the last 20 years are new roads and highways. New highway construction has flattened to a trickle since 1980, even while we drive more. There are exceptions, such as Boston’s Big Dig project, but for the most part, we got what we got. Illustrative is a statistic named Vehicle Miles Trav-eled (VMT) counted by the Federal Highway Administration. Total highway mileage grew at an average annual rate of 0.2% between 1995 and 2004, while total VMT grew at an average annual rate of 2.5% [18]. Is it any wonder that conges-tion is such an issue in many suburban and urban areas?
Even while new highway construction projects are not in the cards, investment continues in repairing existing roads. There is also investment in applying informa-tion technology (IT) to reducing congestion. Most ideas in using IT have coalesced around the Intelligent Transportation System movement in the last 20 years. An example of this is the Intelligent Transportation Society of America (ITS America).
But wait, you say. Was not this a book about what cars were going to look like 20 years from now? Indeed it is. Personal transportation, no matter how we might myopically view it, resides in this larger ecosystem. For our own good, this eco-system is intruding into the design process of today’s vehicles.
This notion of ever-increasing connectivity has led some to think broadly, using a systems perspective to propose solutions to issues. Issues other than the high
T-127 book.indb 14 8/24/11 9:22 AM
Downloaded from SAE International by Eric Anderson, Thursday, September 10, 2015

Automotive 2030 – North America | Chapter 1 | 15
price of gasoline (or the fear of higher prices around the corner) exist, some of which are pollution, traffic congestion, safety, and the impact on our health from long commutes [19]. These system thinkers look at everything—roads, highways, filling stations, and information systems. Solving traffic congestion and reducing the number of cars idling on highways during rush hour may go as far to reduce pollution as making the cars cleaner and more efficient. This is sometimes termed “sustainable transportation.”
References[1] “Light-Duty Automotive Technology, Carbon Dioxide Emissions, and Fuel Economy Trends: 1975 through 2010,” U.S. Environmental Protection Agency, downloaded March 31, 2010, http://www.epa.gov/otaq/fetrends.htm.
[2] Deffeyes, Kenneth S., Beyond Oil, The View from Hubbert’s Peak, Hill and Wang, a division of Farrar, Straus and Giroux, New York, 2005.
[3] Morey, Bruce, “Developing Next-Generation Biofuels,” SAE Off-Highway Engi-neering, SAE International, June 3, 2010.
[4] “Short-Term Energy Outlook – Real Energy Prices,” downloaded Oct. 2010 from http://www.eia.doe.gov/EMEU/steo/realprices/index.cfm.
[5] Effectiveness and Impact of Corporate Average Fuel Economy (CAFE) Standards, National Academies Press, 2002.
[6] “Light-Duty Automotive Technology, Carbon Dioxide Emissions, and Fuel Economy Trends: 1975 through 2010,” EPA-420-R-10-023, November 2010.
[7] “Light-Duty Vehicle Greenhouse Gas Emission Standards and Corporate Aver-age Fuel Economy Standards,” Final Rule, Federal Register, Vol. 75, No. 88, May 7, 2010, NHTSA 40 CFR Parts 85, 86, et al.
[8] Ashley, Steven, “Inside Fiat’s innovative MultiAir system,” SAE Magazines, SAE International, Oct. 7, 2010.
T-127 book.indb 15 8/24/11 9:22 AM
Downloaded from SAE International by Eric Anderson, Thursday, September 10, 2015
16 | Automotive 2030 – North America | Chapter 1
[9] “Cost effective tech is key to meeting 2016 café,” SAE Magazines, 13-Apr-2010, 19:55 GMT, http://www.sae.org/mags/aei/saewc/8071.
[10] Chart and data supplied to the author by Jeff Jowett of IHS Automotive, No-vember 2010.
[11] Toyota Press Release, March 11, 2009, http://pressroom.toyota.com/pr/tms/toyota/toyota-and-lexus-hybrids-top-one-85047.aspx.
[12] Federal Highway Administration data downloaded on 10/23/2010, http://www.fhwa.dot.gov/policyinformation/statistics/2008/dv1c.cfm.
[13] Data supplied to the author by John Tews for J. D. Power and Associates.
[14] Wakefield, Ernest H., History of the Electric Automobile, SAE International, Warrendale, PA,1998.
[15] Statistics from Insurance Institute for Highway Safety, http://www.iihs.org/research/default.html.
[16] Ward’s Automotive Yearbook 2010, Ward’s Communications, Southfield, MI, 2010.
[17] Press Release from iSuppli dated Dec. 2, 2009.
[18] Data from U. S. Department of Transportation, Federal Highway Adminis-tration, Federal Highway Statistics 2008, downloaded Jan. 2011 from http://www.fhwa.dot.gov/policyinformation/statistics/2008/.
[19] Lutz, Catherine and Anne Lutz Fernandez, Carjacked, the Culture of the Auto-mobile and its Effect on Our Lives, Palgrave Macmillan, 2010.
T-127 book.indb 16 8/24/11 9:22 AM
Downloaded from SAE International by Eric Anderson, Thursday, September 10, 2015

Automotive 2030 – North America | Chapter 2 | 17
Chapter Two
Steady March of Conventional EnginesHarnessing the gasoline internal combustion engines (ICE) into mass-produced four-wheel vehicles created the automotive age. In the late-19th century, the ICE beat out electric and steam competitors to dominate in North America. Unlike their electric rival, conventional ICEs are inefficient. Why did they “win”? They proved superior because gasoline packs more energy for its weight than batteries, then or now. Drivers could go farther and refill in minutes. However, with North American drivers growing ever more nervous over fuel prices and availability, im-proving the efficiency of the ICE is getting lots of attention. Fuel economy discus-sions dominated most of the talk in industry gatherings starting in 2008, such as the yearly SAE International World Congress.
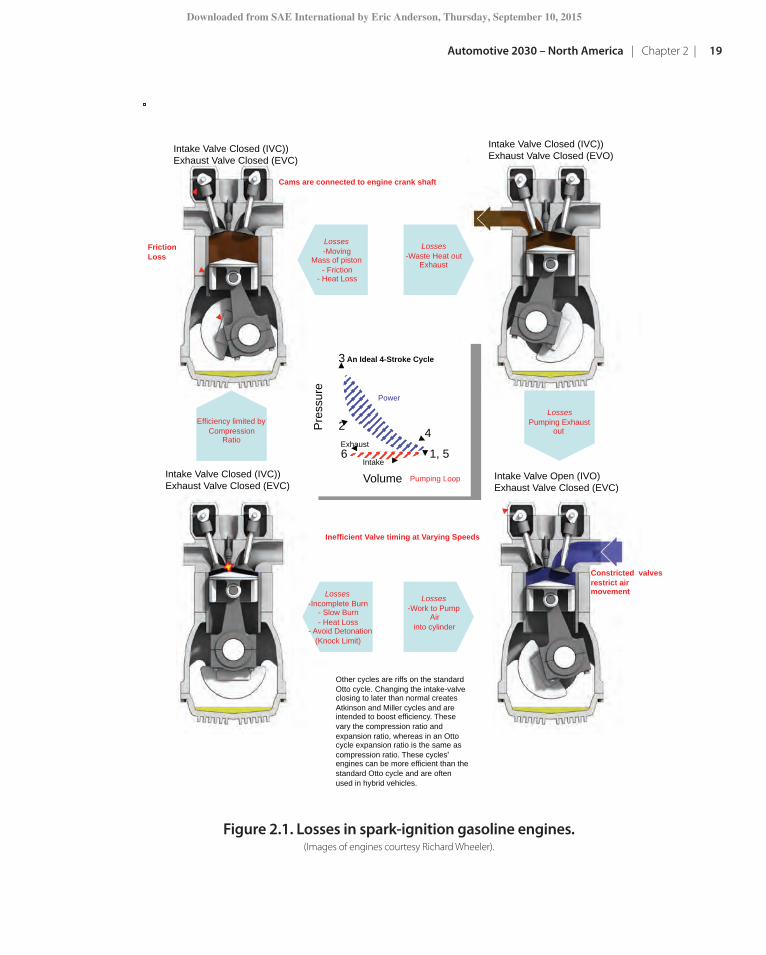
The standard spark-ignition gasoline ICE converts something like 18–25% of the energy in gasoline into energy that moves a car. Most of the energy is lost as heat out of the exhaust or the radiator. Some is lost to idling at times, such as when waiting at a red light. Moving air and fuel into the cylinder, moving exhaust out, and friction and inertia inside the engine all suck away useful energy. Other so-called parasitic losses include oil and coolant pumps, power steering, and the alternator for electricity. This neglects the power used for peripherals, of course, such as power brakes or running a high-volume sound system.
Not only are ICEs inherently inefficient, but also how they are used affects their efficiency. How aerodynamic, heavy, and mechanically efficient the car is greatly affect fuel economy.
T-127 book.indb 17 8/24/11 9:22 AM
Downloaded from SAE International by Eric Anderson, Thursday, September 10, 2015

18 | Automotive 2030 – North America | Chapter 2
Therefore, there are two basic ways a powertrain engineer can increase fuel econo-my, if fuel economy is to remain important through 2030:
• Makeabetterengine—delivermorepowerwithlessfuel• Engineeracarthatusestheengineclosertoitsmostefficientspeedand
load point most of the time
Making better enginesEngineers well understand where inefficiencies hide in engines and how to mea-sure them (see Fig. 2.1). Fundamental ways to increase fuel efficiency in the en-gine include improving the compression ratio of the engine1, increasing the speed and quality of the burn, reducing unwanted heat transfer through the walls of the cylinder, and reducing the loss in getting an air / fuel charge into and exhaust out of the cylinder [1].
Improving compression ratio runs into difficulties with knock, a detonation of the fuel instead of a clean, steady burn. Engineers often refer to “knock limited” conditions that limit fuel economy improvements. Another way of increasing fuel economy is to increase the power and torque density of the engine. This means that a smaller, lighter engine that produces the same power will weigh less and need less fuel to move it. After almost 125 years of development, engineers have a substantial toolkit to dip into for making engines more powerful and efficient. New technologies, especially computers and sophisticated control software, have given them even more tools. Future use of technologies depends on costs, ben-efits, and motivations. One motivation might be even-stricter CAFÉ regulations by 2025; another is a steep price increase in gasoline.
Ways of making engines better in the near future include:
Boosting the amount of air that goes into each cylinder using a blower. This increases density of the charge, providing more power. Turbochargers use exhaust gases to turn the blower, while superchargers connect a blower directly to the crankshaft. The advantage of turbochargers is that they recover energy
1Ratio of the volume of an engine’s combustion chamber from its largest capacity to its small-est capacity.
T-127 book.indb 18 8/24/11 9:22 AM
Downloaded from SAE International by Eric Anderson, Thursday, September 10, 2015
Automotive 2030 – North America | Chapter 2 | 19
Figure 2.1. Losses in spark-ignition gasoline engines. (Images of engines courtesy Richard Wheeler).
Intake Valve Open (IVO) Exhaust Valve Closed (EVC)
Intake Valve Closed (IVC)) Exhaust Valve Closed (EVC)
Intake Valve Closed (IVC)) Exhaust Valve Closed (EVC)
Intake Valve Closed (IVC)) Exhaust Valve Closed (EVO)
Friction Loss
Losses - Moving
Mass of piston - Friction
- Heat Loss
Losses - Incomplete Burn
- Slow Burn - Heat Loss
- Avoid Detonation (Knock Limit)
Losses - Work to Pump
Air into cylinder
Losses - Waste Heat out
Exhaust
Efficiency limited by Compression
Ratio
Losses Pumping Exhaust
out
Inefficient Valve timing at Varying Speeds
Other cycles are riffs on the standard Otto cycle. Changing the intake-valve closing to later than normal creates Atkinson and Miller cycles and are intended to boost efficiency. These vary the compression ratio and expansion ratio, whereas in an Otto cycle expansion ratio is the same as compression ratio. These cycles' engines can be more efficient than the standard Otto cycle and are often used in hybrid vehicles.
Cams are connected to engine crank shaft
Constricted valves restrict air movement
1, 5
2
3
4
Volume
Pre
ssur
e
6 Exhaust
Intake
An Ideal 4-Stroke Cycle
Pumping Loop
Power
T-127 book.indb 19 8/24/11 9:22 AM
Downloaded from SAE International by Eric Anderson, Thursday, September 10, 2015

20 | Automotive 2030 – North America | Chapter 2
otherwise wasted in the exhaust stream. How to best use boosting requires caution, as Curtis Collie, Chief Engineer for Engine R&D for IAV, points out. “Boosting in and of itself is mostly negative because it tends to force lower compression ratios,” he explains. Why is boosting attractive for fuel economy? It often means using a smaller engine. Engineers can replace a V-8 with a V-6, or V-6 with an I-4. It is not just size and weight, but matching the all-impor-tant most-efficient load point of the smaller engine more often (see Translating Engineer Speak).
Let the engine breathe better by engineering valves that let in fuel and air and let out exhaust gas better. Engineers sometimes call this the pumping loop. Timing the closing of the intake affects power and torque. Closing it early in-creases torque; closing it late favors power [2]. With fixed valve timing, these are efficient for a small range of engine speeds. Variable valve timing (VVT) devices let engineers adjust the timing as the engine revs up or slows down, increasing the volumetric efficiency and making it easier for the engine to breathe. Adding more valves increases the amount of air going into and out of an engine. Using more valves does this more efficiently than simply making a bigger, single valve.
“The problem with determining efficiency for an engine is that it depends on the load and speed it is operating at,” explains Prof. John B. Heywood of the Sloan Automotive Laboratory at MIT.
“The best efficiency is close to where the engine is operating at its maximum torque.” He goes on to explain that the friction from internals of the engine—piston rings, journal bearing, crankshaft, and so on—will affect the engine at different loads. “At low loads, the negative effect of engine friction has a very big effect, while at maximum torque, the negative effect of friction is nowhere near as big,” he explains. What this means is that efficiency is a complex function of load (torque) and engine speed in revolutions-per-minute (rpm). A typical car will drive its engine at varying loads and speeds, from
cruising on the highway, to passing on the highway, to fast starts from a dead stop. To understand an engine’s efficiencies, engineers need to map out its performance. Specific engineering terms are used to help as well.
Engineers who work on engines need to isolate the effects of fuel economy of engines from the car. This requires a specific way of measuring, since we get what we measure. To do that, engineers devised Brake Specific Fuel Consumption (BSFC), the rate of fuel consumed divided by the power produced (Fig. 2.2). In metric units, this is g/kWh. A measurement of 200 g/kWh is more efficient than 300 g/kWh. BSFC is converted to actual engine efficiency in percent by using the lower heating value of the fuel used.
Translating Engineer Speak
T-127 book.indb 20 8/24/11 9:22 AM
Downloaded from SAE International by Eric Anderson, Thursday, September 10, 2015

Automotive 2030 – North America | Chapter 2 | 21
Expect to see a number of technologies for better engineering of the timing valves in the period 2010 through 2020. These include VVT—intake cam phas-ing, dual cam phasing, Discrete Variable Valve Lift (DVVL), Dual Overhead Cam (DOHC) or Overhead Valve (OHV), and Continuously Variable Valve Lift (CVVL). These technologies will improve fuel economy anywhere from 1–6%, depending on the technology and the size of the engine that uses them [2]. As Collie from IAV points out, some of these technologies are enablers for OEMs to implement engine cycles known for better efficiency, such as Atkinson and Miller cycles. The most extensive modifications to valves could yield fuel econ-omy improvements up to 11% [2]. “[Atkinson and Miller] are essentially an Otto cycle modified so that the expansion stroke is longer than the compression stroke,” explains Collie. “With variable valve timing, the intake valve can either be closed very early or very late, essentially reducing the effective compression ratio. Meanwhile, the mechanical expansion ratio remains unchanged and—with variable valve timing the exhaust valve opening can be delayed—yielding a longer effective expansion stroke.” Why do this? Less negative work in com-pression and more positive work in expansion mean better efficiency.
Figure 2.2. Measuring BSFC at specific intervals of engine speed and torque in a two-dimensional map gives engineers a complete picture.
T-127 book.indb 21 8/24/11 9:22 AM
Downloaded from SAE International by Eric Anderson, Thursday, September 10, 2015
22 | Automotive 2030 – North America | Chapter 2
A number of electromechanical VVT systems were in the marketplace through 2010. These included Honda’s VTEC, BMW’s Valvetronic, Toyota’s VVTi, Nis-san’s Variable Valve Event and Lift, as well as other phaser and cam-switching approaches. Another example is Fiat’s multi-air system, introduced for sale in 2011. It uses electrohydraulic technology to control the intake valves. Fiat claims a 10% increase in fuel economy for a relatively low variable cost per unit of $25 to $50 [3].
Variably reduce the number of cylinders providing power. Cylinder Deactivation (CDA) shuts down cylinders, such as an entire bank of a V-6 or every second cylinder in the firing order of a V-8, when the computer determines they are no longer needed. During highway cruising, fuel economy improves by deliv-ering only the reduced power required to maintain a steady speed. Those working cylinders operate at a higher efficiency, because the specific load on them is closer to their maximum efficiency (see sidebar, Translating Engineer Speak). Pioneered by GM as early as 1981 with its V-8-6-4 engine, CDA was a feature in 6% of all engines by 2008 [4] and has continued to grow. General Motors alone boasts three million vehicles on the road with CDA [5]. CDA is offered as a no-cost option that provides on average about 8% increase in fuel economy for light trucks and
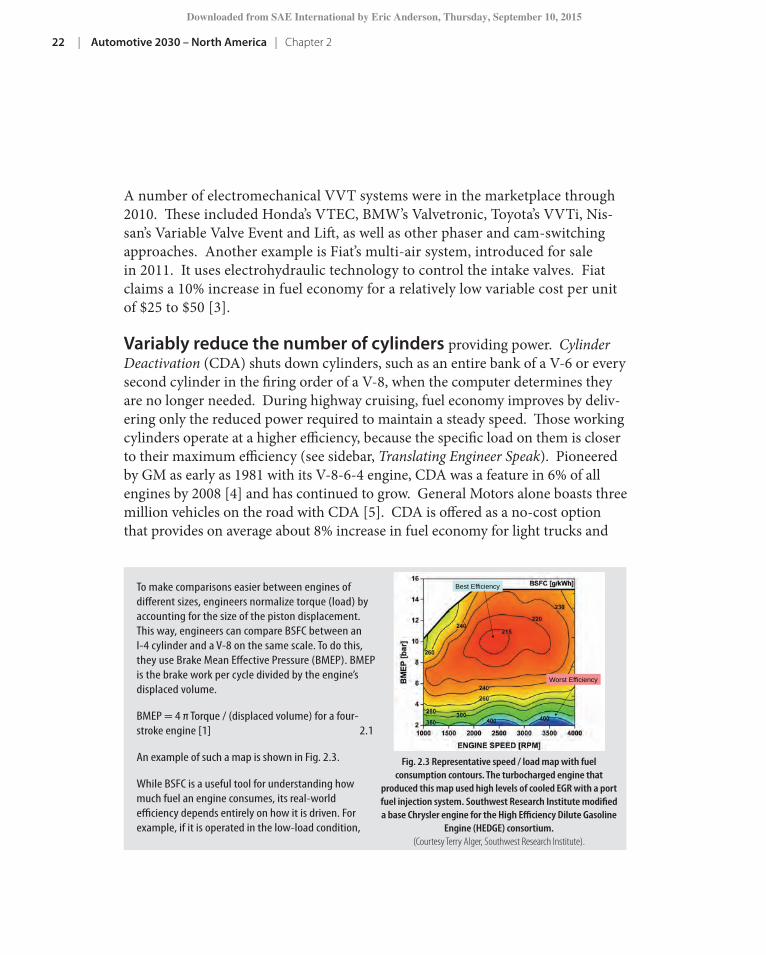
To make comparisons easier between engines of different sizes, engineers normalize torque (load) by accounting for the size of the piston displacement. This way, engineers can compare BSFC between an I-4 cylinder and a V-8 on the same scale. To do this, they use Brake Mean Effective Pressure (BMEP). BMEP is the brake work per cycle divided by the engine’s displaced volume.
BMEP = 4 π Torque / (displaced volume) for a four-stroke engine [1] 2.1
An example of such a map is shown in Fig. 2.3.
While BSFC is a useful tool for understanding how much fuel an engine consumes, its real-world efficiency depends entirely on how it is driven. For example, if it is operated in the low-load condition,
Fig. 2.3 Representative speed / load map with fuel consumption contours. The turbocharged engine that
produced this map used high levels of cooled EGR with a port fuel injection system. Southwest Research Institute modified a base Chrysler engine for the High Efficiency Dilute Gasoline
Engine (HEDGE) consortium. (Courtesy Terry Alger, Southwest Research Institute).
Best Efficiency
Worst Efficiency
T-127 book.indb 22 8/24/11 9:22 AM
Downloaded from SAE International by Eric Anderson, Thursday, September 10, 2015

Automotive 2030 – North America | Chapter 2 | 23
12% for cars (combined city / highway), according to the company. Expect to see in the period 2011–2016 possibly dozens of new applications for cylinder deacti-vation, especially in small engines [6].
Reduce parasitic losses by reducing friction and the weight of moving parts. Improving lubricants and careful engineering of engine parts such as pistons, push rods, and crankshafts—any part in the engine that moves—will lead to a more-efficient engine.
Turn the engine off when not needed. Known as idle-stop or start-stop, there seems no better way to save fuel than not burning it when it is not needed. Idle-stop grew out of developments in hybrids. Reportedly, some basic systems started in Europe in the 1980s—featuring abrupt and slow restarts, they were not popular [7] when first introduced. With changes in how the U.S. Environmental Protection Agency (EPA) tests for fuel-economy starting in 2012, more stops in the cycle will mean better results in EPA tests for cars with idle-stop technology. These cars are sometimes referred to as micro-hybrid. In some variations, a single large machine, capable of both starting the engine and generating electricity, will replace the starter and generator. While restart systems using a higher-voltage
with BMEPs less than 4 bar, the measured real-world fuel economy of the vehicle will be much lower than the highest average. This is why it is difficult to establish a trend for efficiencies for engines, because so much depends on how they are used.
We can use a model of a car moving at a steady speed on the highway to relate BSFC to fuel efficiency in miles per gallon. “For a sedan-sized car moving at a steady speed of about 60 mph, with good aerodynamics and typical tires, transmission, and axle losses, the engine will expend about 20 hp, or 15 kw,” explains Curtis Collie, Chief Engineer of Engine R&D for IAV. Using that specific model means we can relate BSFC to mpg by applying equations that include heating value of fuel and other complex relationships [2].
References[1] Heywood, John B. and Orian Z. Welling, “Trends in Performance Characteristics of Modern Automobile SI and Diesel Engines,” SAE Paper No. 2009-01-1892, SAE International, Warrendale, PA, 2009.
[2] Model and calculations courtesy of Curtis Collie, Chief Engineer for Engine R&D for IAV.
Power needed to maintain speed
15 kW (20 Hp) 15 kW (20 Hp)
Measured BSFC 270 g/kWh 210 g/kWh
Best thermal efficiency 31.4% 40.3%
Fuel efficiency 42.6 mpg 54.7 mpg
T-127 book.indb 23 8/24/11 9:22 AM
Downloaded from SAE International by Eric Anderson, Thursday, September 10, 2015

24 | Automotive 2030 – North America | Chapter 2
system are easier to engineer, moving these systems to mainstream cars will require that they use an enhanced 12-volt battery system. Expect to see some amount of regenerative braking or power bleed from when the car is coasting used to feed electric power back to the battery in some idle-stop systems as well.
The trick is to get the engine to restart quickly and seamlessly. Through 2010, most systems simply turned the car back on as you would when first turning the key. An-other way of restarting the engine is through combustion for engines equipped with direct-injection spark ignition (DISI). For example, the Mazda “i-stop’’ restarts the engine by injecting fuel directly into a cylinder while the engine is stopped. Igniting it generates downward piston force. This system restarts the engine more quickly and quietly than a conventional idle-stop system, according to the company. The tricky part is to stop the compression-stroke pistons and expansion-stroke pistons at exactly the correct positions to create the right balance of air volumes. Reportedly, this reduces the time by half to restart the engine, making it seamless to the user. With the engine off, the system must compensate for creature comforts. For exam-ple, in Ford’s idle-stop implementation, a special electric pump keeps engine coolant circulating through the heater so drivers will stay warm in cold weather. Fuel econ-omy improvements are reported at about 4% or so [8]. It is especially good in city driving or stop-and-go traffic, and practically negligible in steady cruising. Some experts expect to see many of these in new vehicles in the period up to 2016. They could perhaps be universal by 2030 [9], at least in new cars with DISI.
General Motors pioneered the use of cylinder deactivation, which they call Active Fuel Management. Shown in Fig. 2.4 is the lubrication circuit in a GM engine.
Some of these technologies are especially useful when combined—for example, coupling DISI with turbocharging as in the Ford EcoBoost and other engines. “In the past, using turbocharging to improve performance had disadvantages, includ-ing knock, requiring reducing the compression ratio and adding fuel enrichment under high load,” explained Dan Kapp, Director of Advanced Powertrain Engineer-ing for Ford. “Direct-injection, compared to port injection, delivers a cooler, dens-er charge that reduces turbo-lag and knock. You can also maintain compression ratios “for better fuel economy.” He reports that the 3.5-liter EcoBoost—essentially DISI coupled with turbocharging—delivers compression ratios slightly better than
T-127 book.indb 24 8/24/11 9:22 AM
Downloaded from SAE International by Eric Anderson, Thursday, September 10, 2015

Automotive 2030 – North America | Chapter 2 | 25
10:1 [10]. Boosting with DISI is sometimes called gasoline turbocharging with di-rect injection (GTDI). GTDI can decrease fuel consumption by 2–6%.
Advances in engineering methods make these advances in engines possible. “Our engineering tools have improved dramatically as well,” explains Collie. “Software such as computational fluid dynamics (CFD) and finite element analysis (FEA)
Figure 2.4. Lubrication circuit in a GM engine (Courtesy GM Powertrain Engineering).
T-127 book.indb 25 8/24/11 9:22 AM
Downloaded from SAE International by Eric Anderson, Thursday, September 10, 2015

26 | Automotive 2030 – North America | Chapter 2
allow for design optimization that just wasn’t possible or practical, previously. These better tools have also allowed us to make parts lighter and yet still improve reliability,” he remarks. “Better designs and improved materials have improved the efficiency and lowered the cost of key components. For example, we now have automotive turbochargers with maximum compressor efficiencies of 80%, com-pared with less than 70% being the norm in the mid-1970s.”
Taming complexity is another issue. “As we add these technologies together—variable valve timing, direct injection, boosting, cooled EGR (exhaust gas recircu-lation), hybridization, and so on—the number of calibration variables has grown exponentially,” he explains. Collie goes on to point out this is why the computers and control software are the key enabler to yielding the full potential of the pow-ertrain. However, with so many variables (up to 20,000), the ability of a human mind and the current calibration methods are a major limiting factor. In the next few years, he expects to see many more adaptive model-based control schemes where the engine, using sensor signals for feedback, calibrates itself to make the most of all this new hardware.
Trends in performance—delivering steady improvementsEvery year, engines in North America, on average, deliver more specific power and torque. This has been true since 1985, according to Prof. John B. Heywood of the Sloan Automotive Laboratory at MIT. In two separate studies examining the trends in engine performance over time, “we have seen a surprisingly linear rise in [engine torque measured in] BMEP of about 1.5%.” (See sidebar, Translating En-gineer Speak.) These two studies looked at all engines delivered in North America in light-duty applications. The result is that engines have, on average, increased specific power, as measured by maximum BMEP, by 40% over the period 1985-2008. If these trends continued, the average engine of 2030 would use gasoline that is spark-ignited and delivering almost 100% more maximum specific torque in terms of BMEP than its average 1985 predecessor.
The studies attribute this increase to a number of technologies introduced to the fleet of engines. Average compression ratios for naturally aspirated (non-boosted) engines rose from 9.6 to 10.2 from 2000 to 2008 (boosted engines maintained
T-127 book.indb 26 8/24/11 9:22 AM
Downloaded from SAE International by Eric Anderson, Thursday, September 10, 2015

Automotive 2030 – North America | Chapter 2 | 27
Per
cent
Pen
etra
tion
about 9.6). The number of valves increased, as did VVT and use of DOHC at the expense of push rods. “This enables significantly higher compression ratios and higher BMEP than with port fuel injection,” remarks Heywood. Trends in the use of engine technologies are shown in Fig. 2.5.
On the other hand, improvements in some areas may be much harder to come by in the future. “It will be difficult and expensive to get as much reduction in friction losses or in mass reduction of engine parts, like pistons and rods, as we have in the past,” explains Collie from IAV. Since these areas have been the focus for the last few decades, he notes, engineers face the law of diminishing returns in squeezing out more improvement at reasonable cost. “However, increases in CAFÉ or fuel pricing will allow more expensive materials and technology features to be seen as good value proposals,” he explains. “Look at the specific example of mass reduction and power density. In the mid-70s, it was common to see gasoline power density figures less than 0.50 kW/kg. Currently, it is common to see gaso-line power densities of 1.0–1.5 kW/kg. The light-duty diesel engines have seen
Figure 2.5. The trends evident in the last decade are more gasoline direct injection and increasing turbocharging. Estimated
projections are shown to 2020 [11].
T-127 book.indb 27 8/24/11 9:22 AM
Downloaded from SAE International by Eric Anderson, Thursday, September 10, 2015

28 | Automotive 2030 – North America | Chapter 2
even more remarkable improvements, with power densities going from 0.25 kW/kg to some of the better examples today being in the 0.75–0.8 kW/kg range. This same magnitude of change in the next 20 years is unlikely, especially with increas-ingly tighter emission standards. What is more likely is for the variation to be reduced and that the average will be much closer to the BIC [best in class].” One area he does see for potential improvements in the period through 2030 consists of new and novel ways of harvesting the waste energy from hot exhaust gases.
Diesel engines in light vehiclesDiesel engines are inherently more efficient than gasoline spark- ignition engines. Diesel engines typically run at higher compression ratios, use lean mixtures, and exhibit fewer internal losses. They also use a fuel that contains about 11% more energy per gallon than gasoline [12]. All diesel engines inject fuel directly into the cylinder. The major difference is that compressing the fuel / air mixture autoig-nites the fuel. All diesels used for light-duty vehicles through 2010 were direct-injection and turbocharged [4].
A major drawback compared to gasoline is that diesel engines tend to be dirtier. Why? “Diesel fuel is injected directly into the cylinder and never mixes thorough-ly before and during ignition,” explained Dennis Assanis, Director of the Walter E. Lay Automotive Laboratory at the University of Michigan, speaking in 2009. “Burning pockets of rich fuel form soot. Lean pockets form NOx at higher com-bustion temperatures.” Because of this, extensive aftertreatment is needed. With new emissions regulations in both North America and Europe looming, additional equipment for diesel aftertreatment will need to be added in the period. Many of the technologies one would see in advanced diesels are variations on the existing technologies. These include two-stage turbochargers and downsizing engines and increasing boost pressures. Although using these technologies will allow diesels to get more efficient, diesels are already relatively good—especially compared to gasoline engines that now dominate in North America [2].
To date, market acceptance of diesel in light vehicles is negligible. They represent a tiny fraction of overall sales—less than 1% by some measures. In certain seg-ments, they are more popular. For instance, a substantial fraction of trucks over 8500 lb Gross Vehicle Weight Rating (GVWR) use diesel. Drivers use these trucks
T-127 book.indb 28 8/24/11 9:22 AM
Downloaded from SAE International by Eric Anderson, Thursday, September 10, 2015
Automotive 2030 – North America | Chapter 2 | 29
in light-duty commercial work and sometimes in personal use. In Europe, die-sel powertrains represent something like 50% of the market in new vehicles sold. However, this disparity is largely due to favorable pricing policies for diesel fuel and looser European emission standards for NOx. In the period 2000–2009, sales of diesel vehicles in Western Europe climbed from 28.4% of total light-duty vehicle sales to 52.2% [12]. Market share in some countries exceeded 70% in 2009 [12]. The problems with diesels in light duty in North America include the fact that die-sel fuel prices were volatile and often more per gallon than gasoline in the period 2004 through 2010. Aftertreatments in some vehicles require using and replenish-ing a urea supply for a system called selective catalytic reduction (SCR). Another treatment known as NOX storage catalysts (NSC), or Lean NOx Traps (LNT), does not require urea. They do affect fuel economy because the systems have to purge the catalyst periodically with fuel.
Many of the problems with acceptance of diesels are not performance related, but cost and customer perception. Diesels generally cost more than gasoline-powered vehicles, and when diesel fuel is periodically more expensive than gasoline, the perception is that it is not worth it. In many ways, diesels might be best put in the same category as hybrids, plug-ins, and battery electric vehicles as “alternative” powertrains, at least from the perspective of the consumer.
Post-2016 conceptsA number of technologies may happen in the period 2016 through 2030, some of which researchers have pursued for years.
Engineering best compression ratio to match engine speed. Higher loads require lower compression ratios to be more efficient, and lower loads, higher ones. Technology that changes how far the piston advances in the cylinder, for ex-ample, can provide such variable compression ratios. There are a number of differ-ent approaches to this. Some individuals are skeptical that any are practical before 2025, others are more optimistic.
Advanced valve timing. The final word in complete control of valve tim-ing would be through some form of camless valve trains. This would eliminate the need for camshafts connected to the crankshaft to open and close the intake
T-127 book.indb 29 8/24/11 9:22 AM
Downloaded from SAE International by Eric Anderson, Thursday, September 10, 2015

30 | Automotive 2030 – North America | Chapter 2
and exhaust valves. Electromagnetic, hydraulic, pneumatic, or some combination of valve actuators are all possibilities. Common problems that could occur with these systems include high power consumption, reduced accuracy at high speed, temperature sensitivity, weight and packaging issues, high noise, high cost, and unsafe operation in case of electrical problems. Durability is another issue. While there are those who feel that a truly camless valve train is unlikely before 2015, it is a trend worth tracking as we lead up to 2030.
Lean burn means using more air than is required to burn the fuel in an engine. This is in contrast to most spark-ignition (SI) engines on the road today, which use just enough air to burn the fuel completely. This “just right” mix, termed stoichio-metric, is 14.7 parts air to one part gasoline. The rub for stoichiometric SI engines is that engineers size them for maximum power and acceleration. For them to run at less than their maximum power and maintain stoichiometric combustion (re-quired by the catalytic pollution control system) requires a throttle on the intake air to reduce the airflow to the engine in proportion to the reduced fuel flow for lower-power operation. However, partially closing the throttle leads to inefficient operation at low loads. Why? It takes more work to pump air through a partially closed throttle, known as throttle losses. Lean burn offers the possibility of reduc-ing the throttling losses by controlling load with the amount of fuel injected, in-stead of throttling the intake air under part-load conditions.
“The issue with lean burn is that the common three-way catalyst cannot tolerate excess oxygen in the exhaust stream and still reduce NOx properly,” says Collie from IAV. “They [TWCs] are designed to work with carefully controlled ratios of unburned hydrocarbons, carbon monoxide, and NOx. As long as these species are kept at the correct proportion, TWC efficiencies after light off are so high that the total engine-out emissions are not very sensitive.” However, lean-burn op-eration, having excess oxygen in exhaust, would require more expensive exhaust aftertreatment systems similar to diesels, such as lean-NOx traps (LNT) or selec-tive catalytic reduction (SCR). Since the cost of operating these systems is direct-ly proportional to the amount of NOx being produced (reagents or reductants), it is important to minimize engine-out NOx. One way to minimize the amount of NOx created in lean-burn engines is by reducing the maximum temperature of the combustion process.
T-127 book.indb 30 8/24/11 9:22 AM
Downloaded from SAE International by Eric Anderson, Thursday, September 10, 2015

Automotive 2030 – North America | Chapter 2 | 31
Enter cooled EGR. “A cooled EGR system forces the hot exhaust gases through expensive, high-temperature heat exchangers that can tolerate the corrosive gases. This cooled EGR (inert gas) in the combustion chamber reduces the maxi-mum temperatures, and thus lowers NOx production,” he explains. He believes that with enough pressure for fuel economy (CAFÉ and/or fuel price), lean burn is where gasoline engine development will eventually lead, enabled by a number of technology streams already evident in 2010, such as DISI, VVT, and turbo-chargers as well as cooled EGR. However, this kind of advanced gasoline com-bustion system will need an equally advanced ignition system, and this is already forcing significant development efforts. One estimate believes that such a system featuring cooled EGR could reduce fuel consumption for downsized, turbo-charged engines an additional 5 to 13% [13].
“[Another] method of introducing lean burn is homogeneous charge compression ignition, known as HCCI,” explains Dennis Siebers, Manager of Engine Combus-tion Research at Sandia National Laboratories. HCCI combines characteristics of gas and diesel engines with well-mixed fuel (gasoline-like) and air with an ignition started through compression (diesel-like). HCCI garnered much attention in the period of 2001 through 2011. Challenges include controlling the ignition timing, operation through transients and operation over the entire speed / load map, con-trolling hydrocarbon (HC) and carbon monoxide (CO) emissions, and controlling the rate of pressure increase in the engine cylinders. Rapid increases in pressure and high peak pressures can damage engines and result in excessive noise.
In addition to increasing low-load efficiencies by eliminating throttling losses, HCCI is also a low-temperature combustion process, and it allows higher compres-sion ratios similar to a diesel engine. The low-temperature nature reduces heat loss from the engine, resulting in higher efficiency. The higher compression ratios also increase overall efficiency, according to Siebers. The technology offers more than fuel economy—low-temperature HCCI controls NOx formation and produces no soot, promising lower-cost automotive emission control systems relative to the aftertreatment systems now used on diesel engines. While noting that HCCI is not likely to go to market for at least a few years, he reports progress in laboratory R&D. His laboratory has shown advances in controlling ignition timing. It has also demonstrated using HCCI to deliver both high efficiency and power from low
T-127 book.indb 31 8/24/11 9:22 AM
Downloaded from SAE International by Eric Anderson, Thursday, September 10, 2015

32 | Automotive 2030 – North America | Chapter 2
to high loads, where once HCCI was thought to be only practical for lower-load operation. “At these high loads we are still getting very low emissions,” he remarks. He notes that Sandia demonstrated peak efficiencies that were greater than 30% better than port-fuel injected stoichiometric engines on the road today. “HCCI as a combustion method could also be used in a gasoline direct-injected engine, along with intake pressure boosting [such as turbocharging],” he explains. Post 2010, much research and development remains. One major challenge is in developing robust strategies for controlling HCCI over a transient drive cycle.
The key period for seeing the practical adoption of HCCI is probably in the 2015–2020 period. Given the long lead-time needed to transition new engine technolo-gies, if ready by 2020 or so, HCCI could start to enter the market by MY 2030. If successful, expect a practical 20–30% additional improvement in fuel efficiency over today’s port-fuel-injected gasoline engines along with reducing or eliminating NOx aftertreatment, which is worthwhile pursuing despite the many difficulties. “I would expect HCCI engines could enter the market by 2020 to 2025 if the R&D continues to produce positive results,” explains Siebers.
The key uncertainty is in transitioning even a successful laboratory demonstra-tion to practical engines. “HCCI might be used in only part-load conditions sooner,” notes Siebers. He envisions engines that may use different combustion approaches—HCCI at low loads, conventional spark-ignition at higher loads—enabled by today’s sophisticated engine control and fuel injection systems. “GM and Daimler have built such prototype part-load HCCI engines and have them in vehicles [in 2010].”
Comments on fuelEngines and fuels have grown hand-in-hand in the automotive age. While engines have improved, better formulations of fuels could also contribute to better fuel efficiency. Once, lead was added to gasoline to prevent knock and improve the compression ratio of engines, as did methyl tert-butyl ether (MTBE). When the impact on health was understood, lead was removed. The fuel supply continues to evolve and improve. For example, gasoline and diesel fuels in 2010 had less than 15 parts-per-million (ppm) sulfur, making for better exhaust aftertreatment and the more practical use of diesel for everyday commuters.
T-127 book.indb 32 8/24/11 9:22 AM
Downloaded from SAE International by Eric Anderson, Thursday, September 10, 2015
Automotive 2030 – North America | Chapter 2 | 33
Alternative fuels will remain a key focus in the period 2010–2030, and are a key uncertainty. Biofuels derived from corn and soybeans were a small but appre-ciable fraction of the North American fuel supply. While its impact in terms of volume remains uncertain, cellulosic ethanol may contribute even more by 2030. Ethanol or high blends of ethanol and gasoline (E85) are in reality a third fuel, in addition to gasoline and diesel. Components in engines have to be specially de-signed to burn it without damage. To take full advantage of its higher octane rat-ing over gasoline, higher compression ratios would need to be designed. If etha-nol was the only fuel available, engines could be tuned to exploit it.
Collie from IAV also points out that the variability of octane in today’s North American gasoline limits engineers from realizing engines with maximum ef-ficiency. “The strongest factor in improving gasoline engine efficiency is the [compression / expansion] ratio, and that is directly limited by the octane rat-ing of the fuel,” he explains. By uniformly raising the octane in gasoline and tightening variability from state-to-state, engineers / designers could get even more efficiency and power, according to him. Just such an example is Mercedes-Benz’ reported experience in its attempt to introduce lean-burn engines to the U.S. While the acceptable sulfur limit for diesel as of 2010 is 15 ppm, gasoline is much higher at 80-95 ppm. Engines from Mercedes operating on lean-burn cannot function above 50 ppm [14].
SummaryWhen it comes to new engine technologies to improve the efficiencies of ICEs, the number of choices is not limited. An important element not discussed in detail is the complexity and control offered by powertrain control units. These computers in many cases enable more exotic combustion schemes, variable-valve timing, and combustion restart in advanced idle-stops. With so many variables and the com-plexity used to control engines and emissions systems, computers will continue to grow in power. Simulation and statistical models will continue to find their way onto these increasingly capable on-board computers.
As pointed out by the National Academies Study, improving the fuel economy of gasoline SI engines is in many ways the least-risky approach for OEMs to pursue. There are far fewer uncertainties in this approach compared to others discussed
T-127 book.indb 33 8/24/11 9:22 AM
Downloaded from SAE International by Eric Anderson, Thursday, September 10, 2015
34 | Automotive 2030 – North America | Chapter 2
later. There are also no key uncertainties regarding the technology itself, only in the cost-benefit ratio. If advanced combustion schemes such as HCCI fail to pan out, this will reduce the rate of improvement for these engines by a few percentage points—such failure by itself will not fatally cripple the industry.
In fact, what set of technologies is best to pursue post-2016 is uncertain. A survey of OEMs by the U.S. National Highway Traffic Safety Administration (NHTSA), EPA, and California Air Resources Board (CARB) in 2010 found no general consensus on exactly what technologies each OEM intends to pursue past 2016. Even leading up to 2016, according to the National Academy study, OEMs are pursuing advanced Valve Event Modulation (VEM) or GTDI, but not both. As costs decline through engineer-ing and volume, this may not be the case in the 2025 through 2030 timeframe.
Trends to watch for:
• InNorthAmerica,expecttoseemoreDISI,withpossibly100%marketshare by 2030.
• InNorthAmerica,expecttoseemoreboostingcoupledwithDISI(some-times called GTDI), but not universal acceptance.
• MorevalveengineeringwithformsofenhancedVVT.
• Moreinroadsbycylinderdeactivation,evenifthetrendthrough2010ranflat (see The Steady March of Power).
• Greatlyincreaseduseofidle-stop,especiallyonDISIengineswhereitismorepractical and response times are faster. Some predict 100% take-rate by 2020.
• Anincreasingpossibilityofadvanced,lean-burngasolineSIengines,en-abled by cooled EGR, or HCCI, or Premixed Charge Compression Igni-tion (PCCI), or some combination.
• Overall,theaveragenewcarfleetcouldimprovefueleconomyby20–30%from engine technologies alone, by 2030, depending on the size of the en-gine and the cost the OEMs and buyers will tolerate.
T-127 book.indb 34 8/24/11 9:22 AM
Downloaded from SAE International by Eric Anderson, Thursday, September 10, 2015
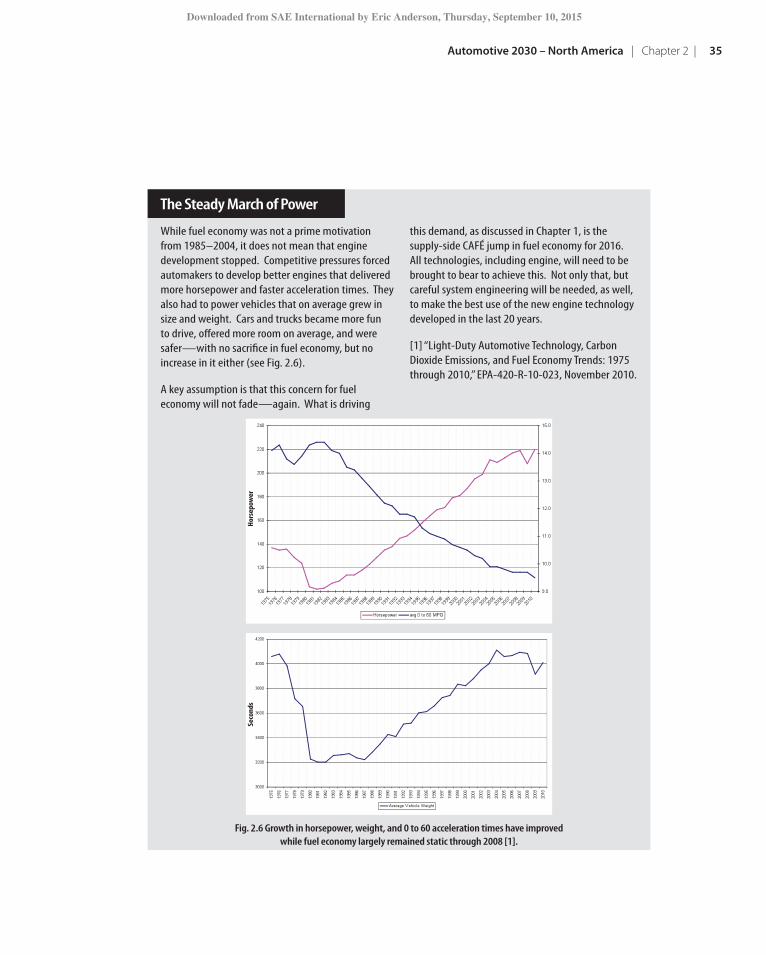
Automotive 2030 – North America | Chapter 2 | 35
Fig. 2.6 Growth in horsepower, weight, and 0 to 60 acceleration times have improved while fuel economy largely remained static through 2008 [1].
The Steady March of Power
While fuel economy was not a prime motivation from 1985–2004, it does not mean that engine development stopped. Competitive pressures forced automakers to develop better engines that delivered more horsepower and faster acceleration times. They also had to power vehicles that on average grew in size and weight. Cars and trucks became more fun to drive, offered more room on average, and were safer—with no sacrifice in fuel economy, but no increase in it either (see Fig. 2.6).
A key assumption is that this concern for fuel economy will not fade—again. What is driving
this demand, as discussed in Chapter 1, is the supply-side CAFÉ jump in fuel economy for 2016. All technologies, including engine, will need to be brought to bear to achieve this. Not only that, but careful system engineering will be needed, as well, to make the best use of the new engine technology developed in the last 20 years.
[1] “Light-Duty Automotive Technology, Carbon Dioxide Emissions, and Fuel Economy Trends: 1975 through 2010,” EPA-420-R-10-023, November 2010.
Hors
epow
erSe
cond
s
T-127 book.indb 35 8/24/11 9:22 AM
Downloaded from SAE International by Eric Anderson, Thursday, September 10, 2015

36 | Automotive 2030 – North America | Chapter 2
Most of these improvements will, in reality, be largely transparent to the driver. Those drivers will notice better fuel economy numbers on window stickers. Only dedicated gear-heads will know enough about what goes on under the hood to care. If these items become overly pricey, there may be consequences.
A key point about vehicle fuel economy is using the engine in the most efficient operating range of its speed / load map. How an engine is currently used results in total average efficiency being considerably worse than its peak efficiency. As Collie from IAV points out, we will probably see more improvement in overall vehicle fuel economy due to more-efficient application and usage in the near term than we will see from any given engine’s efficiency improvement only. “We also should remember that the easiest fuel economy improvement or degradation is the driver’s behavior, not vehicle engineering. Almost any vehicle on any drive cycle can have a 25% variation in fuel economy due to driving style, and this is amazing when OEMs are putting in $50–$100 (per vehicle) for each percent fuel economy,” he remarks. This may require a deeper look at modifying drivers and their behaviors rather than modifying engines.
There are two ways to ensure that if engine developers deliver a highly efficient en-gine for converting liquid fuels into energy, we use that energy most efficiently. One is in a completely different kind of energy-management system that uses electricity or hydraulics to capture and store mechanical energy and allows engineers to tune engine operation to its most efficient operating regime—in other words, hybrids.
The other has been with the industry since its inception—developing highly ef-ficient transmissions, gearing, and rolling gear to ensure that engine-out power is most efficiently used. That is the subject of our next chapter.
References[1] Van Wylen, Gordan and Richard Sonntag, Fundamentals of Classical Thermo-dynamics, John Wiley and Sons, 1976.
[2] “Assessment of Technologies for Improving Light Duty Vehicle Fuel Economy,” Committee on the Assessment of Technologies for Improving Light-Duty Vehicle Fuel Economy, National Research Council, pre-publication, National Academies of Science, 2011.
T-127 book.indb 36 8/24/11 9:22 AM
Downloaded from SAE International by Eric Anderson, Thursday, September 10, 2015

Automotive 2030 – North America | Chapter 2 | 37
[3] Ashley, Steven, “Inside Fiat’s innovative MultiAir system,” Automotive Engi-neering International, SAE International, Warrendale, PA, October 2010.
[4] Heywood, John B. and Orian Z. Welling, “Trends in Performance Characteris-tics of Modern Automobile SI and Diesel Engines,” SAE Paper No. 2009-01-1892, SAE International, Warrendale, PA, 2009.
[5] Personal Communication, Tom Read, General Motors.
[6] Murphy, Tom, “Small Displacement Engines Integrating Cylinder Shutdown,” WardsAuto.com, Oct. 4, 2010.
[7] Weissler, Paul, “Denso shows latest idle-stop technology at NAIAS,” Automotive Engineering Online, downloaded Feb. 15, 2011, http://www.sae.org/mags/AEI/9351.
[8] Ford to expand fuel-saving start-stop technology from hybrids to conventional cars, cross-overs, Ford Press Release Dated 27 December, 2010, http://media.ford.com/article_display.cfm?article_id=33737.
[9] Petersen, John, “EPA and NHTSA Predict 42% Market Penetration for Start-Stop Systems by 2016,” ALT Energy Stocks, downloaded Feb. 15, 2011, http://www.altenergystocks.com/archives/2010/04/epa_and_nhtsa_predict_42_market_penetration_for_startstop_systems_by_2016.html.
[10] Morey, Bruce, “Engineering the Ecoboost,” Automotive Engineering Interna-tional, SAE International, Warrendale, PA, August 2008.
[11] “Light-Duty Automotive Technology, Carbon Dioxide Emissions, and Fuel Economy Trends: 1975 through 2010,” EPA-420-R-10-023, November 2010.
[12] “Light-Duty Diesel Vehicles: Efficiency and Emissions Attributes and Market Issues,” U.S. EIA, Report # SR/OIAF (2009)02 downloaded 2/11/2011, http://www.eia.doe.gov/oiaf/servicerpt/lightduty/execsummary.html.
T-127 book.indb 37 8/24/11 9:22 AM
Downloaded from SAE International by Eric Anderson, Thursday, September 10, 2015

[13] “Interim Joint Technical Assessment Report: Light-duty vehicle greenhouse gas emission standards and corporate average fuel economy standards for MY 2017-2025,” September 2010.
[14] Murphy, Tom, “Mercedes Says Dirty Fuel Problematic in U.S,” WardsAuto.com, Mar. 16, 2011.
T-127 book.indb 38 8/24/11 9:22 AM
Downloaded from SAE International by Eric Anderson, Thursday, September 10, 2015

Automotive 2030 – North America | Chapter 3 | 39
Chapter Three
Vehicle Technologies and TransmissionsAn engine alone does not a car make. Wheels and tires, shock absorbers, steering mechanisms, not to mention those wonders of mechanical technology—transmis-sions—all must be engineered and packaged to make a car. All of these compo-nents have steadily improved in recent decades. This chapter explores how much more they might improve and what impact those improvements will have.While fun and safety are important, fuel economy will most likely continue as the king of concerns for the period 2010–2030. Companies will continue to refine components to wring out the last drop of fuel economy they can. This will drive lighter components, less wiring, compact X-by-wire controls, and transmissions with ever more gears—to a point.
Transmissions—harnessing engine-out powerThe purpose of a transmission and the rest of the drivetrain is to transmit the power from the engine to the road through the wheels. The transmission also helps match the needs of the vehicle with the most efficient speed and load point of the engine (see Chapter 2 Translating Engineer Speak). A variety of transmissions are in use in cars through 2010, including manuals, automatics with hydrodynamic torque converters, automated manual transmissions (AMTs), dual-clutch transmis-sions (DCTs), and continuously variable transmissions (CVTs). DCTs are a form of automatic transmission with two gearboxes operating in parallel, enabled by com-puter controls. First, third, and fifth are in one, and second, fourth, and sixth in the other. While the drive is one gear, the transmission preselects the next most likely gear in the other gearbox. The result provides the best of both worlds, a snappy
T-127 book.indb 39 8/24/11 9:22 AM
Downloaded from SAE International by Eric Anderson, Thursday, September 10, 2015
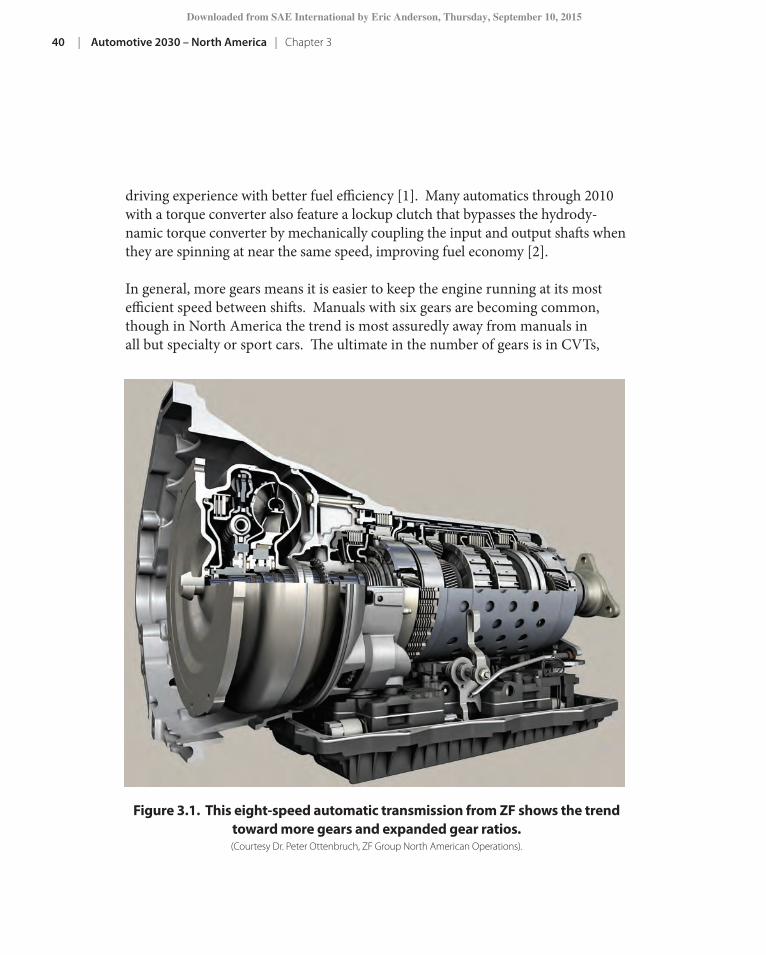
40 | Automotive 2030 – North America | Chapter 3
driving experience with better fuel efficiency [1]. Many automatics through 2010 with a torque converter also feature a lockup clutch that bypasses the hydrody-namic torque converter by mechanically coupling the input and output shafts when they are spinning at near the same speed, improving fuel economy [2]. In general, more gears means it is easier to keep the engine running at its most efficient speed between shifts. Manuals with six gears are becoming common, though in North America the trend is most assuredly away from manuals in all but specialty or sport cars. The ultimate in the number of gears is in CVTs,
Figure 3.1. This eight-speed automatic transmission from ZF shows the trend toward more gears and expanded gear ratios. (Courtesy Dr. Peter Ottenbruch, ZF Group North American Operations).
T-127 book.indb 40 8/24/11 9:22 AM
Downloaded from SAE International by Eric Anderson, Thursday, September 10, 2015
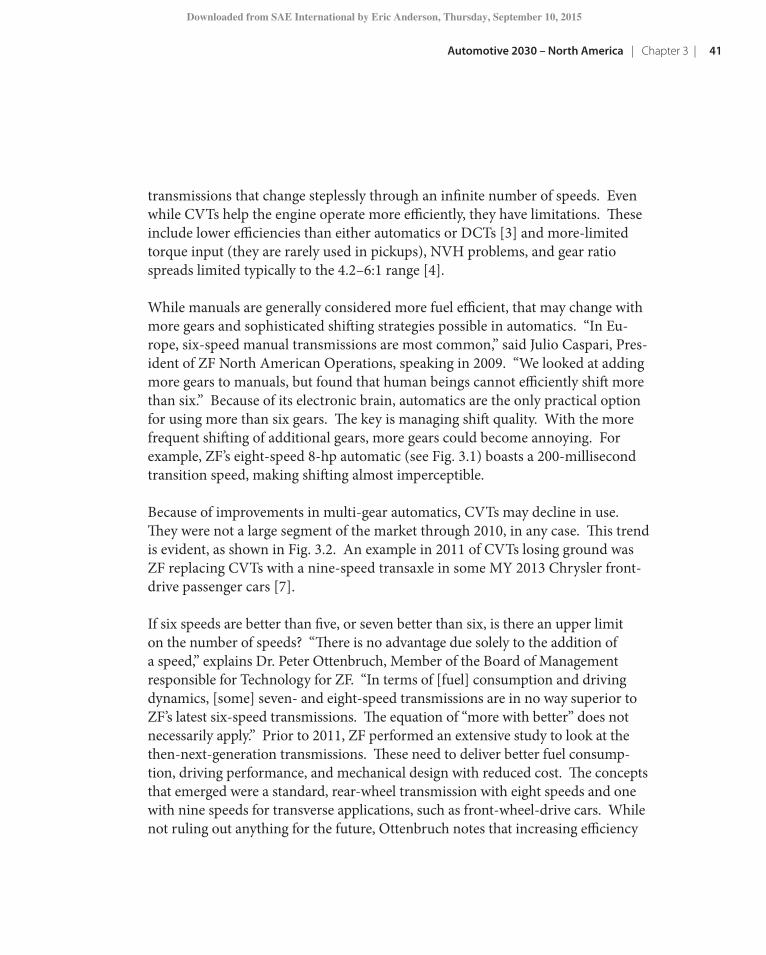
Automotive 2030 – North America | Chapter 3 | 41
transmissions that change steplessly through an infinite number of speeds. Even while CVTs help the engine operate more efficiently, they have limitations. These include lower efficiencies than either automatics or DCTs [3] and more-limited torque input (they are rarely used in pickups), NVH problems, and gear ratio spreads limited typically to the 4.2–6:1 range [4].
While manuals are generally considered more fuel efficient, that may change with more gears and sophisticated shifting strategies possible in automatics. “In Eu-rope, six-speed manual transmissions are most common,” said Julio Caspari, Pres-ident of ZF North American Operations, speaking in 2009. “We looked at adding more gears to manuals, but found that human beings cannot efficiently shift more than six.” Because of its electronic brain, automatics are the only practical option for using more than six gears. The key is managing shift quality. With the more frequent shifting of additional gears, more gears could become annoying. For example, ZF’s eight-speed 8-hp automatic (see Fig. 3.1) boasts a 200-millisecond transition speed, making shifting almost imperceptible.
Because of improvements in multi-gear automatics, CVTs may decline in use. They were not a large segment of the market through 2010, in any case. This trend is evident, as shown in Fig. 3.2. An example in 2011 of CVTs losing ground was ZF replacing CVTs with a nine-speed transaxle in some MY 2013 Chrysler front-drive passenger cars [7].
If six speeds are better than five, or seven better than six, is there an upper limit on the number of speeds? “There is no advantage due solely to the addition of a speed,” explains Dr. Peter Ottenbruch, Member of the Board of Management responsible for Technology for ZF. “In terms of [fuel] consumption and driving dynamics, [some] seven- and eight-speed transmissions are in no way superior to ZF’s latest six-speed transmissions. The equation of “more with better” does not necessarily apply.” Prior to 2011, ZF performed an extensive study to look at the then-next-generation transmissions. These need to deliver better fuel consump-tion, driving performance, and mechanical design with reduced cost. The concepts that emerged were a standard, rear-wheel transmission with eight speeds and one with nine speeds for transverse applications, such as front-wheel-drive cars. While not ruling out anything for the future, Ottenbruch notes that increasing efficiency
T-127 book.indb 41 8/24/11 9:22 AM
Downloaded from SAE International by Eric Anderson, Thursday, September 10, 2015

42 | Automotive 2030 – North America | Chapter 3
Figure 3.2. The trends in transmission types as reported to the EPA in the years 1980 through 2010. M3, M4, M5, and M6 are 3-, 4-, 5- and 6-speed manual
transmissions. A3 are 3-speed automatics without lockup clutches. L4, L5, and L6 are 4-, 5- and 6-speed automatic transmissions with lock-up clutches. CVTs
are shown; however, the EPA does not report DCTs separately as of 2010. (Source: U.S. Environmental Protection Agency).
T-127 book.indb 42 8/24/11 9:22 AM
Downloaded from SAE International by Eric Anderson, Thursday, September 10, 2015

Automotive 2030 – North America | Chapter 3 | 43
as dramatically as the change from six- to eight-speed automatic transmissions will not be possible with more gear steps. “If there was an ideal transmission, with our current solutions [from ZF] we are only about 11% away from it in any case,” he remarked.
Transmission trends to watch for:
• Expecttransmissionsforgasolineanddieselenginestocontinuetoim-prove in efficiency; however, more slowly than the period 1980–2010. Automatics will see increasingly sophisticated control systems, more ag-gressive lockup clutch mechanisms, higher gear ratios, and nine or ten speeds appearing in the period 2015 or so. Since transmissions are already efficient, nine and ten gears will most likely be the upper limit on what is achievable in current architectures.
• CurrentDCT’ssixspeedswillseeadditionalapplicationsofsevenandeightspeeds continuing to grow past 2011. Nine- and even ten-speed DCTs may be introduced by 2015, but the viability of these remains uncertain.
• Ifcurrenttrendscontinue,CVTswilllikelycontinuetoremainasmallshare of the market, used primarily in smaller vehicles.
Aerodynamics and rolling resistance—getting the most from the carAnother way to increase fuel efficiency is by reducing the road load from aerody-namic drag and rolling resistance. Aerodynamic load is important at high speed —one rule of thumb is that for cars at 50–60 mph, roughly 50% of total drag is due to aerodynamics, depending on weight, size, and aerodynamic styling [8]. Reduc-ing aerodynamic drag, termed CD by automotive engineers, constrains design-ers (see Where does it all go?). This does not necessarily mean an ugly or boring vehicle. There are two approaches to delivering low aerodynamic drag in a stylish package. One is to highlight it, such as a purpose-built vehicle fully optimized for aerodynamics. Examples of this are the Toyota Prius or the Honda Insight. The other is to refine traditionally shaped sedans to deliver efficient aerodynamic designs. Some companies in Europe have done this effectively. “[This is] very
T-127 book.indb 43 8/24/11 9:22 AM
Downloaded from SAE International by Eric Anderson, Thursday, September 10, 2015
44 | Automotive 2030 – North America | Chapter 3
similar to our approach that we have taken at Ford. It has been around optimiz-ing traditional shapes as opposed to a purpose-designed aerodynamic silhouette,” said Paul Mascarenas, Ford’s VP of Engineering for global product development, speaking in 2009 [9]. Like in practically every other area of automotive engineer-ing, aerodynamics will be greatly improved by increasing the use of computer simulations and computational fluid dynamics [10].
The other element of road load is rolling resistance, CR, a function of the effec-tive weight of the vehicle and variables such as tire pressure, caster, camber, road speed, and resistance of the tires themselves. Other negative impacts include stylish large tires or ones designed for off-roading. Since a typical car rolling re-sistance is 5–15% from tires alone, expect the industry to continue pursuing even more efficiency. Tire engineers do this by replacing some of the standard carbon black with silica to cut rolling resistance. For example, Goodyear announced in April 2009 their new Assurance Fuel Max tire that boasts 27% less rolling resis-tance, which the company equates to a 4% improvement in fuel economy in high-way driving. According to Goodyear, many fuel-efficient tires today depend on replacing carbon black material with silica in the tread compound, either in part
Not surprisingly, fuel efficiency requires looking at the whole vehicle. What might be surprising is how important it is. A number of studies show that a conventionally fueled car uses only 12–15% of available energy to move. The rest is waste. Understanding where that waste energy goes is by no means an exact science. The vast bulk of losses are through thermal and chemical inefficiencies in the combustion process. That means that of what is left, how to use it efficiently is vital.
We know that most cars get better gas mileage on the highway than in stop-and-go city driving. Through 2010, the EPA measured fuel economy in specific cycles of vehicle speeds, from 0 to 60, over defined time periods. In the urban cycle, energy lost in accelerating and stopping the mass of the vehicle
dominates; in the highway cycle, aerodynamic drag dominates. Aerodynamic load is important at high speed—one rule of thumb is that for cars at 50–60 mph, roughly 50% of total drag is due to aerodynamics, depending on weight, size, and other aerodynamic styling. Aerodynamic drag is measured with a coefficient of aerodynamic drag (CD), 1.0 is for a flat plate perpendicular to an airstream, 0.0 is for a body with no drag. For reference, recent studies show that the CD for sedans is 0.33, for SUVs is about 0.43, and for pickups is about 0.48 [1]. Toyota’s 2010 Prius boasts a CD of 0.25, which contributes appreciably to reduced losses at highway speeds.
[1] Yang, Z. and B. Khaligi, “CFD simulations for flow over pickup trucks,” SAE Paper No. 2005-01-0547, SAE International, Warrendale, PA, 2005.
Where does it all go?
Downloaded from SAE International by Eric Anderson, Thursday, September 10, 2015

Automotive 2030 – North America | Chapter 3 | 45
or in total, to minimize rolling resistance. Other advanced models are off ered from Bridgestone, Toyo, Continental, and BF Goodrich [11]. At least one group believes that overall, tire companies will deliver something like 1.5–1.65% less CR per year through 2025 [12].
Aerodynamic and road-load trends to watch for:
• Sinceaerodynamicsathighwayspeedscontributesoheavilytofueleconomy, look for cars with smooth, round, aerodynamic front ends with a sharp cut-off at the back. Vehicles will begin to look more alike, with more subtle cues along with grillwork and badges defi ning the diff erences between brands.
Replacing hydraulics and mechanicals with wireTh ere are advantages to replacing mechanical linkages and controls with electron-ics. Electronics consume less power (think fuel effi ciency) and space (think more legroom.) Th ey are also evolving as a key enabler in smart driving functions,
Fig. 3.3 Estimates for energy losses in a vehicle vary, depending on the vehicle and how it is driven.
Engine losses due to thermal waste, combustion = 60 – 80%
Accessories = 2 – 4% (power windows, etc.)
Drivetrain combined = 5 – 7 % (Torque converter, transmission, transfer case, differential)
Aero Drag = 12 – 20%
Rolling Resistance = 16 – 20%
T-127 book.indb 45 8/24/11 9:22 AM
Downloaded from SAE International by Eric Anderson, Thursday, September 10, 2015

46 | Automotive 2030 – North America | Chapter 3
when combined with improved sensors, computers, and algorithms. A general term for replacing a hydraulic or mechanical linkage with electronic control sys-tems is “X-by-wire.” These generally include [13]:
• throttle-by-wire—practicallystandardonallnewvehiclesby2010• shift-by-wire—commoninautomatictransmissions• brake-by-wire—purelyelectricallycontrolledbrakesarefew,although
electronic control of braking through antilock braking systems is common• steer-by-wire—noreportedapplicationsasof2009,althougharelated
technology known as electric power-assisted steering (EPAS) is a move in that direction
EPAS provides variable-rate and variable-damping suspension systems to enhance handling, changing the rate of steering to match the speed of the car—less when driving on the highway, more when driving slowly or cutting the wheel hard to park. EPAS systems are not true by-wire systems because an electric motor assists a mechanical linkage, such as rack-and-pinion. Even as a mechanical / electrical hybrid, EPAS is a key enabler for more autonomous driving such as active park as-sist [13]. They consume power only when actually steering, improving fuel econ-omy. “Concerning steer-by-wire for cars, further development is more dependent on legislation than on technical issues. Its implementation in road vehicles is lim-ited by concerns over reliability and safety, although it has been demonstrated in several concept vehicles,” says ZF’s Ottenbruch.
Controlling vehicle and powertrain systems is done through electronic control units (ECUs). These tend to be small, dedicated computer units. They take in-put signals provided by sensors or switches of various forms, condition the sig-nals, and generate action signals. As a simple example, you press a button to roll down the window, releasing it half way. The ECU for the window gets the signal from the switch, activates the window motor, and stops it when you release the button. Multiply this for every action in the car—lights, stereo, various chassis functions, engine controls, transmission—and you realize there are a lot of these in a modern car.
This complexity in vehicle computers is a concern. Each car now contains mil-lions of lines of code, with some cars containing 70 or more individual ECUs. A
T-127 book.indb 46 8/24/11 9:22 AM
Downloaded from SAE International by Eric Anderson, Thursday, September 10, 2015

Automotive 2030 – North America | Chapter 3 | 47
typical car in 2009 contained roughly 100 kg (220 lb) of electronics and 2 km (1.3 mi) of wiring [13]. This leads to a fundamental discussion between distributed architectures, with individual sensors, switches, and ECUs controlling isolated functions vs. centralized systems with fewer, general-purpose computers con-trolling many functions. Distributed architectures tend to be more reliable and cheaper to engineer, but lead to vehicle complexity, component cost, and weight. Centralized architectures tend to be more difficult to engineer and less reliable (meaning more testing), but lighter and cheaper overall for components. Multiple network architectures categorized into diagnostics, airbag, mobile me-dia, X-by-wire, and wireless is one plausible way of combining functions into something manageable and cost effective [14]. However, this tension between distributed and centralized architectures will be an important discussion among automotive electrical engineers.
Remarkably, compared to our collective experience with home PCs, automotive software reliability problems crop up rarely. There was a noticeable hick-up with Toyota’s Prius in the fall of 2006, but for the most part our cars, trucks, and SUVs work, as we desire. Electronics has given us comfort, improved fuel economy, and enhanced safety. Perception remains an issue, as demonstrated again with the Toy-ota unintended acceleration drama that played out in 2010 and 2011, with NASA finally putting to rest the notion that electronics contributed to the problem.
For the near future through 2030, there seems no limitation on ECU, computing power, or networking complexity to provide continued growth of smarter driving through computerization.
Another significant trend in vehicle technologies is the continued electrification of key functions, such as EPAS and various X-by-wire components. While useful in saving weight and increasing fuel economy, it also means they can be connected to computers. As we will see in Chapter 9, EPAS was a key enabler in developing autonomous parallel parking algorithms. These devices enable a smarter car.
T-127 book.indb 47 8/24/11 9:22 AM
Downloaded from SAE International by Eric Anderson, Thursday, September 10, 2015

48 | Automotive 2030 – North America | Chapter 3
References[1] For more information on dual-clutch transmissions, see the website http://www.dctfacts.com/information/how-the-dual-clutch-transmission-works.aspx.
[2] Happian-Smith, ed., An Introduction to Modern Vehicle Design, SAE Interna-tional, Warrendale, PA, 2002.
[3] “Assessment of Technologies for Improving Light Duty Vehicle Fuel Economy,” Committee on the Assessment of Technologies for Improving Light-Duty Vehicle Fuel Economy, National Research Council, pre-publication, National Academies of Science, 2011.
[4] Brooke, Lindsay, “ZF’s new nine-speed automatic to replace CVTs in 2013 Chrys-lers,” Automotive Engineering Online, SAE International, Warrendale, PA, Jan. 2011.
[5] DCTFacts.com, downloaded March 8, 2011, http://www.dctfacts.com/infor-mation/wet-clutch-or-dry-clutch.aspx.
[6] Ford Press Release, “Ford to Introduce Fuel-Efficient Dual-Clutch Powershift Transmission in North American in 2010,” Jan 21, 2009.
[7] Brooke, Lindsay, “ZF’s new nine-speed automatic to replace CVTs in 2013 Chryslers,” Automotive Engineering Online, SAE International, Warrendale, PA, Jan. 2011.
[8] Hucho, Wolf-Heinrich, ed., Aerodynamics of Road Vehicles, 4th Edition, SAE International, Warrendale, PA, 1998.
[9] Morey, Bruce, “Everything but the engine,” AEI, SAE International, Warren-dale, PA, July 2009.
[10] Duncan, B., Satheesh Kandasamy, Khaled Sbeih, Todd H. Lounsberry, and Mark E. Gleason, “Further CFD Studies for Detailed Tires using Aerodynamics Simulation with Rolling Road Conditions,” SAE Paper No. 2010-01-0756, SAE In-ternational, Warrendale, PA, 2010.
T-127 book.indb 48 8/24/11 9:22 AM
Downloaded from SAE International by Eric Anderson, Thursday, September 10, 2015

Automotive 2030 – North America | Chapter 3 | 49
[11] Ashley, Steven, “Treading lightly,” AEI, SAE International, Warrendale, PA, June 1, 2010.
[12] Kasseris, E. P. and J. B. Heywood, “Comparative Analysis of automotive pow-ertrain choices for the next 25 years,” SAE Paper No. 2007-01-1605, SAE Interna-tional, Warrendale, PA, 2007.
[13] Miller, Peter, “Future Trends in X-by-Wire systems,” Paper in SAE book, X-By-Wire Automotive Systems, SAE International, Warrendale, PA, 2009.
[14] Lupini, Christopher, “In-vehicle Networking Technology for 2010 and Be-yond,” SAE Paper No. 2010-01-0687, SAE International, Warrendale, PA, 2010.
T-127 book.indb 49 8/24/11 9:22 AM
Downloaded from SAE International by Eric Anderson, Thursday, September 10, 2015

T-127 book.indb 50 8/24/11 9:22 AM
Downloaded from SAE International by Eric Anderson, Thursday, September 10, 2015

Automotive 2030 – North America | Chapter 4 | 51
Chapter Four
Vehicles on a Diet—Using Lighter, Stronger MaterialsHow important is vehicle weight? It might pose the ultimate dilemma for auto-motive engineers. For fuel efficiency, a lighter vehicle stretches gasoline farther. Various studies have shown that a vehicle weight reduction of 10%—with an ap-propriate engine resizing—translates to anywhere from 6–8% improvement in fuel efficiency. The dilemma is that other priorities drive heavier vehicles—why? Au-tomakers add additional safety and convenience features, both to meet regulations and to match competition. Consumers prefer larger and more spacious vehicles. Whenever lightweighting technologies reduce weight, consumers want more—more safety equipment, more power from their engines, and more room inside.
North American vehicles are in a class of their own compared to the rest of the world, notes Richard Schultz, Managing Director for Automotive Materials with Ducker Worldwide. Even though North American light vehicles topped out at 4018 lb (1822 kg) in 2004 and lightened up to an average 3828 lb (1736 kg) in 2009, they remain about 700 lb (317 kg) heavier than vehicles in the rest of the world.
History shows that when fuel prices get dicey, vehicles go on a diet. Just note that in 1976, when only about 25% of all light vehicles were trucks, the average weight of all vehicles was a portly 4059 lb (1841 kg). What trimmed that bloat in the period from 1976 to 1986 were the CAFE regulations and the push for fuel economy. When gas got cheap in the 1990s, it was as if switching cars from a diet of salad to McDonalds—up went the weight. So it goes, and so it will for alternative-powered cars as well. There will always be a tension in design
T-127 book.indb 51 8/24/11 9:22 AM
Downloaded from SAE International by Eric Anderson, Thursday, September 10, 2015

52 | Automotive 2030 – North America | Chapter 4
between maintaining light weight for fuel economy and adding weight for space, equipment, and functionality.
The current motivation for manufacturers to invest in lightweighting is the set of CAFE regulations that took effect in April 2010. No one at the time of this writ-ing seems to doubt that the industry can meet the new stringent regulations that take effect through 2016. Also, no one doubts it will involve reducing weight. The big-bang parts of the car that can benefit the most from lightweighting include the body-in-white (BIW)1, interiors (think seats or instrument panels), powertrain, and closures (think doors or hoods.) Here is a look at the possibilities of lighter raw materials.
While a number of materials have proven themselves in lightweighting applica-tions, more are under development. Still more have proven themselves in other applications, such as aerospace, but are not economical in automotive.
Lightweight aluminumOne obvious answer to lightweighting is to use a lighter material, such as alumi-num. In general, aluminum alloys are not as strong and are usually more expen-sive per pound compared to steels. To look at broad trends over many years, it is not useful to dwell on absolutes of pricing. Raw material prices can be volatile. For example, in the closing years of the first decade of this century, aluminum’s cost ratio compared to cold-rolled carbon steel trended generally downward, but remained two to three times higher, with frequent fluctuations in that ratio. There is no reason to expect this to change.
It is important to remember that replacing mild steel with aluminum to reduce weight has an added dollar discount. Prices for metals are on a per-pound basis. So, a hood that replaces 80 lb (36 kg) of raw steel sheet with 40 lb (18 kg) of raw aluminum sheet—even if aluminum is three times the price—may end up costing only 50% more.
Aluminum is a big part of the mix in 2010. According to data from the Alumi-num Association, Inc., a trade group, the amount of aluminum in cars grew from
1Body-in-white generally refers to the structure of the car body prior to painting, without en-gine, transmission, or chassis components.
T-127 book.indb 52 8/24/11 9:22 AM
Downloaded from SAE International by Eric Anderson, Thursday, September 10, 2015

Automotive 2030 – North America | Chapter 4 | 53
an average 81 lb (37 kg) in 1973 to 326 lb (148 kg) in 2009. In 2009, 144 vehicles worldwide each used more than 400 lb (181 kg) of aluminum. Many such vehicles were high-volume models, not high-end luxury models, noted Randall Scheps, Chairman of the Aluminum Association’s Auto and Light Truck group, also the Marketing Director, Ground Transportation for Alcoa. Powertrain components are by far the biggest user of aluminum—60% of aluminum used in automotive is in powertrain components, according to Ducker Worldwide. “Aluminum’s suc-cesses are in components such as heat exchangers, pistons, transmission cases, and cylinder heads,” noted Scheps. For these parts, worldwide, almost 100% of com-ponents are made of aluminum, according to him. While grabbing a large share of wheels, engine blocks, and drive shafts, he sees growth for aluminum in producing knuckles, hoods, control arms, and bumpers. Most of these components are cast engine blocks and cylinder heads, where aluminum makes an ideal, one-for-one replacement for cast ferrous metals. “Of the average 324 lb of aluminum used in today’s automobiles, 80% is castings,” explains Shultz, putting aluminum’s usage in perspective. Most of the steel is sheet metal, according to him.
How do trends in the period 2010-2030 look for aluminum? “The next frontier for aluminum is in body-in-white structures,” states Scheps. Engine hoods are alumi-num’s first beachhead into this domain. In MY 2010, about 25% of all hoods were made of aluminum, with some experts expecting this to reach nearly 100% even-tually. There are some good reasons for this. Primary is the fact that aluminum, while lighter, is not as strong as steel (but the hood is not integral to crash safety), although aluminum might help in pedestrian protection. Down-gauging to stron-ger steel may not provide the benefits required to make it worth the greater weight.
Developing the expertise and manufacturing capacity to use aluminum in such applications requires an investment. Stamping and sheet metal forming are com-pletely different processes than casting, not only in tooling specifically designed for aluminum, but also in the engineering expertise required. Some aluminum alloys rival mild steel in strength, including the 6111 or 6022 with yield strength2 of 240 MPa, which compares well to a mild steel of about 180 MPa [1]. Figure 4.1 compares the strength and elongation values for different metals.
2Yield strength is the point at which the metal begins to deform irreparably, on its way to break-ing. Tensile strength is the highest strength a material will show, which is typically after it be-gins deforming and just before it begins to rupture.
T-127 book.indb 53 8/24/11 9:22 AM
Downloaded from SAE International by Eric Anderson, Thursday, September 10, 2015

54 | Automotive 2030 – North America | Chapter 4
Formability is where aluminum differs. Formability is how much the metal can stretch in a die or fabrication operation without rupturing. Aluminum has roughly two-thirds the formability of low-carbon mild steel, according to Scheps. This means stamping or forming operations that require deep drawing, stretching, and bendability must be addressed differently. Differences also occur in spring-back, with an elastic modulus (Young’s modulus) roughly one-third that of steel [1]. The expertise and empirical models for springback based on mild steels no longer apply. It should be noted that aluminum companies, like Alcoa Automo-tive, have developed an extensive database of engineering data to help end-users design with their products.
Joining aluminum is generally different from steels, as well. Engineers use adhesives, continuous fusion-welded joints instead of spot welding, and self-piercing rivets. Because aluminum does not stretch as well as steel, engineers need to design hemming operations, which are common in bodywork specifically for aluminum.
Figure 4.1. Notional comparisons of strengths and elongations of different metals.
(Courtesy Randall Scheps and Dr. Dietrich Wieser, Alcoa Aluminum).
T-127 book.indb 54 8/24/11 9:22 AM
Downloaded from SAE International by Eric Anderson, Thursday, September 10, 2015
Automotive 2030 – North America | Chapter 4 | 55
Trending to the future, one should expect new materials and new alloys as alumi-num suppliers attempt to keep pace with “competitor materials.” Scheps points out that 5xxx series aluminums (Al-Mg alloys) and 6xxx series (Al-Mg-Si) have traditionally been used in automotive. To add to their offerings, the high-strength 7xxx series (Al-Zn) normally used in aerospace is now a choice aluminum com-panies are offering. One such example is Kaiser Aluminum’s introduction in 2010 of a new 7033 alloy for high-performance forged parts (not body stampings), re-portedly 60% stronger than the typical 6061 aluminum alloy used. The company tailored the formulation to achieve the corrosion resistance needed for automotive chassis parts.
Because it is less stiff than the typical steel, aluminum also requires some design accommodations when noise, vibration, and harshness (NVH) is an issue. For instance, one could use a thicker part (up-gauging) made of lighter aluminum and still have a stiff, somewhat lighter part that meets NVH requirements.
Trends to look for through 2030 include increased use of aerospace-grade alumi-nums, such as 7xxx series, in the automotive industry. Also, look for increased use of aluminum in areas not dominated by strength, such as hoods, with the possible addition of other closures such as doors and even some body parts.
With most engine components already in aluminum by 2010, further lightweight-ing of powertrain components will depend on the ability of magnesium to substi-tute for aluminum for transmission cases and possibly small engine blocks.
Steel and bodiesWhile mild steel now constitutes about half the weight of an average vehicle, its steady replacement with advanced formulations of steel alloys has been going on for at least the last 20 years. The steel companies both recognized the need for automobiles to get lighter and were perhaps a bit worried about inroads by aluminum, plastics, and other metals such as magnesium. They responded with the development of high-strength steels (HSS) and advanced high-strength steels (AHSS). Practically every strategy for future lightweighting of vehicle auto bodies now involves increased use of these new steels in body structures, replacing lower-strength mild steels in crash-critical components.
T-127 book.indb 55 8/24/11 9:22 AM
Downloaded from SAE International by Eric Anderson, Thursday, September 10, 2015

56 | Automotive 2030 – North America | Chapter 4
What do they mean by high-strength? Generally, HSS steel has a yield strength greater than 210 MPa or a tensile strength greater than 270 MPa [2]. The indus-try now offers quite a range of choices in materials with yield strengths above 270 MPa. Iron alloyed with both carbon and manganese makes a form of HSS, carbon-manganese (CMn). High-strength low-alloy (HSLA) steels generally con-tain microalloying elements such as titanium, vanadium, or niobium to increase strength. This is done in small amounts, hence the term “low-alloy.” Other ele-ments are sometimes added to extend strength. For even more choice, the steel industry developed AHSS. These steels have names such as dual phase (DP), com-plex phase (CP), or transformation-induced plasticity (TRIP), which provide en-hanced stretching (though not bending [2] or stiffness). DP steel consists of a fer-rite matrix containing a second hard phase, usually martensite. Martensitic steel (MS) consists solely of martensite. It is exceptionally strong, although it features much-reduced elongation. The industry has developed additional higher-strength steels with names such as ferritic-bainitic, twinning-induced plasticity (TWIP), hot-formed, and post-forming heat-treated steels. These are not your parents’ steels anymore.
A general measure of formability and ductility of a metal is its percent elonga-tion as measured in a stress-strain test. The higher the percent elongation, the more ductile a material is. As is shown in Fig. 4.2, the higher-strength advanced steels—some approaching 1200 MPa yield strength—in general have lower ductil-ity than the common steels. Here is the opportunity and the issue. High strength in general reduces formability and weldability. It also produces higher springback and other headaches for body engineers and tool designers. The tradeoff is that less steel provides the same strength (but not stiffness). It provides the same load bearing and crash safety with a thinner gauge of steel—voila, lightweighting.
This is a continuation of a trend that really kicked off in 1994. Back then, a group of 35 steel companies worldwide demonstrated the usefulness of AHSS with the Ultra Light Steel Auto Body (ULSAB) program, a demonstrator steel auto body [3]. This led to the use of HSS and AHSS steels in a number of production ve-hicles by 2010. For example, the MY 2009 Ford 150 body contains 16% by weight of AHSS. Some vehicles are using an even higher percentage of AHSS—the MY 2009 BMW X6 reportedly uses 32% AHSS in its BIW and closures [4].
T-127 book.indb 56 8/24/11 9:22 AM
Downloaded from SAE International by Eric Anderson, Thursday, September 10, 2015

Automotive 2030 – North America | Chapter 4 | 57
Figure 4.2. The steel industry continues to develop new types of AHSS steels. Current exotic steels such as TWIP are generally too expensive
for widespread use because of heavy alloying.(Courtesy Ronald P. Krupitzer, Steel Market Development Institute).
Not only were they used by 2010, the steel industry produced literally dozens of these seemingly exotic grades of steels. Expect more as the steel industry extends its research to develop cost-eff ective, high-strength steels. According to the Steel Market Development Institute, new steels currently under development will ex-tend formability while increasing strength as they reduce the amount of exotic and expensive alloys.
Th e Steel Market Development Institute funded a new program to show off the use of more exotic steels, some invented in 2008-2010, called the Future Steel Vehicle (FSV). Several key take-aways from this program are relevant to mention. Th ey used 23 diff erent grades of advanced steels in the FSV program. Th e program
w w w . s m d i s t e e l . o r g
Elo
ngat
ion
(%)
Tensile Strength (MPa)
0
10
20
30
40
50
60
70
0 600 1200 300 900 1600
MART
HSLA
IF
Mild IF - HS
BH
ISO
-
BH
3rd Generation AHSS
New 3rd Generation AHSS Grades Offer Another 10 % More Mass Reduction with AHSS, that is over 35% for 2017-2025 time period.
T-127 book.indb 57 8/24/11 9:22 AM
Downloaded from SAE International by Eric Anderson, Thursday, September 10, 2015

58 | Automotive 2030 – North America | Chapter 4
demonstrated 17 manufacturing options, from conventional stamping to laser-welded tube profiled sections. As the strength of these steels increases, so does the manufacturability challenges. “Steel is currently 65% of a total car, and our goal in the steel industry is for that to remain or even grow,” remarked Ron Krupitzer, Vice President Automotive Applications of the Steel Market Development Insti-tute, a business unit of the American Iron and Steel Institute (AISI). “To do that (in the future) steel needs to remain the best overall materials choice for manufac-turability, cost, mass, and carbon footprint. Steel must continue to reinvent itself in the form of new high-strength automotive grades with increasing mass reduc-tion potential as far as we can see into the future.”
As noted, while HSS and AHSS steels are quite a bit stronger, they are often no more stiff than the mild steels they replace. A fundamental physical limit applies to increasing stiffness (Young’s Modulus) even while increasing strength. This re-quires careful selection of the type of steel used, its gauge, and its geometric design to match the stiffness of thicker, heavier, mild steel it might replace. These facts are important when piecing the whole picture together.
Composites and plasticsPlastics and composites are other materials considered for lightweighting. Plas-tics, also called resins or polymers, come in three broad flavors: thermosets, elas-tomers, and thermoplastics [5]. Thermosets have cross-linked polymers that are formed when cured. The cure can be set through heat, chemical reaction such as a two-part epoxy, or more exotic means. Thermoplastics are solids at room temper-ature, but are melted when placed into a mold, hot, and then are allowed to cool. As one industry expert explained thermoplastics succinctly, “you heat it, squeeze it, and freeze it...” The final broad category is elastomers, called elastic polymers (think rubber). They can be either thermoset formed (most common) or thermo-plastic. These are most useful in sealants, gaskets, and hoses. Thermosets are typi-cally rigid and strong, thermoplastics typically a little less so, and elastomers much less so.
Plastics by themselves lack the strength for most structural applications. They are nevertheless useful. Applications include fuel tanks, interior roofs, dashboards, and bumper fascia. Other uses are air handling components, engine covers, and
T-127 book.indb 58 8/24/11 9:22 AM
Downloaded from SAE International by Eric Anderson, Thursday, September 10, 2015
Automotive 2030 – North America | Chapter 4 | 59
various pans [6]. According to the same source, interiors make up the largest use of plastics in automobiles. As of 2003, the typical passenger car contained 7.6% plastics and plastic composites.
Plastics and composites are sometimes used on exterior body panels as well. For instance, composite body panels are attached to a space frame that bears the load. The Chevy Corvette is a now classic example of this, as well as parts of many of the original Saturn models. A particularly useful subset of the composite industry produces compression-molding compounds frequently used in the automotive in-dustry. Termed Bulk Molding Compounds (BMC) or Sheet Molding Compounds (SMC), these are typically thermosets produced in sheets in a roller process [5]. SMCs are formed by mixing resin with chopped reinforcements, such as fiberglass, that are unordered and random in the mix. The Chevy Corvette’s body panels were made of SMC, as are many truck bed liners. It is a process ideal for high-vol-ume production. Commercial vehicles and heavy trucks often use such materials in hoods and fenders. SMC is placed in a heated press-mold, cured in the mold, and released.
Could structural applications use composites? Tough fibers in a plastic matrix greatly add strength, stiffness, and reduce or eliminate thermal expansion. Typical filaments used are glass fibers, with carbon fibers often discussed in engineering applications. Often getting the attention of engineers concerned with lightweight-ing is the increasing use of carbon-fiber-reinforced plastics (CFRP) composites in the aerospace industry. High-strength, thermoset CFRP is a major structural component of the new Boeing 787 and Airbus X350 airplanes, along with the new F-35. It is also in the F-22 and F-18. If aerospace adopted CFRP to save weight and increase fuel economy in structural components, why should not automotive adopt it? It offers lightweight strength. The parts can be complex. Parts can be consolidated—where once there were many, there can be a few larger parts.
Companies do offer such materials for use in automotive applications. Formula One and NHRA “funny car” owners have long built their racecar bodies of CFRP. There is a downside—cost. The cost-benefit for racers is clear, but for the general automaker, not so much. Cost has two elements: the manufacturing expense and the base cost of the material.
T-127 book.indb 59 8/24/11 9:22 AM
Downloaded from SAE International by Eric Anderson, Thursday, September 10, 2015
60 | Automotive 2030 – North America | Chapter 4
The fact that aerospace is pioneering structural CFRP may actually be a hindrance to its use by automakers. The aerospace industry builds airplanes in 10s to 100s per year; automobile companies build cars in the 10,000s to 100,000s per year. For example, the aerospace industry uses automated placement machines. These lay individual narrow strips of fiber in precise patterns on a tool that then goes into an autoclave. Autoclave pressures drive out voids in the material that can weaken the material. Temperatures reach 356°F (180°C) and pressures up to 100 psi (689 kPa) in these devices. Curing times can last as long as 12 hours.
Other common fabrication methods include using preimpregnated sheets of car-bon fiber (CF) called prepreg, or laying dry sheets of carbon fiber into a mold, injecting with resin, and curing it in the mold. These molds are also sometimes autoclave cured.
The raw materials are expensive as well. According to C. David Warren of Oak Ridge National Laboratory, carbon fiber has been as expensive as 20 times the price of steel, per pound. In 2010, prices went down to as low as nine times the price of steel, with fluctuations and price spikes expected in the next decade. Also, since precursors used to make carbon fibers are made of petroleum, the price of carbon fiber tends to follow the price of oil. The process of converting the precur-sors into carbon fiber is energy intensive. These two facts are “counter indicative” if the whole point of lightweighting is to reduce dependence on petroleum.
Warren adds to the list of challenges, including the lack of capacity in the carbon fiber industry. It is unlike aluminum. Aluminum is so pervasive in other indus-tries, such as beverage cans, that using it in automotives will not stress aluminum supplies. Automotive aluminum will not make up a significant fraction of the total. This is not so for CFRP. In 2010, using only 6 lb of CFRP per car in North America alone would consume the world supply of carbon fiber, according to Warren.
Lack of innovation is another issue. Because the aerospace industry first used it in such quantities, Warren points out that this actually prohibits rather than pro-motes incremental improvement. “The process for flight-certifying a material is so long and lengthy that most users are happy to stick with a proven material,” explains Warren.
T-127 book.indb 60 8/24/11 9:22 AM
Downloaded from SAE International by Eric Anderson, Thursday, September 10, 2015

Automotive 2030 – North America | Chapter 4 | 61
Another fact Warren is unequivocal about: the eventual price of carbon fiber needs to be about $5/lb in 2010 dollars to meet the needs of the automotive industry.
Even so, it has its benefits. Research showed that a BIW structure with an optimal use of CFRP at that price could achieve a 50% weight savings over today’s con-ventional BIW. What could reduce costs in the 2010-2030 time period? Warren points out four specific trends to watch:
1. Scale of Operations. Scaling up reduces cost.
2. Cheaper precursors. Half the current cost of CF is in the polyacrylonitrile (PAN), pitch, or rayon precursors that are heated and processed into CF. The emergence of cheaper precursors could help significantly.
3. Conversion processes that use less energy than today.
4. Streamlined processing. The current industry, oriented toward aerospace and race cars, is fragmented, with small players adding value in small parts with lots of shipping and refrigeration along the way. It is a model that is a hindrance in mass automotive.
Finally, there is the cultural and investment capital required to make a switch to CFRP. As David Stewart, CEO of Zoltek Automotive, a producer of carbon fiber, relates in an August 2010 interview with Composite Manufacturing Magazine, those manufacturing difficulties may be a significant hurdle. “Composites are a challenge for material substitutions because the technology required to manufac-ture composites differs so much from the traditional materials they replace. The design and manufacturing infrastructure both change, and that makes it challeng-ing for existing capital industries to change over from one material to another,” remarked Stewart [7] in that Q&A. “...it requires a substantial investment. There’s not a lot of existing capacity out there that is drop-in and ready for a significant shift toward lightweight composites.”
That investment may be worthwhile if the price of the raw materials, especially carbon fiber, drops. How much, is the question.
T-127 book.indb 61 8/24/11 9:22 AM
Downloaded from SAE International by Eric Anderson, Thursday, September 10, 2015
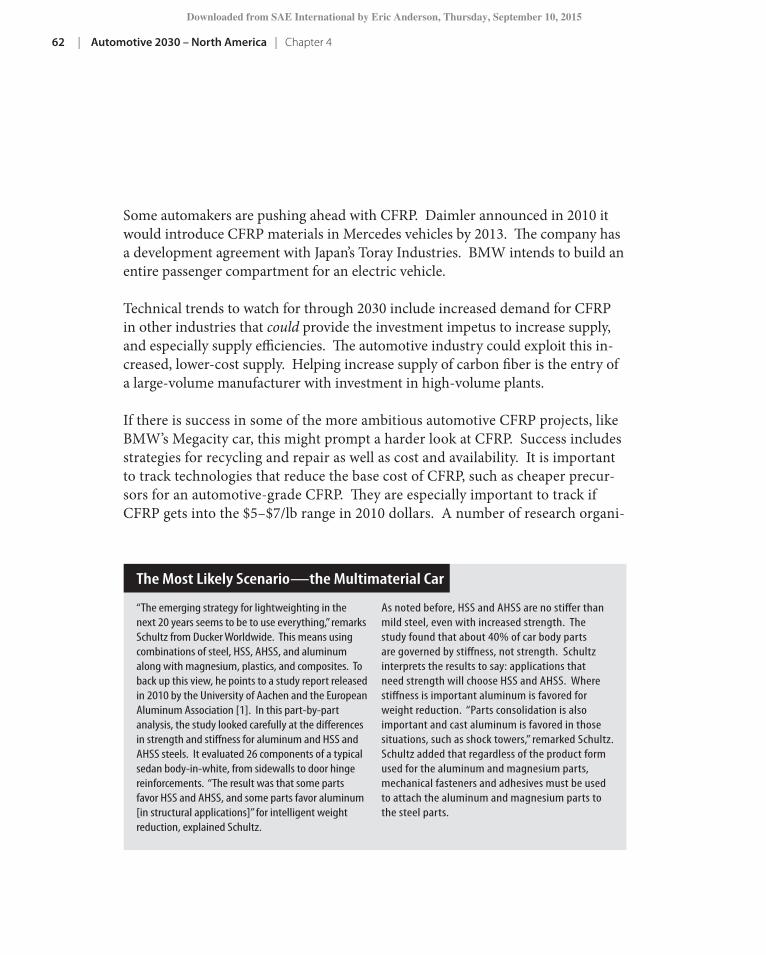
62 | Automotive 2030 – North America | Chapter 4
Some automakers are pushing ahead with CFRP. Daimler announced in 2010 it would introduce CFRP materials in Mercedes vehicles by 2013. The company has a development agreement with Japan’s Toray Industries. BMW intends to build an entire passenger compartment for an electric vehicle.
Technical trends to watch for through 2030 include increased demand for CFRP in other industries that could provide the investment impetus to increase supply, and especially supply efficiencies. The automotive industry could exploit this in-creased, lower-cost supply. Helping increase supply of carbon fiber is the entry of a large-volume manufacturer with investment in high-volume plants.
If there is success in some of the more ambitious automotive CFRP projects, like BMW’s Megacity car, this might prompt a harder look at CFRP. Success includes strategies for recycling and repair as well as cost and availability. It is important to track technologies that reduce the base cost of CFRP, such as cheaper precur-sors for an automotive-grade CFRP. They are especially important to track if CFRP gets into the $5–$7/lb range in 2010 dollars. A number of research organi-
“The emerging strategy for lightweighting in the next 20 years seems to be to use everything,” remarks Schultz from Ducker Worldwide. This means using combinations of steel, HSS, AHSS, and aluminum along with magnesium, plastics, and composites. To back up this view, he points to a study report released in 2010 by the University of Aachen and the European Aluminum Association [1]. In this part-by-part analysis, the study looked carefully at the differences in strength and stiffness for aluminum and HSS and AHSS steels. It evaluated 26 components of a typical sedan body-in-white, from sidewalls to door hinge reinforcements. “The result was that some parts favor HSS and AHSS, and some parts favor aluminum [in structural applications]” for intelligent weight reduction, explained Schultz.
As noted before, HSS and AHSS are no stiffer than mild steel, even with increased strength. The study found that about 40% of car body parts are governed by stiffness, not strength. Schultz interprets the results to say: applications that need strength will choose HSS and AHSS. Where stiffness is important aluminum is favored for weight reduction. “Parts consolidation is also important and cast aluminum is favored in those situations, such as shock towers,” remarked Schultz. Schultz added that regardless of the product form used for the aluminum and magnesium parts, mechanical fasteners and adhesives must be used to attach the aluminum and magnesium parts to the steel parts.
The Most Likely Scenario—the Multimaterial Car
T-127 book.indb 62 8/24/11 9:22 AM
Downloaded from SAE International by Eric Anderson, Thursday, September 10, 2015

Automotive 2030 – North America | Chapter 4 | 63
zations, such as Oak Ridge National Laboratory, are developing techniques right now to reduce cost.
A likely scenario is that CFRP will not significantly influence the auto industry before the 2030 model year without a significant change in motivation (high fuel prices) and cheaper supply of CF.
Summary of material technical trends to look for:• Increaseduseofaerospace-gradealuminumsinautomotive,suchas7xxx
series for forgings and greater use of sheet-suitable grades. A key indica-tor would be a door made of aluminum, given the stringent requirements for crash and safety.
• Thefirstthird-generationAHSSsteelswillbeginappearingforusebyautomakers by 2020, given current trends in steel development. Some of the higher-strength, higher-formability steels with 40–50% elongation and strengths in 1200–1600 MPa range are expected by 2030.
True innovation may compel complete changes in the vehicle architecture. Tooling for aluminum extrusions is cheap and easy to make. Integration into a space frame architecture, such as Audi did for its earliest models, means using even more aluminum. Engineers could use cheaper composite body panels, such as fiberglass, to lightweight the structure. Composites, rather than plastics alone, reduce thermal expansion and make for a finer looking exterior. The body will still require steels of various sorts to meet increased safety regulations, such as for more-stringent side and rollover impact.
Manufacturing hurdles to using more aluminum may yield to investment and ingenuity. These could include advanced aluminum vacuum die-casting, explains Schultz. Because aluminum does not
have the formability of steel in stampings, the use of thin-cast parts is one approach to producing similar parts. Complex, thin components such as strut towers, which are 2–4 mm thick, can save 40% of the weight of traditional steel stampings. Magnesium parts also are good for die-casting and may have some of the same kinds of breakthroughs in manufacturing technique in the period 2011–2020; that is, if price stabilizes and body engineers see the cost benefit.
[1] Stiffness Relevance and Strength Relevance in Crash of Car Body Components, Public version of official report 83440 by IKA, May 2010.
T-127 book.indb 63 8/24/11 9:22 AM
Downloaded from SAE International by Eric Anderson, Thursday, September 10, 2015

64 | Automotive 2030 – North America | Chapter 4
• StiffnessinsteelsasmeasuredbyYoung’smoduluswillmostlikelynotin-crease in tandem with strength increases.
• Magnesiumwillremainasmallerpercentageofautomotivepartscom-pared to other materials, given its price stability and utility.
• Atotal10%decreaseinmassforanygivenvehiclefootprintcouldbeattained by 2020 [8]. Greater than 10% mass reduction will require correspondingly increased motivation, either regulatory, fuel economy, or competitive.
Fig. 4.3 As Ducker Worldwide points out, the future use of materials depends on the particular use and the material’s properties that best fi t that use.
(Courtesy Richard Schultz, Ducker Worldwide)
Transportation * CONSTRUCTION * INDUSTRIAL * materials * FINANCIAL
Aluminum or Advanced High Strength Steel for Bodies and Closures? It Depends on the Part!
Strength favors AHSS Versus Static Stiffness can favor Aluminum
Source: Aachen U. & EAA
Source: Aachen U. & EAA
Ducker Interpretation
Some parts such as shock towers favor aluminum castings due to parts consolidation
T-127 book.indb 64 8/24/11 9:22 AM
Downloaded from SAE International by Eric Anderson, Thursday, September 10, 2015

Automotive 2030 – North America | Chapter 4 | 65
References[1] “Aluminum for Automotive Body Sheet Panels,” The Aluminum Association, December 1998.
[2] “Advanced High Strength Steel (AHSS) Application Guidelines,” V 4.1, June 2009, http://www.worldautosteel.org/projects/AHSSGuidelines/AHSS-applica-tion-guidelines-version-4.aspx.
[3] Website: http://www.autosteel.org/Programs/ULSAB.aspx, downloaded No-vember 2010.
[4] Brooke, Lindsay and Harry Evans, “Lighten up,” Automotive Engineering Inter-national, SAE International, Warrendale, PA, 15096, March 2009.
[5] Strong, Brent, Fundamentals of Composites Manufacturing, Materials, Methods, and Applications, 2nd edition, Society of Manufacturing Engineers, 2008.
[6] Sehanobish, Kalyan, Engineering Plastics and Composites in Automotive Appli-cations, SAE International, Warrendale, PA, 15096, 2009.
[7] Weekly Q&A Session, CM Magazine, August 3, 2010.
[8] “Interim Joint Technical Assessment Report: Light-duty Vehicle GHG Emis-sion Standards and CAFE for MY 2017-2025,” Environmental Protection Agency.
T-127 book.indb 65 8/24/11 9:22 AM
Downloaded from SAE International by Eric Anderson, Thursday, September 10, 2015

T-127 book.indb 66 8/24/11 9:22 AM
Downloaded from SAE International by Eric Anderson, Thursday, September 10, 2015

Automotive 2030 – North America | Chapter 5 | 67
Chapter Five
Gasoline / Electric HybridsToday’s hybrid electric vehicles (HEVs) are high-technology marvels of energy management. These HEVs recharge their batteries from electricity generated on-board, either bleeding kinetic energy through recovery devices while coasting on the highway or down hills, or from capturing the energy from braking when the car comes to a stop. While HEVs stretch petroleum-derived energy, they do not replace it. An HEV needs gas to go.
Why they stretch fuel is not just because they store energy that is otherwise lost—HEVs use that recovered energy in situations where the electric motor (eMotor) is more efficient than the internal combustion engine (ICE), such as when get-ting the vehicle to move from a dead stop or giving an added boost during pass-ing or going up hills, called peak shaving. How is the greater efficiency possible? It is possible because eMotors have greater torque and efficiency at low RPMs compared to ICEs. Because of this, the ICE can be downsized, saving mass and weight, or performance-enhanced for the same-size engine. Further, the engine it-self can be altered for fuel savings and use Atkinson cycles for improved efficiency (see Chapter 2). For sustained driving at highway speeds, the ICE is typically used exclusively, where the eMotor has no advantage. It may actually be a bit of a hin-drance because of the extra weight of the additional equipment and batteries.
How much can HEVs stretch energy? It varies, depending on the level of hybrid-ization. For full hybrids through 2009, most realistic estimates range from 20–25% or better combined fuel economy for models introduced through MY 2011. The city or urban drive cycle is where HEVs excel. Usually sporting a higher EPA fuel-economy rating for city compared to highway, they are the exact opposite of ICE-only vehicles. By 2010, in city-only driving, fuel economy improvements of
T-127 book.indb 67 8/24/11 9:22 AM
Downloaded from SAE International by Eric Anderson, Thursday, September 10, 2015

68 | Automotive 2030 – North America | Chapter 5
40–50% or better is common, especially for newer models using lighter batteries.So far so good. However, even “conventional” hybrids have practical problems. One such problem is confusion about the word itself. Hybrids can encompass a variety of different capabilities. There is some confusion in the marketplace about terms. The other is cost, with hybrids’ price to consumers sometimes 30% or more over their conventional counterparts’ prices.
What are we talking about?Confusion abounds around the word hybrid. There is talk of micro-hybrids, mild hybrids, full hybrids, plug-ins, and so on. Why so many ways to skin a cat? Why so many different approaches, architectures, and technology? Well, this is a brand new field, full of unknowns at many levels. There are technology unknowns, fuel price unknowns, and customer acceptance unknowns. Tests by the OEMs provide data that does not always agree. Not all hybrids are electric. Hydraulic hybrids are a solution for heavy commercial trucks. As of 2010, not that many HEVs are out there in terms of sheer numbers, but an increasing number of names and la-bels are bandied about in advertisements and the news. Every year, new makes and models sporting new architectures are offered. Each helps deliver a range of fuel-economy solutions at different cost-points. To set the vocabulary for the rest of the book, this section defines what we are talking about. While not universally accepted, the following terms are common [1]:
Micro-hybrid. The most cost-effective level of hybrid is an idle-stop system that shuts off the ICE engine when it is not actually delivering power, such as at a red light. These were discussed in detail in Chapter 2 and are included here for context.
Mild Hybrid. This is the next level of hybridization where an eMotor, power electronics and inverter, and a battery pack provide only assistance to the ICE. The architecture may look like any parallel hybrid, but motors and batteries are sized to assist the ICE. There is never any electric-only driving. Braking and coasting recovers lost energy and stores it in the battery. The eMotor and battery are sized much smaller, accordingly, thus it is somewhat cheaper in theory than a full hybrid. Launch-assist or motor-assist type hybrids are in this category. Most include an integrated idle-stop as well, building on the micro described earlier.
T-127 book.indb 68 8/24/11 9:22 AM
Downloaded from SAE International by Eric Anderson, Thursday, September 10, 2015

Automotive 2030 – North America | Chapter 5 | 69
Full Hybrids. Again, these have an eMotor, power electronics and inverter, and a battery pack, but they are so large that at times the eMotor alone can move the car without the ICE. While costing more, theoretically this arrangement provides even more potential fuel economy. They recover more energy, store it longer if needed, and the ICE is shut down more of the time. In a parallel or power-split architec-ture, the ICE, or the motor, or both power the car. Motors and batteries are sized to provide electric-only operation, with the control system shutting down the ICE.
Plug-in Hybrid (or Range-Extended Vehicle). These use electric energy from off-board sources and are discussed in more detail in Chapter 7.
Table 5.1 presents one possible segmentation of HEV technologies. Even these categories are blurring as OEMs devise new architectures and strategies. These are generally agreed on, but there are many variations on this theme.
Architectures and typesTo accomplish these varying levels of hybridization, inventive engineers have dreamed up a number of architectures. One arrangement, known as a parallel hybrid, includes one or two electric motors and an ICE that are connected to the
Functions/Classification
Engine Stop/Start
Engine Assist
Regen. brake
Electric-only Start/Launch
Electric-only Cruise
Micro Hybrid(12 - 14 V systems)
Yes, for both 12V
No No No No
Mild Hybrid (14 V - 42V system) cs)
Yes Some Some No No
Medium Hybrid(42V – 100+ V system)
Yes Yes Yes No No
Full Hybrid (100 + V system)
Yes Yes Yes Yes Yes (for short periods)
Table 5.1 . One possible breakdown of HEV technologies.
T-127 book.indb 69 8/24/11 9:22 AM
Downloaded from SAE International by Eric Anderson, Thursday, September 10, 2015

70 | Automotive 2030 – North America | Chapter 5
driving wheels through a shared gearbox, transmission, or other arrangement. The eMotors act as both a means to power the wheels and a generator to power up the battery during regenerative breaking. In a power-split architecture, separate eMo-tors each act as a motor-generator unit, although one is primarily a motor and the other primarily a generator. Each performs the other function for a small percent-age of the time. A prime example of a power-split is Toyota’s Hybrid Synergy drive.
Another approach to the parallel configuration, sometimes referred to as a P2 hybrid, is to connect the engine and electric motor through a clutch to a transmis-sion or transaxle [2]. This architecture reportedly has comparable fuel-economy to a power-split, although the P2 is a little simpler and therefore probably cheaper to build. It uses one integrated motor/generator [3]. When the clutch is engaged and the engine is running, power then flows from the engine through the motor to the transmission. Examples include the 2011 Hyundai Sonata Hybrid, 2011 Infin-ity G35 Hybrid, and 2011 VW Touareg Hybrids1.
Both the power-split parallel and P2 hybrids are often seen in smaller cars, such as the Toyota Prius and the Honda Insight. There are some practical limitations in motor sizing when trying to scale up the architecture to larger vehicles, such as trucks and SUVs, according to GM. To tackle these issues, in 2006, a Two-Mode hybrid system was introduced, developed by a consortium of General Mo-tors, DaimlerChrysler, and BMW. Developed from an earlier Allison heavy-duty hybrid drive, this hybrid system is specifically designed for heavier trucks and full-sized SUVs. Since 2006, variations of the Two-Mode hybrids have been devel-oped, but generally, the architecture adds a pair of clutches and two planetary gear sets to a base electrically variable transmission (EVT). While the first mode of this two-mode system acts as a power split HEV, the second mode is a compound-split for power sharing. The first mode engages mainly at low speeds with light loads, and can operate on electric power alone. The second mode adds direct mechani-cal gearing along with the EVT. The gearing reportedly creates a mechanical pow-er path that is 20% more efficient at higher speeds when the vehicle is operating on engine power under sustained load. Overall, the advantages of this added com-plexity include smaller electric machines, higher efficiencies over a wider range of operating conditions, and added boost and braking to four fixed gear ratios [4].
1For example, the VW Touareg uses a 1.7-kWh battery pack coupled with a 333-hp, 3.0-L su-percharged V-6 gasoline engine with a 38-kW eMotor.
T-127 book.indb 70 8/24/11 9:22 AM
Downloaded from SAE International by Eric Anderson, Thursday, September 10, 2015

Automotive 2030 – North America | Chapter 5 | 71
As an example of what it can do, the 2011 GMC Sierra Hybrid provides 33% better city and 23.5% highway in a full-size truck with a gross-vehicle weight rating of 6700 lb, according to the company.
Yet another approach for conventional hybrids is the through-the-road hybrid. In this configuration, a conventional ICE is connected to one set of driving wheels and an electrical drivetrain on the other set [5]. The Peugeot 2008 HYbrid4 announced at the 2010 Paris Motor show is an example of this configuration, using a turbocharged, high-pressure 2.0-L diesel engine for the front wheels. There are a number of after-market conversion kits as well that use the through-the-road configuration [6].
Figure 5.1 presents some of the hybrid architectures. In any of these configu-rations, a separate starter / generator for idle-stop operation may be (often is)
Figure 5.1. Some generally accepted idealized architectures for mild to full hybrids.
T-127 book.indb 71 8/24/11 9:22 AM
Downloaded from SAE International by Eric Anderson, Thursday, September 10, 2015

72 | Automotive 2030 – North America | Chapter 5
included separately and attached directly to the ICE. As useful as Fig. 5.1 is in categorizing some of the architectures for various gasoline / electric hybrids, by no means is this all there is. Inventive engineers have riffed on these various themes to produce architectures with multiple eMotors with multiple clutches and various attachments of transmissions. For example, the MY 2011 Infiniti M35 is similar to the P2 configuration above, but uses two clutches instead of one.
So, a conventional hybrid can mean one of many things. To make it even more inventive, the notion of putting individual eMotors onto each axle or wheel is at-tractive. The upside is much greater control over vehicle dynamics, with torque vectoring and other advanced control systems. The downside is added cost and weight—each eMotor would then need its own inverter. Also, a single, larger mo-tor delivers more power density and is generally more efficient.
Components and improvementsThis section discusses three of the major components needed to electrify the pow-ertrain: electric motors, batteries, and power control units including inverters. These last manage the flow of electrical energy into and out of the battery, match-ing voltage and amperage for maximum power at the eMotor and maximum stor-age in the battery.
Electric Motors. While electric motors easily deliver the same torque and pow-er as an internal combustion engine (ICE), they behave in some fundamentally different ways. One is their low-RPM performance compared to ICEs. They make maximum torque from zero RPM while most ICEs need to rev up into their power bands before delivering max torque. Another is their high efficiencies. Peak ef-ficiencies for electric motors—converting the electric power fed to them into me-chanical power—are as high as 98%, and efficiency over most of the speed-load map is above 80%. Compare this to a typical ICE peak efficiency of 30% and aver-age of around 15%, and you can see the attraction for electrification. Another key point is that required torque is as important, or more important, than power. Just like an ICE, larger displacement in an electric motor gives greater torque. This means that required torque—not just power—dictates motor volume, size, cost, and weight—more than power alone.
T-127 book.indb 72 8/24/11 9:22 AM
Downloaded from SAE International by Eric Anderson, Thursday, September 10, 2015

Automotive 2030 – North America | Chapter 5 | 73
There are similarities as well. In particular, to get more power for the same weight, just like ICEs, speeding the eMotor to higher RPMs with the same torque deliv-ers higher power. This requires gearing down the eMotor through a transmission to match the wheel speed, but that is needed in any case, in particular with HEVs that usually attach an eMotor and an ICE to a transmission. The system trade-off is how much weight can be saved through a high-revving motor over the weight needed in gearing.
There are an almost bewildering number of basic designs for electric motors. Mo-tors are made of a stationary part, or stator, and a rotating part, a rotor. Induction motors (IMs) generate a magnetic field using current that flows through windings. The push-pull of the magnetic field in the rotor interacting with the current flow-ing around the stator is what generates motion and torque. Permanent magnet (PM) motors use rare earth magnets. Induction motors are in general lower in cost, easier to make, and use no rare earths. On the other hand, they are not as efficient as permanent magnet motors.
As for eMotors, with already high efficiencies and no new material breakthroughs that seem imminent, any radical new design is not in the cards as of 2010. The major requirements for eMotors are power density measured in kW/kg and kW/L as well as cost in $/kW. As of 2010, common industry values for power density were 1–3 kW/Kg. Some specialty motors go as high as a continuous power densi-ty of 4.3 kW/kg and peak power density of 7 kW/kg. Cost is generally in the range of $8–15/kW in 2010 dollars.
Motor technology is not as much a limiting factor for the cost-effective develop-ment of HEVs, compared to batteries or power control units. Nevertheless, expect careful and continuous engineering to improve eMotors in the years ahead. “Since the days of the EV-1 (in the mid-1990s), we increased the power density by a fac-tor of two,” noted Pete Savagian, Engineering Director, Hybrid Powertrain Systems Engineering and Electric Motor Release Centers for GM, speaking in 2010. He credits this increase to computers. Computational power in the form of finite ele-ment analysis (FEA) for electromagnetics, fluids, and structures produces more optimal designs. Computational power in control systems produces faster and more precise control schemes for the motors as they operate in real time.
T-127 book.indb 73 8/24/11 9:22 AM
Downloaded from SAE International by Eric Anderson, Thursday, September 10, 2015

74 | Automotive 2030 – North America | Chapter 5
There seems no reason to expect that this steady improvement will level off, and perhaps it will show a somewhat accelerated rate with the growing urgency to de-liver electrification. By 2030, given current trends through 2010, it is reasonable to expect eMotors with power densities better than today with costs in the single digits per kW, depending on the design and requirements.
Power Electronics and Control. The main power function of the inverter is to convert DC current from the battery to AC current for the electric motor. At the same time, AC current from a motor-generator used in regenerative braking needs to convert to DC to charge up the battery. Electrical engineers understand both functions well.
The more difficult task in parallel or power-split HEVs is controlling the contribu-tion of the eMotors and ICE to the traction wheels, monitoring the state-of-charge (SOC) of the energy storage device, controlling temperatures, and cooling in the battery, and much more. The key enabler for the HEV as it has emerged in the 21st century has been computer control systems. As with so many other vital functions in today’s vehicles, from safety to combustion, computers and control software cou-pled with inexpensive sensors enables the sophisticated control strategies in HEVs. As of 2010, such a car could have over 100 million lines-of-code, or software instructions, compared to a Boeing 787 with reportedly only 7.5 million lines-of-code [7]. Perhaps more than advances in batteries and the high price of gasoline, computers and computer control algorithms enable practical HEVs for the mass-market. For example, Ford alone has over 200 patents in control algorithms.
Electricity Storage for HEVs—Power and Energy. A common theme throughout the history of electric vehicles is the shortcomings of batteries in pow-ering a vehicle. Batteries take longer to charge than filling a gas tank, are heavier, and hence do not carry as much energy as people would like. HEVs mitigate these shortcomings by carrying only enough charge to power the eMotor only when it has distinct advantages over the ICE. As a result, HEV batteries need to charge and discharge relatively quickly and efficiently, but not necessarily hold a large charge for a long time compared to batteries in more electrified powertrains such as elec-tric vehicles (EVs). The very fact that HEVs require much smaller batteries com-pared to their extended-range or battery electric vehicle brethren is a factor in the more rapid development and widespread use of HEVs, as will be discussed later.
T-127 book.indb 74 8/24/11 9:22 AM
Downloaded from SAE International by Eric Anderson, Thursday, September 10, 2015
Automotive 2030 – North America | Chapter 5 | 75
There are a number of choices in battery technology. Lead-acid batteries, the cheapest and still most common for starting conventional cars, are too heavy for the charge they hold. Other practical choices include nickel cadmium (NiCad) and nickel metal hydride (NiMH). Nickel-based batteries hold roughly twice the energy or more as measured in Wh/kg than a lead-acid battery. Through model year 2010, the most common battery technology chosen for HEVs is NiMH. Lithium-based batteries are set to enter the automotive world for HEVs starting in model-year 2011 (calendar-year 2010). While most OEMs have no plans to abandon their reliable NiMH completely, there is a great deal of momentum and research behind lithium-based batteries. Why? Because they promise to hold even greater charge, hold it longer, and in a lighter package. They hold as much as three or four times—or more—the charge of a lead-acid battery. Some unknowns re-main, chief among them cost, along with reliability, durability, and stability. At the time of this writing, although a number of other battery technologies are available, only advanced lithium-based batteries seem ready to make an impact in the period 2010–2030. As always, surprises may be lurking in universities or research labs.
The term lithium-ion really refers to a family of lithium-based battery technolo-gies. Some of the most prominent include:
• Lithium-nickel-cobalt-aluminum• Lithium-nickel-manganese-cobalt• Lithium-manganese-spinel• Lithium-ironphosphate
Each has their advantages and drawbacks. To enhance complimentary advan-tages, physical mixtures of some of these are also under development, according to Gary Henriksen, retired and former Manager of the Advanced Battery Program at Argonne National Laboratory. Reducing or eliminating expensive materials and increasing production volumes are important to reducing cost of power batter-ies. Improving battery stability and safety also reduces cost. Why? “Improving the inherent safety of the battery chemistry means reducing the cost of the battery management electronics,” explains Henriksen. Another key point, as he explains it, is the fact that currently engineers “oversize” batteries in excess of their actual power and energy needs. That is why in 2010 lithium batteries used in HEVs are in the 1.5–2.0 kWh size even though they probably use far less of this storage to
T-127 book.indb 75 8/24/11 9:22 AM
Downloaded from SAE International by Eric Anderson, Thursday, September 10, 2015

76 | Automotive 2030 – North America | Chapter 5
operate. Balancing state of charge, cold temperature operation, and extending the life of the battery are all valid reasons for oversizing the battery. However, as Hen-riksen explains, each gram of material in a power battery is costly.
Ultracapacitors are another important energy storage technology for HEVs. What is an ultracapacitor? Like a battery, it stores electrical energy and discharges it when needed. Unlike a battery, it uses electrostatics rather than a chemical reac-tion to store that energy. It holds a charge for a very short time, but that charge can be quite powerful. As the CEO of Maxwell Technologies, a maker of ultraca-pacitors, describes it, “A battery, with its high-energy density, is like a marathon runner; the ultracap, whose forte is power density (rapid charge and discharge), is like a sprinter [8].”
What is the measure of an adequate energy storage device for HEVs? The U.S. Advanced Battery Consortium LLC (USABC), a collaborative research organiza-tion of Chrysler Group, Ford, and General Motors was formed in 1991, in part, to provide the answer to that very question. The requirements of the battery vary de-pending on the power needed by the level of hybrid. Steve Clark, USABC external affairs representative and senior manager, Energy Storage and High Voltage Sys-tems department at Chrysler Group, helps put the question in context. He stresses that what is most important in these energy storage devices—be they batteries or ultracaps—is how much power they can deliver for short bursts of time, up to ten seconds typically. Hence, he describes storage devices used in HEVs as “Power” batteries. “They don’t need a lot of storage, only about 300–500 Wh of storage maximum,” he explains. What is important is the power that they have available in those 10 seconds or less. Power is measured in kW, energy in kWh. The key factor for Power storage is the cost in $/kW, in contrast to Energy batteries that need to store a lot of electrical energy. For Energy batteries, the key unit for comparison is $/kWh, according to Clark. (This will be discussed in more detail in Chapter 6.)
The USABC ultimate cost goal for Power batteries is $20/kW. Other notable re-quirements include 15-year calendar life, a peak discharge power of 25 kW to 40 kW (for at least 10 s) and a cycle life of 300,000 cycles. Maximum power density should be 0.625–0.66 kW/kg and volumetric densities around 0.78–0.8 kW/L. By their estimation, meeting these requirements will go a long way in the continued advancement of HEVs. The USABC cost goals of $20/kW for these power-assist
T-127 book.indb 76 8/24/11 9:22 AM
Downloaded from SAE International by Eric Anderson, Thursday, September 10, 2015

Automotive 2030 – North America | Chapter 5 | 77
batteries were set at a level that would support wide spread commercialization of the technology. At that cost point, Clark expects HEVs to compete with other ad-vanced powertrain systems such as diesels. Table 5.2 shows energy storage system performance goals for USABC full (power-assist) hybrid electric vehicles.
How close is the industry to matching these requirements the consortium thinks are necessary for widespread commercial success? Some of the targets mentioned above seem close as of MY 2011. In just one example, the lithium-based battery used on
Characteristics Units Power-Assist (Minimum)
Power-Assist (Maximum)
Total available energy over discharge range where power goals are met
kWh 0.3 0.5
Pulse discharge power (10s) kW 25 40Peak regenerative pulse power (10s)
kW 20 (55-Wh pulse) 35 (97-Wh pulse)
Minimum round-trip energy efficiency
% 90 (25 Wh cycle) 90 (50 Wh cycle)
Cold cranking power at -30°C (three 2-s pulses, 10-rests between cycles) kWs 5 7Cycle Life Cycles 300,000 300,000Calendar Life at 30°C Years 15 15Maximum weight Kg 40 60Maximum volume L 32 45Operating Voltage limits max<400 min>
(0.55 x Vmax)max<400 min> (0.55 x Vmax)
Temperature range - Equipment operation
°C -30 to +52
Production Price @ 100,000 units per year
$ 500 800
Table 5.2. The U.S. Advanced Battery Consortium energy storage system performance goals for full (power-assist) hybrid electric vehicles.
T-127 book.indb 77 8/24/11 9:22 AM
Downloaded from SAE International by Eric Anderson, Thursday, September 10, 2015

78 | Automotive 2030 – North America | Chapter 5
the 2011 Sonata Hybrid boasts a power output of 34 kW in a 43.5 kg package. This gives 0.78 kW/kg, a density in excess of the maximum specified by USABC.
The main technical challenges, according to Clark, as of 2010 include improving the ability to operate at lower temperatures (below 0 degrees Fahrenheit), improved calendar life, and—of course—cost. An estimate of average cost of power storage batteries as of 2010 is greater than $40–$60/kW, depending on a number of factors. Achieving approximately $30/kW by 2030 may very well be likely. To achieve this re-quires a modest 3% improvement in cost per year compounded over 20 years. Figure 5.2 illustrates the status of battery development for HEVs using Li-Ion chemistries.
HEV Battery StatusHigh Power Batteries
General Motors - Ford - Chrysler 19USABC - Steven Clark September 3, 2010
0%
20%
40%
60%
80%
100%
120%
140%Operating Temp (-30 - +52 C)
Production Price (@100k/yr)
Calendar Life (15 yrs)
Cycle Life (300k cycles)
Available Energy (kWh)
Efficiency (90%)
Discharge Power (kW)
Regen Power (kW)
System Volume (L)
System Weight (kg)
Self Discharge (<50 Wh/day)
Cold Crank Power (kW)
USABC Goal 25 kW System Status 40 kW System Status
Figure 5.2. A summary of the status of battery development for HEVs using Li-Ion chemistries as of September 2010. This chart shows cost
and calendar life as the remaining technical challenges, while cold temperature operation remains an open issue as well.
(Courtesy Steven Clark, Chrysler LLC and USABC).
T-127 book.indb 78 8/24/11 9:22 AM
Downloaded from SAE International by Eric Anderson, Thursday, September 10, 2015

Automotive 2030 – North America | Chapter 5 | 79
Developing smaller batteries that come closer to the 300–500 Wh of storage and op-erate at the required power level of 25–40 kW will be another push among developers in the years ahead. Increased number of lifetime charges and wider allowable state-of-charge ranges will also improve.
The extraordinary fuel economy improvements for most HEVs do not come from electrical energy management alone. They compound the power of electrification through enabling smaller, more-efficient ICE engines, and many use the Atkinson cycle described in Chapter 2 for this reason. They tend to use the most fuel-efficient trans-missions. They tend to have smaller footprints and lower weights, as the Prius, and use low-rolling-resistance tires and every other tool in the engineer’s bag, such as improved aerodynamics, for fuel efficiency. Through 2010, OEMs position many of these early HEVs as fuel-sippers, green-machines that help drivers save the environment. This makes the engineering trade-off between performance and fuel economy all the easier.
Public acceptanceBy any raw measure, an impressive number of HEVs have been sold in North America since the Toyota Prius and Honda Insight were introduced in 2000. With continued introduction of new HEV models (more in MY 2012 and beyond than are shown in Fig. 5.3), the public is going to be bombarded with choices in the 2012–2016 timeframe.
While impressive, the numbers may not tell a rosy tale when compared to popular models for new technology adoption, such as the Technology Diffusion Curve [10]. The 2009 sales of hybrids were approximately 2.5% of total vehicle sales in North America [11]. This number corresponds roughly with the number of “innovators” in the Diffusion model. By this model, HEVs as of 2009 have not even cracked into the “early adopters” population. This means it is not close to successful adoption yet.
Undoubtedly, cost to the consumer is a factor, along with perceived risk as well. HEVs have been positioned as fuel-economy savers, gas-sippers that reduce cost and/or save the planet from global warming. For the mainstream consumer, this may not be enough. Will these new-fangled machines run long enough? How much will they cost to repair? With gas prices hovering at historic averages, what is the cost incen-tive? This will be covered in more detail in Chapter 10.
T-127 book.indb 79 8/24/11 9:22 AM
Downloaded from SAE International by Eric Anderson, Thursday, September 10, 2015

80 | Automotive 2030 – North America | Chapter 5
One could speculate on another strategy that reveals itself in the period after 2010. That is, carmakers using elements of today’s HEVs as tomorrow’s stan-dard equipment. Because of CAFE regulations, OEMs are on the hook to deliver improved fuel economy. The alternative to this strategy is what OEMs have pursued through 2009. They passed through incremental cost of HEV technologies. Accord-ing to the U.S. DoE reporting in 2008, this increased price was in the $5000 to $8000 range relative to a non-hybrid base model [12]. When gas mileage is only about 20% better, on average, it seems that most consumers are not biting on this bait (at least not until gas prices get higher or fuel-economy benefits improve). However, that is only if OEMs position HEVs as gas-savers that require a premium price. As standard equipment, as long as there are no major recall campaigns, the fact that they deliver
Figure 5.3. According to data from the U.S. Department of Energy, sales for hybrid-electric vehicles fell during 2008 and 2009, following a trend for
overall sales that dipped significantly as well (not shown) [9].
T-127 book.indb 80 8/24/11 9:22 AM
Downloaded from SAE International by Eric Anderson, Thursday, September 10, 2015

Automotive 2030 – North America | Chapter 5 | 81
CAFE results could be incentive enough for automakers to offer them. With no price premium and no risk, there would be no reason for drivers not to buy them.
On this point, two events in the 2010 and 2011 model years bear watching closely. One is Ford and its MY 2011 Lincoln MKZ and MKZ Hybrid pricing. Ford prices its Lincoln MKZ Hybrid at the same Manufacturer’s Suggested Retail Price (MSRP) as its gasoline-only version [13]. Another is GM and its 2012 Buick LaCrosse. The four-cylinder version will only be offered with GM’s eAssist, its term for a mild hybrid. Again, the six-cylinder gas-only version is offered for the same price as the eAssist four-cylinder. If more companies follow this strategy, developing costing and feature bundling that does not emphasize, hides, or mitigates the increased cost of HEVs, the Diffusion Curve adoption rates become moot.
There is precedent for this. How many drivers really know the details of the engi-neering that go into catalytic converters? How many really know or care if their souped-up ICE has three or four valves per cylinder, or is dual-overhead cam? The same could be true of power batteries, ultracaps, and motor-generators as well. May-be the mild hybrid sticker is another one of those features that gives results but is not central in the mind of the driver.
Evolution over revolution—high volumes remain importantFrom the time of Henry Ford, the path to low cost consists of high volumes and economies of scale. Even with the growing movement and investment in flexible manufacturing, economies of scale are vital for companies to meet cost targets and remain competitive. Through 2010, at least two factors in electrification worked against driving cost down through economies of scale. The first is the variety of ar-chitectures and platforms inventive engineers are dreaming up. The second is the low volume of sales of any one of these. With the possible exception of the Toyota Prius, none of the volumes shown in Fig. 5.3 are overly impressive. The worst case in this trend is overly engineered or special-purpose components built for a specialized, highly optimized architecture produced in small volumes. A specialized electric mo-tor sold in the thousands is not as cheap to build as a general-purpose model sold in the hundreds of thousands.
T-127 book.indb 81 8/24/11 9:22 AM
Downloaded from SAE International by Eric Anderson, Thursday, September 10, 2015

82 | Automotive 2030 – North America | Chapter 5
A trend to watch for is a push from component suppliers for more standardization. An-other trend is for suppliers to develop scalable platform architectures for their com-ponents. This might be easier in batteries and inverters than motors, where the phys-ical size of the motor to a degree dictates the torque it delivers. Another approach is to provide packaged solutions for plug-and-play subsystems of matched integrated components. For example, in this scenario a motor, inverter-controller, and cooling system could be delivered as a complete package, reducing development cost and nonrecurring engineering. For example, Remy, Inc. and MotoCzysz announced such a product in 2010.
Here is a summary of HEV trends to watch for:
• Continuedexperimentationwitharchitecturesandarrangementsofmo-tors, batteries, and transmissions. There will be a resistance to standardize any particular arrangement until more real-world experience is gained. Particular architectures for certain weight classes, such as two-mode for heavier vehicles, may well become the norm.
• Whilemotorsandpowerelectronics,includinginverters,arewellun-derstood, there will be a continuing drive to reduce their cost. This is no surprise! Based on the trends in the last twenty years, there is no reason to expect that key factors such as weight or cost could not be shaved an-other 25% or more through sustained engineering, as long as OEMs and suppliers see the benefit in funding further engineering and development. A mere 1.5% per year improvement in cost compounded over 20 years results in a 26% improvement. As battery prices decrease, the cost in the balance of the electric system will become more visible and therefore sub-ject to competitive pressures.
• Itmayindeedbehighlylikelythatpower electric storage systems (batter-ies or ultracaps or a combination) could achieve cost, storage, and per-formance targets by 2020 or 2030 as defined by USABC. Again, volume purchases will help, to a certain degree, just as much as sustained evolu-tionary engineering. Achieving a cost of at least $30/kW seems reasonable to project, though not guaranteed.
T-127 book.indb 82 8/24/11 9:22 AM
Downloaded from SAE International by Eric Anderson, Thursday, September 10, 2015

Automotive 2030 – North America | Chapter 5 | 83
• Withreducedweightandpackagingofsignificantcomponents,especiallythe battery, HEVs are improving in performance. Control algorithms will continue to improve. A number of sources indicate that hybrids with such improved components could achieve fuel economy improvements of over 40%.
• ItispossiblethatasignificantproportionofallcarssoldthatareHEVs,from mild to full hybrid capability, could exceed double digits by 2020 [14] and beyond (excluding micro-hybrids).
References[1] German, John M., Hybrid Powered Vehicles, SAE International, Warrendale, PA, 2003.
[2] Interim Joint Technical Assessment Report: Light-duty vehicle greenhouse gas emission standards and corporate average fuel economy standards for MY 2017–2025.
[3] Weissler, Paul, “New simplified hybrid drive systems from Hyundai, VW, and FEV reduce cost,” Automotive Engineering International, SAE International, Warrendale, PA, May 2010.
[4] “Hybrid alliance reveals two-mode details,” Automotive Engineering Interna-tional, Tech Briefs, June 2006.
[5] Larminie, James and John Lowry, Electric Vehicle Technology Explained, Wily, 2003.
[6] “Concept: Through-the-road PHEV conversion kit,” Green Car Congress, July 20, 2008.
[7] Charrette, Robert N., “This Car Runs on Code,” Discovery News, IEEE Spectrum, http://news.discovery.com/tech/toyota-recall-software-code.html, Feb. 5, 2010.
T-127 book.indb 83 8/24/11 9:22 AM
Downloaded from SAE International by Eric Anderson, Thursday, September 10, 2015

84 | Automotive 2030 – North America | Chapter 5
[8] Website: http://maxwell.maples.com/blog/2010/02/09/reader-question-why-hasnt-detroit-embraced-ultracapacitors/, Downloaded 12/1/2010.
[9] “Trend of sales by HEV models from 1999-2010,” http://www.afdc.energy.gov/afdc/data/docs/hev_sales.xls, Downloaded 4/9/2011.
[10] Rogers, Everett M., Diffusion of Innovations, 4th Edition, The Free Press, 1995.
[11] Retrieved from http://www.afdc.energy.gov/afdc/data/vehicles.html, Nov. 13, 2010.
[12] “2008 Vehicle Technologies Market Report,” U. S. DoE, July 2009.
[13] Lincoln information from http://www.lincoln.com/cars/mkz/, Downloaded March 2011.
[14] Dinger, Andreas et al., “Batteries for Electric Cars, Challenges, Opportunities, and the Outlook to 2020,” Boston Consulting Group research report.
T-127 book.indb 84 8/24/11 9:22 AM
Downloaded from SAE International by Eric Anderson, Thursday, September 10, 2015

Automotive 2030 – North America | Chapter 6 | 85
Chapter Six
The Electric CarTransport using only electricity offers many benefits. One in particular is quite exciting—an energy source not dependent on foreign imports. All-electric ve-hicles are also quiet, smooth-running vehicles that can be a lot of fun to drive. Challenges remain as of 2010. Will we drive electric someday? (See The Electric Second Commuter Car.)
The engineering behind a pure electric vehicle is relatively simple compared to the gasoline / electric hybrid electric vehicle (HEV). It only requires a battery connected to a motor / generator through a power electronics interface. Modern battery electric vehicle (BEV) designs also include regenerative braking just as in HEVs and other power-stretching devices. Unlike the HEV discussed in Chapter 5, BEVs get all of their energy from batteries. While the power control electronics and electric motor / generators (eMotors) have the same fundamental technolo-gies and economics as in HEVs, the batteries are substantially different because they must hold a much larger charge for far longer than the “power” batteries of the HEV. The same challenges for reducing cost and weight in the power control electronics and eMotors remain, but energy storage challenges greatly overshadow them. Energy storage dominates any talk of using BEVs and is the most complex of the components in a BEV system.
Another important factor in BEVs is recharging them. First, all that electricity has to come from somewhere, and there are concerns that the electric grid and gener-ating capacity of 2010 is not sufficient if we suddenly trade gasoline for electrons. The second, and more important concern for automotive engineers, is getting those electrons into the battery. A simple extension cord from a 115-V wall plug
T-127 book.indb 85 8/24/11 9:22 AM
Downloaded from SAE International by Eric Anderson, Thursday, September 10, 2015

86 | Automotive 2030 – North America | Chapter 6
will not be sufficient. This concern is especially sensitive when talking about large cities, since BEVs might make the most sense economically in urban commutes. In that environment, special recharging stations for apartment dwellers and other urbanites are a top concern.
Carrying and storing electrons—batteries and battery packsThe main issues with batteries as of 2010 are:
1. Too expensive2. Too heavy and big3. Take too long to charge up4. Do not take you far enough when charged
A common theme throughout the history of electric vehicles involves the short-comings of batteries in powering a vehicle. To compare, ten gallons of gasoline, the amount in a small gas tank in a car, weighs about 28 kg and contains about 335 kWh of energy. A modern lead-acid battery weighing the same can store only in the range of 0.8–1.2 kWh, 300 times less than gasoline. Even acknowledging that electric drivetrains are inherently more efficient than ICEs, gasoline-powered cars still have a carrying capacity 70 to 80 times greater or more per kilogram than a
The Electric Second Commuter CarThere are more uncertainties around adoption of EVs than this single chapter alone can enumerate. Assuming that customers want control over their destinies more than anything else, those that wish to use BEVs will then choose a BEV that can get them to work or play and back home again without relying on public infrastructure. Since community living arrangements, such as apartment buildings, will present a further hurdle, the most likely scenario to develop first is the Suburban Electric Commuter Car. The primary car—some might call it Old Reliable—will be a gasoline powered car used for longer or unpredictable trips.
This requires, however, the first-time BEV buyer to make a further capital investment to get reasonable recharge times, from as low as $1500 to several times that if their home is not already wired for 240-V service. One could expect to see only the most dedicated BEV devotees or curious innovators choose this option. However, as battery and recharging technology improves during the period 2010–2030, faster recharges and increasing range may make this a more widespread scenario.
T-127 book.indb 86 8/24/11 9:22 AM
Downloaded from SAE International by Eric Anderson, Thursday, September 10, 2015

Automotive 2030 – North America | Chapter 6 | 87
lead-acid battery [1]. Battery technologies with better storage capacities are only two to four times better than a lead-acid battery, not 70 or 80 times.
All projections from 2011 onward predict Li-ion batteries to dominate transport applications, at least through 2020 and beyond. The same chemistries discussed in Chapter 5 for power batteries are possible in energy batteries needed for BEVs.
Compared to gasoline, other issues occur with batteries—self-discharge is one. If you leave a rechargeable battery sitting for long enough, it will run out of juice all on its own. In addition, energy storage varies with temperature and discharge rate. It may not be apparent from everyday experience, but cold batteries are not as useful as warm ones. Hot batteries catch on fire, something most automotive executives would like to avoid. Hence, cooling and temperature control is a major engineering challenge.
In fact, the term “battery” for use in automotive transport may be a bit mislead-ing. While the Li-ion chemistries that will be used in automobiles are similar to the familiar battery used in your rechargeable cell phone, scaling up an individual cell to get the power and energy needed to move a car is impractical. Cells are placed into packs. Assemblies of cells become modules, along with control electronics that manage power, charging, and temperature. For example, the 16-kWh battery pack for the Chevy Volt uses 220 individual Li-ion prismatic cells; the Nissan Leaf ’s bat-tery pack has a similar number of cells. Scaling up battery packs also introduces some price/kWh discounts, as the cost of battery management equipment and con-trols remains constant to a degree as the pack grows larger. However, a pack con-tains more and costs more than the cost of assembling individual battery cells.
How well could BEV batteries improve in the next 20 years? More importantly, can they improve enough to meet the minimum requirements for commercial acceptance? As in HEV batteries, there are a number of technical requirements for BEV batteries to meet. Cost is only one. For a reasonable benchmark, we rely again, as we did in Chapter 5, on the U.S. Advanced Battery Consortium LLC (US-ABC), a collaborative research organization of Chrysler Group, Ford, and General Motors formed in 1991. As with HEVs, batteries for BEVs must meet a series of minimum requirements for the BEVs to become ultimately economical in com-parison to ICEs. Table 6.1 illustrates these technical goals.
T-127 book.indb 87 8/24/11 9:22 AM
Downloaded from SAE International by Eric Anderson, Thursday, September 10, 2015

88 | Automotive 2030 – North America | Chapter 6
Parameter(Units) of fully burdened system
Minimum Near Term Goals for Commercialization
Long Term Goal
Power Density (W/L) 460 600Specific Power – Discharge, 80% DOD/30 sec (W/kg)
300 400
Specific Power - Regen, 20% DOD/10 sec (W/kg)
150 200
Energy Density - C/3 Discharge Rate (Wh/L)
230 300
Specific Energy - C/3 Discharge Rate (Wh/kg)
150 200
Specific Power/Specific Energy Ratio 2:1 2:1Total Pack Size (kWh) 40 40Life (Years) 10 10Cycle Life - 80% DOD (Cycles) 1,000 1,000Power & Capacity Degradation (% of rated spec)
20 20
Selling Price - 25,000 units @ 40 kWh ($/kWh)
<150 100
Operating Environment (ºC) -40 to +5020% PerformanceLoss (10% Desired)
-30 to +85
Normal Recharge Time 6 hours (4 desired) 3 to 6 hoursHigh Rate Charge 20-70% SOC in <30
minutes @ 150W/kg (<20min @ 270W/kg
Desired)
40-80% SOC in 15 minutes
Continuous discharge in 1 hour - No Failure (% of rated energy capacity)
75 75
Table 6.1. Technical goals for BEV “Energy” batteries as set by the U.S. Advanced Battery Consortium LLC (USABC).
T-127 book.indb 88 8/24/11 9:22 AM
Downloaded from SAE International by Eric Anderson, Thursday, September 10, 2015

Automotive 2030 – North America | Chapter 6 | 89
While the main economic unit of measure in the “power” battery is $/kW, in “en-ergy” batteries for BEVs it is $/kWh. As of 2010, according to one expert, a few of the USABC goals are met by batteries made from lithium-ion battery chemistries, including specific power discharge, cycle life, and power density. Cost estimates as of 2010 range from approximately $500–$1200/kWh, depending on the source of the information and the projected volumes used. The most reliable figure for 2010 is probably the $1000/kWh. Figure 6.1 shows one estimate of the state of battery
EV Battery StatusHigh Energy Battery
General Motors - Ford - Chrysler 21USABC - Steven Clark September 3, 2010
0%
20%
40%
60%
80%
100%
120%
140%Power Density
Specific Power - Discharge
Specific Power - Regen
Energy Density - C/3
Specific Energy - C/3
Power/Energy Ratio
Calendar Life
Cycle Life
Power & Capacity Degradation
Production Price (@10k/yr)
Operating Environment
Recharge Time
High Rate Recharge
Continuous Discharge - 1 hr
USABC Goal Near Term Status Long Term Status
Figure 6.1. A summary of the status of battery development for BEVs using Li-ion chemistries against USABC’s near-term and long-term goals (see Table 6.1). While some goals have been met, much work
remains. Price pessimism prevails. (Courtesy Steven Clark USABC and Chrysler Group LLC).
T-127 book.indb 89 8/24/11 9:22 AM
Downloaded from SAE International by Eric Anderson, Thursday, September 10, 2015

90 | Automotive 2030 – North America | Chapter 6
technology in 2009 against USABC’s goals for widespread commercial acceptance. Remaining technical hurdles, besides cost, include calendar life, package size in Wh/liter, and energy density in Wh/kg.
Other concerns voiced by an expert in the field, Dr. Menahem Anderman of Ad-vanced Automotive Batteries, a consulting and analyst firm, include safety, reli-ability, and durability [3]. In fact, he rates these three factors above cost and energy density in order of importance towards the commercial acceptance of BEVs. Once BEVs establish safety, reliability, and durability, then cost, performance, and energy density can follow. He points to a number of unresolved design trade-offs, such as using pouch cells versus metal-can types with hard casings. He advocates the metal-can types [3].
To engineer-in reliability and manage uncertainty, automotive OEMs tend to over-size the batteries. This further compounds the cost issue [4]. Since, as of 2010, the operating temperature range does not meet the USABC goal, it is easier to optimize batteries for either high or low temperatures. This leads to a challenge in engineer-ing batteries to operate over a wide range of temperatures, from say an Alaskan winter to an Arizonan summer.
What is the likelihood of meeting these goals, especially price, by 2030? Both government-sponsored committees and private experts conducted studies through 2010. No consensus in details emerges from looking at this data. However, a broad trend of steadily declining prices emerges. Some comments from experts in the field, while not necessarily contradictory, also show this range of price uncertainty. Anderman from Advanced Automotive Batteries believes that prices for BEV batteries could get down to about $600–$700 per kWh by 2015, a significant drop in just a few years [5]. In the same period, the EPA in a study supporting the current CAFE regulations predicts a drop in cost to $300/kWh. Another study spon-sored by EPA, NHTSA, and CARB—considered optimistic by many—indicated that battery pack costs for use in BEVs could get in the $136–173/kWh range by 2025, de-pending on the size and volumes produced [6]. In this same study, the authors report that the stakeholders they interviewed estimated battery pack costs in the $250–$300/kWh range by 2025. Another study by the National Academy of Sciences (NAS) projects a cost in 2025 of about $715/kWh, assuming a 3% decline in price per year due to economies-of-scale and learning-curve benefits [7]. This might be considered
T-127 book.indb 90 8/24/11 9:22 AM
Downloaded from SAE International by Eric Anderson, Thursday, September 10, 2015
Automotive 2030 – North America | Chapter 6 | 91
the most pessimistic estimate and uses a simple percentage price decline per year model rather than a more involved analysis.
Another study by the Boston Consulting Group (BCG) took a detailed look at the cost components of battery packs and how they are manufactured. This group concluded that 70% of cell costs and 75% of battery pack costs are volume depen-dent, effectively creating a cost-floor for current Li-ion technology. Their analysis suggests that OEMs might pay in the range of $360–$440 per kWh for batteries that store up to 15 kWh by the year 2020 [8]. “We view cost coming down in a decay curve—steeper reduction up front and slower later—versus a linear de-cay. This is consistent with scale-curve economics where cost falls at a consistent rate for each doubling of production volume. As doublings are exponential and get more difficult to achieve, it becomes more difficult to achieve the same level of cost reduction,” explains Ripley Martin, principal for the Boston Consulting Group and one of the authors of the study. Another opinion echoes the belief that costs for batteries will decline by 35% by 2020, then decline more slowly because Li-ion battery cells are far along their learning curve [9]. Another somewhat op-timistic scenario from Deutsche Bank predicts automotive battery costs as low as $250/kWh by 2020 [10].
What should we make of all this?
Experts in the field, sometimes looking at the problem from different perspectives, made all these projections. All of these future prices are based on reasonable, if sometimes differing, assumptions. The wide range reflects the uncertainties over a rapidly evolving technology. They also, to a degree, reflect uncertainty over vol-umes, the classic Catch-22. High-volume production leads to lower costs and steep price declines, but no one will commit to high volumes without steep price de-clines. Figure 6.2 plots out some cost estimates collected by the author, enough to show that a solid trend might be difficult to establish.
Unsurprisingly, a lot of effort has been expended to influence the development of better batteries. Through 2010–2030, new technology developments could certainly change this picture. For instance, in 2010 the De-partment of Energy’s Advanced Research Projects Agency—Energy (ARPA-E) is funding a number of high-risk battery storage research projects in its Batteries for
T-127 book.indb 91 8/24/11 9:22 AM
Downloaded from SAE International by Eric Anderson, Thursday, September 10, 2015

92 | Automotive 2030 – North America | Chapter 6
Electrical Energy Storage in Transportation (BEEST) program. Projects funded range from solid-state Li-ion batteries to an All-Electron battery that moves electrons rather than ions. In another example, Argonne National Laboratory is researching the feasibility of lithium-air batteries that might have five to ten times the storage capacity of lithium-ion [11]. Another technology that might not in-crease density storage over Li-ion batteries but might significantly reduce recharge time is the redox flow battery [12]. Here is a partial (note—partial) list of high-risk, high-payoff battery developments, many funded under the BEEST program.
Figure 6.2. This wide range of cost estimates in 2010 reflects uncertainty over predicting the rapidly evolving battery storage
for BEVs. All trend downward. (Source data: NAS, 2010 [7], AAB [5], EPA [6], BCG [8], Deutsche Bank [10]).
EPA (Optimistic); 2014
EPA (Optimistic); 2020
NAS; 2010
NAS; 2025
BCG; 2010
BCG; 2020 Deutsche Bank; 2011
Deutsche Bank; 2015
Deutsche Bank; 2020
0
200
400
600
800
1000
1200
1400
2010 2011 2012 2013 2014 2015 2016 2017 2018 2019 2020 2021 2022 2023 2024 2025 2026 2027 2028 2029 2030
$/kW
h
Year
EPA (Optimistic) NAS AAB EPA(stakeholder) BCG Deutsche Bank
USABC Minimum Cost Goal for Energy Batteries $150
T-127 book.indb 92 8/24/11 9:22 AM
Downloaded from SAE International by Eric Anderson, Thursday, September 10, 2015

Automotive 2030 – North America | Chapter 6 | 93
• Lithium-airbatteries• Vanadiumredoxflowcells• Semi-solidrechargeablepowerelectrochemicalfuels• Magnesium-ionbatteries• Solid-stateinorganiclithiumbatteries• Zincflowairbatteries• Lithium-sulfurbatteries• 3-Dhigh-energy-densitycapacitors• All-electronbatteriesthatmoveelectronsratherthanions
“Battery technology is the single most challenging subsystem for the commercial viability of plug-in hybrid electric vehicles (PHEVs) and BEVs,” observes Jay Bar-on, president and CEO of the Center for Automotive Research who served on a panel developing an assessment of fuel-economy technologies for the National Re-search Council. This panel stated that the practicality of full-performance battery electric vehicles depends on a battery cost breakthrough that is not anticipated by 2025, according to Baron.
While predicting technological breakthroughs is difficult, such research needs to be encouraged and monitored. Using a prediction of a breakthrough for plan-ning purposes may not be wise. At the same time, it may be more than likely that incremental improvements to batteries will cause cost drops more than the most pessimistic projections. For example, improvements in cathode materials for Li-ion batteries may improve them by 50–100%. This is significant enough to cause a steady drop in price without a splashy breakthrough.
Trends to look for in battery development:
• AsteadydeclineinLi-ionbatteryprice.ThepriceperkWhgoalsstatedbyUSABC will likely not be met by 2020, maybe not even by 2030.
• Forthenearfuture,atleastoutto2020,Li-ionwillcontinuetogainmar-ket share at the expense of NiMH. It will be the practical choice for BEVs, unless recall events occur in the deployment of them in the first wave of Li-ion cars.
T-127 book.indb 93 8/24/11 9:22 AM
Downloaded from SAE International by Eric Anderson, Thursday, September 10, 2015

94 | Automotive 2030 – North America | Chapter 6
• Emphasisonsafety,reliability,anddurabilityissuesinthetimeframe2010–2020(especiallyanynoteworthynewsitemscomingoutofthecropofBEVsexpectedinthemarketplaceafterMY2012)
• Fundedresearchonnewbatterytechnologiesandnewbatterychemistrieswillcontinue,primarilyfundedbygovernmentgrantsaimedatreducingpetroleumdependency.
• Thereisahigh degree of uncertaintyinhowbatterytechnologymayevolveintheperiod2010–2030;anumberofpromisingtechnologiesareunderdevelopment.All,some,ornonemaypanoutascommer-ciallyviable.
Recharging and infrastructureGettingelectronsintothevehicleisanotherissue.Althoughelectricityisevery-where,accessforcarrechargingisanissueinmany,especiallyurban,situations.Insuburbanhomeswithanattachedgarage,pluggingshouldbeeasyandconve-nient.Eveninsuburbansettings,garagesmaynotbelargeenough,andnotevery-oneusestheirgaragetoactuallystoreacar.(Ifillhalfofminewithlawnequip-ment,bikes,andrefusecans.)Howmanypotentialbuyerswillhaveeasyaccesstohomerecharging?Reportedly,asurveyconductedbytheUniversityofCalifornia,Davisfoundthatonly36%ofrespondentshadaplugavailabletoacarwithin10ft(3m)ofitsparkinglocation,while61%hadonewithin50ft(15m).
Rechargingtimeisanotherunpleasantfactor.Unlikegasoline,aswesaidinthebe-ginningofthischapter,ittakesfarlongertochargeabatterythanthefewminutesittakestopour10–15gallonsofgasolineintoatank.Usinghighervoltagesandcurrentscanspeedthingsup.Recognizingthis,BEVmanufacturersofferhigh-voltagechargesystemsforuseinhomes.Therearethreelevelsofchargingstations:
Level1:120-V,single-phaseACinputupto16A
Level2:240-V,single-phaseACinputupto80A
Level3:therangeof440–480V,withathree-phaseACcircuit(proposed)
Downloaded from SAE International by Eric Anderson, Thursday, September 10, 2015

Automotive 2030 – North America | Chapter 6 | 95
StandardizationofrechargingplugswillbeessentialtoacceptanceofBEVs.Canyouimaginewhatdriversmightthinkiftheycouldonlyrechargeusingaproprie-taryplug,availableonlyinselectlocations?SAE(SocietyofAutomotiveEngineers)Internationalestablishedsuchastandard,knownasJ1772,in2010.Level1andLevel2are,asof2010,definedinSAE’sJ1772standardonelectricvehiclecharging.
MostBEVownerswillfindpluggingintoastandard110–120Vwallsocketsatis-factory,atleastforthetechnologylikelytobeavailablein2010–2030.AruleofthumbforBEVrangesisthatthevehiclegetsabout3–4mi(5–6km)perkWh**.So,toget100mi(160km)betweenrechargesataminimumrequiresatleast24kWhofenergy.Abatterythatsizetakessometimetocharge.Forexample,theMY2011NissanLeafBEVestimatesits24-kWhbatterypackwilltake21hourstofullychargewitha110-Vsourceavailablefromastandardwallsocket.TheMY2012FordFocuswilltake18–20hoursonaLevel1charger,accordingtoFord.
MostautomakersofferingBEVsin2010willofferLevel2equipmentforuseinresidentialrecharging,significantlyreducingrechargetime.Tocompare,theNissanLeafwillfullychargeupitsbatterypackineighthoursusingitsLevel2device.Nissanischargingabout$2000orsoforit.TheMY2012FordFocusElectricwillbeabletochargeupits23kWhbatteryinthreetofourhoursusingaLevel2charger.Thesetypicallyrequirealicensedelectriciantoinstall,hencethepricevariabilitydependingonmodificationsrequiredforthehome.FordisofferingitsLevel2chargersthroughtheconsumerelectronicscompanyBestBuy.Itwillcostabout$1500andrequiresonlya240-Vplugservice.Oneestimatebelievestheadditionalcosttothehomeinfrastructure—toinstallabreakerpanelfor240-Vservice—couldreach$10,000[13]ininstanceswherethehomedoesnothavethatalready.
Forchargingevenfaster,theindustryisdevelopingaLevel3,oftendescribedasa“DCfastcharger.”Although,asof2010,Level3hasnotyetbeendefinedintheSAE
**TheChevyVolthasa16-kWhbatteryandclaimsa50-mile(3.1m/kWh)maximumelectric-onlyrange;theNissanLeafhasa24-kWhbatteryandclaimsa100-milemaximumrange(4.1m/kWh).Muchdependsontheefficiencyofthedrivetrain,drivingusage,andoverallsizeandweightofthecaraswell.Minimumrangesareabouthalfthesenumbers.Thisalsodoesnottakeintoaccountthatthebatteriesaremostlikelyoversized,andtheactualstate-of-chargeusedtopropelthevehiclecouldbemuchlessthanthedeliveredsizeofthebatteryinthevehicle.
Downloaded from SAE International by Eric Anderson, Thursday, September 10, 2015

96 | Automotive 2030 – North America | Chapter 6
J1772 standard [14], a few companies provide them. These Level 3 chargers use in the range of 440–480 V, with a three-phase AC circuit. A Japanese consortium, CHAdeMO, developed a standard for DC fast charging. Eaton Corporation offers its Pow-R-Station with a Level 3 option of 480 V at up to 250 A, with a promise of a 15- to 30-minute charge. The Nissan Leaf and the Mitsubishi MiEV used this stan-dard in developing equipment for DC fast charging. Nissan claims its fast charger for the Leaf delivers an 80% charge in 30 minutes. However, at an MSRP of 1.47 M yen (about U.S. $18,000 at 2010 exchange rate) and a required 49-kW, 200-V three-phase AC input line, these fast chargers may not be for the average home user [15]. Businesses and fleets might find them attractive. Few are in service as of 2010. A key point is that the BEV must be equipped to handle the Level 3 charging device. In the case of the Nissan Leaf, this requires an additional charge at the time it is or-dered—the Level 3 charger cannot be backfit on the Leaf.
Properly charging a battery composed of many cells, as automotive batteries are, is also a tricky business. All commercially viable electric vehicles will have on-board charging systems that convert external AC power into DC power at the right volt-age for the battery. The on-board charger, which on the Leaf is a 3.3-kW device, converts that AC power, conditions it, and distributes it correctly through the bat-tery. The MY 2012 Ford Focus Electric has a 6.6-kW on-board charger. Charging faster than the 30-minute Level 3 for a lithium-ion battery, say in five minutes, is practically impossible, according to a number of sources. It would cause the Li-ion battery to degrade through irreversible chemical reactions.
How important a widespread public infrastructure of charging stations is to adop-tion of BEVs is a key uncertainty. There is one line of thought that the spread of public chargers is essential to the adoption of BEVs. To try and help answer that question, among others, the DoE’s Energy Efficiency and Renewable Energy De-partment funded the Transportation Electrification Initiative. This project pro-vided $400M in cost-sharing grants to develop, demonstrate, and evaluate BEVs and charging infrastructure.
According to the DOE, 18 Transportation Electrification awards will deploy more than 22,000 electric vehicle chargers in homes, businesses, and public areas. Of these chargers, 320 of them will be Level 3 “fast chargers.” They will also deploy more than 13,000 electric drive vehicles. The biggest recipient is the company
T-127 book.indb 96 8/24/11 9:22 AM
Downloaded from SAE International by Eric Anderson, Thursday, September 10, 2015
Automotive 2030 – North America | Chapter 6 | 97
ECOtality North America, which will demonstrate 5700 all-electric Nissan Leafs and 2600 extended-range electric Chevy Volts. Other recipients include the companies Coulomb Technologies, General Motors, Chrysler, the South Coast Air Quality Management District, Cascade Sierra Solutions, Navistar, and Smith Electric Vehicles. The charger and vehicle deployment will be complete by the end of 2011. Expected to finish in 2014, these projects will result in development of information and data that is vital to understanding some of the deeper questions around infrastructure. Most importantly, using the data available from these proj-ects, the Department will have a much better understanding of how and why driv-ers use these vehicles and charging stations. Projects are spread across the country to aid in understanding regional differences. States include Arizona, California, Florida, Michigan, New York, Oregon, Tennessee, Texas, Washington State, and the District of Columbia.
BMW outfitted a number of specially built MINIs to run as BEVs in a field test conducted in Los Angeles and in the metropolitan New York City area. The re-sults were positive enough for the company to move ahead with plans for produc-ing purpose-built electric vehicles, including a two-seat sports car and its Megac-ity small car.
Another scheme to reduce charge time is to swap batteries. Many people do this for consumer items such as cameras and cell phones, so why not for cars? Weight and expense are the main arguments against a swapping scheme. A BEV battery weighs hundreds of pounds and costs many thousands of dollars. Moving and storing the batteries, and having the capital expense tied up in extra batteries, re-quires a different business model than simply making and selling a car and then passing on responsibility for upkeep and fueling to the owner (with the exception of warranty recalls). California company Better Place is advocating the concept and, as of 2010, developing technology, pilot projects, and a business model for battery swapping. Better Place is targeting Denmark and Israel initially for its business model. The key element for introduction of the model in North America on a widespread basis is agreement on a standard battery pack along with engi-neering the car to easily switch out the battery. That requires cooperation with the automakers in the design of the car. It also requires investment in battery-swap-ping equipment to make the batteries universally available.
T-127 book.indb 97 8/24/11 9:22 AM
Downloaded from SAE International by Eric Anderson, Thursday, September 10, 2015

98 | Automotive 2030 – North America | Chapter 6
Any way you look at it, charging infrastructure cost for BEVs will be substantial. To illustrate the potential size of the problem, the Boston Consulting Group esti-mates $8B invested in charging infrastructure by 2020 in the United States alone. The company also notes that in the United States, owners of BEVs are more likely than other places in the world to have access to home chargers.
Trends to look for in BEV charging infrastructure:
• DevelopmentofanSAEJ1771standardforLevel3charging,followedbydeployment of the standard in Level 3 charging equipment.
• Auniformconcept-of-operationforpublicchargingstations,growingoutof lessons learned from the Transportation Electrification Initiative and real-world experience. This may need to develop well before 2020 if the BEVs are to have a substantial impact by 2030.
• ContinuedemphasisonthepartofOEMstomakeiteasyforownerstoown and install Level 2 chargers. This will bolster the commuter car con-cept for BEVs but will do nothing for a BEV replacing a main car thought suitable for longer trips.
• ThetechnicalaspectsofhowtochargeupaBEVcararewellunderstood.However, key uncertainties remain on how the infrastructure will evolve, who pays for it, and how necessary it is for full acceptance of BEVs in a future world.
Perhaps the biggest anxiety to overcome for any meaningful penetration of BEVs is “range anxiety.” Without a pervasive public infrastructure of Level 2 and Level 3 chargers, any BEV owner will feel constrained. While working on better and cheaper batteries, one way the industry is addressing this problem of “range anxi-ety” is with the range-extended BEV, sometimes known as plug-in hybrids, the subject of our next chapter.
T-127 book.indb 98 8/24/11 9:22 AM
Downloaded from SAE International by Eric Anderson, Thursday, September 10, 2015

Automotive 2030 – North America | Chapter 6 | 99
References[1] Wakefield, Ernest H., History of the Electric Automobile: Hybrid Electric Ve-hicles, SAE International, Warrendale, PA, October 1998.
[2] 2011 Nissan LEAF Specifications released by Nissan Corp., November 2010.
[3] Ponticel, Patrick, “Battery guru a skeptic about Leaf, Volt batteries,” Automotive Engineering International, SAE International, Warrendale, PA, May 27, 2010.
[4] Anderman, Dr. Menahem, President, Advanced Automotive Batteries speaking at SAE’s 2010 Hybrid Electric Symposium, Feb. 2010.
[5] Personal communication with Dr. Menahem Anderman in December 2010.
[6] “Interim Joint Technical Assessment Report: Light-duty vehicle greenhouse gas emission standards and corporate average fuel economy standards for MY 2017 – 2025,” EPA, NHTSA, and CARB, September 2010.
[7] “Assessment of Technologies for Improving Light Duty Vehicle Fuel Economy,” Committee on the Assessment of Technologies for Improvising Light-Duty Ve-hicle Fuel Economy, National Research Council, National Academies Press, pre-publication copy, 2010.
[8] Dinger, Andreas et al., “Batteries for Electric Cars, Challenges, Opportunities, and the Outlook to 2020,” Boston Consulting Group research report, January 2010.
[9] “Transitions to Alternative Transportation Technologies – Plug-in Hybrid Electric Vehicles,” Committee on Assessment of Resource Needs for Fuel Cell and Hydrogen Technologies, The National Academies Press, 2010.
[10] “The End of the Oil Age – 2011 and beyond: a reality check,” Deutsche Bank Research Note, December 22, 2010.
[11] Website: http://www.transportation.anl.gov/publications/transforum/v10/v10n1/lithium_air.html, Downloaded on December 30, 2010.
T-127 book.indb 99 8/24/11 9:22 AM
Downloaded from SAE International by Eric Anderson, Thursday, September 10, 2015

100 | Automotive 2030 – North America | Chapter 6
[12] “Fraunhofer ICT Working on New Redox Flow Batteries with Improved Ca-pacity for EV Applications,” Green Car Congress, October 2009.
[13] Motavalli, Jim, “Bringing Home Baby, Your Electric Car,” New York Times, October 14, 2010.
[14] Ponticel, Patrick, “SAE standard on EV charging connector approved,” Automo-tive Engineering International, SAE International, Warrendale, PA, Jan. 15, 2010.
[15] Nissan press release, “Nissan Introduces Quick EV Charger,” May 21, 2010.
T-127 book.indb 100 8/24/11 9:22 AM
Downloaded from SAE International by Eric Anderson, Thursday, September 10, 2015

Automotive 2030 – North America | Chapter 7 | 101
Chapter Seven
Plug-ins and Range-Extended Electric VehiclesElectric vehicles may very well have failed in the 1990s, the last time there was a big push for them, due to range anxiety [1]. If range anxiety is an impediment, if charging times and charging availability adds to that anxiety, yet the end-goal re-mains electron mobility, how do we get there? Enter Plug-in Hybrid-Electric Ve-hicles (PHEVs) and Range-extended Electric Vehicles (REVs). A PHEV or REV means developing both the BEV technology and the infrastructure to support them, while providing a practical means of getting around without anxiety and as much freedom as we now have with gasoline and internal combustion engines (ICEs). These vehicles bridge the world of oil with the world of electron mobility.
From the customer’s point of view, there may be little difference in how these dif-ferent architectures look. They each have a plug for charging a battery and a fuel door for pouring in gasoline. From an engineering point of view, they are quite a bit different. What will be noticeable to the owner are different performance ca-pabilities and electric-only ranges. The REV grafts an ICE engine onto a BEV. In contrast, the PHEV grafts a long-term storage battery (“energy” battery) onto a Hybrid Electric Vehicle (HEV) architecture. Both have their pluses and minuses.
A key distinction about most plug-ins when compared to their fully BEV brethren is that their batteries tend to be smaller. This has cost advantages, since the BEV battery in 2010 is the most expensive part of the drivetrain and is expected to
T-127 book.indb 101 8/24/11 9:22 AM
Downloaded from SAE International by Eric Anderson, Thursday, September 10, 2015
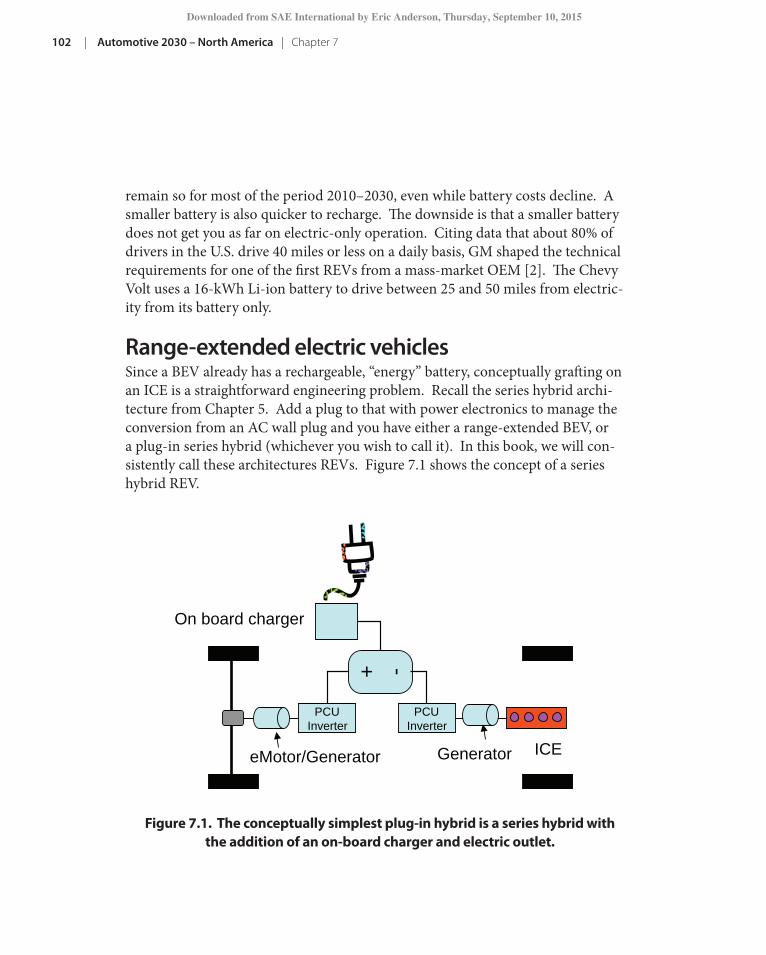
102 | Automotive 2030 – North America | Chapter 7
remain so for most of the period 2010–2030, even while battery costs decline. A smaller battery is also quicker to recharge. Th e downside is that a smaller battery does not get you as far on electric-only operation. Citing data that about 80% of drivers in the U.S. drive 40 miles or less on a daily basis, GM shaped the technical requirements for one of the fi rst REVs from a mass-market OEM [2]. Th e Chevy Volt uses a 16-kWh Li-ion battery to drive between 25 and 50 miles from electric-ity from its battery only. Range-extended electric vehicles Since a BEV already has a rechargeable, “energy” battery, conceptually graft ing on an ICE is a straightforward engineering problem. Recall the series hybrid archi-tecture from Chapter 5. Add a plug to that with power electronics to manage the conversion from an AC wall plug and you have either a range-extended BEV, or a plug-in series hybrid (whichever you wish to call it). In this book, we will con-sistently call these architectures REVs. Figure 7.1 shows the concept of a series hybrid REV.
eMotor/Generator
+ -
PCU Inverter
PCU Inverter
Series Hybrid REV
ICE
On board charger
Generator
Figure 7.1. The conceptually simplest plug-in hybrid is a series hybrid with the addition of an on-board charger and electric outlet.
T-127 book.indb 102 8/24/11 9:22 AM
Downloaded from SAE International by Eric Anderson, Thursday, September 10, 2015
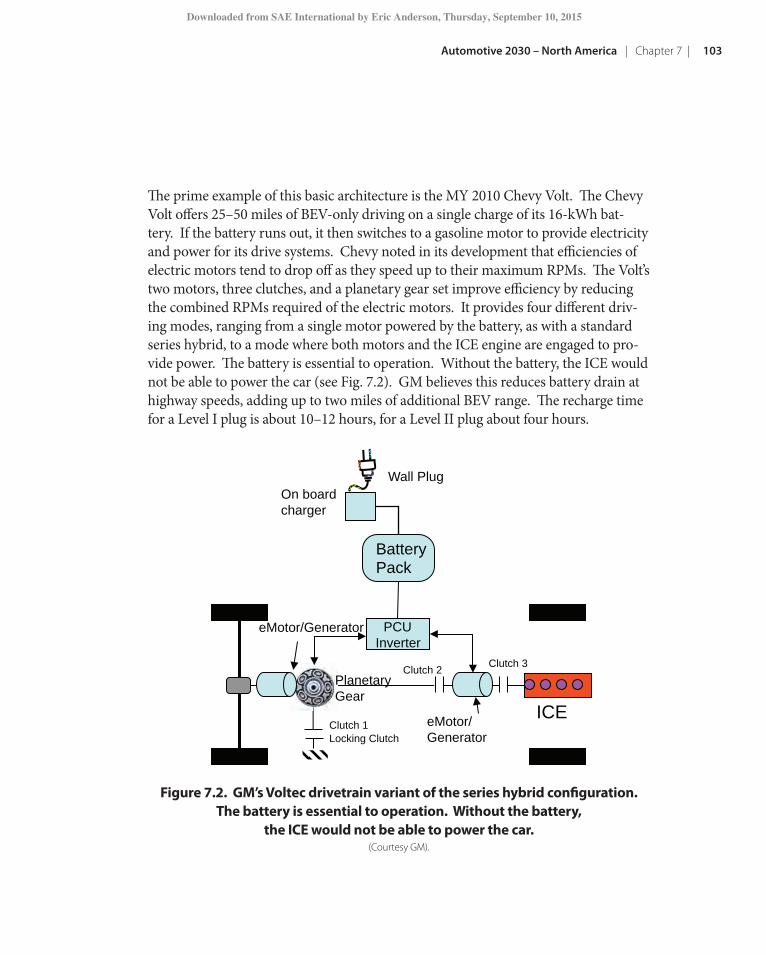
Automotive 2030 – North America | Chapter 7 | 103
Th e prime example of this basic architecture is the MY 2010 Chevy Volt. Th e Chevy Volt off ers 25–50 miles of BEV-only driving on a single charge of its 16-kWh bat-tery. If the battery runs out, it then switches to a gasoline motor to provide electricity and power for its drive systems. Chevy noted in its development that effi ciencies of electric motors tend to drop off as they speed up to their maximum RPMs. Th e Volt’s two motors, three clutches, and a planetary gear set improve effi ciency by reducing the combined RPMs required of the electric motors. It provides four diff erent driv-ing modes, ranging from a single motor powered by the battery, as with a standard series hybrid, to a mode where both motors and the ICE engine are engaged to pro-vide power. Th e battery is essential to operation. Without the battery, the ICE would not be able to power the car (see Fig. 7.2). GM believes this reduces battery drain at highway speeds, adding up to two miles of additional BEV range. Th e recharge time for a Level I plug is about 10–12 hours, for a Level II plug about four hours.
eMotor/Generator PCU Inverter
GM Voltec Electric Drive REV
ICE
On board charger
Clutch 3 Clutch 2
Clutch 1 Locking Clutch
eMotor/ Generator
Battery Pack
Wall Plug
Planetary Gear
Figure 7.2. GM’s Voltec drivetrain variant of the series hybrid confi guration. The battery is essential to operation. Without the battery,
the ICE would not be able to power the car. (Courtesy GM).
T-127 book.indb 103 8/24/11 9:22 AM
Downloaded from SAE International by Eric Anderson, Thursday, September 10, 2015

104 | Automotive 2030 – North America | Chapter 7
Plug-in hybrid electric vehiclesThe other type of plug-in is an upgrade of existing HEVs. The “power” batteries are augmented with “energy” batteries that are charged from a wall plug. Toyota’s Prius PHEV plug-in will swap out the Prius HEV NiMH battery pack with three lithium-ion battery packs. According to Toyota, pack one and pack two operate in tandem with the main battery pack. When pack one’s battery charge is depleted, it disconnects from the circuit and pack two engages to supply electrical energy to the driveline. When pack two is depleted, it disconnects from the circuit and the vehicle operates like a traditional hybrid, charging and discharging from the third, or main battery pack. Pack one and pack two will not reengage in tandem with the main bat-tery pack until the vehicle is plugged in and charged. The combined weight of the batteries is 330 lb (150 kg).
The Prius plug-in electric-only range, like many PHEVs, is shorter than the typical REV. Depending on driving conditions, the Prius plug-in can be driven approxi-mately 13 miles (21 km) on battery power, according to Toyota. Recharging time is about three hours on 110 V and 1.7 hours on 220 V. It can be “topped off” anytime with a convenient short charge [3]. Top speed of the BEV mode is up to approxi-mately 60 mph (97 km/h). This sort of range is typical of many PHEVs that are built from an existing HEV architecture.
Public acceptanceIn 1900, 28% of American automobiles—all 4192 of them—were electric vehicles. By 1920, the BEV was nearly extinct as a commercial product [4]. In 2010, the BEV and plug-in hybrids look to have a second chance. We may be at the dawn of a new era. For the 21st century version of the BEV not to follow its 20th century predeces-sor into extinction, challenges of cost and acceptance remain to be solved. When a battery pack alone costs what a small car, such as a Ford Focus, does, the benefits that extra price brings to the consumer have to be real. Although prices on HEVs have been dropping in the period leading up to 2010, their relative cost is higher.
Compared with a traditional compact vehicle powered by an ICE, a comparably sized HEV is typically priced 30–40% higher (see Fig. 7.3), and a BEV is priced 50–100% higher (depending on the subsidies received), according to J. D. Power and Associates
T-127 book.indb 104 8/24/11 9:22 AM
Downloaded from SAE International by Eric Anderson, Thursday, September 10, 2015
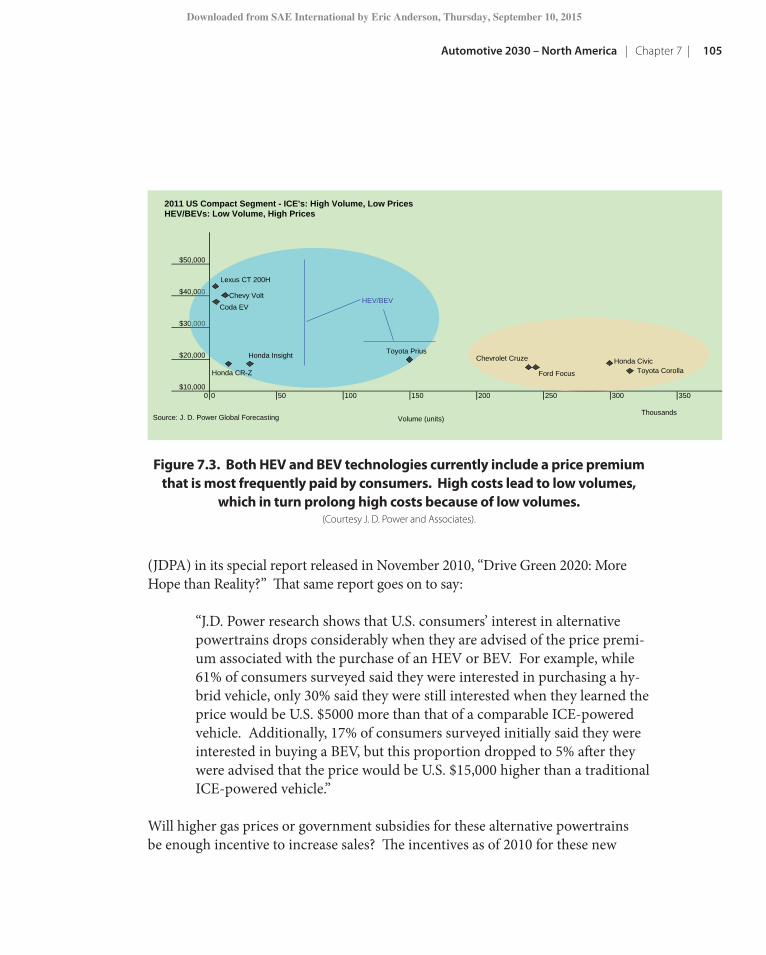
Automotive 2030 – North America | Chapter 7 | 105
(JDPA) in its special report released in November 2010, “Drive Green 2020: More Hope than Reality?” Th at same report goes on to say:
“J.D. Power research shows that U.S. consumers’ interest in alternative powertrains drops considerably when they are advised of the price premi-um associated with the purchase of an HEV or BEV. For example, while 61% of consumers surveyed said they were interested in purchasing a hy-brid vehicle, only 30% said they were still interested when they learned the price would be U.S. $5000 more than that of a comparable ICE-powered vehicle. Additionally, 17% of consumers surveyed initially said they were interested in buying a BEV, but this proportion dropped to 5% aft er they were advised that the price would be U.S. $15,000 higher than a traditional ICE-powered vehicle.”
Will higher gas prices or government subsidies for these alternative powertrains be enough incentive to increase sales? Th e incentives as of 2010 for these new
$50,000
$40,000
$30,000
$20,000
$10,0000 0 50 100 150 200 250 300 350
$40,000
$30,000
Lexus CT 200H
Chevy Volt
Honda Insight
Coda EV
Honda CR-Z
Toyota Prius Chevrolet Cruze
Ford Focus
Honda Civic Toyota Corolla
HEV/BEV
2011 US Compact Segment - ICE's: High Volume, Low Prices HEV/BEVs: Low Volume, High Prices
Source: J. D. Power Global Forecasting Volume (units) Thousands
Figure 7.3. Both HEV and BEV technologies currently include a price premium that is most frequently paid by consumers. High costs lead to low volumes,
which in turn prolong high costs because of low volumes. (Courtesy J. D. Power and Associates).
T-127 book.indb 105 8/24/11 9:22 AM
Downloaded from SAE International by Eric Anderson, Thursday, September 10, 2015

106 | Automotive 2030 – North America | Chapter 7
technologies seem driven by regulatory mandates, especially the CAFE regulations through 2016. Beyond these, a wider acceptance of electrified vehicles seems tied to either higher gas prices—well above $4.00/gal in 2010 dollars, or stiffer regula-tory requirements.
These uncertainties are not stopping automakers from pushing ahead with new developments. According to JDPA, there will be over 100 HEV and PHEV models available (worldwide) by 2014. With continued low volumes, what this means is an extensive amount of engineering and marketing work ahead.
References[1] Bucholz, Kami, “BEVs not quite ready for prime time,” Automotive Engineering International Online, April 2010.
[2] Morey, Bruce, “Future of plug-in hybrids forecast by panel,” Automotive Engineer-ing Online, Dec. 2008.
[3] Website: http://pressroom.toyota.com/pr/tms/toyota/toyota-reveals-prius-family-of-190206.aspx, Toyota, Downloaded February 2011.
[4] Schiffer, Michael Brian, Taking Charge, the Electric Automobile in America, Smith-sonian Books, 1994.
T-127 book.indb 106 8/24/11 9:22 AM
Downloaded from SAE International by Eric Anderson, Thursday, September 10, 2015
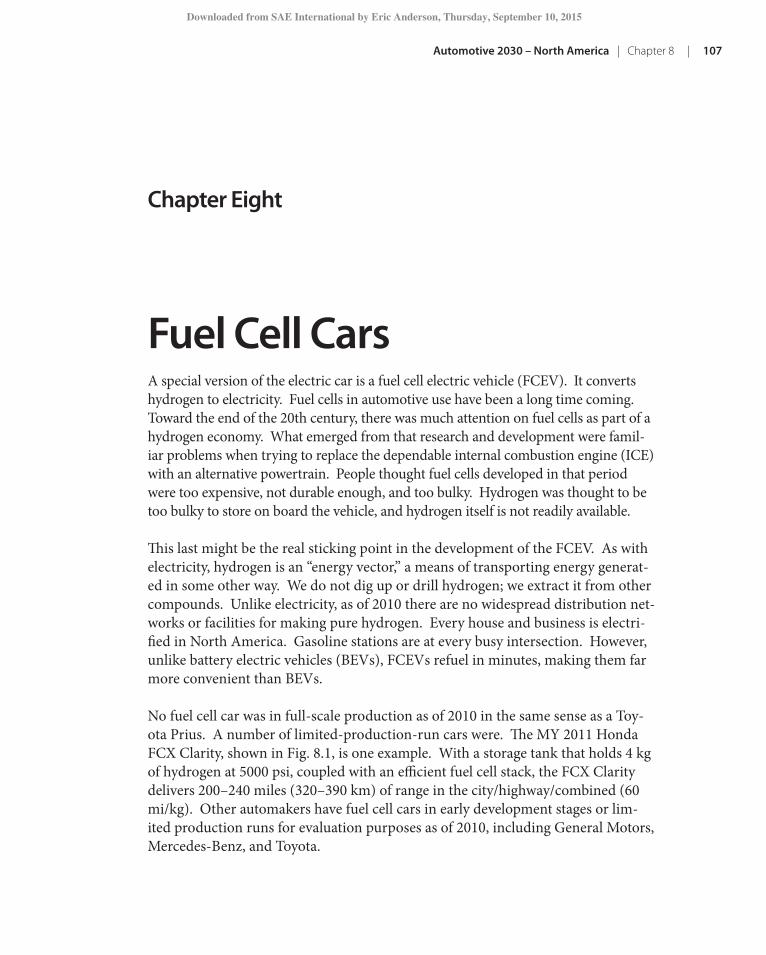
Automotive 2030 – North America | Chapter 8 | 107
Chapter Eight
Fuel Cell CarsA special version of the electric car is a fuel cell electric vehicle (FCEV). It converts hydrogen to electricity. Fuel cells in automotive use have been a long time coming. Toward the end of the 20th century, there was much attention on fuel cells as part of a hydrogen economy. What emerged from that research and development were famil-iar problems when trying to replace the dependable internal combustion engine (ICE) with an alternative powertrain. People thought fuel cells developed in that period were too expensive, not durable enough, and too bulky. Hydrogen was thought to be too bulky to store on board the vehicle, and hydrogen itself is not readily available.
This last might be the real sticking point in the development of the FCEV. As with electricity, hydrogen is an “energy vector,” a means of transporting energy generat-ed in some other way. We do not dig up or drill hydrogen; we extract it from other compounds. Unlike electricity, as of 2010 there are no widespread distribution net-works or facilities for making pure hydrogen. Every house and business is electri-fied in North America. Gasoline stations are at every busy intersection. However, unlike battery electric vehicles (BEVs), FCEVs refuel in minutes, making them far more convenient than BEVs.
No fuel cell car was in full-scale production as of 2010 in the same sense as a Toy-ota Prius. A number of limited-production-run cars were. The MY 2011 Honda FCX Clarity, shown in Fig. 8.1, is one example. With a storage tank that holds 4 kg of hydrogen at 5000 psi, coupled with an efficient fuel cell stack, the FCX Clarity delivers 200–240 miles (320–390 km) of range in the city/highway/combined (60 mi/kg). Other automakers have fuel cell cars in early development stages or lim-ited production runs for evaluation purposes as of 2010, including General Motors, Mercedes-Benz, and Toyota.
T-127 book.indb 107 8/24/11 9:22 AM
Downloaded from SAE International by Eric Anderson, Thursday, September 10, 2015
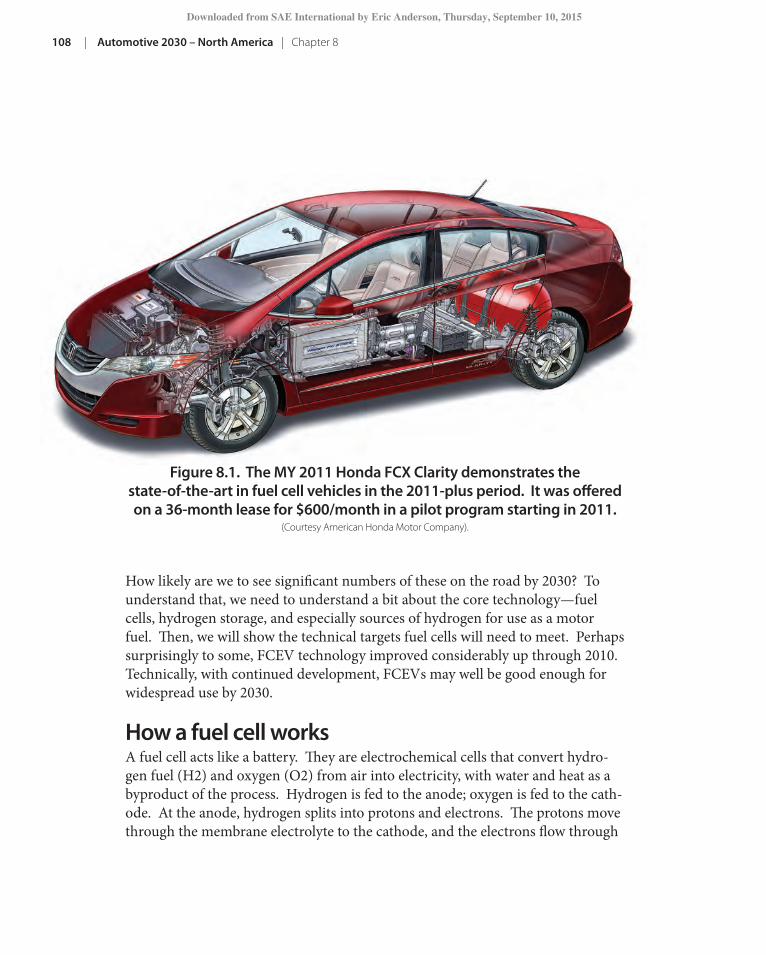
108 | Automotive 2030 – North America | Chapter 8
How likely are we to see significant numbers of these on the road by 2030? To understand that, we need to understand a bit about the core technology—fuel cells, hydrogen storage, and especially sources of hydrogen for use as a motor fuel. Then, we will show the technical targets fuel cells will need to meet. Perhaps surprisingly to some, FCEV technology improved considerably up through 2010. Technically, with continued development, FCEVs may well be good enough for widespread use by 2030.
How a fuel cell worksA fuel cell acts like a battery. They are electrochemical cells that convert hydro-gen fuel (H2) and oxygen (O2) from air into electricity, with water and heat as a byproduct of the process. Hydrogen is fed to the anode; oxygen is fed to the cath-ode. At the anode, hydrogen splits into protons and electrons. The protons move through the membrane electrolyte to the cathode, and the electrons flow through
Figure 8.1. The MY 2011 Honda FCX Clarity demonstrates the state-of-the-art in fuel cell vehicles in the 2011-plus period. It was offered on a 36-month lease for $600/month in a pilot program starting in 2011.
(Courtesy American Honda Motor Company).
T-127 book.indb 108 8/24/11 9:22 AM
Downloaded from SAE International by Eric Anderson, Thursday, September 10, 2015
Automotive 2030 – North America | Chapter 8 | 109
an external circuit to the cathode, where they recombine and react with oxygen to produce water [1]. Unlike batteries, because the oxidizing agent is either oxygen or air, they require special porous electrode structures that help the mass transport of fuel and air to the active surface sites where chemical reaction takes place. Fig-ure 8.2 shows the basics of an individual fuel cell.
Energy conversion efficiency is in the neighborhood of 50–60%. Because an in-dividual cell generates small amounts of voltage, cells are connected in series into “stacks.” A fuel cell stack provides the high voltages needed to power cars. The different fuel cell technologies that are available primarily differ in the electrolyte used (see Table 8.1).
Figure 8.2. An individual fuel cell using hydrogen and oxygen produces only electricity and water vapor.
Electrolyte
Anode Cathode
H2 O2
H2
Excess
H2O
- +
T-127 book.indb 109 8/24/11 9:22 AM
Downloaded from SAE International by Eric Anderson, Thursday, September 10, 2015
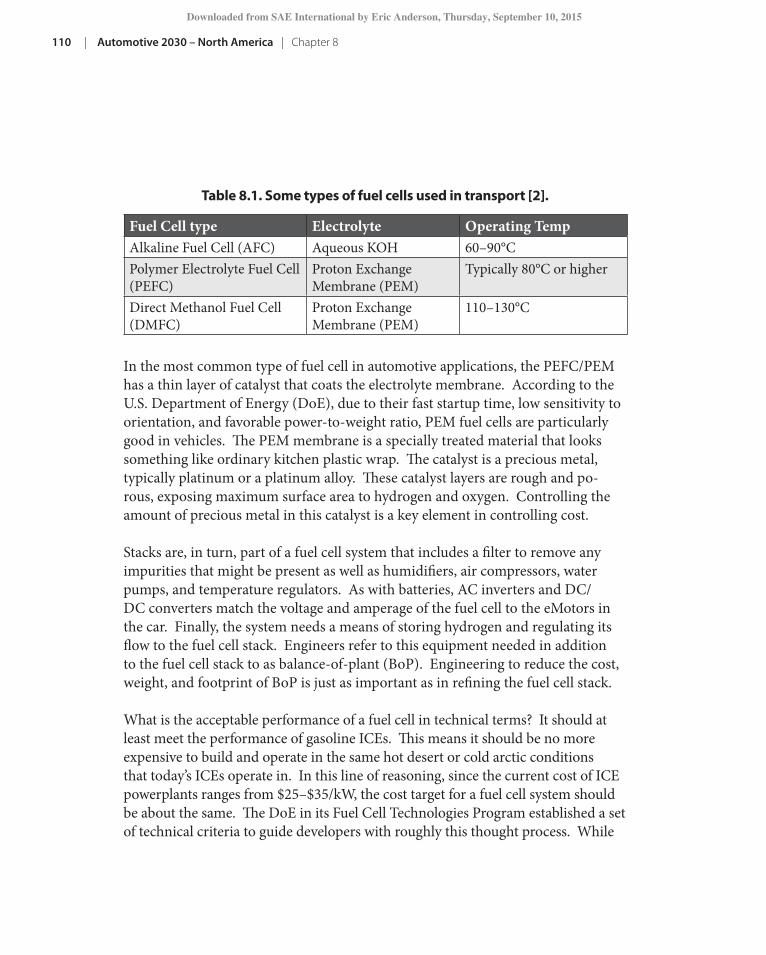
110 | Automotive 2030 – North America | Chapter 8
In the most common type of fuel cell in automotive applications, the PEFC/PEM has a thin layer of catalyst that coats the electrolyte membrane. According to the U.S. Department of Energy (DoE), due to their fast startup time, low sensitivity to orientation, and favorable power-to-weight ratio, PEM fuel cells are particularly good in vehicles. The PEM membrane is a specially treated material that looks something like ordinary kitchen plastic wrap. The catalyst is a precious metal, typically platinum or a platinum alloy. These catalyst layers are rough and po-rous, exposing maximum surface area to hydrogen and oxygen. Controlling the amount of precious metal in this catalyst is a key element in controlling cost.
Stacks are, in turn, part of a fuel cell system that includes a filter to remove any impurities that might be present as well as humidifiers, air compressors, water pumps, and temperature regulators. As with batteries, AC inverters and DC/DC converters match the voltage and amperage of the fuel cell to the eMotors in the car. Finally, the system needs a means of storing hydrogen and regulating its flow to the fuel cell stack. Engineers refer to this equipment needed in addition to the fuel cell stack to as balance-of-plant (BoP). Engineering to reduce the cost, weight, and footprint of BoP is just as important as in refining the fuel cell stack. What is the acceptable performance of a fuel cell in technical terms? It should at least meet the performance of gasoline ICEs. This means it should be no more expensive to build and operate in the same hot desert or cold arctic conditions that today’s ICEs operate in. In this line of reasoning, since the current cost of ICE powerplants ranges from $25–$35/kW, the cost target for a fuel cell system should be about the same. The DoE in its Fuel Cell Technologies Program established a set of technical criteria to guide developers with roughly this thought process. While
Fuel Cell type Electrolyte Operating TempAlkaline Fuel Cell (AFC) Aqueous KOH 60–90°CPolymer Electrolyte Fuel Cell (PEFC)
Proton Exchange Membrane (PEM)
Typically 80°C or higher
Direct Methanol Fuel Cell (DMFC)
Proton Exchange Membrane (PEM)
110–130°C
Table 8.1. Some types of fuel cells used in transport [2].
T-127 book.indb 110 8/24/11 9:22 AM
Downloaded from SAE International by Eric Anderson, Thursday, September 10, 2015

Automotive 2030 – North America | Chapter 8 | 111
the needs of commercial competition may require slightly different—or even more challenging—requirements in the period 2015–2030, they give a sense for what they are and how challenging they are to meet. These are shown in Table 8.2.
Characteristic Units 2005 Status
2010 Target
2015 Target
Energy efficiency @ 25% of rated power (Ratio of DC output energy to the lower heating value of the input fuel (hydrogen). Peak efficiency occurs at about 25% rated power.)
% 59 60 60
Energy efficiency @ rated power % 50 50 50Power Density W / L 500 650 650Specific Power W / kg 470 650 650Cost [Based on 2002 dollars and cost projected to high-volume production (500,000 systems per year)]
$ / kW 110 45 30
Transient response (time from 10% to 90% of rated power)
seconds 1.5 1 1
Cold start-up time to 50% of rated power @ –20°C ambient temp.
seconds 20 30 30
Cold start-up time to 50% of rated power @ + 20°C ambient temp.
seconds <10 5 5
Start up and shut down energy from -20°C ambient temp.
MJ 7.5 5 5
Start up and shut down energy from +20°C ambient temp.
MJ N/A 1 1
Durability with cycling (number of operational hours the fuel cell can operate under normal driving conditions for 150,000 miles)
Hours ~1000 5000 5000
Unassisted start from low temperatures Deg. C -20 -40 -40
Table 8.2. Fuel Cell power systems technical targets for automotive applications (assuming a PEM fuel cell) for 2010 and 2015, assuming an 80-kW (~108-hp)
system operating on direct hydrogen [3]. (Targets exclude hydrogen storage, power electronics, and electric drive.)
T-127 book.indb 111 8/24/11 9:22 AM
Downloaded from SAE International by Eric Anderson, Thursday, September 10, 2015
112 | Automotive 2030 – North America | Chapter 8
Hydrogen storageGaseous hydrogen is the lightest and least dense element in the universe. This fact makes it the most difficult to store and transport. Although gaseous hydrogen con-tains almost three times the energy of gasoline per weight, it stores four times less per volume. For comparison purposes, 1 kg of hydrogen contains as much en-ergy as 1 gal of gasoline. According to the DoE, at least 5 kg or more of hydrogen provides drivers a 300-mile (480-km) range, depending on the fuel cell efficiency and the size of the vehicle. Since fuel cells are roughly twice as efficient as an ICE in converting energy, they need less hydrogen to travel just as far. A distance of 300 miles is a comparable range to most gasoline cars on the road today. However, 5 kg of gaseous hydrogen takes up about 1921 L when stored, including the pressure tank, which is equal to a volume of about 50 gal.
To increase storage density there are three basic methods [4]:• Compressedgas• Cryogenicliquidstorage• Usingamaterialtostorethehydrogen,wherethehydrogenisstoredeither
on the surface or within a solid
The problem with compressed gas is the high pressures required, between 5000 and 10,000 psi (~350 and 700 bar, respectively). As a cryogenic liquid, at one at-mosphere the boiling point of hydrogen is -252.8°C. Keeping the gas that cold on a car is a challenge. It can be done; it is a question of economics. Using an advanced material to store hydrogen in cheaper, less-pressurized containers is also an area of research. Using the material storage method, hydrogen is stored on the surfaces of solids (by adsorption) or within solids (by absorption). Hydrogen molecules dis-sociated into single atoms and incorporated into hydrides may make it possible to store larger quantities of hydrogen in smaller volumes. These methods may also use lower pressures and operate close to room temperatures. It is an area of re-search rather than practical application as of 2011.
As in the case of fuel cells, the DoE established technical targets for hydrogen stor-age, presented in Table 8.3. While all of these component targets are useful to un-derstand, the bottom line to the customer is the value they are getting. The bottom
1According to the DoE, the volumetric capacity for a high-pressure tank that includes the com-plete system plus H2 is about 26 g/L system. This translates to 0.026 kg in 1 L, which means that 5 kg is about 192 L.
T-127 book.indb 112 8/24/11 9:22 AM
Downloaded from SAE International by Eric Anderson, Thursday, September 10, 2015
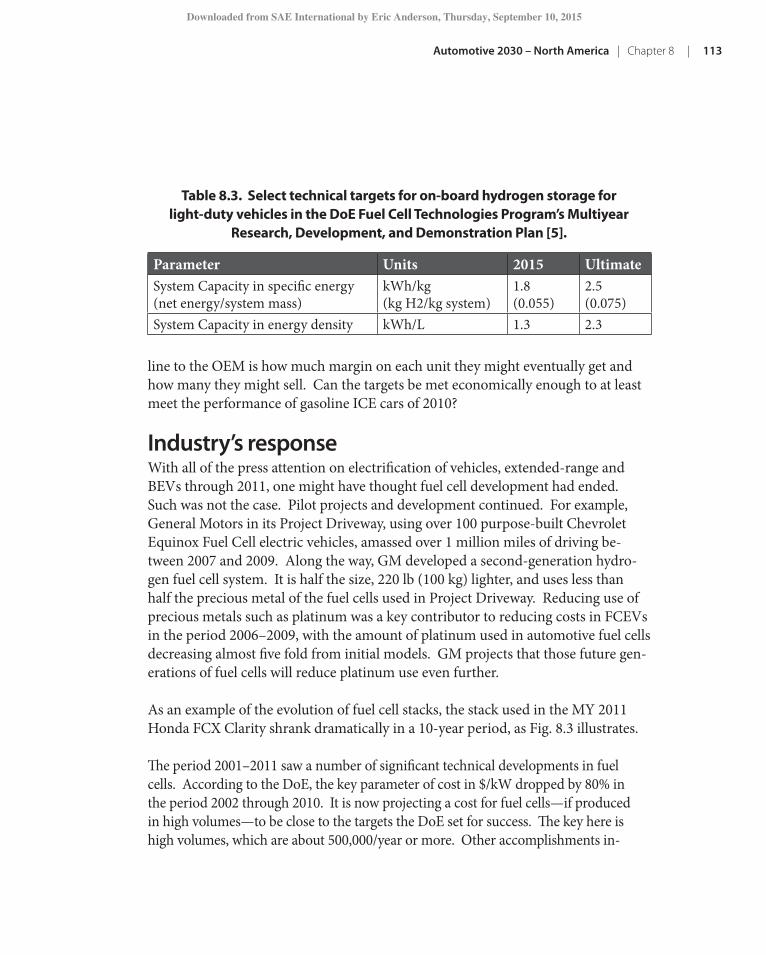
Automotive 2030 – North America | Chapter 8 | 113
line to the OEM is how much margin on each unit they might eventually get and how many they might sell. Can the targets be met economically enough to at least meet the performance of gasoline ICE cars of 2010?
Industry’s responseWith all of the press attention on electrification of vehicles, extended-range and BEVs through 2011, one might have thought fuel cell development had ended. Such was not the case. Pilot projects and development continued. For example, General Motors in its Project Driveway, using over 100 purpose-built Chevrolet Equinox Fuel Cell electric vehicles, amassed over 1 million miles of driving be-tween 2007 and 2009. Along the way, GM developed a second-generation hydro-gen fuel cell system. It is half the size, 220 lb (100 kg) lighter, and uses less than half the precious metal of the fuel cells used in Project Driveway. Reducing use of precious metals such as platinum was a key contributor to reducing costs in FCEVs in the period 2006–2009, with the amount of platinum used in automotive fuel cells decreasing almost five fold from initial models. GM projects that those future gen-erations of fuel cells will reduce platinum use even further.
As an example of the evolution of fuel cell stacks, the stack used in the MY 2011 Honda FCX Clarity shrank dramatically in a 10-year period, as Fig. 8.3 illustrates.
The period 2001–2011 saw a number of significant technical developments in fuel cells. According to the DoE, the key parameter of cost in $/kW dropped by 80% in the period 2002 through 2010. It is now projecting a cost for fuel cells—if produced in high volumes—to be close to the targets the DoE set for success. The key here is high volumes, which are about 500,000/year or more. Other accomplishments in-
Parameter Units 2015 UltimateSystem Capacity in specific energy (net energy/system mass)
kWh/kg(kg H2/kg system)
1.8(0.055)
2.5(0.075)
System Capacity in energy density kWh/L 1.3 2.3
Table 8.3. Select technical targets for on-board hydrogen storage for light-duty vehicles in the DoE Fuel Cell Technologies Program’s Multiyear
Research, Development, and Demonstration Plan [5].
T-127 book.indb 113 8/24/11 9:22 AM
Downloaded from SAE International by Eric Anderson, Thursday, September 10, 2015

114 | Automotive 2030 – North America | Chapter 8
clude significantly advancing the range of operating temperatures of fuel cells. The 2011 Honda FCX boasts cold start and operating temperatures down to -30°C (-22°F); Mercedes-Benz with its F-CELL system operates down to -25°C (-13°F). Honda’s FCX is advertising a 240-mile (390-km) range, and range for the F-CELL is about 260 miles (400 km). The Honda uses 5000-psi (350-bar) tanks; the F-CELL uses 10,000-psi (700-bar) tanks. Reportedly, Honda uses the same tanks commonly used to store natural gas. In the 2010 era, they are filament-wound carbon-fiber-reinforced plastic (CFRP), although more research and development in better storage solutions is continuing.
The DoE Office of Fuel Cell Technologies projects cost of fuel cells—if manufac-tured in a volume of 500,000 units per year [6]. The goal for 2010 was $45/kW
Figure 8.3. The fuel cell stack used in the MY 2011 Honda Clarity is ¼ the size (per kW output) of a comparable stack from 10 years earlier. The FCX Clarity,
with stack plus the BoP that contains it, is 40% smaller and 400 lb (180 kg) lighter than Honda’s previous-generation fuel cell vehicle.
(Courtesy American Honda Motor Company).
T-127 book.indb 114 8/24/11 9:22 AM
Downloaded from SAE International by Eric Anderson, Thursday, September 10, 2015

Automotive 2030 – North America | Chapter 8 | 115
(see Fig. 8.4). Although a number of challenges remain in terms of fuel cell vehicle development, none seems insurmountable in the years 2010–2020. “It is challeng-ing but possible to meet the DoE technical targets necessary for commercialization by 2015,” explains Romesh Kumar, Senior Chemical Engineer with the Argonne National Laboratory who has been researching fuel cells for over a decade. Cost and durability targets are the two most challenging, according to him. He also believes there may be a need to prioritize targets to meet the commercialization goal, for instance trading effi ciency or durability to meet cost targets. Unknowns remain. “For instance, the makers of fuel cells have reduced platinum loading, but does that shorten the stack lifetime?” he asks rhetorically. Th ere may be more than simply meeting the DoE targets as well. “You know, the car companies have to sat-isfy the customer, so the drivability and performance of the car may require targets that are actually more stringent than those set by DoE,” he explains.
“Th e best modeling from Honda shows we can achieve the cost goals in $/kW— at volume levels consistent with mass-produced vehicles—to meet commercial success,” explains Steve Ellis, Manager of Fuel Cell marketing for Honda. Size and power density has come a long way toward meeting targets. “We now have a
Figure 8.4. DoE Offi ce of Fuel Cell Technologies’ transportation fuel cell system cost projections. [6]
T-127 book.indb 115 8/24/11 9:22 AM
Downloaded from SAE International by Eric Anderson, Thursday, September 10, 2015
116 | Automotive 2030 – North America | Chapter 8
power system in 2010—that is the fuel stack plus balance-of-plant—that is smaller than a typical V-6 engine with a transmission or transaxle assembly and about the same weight,” remarks Ellis. “This allows us to put it into a sedan-sized car, like the Honda Clarity.” He goes on to explain that although the MY 2011 FCX has a driving range of 200–240 miles in real-world conditions, further improvements to 300 miles is not impossible. Durability, cold start, and other important elements are all quite feasible technically. While it may not be ready for “prime time” in the 2015–2020 period, engineering an FCEV vehicle that meets cost and durability requirements required for commercial acceptance seems achievable by at least 2030, if technology developments and investments continue.
The estimated system costs for fuel cells drop dramatically when volumes ramp up to 100,000 per year (as of June 2010), as shown in Fig. 8.5. This is an important point when considering the transitional phase of a shift to substantial numbers of FCEVs [7].
Technical trends to watch in FCEVs:
• Ifcontinuedcostreductionsanddurabilityincreasesareinlinewiththeexponential growth shown in the period 2000 through 2010, fuel cells may likely meet targets set for their acceptance. The rate of such improvements will most likely decline, with the kind of dramatic improvements shown from 2000–2010 hard to sustain. Key improvements include improved ranges of operating temperatures and proven durability.
• Improvedmethodsofstoringhydrogen,athigherpressuresorusingma-terial storage methods such as hydrides to store it at lower pressures and higher temperatures. Current methods of storage using pressurized tanks are providing up to 2/3 of the range volume (using the Honda FCX Clarity as a data point).
• AbilityofFCEVstomeetdurabilityremainsanuncertainty. Most re-searchers in the field are optimistic, but real world experience needs to prove it.
• Costatvolumeproductionremainsanuncertainty, and may remain so since all “cost at volume” calculations are projections through 2011.
T-127 book.indb 116 8/24/11 9:22 AM
Downloaded from SAE International by Eric Anderson, Thursday, September 10, 2015

Automotive 2030 – North America | Chapter 8 | 117
Hydrogen history, economy, and distributionUnlike electricity, which is available almost anywhere, a ready source of hydrogen is not. Like gasoline or diesel, it can easily refuel a car in minutes. Unlike gasoline, and like electricity, it is not a fuel in itself. No one mines or drills for hydrogen. We extract it from existing sources, such as natural gas or even from water. It is a way of transmitting energy from a primary source, sometimes called an energy vector. The primary source could be a coal-fired or nuclear power station, making the hy-drogen economy equivalent to the gasoline economy we are familiar with.
Figure 8.5. Estimated system costs for fuel cells drop when volumes reach 100,000 per year, as of June 2010.
(Data developed by Directed Technologies, Inc.).
$0
$30
$60
$90
$120
$150
$180
$210
$240
$270
$300
0 100,000 200,000 300,000 400,000 500,000
Sys
tem
Co
st (
$/kW
net
)
Annual Production rate (system/year)
System Cost
2015
2010
$51.31
$39.45
T-127 book.indb 117 8/24/11 9:22 AM
Downloaded from SAE International by Eric Anderson, Thursday, September 10, 2015

118 | Automotive 2030 – North America | Chapter 8
Practical methods of creating hydrogen include
1. Distributed steam methane reformation (DSMR) that uses natural gas as a feedstock. This could be done at a refueling station by piping natural gas to the station and reforming it locally. Natural gas pipelines are an existing infrastructure.
2. Coal gasification. This would require pipeline or truck delivery of hy-drogen from centralized reforming plants and a new infrastructure to be developed.
3. Centralized production from biomass production [8]. This is relatively new technology, though a number of “digesters” using a variety of waste from humans and animals have proven the viability.
4. Using electricity to split water into hydrogen and oxygen via electrolysis. Electricity could come from coal, nuclear, or renewable sources.
DoE reports that hydrogen might be produced by distributed reforming of natural gas at a projected high-volume cost of about $3.00/kg. This is a cost competitive with gasoline in 2011 [9]. According to another study, stations using distributed electrolysis could produce hydrogen at an average of $5.30/kg, assuming the station produces about 1500 kg per day [10]. There is an argument that if FCEVs are twice as efficient, then the price per kg of hydrogen could rise to two times that of gaso-line and remain competitive.
“We have been quite pleased with the progress our program has made [through 2010],” says Dr. Sunita Satyapal, director of the hydrogen and fuel cell program for DoE. The number of demonstration vehicles on the road through 2010 numbered in the 100s. The U.S. DoE Hydrogen and Fuel Cell Program worked with multiple partners to demonstrate vehicles and stations in California, New York, Florida, Michigan, and Washington D.C. “We have reduced the projected cost of fuel cells—if they are produced at high volumes of 500,000 units per year—by almost 80%. We demonstrated on-road efficiencies of up to 59%, and, so far, have shown durability of fuel cell vehicles up to 2500 hours, or 75,000
T-127 book.indb 118 8/24/11 9:22 AM
Downloaded from SAE International by Eric Anderson, Thursday, September 10, 2015
Automotive 2030 – North America | Chapter 8 | 119
miles, with only 10% degradation.” She goes on to explain that the program also demonstrated laboratory fuel cells with over 5000 hours of durability as well as testing on-road ranges of many vehicles with over 250 miles of range. One ve-hicle was capable of 430 miles between refueling. These cars went that far using only compressed hydrogen storage technology readily available in 2010. “We feel that we have made much progress in fuel cell technology. On-board storage could be improved, but it is not a showstopper for early market penetration. It is now up to the OEMs to decide on the vehicle readiness [for commercialization and production],” she explains.
“Hydrogen supply is one of the key challenges,” she states. According to the DoE, there are about 370 hydrogen-fueling stations worldwide in the year 2009. In the U.S., there were 69 stations in 2009, with 27 stations in California alone. For context, there are over 160,000 gasoline filling stations [11] in the U.S. Some analysts believe only 5,000 to 10,000 might be enough nationwide to get into an early adopter stage, although that is still a hefty investment. The technology for hydrogen refueling has little in common with gasoline. While hydrogen-refueling equipment could certainly occupy the same real estate as existing gasoline sta-tions, the purchase of that equipment is not trivial. Estimates for the cost of prototype or pre-commercial stations that produce anywhere from 60 to 100 kg of hydrogen per day range from $400K on the low-end (for hydrogen delivered to the station) to over $2M for onsite production through DSMR or electrolysis. Full-scale stations, capable of producing and dispensing up to 1500 kg/day, will lower the cost of each fill but require substantial capital. In other words, the real question may not be “if we invest money in capital equipment can we produce hydrogen at a cost that meets DoE’s target of $3/kg?” The question may be “how do we transition to a hydrogen economy where enough hydrogen is produced to facilitate volumes of FCEVs to make everything as cheap as we have it now?” (See Fuel Cells and Lighthouses.)
If hydrogen stations are built, but underutilized because there are not enough FCEVs refilling from them, the average cost of hydrogen goes up. One analysis shows that if a station built for a maximum capacity of 70 refuelings a day is used for only 10, the cost of hydrogen jumps from a projected $3.5/kg to $7.7/kg [8]. Commercial-scale stations are projected to produce about 1500 kg/day or about
T-127 book.indb 119 8/24/11 9:22 AM
Downloaded from SAE International by Eric Anderson, Thursday, September 10, 2015

120 | Automotive 2030 – North America | Chapter 8
300 refuelings at the minimum of 5 kg/refill. A scenario analysis provided in the same report demonstrated that a total cost to build a hydrogen infrastructure that supports 5.6 million FCEVs would be about $8 billion.
Could we make hydrogen at home? Honda is in the initial stages of developing a home charging station for hydrogen, based on its earlier FILL home station de-veloped for compressed natural gas (CNG) cars. It reforms natural gas into pure hydrogen for use in its FCX Clarity car. Natural gas is available in most homes in North America. Along the way, the unit will create electricity and heat for the home. It will produce 1/3 to ½ of a kilogram of hydrogen per day. “This should be sufficient to power the car for the average commutes,” explains Ellis from Honda. The Home Energy Station will be about the size of a larger home air-conditioning unit, according to him. The fuel cell stack in the station generates electricity, us-ing some of the hydrogen. Heat is a byproduct of the reforming process. He notes that such a station will most likely cost more than a Level 2 electric charger, as it provides more than hydrogen for the car. It also provides heat and electricity. They are also developing a solar-powered station to produce hydrogen from elec-trolysis using photovoltaic arrays to provide electricity.
The unique problem with developing hydrogen fuel cell vehicles is that the country needs to develop both vehicles and the infrastructure for creating and delivering hydrogen. The analogy is the classic question, what came first the chicken or the egg? Personal mobility using hydrogen cars and refueling stations need to appear in tandem.
An alternative to developing an initial, nationwide system of 10,000s of hydrogen fueling stations is to target a geographic area that would be ripe for market acceptance. Once a critical mass of filling stations, dealerships and services, plus drivers and customers is developed, the market could be expanded. Such an approach, advocated by a report
published by Oak Ridge National Laboratory [1], would eliminate the need to establish an expensive and risky nationwide system. A number of areas with increased demand have been identified; the two most promising are southern California in the Los Angeles area and the San Francisco bay area [2]. Others are in the Northeast, centered on New York City.
For example, in the period leading up to 2015, New York and LA metro areas might have 10s of refueling stations deployed. The automakers supplying FCEVs would establish dealerships and target selling or leasing FCEVs in these select areas. Buyers of FCEVs, innovative people who like to try new things, would be tempted to experiment
Fuel Cells and Lighthouses
T-127 book.indb 120 8/24/11 9:22 AM
Downloaded from SAE International by Eric Anderson, Thursday, September 10, 2015
Automotive 2030 – North America | Chapter 8 | 121
SummaryAs everyone interviewed for this chapter stressed, there is a key transition period before fuel cell cars are no longer novelties. Although no one expects North Amer-ica to be driving on hydrogen instead of gasoline by 2030, there has to be a critical number of FCEVs to make the whole thing cost-effective. If there are not many, there has to be enough. While engineers will most likely produce a vehicle design that will satisfy customers, it has to be produced in volumes to satisfy their pocket-books. Until there are enough orders to produce at least 100,000 fuel cells (better, 500,000), there will be a substantial price premium on FCEVs over traditional gas-oline vehicles. A key uncertainty is that, according to Satyapal from DoE, assuming engineers have the knowledge and talent to improve FCEVs, who will pay for that substantial development cost, particularly for infrastructure?
As Kumar from ANL points out, in the past, funding for sustained development of new technologies came from the marketplace itself. “Profits from the sales of Model Ts were used to evolve the next generations of Model Ts and successor cars,” explains Kumar. So might it be for fuel cell development. “No government or company has enough money to, say, spend 10 years or more developing fuel cell technology.” This argues for marketable fuel cell products, the revenues from which
with FCEVs. They would know they could refuel close to home. Putting the FCEVs in dense urban areas situates them where more such innovators are concentrated and each refueling station has a better chance of being fully used. This would be a Phase I, or initial introduction.
For Phase II, what the authors term Targeted Regional Growth, hydrogen infrastructure in eight additional cities would be deployed. This would expand the market for FCEVs. Interurban refueling stations would be positioned to create three corridors — Los Angeles-to-San Francisco; New York-Boston-Washington, DC; and Chicago-to-Detroit. Finally, in Phase III, what the authors term Inter-Regional Expansion, more corridors are established between urban centers. Drivers
could cross the country with careful planning. The numbers of vehicles, refueling stations, and government support varies based on adoption assumptions.
[1] Analysis of the Transition to Hydrogen Fuel Cell Vehicles and the Potential Hydrogen Energy Infrastructure Requirements, ORNL/TM-2008/30, March 2008, downloaded on January 31, 2001, http://cta.ornl.gov/cta/Publications/Reports/ORNL_TM_2008_30.pdf.
[2] Geographically-Based Hydrogen Demand & Infrastructure Rollout Scenario Analysis, Presentation to 2007 DOE Hydrogen Program Annual Merit Review and Peer Evaluation on May 15-18, 2007 in Arlington, Virginia, Nrel/pr-540-41535.
T-127 book.indb 121 8/24/11 9:22 AM
Downloaded from SAE International by Eric Anderson, Thursday, September 10, 2015

122 | Automotive 2030 – North America | Chapter 8
can help to develop further fuel cells for a variety of applications, including fuel cell automobiles. Such a product might be fuel cell forklifts. For example, Bridgestone, FedEX, Wegmans, Whole Foods, and Wal-Mart among others are experimenting with fuel-cell-powered forklifts. The advantage over battery-powered forklifts is much quicker recharge, though there remains a price premium [12]. Satyapal from DoE points out that commuter buses might also be another early progression to spur development of both hydrogen supply and fuel cell development. “In the early transition period, it is important to look at other applications of hydrogen, such as back-up power and forklifts, to spur the demand for hydrogen,” she explains. The idea here is that it will help the development of FCEVs by creating an infrastructure for hydrogen supply.
Some are optimistic. “Beginning in 2015, we will see the ramp-up of fuel cell ve-hicles in an all new way towards commercialization,” predicts Ellis from Honda. He believes it will be more of a series of “stair steps,” with numbers of vehicles and capabilities growing dramatically within a year or two, than leveling off before im-
Fig. 8.6 The “lighthouse” approach to a simultaneous introduction of hydrogen refueling stations and FCV cars establishes a workable, local economy in phases. Eventually these isolated urban areas are connected
by corridors with intercontinental refueling stations(from presentation by M. Melendez, NREL [2]).
T-127 book.indb 122 8/24/11 9:22 AM
Downloaded from SAE International by Eric Anderson, Thursday, September 10, 2015

Automotive 2030 – North America | Chapter 8 | 123
proving again, in contrast to a linear growth. Events internationally may also have an effect in the North American market. Satyapal points to agreements in Japan and Germany between governments and OEMs that may help spur market devel-opment and technologies. These agreements are also targeting the 2015 through 2020 period as an important period for commercial development.
Trends to watch for:• ExpectR&Deffortstocontinuetocreaterenewable,carbon-neutralhy-
drogen, as many believe it is the best option for reducing emissions and acting as a transport fuel. Using renewable sources such as wind or solar power is the Holy Grail for those concerned over global warming and pol-lution in general.
• Ifpolicymakers,OEMs,andlocalgovernmentssuchasCaliforniacon-tinue to fund hydrogen development, including not only subsidies or tax incentives for infrastructure, but also vehicles themselves.
• Thedemonstrationprojectsanddatacomingfromthevariousprogramsestablishing viability of hydrogen fuel cells, especially sufficient quantities of hydrogen at affordable prices.
• Thekeyindicatortoaninitialtransitiontohydrogen/FCEVeconomywillmost likely occur around 2015 through 2020. There may be as many as 40,000 FCEVs on the road by 2017 according to one confidential survey of OEMs [13], most likely clustered in southern California. A key uncer-tainty is if this will be enough to spur further development.
• InternationaldevelopmentsmayaffecteventsinNorthAmerica,asothercountries may choose to spend substantial amounts of public money to develop FCEV technology and hydrogen production. In today’s global economy, this could only benefit hydrogen deployment in North America as well.
• A key uncertainty is the level of government funding devoted to a hydrogen economy, and especially in the transition period. External factors, such as oil shocks and competitive technologies, will have a major impact.
T-127 book.indb 123 8/24/11 9:22 AM
Downloaded from SAE International by Eric Anderson, Thursday, September 10, 2015

124 | Automotive 2030 – North America | Chapter 8
References[1] Just the Basics Fact Sheet, Argonne National Laboratory.
[2] Automotive Handbook, 6th Edition, Robert Bosch & Co., October 2004.
[3] Fuel Cell Section of the DoE’s Program’s Multi-Year Research 2007, Chapter 3.4, Downloaded on January 24, 2011 from http://www1.eere.energy.gov/hydrogenand-fuelcells/fuelcells/fc_challenges.html.
[4] Hydrogen Storage Basics, DoE, http://www1.eere.energy.gov/hydrogenandfuel-cells/storage/basics.html, Downloaded Jan. 18, 2011.
[5] In 2009, the On-Board Hydrogen Storage System Targets were revised to reflect knowledge gained in hydrogen-fueled vehicles since the original release of the tar-gets. Revised targets downloaded on Jan.25, 2011, http://www1.eere.energy.gov/hydrogenandfuelcells/storage/current_technology.html.
[6] Website: http://www1.eere.energy.gov/hydrogenandfuelcells/accomplishments.html, Downloaded Jan. 19, 2011.
[7] James, Brian, Jeff Kalinoski, and Kevin Baum, Mass-Production Cost Estima-tion for Automotive Fuel Cell Systems, DoE H2 program review, Presented June 9, 2010, Directed Technologies, Inc., https://www1.eere.energy.gov/hydroge-nandfuelcells/pdfs/mass_production_cost_estimation_report.pdf, Downloaded May 28, 2011.
[8] Transitions to Alternative Transportation Technologies—A Focus on Hydrogen, National Academies Press, 2008.
[9] Assumes a production plant producing 1500 kg/day of hydrogen using natural gas that costs $6.1/MBtu and electricity costs $0.08/kWh and at least 500 such units produce. Reportedly, amortization of capital equipment is included in these cost figures, http://www1.eere.energy.gov/hydrogenandfuelcells/accomplishments.html and IBID above, Downloaded Jan. 19, 2011.
T-127 book.indb 124 8/24/11 9:22 AM
Downloaded from SAE International by Eric Anderson, Thursday, September 10, 2015

Automotive 2030 – North America | Chapter 8 | 125
[10] Wipke, Keith et al., “Controlled Hydrogen Fleet and Infrastructure Analy-sis,” 2010 DoE Annual Merit Review and Peer Evaluation Meeting, June 10, 2010, http://www.nrel.gov/hydrogen/proj_tech_validation.html, Downloaded January 31, 2010.
[11] NPN Market Data, http://www.npnweb.com/ME2/dirmod.asp?sid=A79131211D8846B1A33169AF72F78511&type=gen&mod=Core+Pages&gid=CD6098BB12AF47B7AF6FFC9DF4DAE988, Downloaded January 17, 2011.
[12] Costlow, Terry, “Giving fuel cells a lift,” Off-highway Engineering, SAE Interna-tional, November 2008.
[13] Assessment of Technologies for Improving Light Duty Vehicle Fuel Economy, Committee on the Assessment of Technologies for Improving Light-Duty Vehicle Fuel Economy; National Research Council, 2010 National Academies Press, pre-publication copy.
T-127 book.indb 125 8/24/11 9:22 AM
Downloaded from SAE International by Eric Anderson, Thursday, September 10, 2015

T-127 book.indb 126 8/24/11 9:22 AM
Downloaded from SAE International by Eric Anderson, Thursday, September 10, 2015
Automotive 2030 – North America | Chapter 9 | 127
Chapter Nine
Safety and Context— Cars Get Smart“The future ain’t what it used to be,” is a quote often attributed to one of America’s favorite philosophers, Yogi Berra. Movies used to show a future of flying cars, of-ten zipping by in stacked, elevated highways. That vision of the future changed, as it became apparent flying cars would never make economic sense. Now, cars that drive themselves are creeping into our vision of the future. For example, the 2004 movie I, Robot predicted a year of 2035 with thinking, capable robots, and—more relevant to this book—cars that drive themselves at high speeds. In fact, the main character is chided for unsafe driving by “going manual.” Based on technology trends since the year 2000, there may be kernels of truth in this future. A number of demonstrations have both shown the promise of autonomous cars, and their challenges. Could we expect a car that drives itself by 2030? Why would we want such a thing?
Convenience, safety, and congestion are three reasons for an autonomous car. Ac-cording to the National Highway Traffic Safety Administration, there were 33,808 deaths from crashes in 2009, the last year data is available [1]. Could an autono-mous vehicle react faster or intervene when the driver is incapacitated to reduce these deaths? Another thought is that autonomous cars could either reduce congestion or at least allow us to do productive things while creeping along in a traffic slow-down. “It is estimated that the cost of urban congestion runs around $78 billion and causes roughly 4.2 billion hours of travel delay,” explains Dr. Da-vid Schutt, Chief Executive Officer for SAE International. He points to using advanced technology that reduces traffic congestion by enabling routing of traffic
T-127 book.indb 127 8/24/11 9:22 AM
Downloaded from SAE International by Eric Anderson, Thursday, September 10, 2015

128 | Automotive 2030 – North America | Chapter 9
expeditiously away from bottlenecks. “Let us not forget about the net gain on the environmental side that the connectivity will offer,” he goes on to say. “Transpor-tation contributes 28% of U.S. green-house gas emissions and energy consump-tion while 2.9 billion gallons of fuel are wasted [in congestion].”
Safety firstThe beginning of smart cars may have been when antilock braking systems (ABS) were introduced. This was the first successful attempt to make cars safer by mak-ing them smarter in situations where humans often failed. Since first introduced in 1971, they became more widely available in the 1980s. In 2010, ABS is on 89% of cars and 99% of light trucks [2], according to data from the Insurance Insti-tute for Highway Safety. Where before, a human driver stomping on the brakes on slippery roads caused a spinout, now ABS takes over and “pumps” the brakes to get the best results. The key to this system is the wheel-speed sensor that de-tects an abrupt deceleration of the wheel, meaning the wheel is probably locking [3]. Computer-controlled hydraulic systems adjust to prevent wheel lock-up. Additional features that have grown in recent years include an ABS that adjusts when one set of wheels is on a slippery surface, and the other on a more tractive surface*. Another development in chassis control is the traction control system (TCS), designed to prevent wheel slip while accelerating on a wet or icy surface. Think of TCS as the opposite of ABS; TCS tries to maximize wheel adhesion dur-ing acceleration, ABS during stopping. While using the same wheel speed sen-sors, different systems control braking, fuel, or ignition [4].
Cars continued to get smarter. The next evolution was the introduction of elec-tronic stability control (ESC), which combines data from wheel-speed sensors, an additional yaw sensor, and the angle of the steering wheel to determine if the car is going where the driver intends. The ESC brakes certain wheels to prevent understeer (car turning less than needed) or oversteer (car turning more than intended). According to the Insurance Institute for Highway Safety (IIHS), as of 2011, 92% of all light vehicles offered for sale had ESC standard, after automakers first introduced it in significant numbers in the mid-1990s.
*Engineers call this split-μ, using the Greek symbol for friction.
T-127 book.indb 128 8/24/11 9:22 AM
Downloaded from SAE International by Eric Anderson, Thursday, September 10, 2015

Automotive 2030 – North America | Chapter 9 | 129
Regulation has much to do with this adoption. The United States requires ESC for all passenger vehicles less than 10,000 lb (4536 kg). The phase-in began with 55% of 2009 models (effective September 1, 2008), 75% of 2010 models, 95% of 2011 models, and all 2012 models. NHTSA’s definition of ESC includes “an algorithm to determine the need, and a means to modify engine torque, as necessary, to assist the driver in maintaining control of the vehicle [5].” Canada has similar regulations.
Cars get sensitiveSensors that help drivers understand their surroundings are now cheap and du-rable enough for mass-market cars. Ultrasonic sonar, digital cameras, millimeter wave radars, and laser sensors are finding their way into our everyday driving ex-perience, as shown in Fig. 9.1.
With the growth of sensors comes the growth of new automatic functions to help the driver, especially aimed at making driving safer. This growth has spawned a
Figure 9.1. Situational awareness sensors, such as these, grew in availability by 2011.
(Courtesy Roger Berg and Denso).
T-127 book.indb 129 8/24/11 9:22 AM
Downloaded from SAE International by Eric Anderson, Thursday, September 10, 2015

130 | Automotive 2030 – North America | Chapter 9
new category of automotive devices called Advanced Driver Assistance Systems (ADAS). “We track five specific systems as ADAS systems,” explained Dr. Egil Ju-liussen, Principal Analyst & Fellow Automotive Research Practice of IHS iSuppli, a market research firm. These are (see Table 9.1):
• ParkAssist,whereultrasonicorcamerasprovideawarningtoadriverofimminent collision when backing or warn of children or pets that cannot be seen from the driver’s seat.
• AdaptiveCruiseControl—usingaforwardsensorcoupledtoaspeedcon-trol, automatically slows the car down if traffic ahead is slow and speeds up to its set cruise speed when traffic clears.
• BlindSpotdetectionhelpswithlanechanges.
• Lanedeparturewarning(LDW),adevicetowarnofdriftoutofthelane,usually de-activated if the turn signal is on.
• AutonomousParking—usingsensorsandcomputers,thesystemaidspar-allel parking by turning the wheels automatically while the driver acceler-ates or stops.
This trend toward ADAS has been evident only since about 2000. Helena Perslow, Market Research Analyst in the Automotive & Transport Research Group of IMS Research, notes that her company classifies a number of additional technologies as ADAS, including forward collision warning, driver monitoring, and adaptive headlights. “Some of these systems, such as adaptive cruise control, have been on the market since about 2000,” she said. All aim to make driving safer. Not all will be winners.
Pointing to some of the key uncertainties in predicting such new technology, she notes “a lot of enthusiasm” about ACC when first introduced around 2000. “How-ever, it was always a costly option,” she remarks. “Everyone in the industry was optimistic about it and foresaw a great take rate for it. However, it has not really emerged from that initial state into a more mature system. This is due partly to
T-127 book.indb 130 8/24/11 9:22 AM
Downloaded from SAE International by Eric Anderson, Thursday, September 10, 2015

Automotive 2030 – North America | Chapter 9 | 131
Technology Share of models sold
2006 2007 2008 2009 2010 2011
Adaptive Cruise Control Availability
% 13.1 15.2 17.1 16.4 20.8 24.6
Blind Spot Detection Availability
% 0.0 1.2 6.2 11.1 18.2 23.3
Lane Departure Warning Availability
% 0.9 1.2 5.8 5.7 9.3 10.3
Camera Park Assist Availability
% 10.9 18.9 30.7 39.7 58.9 68.1
Ultrasonic Park Assist Availability
% 33.2 41.6 50.2 52.7 57.6 57.3
Autonomous Park Assist Availability
% 0.0 0.4 0.4 0.4 3.0 3.4
cost and partly to lack of perceived benefits from consumers.” Her data shows the take rate for ACC much less than 5% in North America, while higher in other areas of the world. Passive parking assist is more popular in North America, with a take rate of about 20%. She also notes that, as of 2010, ultrasonic versions are more popular than those that use cameras. “It is too soon to tell what is going to happen with the rest,” she said.
Regulatory requirements may dictate much of what might happen. She points to electronic stability control (ESC) as a case in point. “A lot of consumers are not aware of or do not experience the benefit of ESC, but now it has become manda-tory. Before that, the consumer demand was not there. This shows how take rates go up as a result of regulation—even if drivers do not know what it is,” she ex-plained. NHTSA five star crash ratings are another motivation. In fact, starting in 2011, NHTSA is adding forward collision warning and lane departure warning as an advisory to its five star rating, noting which cars have them [6]. “This is likely to make LDW and collision warning far more popular,” she states.
Table 9.1. Five driver assist systems tracked by IHS iSuppli and the percentage of models that offer them in the U.S.
Downloaded from SAE International by Eric Anderson, Thursday, September 10, 2015
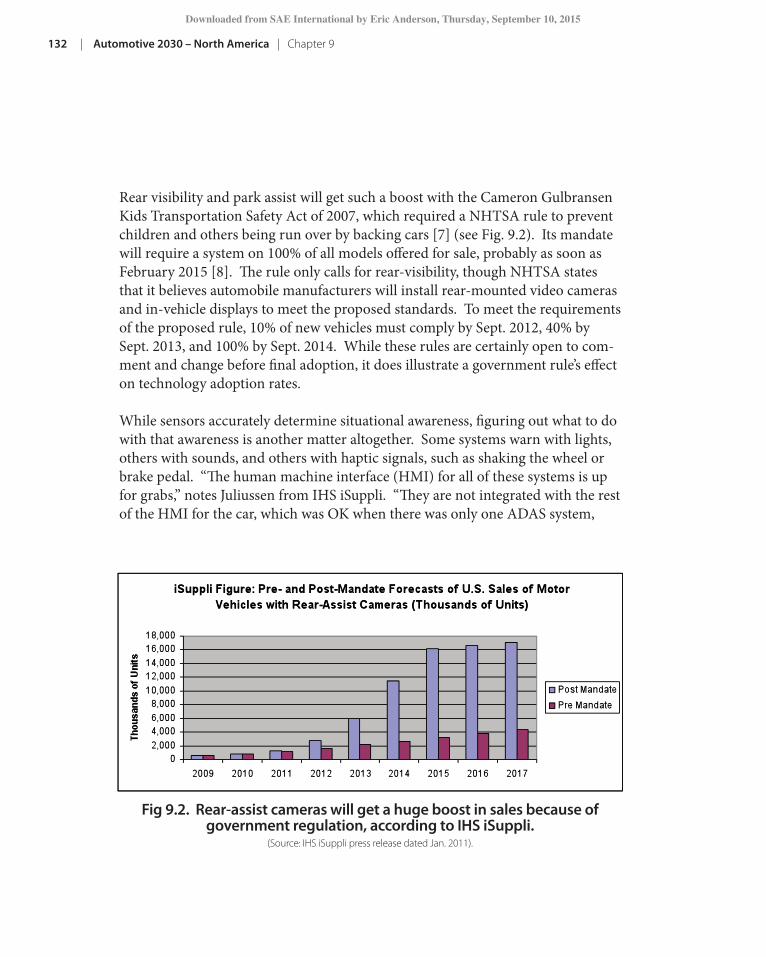
132 | Automotive 2030 – North America | Chapter 9
Rear visibility and park assist will get such a boost with the Cameron Gulbransen Kids Transportation Safety Act of 2007, which required a NHTSA rule to prevent children and others being run over by backing cars [7] (see Fig. 9.2). Its mandate will require a system on 100% of all models offered for sale, probably as soon as February 2015 [8]. The rule only calls for rear-visibility, though NHTSA states that it believes automobile manufacturers will install rear-mounted video cameras and in-vehicle displays to meet the proposed standards. To meet the requirements of the proposed rule, 10% of new vehicles must comply by Sept. 2012, 40% by Sept. 2013, and 100% by Sept. 2014. While these rules are certainly open to com-ment and change before final adoption, it does illustrate a government rule’s effect on technology adoption rates.
While sensors accurately determine situational awareness, figuring out what to do with that awareness is another matter altogether. Some systems warn with lights, others with sounds, and others with haptic signals, such as shaking the wheel or brake pedal. “The human machine interface (HMI) for all of these systems is up for grabs,” notes Juliussen from IHS iSuppli. “They are not integrated with the rest of the HMI for the car, which was OK when there was only one ADAS system,
Fig 9.2. Rear-assist cameras will get a huge boost in sales because of government regulation, according to IHS iSuppli.
(Source: IHS iSuppli press release dated Jan. 2011).
Downloaded from SAE International by Eric Anderson, Thursday, September 10, 2015
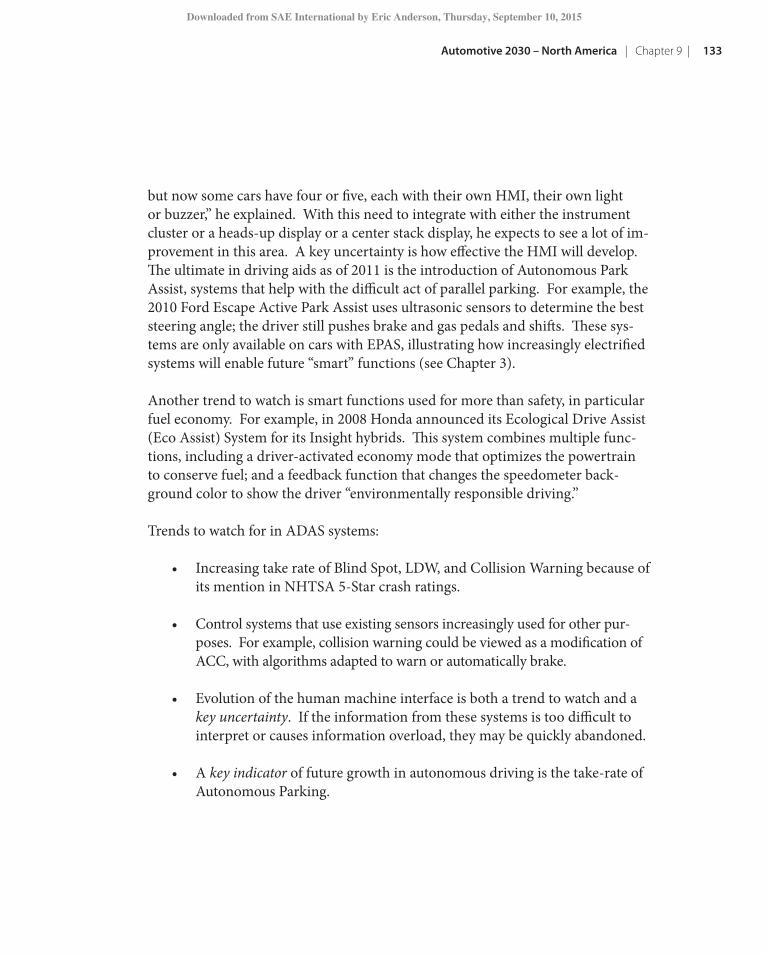
Automotive 2030 – North America | Chapter 9 | 133
but now some cars have four or five, each with their own HMI, their own light or buzzer,” he explained. With this need to integrate with either the instrument cluster or a heads-up display or a center stack display, he expects to see a lot of im-provement in this area. A key uncertainty is how effective the HMI will develop.The ultimate in driving aids as of 2011 is the introduction of Autonomous Park Assist, systems that help with the difficult act of parallel parking. For example, the 2010 Ford Escape Active Park Assist uses ultrasonic sensors to determine the best steering angle; the driver still pushes brake and gas pedals and shifts. These sys-tems are only available on cars with EPAS, illustrating how increasingly electrified systems will enable future “smart” functions (see Chapter 3).
Another trend to watch is smart functions used for more than safety, in particular fuel economy. For example, in 2008 Honda announced its Ecological Drive Assist (Eco Assist) System for its Insight hybrids. This system combines multiple func-tions, including a driver-activated economy mode that optimizes the powertrain to conserve fuel; and a feedback function that changes the speedometer back-ground color to show the driver “environmentally responsible driving.”
Trends to watch for in ADAS systems:
• IncreasingtakerateofBlindSpot,LDW,andCollisionWarningbecauseofits mention in NHTSA 5-Star crash ratings.
• Controlsystemsthatuseexistingsensorsincreasinglyusedforotherpur-poses. For example, collision warning could be viewed as a modification of ACC, with algorithms adapted to warn or automatically brake.
• Evolutionofthehumanmachineinterfaceisbothatrendtowatchandakey uncertainty. If the information from these systems is too difficult to interpret or causes information overload, they may be quickly abandoned.
• Akey indicator of future growth in autonomous driving is the take-rate of Autonomous Parking.
T-127 book.indb 133 8/24/11 9:22 AM
Downloaded from SAE International by Eric Anderson, Thursday, September 10, 2015

134 | Automotive 2030 – North America | Chapter 9
The connected carWhile cars with sensors and smarts that allow them to react entirely autono-mously are one approach to increasing safety, another is to connect cars with each other and surrounding infrastructure in a web of communication, as shown in Fig. 9.3. Known as vehicle-to-vehicle (V2V) and vehicle-to-infra-structure (V2I), these systems would use active signals emitting from each car and infrastructure to determine position, velocity, and imminent dangers. Be-cause of the collective nature of the enterprise, government support of such a technology is essential to adoption. Recognizing this, DoT established the Intel-ligent Transportation Research program, of which the IntelliDrive initiative is a centerpiece. Improving safety, congestion, fuel economy, and emissions are all targets of the program [9].
Figure 9.3. The current vision of tomorrow’s connected car includes both on-board sensors and communication with other cars and infrastructure.
(Courtesy Roger Berg and Denso).
T-127 book.indb 134 8/24/11 9:22 AM
Downloaded from SAE International by Eric Anderson, Thursday, September 10, 2015

Automotive 2030 – North America | Chapter 9 | 135
V2V uses wireless networks and on-board computing devices to send out a “heartbeat” signal, providing information such as the vehicle’s position, speed, brake status, path prediction, path history, vehicle mass, and bumper height. Each vehicle equipped with V2V both sends and receives those signals, computing po-tential collision paths and issuing warnings as needed, according to Juliussen from IHS iSuppli. “Since the spring of 2010, the emphasis in the IntelliDrive initiative has been on developing and fielding V2V technologies,” he explained. “There are a number of good reasons for this — over 70% of all accidents can be addressed by V2V, additional accidents can be addressed by V2I.” He goes on to explain that V2I requires government funding, which in 2010 is under a lot of pressure with concerns about national debt. Finally, the projected cost of individual V2V units is in the $100–$200 range, according to him, making these systems individually cost competitive with ADAS systems that might cost as much as $1000. The smart technology needed to automatically brake or warn the driver is already in place, developed for ACC and collision avoidance [9]. This makes them a feasible, cost-effective tool for increasing safety.
A number of uncertainties surround this technology, including specification of the communications protocol, adoption and government policy, and human machine interface issues. Relying primarily or solely on V2V has its issues. Adoption rate is a key uncertainty. If only a few, isolated cars have it, there is no benefit. One estimate for a critical mass toward adoption is 10–20% of all vehicles on the road [10]. In addition, as of 2010, the exact technical details remain to be worked out, such as using dedicated short-range communications (DSRC) protocol. Another is the question, “Is it an additional device or integrated into existing ones?” For example, DSCR and V2V could be added to automotive telematics, to personal navigation devices, or even smart phones, according to Juliussen. There is also the issue of who pays for it in its initial stages, when benefits are small due to initial, limited deployment. Since there are aftermarket solutions, governments could require it for all cars, not just new ones. Another alternative is to let the market take its course with the expected expansion of telematics and their accompanying transceivers [10]. Another key uncertainty is the future of V2I.
As Schutt from SAE remarks: “Assuming that every driver is equipped with ‘smart’ devices talking to other participants in the traffic environment, the benefits are
T-127 book.indb 135 8/24/11 9:22 AM
Downloaded from SAE International by Eric Anderson, Thursday, September 10, 2015

136 | Automotive 2030 – North America | Chapter 9
very clear. To make such an effort succeed, we first need a solid and clear govern-ment policy. Additionally, it is also a function of available infrastructure that is reliable and affordable. This automatically brings up the issue of standards. To be reliable, the entire system must be based on solid technical foundation. At the end, it is up to us, consumers, to accept it and create market demand.”
Putting it togetherIf V2V becomes a collective reality, it will in some ways become a competitor to functions now performed by more-expensive sensor systems equipped on the car, such as radar or laser. In other ways, V2V would be complementary to these sen-sors. For example, truly autonomous driving such as seen in the movies would require a wealth of data from a variety of sensors. While technically feasible, cost and acceptance issues remain a hurdle for the near future. V2V would be a wel-come adjunct to other sensors.
Figure 9.4. The winner of the 2007 DARPA challenge was a 2007 Chevy Tahoe fielded by Tartan Racing. The team includes Carnegie Mellon faculty, staff,
and students from the School of Computer Science’s Robotics Institute and College of Engineering, with major support from General Motors,
Caterpillar, and Continental AG, including personnel from those companies embedded with the team.
(Photo reprinted with permission of Carnegie Mellon University, Pittsburgh, Pennsylvania, www.cmu.edu.).
T-127 book.indb 136 8/24/11 9:22 AM
Downloaded from SAE International by Eric Anderson, Thursday, September 10, 2015

Automotive 2030 – North America | Chapter 9 | 137
Rudimentary autonomous cars have been shown to be technically practical. For ex-ample, in 2007 the Defense Advanced Research Projects Agency sponsored the Urban Challenge. In a contest with 11 other entries, a 2007 Chevy Tahoe equipped with sen-sors and a computer named Boss drove a 55-mile urban course, sharing the road with human drivers and robots (see Fig. 9.4). Boss was rigorously tested during its devel-opment, with two identical versions of the machine logging more than 2000 autono-mous miles, many on a brownfield site in Pittsburgh known as Robot City [11].
Emphasis is clearly first on safety. Functions could then possibly migrate into advising on other issues such as best route and driving for fuel economy. Legal issues are anoth-er key uncertainty. If accidents or a system malfunctions, who would be sued? Because rapid development and market surprises are the hallmarks of consumer electronics, development in this area is much harder to establish a reasonable scenario around.
Trends to watch for in smart and connected cars:
• GovernmentpolicyanddeploymentdecisionsregardingV2Vbecomingmore firm by 2015 or so, based on tests and demonstration programs be-ginning in 2012.
• Ifasuitableaftermarketsolutionexistsandgovernmentincentivesorregu-lations require V2V, the human machine interface may well be a source of competitive advantage. Since the basic system itself must be the same to work, the HMI might be the only source of competitive advantage.
• V2Iwillcomealongslowlyornotatall,sinceitrequiresmassivegovern-ment investment—an unlikely scenario.
References[1] Fatality Analysis Reporting System, from http://www-fars.nhtsa.dot.gov/Main/index.aspx, Downloaded April 2011.
[2] Insurance Institute for Highway Safety – Q&As: Antilock Brakes – cars, trucks, motorcycles, http://www.iihs.org/research/qanda/antilock.html, Downloaded March 1, 2011.
T-127 book.indb 137 8/24/11 9:22 AM
Downloaded from SAE International by Eric Anderson, Thursday, September 10, 2015

138 | Automotive 2030 – North America | Chapter 9
[3] Automotive Handbook, 6th Edition, Bosch, October 2004.
[4] Happian-Smith, Julian, ed., An Introduction to Modern Vehicle Design, SAE In-ternational, Warrendale, PA, 2002.
[5] Department Of Transportation, National Highway Traffic Safety Administration 49 CFR Parts 571 and 585 [Docket No. NHTSA–2007 27662] RIN: 2127 AJ77, http://www.nhtsa.gov/Laws+&+Regulations/Electronic+Stability+Control+%28ESC%29, Downloaded March 12, 2011.
[6] Technology: Driving the Development of Safer Cars, NHTSA fact sheet, http://www.safercar.gov/staticfiles/safetytech/st_landing_ca.htm, Downloaded March 13, 2011.
[7] “U.S. DOT Proposes Rear View Visibility Rule to Protect Kids and the Elderly,” NHTSA press release, Dec. 3, 2010, http://www.nhtsa.gov/PR/NHTSA-17-10, Downloaded March 15, 2011.
[8] Carlson, Jeremy, “NHTSA Rear-Visibility Proposal Presents Opportunities and Challenges Alike,” Dec. 23, 2010, iSuppli Market Watch, http://www.isuppli.com/Automotive-Infotainment-and-Telematics/MarketWatch/Pages/NHTSA-Rear-Vis-ibility-Proposal-Presents-Opportunities-and-Challenges-Alike.aspx, Downloaded March 13, 2011.
[9] Ashley, Steven, “Safer cars talk to each other,” http://www.sae.org/mags/aei/9385, AEI Online, SAE International, Warrendale, PA, March 14, 2011.
[10] Costlow, Terry, “Debating IntelliDrive’s future,” http://www.sae.org/mags/aei/8729, AEI Online, SAE International, Warrendale, PA, Aug 23, 2010.
[11] Carnegie Mellon Tartan Racing Wins $2 Million DARPA Urban Challenge, CMU press release, November 4, 2007.
T-127 book.indb 138 8/24/11 9:22 AM
Downloaded from SAE International by Eric Anderson, Thursday, September 10, 2015

Automotive 2030 – North America | Chapter 10 | 139
Chapter Ten
People, Human Nature, and ChoicesWe live in a market economy in North America. What drivers want is what manufacturers will make to sell. Many of the preceding chapters in this book fo-cused on the supply side, on what automotive engineers could build. This chapter deals with demand. What will future drivers want? Comparing the period 2010 through 2030 with the period 1990 through 2010, will there be fundamental dif-ferences in drivers’ desires in these two periods?
“In the U.S. and Canada, there is probably not a fundamental shift in the demand for new cars through 2030,” said Glenn Mercer, Automotive Consultant & Senior Director for the International Motor Vehicle Program at MIT. Some changes will affect demand compared to 1990. Demographics are one. Concerns about fuel availability seem more acute. Other trends will remain constant.
According to Mercer, five basic trends are key to understanding the demand side of the market:
1. Car affordability. Since the 1950s, car affordability has steadily im-proved. For example, according to the closely watched Comerica quarter-ly report, the number of weeks of average household income it took to buy a new car dropped from about 29 weeks in 1996 to about 24 in 2010. If that trend held until 2030, it would take about 17 weeks of average income to buy an average new car [1]. While there will be fluctuations in afford-ability along the way, there is every reason to expect this long-term trend
T-127 book.indb 139 8/24/11 9:22 AM
Downloaded from SAE International by Eric Anderson, Thursday, September 10, 2015

140 | Automotive 2030 – North America | Chapter 10
to continue, if the country slowly but steadily becomes wealthier and as OEMs continue to drive down costs.
2. Price of fuel and its availability. According to the latest figures of gasoline price projections, there is a steadily increasing price of oil, “but not at a catastrophic rate,” according to Mercer. Naturally, there will al-ways be short-term events driving short-term fluctuations, such as hur-ricanes, earthquakes, wars, and political upheaval. Even if we are running out of oil, it is not going to happen anytime soon, and most likely not before 2030. The public’s attitude about prices seems to have changed as well. “A price increase in 1975 of 10% would throw people into a panic—[by 2011] such a rise would create almost no impact. A contributing fac-tor is that fuel expenditure as a share of income is still dropping,” explains Mercer. Drivers respond to increasing gas prices by—in the short-term—cutting back on discretionary travel and in the longer term by buying more fuel-efficient cars. They do not seem to respond by reducing their car purchase entirely. In addition, the underlying desire for travel seems very strong in the U.S. Vehicle-miles-traveled (VMT) fell during the pe-riod 2007–2009 for only the first time since World War II, and then only a small amount, as indicated in Fig. 10.1.
3. Cars per household. Mercer notes North Americans are not buying fewer cars, even if they may buy more fuel efficient ones. “There is a say-ing that Europeans buy cars, while Americans manage fleets,” he said in pointing out the North American tendency to have multiple vehicles in the driveway. “The average household in France has 1.3 cars, in the USA it is approaching 2.5,” he remarks. The rate of household fleet growth is indeed slowing, but seems to have not plateaued yet. However, one dampening effect this can have on new-car demand is that if household miles driven do not change much, increasing the number of cars in the household lowers miles traveled per car per year, which delays the point at which a new car must be bought. Even today, the U.S. has the oldest vehicle fleet in the entire Organisation for Economic Cooperation and Development (OECD).
T-127 book.indb 140 8/24/11 9:22 AM
Downloaded from SAE International by Eric Anderson, Thursday, September 10, 2015

Automotive 2030 – North America | Chapter 10 | 141
4. Population growth is slow but steady. Something that is some-times overlooked as a driver of new-car demand is simple population growth: between the birth rate and the immigration rate, the U.S. remains a faster-growing country than most other developed nations, putting a sig-nificant tailwind behind demand, according to Mercer.
5. Finally, people need to drive. “People live far from the city in far flung suburbs or rural suburbs (“ruburbs”) today,” he explains. In much of North America, there are no practical alternatives to driving. North America in 2010 is a landscape created by affordable personal mobility. Alternatives to driving, such as light rail or even bus routes have proven not to be as desirable, even when congestion is heavy. Maybe we like to drive as much as we need to. Additionally, economic stress on govern-ment finances makes it hard to imagine where the money would come from to build significant new mass-transit infrastructure.
Putting these factors together, it would seem that new car sales may continue to inch up at a percent or two a year throughout the next two decades (with growth in the period 2011 and beyond being faster due to recovery from the Great Recession).
One development that could dent demand is the rise of nontraditional modes of car ownership, such as car-sharing schemes or ultra-short-term rental plans such as Zipcar. These probably will not significantly change the automotive landscape in the period up to 2030. “Car sharing schemes are alternatives that are gaining ground, but not moving the needle in a significant way,” reports Mercer. Overall, he does not foresee a radical change in the pattern of ownership for new cars, de-spite recurrent talk about a shift here.
A key trend that will influence the kind of car in demand, rather than the total volume sold, is the growing population of older people in America. “This means the luxury car segment will continue to grow faster than the rest of the car mar-ket,” Mercer predicted. “As the average car buyer ages, they shift to a luxury car.” Older buyers are more affluent. “In fact, the average age of a new-car buyer is now well over 45, implying that young people are not only not buying upscale new cars, but are in fact not buying new cars at all, preferring to stay with used vehicles well into their 30s in many cases,” explains Mercer.
T-127 book.indb 141 8/24/11 9:22 AM
Downloaded from SAE International by Eric Anderson, Thursday, September 10, 2015

142 | Automotive 2030 – North America | Chapter 10
What will cars look like in twenty years? Styling alone as diff erentiator matters far less than it used to as well. To Mercer, our perception of the car today as con-sumers is that it is an appliance. We might want choice between a utilitarian van, utilitarian pick-up, or a comfortable sedan. Of course, there are those who still want a BMW or a Porsche to quietly show-off they have made it. Human nature is what it is. Even the Toyota Prius may be an example of a showing off to the neigh-bors that the owner is environmentally conscious. However, this kind of status is deeply rooted in the technology—BMWs and Porsches really do deliver more performance and luxury. Th e Prius really is a technological marvel of energy-management. Th ese seem to be the choices we want today—real choices rooted in real technology diff erences around engines, comfort, aff ordability, size, and fuel economy. What this means is that as of 2010, for sustained sales, styling is second to utility. From Mercer’s perspective, the role of styling will depend on the role of the car in the American family in 2030. If a family in 2030 still sees its car as defi ning the family’s status, styling will be crucial: ownership of a sports car will signify a sense of daring and fun and affl uence, a German luxury sedan will signify
Figure 10.1. Vehicle-miles-traveled (VMT) decreased in 2007 as gasoline prices rose, showing that there is some fl exibility in people’s “travel budget.”
(Source: U.S. Department of Transportation, Federal Highway Administration (FHWA),
and Department of Energy Information Administration).
T-127 book.indb 142 8/24/11 9:22 AM
Downloaded from SAE International by Eric Anderson, Thursday, September 10, 2015
Automotive 2030 – North America | Chapter 10 | 143
wealth, etc. However, if by 2030 cars are seen as purely utilitarian devices, such as washing machines or other appliances, styling may recede as a major buying fac-tor “just as fancy expensive home sound systems have receded in popularity, given that everyone’s phone can play one’s music at any time,” remarks Mercer.
In terms of the role of brand in car buying, Mercer believes it may continue to erode over time, for the mass market at least. In the past, brand loyalty was as-sumed. “Some men are Catholics, others Baptist; my father was an Oldsmobile man,” quoted Jean Shepherd in his movie about 1930s America, “A Christmas Story” [2]. It is hard to find a hard-core brand loyalist today: the rich person who chooses a Mercedes this year may choose a BMW in the next, and a growing sub-urban family may pair a Honda minivan with a Subaru AWD station wagon to meet its needs. As the phrase goes, it is now a market of “horses for courses,” with few brands being strong enough to retain buyers throughout their lives, as their needs change and evolve. Some OEMs have explicitly recognized this, as Toyota added Lexus for older and Scion for younger buyers, and VW has gone on a global brand-buying spree that is unprecedented, ranging from SEAT to Lamborghini.
Big is something else noted in the introductory chapter. What seemed to ar-rest the truck boom are high gasoline prices that spiked up in 2008. With gaso-line hovering at or above $4/gal for a short time in 2008, the market noticeably dropped for big vehicles in favor of small vehicles. However, if you look closely at the data, it also dropped for everything. While in 2008 there were fewer trucks sold than cars for the first time since 1998, there was no return to the relative comparison of many cars against far fewer trucks of 1988. These data show that in North America, at least, big is still preferred.
Consumers avoid riskWhile the basic North American consumer may not have changed since 1990, the technology options available have. There is a lot of excitement and buzz around alternative powertrains, from hydrogen fuel cell vehicles, with interest waning in 2011, to battery electric vehicles, with interest gaining in 2011. More were dis-cussed in this book, including hybrid electrics, plug-in hybrids, extended-range electric vehicles, biofuels, and souped-up diesels. Consumers in 2010 and beyond will have to evaluate a raft of exotic technologies, more so than perhaps any other
T-127 book.indb 143 8/24/11 9:22 AM
Downloaded from SAE International by Eric Anderson, Thursday, September 10, 2015

144 | Automotive 2030 – North America | Chapter 10
consumer set in the past. Will consumers understand these choices, or be bewil-dered? What issues do consumers really care about?
“Reliability and Economy top the list of important features in the next-new-vehicle purchase decision,” stated Dr. Stephen Popiel, Senior Vice President of Synovate Motoresearch. What about environmental concerns, such as global warming? “Environmental issues are at the bottom.”
Why is reliability so important? For most of us, new technology is scary. “Con-sumers want to reduce risk,” he explains. Figure 10.2 presents the survey results for these and other vehicle purchase considerations.
Th e supply side mandates for increasing fuel economy are driving much of the “demand” for new technology vehicles, according to him. Th ese include CAFE,
Figure 10.2. Responses provided in 2010 in a survey conducted by Synovate eNation between October 22 and November 2, 2010 in the United States
with 1898 new vehicle buyers and intenders. The respondents were asked: In considering your next purchase of a new vehicle, please select the vehicle
characteristics/features from the list below that will be important in the decision process. You may select as many characteristics/features as desired.© Synovate 2010 1
T-127 book.indb 144 8/24/11 9:22 AM
Downloaded from SAE International by Eric Anderson, Thursday, September 10, 2015
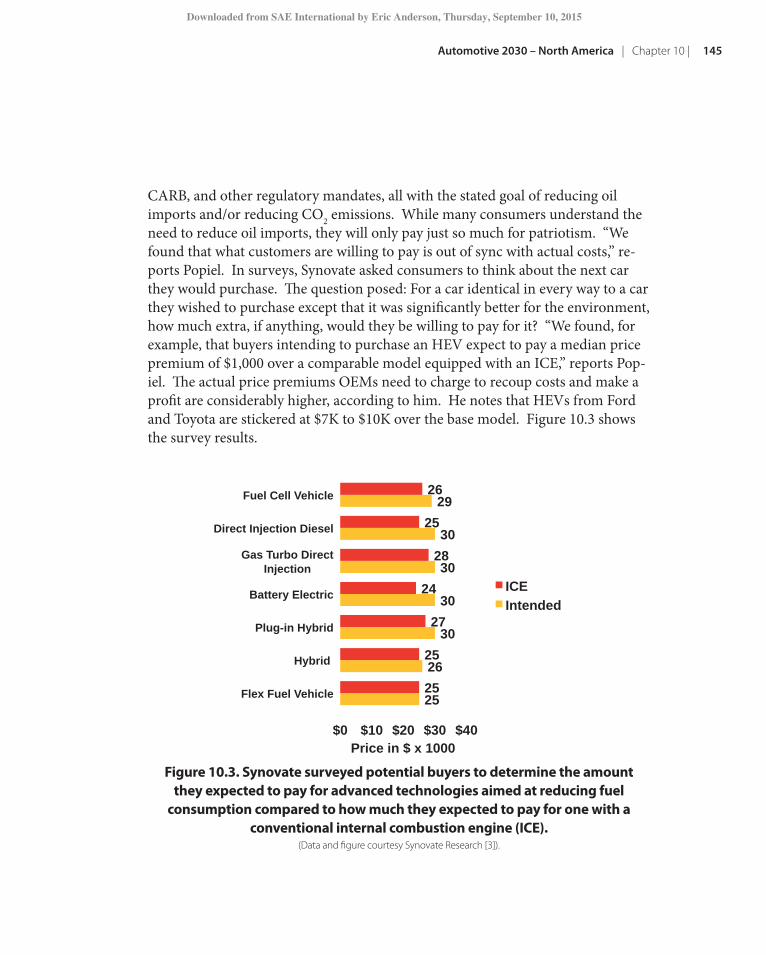
Automotive 2030 – North America | Chapter 10 | 145
CARB, and other regulatory mandates, all with the stated goal of reducing oil imports and/or reducing CO2 emissions. While many consumers understand the need to reduce oil imports, they will only pay just so much for patriotism. “We found that what customers are willing to pay is out of sync with actual costs,” re-ports Popiel. In surveys, Synovate asked consumers to think about the next car they would purchase. The question posed: For a car identical in every way to a car they wished to purchase except that it was significantly better for the environment, how much extra, if anything, would they be willing to pay for it? “We found, for example, that buyers intending to purchase an HEV expect to pay a median price premium of $1,000 over a comparable model equipped with an ICE,” reports Pop-iel. The actual price premiums OEMs need to charge to recoup costs and make a profit are considerably higher, according to him. He notes that HEVs from Ford and Toyota are stickered at $7K to $10K over the base model. Figure 10.3 shows the survey results.
Figure 10.3. Synovate surveyed potential buyers to determine the amount they expected to pay for advanced technologies aimed at reducing fuel
consumption compared to how much they expected to pay for one with a conventional internal combustion engine (ICE).
(Data and figure courtesy Synovate Research [3]).
25
26
30
30
30
30
29
25
25
27
24
28
25
26
$0 $10 $20 $30 $40
Flex Fuel Vehicle
Hybrid
Plug-in Hybrid
Battery Electric
Gas Turbo Direct Injection
Direct Injection Diesel
Fuel Cell Vehicle
Price in $ x 1000
ICE
Intended
T-127 book.indb 145 8/24/11 9:22 AM
Downloaded from SAE International by Eric Anderson, Thursday, September 10, 2015

146 | Automotive 2030 – North America | Chapter 10
Since the cost differences of most of these advanced technologies over conven-tional ICEs are more (sometime considerably more), this presents a conundrum to manufacturers. So many choices present another problem. “Conflicting messages to consumers over which technology is better means they have difficulty evaluat-ing options,” explains Popiel.
Selling replacements for gasoline ICEs may be difficult. “Automotive OEMs face the single greatest marketing challenge that has ever been conceived,” explains Popiel. “To sell BEVs, and PHEVs to a lesser extent, they must convince consum-ers to accept vehicles that go a shorter distance, take longer to refuel, and have a newer and more risky powertrain. In addition, they are asked to pay more for these ‘benefits’.”
Another significant variable in consumer thinking is that cost today is more impor-tant than saving cost in the future. Richard Curtin, a Director of Consumer Surveys at the Institute for Social Research, a unit of the University of Michigan, presented data supporting this statement in December 2008. In his survey, when presented
As noted in the Introduction, today’s cars are durable. Cars that last in excess of 10 years and 200,000 miles are becoming the norm. Although consumers who like to drive cars with no debt or lease payments find this attractive, many older vehicles do not have the latest advances for fuel economy, safety, or convenience. In 2010, the yearly sales rate in the U.S. was a mere 11M units, down from a high of over 17M earlier in the decade.
Many analysts project that as much as 80% of future automotive innovation will come from electronics and software. As new features become available, society may decide that such features are crucial. This could force—or present—an increase in aftermarket opportunities.
Each year they are getting more reliable. The median age for cars on the road today increased by 13%
from 1999 to 2008 to 9.4 years, and by 8.6% for light trucks to 7.5 years, according to R. L. Polk and Co., an industry analyst firm [1]. Examination of Table 10.1 shows a 21% increase in the average age of all light vehicles on the road.
Consumer Reports also reports an upward trend in reliability across the board, though noting some differences between automakers. As Consumer Reports notes:
One thing that has made used cars more appealing is their improved reliability. In an analysis of Consumer Reports’ annual subscriber surveys from 1980 through 2000, we found that the reliability of vehicles had vastly improved. Reported problems declined to a fraction of what they were in 1980. Rust and exhaust-system problems, once common, are now no longer a major concern. As a result,
The Durable Automobile
T-127 book.indb 146 8/24/11 9:22 AM
Downloaded from SAE International by Eric Anderson, Thursday, September 10, 2015
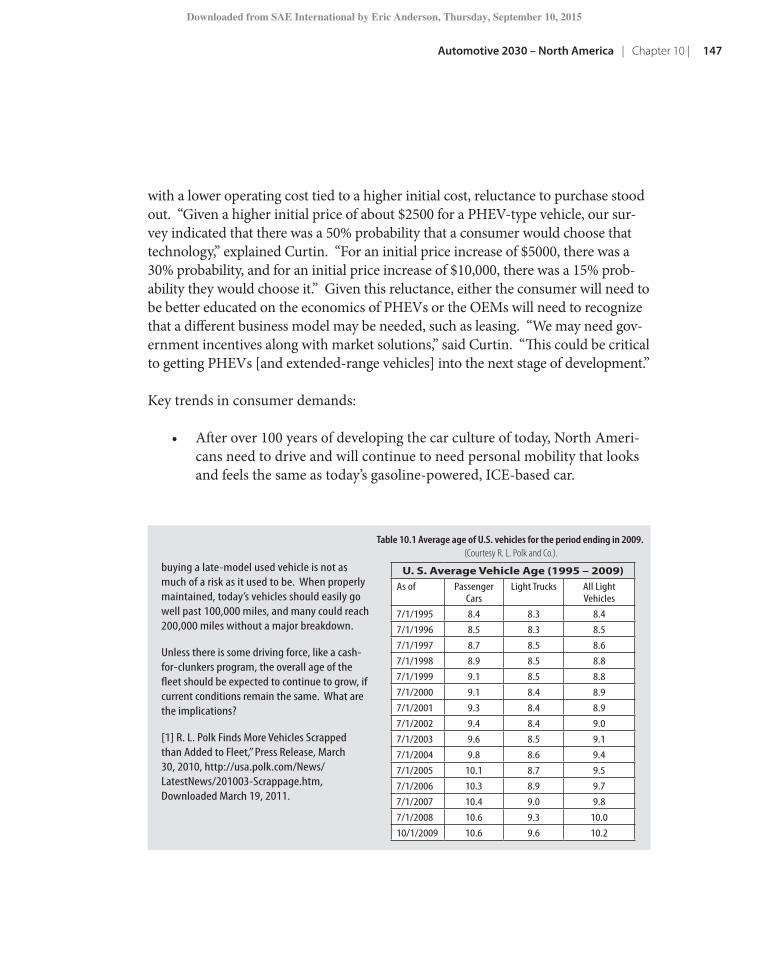
Automotive 2030 – North America | Chapter 10 | 147
with a lower operating cost tied to a higher initial cost, reluctance to purchase stood out. “Given a higher initial price of about $2500 for a PHEV-type vehicle, our sur-vey indicated that there was a 50% probability that a consumer would choose that technology,” explained Curtin. “For an initial price increase of $5000, there was a 30% probability, and for an initial price increase of $10,000, there was a 15% prob-ability they would choose it.” Given this reluctance, either the consumer will need to be better educated on the economics of PHEVs or the OEMs will need to recognize that a different business model may be needed, such as leasing. “We may need gov-ernment incentives along with market solutions,” said Curtin. “This could be critical to getting PHEVs [and extended-range vehicles] into the next stage of development.”
Key trends in consumer demands:
• Afterover100yearsofdevelopingthecarcultureoftoday,NorthAmeri-cans need to drive and will continue to need personal mobility that looks and feels the same as today’s gasoline-powered, ICE-based car.
Table 10.1 Average age of U.S. vehicles for the period ending in 2009. (Courtesy R. L. Polk and Co.).
U. S. Average Vehicle Age (1995 – 2009)As of Passenger
CarsLight Trucks All Light
Vehicles7/1/1995 8.4 8.3 8.47/1/1996 8.5 8.3 8.57/1/1997 8.7 8.5 8.67/1/1998 8.9 8.5 8.87/1/1999 9.1 8.5 8.87/1/2000 9.1 8.4 8.97/1/2001 9.3 8.4 8.97/1/2002 9.4 8.4 9.07/1/2003 9.6 8.5 9.17/1/2004 9.8 8.6 9.47/1/2005 10.1 8.7 9.57/1/2006 10.3 8.9 9.77/1/2007 10.4 9.0 9.87/1/2008 10.6 9.3 10.010/1/2009 10.6 9.6 10.2
buying a late-model used vehicle is not as much of a risk as it used to be. When properly maintained, today’s vehicles should easily go well past 100,000 miles, and many could reach 200,000 miles without a major breakdown.
Unless there is some driving force, like a cash-for-clunkers program, the overall age of the fleet should be expected to continue to grow, if current conditions remain the same. What are the implications?
[1] R. L. Polk Finds More Vehicles Scrapped than Added to Fleet,” Press Release, March 30, 2010, http://usa.polk.com/News/LatestNews/201003-Scrappage.htm, Downloaded March 19, 2011.
T-127 book.indb 147 8/24/11 9:22 AM
Downloaded from SAE International by Eric Anderson, Thursday, September 10, 2015

148 | Automotive 2030 – North America | Chapter 10
• Averagecarswillcontinuetogrowindurabilityandwillcontinuetobe-come more affordable if current trends remain.
• Thevastmajorityofconsumerswillcontinuetodefertotheirpocketbooksif asked to shoulder the burden of costs to reduce dependence on foreign oil or save the environment.
• Highinitial(capital)costishardtojustifyfortheaverageconsumerevenif it leads to lower (operating) cost in the future.
References[1] Auto Affordability Improves Slightly in Q3 Comerica Bank Reports, Comerica Quarterly Research Report, Nov. 15, 2010.
[2] Shepherd, Jean, “A Christmas Story.”
[3] Survey was conducted between October 22 and November 2, 2010 in the Unit-ed States with 1898 new vehicle buyers and intenders by Synovate eNation. The respondents were asked the following questions:
Question 1: And how much do you expect to pay for your next new vehi-cle, that is in terms of make and model with the specific engine you would most likely acquire?
Question 2: And how much would you expect to pay for your next new vehicle, that is in terms of make and model with a specific engine if it came with a traditional internal combustion engine and not an alternative engine? (From Stephen Popiel, private communication)
T-127 book.indb 148 8/24/11 9:22 AM
Downloaded from SAE International by Eric Anderson, Thursday, September 10, 2015
Automotive 2030 – North America | Chapter 11 | 149
Chapter Eleven
Putting it all Together“In the American psyche there seems to be a deep emotional need to control one’s ability to move, whether because the car is a status symbol or the means to flee to a new life, or just pure and simple entertainment,” states Glenn Mercer, Automo-tive Consultant & Senior Director for the International Motor Vehicle Program at MIT. “We see this in the Cadillac parked in suburban driveways, in the jalopies that carried the Okies west out of the Dust Bowl, and in the ‘little Deuce coupes’ that the Beach Boys headed out to the beach in. Is there any other culture so fix-ated on having and using a car?” Personal mobility in the 20th century shaped the landscape we live in at the beginning of the 21st. Our desire for this personal mo-bility Mercer speaks of created highways, suburbs, and a mobile lifestyle. In pro-jecting ahead for at least the next 20 years, there is no reason to think our desire for personal mobility is going to change. This is central to this book’s projections about automotive engineering in the year 2030. We want our own, individual cars.
One major uncertainty in this future period is what will power our cars. Rising gasoline prices coupled with concerns over foreign dependency on oil as well as climate change increases pressure on the U.S. government to act. A new Cor-porate Average Fuel Economy (CAFÉ) standard for the period 2017–2025 was proposed in the summer of 2011 that would require a fleet average of 54.5 mpg. This represents a fuel economy improvement over 50% from that agreed to for the CAFÉ regulations for 2016 (fleet average of 35.5 mpg). On average, this would require cars to improve fuel economy by 5%, while full-size pick-up trucks are re-quired to improve by 3.5% during the early years of the program.
As of this writing, details remain to be worked out before a final rule is published. Also, given the long time frame, the proposed rules allow for a mid-term review,
T-127 book.indb 149 8/24/11 9:22 AM
Downloaded from SAE International by Eric Anderson, Thursday, September 10, 2015

150 | Automotive 2030 – North America | Chapter 11
which will most likely begin in 2018 to provide enough time to issue adjustments for the 2022 model year. Credits for alternative air conditioning systems, CNG-powered cars, PHEVs, and banking of unused credits from the period before 2017 add even more complexity to fully understanding the technical impact of these rules. However, commitment letters from most automakers show that fuel econo-my is a priority and will remain so.
While our desire for cars will remain, some of the details of those desires will change. The key trends in demand, projected to 2030, that will require vehicle en-gineers to adapt their designs include:
• Aslowlygrowing,agingpopulationofdrivers.
• Safetysells.Somewhatrelatedtoanagingpopulation,therewillcontinueto be a push for safer driving with active technologies, either with visible ratings like evolution of the 5-Star crash or safety ratings, or with regula-tory mandates.
• NorthAmericans,onaverage,wanttoownmorecarsthanindividualsinother parts of the world. “Americans manage fleets.”
• Carswillcontinuetoincreaseindurability,withprojectionsshowingve-hicles averaging a 12-year lifespan by 2030. This skews who buys new cars and why.
• Continuedorrisingpublicconcernsaboutfuelsupply,fuelprices,orgreen-house gases. Naturally, these concerns have been stoked by the steady trend upward of gasoline prices in the period 1999–2010 (see Fig. 1.3).
• TheNorthAmericanconsumerisrationalandrisk-averse,seekingtopur-chase cars guaranteed to give little trouble and provide value. They will change out of gasoline-powered ICEs for rational, risk-averse reasons.
Then, there are the trends from the supply side. Key technological trends pro-jected to 2030 include:
T-127 book.indb 150 8/24/11 9:22 AM
Downloaded from SAE International by Eric Anderson, Thursday, September 10, 2015

Automotive 2030 – North America | Chapter 11 | 151
• FromChapters2,3,and4weseetheincreasingabilityfornew-model,conventional, gasoline-powered ICE cars to improve their fuel economies. Average increases of 20 to 30% in fuel economy for the standard, non-electrified vehicle are reasonable—even easy—to project to 2030, possibly by 2020.
• Mostcarcompaniesandthegovernmenthaveagreedtopursueafleet-wide ‘next-generation’ CAFÉ rule that would require greater than 50% improvement by 2025—though uncertainties and details remain to be worked out. Some level of hybridization and electrification will most likely be required to achieve a true fleet average improvement of 50%.
• Increasingnumbersofsensors,computers,X-by-wirecontrols,andalgo-rithms will give vehicle engineers the ability to create a smart car.
• Recognitionofthebenefitsofvehicle-to-vehicle(V2V)andvehicle-to-infra-structure (V2I) communication for safety and autonomous functions.
Those were the easy trends to understand. A number of other trends surround-ing alternative power sources carry higher degrees of uncertainty. The price stability of gasoline is one—if stable and affordable, why switch? The availability of alternative fuels from biosources is another. There remains the question of feasibility for both electric vehicles and hydrogen-fueled FCEVs, especially in infrastructure costs.
“Currently [as of 2011] there is much talk of electrifying the powertrain using batteries and, eventually, fuel cells to fuel powertrains,” highlights Dr. David Schutt, Chief Executive Officer for SAE International. His comments illustrate these uncertainties. “The industry’s greatest minds are also working on improv-ing traditional powertrain solutions. However, how will sustainable fuel develop-ment help build the bridge to an electric future? At what rate will the market ac-cept these new technologies and how much premium will they be willing to pay in the interim?” A key uncertainty to the author seems to be the patience of fu-ture drivers when it comes to refueling / recharging future non-gasoline vehicles.
T-127 book.indb 151 8/24/11 9:22 AM
Downloaded from SAE International by Eric Anderson, Thursday, September 10, 2015

152 | Automotive 2030 – North America | Chapter 11
A crucial step in understanding and planning is to identify, as much as possible, these critical uncertainties. A few are listed below. All are highly debatable—be-cause they are uncertain:
• Thefuturepriceandavailabilityofpetroleumandgasoline.Thisislistedas a key uncertainty because whenever oil prices go up, there is added incentive to invest in new drilling technologies and search for more oil reserves. If there is new oil to be found, these investments yield more sup-ply, and less need for alternatives.
• Thefuturepriceandavailabilityofpetroleum-substitutes,especiallycel-lulosic ethanol or drop-in fuels. Again, whenever oil prices go up, there is added incentive to invest in alternative drop-in fuels. This uncertainty is correlated with high oil prices—if gasoline prices remain affordable, there is little chance an alternative will be developed.
• FutureincomestabilityoftheNorthAmericanpopulation.TheGreatRe-cession of 2008 proved that there might just be uncertainty about future incomes and the continued rise in affordability of new car purchases.
• Theexactnatureofhowactivesafetyequipmentwilldevelop.Thekeyun-certainty is the human-machine interface and legal liabilities around autono-mous functions. What if a car equipped with active crash avoidance does not work? What if it malfunctions and causes a crash—who is at fault?
• Asofthiswriting,withconcernsovergovernmentspending,itseemsuncertain, even unlikely, that massive government investment in V2I will occur. V2V seems more likely because of its relatively low expense per car and a cost model to pay for it. Even V2V remains a key uncertainty, which should reveal itself no later than 2020.
• Itislikelythecostofvehiclebatteriesandissueswithrechargingwillpre-clude widespread acceptance of BEVs by 2030. Although a breakthrough could happen that dramatically reduces prices and speeds up charging times, it remains highly uncertain.
T-127 book.indb 152 8/24/11 9:22 AM
Downloaded from SAE International by Eric Anderson, Thursday, September 10, 2015

Automotive 2030 – North America | Chapter 11 | 153
• WhilerangeanxietymayindeedbeanissueforBEVs,theauthormain-tains that recharge time is another key uncertainty for adoption.
• Akey uncertainty remains future CAFÉ regulations and their impacts. While the CAFÉ rule-making initiated for the 2017–2025 period states a target of over 50% mpg improvement, it remains a target as of this writing.
When trying to predict the future, there are two pitfalls to be avoided. One is under-predicting, assuming that the future will look and behave pretty much like the pres-ent. The other is overpredicting, assuming the future will be vastly more wonderful than the present—or vastly worse, with dire consequences deriving from perceived evil trends in the present. Removing the bias from either under- or over-predicting provides a flavor of what might happen if specific uncertain trends play out.
The future is a world of possibilities. To help explore what some possibilities might be, this chapter includes a couple of scenarios. I invite you to look at the two sidebar scenarios provided here. I also invite you to develop your own, if you wish, based on the trends outlined in previous chapters.
The two scenarios explore basic mega-trends, which to a large degree are unrelated to one other. One megatrend is the worry over fuel; the other is the evolving smart, connected car. They are written from the perspective of the future as history, as if we are in the year 2030 and reporting on what happened in the last two decades.
The history of what is to comeHistorians write often about pre-periods and post-periods, such as pre-Civil War or post-World War II, for instance.
The author’s sense is that the period leading up to 2030 is a pre-period, that the next twenty years are preparing the North American automotive world for a truly new driving experience to come in the period after 2030.
Much depends on the price and availability of petroleum. Much also depends on the ability of automotive engineers to deliver autonomous functions, first solving known safety issues and then moving to convenience and addressing congestion.
T-127 book.indb 153 8/24/11 9:22 AM
Downloaded from SAE International by Eric Anderson, Thursday, September 10, 2015
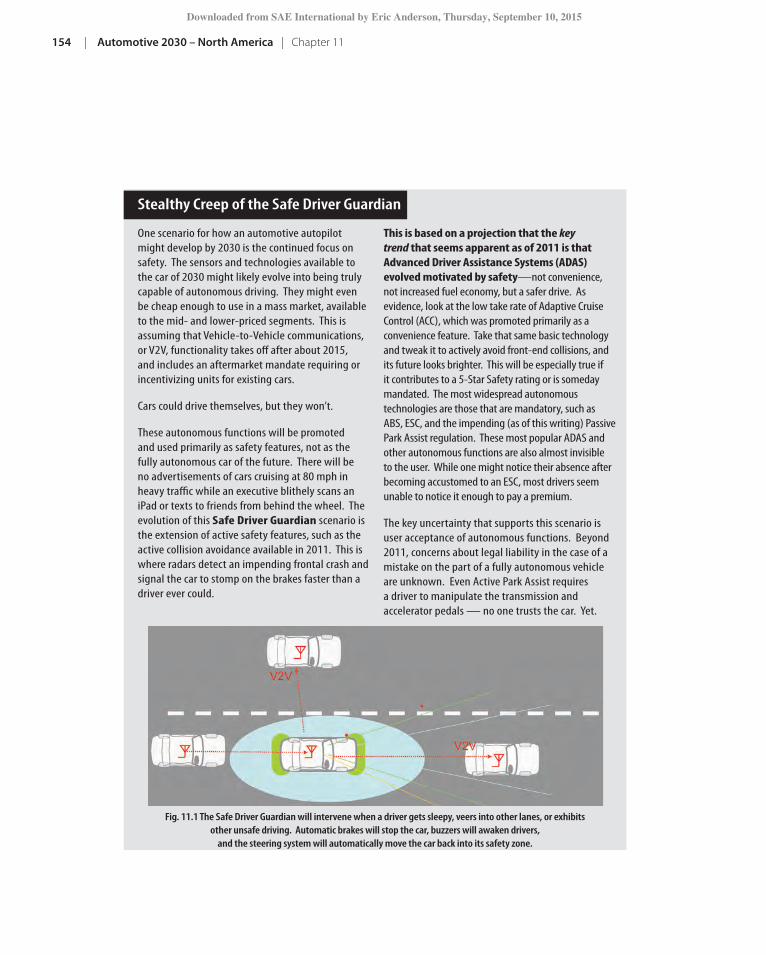
154 | Automotive 2030 – North America | Chapter 11
One scenario for how an automotive autopilot might develop by 2030 is the continued focus on safety. The sensors and technologies available to the car of 2030 might likely evolve into being truly capable of autonomous driving. They might even be cheap enough to use in a mass market, available to the mid- and lower-priced segments. This is assuming that Vehicle-to-Vehicle communications, or V2V, functionality takes off after about 2015, and includes an aftermarket mandate requiring or incentivizing units for existing cars.
Cars could drive themselves, but they won’t.
These autonomous functions will be promoted and used primarily as safety features, not as the fully autonomous car of the future. There will be no advertisements of cars cruising at 80 mph in heavy traffic while an executive blithely scans an iPad or texts to friends from behind the wheel. The evolution of this Safe Driver Guardian scenario is the extension of active safety features, such as the active collision avoidance available in 2011. This is where radars detect an impending frontal crash and signal the car to stomp on the brakes faster than a driver ever could.
This is based on a projection that the key trend that seems apparent as of 2011 is that Advanced Driver Assistance Systems (ADAS) evolved motivated by safety—not convenience, not increased fuel economy, but a safer drive. As evidence, look at the low take rate of Adaptive Cruise Control (ACC), which was promoted primarily as a convenience feature. Take that same basic technology and tweak it to actively avoid front-end collisions, and its future looks brighter. This will be especially true if it contributes to a 5-Star Safety rating or is someday mandated. The most widespread autonomous technologies are those that are mandatory, such as ABS, ESC, and the impending (as of this writing) Passive Park Assist regulation. These most popular ADAS and other autonomous functions are also almost invisible to the user. While one might notice their absence after becoming accustomed to an ESC, most drivers seem unable to notice it enough to pay a premium.
The key uncertainty that supports this scenario is user acceptance of autonomous functions. Beyond 2011, concerns about legal liability in the case of a mistake on the part of a fully autonomous vehicle are unknown. Even Active Park Assist requires a driver to manipulate the transmission and accelerator pedals — no one trusts the car. Yet.
Stealthy Creep of the Safe Driver Guardian
Fig. 11.1 The Safe Driver Guardian will intervene when a driver gets sleepy, veers into other lanes, or exhibits other unsafe driving. Automatic brakes will stop the car, buzzers will awaken drivers,
and the steering system will automatically move the car back into its safety zone.
T-127 book.indb 154 8/24/11 9:22 AM
Downloaded from SAE International by Eric Anderson, Thursday, September 10, 2015
Automotive 2030 – North America | Chapter 11 | 155
Few of the sources researched or interviewed for this book predicted a wholesale take-over of electric- or hydrogen-fueled vehicles by 2030. This could mean we are biased. Can any driver in North America really comprehend a future with no gasoline? Or even a future with gasoline at $5 or $6 or more a gallon, adjusted for inflation? Perhaps. However, past oil shocks have taught us to be cautionary about over-predicting a gloomy future. There will be unpleasant incidents along the way—wars, coups, and natural disasters that affect the price of gasoline in the short term.
Some of the issues that need to be understood in this preparatory period include infrastructure investment. It became clear by 2010 and the first commercial in-troduction of BEVs that we need to invest in infrastructure to deliver reasonable charging times for long-range BEVs. Whether it is a few thousand dollars to cut the recharge time down to a few hours, or substantially more investment in Level III chargers to get it down to 30 minutes or so, practical BEVs will require ad-
Gasoline Prices Held in Check
Each time gasoline rose close to the inflation-adjusted price of $4/gal, reactions from both carmakers and drivers conspired to reduce consumption and demand, driving prices down again. For one, new cars that emphasized fuel efficiency rose in the total mix of new car sales. Each price rise prompted a reason for owners to trade-in older cars with worse gasoline mileage for newer ones. Very large SUVs have practically disappeared from new car lots, though CUVs and larger cars remain in the mix.
Better fuel efficiency is delivered through a variety of technologies that were apparent in 2010. Practically all new vehicles sport elements of mild-hybrid technologies, including idle-stop and small power batteries and eMotors. These technologies assist take-off, recuperate some energy in braking, and allow engineers to tune ICEs to their most efficient operating ranges. These mild-hybrid technologies are increasingly packaged in a car that emphasizes fuel-efficiency — there is little branding around
the hybrid as such for most of these vehicles. In rare cases is a hybrid vehicle line sold exclusively as a hybrid, since it connotes risk and extra expense. Direct Injection Spark Ignition vehicles are universal in new car sales. Other technologies include cylinder deactivation in larger engines, turbocharging and boosting, and novel thermal and waste heat recovery techniques.
Another key element that contributed to reducing gasoline consumption is driver behavior. Drivers learned that if they drive less, they spend less on gasoline. Vehicle Miles Traveled (VMT) dips down every time gasoline prices rise. However, drivers remain wedded to their individual cars, enabled in part by increased affordability in the period 2010 through 2030. With an average cost of 17 weeks to buy a new car in 2030, and plenty of suburban real estate to park it, the average North American tends to want a lot of car even as they drive them less.
T-127 book.indb 155 8/24/11 9:22 AM
Downloaded from SAE International by Eric Anderson, Thursday, September 10, 2015

156 | Automotive 2030 – North America | Chapter 11
ditional investment beyond the cost of the car. The common objection to H2 and FCEVs in the years leading up to 2011 is the lack of supply of H2 and the cost of infrastructure required to produce and deliver H2. Given the improvement in FCEV development outlined in Chapter 8, and the conveniences they offer that North American drivers are used to, they may very well prove to be a more viable solu-tion to any replacement to gasoline — if we need a replacement.
Given the uncertainties, passions, and fears inherent in the automotive world to-day, the one thing we will see is a number of these alternative powertrains devel-oped and fielded — possibly in very small numbers but capturing a huge “mind-share.” The same holds for autonomous functions. This mix of demands and solutions will make for an interesting time in the industry through 2030.
I think there will be something for everyone.
T-127 book.indb 156 8/24/11 9:22 AM
Downloaded from SAE International by Eric Anderson, Thursday, September 10, 2015

Automotive 2030 – North America | About the Author 157
About the AuthorWith over twenty years of experience in technology de-velopment, research, and management, Bruce Morey brings a unique perspective when looking at the future of automotive engineering. His sixteen years in the defense industry exposed him to a number of forward-looking methodologies, including scenario planning and con-tingency planning. His six years in automotive product development at Ford Motor Company gave him an inside look at the day-to-day challenges and pressures of deliv-ering quality vehicles that customers want to buy, at an affordable price to both customer and company. Since becoming a journalist, his published articles have cov-ered everything from solar energy to lean manufacturing, as well as automotive engineering and product development. Mr. Morey earned Bachelor’s and Master’s degrees in mechanical engineering from the University of Michigan.
T-127 book.indb 157 8/24/11 9:22 AM
Downloaded from SAE International by Eric Anderson, Thursday, September 10, 2015

T-127 book.indb 158 8/24/11 9:22 AM
Downloaded from SAE International by Eric Anderson, Thursday, September 10, 2015

T-127 book.indb 159 8/24/11 9:22 AM
Downloaded from SAE International by Eric Anderson, Thursday, September 10, 2015

T-127 book.indb 160 8/24/11 9:22 AM
Downloaded from SAE International by Eric Anderson, Thursday, September 10, 2015

SAE International®
Downloaded from SAE International by Eric Anderson, Thursday, September 10, 2015