SACRS Symposium The 2008 Market Collapse WHAT DO WE DO NOW? BOB MCCRORY EFI ACTUARIES MARCH 20, 2009...
38
SACRS Symposium The 2008 Market Collapse WHAT DO WE DO NOW? BOB MCCRORY EFI ACTUARIES MARCH 20, 2009 1
-
Upload
daniela-newman -
Category
Documents
-
view
216 -
download
0
Transcript of SACRS Symposium The 2008 Market Collapse WHAT DO WE DO NOW? BOB MCCRORY EFI ACTUARIES MARCH 20, 2009...

SACRS SymposiumThe 2008 Market Collapse
WHAT DO WE DO NOW?
BOB MCCRORYEFI ACTUARIES
MARCH 20, 2009
1

• Shifting Costs
• Hidden Costs
• Hidden Risk
• Things That Don’t Work
• Flying Pigs
2
Today’s Discussion

• Asset Smoothing Policy
• Amortization Policy
• Direct Cost Smoothing
3
ShiftingCosts

Shifting Costs
Tools Asset Smoothing Amortization Policy Direct Cost Smoothing
Ask yourself: What are our choices? What are the rules? What is current practice? What are your limits?
4
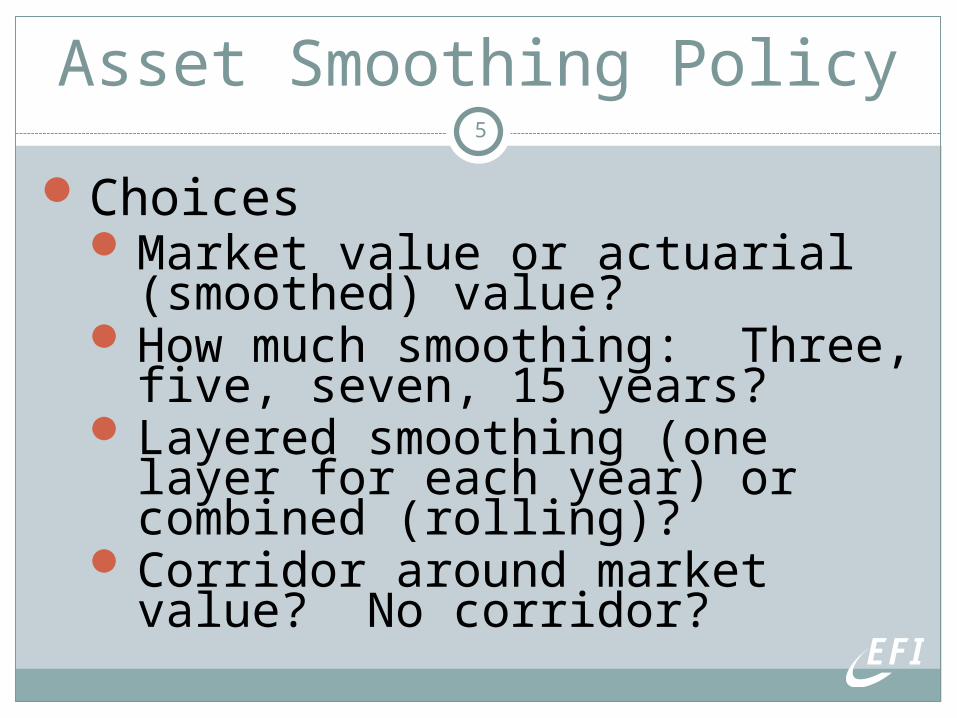
Asset Smoothing Policy
ChoicesMarket value or actuarial
(smoothed) value?How much smoothing: Three,
five, seven, 15 years?Layered smoothing (one layer
for each year) or combined (rolling)?
Corridor around market value? No corridor?
5
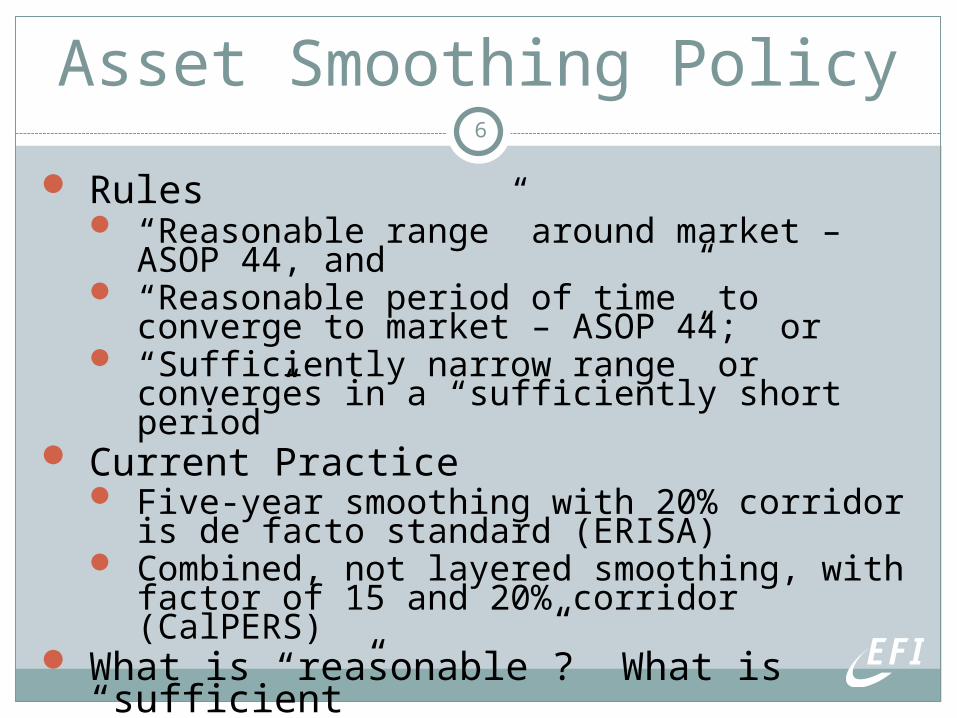
Asset Smoothing Policy
Rules “Reasonable range” around market –
ASOP 44, and “Reasonable period of time” to converge to
market – ASOP 44; or “Sufficiently narrow range” or converges in
a “sufficiently short period” Current Practice
Five-year smoothing with 20% corridor is de facto standard (ERISA)
Combined, not layered smoothing, with factor of 15 and 20% corridor (CalPERS)
What is “reasonable”? What is “sufficient”
6
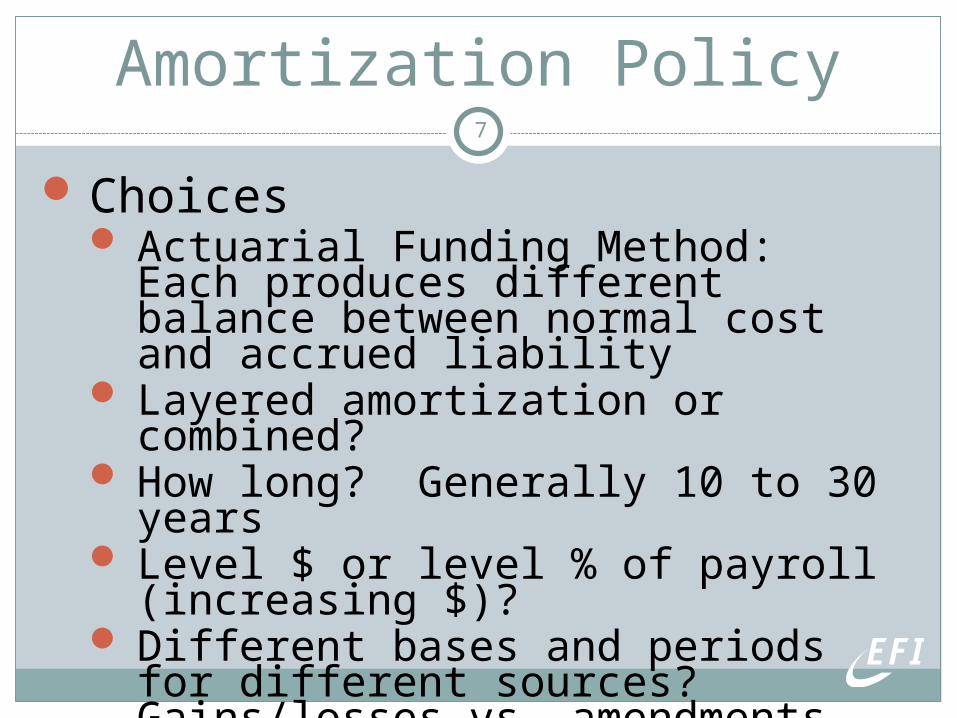
Amortization Policy
Choices Actuarial Funding Method: Each
produces different balance between normal cost and accrued liability
Layered amortization or combined? How long? Generally 10 to 30
years Level $ or level % of payroll
(increasing $)? Different bases and periods for
different sources? Gains/losses vs. amendments
7

Amortization Policy
Rules No more than 30 years (GASB) Level % of pay is “negative
amortization” after about 17 yearsCurrent Practice
Practice varies widely Gains and losses over a rolling 30-
year, level % payroll (CalPERS) Is level % of payroll reasonable if
employment is likely to drop?
8

Direct Cost Smoothing
Choices Actuarial cost Phase into actuarial cost over a
number of years Actuarial cost with limits on level
(e.g., cost must be less than 23.7%)
Actuarial cost with limits on growth (e.g., cost cannot increase more than 0.6% of pay per year)
Single stipulated cost
9
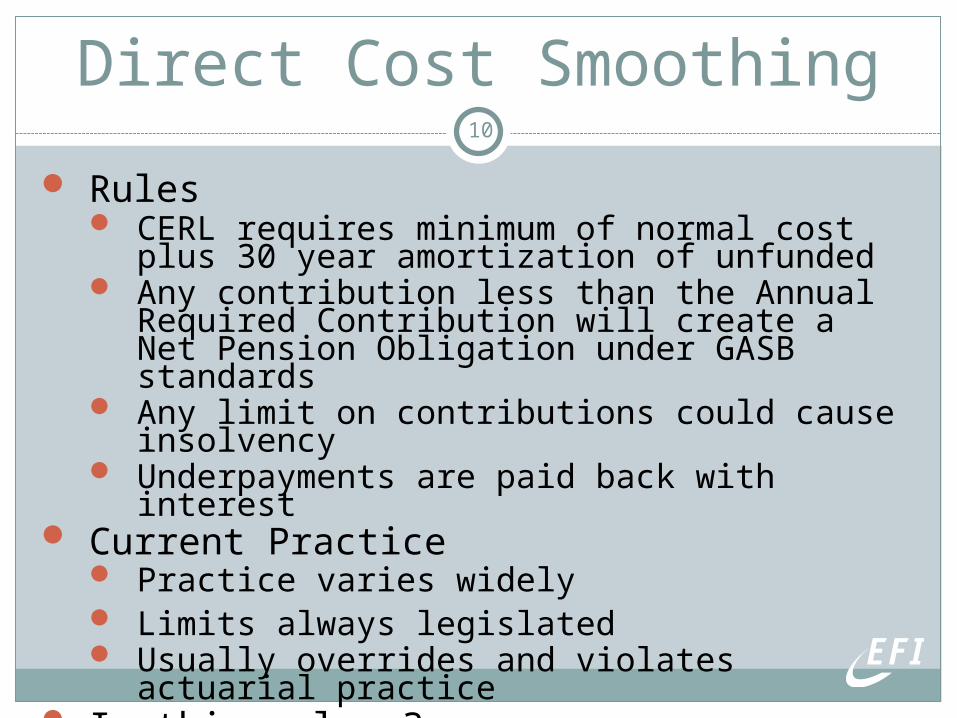
Direct Cost Smoothing
Rules CERL requires minimum of normal cost plus
30 year amortization of unfunded Any contribution less than the Annual
Required Contribution will create a Net Pension Obligation under GASB standards
Any limit on contributions could cause insolvency
Underpayments are paid back with interest Current Practice
Practice varies widely Limits always legislated Usually overrides and violates actuarial
practice Is this a loan?
10

• Compensation Policy
• Disabilities
• Furloughs
• Early Retirement
11
HiddenCosts

Compensation Policy
Review pensionable earnings Earnings structure – therefore pensionable
earnings – may be bargained, subject to immediate change
Review last 50 or so retirements and disabilities. Jumps in pay at retirement (spiking)? Categories of pay not available to all
members? Special pay for some members? Benefit disparities among similarly situated
members? Terminal payments (unused sick leave or
vacation) increasing final average pay? Incentive bonuses?
12

Compensation Policy
Review seniority systems Can drive access to overtime, thus final
compensation and payroll What impact does this have? Do you want
to limit this? Goals
Not trying to reduce benefits Improve benefit predictability Improve adherence to pension policy
goals A pension plan, not a lottery
Rough Rule of Thumb: Save $15 in liabilities for every $1 reduction in benefits
13
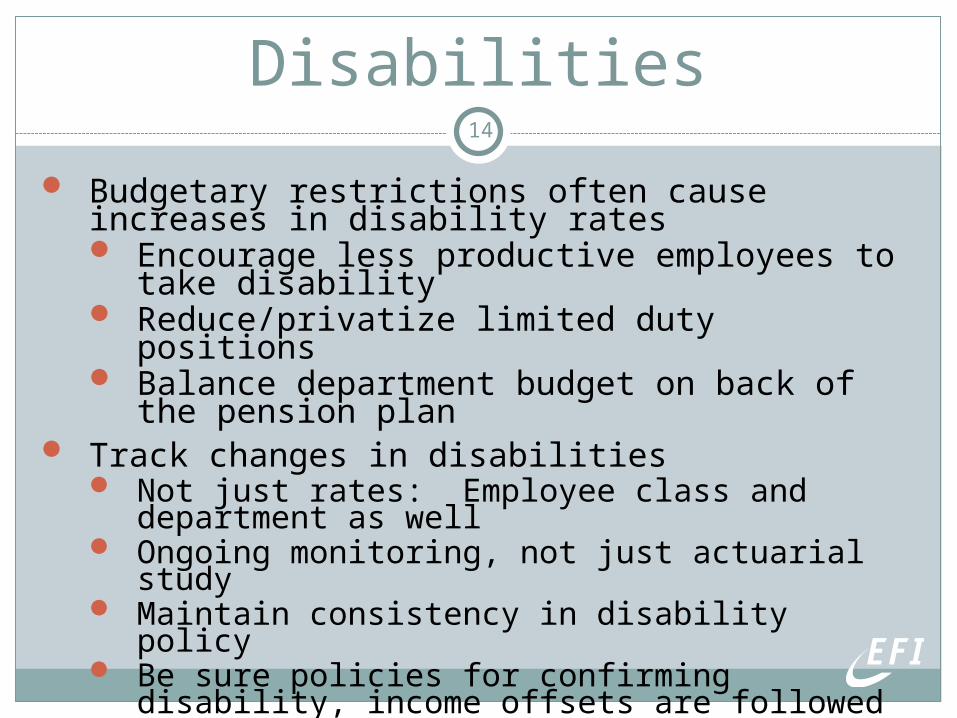
Disabilities
Budgetary restrictions often cause increases in disability rates Encourage less productive employees to take
disability Reduce/privatize limited duty positions Balance department budget on back of the
pension plan Track changes in disabilities
Not just rates: Employee class and department as well
Ongoing monitoring, not just actuarial study Maintain consistency in disability policy Be sure policies for confirming disability,
income offsets are followed
14

Hidden Costs
Furloughs Decrease payroll; leave benefit
unchanged Increase cost as a percent of payroll Decrease payroll over which
unfunded liabilities and gains/losses are amortized
Early Retirement In general, earlier retirement
increases plan costs Subsidized early retirement adds
additional cost Also reduces payroll base
15
• Plan Maturity
• Layers
• Layoffs
16
HiddenRisks

Plan Maturity
’37 Act Plans are maturingBaby Boom is retiringReplacement employees olderPlan improvements increasing
retirement benefitsGovernment employment
static, maybe declining (?)Result is increase in ratio of
assets to payroll
17

Plan MaturityAssets as a Percentage of Payroll
18
0%
100%
200%
300%
400%
500%
600%
700%
800%
900%
7/1/08 7/1/18 7/1/28 7/1/38 7/1/48 7/1/58 7/1/68
Ac
tua
ria
l V
alu
e o
f A
ss
ets
% A
cti
ve
Pa
yro
ll
Valuation Date
Actuarial Assets(As a percentage of active member payroll)

Plan Maturity
Increase in ratio of assets to payroll Typical ‘37 Act plan is increasing
from about 5X payroll to around 9X payroll
Represents a sensitivity ratio As the ratio increases, investment
gains and losses are larger relative to payroll
Produces more cost volatility Increasing risk is structural, permanent,
unavoidable In addition, OPEB benefits are starting
to be pre-funded
19

Layers
Layers (tranches?) in asset smoothing and unfunded liability add to cost volatility Cost steps – up or down – as
layers are established and retired Sometimes these cancel,
sometimes they reinforce each other
Layers bring advantages as well Each layer is eventually retired Layers are reasonably predictable
20
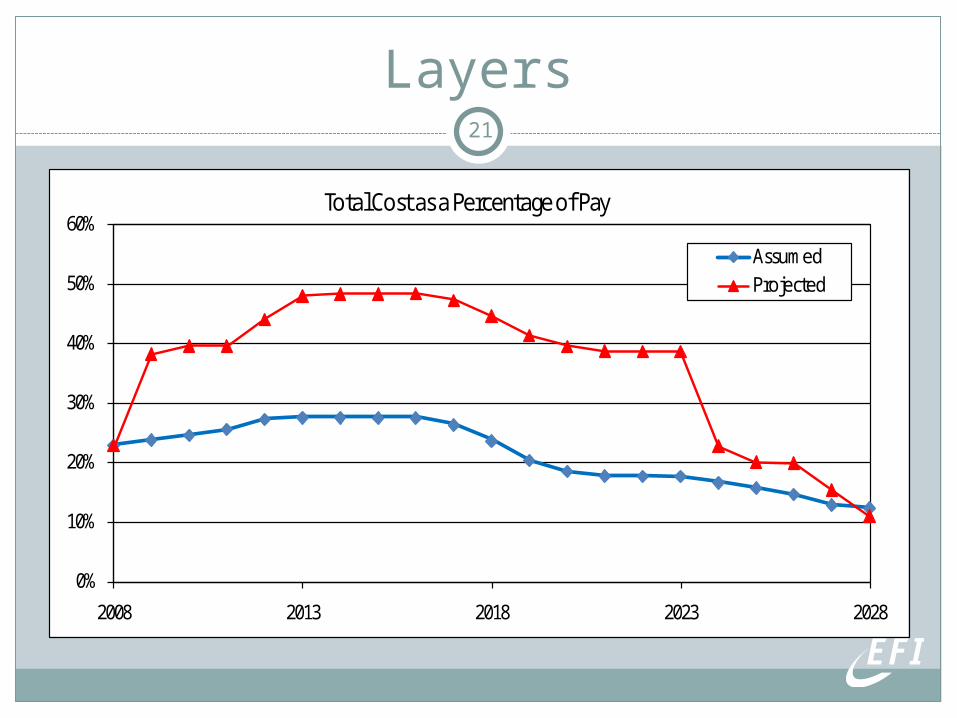
Layers21
0%
10%
20%
30%
40%
50%
60%
2008 2013 2018 2023 2028
Total Cost as a Percentage of Pay
AssumedProjected

Layers22
0%
10%
20%
30%
40%
50%
60%
2008 2013 2018 2023 2028
Total Cost as a Percentage of Pay
Assumed
Layered
Combined
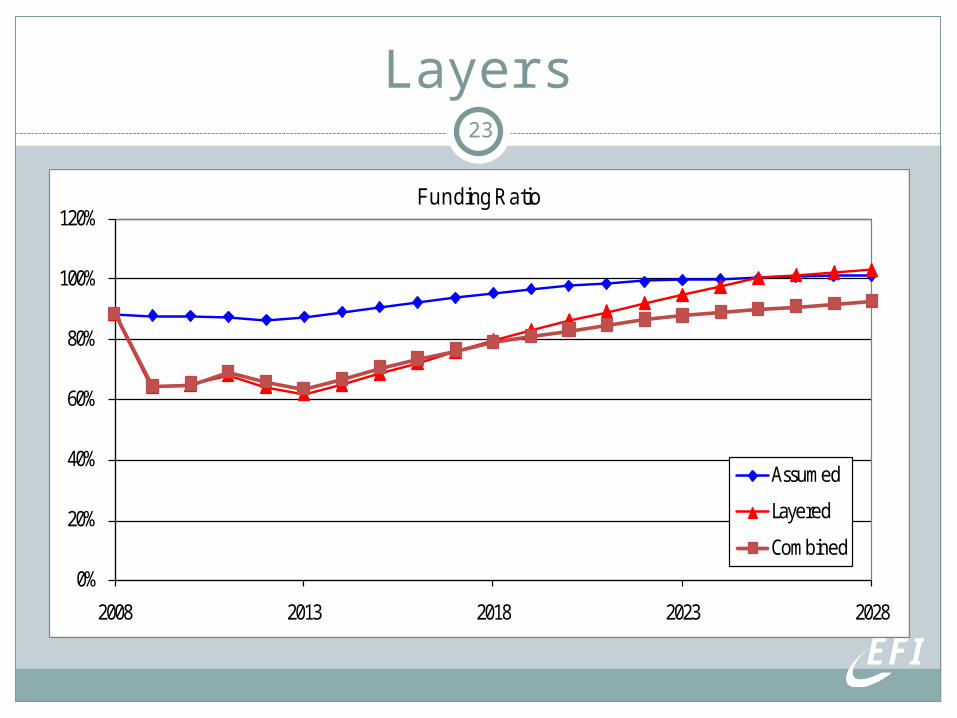
Layers23
0%
20%
40%
60%
80%
100%
120%
2008 2013 2018 2023 2028
Funding Ratio
Assumed
Layered
Combined
Layoffs
Our projections routinely assume constant active workforce Implies an increasing active payroll
Layoffs, hiring freezes, pay freezes all violate these assumptions Payroll decreases; benefits in pay status
unchanged Members near retirement not affected much Layoffs usually among younger members who
don’t cost much Increases cost as a percent of payroll Decreases payroll over which unfunded
liabilities and gains/losses are amortized
24
• Contribution Limits
• Downsizing
• Defecting to CalPERS
• Quid Pro Quo
25
Things That Don’t Work

Contribution Limits
Limit on level or growth of employer contributions Increase by no more than 0.6% of pay
per year Total contribution less than 23.7% of
pay CalSTRS bases maximum
contribution on 1990 formula, benefits, adjusted assets
Generally legislated Can lead to insolvency Must be monitored closely and managed
26
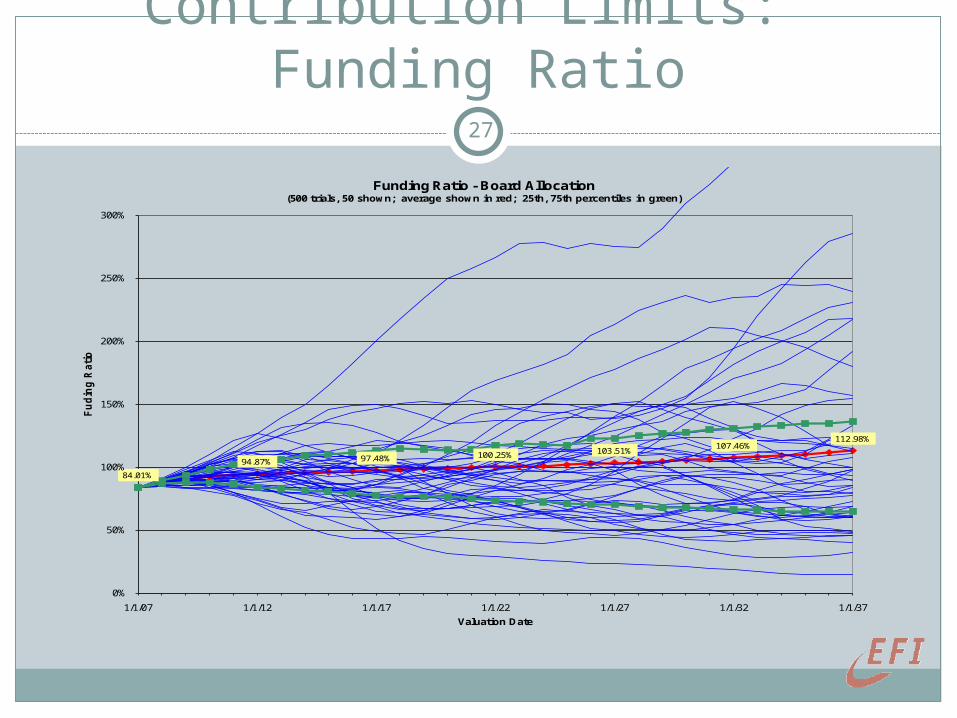
Contribution Limits: Funding Ratio27
84.01%
94.87% 97.48% 100.25% 103.51%107.46%
112.98%
0%
50%
100%
150%
200%
250%
300%
1/1/07 1/1/12 1/1/17 1/1/22 1/1/27 1/1/32 1/1/37
Fu
din
g R
ati
o
Valuation Date
Funding Ratio - Board Allocation(500 trials, 50 shown; average shown in red; 25th, 75th percentiles in green)
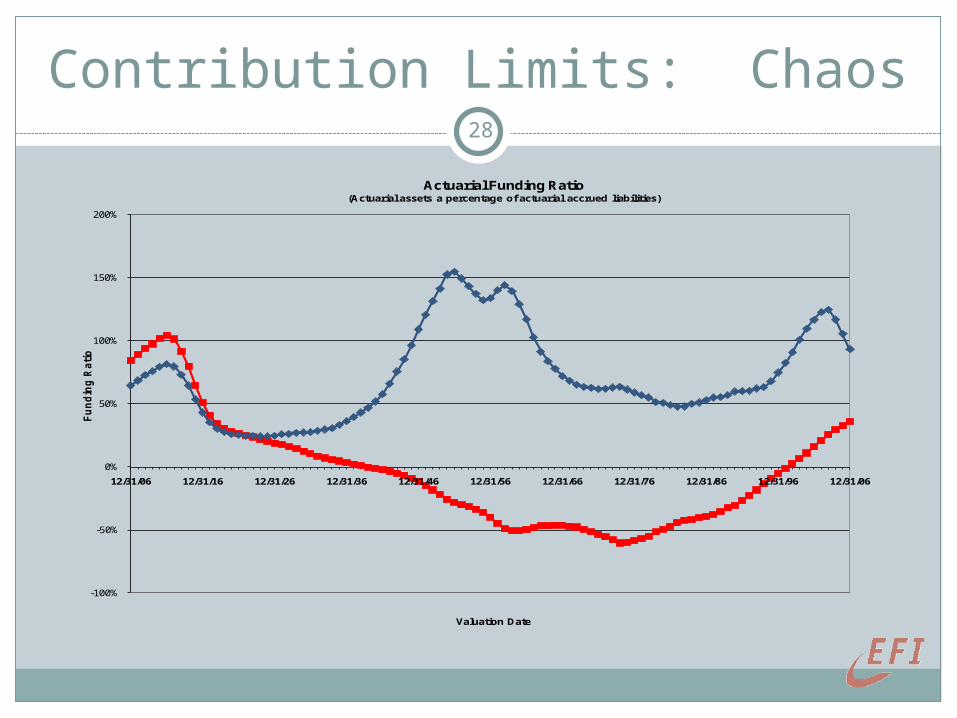
Contribution Limits: Chaos28
-100%
-50%
0%
50%
100%
150%
200%
12/31/06 12/31/16 12/31/26 12/31/36 12/31/46 12/31/56 12/31/66 12/31/76 12/31/86 12/31/96 12/31/06
Fu
nd
ing
Rati
o
Valuation Date
Actuarial Funding Ratio(Actuarial assets a percentage of actuarial accrued liabilities)
Downsizing
Spinning off operations or subdivisions Lose active members and payroll Employer contribution decreases Often lose a revenue stream
Retirees and disabled remain Fewer active members and payroll
to support the Plan Volatility and risk of remaining Plan
increases Example: General Motors
29

Defecting to CalPERS
Some participating employers are withdrawing to join CalPERS. Impact on Legacy Plan: Lose active members and payroll Retirees and disabled remain Fewer active members and payroll to
support the Plan Lose a revenue stream CalPERS amortizes initial unfunded and
gains and losses over 30 years – often longer than Legacy Plan amortization period
Therefore, employer contribution decreases
Volatility and risk of Legacy Plan increases
30

Quid Pro Quo
“If the Retirement Board reduces our contribution we will…”
31

• The Actuarial World is not the Real World
32
FlyingPigs

Flying PigsProjected Actuarial Cost
33
0%
10%
20%
30%
40%
50%
60%
2008 2013 2018 2023 2028
Total Cost as a Percentage of Pay
AssumedProjected

Flying PigsSimulated Actuarial Cost
34
23.01%
40.15%
34.33%
29.30%
15.55% 16.76% 16.04%
0%
10%
20%
30%
40%
50%
60%
70%
80%
90%
100%
7/1/08 7/1/13 7/1/18 7/1/23 7/1/28 7/1/33 7/1/38
Co
st %
Ac
tiv
e P
ayro
ll
Valuation Date
Actuarial Cost - Board Allocation(500 trials, 50 shown; average shown in red; 25th, 75th percentiles in green)

• Work Together!
35
Best Friends

Work Together!
Pension stakeholders must work together Retirement Board Board of Supervisors and other
employers Employee organizations Retirees
Work together to develop: Shared vision Shared understanding of the
problems Common strategy and tactics Shared sacrifice
36

Work Together!
Share information Retirement Board presentations to
employers about current and expected costs
Employer presentations to Retirement Board on employer financial situation
Presentations to employee organizations and retirees on funding basics, current financial environment
Joint planning Working groups with retirement board,
employer, and employee participation Joint press policy
37