Sacramento Valley Water Quality Coalition … DRAFT Sacramento Valley Water Quality Coalition...
168
Final DRAFT Sacramento Valley Water Quality Coalition Groundwater Quality Assessment Report Prepared for Northern California Water Association June 2014 2485 Natomas Park Drive Suite 600 Sacramento, CA 95833
Transcript of Sacramento Valley Water Quality Coalition … DRAFT Sacramento Valley Water Quality Coalition...

F i na l DRAFT
Sacramento Valley Water Quality Coalition
Groundwater Quality Assessment Report
Prepared for
Northern California Water Association
June 2014
2485 Natomas Park Drive Suite 600
Sacramento, CA 95833


WBG091013074126SAC ES-1
Executive Summary The groundwater quality and vulnerability analysis presented in this GAR accomplished the following major outcomes:
Enables a big‐picture, initial regional assessment of groundwater quality and vulnerability of irrigated agricultural lands in the Sacramento River Watershed that acknowledges the range of diversity in agricultural practices within the valley by accounting for numerous sources of readily available data
Provides a framework for long‐term sustainable farming in the Sacramento River Watershed with an emphasis on groundwater quality protection by stewardship of the land
Establishes an initial framework to help prioritize groundwater monitoring activities
Sacramento Valley water resources managers have adopted a single, overarching water management goal to guide their surface and groundwater initiatives: sustainability. The SVWQC recognizes how important it is to all members of the valley’s diverse community that the Sacramento Valley’s water resources be managed so that existing economic, social, and environmental systems endure indefinitely.
The Central Valley Regional Water Quality Control Board (Central Valley RWQCB) developed the Long Term Irrigated Lands Regulatory Program (LTILRP), which proposes to continue to address surface water quality and to add new groundwater quality monitoring and reporting requirements. The new requirements are adopted as WDRs and an associated MRP. The SVWQC WDR was adopted March 12, 2014. This GAR supports the WDR under the Central Valley RWQCB LTILRP.
This GAR provides a rigorous review of regional settings of irrigated farmlands in the Sacramento River Watershed including agriculture practices, soils and hydrogeology, and existing groundwater monitoring networks and data. In this manner, the GAR serves as an initial framework document that establishes the technical basis of the groundwater quality monitoring and implementation program. This report identifies areas of high vulnerability to water quality impacts from irrigated agriculture, areas of low vulnerability, and areas having data gaps that indicate the need for further evaluation.
Sacramento River Watershed The study area for the GAR is defined by the Sacramento Valley Watershed encompassed by the SVWQC boundary. The study area is composed of 13 subwatersheds and all or parts of 20 counties. The Sacramento River Watershed encompasses roughly 17 percent of the land area of California, with a total acreage of about 22.2 million acres.
The Sacramento River Watershed is bounded on the east by the Sierra Nevada and Cascade Ranges and on the west by the North Coast Range and Klamath Mountains. Large forest areas, including the Mendocino and Shasta‐Trinity National Forests in the Coast Ranges; Shasta National Forest in the southern Cascades; and the Plumas, Tahoe, and El Dorado National Forests on the western slopes of the Sierra Nevada, cover portions of the Sacramento Valley watershed. Sparse grasslands and high deserts stretch to the north.
The Sacramento Valley is drained by the Sacramento River, which stretches for over 400 miles from Mount Shasta to the San Francisco Bay‐Delta. Its major tributaries include the Pit, Feather, Yuba, and American rivers. Agriculture is concentrated around the Sacramento River as a function of accessible irrigation supplies and favorable soils.
The area is home to 2.8 million people, more than half of whom reside within the Sacramento metropolitan area. Major cities within the watershed are Alturas, Oroville, Marysville, Yuba City, Redding, Red Bluff, Chico, Sacramento, Davis, and Woodland.
The Sacramento River Watershed study area can be split into three distinct types of regions with specific hydrogeologic characteristics for purposes of the GAR analysis:
EXECUTIVE SUMMARY
2 WBG091013074126SAC
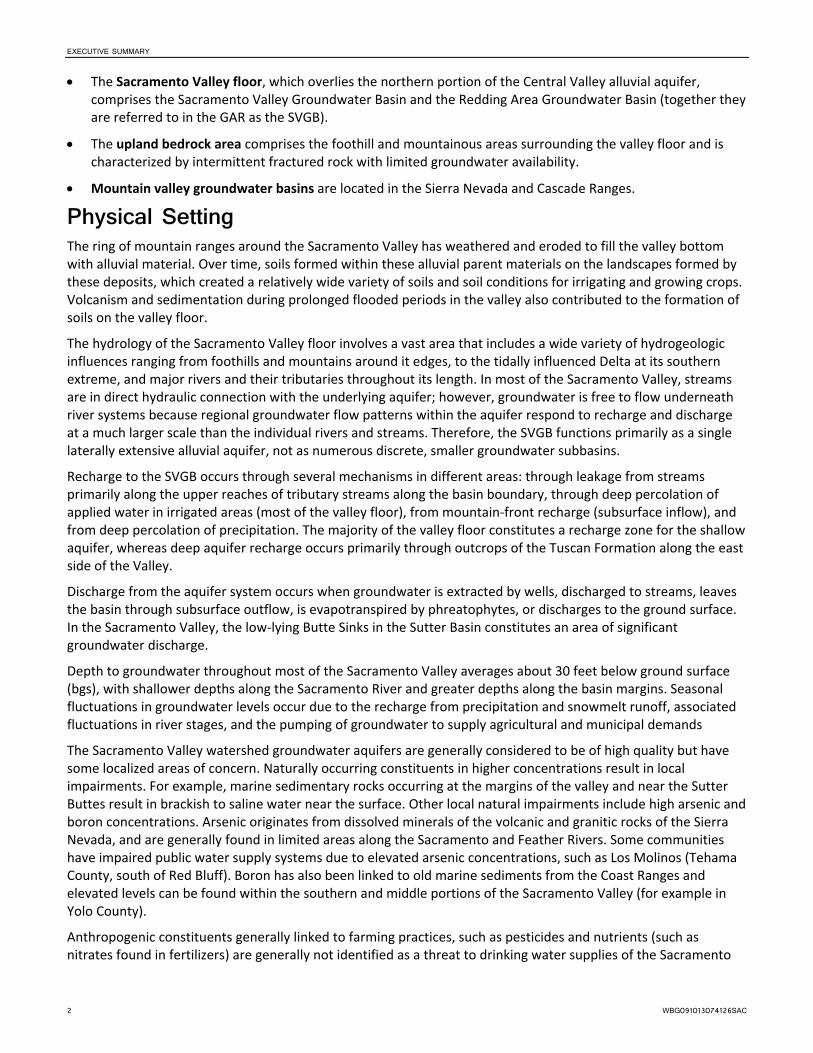
The Sacramento Valley floor, which overlies the northern portion of the Central Valley alluvial aquifer, comprises the Sacramento Valley Groundwater Basin and the Redding Area Groundwater Basin (together they are referred to in the GAR as the SVGB).
The upland bedrock area comprises the foothill and mountainous areas surrounding the valley floor and is characterized by intermittent fractured rock with limited groundwater availability.
Mountain valley groundwater basins are located in the Sierra Nevada and Cascade Ranges.
Physical Setting The ring of mountain ranges around the Sacramento Valley has weathered and eroded to fill the valley bottom with alluvial material. Over time, soils formed within these alluvial parent materials on the landscapes formed by these deposits, which created a relatively wide variety of soils and soil conditions for irrigating and growing crops. Volcanism and sedimentation during prolonged flooded periods in the valley also contributed to the formation of soils on the valley floor.
The hydrology of the Sacramento Valley floor involves a vast area that includes a wide variety of hydrogeologic influences ranging from foothills and mountains around it edges, to the tidally influenced Delta at its southern extreme, and major rivers and their tributaries throughout its length. In most of the Sacramento Valley, streams are in direct hydraulic connection with the underlying aquifer; however, groundwater is free to flow underneath river systems because regional groundwater flow patterns within the aquifer respond to recharge and discharge at a much larger scale than the individual rivers and streams. Therefore, the SVGB functions primarily as a single laterally extensive alluvial aquifer, not as numerous discrete, smaller groundwater subbasins.
Recharge to the SVGB occurs through several mechanisms in different areas: through leakage from streams primarily along the upper reaches of tributary streams along the basin boundary, through deep percolation of applied water in irrigated areas (most of the valley floor), from mountain‐front recharge (subsurface inflow), and from deep percolation of precipitation. The majority of the valley floor constitutes a recharge zone for the shallow aquifer, whereas deep aquifer recharge occurs primarily through outcrops of the Tuscan Formation along the east side of the Valley.
Discharge from the aquifer system occurs when groundwater is extracted by wells, discharged to streams, leaves the basin through subsurface outflow, is evapotranspired by phreatophytes, or discharges to the ground surface. In the Sacramento Valley, the low‐lying Butte Sinks in the Sutter Basin constitutes an area of significant groundwater discharge.
Depth to groundwater throughout most of the Sacramento Valley averages about 30 feet below ground surface (bgs), with shallower depths along the Sacramento River and greater depths along the basin margins. Seasonal fluctuations in groundwater levels occur due to the recharge from precipitation and snowmelt runoff, associated fluctuations in river stages, and the pumping of groundwater to supply agricultural and municipal demands
The Sacramento Valley watershed groundwater aquifers are generally considered to be of high quality but have some localized areas of concern. Naturally occurring constituents in higher concentrations result in local impairments. For example, marine sedimentary rocks occurring at the margins of the valley and near the Sutter Buttes result in brackish to saline water near the surface. Other local natural impairments include high arsenic and boron concentrations. Arsenic originates from dissolved minerals of the volcanic and granitic rocks of the Sierra Nevada, and are generally found in limited areas along the Sacramento and Feather Rivers. Some communities have impaired public water supply systems due to elevated arsenic concentrations, such as Los Molinos (Tehama County, south of Red Bluff). Boron has also been linked to old marine sediments from the Coast Ranges and elevated levels can be found within the southern and middle portions of the Sacramento Valley (for example in Yolo County).
Anthropogenic constituents generally linked to farming practices, such as pesticides and nutrients (such as nitrates found in fertilizers) are generally not identified as a threat to drinking water supplies of the Sacramento

EXECUTIVE SUMMARY
WBG091013074126SAC 3
Valley. However, some public water supply systems that do tend to have nitrate levels exceeding the MCL include Olivehurst, Chico, Antelope, and the Woodland‐Davis area in Yolo County.
Irrigated Agriculture The majority of irrigated agriculture in the study area occurs on the Sacramento Valley floor.
The Sacramento Valley has a diverse agriculture that is dependent on and is reflective of the range in climate, soil types, and available water supply conditions, among other factors. Apart from rice, some of the major crops of the Sacramento Valley include almonds, walnuts, alfalfa, wheat, and corn, with a recent increase in permanent crops (mostly almond orchards). Agriculture is a key employer and the major driver of the local economy, accounting for the majority of the valley’s economic production.
The seven crop categories used in the analysis and discussion in this GAR are represented by the following:
Annual fruits, vegetables, and seeds
Citrus, olives, and ornamentals
Deciduous fruits and nuts
Field
Grain and hay
Pasture
Vineyard
In addition, approximately 22,000 acres of managed wetlands are enrolled as members of the SVWQC. These wetlands are managed by a variety of entities that include public agencies, non‐government organizations, and private organizations.
Technical Approach The GAR analysis is regional in nature, with an emphasis on identifying areas of known groundwater quality vulnerability to impacts from irrigated agriculture. The GAR will provide the basis for a regional prioritization of monitoring, as well as high vulnerability areas, consistent with the requirements of the WDR.
Overview The technical analysis presented in this GAR evaluates land use in conjunction with soils and agronomy information and reviews potential hydrogeologic vulnerabilities to identify practices or physical characteristics that pose a greater risk to groundwater quality impact than other areas. Further analysis then pairs these results with groundwater quality data to refine the vulnerability conclusions and present information at the subwatershed level.
More specifically, the technical approach was developed to:
Collectively consider the agronomic, soils and hydrogeology, and geographic/land use factors to estimate groundwater vulnerability to water quality degradation
Perform a detailed evaluation of groundwater quality data
Groundwater quality for nitrate and salinity will be evaluated with detailed mapping (geographic representation) and graphical analysis (trends)
Groundwater quality for pesticides will be reviewed form DPR datasets
Groundwater quality for other constituents will be evaluated based on information contained in previously published reports
Use several lines of evidence to develop vulnerability conclusions:
Hydrogeology (geology, recharge rates, depth to groundwater)
Soils (texture and drainage class)
EXECUTIVE SUMMARY
4 WBG091013074126SAC
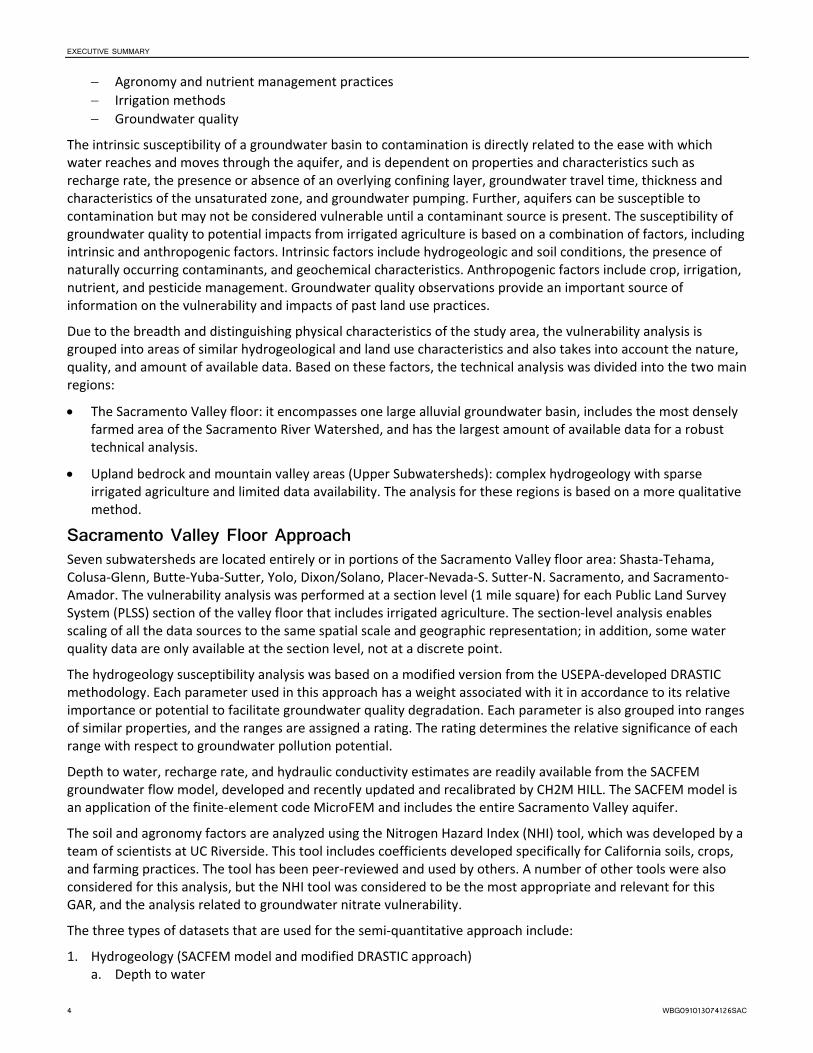
Agronomy and nutrient management practices
Irrigation methods
Groundwater quality
The intrinsic susceptibility of a groundwater basin to contamination is directly related to the ease with which water reaches and moves through the aquifer, and is dependent on properties and characteristics such as recharge rate, the presence or absence of an overlying confining layer, groundwater travel time, thickness and characteristics of the unsaturated zone, and groundwater pumping. Further, aquifers can be susceptible to contamination but may not be considered vulnerable until a contaminant source is present. The susceptibility of groundwater quality to potential impacts from irrigated agriculture is based on a combination of factors, including intrinsic and anthropogenic factors. Intrinsic factors include hydrogeologic and soil conditions, the presence of naturally occurring contaminants, and geochemical characteristics. Anthropogenic factors include crop, irrigation, nutrient, and pesticide management. Groundwater quality observations provide an important source of information on the vulnerability and impacts of past land use practices.
Due to the breadth and distinguishing physical characteristics of the study area, the vulnerability analysis is grouped into areas of similar hydrogeological and land use characteristics and also takes into account the nature, quality, and amount of available data. Based on these factors, the technical analysis was divided into the two main regions:
The Sacramento Valley floor: it encompasses one large alluvial groundwater basin, includes the most densely farmed area of the Sacramento River Watershed, and has the largest amount of available data for a robust technical analysis.
Upland bedrock and mountain valley areas (Upper Subwatersheds): complex hydrogeology with sparse irrigated agriculture and limited data availability. The analysis for these regions is based on a more qualitative method.
Sacramento Valley Floor Approach Seven subwatersheds are located entirely or in portions of the Sacramento Valley floor area: Shasta‐Tehama, Colusa‐Glenn, Butte‐Yuba‐Sutter, Yolo, Dixon/Solano, Placer‐Nevada‐S. Sutter‐N. Sacramento, and Sacramento‐Amador. The vulnerability analysis was performed at a section level (1 mile square) for each Public Land Survey System (PLSS) section of the valley floor that includes irrigated agriculture. The section‐level analysis enables scaling of all the data sources to the same spatial scale and geographic representation; in addition, some water quality data are only available at the section level, not at a discrete point.
The hydrogeology susceptibility analysis was based on a modified version from the USEPA‐developed DRASTIC methodology. Each parameter used in this approach has a weight associated with it in accordance to its relative importance or potential to facilitate groundwater quality degradation. Each parameter is also grouped into ranges of similar properties, and the ranges are assigned a rating. The rating determines the relative significance of each range with respect to groundwater pollution potential.
Depth to water, recharge rate, and hydraulic conductivity estimates are readily available from the SACFEM groundwater flow model, developed and recently updated and recalibrated by CH2M HILL. The SACFEM model is an application of the finite‐element code MicroFEM and includes the entire Sacramento Valley aquifer.
The soil and agronomy factors are analyzed using the Nitrogen Hazard Index (NHI) tool, which was developed by a team of scientists at UC Riverside. This tool includes coefficients developed specifically for California soils, crops, and farming practices. The tool has been peer‐reviewed and used by others. A number of other tools were also considered for this analysis, but the NHI tool was considered to be the most appropriate and relevant for this GAR, and the analysis related to groundwater nitrate vulnerability.
The three types of datasets that are used for the semi‐quantitative approach include:
1. Hydrogeology (SACFEM model and modified DRASTIC approach) a. Depth to water
EXECUTIVE SUMMARY
WBG091013074126SAC 5
b. Recharge rate c. Hydraulic Conductivity d. Aquifer media e. Soil media
2. Soils and Agronomy (NHI Tool) a. Crop type b. Soil type c. Irrigation practice
3. Groundwater quality (existing monitoring networks) a. Nitrate b. Salinity
Upper Subwatersheds Appraoch The vulnerability assessment in the Upper Subwatersheds focused on:
NHI evaluation results (same approach to valley floor)
Groundwater quality data as available, and also obtained from areas with similar cropping, soil, and irrigation practices
General understanding of hydrogeology from existing reports and existing depth to water contour maps
The qualitative review of these limited datasets enabled an understanding of potential and existing vulnerabilities to groundwater contamination in the upland areas to be developed.
Following the rigorous analysis of each of the datasets described above, the information was integrated to assess susceptibility and vulnerability to groundwater contamination for areas in each subwatershed. First, the vulnerability analysis was performed at the SACFEM area section level scale of resolution across the valley floor before adding a more detailed review of existing water quality data on a subwatershed level.
This technical analysis was used to make vulnerability assessment conclusions and provide basic recommendations.
Summary and Conclusions Each of the 13 subwatersheds are characterized and a summary of susceptibility and vulnerability designations and conclusions are given in separate GAR Sections. Conclusions were developed separately for each subwatershed based on mapping of data and review of existing information and other factors.
The groundwater quality vulnerability analysis focused on nitrate and TDS concentrations measured in groundwater across the study area. Results for TDS were reviewed and discussed for each subwatershed in the context of groundwater beneficial use. Limited areas of vulnerability were identified, primarily based on the occurrence of naturally occurring sources of groundwater salinity and use of groundwater for irrigation supply. The main focus of the discussion is on the vulnerability analysis due to nitrate concentrations.
In general, nitrate concentrations are very low in the groundwater of the Sacramento River Watershed, with the exception of a few localized high‐concentration areas. These areas showing elevated nitrate levels also tend to have associated land uses other than irrigated agriculture that might influence nitrate levels in groundwater. Looking specifically at the valley floor area, of the 2,645 recent well samples reviewed, the average nitrate (as NO3) concentration is 11 mg/L, which is well below half the MCL of 22.5 mg/L. In addition, only 5% of all recent well samples had concentrations above the MCL of 45 mg/L. These data indicate that even on the valley floor, where 80% of the agricultural production in this watershed occurs, nitrate concentrations are low, and irrigated agriculture does not appear to pose a significant threat to groundwater quality. Limited areas of vulnerability were identified, as described below.

EXECUTIVE SUMMARY
6 WBG091013074126SAC
The GIS‐based analysis of susceptibility indicators and groundwater quality results evaluated the Sacramento River Watershed irrigated agricultural areas on the valley floor using a different methodology than that used to evaluate the upper subwatersheds for two key reasons: (1) the differences in agricultural practices employed and (2) the physical characteristics that exist in these areas.
The susceptibility evaluation of the valley floor area employed a detailed GIS‐based analysis of hydrogeologic properties obtained from a calibrated groundwater flow model of the area, SACFEM, and a modified version of the DRASTIC methodology (USEPA 1987). Based on the combination of hydrogeologic susceptibility data, NHI data, and nitrate concentration data, each section containing irrigated agricultural lands on the valley floor was designated as having a low, moderate, or high vulnerability to groundwater quality contamination. The resulting number of sections designated within each category are summarized in Table ES‐1.
TABLE ES-1 Vulnerability Designations by Section for SACFEM Portions of Subwatershed on the Sacramento Valley Floor
Subwatershed
Section Vulnerability Designations*
Low Moderate High
Butte Yuba Sutter 262 352 253
Colusa Glenn 344 325 184
Dixon Solano 91 148 87
Placer Nevada 111 88 20
Sacramento Amador 108 133 76
Shasta Tehama 273 74 30
Yolo 321 248 135
Total SACFEM Area (3,807 sections) 1,441 1,224 692
* Vulnerability designations due to nitrate concentrations
These data indicate that within the Sacramento Valley floor, about 38 percent of the sections are categorized as low vulnerability, with 32 percent as moderate vulnerability, and 18 percent as high vulnerability. In addition, 12 percent of the sections are classified as data gaps due to the lack of sufficient data to make a final determination.
For any of the above listed subwatersheds that have a portion of their area extending outside of the Sacramento Valley floor and that overlie the foothill bedrock aquifers, these extended areas were all designated low vulnerability because the groundwater quality is those areas is generally excellent, the extent of the agricultural areas are sparse, and agricultural operations do not overly an alluvial groundwater basin.
For the six upper subwatersheds that lie outside the valley floor, the technical analysis was more qualitative in nature, and results were discussed specifically in each subwatershed section. These analyses accounted for known information on groundwater quality, geologic characteristics, agronomic practices, and sustainability programs.
Areas designated as high vulnerability have the following characteristics:
Overall high relative susceptibility conditions (hydrogeology and NHI)
and/or
High nitrate concentrations
and/or
Increasing nitrate concentration trends
These areas are primarily located in the Chico area in northwestern Butte County, in northern Glenn County, in the Yuba City area, in the Davis‐Woodland area, in northeastern Solano County, and in the northern Delta.

EXECUTIVE SUMMARY
WBG091013074126SAC 7
However, groundwater quality in most of these areas are not solely influenced by irrigated agricultural land use. For example, the City of Chico has documented impacts to groundwater quality due to releases from septic systems, and in Glenn County, dairy operations may also be influencing groundwater quality. The potential for these external urban and dairy influences to impact groundwater quality should be reviewed and considered during development of the groundwater trend monitoring workplan so that existing monitoring information can be leveraged from other programs, in addition to assessing the potential impacts of irrigated agricultural practices.
In the upper subwatersheds, the Lake Subwatershed has an area of high vulnerability to nitrate contamination in the Big Valley groundwater basin according to existing data and previously documented monitoring results. Additional monitoring is warranted within that subwatershed. The main high vulnerability areas for each subwatershed are summarized in Table ES‐2.
TABLE ES-2 Summary of Main Areas Having High Vulnerability to Nitrate Contamination
Subwatershed Main Areas of High Vulnerability Other Potential Influencers
Butte Yuba Sutter Northeastern Butte Co., Yuba City area Chico area septic systems
Colusa Glenn Northern Glenn Co. Glenn County dairies
Dixon Solano Northeastern Solano Co. Dixon wastewater ponds
Placer Nevada No major areas
Sacramento Amador Delta area Historical dairies in the Delta
Shasta Tehama No major areas
Yolo Davis‐Woodland area
El Dorado No major areas
Goose Lake No major areas
Lake Big Valley Basin
Napa No major areas
Pit River No major areas
Upper Feather River No major areas
The GAR analysis shows that the Sacramento River Watershed shows generally low vulnerability to groundwater quality degradation from irrigated agriculture. In localized areas where high vulnerability was designated, other influencers might also be causing or contributing nitrate concentration increases. Furthermore, in cases where available well data were a few decades old, newer samples may yield different water quality results.
A review of previously published studies by the USGS demonstrate that the results of this GAR correlate with the observations from previous recent groundwater quality technical analysis. In particular, the USGS studies found that nitrate is generally observed at low concentrations on the valley floor (less than half the MCL) in the upper 200 feet of the aquifer, with a few localized exceptions, as discussed throughout this GAR. In addition, due to the fine‐grained sediments present in the Sacramento Valley aquifers, and generally reduced conditions, the central basin area has very low predicted nitrate concentrations compared to areas at the basin’s margins.
The Sacramento Valley has unique characteristics, such as high precipitation rates, an important surface water system with high‐quality water for groundwater recharge and irrigation, efficient irrigation practices, well managed agricultural practices, and a dedication to stewardship of the land. These combined characteristics result in low vulnerability of groundwater quality contamination in the majority of the watershed.
EXECUTIVE SUMMARY
8 WBG091013074126SAC
The regional‐scale analysis presented in this GAR provides a technical basis for the prioritization for the initial implementation of the LTILRP WDR and MRP requirements, including the prioritization of trend monitoring programs and the implementation of agricultural water quality protection implementation activities. Subsequent to the RWQCB’s approval of the submitted GAR, a Groundwater Quality Monitoring Workplan will be developed. The Workplan will use the technical analysis presented herein to develop a prioritized monitoring program that seeks to rely on existing well networks, and focuses the density of monitoring activities in areas of higher vulnerability. Results collected during the monitoring phases of the program will be incorporated into annual monitoring reports, and will inform the update of the GAR that is required every 5 years.

WBG091013074126SAC III
Contents Section Page
Executive Summary ........................................................................................................................................ ES‐1
Acronyms and Abbreviations ............................................................................................................................ xiii
1 Introduction ......................................................................................................................................... 1‐1 1.1 Purpose ............................................................................................................................................ 1‐1 1.2 Background ...................................................................................................................................... 1‐1
1.2.1 Sacramento Valley Water Quality Coalition ....................................................................... 1‐1 1.2.2 Central Valley RWQCB’s Long‐Term Irrigated Lands Regulatory Program ......................... 1‐2 1.2.3 Sustainable Water Management in the Sacramento Valley............................................... 1‐2 1.2.4 Sources of Existing Data ..................................................................................................... 1‐2
2 Regional Setting ................................................................................................................................... 2‐1 2.1 Physical Setting ................................................................................................................................ 2‐1
2.1.1 Sacramento River Watershed Study Area .......................................................................... 2‐1 2.1.2 Soils and Landforms ............................................................................................................ 2‐3 2.1.3 Overview of Valley Floor Hydrogeology ............................................................................. 2‐4 2.1.4 Overview of Valley Floor Groundwater Quality ................................................................. 2‐6 2.1.5 Initial Designation of Hydrogeologically Vulnerable Areas ................................................ 2‐7
2.2 Existing Groundwater Beneficial Uses ............................................................................................. 2‐7 2.3 Overview of Water Quality Objectives and Basin Plans .................................................................. 2‐8
2.3.1 Nitrate Standards ................................................................................................................ 2‐8 2.3.2 Salinity Standards ............................................................................................................... 2‐8 2.3.3 MUN Standards .................................................................................................................. 2‐9 2.3.4 AGR Standards .................................................................................................................... 2‐9
2.4 Major Known Impacted Groundwater Quality Areas ...................................................................... 2‐9 2.5 Irrigated Agriculture in the Sacramento River Watershed ............................................................ 2‐10
2.5.1 Major Crop Categories ...................................................................................................... 2‐10 2.5.2 Fertilizer Use Summary ..................................................................................................... 2‐11
2.6 Managed Wetlands ........................................................................................................................ 2‐11
3 Overview of Well Networks ................................................................................................................. 3‐1 3.1 Groundwater Level Measurements ................................................................................................. 3‐1 3.2 Groundwater Quality Datasets ........................................................................................................ 3‐1
3.2.1 SWRCB GeoTracker GAMA Database ................................................................................. 3‐2 3.2.2 SWRCB GAMA Program: Domestic Wells Project ............................................................... 3‐4 3.2.3 USGS NWIS Database ......................................................................................................... 3‐6 3.2.4 USGS GAMA Program: Priority Basin Project ..................................................................... 3‐7 3.2.5 USGS NAWQA ..................................................................................................................... 3‐9 3.2.6 DWR .................................................................................................................................. 3‐10 3.2.7 DPR ................................................................................................................................... 3‐10 3.2.8 Well Networks Summary .................................................................................................. 3‐11
4 Vulnerability Analysis Approach ........................................................................................................... 4‐1 4.1 Overview of Approach ..................................................................................................................... 4‐1
4.1.1 Evaluation of Factors Contributing to Groundwater Quality Vulnerability ........................ 4‐1 4.1.2 Regional Characteristics ..................................................................................................... 4‐2
4.2 Vulnerability Assessment Approach ................................................................................................ 4‐2 4.2.1 Subwatershed Scale Analysis .............................................................................................. 4‐2

CONTENTS, CONTINUED
IV WBG091013074126SAC
4.2.2 Hydrogeology ...................................................................................................................... 4‐3 4.2.3 Soils and Agronomy ............................................................................................................ 4‐4 4.2.4 Groundwater Quality .......................................................................................................... 4‐5 4.2.5 Assumptions and Limitations ............................................................................................. 4‐6 4.2.6 Sacramento Valley Floor Approach .................................................................................... 4‐6 4.2.7 Upper Subwatersheds Approach ...................................................................................... 4‐13 4.2.8 Pesticides Approach ......................................................................................................... 4‐13 4.2.9 Summary and Integration of Data for Vulnerability Designations ................................... 4‐14
5 Butte/Yuba/Sutter Subwatershed ........................................................................................................ 5‐1 5.1 Background ...................................................................................................................................... 5‐1
5.1.1 Land Use ............................................................................................................................. 5‐1 5.1.2 Soils ..................................................................................................................................... 5‐2 5.1.3 Geology and Hydrogeology ................................................................................................ 5‐2 5.1.4 Current Programs and Groundwater Monitoring ............................................................... 5‐3
5.2 Vulnerability Analysis Results .......................................................................................................... 5‐4 5.2.1 Groundwater Quality .......................................................................................................... 5‐4 5.2.2 Susceptibility Factors .......................................................................................................... 5‐7
5.3 Conclusions ...................................................................................................................................... 5‐7
6 Colusa Glenn Subwatershed ................................................................................................................. 6‐1 6.1 Background ...................................................................................................................................... 6‐1
6.1.1 Land Use ............................................................................................................................. 6‐1 6.1.2 Soils ..................................................................................................................................... 6‐2 6.1.3 Geology and Hydrogeology ................................................................................................ 6‐2 6.1.4 Current Programs and Groundwater Monitoring ............................................................... 6‐3
6.2 Vulnerability Analysis Results .......................................................................................................... 6‐3 6.2.1 Groundwater Quality .......................................................................................................... 6‐3 6.2.2 Susceptibility Factors .......................................................................................................... 6‐6
6.3 Conclusions ...................................................................................................................................... 6‐6
7 Dixon/Solano Subwatershed ................................................................................................................ 7‐1 7.1 Background ...................................................................................................................................... 7‐1
7.1.1 Land Use ............................................................................................................................. 7‐1 7.1.2 Soils ..................................................................................................................................... 7‐2 7.1.3 Geology and Hydrogeology ................................................................................................ 7‐2 7.1.4 Current Programs and Groundwater Monitoring ............................................................... 7‐3
7.2 Vulnerability Analysis Results .......................................................................................................... 7‐3 7.2.1 Groundwater Quality .......................................................................................................... 7‐3 7.2.2 Susceptibility Factors .......................................................................................................... 7‐5
7.3 Conclusions ...................................................................................................................................... 7‐5
8 Placer / Nevada/ S. Sutter / N. Sacramento Subwatershed .................................................................. 8‐1 8.1 Background ...................................................................................................................................... 8‐1
8.1.1 Land Use ............................................................................................................................. 8‐1 8.1.2 Soils ..................................................................................................................................... 8‐2 8.1.3 Geology and Hydrogeology ................................................................................................ 8‐2 8.1.4 Current Programs and Groundwater Monitoring ............................................................... 8‐3
8.2 Vulnerability Analysis Results .......................................................................................................... 8‐3 8.2.1 Groundwater Quality .......................................................................................................... 8‐3 8.2.2 Susceptibility Factors .......................................................................................................... 8‐6
8.3 Conclusions ...................................................................................................................................... 8‐6

CONTENTS, CONTINUED
WBG091013074126SAC V
9 Sacramento‐Amador Subwatershed ..................................................................................................... 9‐1 9.1 Background ...................................................................................................................................... 9‐1
9.1.1 Land Use ............................................................................................................................. 9‐1 9.1.2 Soils ..................................................................................................................................... 9‐2 9.1.3 Geology and Hydrogeology ................................................................................................ 9‐2 9.1.4 Current Programs and Groundwater Monitoring ............................................................... 9‐3
9.2 Vulnerability Analysis Results .......................................................................................................... 9‐3 9.2.1 Groundwater Quality .......................................................................................................... 9‐4 9.2.2 Susceptibility Factors .......................................................................................................... 9‐6
9.3 Conclusions ...................................................................................................................................... 9‐7
10 Shasta/Tehama Subwatershed ........................................................................................................... 10‐1 10.1 Background .................................................................................................................................... 10‐1
10.1.1 Land Use ........................................................................................................................... 10‐1 10.1.2 Soils ................................................................................................................................... 10‐2 10.1.3 Geology and Hydrogeology .............................................................................................. 10‐2 10.1.4 Current Programs and Groundwater Monitoring ............................................................. 10‐3
10.2 Vulnerability Analysis Results ........................................................................................................ 10‐3 10.2.1 Groundwater Quality ........................................................................................................ 10‐3 10.2.2 Susceptibility Factors ........................................................................................................ 10‐6
10.3 Conclusions .................................................................................................................................... 10‐6
11 Yolo Subwatershed ............................................................................................................................ 11‐1 11.1 Background .................................................................................................................................... 11‐1
11.1.1 Land Use ........................................................................................................................... 11‐1 11.1.2 Soils ................................................................................................................................... 11‐2 11.1.3 Geology and Hydrogeology .............................................................................................. 11‐2 11.1.4 Current Programs and Groundwater Monitoring ............................................................. 11‐2
11.2 Vulnerability Analysis Results ........................................................................................................ 11‐3 11.2.1 Groundwater Quality ........................................................................................................ 11‐3 11.2.2 Susceptibility Factors ........................................................................................................ 11‐6
11.3 Conclusions .................................................................................................................................... 11‐6
12 El Dorado Subwatershed .................................................................................................................... 12‐1 12.1 Background .................................................................................................................................... 12‐1
12.1.1 Land Use ........................................................................................................................... 12‐1 12.1.2 Soils ................................................................................................................................... 12‐2 12.1.3 Geology and Hydrogeology .............................................................................................. 12‐3 12.1.4 Current Programs and Groundwater Monitoring ............................................................. 12‐3
12.2 Vulnerability Analysis Results ........................................................................................................ 12‐4 12.2.1 Groundwater Quality ........................................................................................................ 12‐4 12.2.2 Susceptibility Factors ........................................................................................................ 12‐5
12.3 Conclusions .................................................................................................................................... 12‐6
13 Goose Lake Subwatershed ................................................................................................................. 13‐1 13.1 Background .................................................................................................................................... 13‐1
13.1.1 Land Use ........................................................................................................................... 13‐1 13.1.2 Soils ................................................................................................................................... 13‐2 13.1.3 Geology and Hydrogeology .............................................................................................. 13‐3 13.1.4 Current Programs and Groundwater Monitoring ............................................................. 13‐3
13.2 Vulnerability Analysis Results ........................................................................................................ 13‐3 13.2.1 Groundwater Quality ........................................................................................................ 13‐3 13.2.2 Susceptibility Factors ........................................................................................................ 13‐4
CONTENTS, CONTINUED
VI WBG091013074126SAC
13.3 Conclusions .................................................................................................................................... 13‐4
14 Lake Subwatershed ............................................................................................................................ 14‐1 14.1 Background .................................................................................................................................... 14‐1
14.1.1 Land Use ........................................................................................................................... 14‐1 14.1.2 Soils ................................................................................................................................... 14‐2 14.1.3 Geology and Hydrogeology .............................................................................................. 14‐3 14.1.4 Current Programs and Groundwater Monitoring ............................................................. 14‐3
14.2 Vulnerability Analysis Results ........................................................................................................ 14‐4 14.2.1 Groundwater Quality ........................................................................................................ 14‐4 14.2.2 Susceptibility Factors ........................................................................................................ 14‐6
14.3 Conclusions .................................................................................................................................... 14‐6
15 Napa Subwatershed ........................................................................................................................... 15‐1 15.1 Background .................................................................................................................................... 15‐1
15.1.1 Land Use ........................................................................................................................... 15‐1 15.1.2 Soils ................................................................................................................................... 15‐2 15.1.3 Geology and Hydrogeology .............................................................................................. 15‐2 15.1.4 Current Programs and Groundwater Monitoring ............................................................. 15‐2
15.2 Vulnerability Analysis Results ........................................................................................................ 15‐3 15.2.1 Groundwater Quality ........................................................................................................ 15‐3 15.2.2 Susceptibility Factors ........................................................................................................ 15‐3
15.3 Conclusions .................................................................................................................................... 15‐4
16 Pit River Subwatershed ...................................................................................................................... 16‐1 16.1 Background .................................................................................................................................... 16‐1
16.1.1 Land Use ........................................................................................................................... 16‐1 16.1.2 Soils ................................................................................................................................... 16‐2 16.1.3 Geology and Hydrogeology .............................................................................................. 16‐2 16.1.4 Current Programs and Groundwater Monitoring ............................................................. 16‐3
16.2 Vulnerability Analysis Results ........................................................................................................ 16‐3 16.2.1 Groundwater Quality ........................................................................................................ 16‐3 16.2.2 Susceptibility Factors ........................................................................................................ 16‐5
16.3 Conclusions .................................................................................................................................... 16‐6
17 Upper Feather River Subwatershed .................................................................................................... 17‐1 17.1 Background .................................................................................................................................... 17‐1
17.1.1 Land Use ........................................................................................................................... 17‐1 17.1.2 Soils ................................................................................................................................... 17‐2 17.1.3 Geology and Hydrogeology .............................................................................................. 17‐3 17.1.4 Current Programs and Groundwater Monitoring ............................................................. 17‐3
17.2 Vulnerability Analysis Results ........................................................................................................ 17‐4 17.2.1 Groundwater Quality ........................................................................................................ 17‐4 17.2.2 Susceptibility Factors ........................................................................................................ 17‐6
17.3 Conclusions .................................................................................................................................... 17‐6
18 Results and Conclusions ..................................................................................................................... 18‐1 18.1 Summary of Results ....................................................................................................................... 18‐1
18.1.1 Groundwater Quality Summary........................................................................................ 18‐1 18.1.2 Aquifer Susceptibility and Vulnerability Results Summary .............................................. 18‐2
18.2 Vulnerability Designations ............................................................................................................. 18‐3 18.2.1 Low Vulnerability .............................................................................................................. 18‐3 18.2.2 Moderate Vulnerability .................................................................................................... 18‐3

CONTENTS, CONTINUED
WBG091013074126SAC VII
18.2.3 High Vulnerability ............................................................................................................. 18‐3 18.2.4 Data Gap Areas ................................................................................................................. 18‐4 18.2.5 Conclusions ....................................................................................................................... 18‐4
19 References ......................................................................................................................................... 19‐1 19.1 Section 1 ........................................................................................................................................ 19‐1 19.2 Section 2 ........................................................................................................................................ 19‐1 19.3 Section 3 ........................................................................................................................................ 19‐2 19.4 Section 4 ........................................................................................................................................ 19‐3 19.5 Section 5 ........................................................................................................................................ 19‐3 19.6 Section 6 ........................................................................................................................................ 19‐4 19.7 Section 7 ........................................................................................................................................ 19‐4 19.8 Section 8 ........................................................................................................................................ 19‐4 19.9 Section 9 ........................................................................................................................................ 19‐4 19.10 Section 10 ...................................................................................................................................... 19‐4 19.11 Section 11 ...................................................................................................................................... 19‐5 19.12 Section 12 ...................................................................................................................................... 19‐5 19.13 Section 13 ...................................................................................................................................... 19‐5 19.14 Section 14 ...................................................................................................................................... 19‐5 19.15 Section 15 ...................................................................................................................................... 19‐5 19.16 Section 16 ...................................................................................................................................... 19‐6 19.17 Section 17 ...................................................................................................................................... 19‐6 19.18 Section 18 ...................................................................................................................................... 19‐6
Appendixes
A Subwatershed Overview B Land Use C NRCS Soil Drainage Classes D DWR Groundwater Contour Maps E USGS Water Quality Maps F Fertilizer Usage G NHI Scores and Descriptions H CASGEM Maps I Nitrate and TDS Trend Graphs J Pesticides Data Summary
Tables
Table ES‐1: Vulnerability Designations by Section for SACFEM Portions of Subwatershed on the Sacramento Valley Floor .......................................................................................................................................................... 6
Table ES‐2: Summary of Main Areas Having High Vulnerability to Nitrate Contamination ........................................ 7
Table 1‐1: Sources of Readily Available Data .......................................................................................................... 1‐3
Table 2‐1: Salinity Indicator Standards ................................................................................................................... 2‐9
Table 3‐1: GAMA Domestic Well Depths in Tehama County Focus Area ............................................................... 3‐4 Table 3‐2: GAMA Domestic Well Depths in Yuba County Focus Area .................................................................... 3‐5 Table 3‐3: GAMA Domestic Well Depths in El Dorado County Focus Area ............................................................. 3‐6 Table 3‐4: Summary of GAMA Well Network Well Depths ..................................................................................... 3‐7 Table 3‐5: Summary Evaluation of Available Well Water Quality Data Sources ................................................... 3‐12

CONTENTS, CONTINUED
VIII WBG091013074126SAC
Table 4‐1: Grouping and Order of Subwatershed Sections in the GAR .................................................................. 4‐3 Table 4‐2: Modified DRASTIC Methodology Applied to GAR Approach ................................................................. 4‐7 Table 4‐3: Ranges and Ratings for Depth to Water ................................................................................................ 4‐8 Table 4‐4: Ranges and Ratings for Drainage Classes ............................................................................................... 4‐8 Table 4‐5: Ranges and Ratings for Aquifer Media .................................................................................................. 4‐8 Table 4‐6: Ranges and Ratings for Net Recharge ................................................................................................... 4‐8 Table 4‐7: Ranges and Ratings for Hydraulic Conductivity ..................................................................................... 4‐9 Table 4‐8: Susceptibility Ranking Scheme ............................................................................................................. 4‐15 Table 4‐9: Initial Vulnerability Ratings and Ranking .............................................................................................. 4‐15
Table 5‐1: Butte‐Yuba‐Sutter Subwatershed: Most Recent NO3 Results at Each Well .......................................... 5‐5 Table 5‐2: Butte‐Yuba‐Sutter Subwatershed: Most Recent TDS Results at Each Well ........................................... 5‐6
Table 6‐1: Colusa Glenn Subwatershed: Most Recent NO3 Results at Each Well .................................................. 6‐5 Table 6‐2: Colusa Glenn Subwatershed: Most Recent TDS Results at Each Well ................................................... 6‐5
Table 7‐1: Dixon/Solano Subwatershed: Most Recent NO3 Results at Each Well .................................................. 7‐3 Table 7‐2: Dixon/Solano Subwatershed: Most Recent TDS Results at Each Well ................................................... 7‐4
Table 8‐1: PNSSNS Subwatershed: Most Recent NO3 Results at Each Well ........................................................... 8‐4 Table 8‐2: PNSSNS Subwatershed: Most Recent TDS Results at Each Well ............................................................ 8‐5
Table 9‐1: Sacramento‐Amador Subwatershed: Most Recent NO3 Results at Each Well ...................................... 9‐4 Table 9‐2: Sacramento‐Amador Subwatershed: Most Recent TDS Results at Each Well ....................................... 9‐6
Table 10‐1: Shasta Tehama Subwatershed: Most Recent NO3 Results at Each Well ............................................. 10‐4 Table 10‐2: Shasta Tehama Subwatershed: Most Recent TDS Results at Each Well .............................................. 10‐5
Table 11‐1: Yolo Subwatershed: Most Recent NO3 Results at Each Well .............................................................. 11‐4 Table 11‐2: Yolo Subwatershed: Most Recent TDS Results at Each Well ............................................................... 11‐5
Table 12‐1: El Dorado Subwatershed: Most Recent NO3 Results at Each Well ...................................................... 12‐4 Table 12‐2: El Dorado Subwatershed: Most Recent TDS Results at Each Well ....................................................... 12‐5
Table 14‐1: Lake Subwatershed: Most Recent NO3 Results at Each Well .............................................................. 14‐5 Table 14‐2: Lake Subwatershed: Most Recent TDS Results at Each Well ............................................................... 14‐5
Table 16‐1: Pit River Subwatershed: Most Recent NO3 Results at Each Well ........................................................ 16‐4 Table 16‐2: Pit River Subwatershed: Most Recent TDS Results at Each Well ......................................................... 16‐5
Table 17‐1: Upper Feather River Subwatershed: Most Recent NO3 Results at Each Well ..................................... 17‐4 Table 17‐2: Upper Feather River Subwatershed: Most Recent TDS Results at Each Well ...................................... 17‐5
Table 18‐1: Vulnerability Designations by Section for SACFEM Portions of Subwatershed on the Sacramento Valley Floor ...................................................................................................................... 18‐2
Table 18‐2: Summary of Main Areas Having High Vulnerability to Nitrate Contamination ................................... 18‐4
Figures (all figures are located at the end of each respective section)
Figure 2‐1: Sacramento River Watershed Study Area Figure 2‐2: Land Use in the Sacramento River Watershed Figure 2‐3: Generalized Lithology in the Sacramento River Watershed
CONTENTS, CONTINUED
WBG091013074126SAC IX
Figure 2‐4: Detailed Lithology in the Sacramento Basin Figure 2‐5: Soil Surface Texture in the Sacramento River Watershed Figure 2‐6: Soil Drainage Classes in the Sacramento River Watershed Figure 2‐7: Soil Hydraulic Conductivity in the Sacramento River Watershed Figure 2‐8: Soil Salinity in the Sacramento River Watershed Figure 2‐9: Soil pH in the Sacramento River Watershed Figure 2‐10: SWRCB Hydrogeologically Vulnerable and DPR Groundwater Protection Areas Figure 2‐11: Major Irrigated Crop Categories in the Sacramento River Watershed Figure 3‐1: SWRCB GeoTracker GAMA Database: CDPH Wells in the Study Area Figure 3‐2: SWRCB GeoTracker GAMA Database: GAMA Wells in the Study Area Figure 3‐3: USGS NWIS Wells in the Study Area Figure 3‐4: USGS GAMA Wells in the Study Area Figure 3‐5: DWR Wells with Groundwater Quality Measurements in the Study Area Figure 4‐1: SACFEM Area Hydrogeology Figure 4‐2: SACFEM Area NHI Figure 4‐3: SACFEM Area Water Quality Figure 4‐4: SACFEM Area Initial Vulnerability Figure 5‐1: Field Level NHI Results Butte‐Yuba‐Sutter Subwatershed Figure 5‐2: NO3 Sampling Results Butte‐Yuba‐Sutter Subwatershed Figure 5‐3: NO3 Concentration Trend Butte‐Yuba‐Sutter Subwatershed Figure 5‐4: TDS Sampling Results Butte‐Yuba‐Sutter Subwatershed Figure 5‐5: TDS Concentration Trend Butte‐Yuba‐Sutter Subwatershed Figure 5‐6: Hydrogeology Susceptibility Butte‐Yuba‐Sutter Subwatershed Figure 5‐7: Section Level NHI Results Butte‐Yuba‐Sutter Subwatershed Figure 5‐8: Vulnerability Designation Butte‐Yuba‐Sutter Subwatershed Figure 6‐1: Field Level NHI Results Colusa‐Glenn Subwatershed Figure 6‐2: NO3 Sampling Results Colusa‐Glenn Subwatershed Figure 6‐3: NO3 Concentration Trend Colusa‐Glenn Subwatershed Figure 6‐4: TDS Sampling Results Colusa‐Glenn Subwatershed Figure 6‐5: TDS Concentration Trend Colusa‐Glenn Subwatershed Figure 6‐6: Hydrogeology Susceptibility Colusa‐Glenn Subwatershed Figure 6‐7: Section Level NHI Results Colusa‐Glenn Subwatershed Figure 6‐8: Vulnerability Designation Colusa‐Glenn Subwatershed Figure 7‐1: Field Level NHI Results Dixon‐Solano Subwatershed Figure 7‐2: NO3 Sampling Results Dixon‐Solano Subwatershed Figure 7‐3: NO3 Concentration Trend Dixon‐Solano Subwatershed Figure 7‐4: TDS Sampling Results Dixon‐Solano Subwatershed Figure 7‐5: TDS Concentration Trend Dixon‐Solano Subwatershed Figure 7‐6: Hydrogeology Susceptibility Dixon‐Solano Subwatershed Figure 7‐7: Section Level NHI Results Dixon‐Solano Subwatershed Figure 7‐8: Vulnerability Designation Dixon‐Solano Subwatershed Figure 8‐1: Field Level NHI Results Placer‐Nevada‐S.Sutter‐N.Sacramento Subwatershed Figure 8‐2: NO3 Sampling Results Placer‐Nevada‐S.Sutter‐N.Sacramento Subwatershed Figure 8‐3: NO3 Concentration Trend Placer‐Nevada‐S.Sutter‐N.Sacramento Subwatershed Figure 8‐4: TDS Sampling Results Placer‐Nevada‐S.Sutter‐N.Sacramento Subwatershed

CONTENTS, CONTINUED
X WBG091013074126SAC
Figure 8‐5: TDS Concentration Trend Placer‐Nevada‐S.Sutter‐N.Sacramento Subwatershed Figure 8‐6: Hydrogeology Susceptibility Placer‐Nevada‐S.Sutter‐N.Sacramento Subwatershed Figure 8‐7: Section Level NHI Results Placer‐Nevada‐S.Sutter‐N.Sacramento Subwatershed Figure 8‐8: Vulnerability Designation Placer‐Nevada‐S.Sutter‐N.Sacramento Subwatershed Figure 9‐1: Field Level NHI Results Sacramento‐Amador Subwatershed Figure 9‐2: NO3 Sampling Results Sacramento‐Amador Subwatershed Figure 9‐3: NO3 Concentration Trend Sacramento‐Amador Subwatershed Figure 9‐4: TDS Sampling Results Sacramento‐Amador Subwatershed Figure 9‐5: TDS Concentration Trend Sacramento‐Amador Subwatershed Figure 9‐6: Hydrogeology Susceptibility Sacramento‐Amador Subwatershed Figure 9‐7: Section Level NHI Results Sacramento‐Amador Subwatershed Figure 9‐8: Vulnerability Designation Sacramento‐Amador Subwatershed Figure 10‐1: Field Level NHI Results Shasta‐Tehama Subwatershed Figure 10‐2: NO3 Sampling Results Shasta‐Tehama Subwatershed Figure 10‐3: NO3 Concentration Trend Shasta‐Tehama Subwatershed Figure 10‐4: TDS Sampling Results Shasta‐Tehama Subwatershed Figure 10‐5: TDS Concentration Trend Shasta‐Tehama Subwatershed Figure 10‐6: Hydrogeology Susceptibility Shasta‐Tehama Subwatershed Figure 10‐7: Section Level NHI Results Shasta‐Tehama Subwatershed Figure 10‐8: Vulnerability Designation Shasta‐Tehama Subwatershed Figure 11‐1: Field Level NHI Results Yolo Subwatershed Figure 11‐2: NO3 Sampling Results Yolo Subwatershed Figure 11‐3: NO3 Concentration Trend Yolo Subwatershed Figure 11‐4: TDS Sampling Results Yolo Subwatershed Figure 11‐5: TDS Concentration Trend Yolo Subwatershed Figure 11‐6: Hydrogeology Susceptibility Yolo Subwatershed Figure 11‐7: Section Level NHI Results Yolo Subwatershed Figure 11‐8: Vulnerability Designation Yolo Subwatershed Figure 12‐1: Field Level NHI Results El Dorado Subwatershed Figure 12‐2: NO3 Sampling Results El Dorado Subwatershed Figure 12‐3: TDS Sampling Results El Dorado Subwatershed Figure 12‐4: Section Level NHI Results El Dorado Subwatershed Figure 13‐1: Field Level NHI Results Goose Lake Subwatershed Figure 13‐2: NO3 Sampling Results Goose Lake Subwatershed Figure 13‐3: TDS Sampling Results Goose Lake Subwatershed Figure 13‐4: Section Level NHI Results Goose Lake Subwatershed Figure 14‐1: Field Level NHI Results Lake Subwatershed Figure 14‐2: NO3 Sampling Results Lake Subwatershed Figure 14‐3: TDS Sampling Results Lake Subwatershed Figure 14‐4: Section Level NHI Results Lake Subwatershed Figure 15‐1: Field Level NHI Results Napa Subwatershed Figure 15‐2: NO3 Sampling Results Napa Subwatershed Figure 15‐3: TDS Sampling Results Napa Subwatershed Figure 15‐4: Section Level NHI Results Napa Subwatershed

CONTENTS, CONTINUED
WBG091013074126SAC XI
Figure 16‐1: Field Level NHI Results Pit River Subwatershed Figure 16‐2: NO3 Sampling Results Pit River Subwatershed Figure 16‐3: TDS Sampling Results Pit River Subwatershed Figure 16‐4: Section Level NHI Results Pit River Subwatershed Figure 17‐1: Field Level NHI Results Upper Feather River Subwatershed Figure 17‐2: NO3 Sampling Results Upper Feather River Subwatershed Figure 17‐3: TDS Sampling Results Upper Feather River Subwatershed Figure 17‐4: Section Level NHI Results Upper Feather River Subwatershed Figure 18‐1: Sacramento Valley Floor Vulnerability Designation

WBG091013074126SAC XIII
Acronyms and Abbreviations µS/cm microSiemens per centimeter
µmhos/cm micromhos per centimeter
µm/s micrometer per second
AGR agricultural supply (beneficial use)
Basin Plan Water Quality Control Plan for the Sacramento River and San Joaquin River Basins
bgs below ground surface
BLM Bureau of Land Management
C Celsius
CAMP Cascade Range and Modoc Plateau
CASGEM California Statewide Groundwater Elevation Monitoring
CDPH California Department of Public Health
Coalition Sacramento Valley Water Quality Coalition
CSUS California State University, Sacramento
CV Central Valley
CVHM Central Valley Hydrologic Model
CV‐SALTS Central Valley Salinity Alternatives for Long‐Term Sustainability
DBCP dibromochloropropane
DPR California Department of Pesticide Regulation
dS/m deciSiemens
DWR California Department of Water Resources
DWRC Department of Water and Resource Conservation
EC Electrical Conductivity
EM Environmental Management Division
EDCWA El Dorado County Water Agency
ft feet
ft/day feet per day
GAMA Groundwater Ambient Monitoring and Assessment
GAR Groundwater Quality Assessment Report
GCID Glenn Colusa Irrigation District
GIS Geographic Information Systems
GPA Groundwater Protection Area
GPL Groundwater Protection List
GPP Groundwater Protection Program
SECTION 1 INTRODUCTION
XIV WBG091013074126SAC
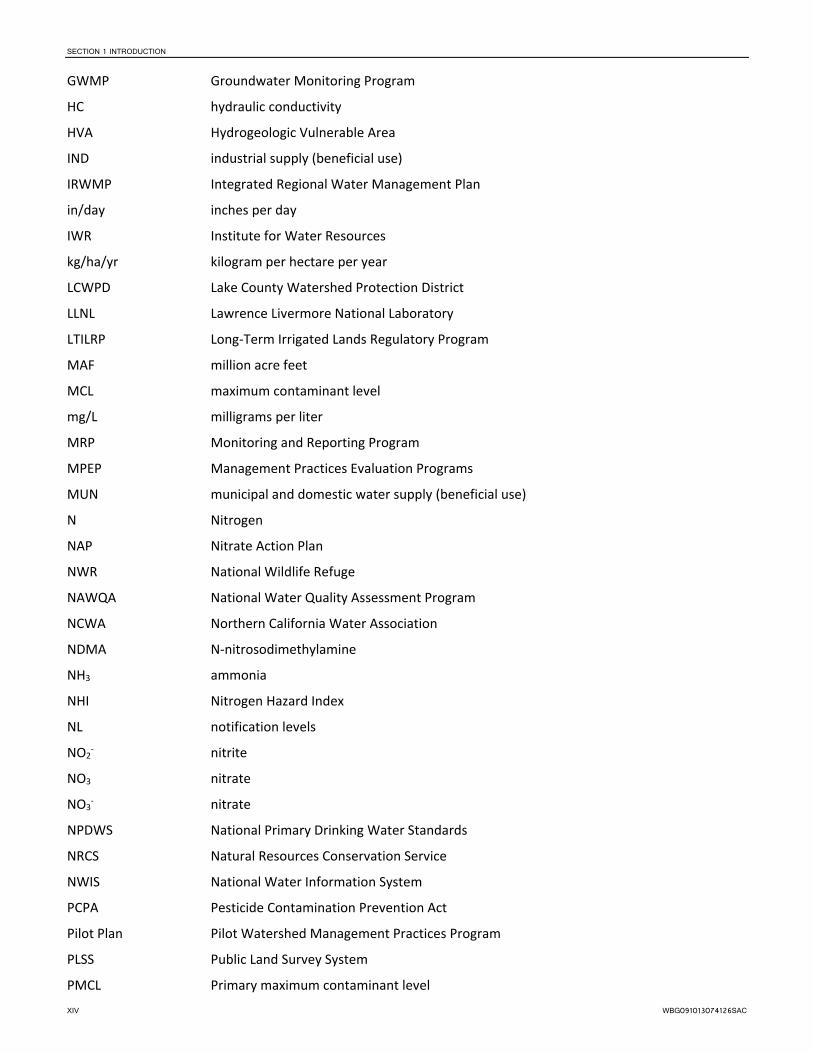
GWMP Groundwater Monitoring Program
HC hydraulic conductivity
HVA Hydrogeologic Vulnerable Area
IND industrial supply (beneficial use)
IRWMP Integrated Regional Water Management Plan
in/day inches per day
IWR Institute for Water Resources
kg/ha/yr kilogram per hectare per year
LCWPD Lake County Watershed Protection District
LLNL Lawrence Livermore National Laboratory
LTILRP Long‐Term Irrigated Lands Regulatory Program
MAF million acre feet
MCL maximum contaminant level
mg/L milligrams per liter
MRP Monitoring and Reporting Program
MPEP Management Practices Evaluation Programs
MUN municipal and domestic water supply (beneficial use)
N Nitrogen
NAP Nitrate Action Plan
NWR National Wildlife Refuge
NAWQA National Water Quality Assessment Program
NCWA Northern California Water Association
NDMA N‐nitrosodimethylamine
NH3 ammonia
NHI Nitrogen Hazard Index
NL notification levels
NO2‐ nitrite
NO3 nitrate
NO3‐ nitrate
NPDWS National Primary Drinking Water Standards
NRCS Natural Resources Conservation Service
NWIS National Water Information System
PCPA Pesticide Contamination Prevention Act
Pilot Plan Pilot Watershed Management Practices Program
PLSS Public Land Survey System
PMCL Primary maximum contaminant level

SECTION 1 INTRODUCTION
WBG091013074126SAC XV
PNSSNS Placer Nevada South Sutter North Sacramento
PRO industrial process supply
PUR Pesticide Use Reporting
RCD Resource Conservation District
RWQCB Regional Water Quality Control Board
SACFEM Sacramento Valley groundwater flow model
SC specific conductivity
SCWA Solano County Water Agency
SGA Sacramento Groundwater Authority
SID Solano Irrigation District
SMCL secondary maximum contaminant level
SRCSD Sacramento Regional County Sanitation District
SSURGO Soil Survey Geographic
SVGB Sacramento Valley Groundwater Basin
SVWQC Sacramento Valley Water Quality Coalition
SWRCB State Water Resources Control Board
Team CH2M HILL Team
TDS total dissolved solids
TKN Total Kjeldahl Nitrogen
UC‐ANR University of California Agriculture and Natural Resources
UFRW Upper Feather River Watershed
USDA United States Department of Agriculture
USEPA U.S. Environmental Protection Agency
USGS U.S. Geological Survey
VOC volatile organic compounds
Voluntary Project Voluntary Domestic Well Assessment Project
WDL Water Data Library
WDR Waste Discharge Requirements
WRP Wetland Resources Program
WQO water quality objectives
WQS water quality standards
YCFCWCD Yolo County Flood Control and Water Conservation District
YCWA Yuba County Water Agency

WBG091013074126SAC 1-1
SECTION 1
Introduction This Sacramento River Watershed Groundwater Quality Assessment Report (GAR) has been developed to provide water resources managers and the leadership of the Sacramento Valley Water Quality Coalition (SVWQC or Coalition) with a better understanding of groundwater quality in the region’s irrigated lands and to support the fulfillment of regulatory requirements for groundwater quality. Importantly, this is a regional‐scale analysis that is to help inform priorities for groundwater monitoring and water quality protection efforts.
1.1 Purpose This GAR meets the requirements of the Waste Discharge Requirements (WDR) under the Central Valley Regional Water Quality Control Board’s (Central Valley RWQCB) Long‐Term Irrigated Lands Regulatory Program (LTILRP). As a key element of the draft WDR, the GAR evaluates groundwater quality and its protection associated with Sacramento Valley irrigated lands. In brief, the GAR compiles and analyzes readily available existing relevant data, and serves as the basis for the agricultural practice evaluation and establishing future groundwater monitoring requirements of the WDR.
More specifically, the GAR reviews available groundwater quality data, hydrogeology, and groundwater quality monitoring program information that is relevant to the groundwater component of the SVWQC’s LTILRP. In this manner, the GAR serves as an initial framework document that establishes the technical basis of the groundwater quality monitoring and implementation program. This report will identify areas of high vulnerability to water quality impacts from irrigated agriculture, areas of low vulnerability, and areas having data gaps that indicate the need for further evaluation.
1.2 Background The following discussion provides the contextual basis for the GAR by describing the SVWQC, the LTILRP, and the long‐term focus of sustainable water management approach in the Sacramento Valley. Next, it provides an overview of the existing data sources relevant to the GAR, including recent U.S. Geological Survey (USGS) studies, initial designation of hydrogeologically vulnerable areas, land use, soil characteristics, and stakeholder outreach efforts to compile up‐to‐date information.
1.2.1 Sacramento Valley Water Quality Coalition The SVWQC is operated as a partnership between local subwatershed groups coordinated by the Northern California Water Association (NCWA). Formed in 2003, the SVWQC’s membership includes more than 8,600 farmers and wetland managers over more than 1.1 million acres. The Coalition’s mission is “to enhance and improve water quality in the Sacramento River, while sustaining the economic viability of agriculture, functional values of managed wetlands, and sources of safe drinking water” (SVWQC 2014). Additional information about the Coalition’s regional planning and compliance efforts since 2003, including surface water monitoring, are available at http://www.svwqc.org/.
To effectively implement the LTILRP requirements, the SVWQC and 13 subwatershed groups signed a memorandum of agreement that defines the respective roles and responsibilities of the subwatershed group and NCWA. The subwatershed groups are independently organized by local resource conservation districts, farm bureaus, or independent organizations established to comply with the Central Valley RWQCB’s LTILRP. Owners and operators of farming operations are represented on the boards of the subwatershed organizations, and those organizations are represented at quarterly Coalition meetings. The subwatershed organizations provide leadership for grower outreach and implementation of the requirements of management plans, while NCWA coordinates monitoring, reporting, and overall communications.
The SVWQC’s 13 subwatershed organizations manage the specific WDR and Monitoring and Reporting Program (MRP) requirements for the farmers enrolled in their subwatershed areas. Subwatersheds were designated based on common features such as counties, hydrology, and organizational structure. The SVWQC facilitates grower

SECTION 1 INTRODUCTION
1-2 WBG091013074126SAC
outreach and communication and participation through the subwatershed groups, and also serves as the main point of contact for the Central Valley RWQCB staff.
An overview of the 13 subwatersheds is provided in Attachment A of the WDR and summarized in Appendix A of this GAR, and the major features are also summarized under each separate subwatershed section. Overall, in about 30% of the groundwater basins underlying irrigated agriculture in this Coalition area, irrigated agriculture occupies 5% or less of the area (CVRWQCB 2008).
The existing subwatershed features and designations provide a natural structure for geographic subwatershed designations in the GAR analysis, allowing a more manageable geographic analysis and understanding of datasets.
1.2.2 Central Valley RWQCB’s Long-Term Irrigated Lands Regulatory Program The Central Valley RWQCB developed an LTILRP, which proposes to continue to address surface water quality and to add new groundwater quality monitoring and reporting requirements. The new requirements are adopted as WDRs and an associated MRP. The SVWQC WDR was adopted March 12, 2014. As a result, the development of the GAR is one of the first requirements outlined in the WDR, and is due to the Central Valley RWQCB 1 year after adoption of the WDR. This report serves as the document for this requirement.
1.2.3 Sustainable Water Management in the Sacramento Valley Sacramento Valley water resources managers have adopted a single, overarching water management goal to guide their surface and groundwater initiatives: sustainability. The SVWQC recognizes how important it is to all members of the valley’s diverse community that the Sacramento Valley’s water resources be managed so that existing economic, social, and environmental systems endure indefinitely. This long established approach is summarized as follows (NCWA 2011):
The Sacramento Valley is a rich mosaic of farmlands, cities and rural communities, refuges and managed wetlands for waterfowl and shorebird habitat, and meandering rivers and streams that support numerous fisheries and wildlife. The natural and working landscape between the foothills of the Sierra Nevada and the Coast Range is dependent on the fertile lands of the Sacramento Valley floor, water supplies from rivers, streams, and the underlying groundwater basins to support and sustain a healthy and vibrant local economy and environment.
1.2.4 Sources of Existing Data One of the principles guiding the GAR development—and the subsequent efficient implementation of irrigated lands groundwater quality assessment and monitoring approach—is the use of readily available and applicable data to the extent possible. This preferred approach does not require the installation of new, dedicated monitoring wells and/or other infrastructure solely for the purpose of WDR compliance. To this end, this GAR presents all known, available, and pertinent sources of data.
Readily available data to be used in this analysis are presented in Table 1‐1. For this study, agricultural stakeholders include commodity groups, local farmers, resource conservation districts (RCDs), water agencies, agricultural commissioners, and experts from the UC Cooperative Extension. The major data sources listed in Table 1‐1 are discussed briefly in the following sections with the exception of groundwater well databases and projects, which are discussed in Section 3.

SECTION 1 INTRODUCTION
WBG091013074126SAC 1-3
TABLE 1-1 Sources of Readily Available Data
Dataset Agency or Organization Analytical Application
Previous studies and characterization of Sacramento Valley
USGS, DWR, Central Valley RWQCB and other related organizations
Understanding of background information and review of previous technical reports that are pertinent to the GAR analysis
Detailed and general geology of Sacramento Valley
United States Geological Survey (USGS), California Division of Mines and Geology
Geology and hydrogeology information
Groundwater Protection Areas (GPAs) California Department of Pesticide Regulation (DPR)
GPAs based on leaching and runoff for initial vulnerability analysis
Initial Hydrogeologic Vulnerable Areas (HVAs) State Water Resources Control Board (SWRCB)
HVAs for initial vulnerability analysis
Land use surveys by county California Department of Water Resources (DWR), NRCS, and Cal Ag Pesticide Use Reporting System
Land use and crop categories at the field level
Groundwater well databases and projects: GeoTracker Groundwater Ambient Monitoring and Assessment (GAMA), National Water Information System (NWIS), Water Data Library)
SWRCB, USGS, DWR Groundwater quality data
Soil Survey Geographic (SSURGO) data by soil map unit
Natural Resources Conservation Service (NRCS)
Surface soil texture, drainage class, salinity measured as electrical conductivity, permeability measured as hydraulic conductivity, pH
Stakeholder Outreach Coalition Subwatershed Groups, Farming Advisors, NCWA Groundwater Advisory Group
Collect information on farming practices, groundwater quality monitoring programs, and general information on Subwatershed characteristics
1.2.4.1 Previous Studies and Characterization of Sacramento Valley Nitrate contamination of groundwater in agricultural areas of the United States has been extensively studied by numerous agencies including the USGS and other federal and academic entities. These studies have focused on developing a better understanding of areas that are at greater risk for this type of non‐point source contamination, and to identify areas with the highest observed levels of nitrate contamination. These studies are being used to prioritize actions to address this threat to groundwater quality and provide excellent background information to improve understanding of the overall groundwater quality picture in the context of the LTILRP and the development of the GAR.
Based on the results of the extensive technical work already completed in the Sacramento Valley, initial conclusions can be drawn regarding the susceptibility and vulnerability of groundwater underlying irrigated lands to nitrate contamination. The purpose of the GAR is not to reproduce any of these detailed technical predictive studies. Instead, the GAR is developed to accomplish the following:
Compile relevant existing information
Include and evaluate the results of other previous technical studies

SECTION 1 INTRODUCTION
1-4 WBG091013074126SAC
Provide preliminary conclusions on existing nitrate impacts in the Sacramento River Watershed
Evaluate the observed water quality data in the context of previous studies performed in the study area,
Develop a methodology that effectively combines this information to prioritize program implementation in areas that are more vulnerable than others to impacts from irrigated agriculture
Three recent major documents developed by the USGS and supporting findings on nitrate in groundwater are reviewed below.
1.2.4.1.1 USGS Scientific Investigations Report 2012–5065: Predicted Nitrate and Arsenic Concentrations in Basin‐Fill Aquifers of the Southwestern United States
This USGS report covers a large study area that includes California’s Central Valley. The Sacramento Valley portion of this study focuses on the southern half of the valley (no data or analysis north of Chico). Both observed and predicted nitrate concentrations for this portion of the Sacramento Valley show that nitrate is generally found at low concentrations on the valley floor (less than half the MCL) in the upper 200 feet of the aquifer. A few localized exceptions occur where nitrate concentrations are above half the MCL (but mostly below the MCL) in the Glenn County area and in Yolo County (areas west of the Sacramento River). Very minimal areas are predicted to have nitrate concentrations exceeding the MCL (USGS 2012).
1.2.4.1.2 Assessment of Regional Change in Nitrate Concentrations in Groundwater in the Central Valley, California, USA, 1950s–2000s
This journal article by several USGS authors provides a trend analysis of nitrate concentrations obtained from USGS monitoring events over the past few decades (Burow et al. 2013). Important observations for the Sacramento Valley are as follows:
Changes in median nitrate concentrations in the shallow aquifer (at a depth of approximately less than 150 feet below the water table, representing primarily domestic drinking water supplies) between the 1970s and 1980s was less than 5 mg/L (as N)
Age of groundwater in the shallow aquifer is thought to be approximately 1 to 2 decades old
Important differences in trends were observed between the Sacramento Valley and the San Joaquin Valley (even though both have substantial irrigated agricultural lands):
Concentrations in the east fans area of the San Joaquin Valley increased at nearly 3 times the rate of those observed in the east fans in the Sacramento Valley (0.8 mg/L per decade versus 0.3 mg/L per decade).
The report concludes that “differences in nitrate trends cannot be explained by differences in nitrogen input alone,” since rates of fertilizer inputs on agricultural lands in both valleys is similar (average about 80 kg/ha/yr).
Differences in nitrate trends can be attributed to redox conditions, with redox conditions in the Sacramento Valley more favorable to nitrogen de‐mobilization.
Soils in the Sacramento Valley have a more fine‐grained texture than soils in the San Joaquin Valley.
Precipitation rates in the Sacramento Valley are greater than in the San Joaquin Valley (favoring precipitation‐driven aquifer recharge).
Anoxic (reducing) conditions are more common in fine‐textured sediments in wetter environments.
The Sacramento Valley has more undeveloped lands, large areas of rice fields, and major wildlife refuges, which do not introduce significant levels of nitrogen to the groundwater system.
Conclusions for Sacramento Valley:

SECTION 1 INTRODUCTION
WBG091013074126SAC 1-5
The east fans subregion has oxic conditions and the highest rates of increasing nitrate trends (Feather River area in Butte, Sutter, and Yuba Counties)
Generally low nitrate conditions in the center of the basin are consistent with reduced geochemical conditions resulting from low permeability soils and higher organic content. In addition, historical groundwater discharge areas are present in the center of the basin.
1.2.4.1.3 Modeling Nitrate at Domestic and Public‐Supply Well Depths in the Central Valley, California
This recent journal article by several USGS authors used a random forest regression to predict nitrate concentrations in the Central Valley aquifer by using outputs from the USGS’s Central Valley Hydrologic Model (CVHM) and from the Central Valley texture model as predictor variables. Conclusions were similar to those described in the previous 2012 and 2013 findings (USGS 2012 and Burow et al. 2013, respectively). Due to finer sediments in the Sacramento Valley and generally reduced conditions, the central basin area has very low predicted nitrate concentrations compared to areas at the basin’s margins. Predicted nitrate concentrations are lower overall in the deep aquifer as compared to the shallow aquifer.
1.2.4.2 Groundwater Protection Areas and Initial Designation of Hydrogeologic Vulnerable Areas
In 2000, the SWRCB created a statewide GIS dataset to support a groundwater vulnerability assessment. This map is referred to as the “initial hydrogeologically vulnerable areas” map. A brief SWRCB description of the dataset noted that where published hydrogeologic information suggested the presence of soil or rock conditions, causing the area to potentially be more vulnerable to groundwater contamination, these areas were designated in the dataset. SWRCB used data from DWR and USGS publications to identify areas where geologic conditions may be more likely to allow recharge at rates substantially higher than in lower permeability or confined areas of the same groundwater basin. For example, groundwater resources underlying designated (i.e., published) recharge, rapid infiltration, or unconfined areas were considered categorically more vulnerable to potential contaminant releases than groundwater underlying areas of slower recharge, lower infiltration rates, or intervening low permeability deposits (confining layers) (SWRCB 2000).
In addition to the SWRCB initial HVA designations, Central Valley RWQCB staff identified the DPR Groundwater Protection Areas (GPAs) for consideration. DPR, under its Groundwater Protection Program, identifies conditions of only leaching, only runoff, and leaching or runoff conditions for GPAs. The purpose of the designations is to inform agricultural pesticide users of vulnerable areas where unmitigated use of certain pesticides is likely to contaminate groundwater. RWQCB staff identified the “leaching” and “leaching or runoff” GPAs for consideration as vulnerable under a groundwater quality assessment.
1.2.4.3 Land Use Irrigated agriculture of the SVWQC extends over 1.1 million acres in the Sacramento River Watershed, or roughly 8 percent of the study area (excluding rice agriculture, which is covered under a separate Central Valley RWQCB WDR). The remaining approximately 92 percent of the Sacramento River Watershed consists of open space, riparian vegetation, and urban development.
Land use information to support the GAR analysis was compiled from two sources: the Department of Water Resources (DWR) land use surveys and Department of Pesticide Regulation (DPR) Pesticide Use Reporting (PUR) system field boundaries land use data. DWR’s most recent survey for each county was used, but available data ranges only from 1994 to 2008. Therefore, in an effort to update this data gap, it was determined that the 2013 DPR Field Boundaries land use data, also available by county, was more applicable, representative, comprehensive, and agriculture‐specific, and was deemed appropriate for supplementing the analytical needs of the GAR. Additional details on both these data sources and how they were used for this assessment are provided in Appendix B.
1.2.4.4 USDA-NRCS Soil Survey Information The USDA‐NRCS (NRCS) Soil Survey Geographic (SSURGO) database was used to identify the soil map units within the Sacramento Valley, as mapped by the NRCS. The SSURGO dataset is generally the most‐detailed level of soil

SECTION 1 INTRODUCTION
1-6 WBG091013074126SAC
geographic data available and utilizes information contained in published NRCS soil surveys. The extent of a SSURGO database is a soil survey area, which historically consisted of one county, but may include several counties, or a specific land resource area (such as Lassen Volcanic National Park). SSURGO data may be viewed in the “Web Soil Survey” online interface (http://websoilsurvey.sc.egov.usda.gov/App/WebSoilSurvey.aspx), or may be downloaded in shapefile format for use in a GIS. The soil map units included in the SSURGO database comprise one or more soil series. Each soil map unit may also include specific surface soil texture, slope, or erosion characteristic designations that affect the soil properties and designations. The relevant soil properties are discussed in more detail below.
Soil surface texture class: The representative soil surface texture class is given in standard terms used by the NRCS. These terms are defined according to percentages of sand, silt, and clay in the fraction of the soil that is less than 2 millimeters in diameter.
Soil drainage class: The NRCS classifies a soil’s drainage characteristics into natural drainage classes. Drainage class refers to the frequency and duration of wet periods under conditions similar to those under which the soil developed. Alteration of the water regime by humans, either through drainage or irrigation, is not a consideration unless the alterations have significantly changed the morphology of the soil. Texture, saturated hydraulic conductivity, presence of free water in the profile, water table surface elevation, additional water from seepage, and rainfall are factors considered. The NRCS recognizes seven classes of natural soil drainage ranging from “excessively drained” to “very poorly drained.” Each soil drainage class will influence the ability to grow crops and the leaching potential of nutrients and pesticides to shallow groundwater. Appendix C provides definitions for each NRCS soil drainage class.
Soil hydraulic conductivity: The other measure of soil drainage, KSAT, measures the ease with which pores in a saturated soil transmit water in units of micrometers per second. Hydraulic conductivity is a measure of permeability in the soil. Water movement in soil is controlled by two factors: (1) the resistance of the soil matrix to water flow, and (2) the forces acting on soil water. The NRCS measurement of vertical, saturated hydraulic conductivity is based on soil characteristics observed in the field, particularly structure, porosity, and texture. Standard KSAT classes range from “very low” (0.00–0.01 µm/s) to “very high” (100–705 µm/s).
Soil salinity: Soil salinity is inferred from measurements of electrical conductivity. Electrical conductivity is related to the amount of salts more soluble than gypsum in the soil, but it may include a small contribution (up to 2 deciSiemens per meter [dS/m]) from dissolved gypsum. The standard international unit of measure dS/m is corrected to a temperature of 25° Celsius (C). The NRCS categorizes salinity into five range classes from “nonsaline” (0–2 dS/m) to “strongly saline” (greater than 16 dS/m).
Soil pH: The NRCS categorizes pH into eleven range classes from “ultra acidic” (<3.5) to “very strongly alkaline” (>9)
1.2.4.5 Stakeholder Outreach After the initial data compilation described in TM 1 and before developing a detailed technical approach for the GAR vulnerability analysis, extensive agricultural stakeholder outreach was performed in order to obtain feedback on our initial understanding of the study area and to collect additional important information for the analysis. Over a period of 4 months (November 2013 through February 2014), the CH2M HILL Team (Team) reached out to each subwatershed group and organized conference calls with subwatershed leaders and additional stakeholders, as appropriate. Prior to each call, outreach materials were developed specifically for each subwatershed and were sent out for their review. Outreach materials included a GAR factsheet, a subwatershed‐specific factsheet on land use, a list of applicable groundwater management plans, and a short presentation of 7 slides to provide stakeholders with general background information on the GAR effort, engage them in the conversation, and receive input. One of the primary datasets reviewed were crop acreages and their distribution and irrigation practices in each subwatershed. As discussed in Appendix B, new land use datasets and additional changes were incorporated since TM 1 to satisfy comments received.

WBG091013074126SAC 2-1
SECTION 2
Regional Setting The GAR’s regional setting is described in terms of physical setting, existing groundwater beneficial uses, water quality objectives and basin plans, areas with major known impacts to groundwater quality, irrigated agriculture in the valley, and managed wetlands.
2.1 Physical Setting Physical setting includes the description of the Sacramento River Watershed study area, its three distinct types of regions with specific hydrogeologic characteristics, soils and landforms, and an overview of valley floor groundwater quality.
2.1.1 Sacramento River Watershed Study Area The Sacramento River Watershed study area for the GAR is defined by the Sacramento River Watershed encompassed by the SVWQC boundary in Northern California (Figure 2‐1). The study area is composed of 13 subwatersheds and all or parts of 20 counties. The Sacramento River Watershed encompasses roughly 17 percent of the land area of California, with a total acreage of about 22.2 million acres (SVWQC 2013).
The ring of mountain ranges around the Sacramento River Watershed has weathered and eroded to fill the valley bottom with alluvial material. Over time, soils formed within these alluvial parent materials on the landscapes formed by these deposits, which created a relatively wide variety of soils and soil conditions for irrigating and growing crops. Volcanism and sedimentation during prolonged flooded periods in the valley also contributed to the formation of soils on the valley floor.
The Sacramento River Watershed is bounded on the east by the Sierra Nevada and Cascade Ranges and on the west by the North Coast Range and Klamath Mountains. Large forest areas, including the Mendocino and Shasta‐Trinity National Forests in the Coast Ranges; Shasta National Forest in the southern Cascades; and the Plumas, Tahoe, and El Dorado National Forests on the western slopes of the Sierra Nevada, cover portions of the Sacramento River Watershed. Sparse grasslands and high deserts stretch to the north. Lassen Volcanic National Park, covering 106,000 acres, is also in the watershed.
The Sacramento Valley is drained by the Sacramento River, which stretches for over 400 miles from Mount Shasta to the San Francisco Bay‐Delta. Its major tributaries include the Pit, Feather, Yuba, and American rivers. Agriculture is concentrated around the Sacramento River as a function of accessible irrigation supplies and favorable soils.
The Sacramento Valley is a classic flow‐through system in the parlance of water management. The valley essentially functions as a funnel, where the various uses are all sequential as water flows through the region. All water that is not consumptively used in the watershed returns to the hydrologic system and funnels through the Sacramento River, just west of the City of Sacramento (NCWA 2011).
California depends on the Sacramento River Watershed for agriculture, timber harvesting, hydroelectric power generation, fishing and recreation, potable water, and many other diverse and sometimes competing needs. Modern influences on this watershed include small family farms, mining operations, major water supply and flood control systems, a deep shipping channel, and several large urban centers. The area is home to 2.8 million people, more than half of whom reside within the Sacramento metropolitan area (SRCSD 2008). Major cities within the watershed are Alturas, Oroville, Marysville, Yuba City, Redding, Red Bluff, Chico, Sacramento, Davis, and Woodland.
General land use designations, as provided by DWR, are shown in Figure 2‐2, which presents a compilation of the most recent DWR land use designation available for each county within the Sacramento River Watershed study area.

SECTION 2 REGIONAL SETTING
2-2 WBG091013074126SAC
The Sacramento River Watershed study area encompasses three distinct types of regions with specific hydrogeologic characteristics:
The Sacramento Valley floor, which overlies the northern portion of the Central Valley alluvial aquifer, comprises the Sacramento Valley Groundwater Basin and the Redding Area Groundwater Basin, which are separated by the Red Bluff Arch; these two basins are together referred to as the Sacramento Valley Groundwater Basin (SVGB) for the purposes of the GAR analysis.
The upland bedrock area comprises the foothill and mountainous areas surrounding the valley floor and is characterized by intermittent fractured rock with limited groundwater availability.
Mountain valley groundwater basins are located in the Sierra Nevada, Cascade and Coast Ranges.
The approaches to the groundwater assessment will vary for these three areas, and a general overview of their characteristics is presented below. Figures 2‐3 and 2‐4 show the geologic outcrops in the SVWQC area and in the Sacramento Valley.
2.1.1.1 Sacramento Valley Floor The majority of irrigated agriculture in the study area occurs on the Sacramento Valley floor, which has the most abundance of groundwater and is described in more detail below.
Agriculture in the Sacramento Valley mostly relies on surface water for irrigation. However, some regions rely on a variable combination of surface water and groundwater. Groundwater accounts for approximately 30 percent of the annual supply used for agricultural and urban purposes in the Sacramento Valley (DWR 2009).
The Sacramento Valley overlies one of the largest alluvial aquifer systems in the state, and wells developed in the sediments of the valley provide excellent (high quality and relatively plentiful) water supply for irrigation, municipal, industrial, and domestic uses (DWR 2003a). Groundwater has also been developed in the upland hard rock and mountain regions of the Sacramento Valley watershed, as described in the following two sections. Although the SVGB is split into several subbasins, it really functions as a single laterally extensive alluvial aquifer.
The Sacramento Valley floor has a Mediterranean climate, with mild winters and hot, dry summers. Precipitation during an average year ranges from 13 to 26 inches in the Sacramento Valley, with annual average precipitation around 36 inches in the northern portion of the Valley (near Redding), occurring primarily between the months of November through April (USGS 2009).
2.1.1.2 Upland Bedrock Areas The Sierra Nevada makes up the northwestern portion of the SVWQC area. Fractured rock systems are the primary aquifer type in the Sierra Nevada. Generally the fractures are more numerous in the upper few hundred feet of bedrock and decrease with depth. In most areas, there are no DWR‐identified groundwater basins and no routine mandatory groundwater elevation monitoring takes place in these areas (as described in Water Code Section 10925), except for the Modoc Plateau and the Sierra Valley, as described below. The fractured rock systems of the foothills of the southern Cascades and Sierra Nevada provide uncertain and sometimes limited groundwater supply. Where present, these groundwater supplies are highly variable in quantity and quality (DWR 2003a).
2.1.1.3 Mountain Valley Groundwater Basins In the mountain valleys and basins with arable land, groundwater is used to supplement surface water supplies. In some basins, the fractured volcanic rock underlying the alluvial fill is the major aquifer of the area. Flow in the fractures may approach a similar velocity as that of surface water, but there is often only limited storage potential for groundwater (DWR 2003a).
Groundwater basins in these areas tend to be sparse, generally small in extent, and composed of fluvial, alluvial, or glacial sediments. Two areas in the mountainous regions have notable groundwater basins outside of the Sacramento Valley: the Modoc Plateau/Pit River area, and the Sierra Valley area. Wells in the Modoc Plateau volcanics typically yield between 100 and 1,000 gallons per minute (DWR 2003a). The Sierra Valley is an irregularly shaped, complexly faulted valley in eastern Plumas and Sierra Counties. Most of the upland recharge areas are
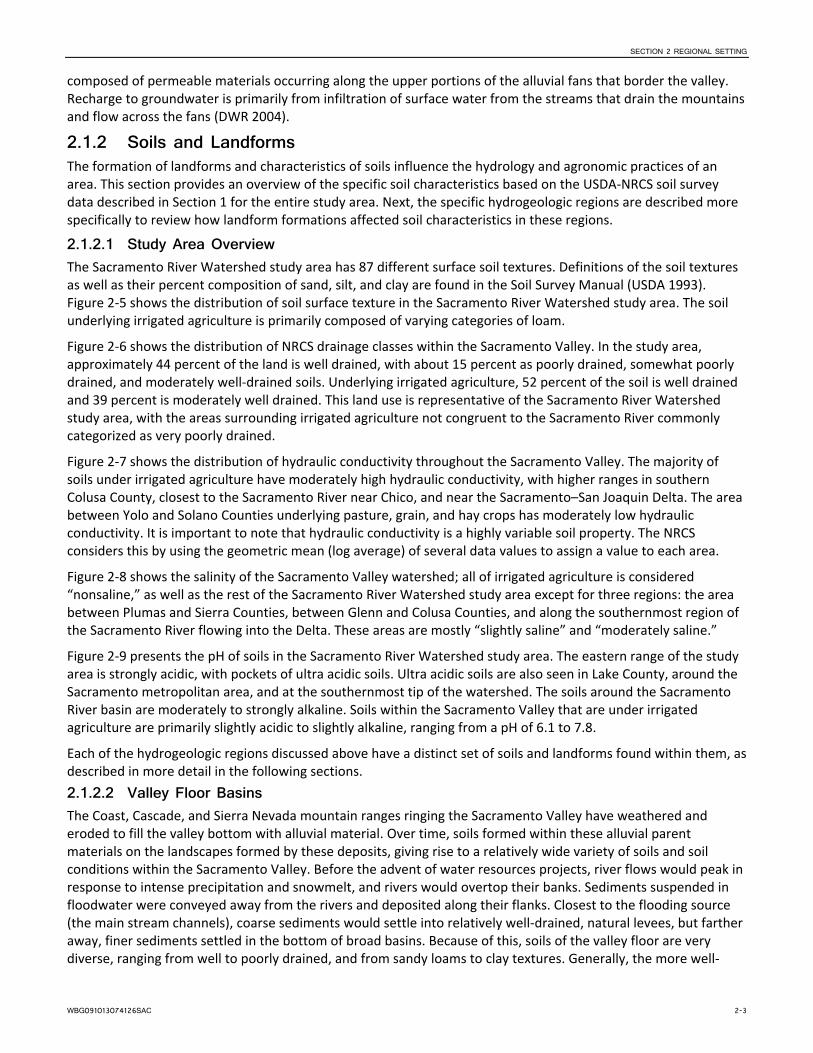
SECTION 2 REGIONAL SETTING
WBG091013074126SAC 2-3
composed of permeable materials occurring along the upper portions of the alluvial fans that border the valley. Recharge to groundwater is primarily from infiltration of surface water from the streams that drain the mountains and flow across the fans (DWR 2004).
2.1.2 Soils and Landforms The formation of landforms and characteristics of soils influence the hydrology and agronomic practices of an area. This section provides an overview of the specific soil characteristics based on the USDA‐NRCS soil survey data described in Section 1 for the entire study area. Next, the specific hydrogeologic regions are described more specifically to review how landform formations affected soil characteristics in these regions.
2.1.2.1 Study Area Overview The Sacramento River Watershed study area has 87 different surface soil textures. Definitions of the soil textures as well as their percent composition of sand, silt, and clay are found in the Soil Survey Manual (USDA 1993). Figure 2‐5 shows the distribution of soil surface texture in the Sacramento River Watershed study area. The soil underlying irrigated agriculture is primarily composed of varying categories of loam.
Figure 2‐6 shows the distribution of NRCS drainage classes within the Sacramento Valley. In the study area, approximately 44 percent of the land is well drained, with about 15 percent as poorly drained, somewhat poorly drained, and moderately well‐drained soils. Underlying irrigated agriculture, 52 percent of the soil is well drained and 39 percent is moderately well drained. This land use is representative of the Sacramento River Watershed study area, with the areas surrounding irrigated agriculture not congruent to the Sacramento River commonly categorized as very poorly drained.
Figure 2‐7 shows the distribution of hydraulic conductivity throughout the Sacramento Valley. The majority of soils under irrigated agriculture have moderately high hydraulic conductivity, with higher ranges in southern Colusa County, closest to the Sacramento River near Chico, and near the Sacramento–San Joaquin Delta. The area between Yolo and Solano Counties underlying pasture, grain, and hay crops has moderately low hydraulic conductivity. It is important to note that hydraulic conductivity is a highly variable soil property. The NRCS considers this by using the geometric mean (log average) of several data values to assign a value to each area.
Figure 2‐8 shows the salinity of the Sacramento Valley watershed; all of irrigated agriculture is considered “nonsaline,” as well as the rest of the Sacramento River Watershed study area except for three regions: the area between Plumas and Sierra Counties, between Glenn and Colusa Counties, and along the southernmost region of the Sacramento River flowing into the Delta. These areas are mostly “slightly saline” and “moderately saline.”
Figure 2‐9 presents the pH of soils in the Sacramento River Watershed study area. The eastern range of the study area is strongly acidic, with pockets of ultra acidic soils. Ultra acidic soils are also seen in Lake County, around the Sacramento metropolitan area, and at the southernmost tip of the watershed. The soils around the Sacramento River basin are moderately to strongly alkaline. Soils within the Sacramento Valley that are under irrigated agriculture are primarily slightly acidic to slightly alkaline, ranging from a pH of 6.1 to 7.8.
Each of the hydrogeologic regions discussed above have a distinct set of soils and landforms found within them, as described in more detail in the following sections.
2.1.2.2 Valley Floor Basins The Coast, Cascade, and Sierra Nevada mountain ranges ringing the Sacramento Valley have weathered and eroded to fill the valley bottom with alluvial material. Over time, soils formed within these alluvial parent materials on the landscapes formed by these deposits, giving rise to a relatively wide variety of soils and soil conditions within the Sacramento Valley. Before the advent of water resources projects, river flows would peak in response to intense precipitation and snowmelt, and rivers would overtop their banks. Sediments suspended in floodwater were conveyed away from the rivers and deposited along their flanks. Closest to the flooding source (the main stream channels), coarse sediments would settle into relatively well‐drained, natural levees, but farther away, finer sediments settled in the bottom of broad basins. Because of this, soils of the valley floor are very diverse, ranging from well to poorly drained, and from sandy loams to clay textures. Generally, the more well‐

SECTION 2 REGIONAL SETTING
2-4 WBG091013074126SAC
drained and coarser textured soils (sandy loams) exist on alluvial fans and basin rims, and the more poorly drained and finer textured soils (silty clays and clays) exist in basins.
Soils of the valley floor basins tend to be moderately well to poorly drained, and range from non‐saline to strongly saline depending on location. These soils tend to be alkaline, and have a low to moderately low hydraulic conductivity.
2.1.2.3 Upland Bedrock Area Soils of the upland bedrock area are in the Sierra Nevada and weathered in place, forming from the weathering of the granitic, metasedimentary, metabasic, and basic igneous rock. Rock outcrops are common, as are shallow soils; however, soils may be very deep in some areas. These soils can be steep, are typically well drained, and range from loamy to sandy loam in texture. The majority contain coarse fragments within the profile.
Soils of the upland bedrock area are generally well drained and non‐saline, with small areas of slightly saline soils along rivers. These soils tend to be slightly acidic, with a moderately high to high hydraulic conductivity.
2.1.2.4 Mountain Valley Basin Soils of the mountain valley basin areas are in basins surrounded by mountainous areas, commonly on stream terraces. These soils formed in alluvium derived from lacustrine sediments, and ash from past volcanic events may be present. These soils are shallow to deep, and range from well to poorly drained, depending on landscape position. Some soils have a hardpan and a claypan, which may limit the production of crops.
These soils are generally moderately well to well drained, non‐saline, and have a neutral pH. They tend to have moderately high hydraulic conductivity.
2.1.3 Overview of Valley Floor Hydrogeology The hydrology of the Sacramento Valley floor involves a vast area that includes a wide variety of hydrogeologic influences ranging from foothills and mountains around its edges, to the tidally influenced Delta at its southern extreme, and major rivers and their tributaries throughout its length.
DWR divides the SVGB into 17 subbasins according to groundwater characteristics, surface water features, and political boundaries (DWR 2003a). It is important to note that these individual groundwater subbasins have a high degree of hydraulic interconnection because the rivers (which are the primary method of defining the subbasin boundaries) do not act as barriers to groundwater flow. In most of the Sacramento Valley, streams are in direct hydraulic connection with the underlying aquifer; however, groundwater is free to flow underneath river systems because regional groundwater flow patterns within the aquifer respond to recharge and discharge at a much larger scale than the individual rivers and streams. Therefore, the SVGB functions primarily as a single laterally extensive alluvial aquifer, not as numerous discrete, smaller groundwater subbasins.
The main source of fresh groundwater in the SVGB is the upper 1,000 feet of basin‐fill deposits (USGS 2010). Hydrogeologic units containing fresh water along the eastern portion of the basin, primarily the Tuscan and Mehrten formations, are derived from sediments from the Sierra Nevada. Toward the southeastern portion of the Sacramento Valley, the Mehrten formation is overlain by sediments of the Laguna, Riverbank, and Modesto formations, which also originated in the Sierra Nevada. The primary hydrogeologic unit in the western portion of the SVGB is the Tehama formation, which was derived from the Coast Ranges. In most of the Sacramento Valley, these deeper units are overlain by younger alluvial and floodplain deposits. Geologic outcrops in the Sacramento Valley are shown in Figure 2‐3.
In the SVGB, surface water and groundwater systems are strongly connected and are highly variable spatially and temporally. Generally, the major trunk streams of the valley (the Sacramento and Feather rivers) act as drains and are recharged by groundwater throughout most of the year. The exceptions are areas of depressed groundwater elevations attributable to groundwater pumping, inducing leakage from the rivers, and localized recharge to the groundwater system. In contrast, the upper reaches of tributary streams flowing into the Sacramento River from upland areas are almost all losing streams (they recharge the groundwater system). Some of these transition to gaining streams (they receive groundwater) farther downstream, closer to their confluences with the Sacramento
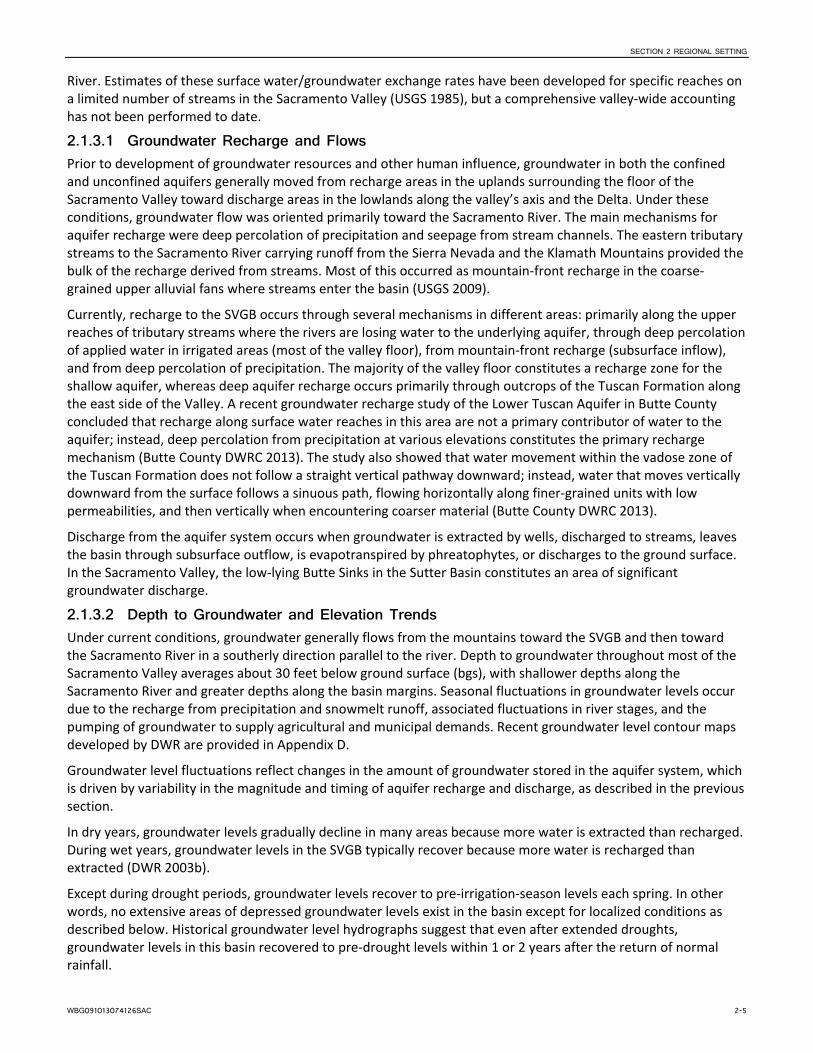
SECTION 2 REGIONAL SETTING
WBG091013074126SAC 2-5
River. Estimates of these surface water/groundwater exchange rates have been developed for specific reaches on a limited number of streams in the Sacramento Valley (USGS 1985), but a comprehensive valley‐wide accounting has not been performed to date.
2.1.3.1 Groundwater Recharge and Flows Prior to development of groundwater resources and other human influence, groundwater in both the confined and unconfined aquifers generally moved from recharge areas in the uplands surrounding the floor of the Sacramento Valley toward discharge areas in the lowlands along the valley’s axis and the Delta. Under these conditions, groundwater flow was oriented primarily toward the Sacramento River. The main mechanisms for aquifer recharge were deep percolation of precipitation and seepage from stream channels. The eastern tributary streams to the Sacramento River carrying runoff from the Sierra Nevada and the Klamath Mountains provided the bulk of the recharge derived from streams. Most of this occurred as mountain‐front recharge in the coarse‐grained upper alluvial fans where streams enter the basin (USGS 2009).
Currently, recharge to the SVGB occurs through several mechanisms in different areas: primarily along the upper reaches of tributary streams where the rivers are losing water to the underlying aquifer, through deep percolation of applied water in irrigated areas (most of the valley floor), from mountain‐front recharge (subsurface inflow), and from deep percolation of precipitation. The majority of the valley floor constitutes a recharge zone for the shallow aquifer, whereas deep aquifer recharge occurs primarily through outcrops of the Tuscan Formation along the east side of the Valley. A recent groundwater recharge study of the Lower Tuscan Aquifer in Butte County concluded that recharge along surface water reaches in this area are not a primary contributor of water to the aquifer; instead, deep percolation from precipitation at various elevations constitutes the primary recharge mechanism (Butte County DWRC 2013). The study also showed that water movement within the vadose zone of the Tuscan Formation does not follow a straight vertical pathway downward; instead, water that moves vertically downward from the surface follows a sinuous path, flowing horizontally along finer‐grained units with low permeabilities, and then vertically when encountering coarser material (Butte County DWRC 2013).
Discharge from the aquifer system occurs when groundwater is extracted by wells, discharged to streams, leaves the basin through subsurface outflow, is evapotranspired by phreatophytes, or discharges to the ground surface. In the Sacramento Valley, the low‐lying Butte Sinks in the Sutter Basin constitutes an area of significant groundwater discharge.
2.1.3.2 Depth to Groundwater and Elevation Trends Under current conditions, groundwater generally flows from the mountains toward the SVGB and then toward the Sacramento River in a southerly direction parallel to the river. Depth to groundwater throughout most of the Sacramento Valley averages about 30 feet below ground surface (bgs), with shallower depths along the Sacramento River and greater depths along the basin margins. Seasonal fluctuations in groundwater levels occur due to the recharge from precipitation and snowmelt runoff, associated fluctuations in river stages, and the pumping of groundwater to supply agricultural and municipal demands. Recent groundwater level contour maps developed by DWR are provided in Appendix D.
Groundwater level fluctuations reflect changes in the amount of groundwater stored in the aquifer system, which is driven by variability in the magnitude and timing of aquifer recharge and discharge, as described in the previous section.
In dry years, groundwater levels gradually decline in many areas because more water is extracted than recharged. During wet years, groundwater levels in the SVGB typically recover because more water is recharged than extracted (DWR 2003b).
Except during drought periods, groundwater levels recover to pre‐irrigation‐season levels each spring. In other words, no extensive areas of depressed groundwater levels exist in the basin except for localized conditions as described below. Historical groundwater level hydrographs suggest that even after extended droughts, groundwater levels in this basin recovered to pre‐drought levels within 1 or 2 years after the return of normal rainfall.
SECTION 2 REGIONAL SETTING
2-6 WBG091013074126SAC
As agricultural land use and water demands have intensified over time, groundwater levels in some areas have declined because increases in pumping have exceeded the quantity of local recharge to the groundwater system. This imbalance between pumping and recharge in portions of the valley has been the motivating force for development of supplemental surface supplies in several areas during the past 30 to 40 years. Examples include Yolo County’s construction of Indian Valley Dam on the North Fork of Cache Creek, South Sutter Water District’s construction of Camp Far West Reservoir on the Bear River, and Yuba County’s construction of New Bullards Bar Dam and Reservoir on the North Yuba River.
Today, groundwater levels are generally in balance valley‐wide, with pumping matched by recharge from the various sources annually. Some locales show the early signs of persistent declines in groundwater level, including northern Sacramento County, areas near Chico, and on the far west side of the Valley in Glenn County, where water demands are met primarily, and in some locales exclusively, by groundwater.
2.1.4 Overview of Valley Floor Groundwater Quality Groundwater quality in the Sacramento Valley is generally good and adequate for municipal, agricultural, domestic, and industrial uses (DWR 2003a). However, some localized groundwater quality problems exist, as described below. Natural groundwater quality is influenced by streamflow and recharge from the surrounding Coast Ranges and Sierra Nevada. Runoff from the Sierra Nevada is generally of higher quality than runoff from the Coast Ranges because of the presence of marine sediments in the Coast Ranges. Therefore, groundwater quality tends to be better in the eastern half of the valley. Groundwater quality also varies from north to south, with the best water quality occurring in the northern portion of the Valley, and poorer water quality in the southwestern portion (USGS 1984). This geographic variation is caused by surface recharge through the valley floor, which tends to be more concentrated in constituents than inflows from the valley margins. Most recharge of shallow groundwater in the basin is from agricultural irrigation, which has the potential to concentrate materials over‐applied to farmland via percolating water.
Calcium is the predominant cation and bicarbonate the predominant anion in the groundwater in the northern and eastern Sacramento Valley (USGS 2010). Groundwater on the west side generally has higher concentrations of sulfate, chloride, and total dissolved solids (TDS) than groundwater on the east side. Groundwater in the center of the Sacramento Valley is generally more geochemically reduced and contains higher concentrations of dissolved solids than groundwater on the east side (USGS 2010).
TDS consist of inorganic salts and small amounts of organic matter, and are strongly correlated with electrical conductivity (EC, also referred to as specific conductance). EC and TDS are both used as indicators of salinity levels in groundwater. The California secondary drinking water standard for TDS is recommended at 500 milligrams per
liter (mg/L) (taste and odor threshold). The non‐regulatory agricultural water quality goal is 450 mg/L.1 Generally, TDS levels are between 200 and 500 mg/L in most of the Sacramento Valley. Along the eastern boundary of the valley, TDS concentrations tend to be less than 200 mg/L, indicative of the low salinity of Sierra Nevada runoff. In the southern half of the valley, the TDS levels are higher because of the local geology, and large areas have TDS concentrations exceeding 500 mg/L. TDS concentrations as high as 1,500 mg/L have been reported in a few areas (USGS 1991). Areas that have high TDS concentrations include the south‐central part of the SVGB south of Sutter Buttes, in the area between the confluence of the Sacramento and Feather Rivers. The area west of the Sacramento River, between Putah Creek and the Delta, also has elevated TDS levels. The areas around Maxwell, Williams, and Arbuckle have high concentrations of chloride, sodium, and sulfate (DWR 1978). TDS in this region averages about 500 mg/L, but concentrations exceeding 1,000 mg/L have been reported. The source of salinity in the Maxwell and Putah Creek areas is associated with mineral springs in the hills to the west. High salinity around the Sutter Buttes is believed to be caused by upwelling of saline water from underlying marine sediments (USGS 1984).
1 Water Quality for Agriculture, published by the Food and Agriculture Organization of the United Nations in 1985, contains recommended goals protective of various agricultural uses of water, including irrig+ation of various types of crops and stock watering. This goal is for salt‐sensitive crops, considering a number of different factors, including climate, precipitation, and irrigation management.

SECTION 2 REGIONAL SETTING
WBG091013074126SAC 2-7
Nitrates found in groundwater have various sources, including fertilizers, wastewaters, and natural deposits. In irrigation water, nitrate can be an asset because of its value as a fertilizer; however, problems associated with plant toxicity can arise from concentrations exceeding 30 mg/L (as N) (USGS 1991). Two areas of elevated nitrate concentrations have been identified in the Sacramento Valley: one in northern Yuba and southern Butte counties (in the Gridley‐Marysville area) and another in northern Butte and southern Tehama counties (in the Corning‐Chico area). Approximately 25 to 33 percent of samples from these areas have concentrations exceeding the maximum contaminant level (MCL). Elevated nitrate concentrations in these areas are associated with shallow wells and are thought to be the result of a combination of fertilizers and septic systems. The latter is especially an issue in Butte County, where 150,000 of its 200,000 residents rely on individual septic systems (DWR 2009).
Iron and manganese are naturally occurring elements that often co‐occur in the valley‐fill sediments. Findings from the USGS Groundwater Ambient Monitoring and Assessment (GAMA) Middle Sacramento Valley Study showed that iron or manganese concentrations are present at high concentrations in about 27 percent of the primary aquifers and at moderate concentrations in about 6 percent (USGS and SWRCB 2011). This indicates that groundwater in the major aquifers of the Sacramento Valley is affected by the presence of the surrounding naturally occurring minerals throughout the deep sediments.
Other naturally occurring groundwater quality impairments occur in specific areas of the valley. Groundwater near the Sutter Buttes is impaired because of the local volcanic geology. Hydrogen sulfide is a problem for wells in geothermal areas in the western part of the region (DWR 2009).
The 2010 USGS GAMA report (USGS 2010) summarizes groundwater quality findings in the Sacramento Valley. Maps showing groundwater quality spatial distribution for several major constituents of concern are provided in Appendix E.
2.1.5 Initial Designation of Hydrogeologically Vulnerable Areas Section 1 described the SWRCB’s mapping of “initial hydrogeologically vulnerable areas” to identify the presence of soil or rock conditions that may potentially be more vulnerable to groundwater contamination, and the Central Valley RWQCB’s identification of DPR Groundwater Protection Areas for consideration. Figure 2‐10 shows the HVAs and GPAs in the SVWQC area. This map shows that most of the identified vulnerable areas are located in alluvial plains by the mainstem rivers of the valley and their floodplain areas. In addition, a few areas in the mountainous groundwater basins are also designated as an HVA or GPA, notably in the northern Pit River watershed area, and in the Sierra Valley area of Plumas and Sierra Counties. The map also shows that significant portions of the SWRCB initial HVA lands intersect with DPR GPAs. These initial characterizations of vulnerability in the Sacramento River Watershed study area were assessed during GAR analysis, and a more refined map of vulnerable areas was prepared based on a more detailed understanding of actual potential vulnerabilities due to hydrogeologic susceptibilities, agricultural practices, and groundwater quality data.
2.2 Existing Groundwater Beneficial Uses Approximately 31 percent of the Sacramento Valley region’s urban and agricultural water needs are met by groundwater (DWR 2003a). Although surface water supplies provide the majority of agricultural applied water in the Sacramento Valley, groundwater provides approximately 10 to 15 percent of the total water for agricultural irrigation, depending on water year type.
Beneficial uses of groundwater are designated in the Water Quality Control Plan for the Sacramento River and San Joaquin River Basins (Basin Plan). Unless otherwise designated, all groundwater in the Sacramento Valley is considered suitable, or at a minimum potentially suitable, for municipal and domestic water supply (MUN), agricultural supply (AGR), industrial service supply (IND), and industrial process supply (PRO). The Basin Plan specifies exceptions to each beneficial use designation on the basis of quality or yield characteristics (Central Valley RWQCB 1998).
Municipal, industrial, and agricultural water demands in the region total approximately 8 MAF, and groundwater provides about 2.5 MAF of this total (DWR 2009). The portion of the water diverted for irrigation but not actually

SECTION 2 REGIONAL SETTING
2-8 WBG091013074126SAC
consumed by crops or other vegetation becomes recharge to the groundwater aquifer or flows back to surface waterways and contributes to surface supplies either within or downstream of the Sacramento Valley.
Groundwater well yields are generally good and range from one hundred to several thousand gallons per minute in the coarser aquifer materials. Municipal and irrigation wells are typically screened deeper in the aquifer (200 to 600 feet bgs) than the domestic wells in the SVGB (100 to 250 feet bgs).
2.3 Overview of Water Quality Objectives and Basin Plans The Central Valley Basin Plan specifies water quality standards (WQSs) for groundwater. WQSs comprise designated beneficial uses and numeric and/or narrative water quality objectives (WQOs) developed to be protective of designated beneficial uses. For groundwater, WQOs are relevant to the protection of designated beneficial uses, but do not require improvement over naturally occurring background water concentrations.
2.3.1 Nitrate Standards Nitrogen is present in water bodies in the following forms that are measured to characterize water quality: nitrate (NO3
‐), nitrite (NO2‐), ammonia (NH3), and organic (TKN minus NH3). The sum of the concentrations of the
mentioned compounds is referred to as total nitrogen.
Nitrogen is of particular concern when assessing water quality impacts from agriculture as it, along with phosphorus, is frequently applied to fields in fertilizer. As set forth by the EPA’s Safe Drinking Water Act and the National Primary Drinking Water Standards (NPDWS), the federal MCL standards for nitrogen compounds are as follows (USEPA 2012, CDPH 2012):
Nitrate + nitrite as N: 10 mg/L
Nitrate as NO3‐: 45 mg/L (the applicable MCL for this data review)
Nitrite as N: 1 mg/L
CDPH regulations match these limits under Title 22 of the California Code of Regulations section 63341. Health issues of concern at concentrations exceeding the standards set forth by federal and state regulations are caused by both the nitrate and nitrite forms of nitrogen in water (CDPH 2012).
Nitrate occurs naturally in groundwater from leached soils or bedrock, and it does not generally react with soil or sediments and tends to move with groundwater due to its high solubility in water and its generally stable condition; ammonia is less mobile and subject to sorption and conversion to nitrate under oxidized conditions (USGS 1996). Anthropogenic groundwater nitrate sources include synthetic fertilizer, animal manure, wastewater treatment plant effluent and biosolids, and septic systems (Esser et al. 2002).
2.3.2 Salinity Standards Salinity is indicated either as total dissolved solids (TDS, in mg/L), or as the water source’s conductivity (the ability of water to conduct an electrical current). When soluble salts dissolve in water, the resulting ions behave as conductors. Therefore, electrical conductivity (EC in microSiemens per centimeter [µS/cm], referred to as specific conductance when normalized to 25°C) measured in the field is an indirect measurement of salinity. The relationship between EC and TDS is variable in natural waters due to variations in water composition: different ions affect the EC electrode differently. For example, water high in sulfate will yield a lower value of EC than a water low in sulfate but at the same TDS. In addition, field EC instrument error or miscalibration can add uncertainty to the correlation with TDS.
Salinity in groundwater is often caused by the dissolution of soluble minerals, the presence of seawater deposited with marine sediments in particular geologic formations, and the presence of mineral springs. In the Sacramento Valley, these processes are responsible for elevated salinity levels in groundwater in the vicinity of the Sutter Buttes, where there are documented saline water intrusions from marine sediments (USGS 1984). Below are the
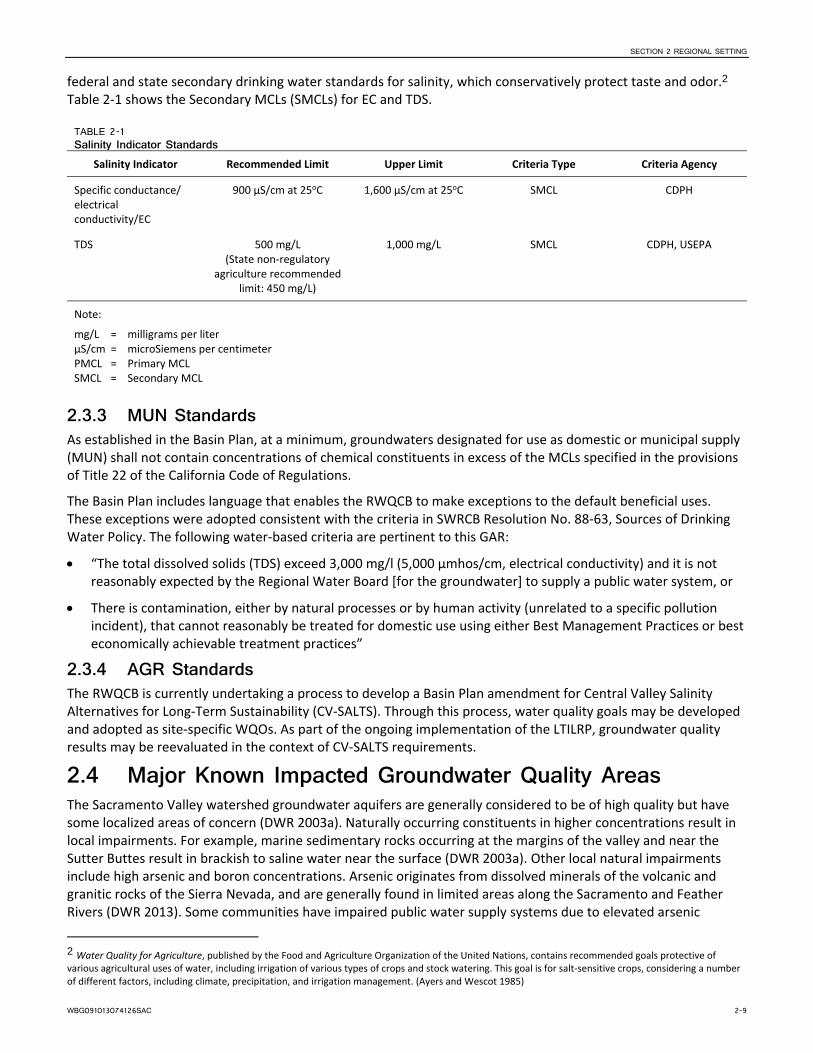
SECTION 2 REGIONAL SETTING
WBG091013074126SAC 2-9
federal and state secondary drinking water standards for salinity, which conservatively protect taste and odor.2 Table 2‐1 shows the Secondary MCLs (SMCLs) for EC and TDS.
TABLE 2-1 Salinity Indicator Standards
Salinity Indicator Recommended Limit Upper Limit Criteria Type Criteria Agency
Specific conductance/ electrical conductivity/EC
900 µS/cm at 25oC 1,600 µS/cm at 25oC SMCL CDPH
TDS 500 mg/L (State non‐regulatory
agriculture recommended limit: 450 mg/L)
1,000 mg/L SMCL CDPH, USEPA
Note:
mg/L = milligrams per liter µS/cm = microSiemens per centimeter PMCL = Primary MCL SMCL = Secondary MCL
2.3.3 MUN Standards As established in the Basin Plan, at a minimum, groundwaters designated for use as domestic or municipal supply (MUN) shall not contain concentrations of chemical constituents in excess of the MCLs specified in the provisions of Title 22 of the California Code of Regulations.
The Basin Plan includes language that enables the RWQCB to make exceptions to the default beneficial uses. These exceptions were adopted consistent with the criteria in SWRCB Resolution No. 88‐63, Sources of Drinking Water Policy. The following water‐based criteria are pertinent to this GAR:
“The total dissolved solids (TDS) exceed 3,000 mg/l (5,000 µmhos/cm, electrical conductivity) and it is not reasonably expected by the Regional Water Board [for the groundwater] to supply a public water system, or
There is contamination, either by natural processes or by human activity (unrelated to a specific pollution incident), that cannot reasonably be treated for domestic use using either Best Management Practices or best economically achievable treatment practices”
2.3.4 AGR Standards The RWQCB is currently undertaking a process to develop a Basin Plan amendment for Central Valley Salinity Alternatives for Long‐Term Sustainability (CV‐SALTS). Through this process, water quality goals may be developed and adopted as site‐specific WQOs. As part of the ongoing implementation of the LTILRP, groundwater quality results may be reevaluated in the context of CV‐SALTS requirements.
2.4 Major Known Impacted Groundwater Quality Areas The Sacramento Valley watershed groundwater aquifers are generally considered to be of high quality but have some localized areas of concern (DWR 2003a). Naturally occurring constituents in higher concentrations result in local impairments. For example, marine sedimentary rocks occurring at the margins of the valley and near the Sutter Buttes result in brackish to saline water near the surface (DWR 2003a). Other local natural impairments include high arsenic and boron concentrations. Arsenic originates from dissolved minerals of the volcanic and granitic rocks of the Sierra Nevada, and are generally found in limited areas along the Sacramento and Feather Rivers (DWR 2013). Some communities have impaired public water supply systems due to elevated arsenic
2 Water Quality for Agriculture, published by the Food and Agriculture Organization of the United Nations, contains recommended goals protective of various agricultural uses of water, including irrigation of various types of crops and stock watering. This goal is for salt‐sensitive crops, considering a number of different factors, including climate, precipitation, and irrigation management. (Ayers and Wescot 1985)
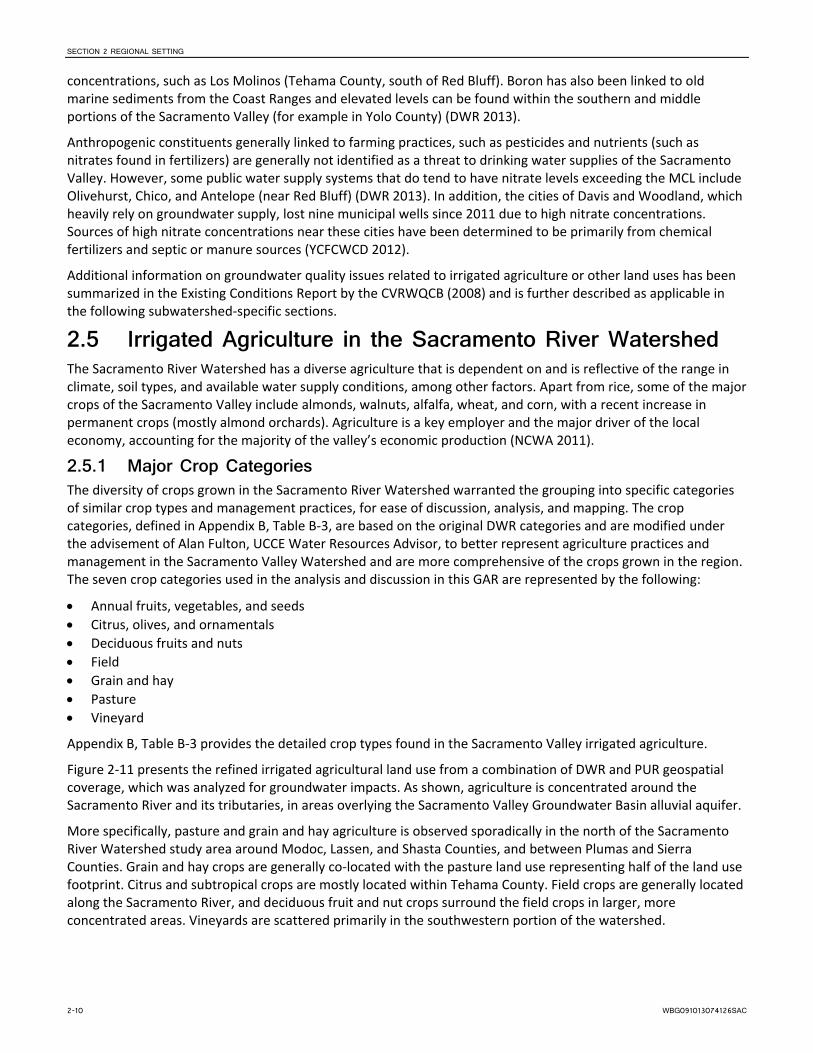
SECTION 2 REGIONAL SETTING
2-10 WBG091013074126SAC
concentrations, such as Los Molinos (Tehama County, south of Red Bluff). Boron has also been linked to old marine sediments from the Coast Ranges and elevated levels can be found within the southern and middle portions of the Sacramento Valley (for example in Yolo County) (DWR 2013).
Anthropogenic constituents generally linked to farming practices, such as pesticides and nutrients (such as nitrates found in fertilizers) are generally not identified as a threat to drinking water supplies of the Sacramento Valley. However, some public water supply systems that do tend to have nitrate levels exceeding the MCL include Olivehurst, Chico, and Antelope (near Red Bluff) (DWR 2013). In addition, the cities of Davis and Woodland, which heavily rely on groundwater supply, lost nine municipal wells since 2011 due to high nitrate concentrations. Sources of high nitrate concentrations near these cities have been determined to be primarily from chemical fertilizers and septic or manure sources (YCFCWCD 2012).
Additional information on groundwater quality issues related to irrigated agriculture or other land uses has been summarized in the Existing Conditions Report by the CVRWQCB (2008) and is further described as applicable in the following subwatershed‐specific sections.
2.5 Irrigated Agriculture in the Sacramento River Watershed The Sacramento River Watershed has a diverse agriculture that is dependent on and is reflective of the range in climate, soil types, and available water supply conditions, among other factors. Apart from rice, some of the major crops of the Sacramento Valley include almonds, walnuts, alfalfa, wheat, and corn, with a recent increase in permanent crops (mostly almond orchards). Agriculture is a key employer and the major driver of the local economy, accounting for the majority of the valley’s economic production (NCWA 2011).
2.5.1 Major Crop Categories The diversity of crops grown in the Sacramento River Watershed warranted the grouping into specific categories of similar crop types and management practices, for ease of discussion, analysis, and mapping. The crop categories, defined in Appendix B, Table B‐3, are based on the original DWR categories and are modified under the advisement of Alan Fulton, UCCE Water Resources Advisor, to better represent agriculture practices and management in the Sacramento Valley Watershed and are more comprehensive of the crops grown in the region. The seven crop categories used in the analysis and discussion in this GAR are represented by the following:
Annual fruits, vegetables, and seeds
Citrus, olives, and ornamentals
Deciduous fruits and nuts
Field
Grain and hay
Pasture
Vineyard
Appendix B, Table B‐3 provides the detailed crop types found in the Sacramento Valley irrigated agriculture.
Figure 2‐11 presents the refined irrigated agricultural land use from a combination of DWR and PUR geospatial coverage, which was analyzed for groundwater impacts. As shown, agriculture is concentrated around the Sacramento River and its tributaries, in areas overlying the Sacramento Valley Groundwater Basin alluvial aquifer.
More specifically, pasture and grain and hay agriculture is observed sporadically in the north of the Sacramento River Watershed study area around Modoc, Lassen, and Shasta Counties, and between Plumas and Sierra Counties. Grain and hay crops are generally co‐located with the pasture land use representing half of the land use footprint. Citrus and subtropical crops are mostly located within Tehama County. Field crops are generally located along the Sacramento River, and deciduous fruit and nut crops surround the field crops in larger, more concentrated areas. Vineyards are scattered primarily in the southwestern portion of the watershed.

SECTION 2 REGIONAL SETTING
WBG091013074126SAC 2-11
2.5.2 Fertilizer Use Summary The USGS compiled annual estimated fertilizer use from fertilizer sales in each county for the period 1987 to 2006 (USGS 2012). The bar charts provided in Appendix F summarize the estimated nitrogen and phosphorus use for each of the 20 counties within the SCWQC area. It should be noted that some counties are not entirely included with the SVWQC area, and therefore these values over‐estimate the fertilizer use within the study area in some counties (for example Napa County, Plumas County). However, this summary provides an indication of trends in fertilizer use in the past 3 decades in the Sacramento River Watershed counties. In general, there has been a gradual increase in phosphorus and nitrogen fertilizer use in the 1980s and 1990s, with a notable increase in the early 2000s. This increase in fertilizer use probably correlates with an increase in agriculture acreage over the same period of time.
2.6 Managed Wetlands Approximately 22,000 acres of managed wetlands are enrolled as members of the SVWQC. These wetlands are managed by a variety of entities that include public agencies, non‐government organizations, and private organizations.
In addition to the major large managed wetlands, wetland easements are obtained on private farmland and are managed under the USDA NRCS’s Wetland Resources Program (WRP). Wetland easements exist in every subwatershed within the Sacramento River Watershed study area except in the El Dorado, Goose Lake, and Lake subwatersheds. They are primarily found along the valley floor and along both sides of the Pit River. Wetland easements managed by the WRP by the NRCS are hereafter also included as a separate land use category as they are enrolled under the SVWQC.
Wetlands are managed much differently than agricultural lands. These flooded areas provide important conservation and habitat benefits, particularly for migrating birds in Northern California. Wetlands provide unique environmental conditions and do not have the same potential to affect groundwater quality as agricultural lands do for two reasons: (1) no fertilizers or pesticides are applied on these lands, and (2) the flooded fields create reducing conditions in the shallow zone underneath the wetland that promotes denitrification of leached nitrate in the subsurface (similar to rice fields).
Several federally managed wildlife areas that are not regulated under this order are also present in the Sacramento Valley:
Sacramento National Wildlife Refuge
Delevan National Wildlife Refuge
Colusa National Wildlife Refuge
Sutter National Wildlife Refuge
Managed wetlands on public and private lands in the Sacramento Valley provide habitat for millions of waterfowl, shorebirds, and other waterbirds along the Pacific Flyway migratory route. These relatively few remaining wetland areas depend on dedicated water supplies and active management.


WBG091013074126SAC 3-1
SECTION 3
Overview of Well Networks This section provides an overview of the different groundwater well networks managed by public agencies in California and having data readily and publicly available for the Sacramento River Watershed study area.
3.1 Groundwater Level Measurements The DWR Northern and North Central Districts perform groundwater level monitoring at wells of varying depths and use (agricultural, domestic, and monitoring) throughout the Valley. Water level contour maps for 2012–2013 summer, fall, and spring measurements in the Northern Sacramento Valley are provided in Appendix D. These maps are good indicators of the groundwater levels and flow direction within the Valley.
Groundwater levels in areas outside of the Valley floor are not monitored as often and no contour maps are available, but DWR maintains water level results in their database. These data are retrievable online.
In addition, the California Statewide Groundwater Elevation Monitoring (CASGEM) program, authorized by SBX7‐6 and enacted in November 2009, provides for additional water level data at a variety of wells. This online database was designed and is maintained by DWR. Numerous agencies throughout the Valley participate in the CASGEM program and upload their water level measurements regularly. The majority of available water levels are for designated DWR groundwater basins in the Sacramento Valley and in the mountain valley basins. Data for fractured rock areas in the foothills are not as readily available from this database, as CASGEM does not apply to these areas (per Water Code Section 10925(a)).
For the purpose of this groundwater assessment analysis, these two DWR datasets, in addition to local agencies’ groundwater management plans and monitoring reports, were used to assess the depth to groundwater in the irrigated lands areas.
3.2 Groundwater Quality Datasets Groundwater quality is best understood by reviewing existing groundwater quality data from groundwater monitoring networks. The GAR requirements call for the review of readily available and relevant well networks for a comprehensive analysis. Data from historical and current groundwater monitoring networks were reviewed to determine which were applicable for this analysis and to provide an initial identification of significant gaps in monitoring of groundwater quality in the Sacramento Valley. The well networks were evaluated based on the following features:
Location of wells throughout the study area
Number of unique locations in each dataset
Proximity of wells to irrigated agricultural land use areas
Availability of well construction information
Availability of depth of sample information
Period of record for concentrations of nutrients (primarily nitrate) and salinity indicators (total dissolved solids, and measurements of specific conductivity)
Wells of different depths serve distinct data needs:
Shallow wells were preferred to deeper wells for the purpose of identifying the quality of shallow groundwater beneath and downgradient of agriculture land use areas because these are most likely to exhibit the influence of agricultural sources of pollutants.
Deeper wells were reviewed to assess the potential for contaminants to migrate vertically to the deeper zones of the aquifer.
In California, there is no standardized and coordinated geodatabase for all wells sampled by various public agencies. Therefore, a data search was performed for groundwater quality samples within the study area by

SECTION 3 OVERVIEW OF WELL NETWORKS
3-2 WBG091013074126SAC
querying databases from several agencies that manage groundwater quality data. State and federal agencies that maintain online‐accessible geodatabases of groundwater level and groundwater quality monitoring at a variety of wells include the following:
SWRCB: GeoTracker GAMA geodatabase
USGS: NWIS Web Portal
DWR: Water Data Library
Each database was queried for wells within the Sacramento River Watershed, and the results are described below. In addition to database queries, special groundwater quality monitoring programs and reports from SWRCB and USGS were reviewed and summarized below.
For a technically sound analysis of groundwater conditions based on well data, the ideal well networks would include well construction information (including depth of well and depth of screen intervals), an exact location of the well, and several sampling results with respective dates of when the samples were taken. In addition, an indication of the use of the well (monitoring, domestic, irrigation, public supply) would also be useful to assess the potential influence on the well sample from anthropogenic factors.
3.2.1 SWRCB GeoTracker GAMA Database SWRCB GeoTracker GAMA is an online database tool that integrates groundwater quality data from multiple sources: State and Regional Water Boards, California Department of Public Health (CDPH), DPR, DWR, USGS, and Lawrence Livermore National Laboratory. The DPR dataset will be evaluated in this GAR, however, the GAMA GeoTracker data from DPR are not included in this review. The following datasets were reviewed in depth for potential use in this analysis: CDPH, DWR, USGS, and GAMA (SWRCB 2011). They are further described below.
3.2.1.1 CDPH Municipal water providers submit their water quality data to CDPH under requirements of state water law. These wells are owned, operated, and typically sampled by providers of municipal water; CDPH does not typically perform its own monitoring of these wells. Figure 3‐1 shows that the CDPH wells are fairly evenly spread throughout the study area and identifies wells that were sampled for nitrate and that are located in areas of irrigated agriculture (wells in urban areas are excluded from this dataset). The coordinates of the CDPH wells are not exact, but instead are at the center of the section in which they are located; their coordinates are not specifically identified by the GAMA Geotracker database per restrictions of the California Water Code. As a result, when multiple wells are located in the same section, the wells all have the same coordinates listed in the database and display in a single location on maps.
Because many CDPH wells are public drinking water supply wells, most are located near population centers, and the groundwater quality of these wells represent water quality influenced by urban land use rather than or in addition to agricultural land use. The database query intentionally excluded wells underlying urban land use and includes only wells underlying irrigated agriculture. This was done in an effort to restrict the data to show potential impacts from only irrigated agriculture and not urban impacts. The period of record for the CDPH wells extends from 1982 to 2012, with many wells having greater than 10 samples over this period.
Data limitations include the following:
Inexact coordinates, resulting in multiple wells at a single location
Many wells with only one sample
Wells with multiple samples on the same day with no specific explanation
No well construction information
No sample depth information
These wells may be valuable for an agriculturally focused groundwater quality assessment because they do represent groundwater quality of deeper aquifers, some are located in proximity to agricultural land uses, and they are the major drinking water supplies in the region.

SECTION 3 OVERVIEW OF WELL NETWORKS
WBG091013074126SAC 3-3
3.2.1.2 DWR The DWR wells that include nitrate measurements are mostly located in the Sacramento Valley, leaving a large part of the study area without data from this well dataset. Each of the wells in the GeoTracker DWR dataset has a unique location. Most of the wells have only one sample, but the number of samples range from 1 to 4 samples per well. Most samples included nitrate concentrations and total dissolved solids (TDS) results; however, some of the samples had results for only one constituent. None of the samples in the dataset had specific conductivity measurements. Further, the GeoTracker subset of DWR wells does not include all the known DWR wells or sampling events. The period of record for the DWR wells extends from 2000 to 2008, with no wells showing more than four samples.
Data limitations include the following:
Little coverage outside of the Sacramento Valley
Many wells with only one sample
Wells with multiple samples on the same day with no specific explanation
No specific conductivity measurements
Short period of record
Not all DWR wells are in GeoTracker
No well construction information
No sample depth information
3.2.1.3 USGS The USGS wells that include nitrate measurements are mostly located within the Sacramento Valley in the northern part of the study area, and are more evenly spread out in the southern part of the study area. Each of the GeoTracker USGS wells has a unique location. The USGS wells included in the GAMA Geotracker database are intended to include those that were sampled under the State‐funded GAMA program. However, many of the USGS‐sampled GAMA wells are missing from GeoTracker data set (approximately 130 of the USGS GAMA wells from the Sacramento Valley and 52 USGS GAMA wells from the Sierra Nevada). All wells had specific conductivity measurements. Only some wells had nitrate and TDS analysis. These USGS wells were sampled in 2006, and very few wells have more than one sample.
Data limitations include the following:
Little coverage outside of the Sacramento Valley in the northern region
Many wells with only one sample
Wells with multiple samples on the same day with no specific explanation
Nitrate and TDS not analyzed for all samples
Short period of record
Not all USGS wells are included (USGS GAMA and USGS NWIS)
No well construction information
No sample depth information
3.2.1.4 GAMA The GAMA wells are concentrated in three locations: around Red Bluff in Tehama County, Yuba County, and El Dorado County (Figure 3‐2). These wells were part of an SWRCB‐managed domestic well sampling project for several counties throughout the state. Within the Sacramento River Watershed area, Tehama, Yuba, and El Dorado Counties were monitored as part of this project. All the wells have nitrate and TDS analysis, but only about half the wells also have specific conductivity measurements. The period of record for the GAMA wells only includes a single year for each county, and no wells have more than one sample.
Data limitations include the following:
Coverage limited to three counties
Wells only have one sample

SECTION 3 OVERVIEW OF WELL NETWORKS
3-4 WBG091013074126SAC
Specific conductivity not analyzed for all samples
Short period of record
No well construction information
No sample depth information
Even though this dataset has only sporadic coverage for the study area, it is useful for determining the water quality in shallow domestic wells for areas that rely on groundwater for drinking water supply and that are primarily rural areas surrounded by irrigated agriculture. Additional information on this dataset is provided under the following discussion on the SWRCB’s Domestic Wells Project.
3.2.2 SWRCB GAMA Program: Domestic Wells Project This project samples domestic wells for commonly detected chemicals at no cost to volunteering well owners. Results are shared with the well owners and used by the GAMA Program to evaluate the quality of groundwater used by private well owners. SWRCB staff performs the sampling and data analysis, and results are available from the GeoTracker GAMA database (as described above). The Domestic Well Project has sampled three County Focus Areas in the study area: Tehama, Yuba, and El Dorado Counties.
3.2.2.1 Tehama County Located in northern Sacramento Valley, Tehama County is bordered to the west by the Coast Ranges and to the east by the Cascade Range. The water‐bearing geologic units include the Tehama, Tuscan, Riverbank, and Modesto Formations. The Tehama Formation is mostly composed of sediments from the Klamath Mountains and Coast Ranges. The Tehama Formation is located at or near the surface on the western edge of Tehama County and is a primary source of groundwater in the Red Bluff area. Near the center of the Valley, it supplies water to deep wells. The Tuscan Formation is mostly composed of volcanic gravels, mudflows, and eruptive material. The Tuscan formation primarily supplies deep wells toward the middle and eastern side of the Sacramento Valley. The Riverbank Formation is composed of gravels, clay sands, and silts. It varies in thickness and does not supply many domestic wells. The Modesto Formation is composed of reworked older sedimentary deposits and supplies shallow wells near the Sacramento River.
Private domestic wells in Tehama County were sampled in 2005. Tehama County was selected for sampling because it has a large number of domestic wells and has good availability of well‐owner data. A total of 223 wells were sampled, primarily in the Los Molinos and Red Bluff areas (SWRCB 2009). A summary of sampled well depths is provided in Table 3‐1.
TABLE 3-1 GAMA Domestic Well Depths in Tehama County Focus Area
Total Well Depth (feet bgs) Number of Wells
0–24 0
25–49 3
50–74 10
75–99 39
100–124 29
125–149 8
150–174 5
175–199 4
200–224 6
225–249 1
250–274 3
275–299 5
300–324 9
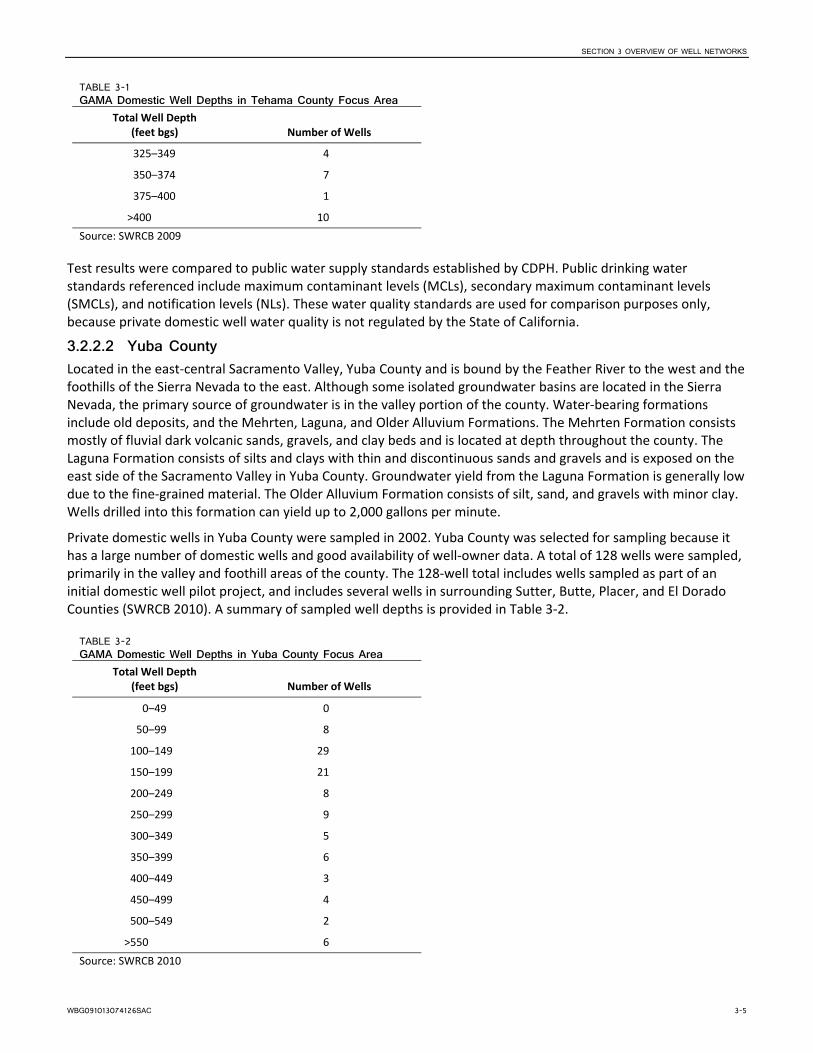
SECTION 3 OVERVIEW OF WELL NETWORKS
WBG091013074126SAC 3-5
TABLE 3-1 GAMA Domestic Well Depths in Tehama County Focus Area
Total Well Depth (feet bgs) Number of Wells
325–349 4
350–374 7
375–400 1
>400 10
Source: SWRCB 2009
Test results were compared to public water supply standards established by CDPH. Public drinking water standards referenced include maximum contaminant levels (MCLs), secondary maximum contaminant levels (SMCLs), and notification levels (NLs). These water quality standards are used for comparison purposes only, because private domestic well water quality is not regulated by the State of California.
3.2.2.2 Yuba County Located in the east‐central Sacramento Valley, Yuba County and is bound by the Feather River to the west and the foothills of the Sierra Nevada to the east. Although some isolated groundwater basins are located in the Sierra Nevada, the primary source of groundwater is in the valley portion of the county. Water‐bearing formations include old deposits, and the Mehrten, Laguna, and Older Alluvium Formations. The Mehrten Formation consists mostly of fluvial dark volcanic sands, gravels, and clay beds and is located at depth throughout the county. The Laguna Formation consists of silts and clays with thin and discontinuous sands and gravels and is exposed on the east side of the Sacramento Valley in Yuba County. Groundwater yield from the Laguna Formation is generally low due to the fine‐grained material. The Older Alluvium Formation consists of silt, sand, and gravels with minor clay. Wells drilled into this formation can yield up to 2,000 gallons per minute.
Private domestic wells in Yuba County were sampled in 2002. Yuba County was selected for sampling because it has a large number of domestic wells and good availability of well‐owner data. A total of 128 wells were sampled, primarily in the valley and foothill areas of the county. The 128‐well total includes wells sampled as part of an initial domestic well pilot project, and includes several wells in surrounding Sutter, Butte, Placer, and El Dorado Counties (SWRCB 2010). A summary of sampled well depths is provided in Table 3‐2.
TABLE 3-2 GAMA Domestic Well Depths in Yuba County Focus Area
Total Well Depth (feet bgs) Number of Wells
0–49 0
50–99 8
100–149 29
150–199 21
200–249 8
250–299 9
300–349 5
350–399 6
400–449 3
450–499 4
500–549 2
>550 6
Source: SWRCB 2010
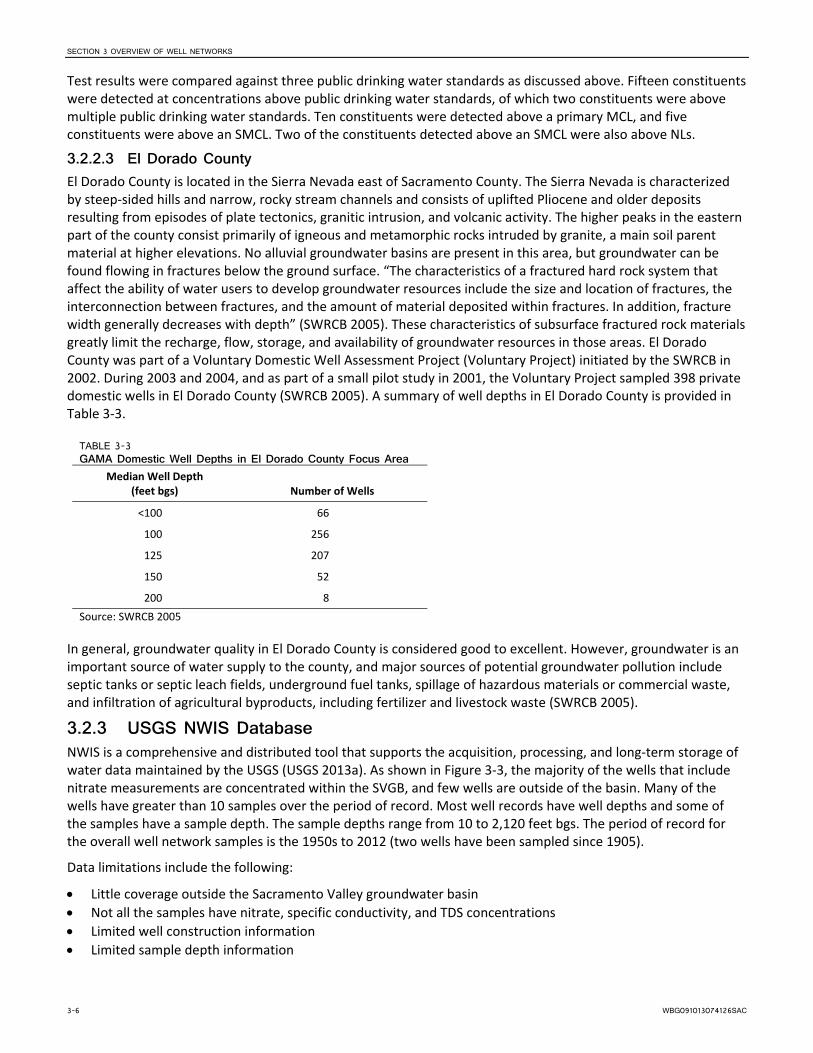
SECTION 3 OVERVIEW OF WELL NETWORKS
3-6 WBG091013074126SAC
Test results were compared against three public drinking water standards as discussed above. Fifteen constituents were detected at concentrations above public drinking water standards, of which two constituents were above multiple public drinking water standards. Ten constituents were detected above a primary MCL, and five constituents were above an SMCL. Two of the constituents detected above an SMCL were also above NLs.
3.2.2.3 El Dorado County El Dorado County is located in the Sierra Nevada east of Sacramento County. The Sierra Nevada is characterized by steep‐sided hills and narrow, rocky stream channels and consists of uplifted Pliocene and older deposits resulting from episodes of plate tectonics, granitic intrusion, and volcanic activity. The higher peaks in the eastern part of the county consist primarily of igneous and metamorphic rocks intruded by granite, a main soil parent material at higher elevations. No alluvial groundwater basins are present in this area, but groundwater can be found flowing in fractures below the ground surface. “The characteristics of a fractured hard rock system that affect the ability of water users to develop groundwater resources include the size and location of fractures, the interconnection between fractures, and the amount of material deposited within fractures. In addition, fracture width generally decreases with depth” (SWRCB 2005). These characteristics of subsurface fractured rock materials greatly limit the recharge, flow, storage, and availability of groundwater resources in those areas. El Dorado County was part of a Voluntary Domestic Well Assessment Project (Voluntary Project) initiated by the SWRCB in 2002. During 2003 and 2004, and as part of a small pilot study in 2001, the Voluntary Project sampled 398 private domestic wells in El Dorado County (SWRCB 2005). A summary of well depths in El Dorado County is provided in Table 3‐3.
TABLE 3-3 GAMA Domestic Well Depths in El Dorado County Focus Area
Median Well Depth (feet bgs) Number of Wells
<100 66
100 256
125 207
150 52
200 8
Source: SWRCB 2005
In general, groundwater quality in El Dorado County is considered good to excellent. However, groundwater is an important source of water supply to the county, and major sources of potential groundwater pollution include septic tanks or septic leach fields, underground fuel tanks, spillage of hazardous materials or commercial waste, and infiltration of agricultural byproducts, including fertilizer and livestock waste (SWRCB 2005).
3.2.3 USGS NWIS Database NWIS is a comprehensive and distributed tool that supports the acquisition, processing, and long‐term storage of water data maintained by the USGS (USGS 2013a). As shown in Figure 3‐3, the majority of the wells that include nitrate measurements are concentrated within the SVGB, and few wells are outside of the basin. Many of the wells have greater than 10 samples over the period of record. Most well records have well depths and some of the samples have a sample depth. The sample depths range from 10 to 2,120 feet bgs. The period of record for the overall well network samples is the 1950s to 2012 (two wells have been sampled since 1905).
Data limitations include the following:
Little coverage outside the Sacramento Valley groundwater basin
Not all the samples have nitrate, specific conductivity, and TDS concentrations
Limited well construction information
Limited sample depth information
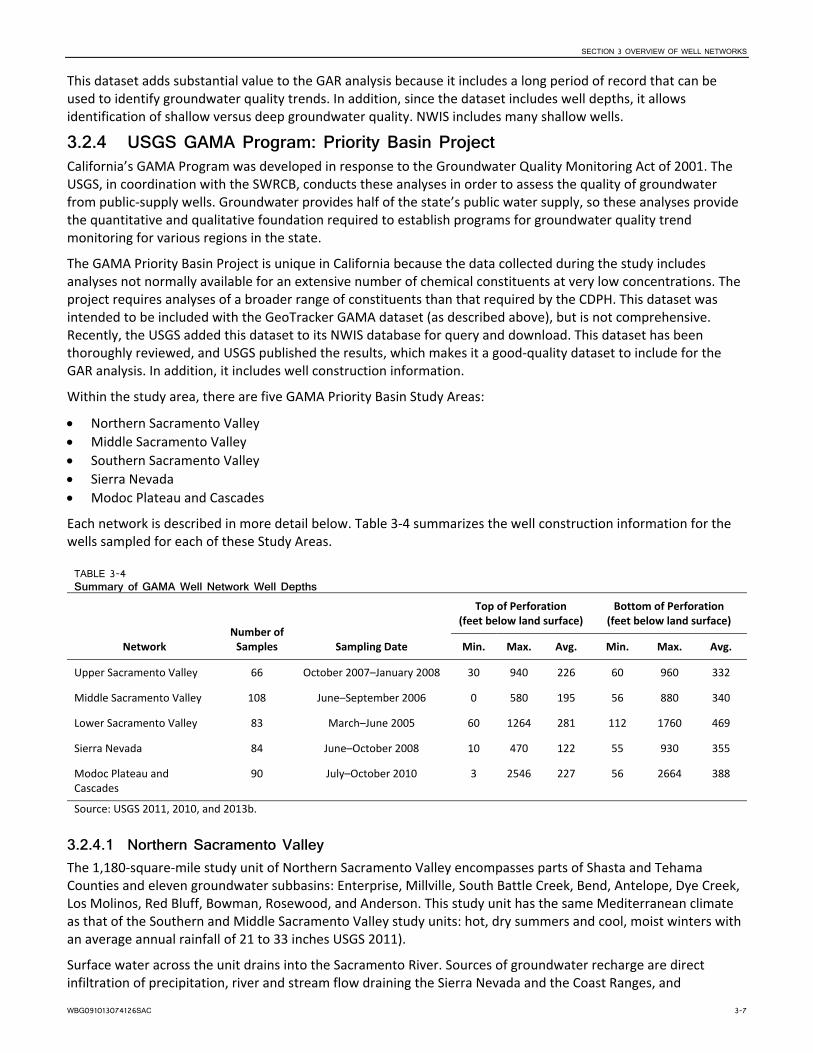
SECTION 3 OVERVIEW OF WELL NETWORKS
WBG091013074126SAC 3-7
This dataset adds substantial value to the GAR analysis because it includes a long period of record that can be used to identify groundwater quality trends. In addition, since the dataset includes well depths, it allows identification of shallow versus deep groundwater quality. NWIS includes many shallow wells.
3.2.4 USGS GAMA Program: Priority Basin Project California’s GAMA Program was developed in response to the Groundwater Quality Monitoring Act of 2001. The USGS, in coordination with the SWRCB, conducts these analyses in order to assess the quality of groundwater from public‐supply wells. Groundwater provides half of the state’s public water supply, so these analyses provide the quantitative and qualitative foundation required to establish programs for groundwater quality trend monitoring for various regions in the state.
The GAMA Priority Basin Project is unique in California because the data collected during the study includes analyses not normally available for an extensive number of chemical constituents at very low concentrations. The project requires analyses of a broader range of constituents than that required by the CDPH. This dataset was intended to be included with the GeoTracker GAMA dataset (as described above), but is not comprehensive. Recently, the USGS added this dataset to its NWIS database for query and download. This dataset has been thoroughly reviewed, and USGS published the results, which makes it a good‐quality dataset to include for the GAR analysis. In addition, it includes well construction information.
Within the study area, there are five GAMA Priority Basin Study Areas:
Northern Sacramento Valley
Middle Sacramento Valley
Southern Sacramento Valley
Sierra Nevada
Modoc Plateau and Cascades
Each network is described in more detail below. Table 3‐4 summarizes the well construction information for the wells sampled for each of these Study Areas.
TABLE 3-4 Summary of GAMA Well Network Well Depths
Network Number of Samples Sampling Date
Top of Perforation (feet below land surface)
Bottom of Perforation (feet below land surface)
Min. Max. Avg. Min. Max. Avg.
Upper Sacramento Valley 66 October 2007–January 2008 30 940 226 60 960 332
Middle Sacramento Valley 108 June–September 2006 0 580 195 56 880 340
Lower Sacramento Valley 83 March–June 2005 60 1264 281 112 1760 469
Sierra Nevada 84 June–October 2008 10 470 122 55 930 355
Modoc Plateau and Cascades
90 July–October 2010 3 2546 227 56 2664 388
Source: USGS 2011, 2010, and 2013b.
3.2.4.1 Northern Sacramento Valley The 1,180‐square‐mile study unit of Northern Sacramento Valley encompasses parts of Shasta and Tehama Counties and eleven groundwater subbasins: Enterprise, Millville, South Battle Creek, Bend, Antelope, Dye Creek, Los Molinos, Red Bluff, Bowman, Rosewood, and Anderson. This study unit has the same Mediterranean climate as that of the Southern and Middle Sacramento Valley study units: hot, dry summers and cool, moist winters with an average annual rainfall of 21 to 33 inches USGS 2011).
Surface water across the unit drains into the Sacramento River. Sources of groundwater recharge are direct infiltration of precipitation, river and stream flow draining the Sierra Nevada and the Coast Ranges, and
SECTION 3 OVERVIEW OF WELL NETWORKS
3-8 WBG091013074126SAC
agricultural irrigation return flow. The primary sources of groundwater discharge are pumping for irrigation and municipal water supply, evaporation from areas with a shallow depth to water, and discharge to streams. Land use in this area is mostly natural grassland (61 percent), 9 percent urban, and 30 percent dedicated to agriculture. Redding is the largest urban area in this study unit.
Groundwater samples were analyzed for over 275 constituents and additional field water‐quality indicators were investigated. Groundwater samples were analyzed for volatile organic compounds, pesticides and pesticide degradates, pharmaceutical compounds, constituents of special interest (perchlorate and N‐nitrosodimethylamine [NDMA]), nutrients, major and minor ions, trace elements, radioactivity, and microbial constituents. Most constituents that were detected in groundwater samples were found at concentrations below drinking‐water thresholds. Sampling took place between October 2007 and January 2008 (USGS 2011). A summary of the well construction information for this network is given in Table 3‐4. Wells are plotted on Figure 3‐4.
3.2.4.2 Middle Sacramento Valley The USGS GAMA’s Middle Sacramento Valley study unit is an area of 3,340 square miles encompassing seven counties (Butte, Colusa, Glenn, Sutter, Tehama, Yolo, and Yuba) and eight groundwater subbasins (East Butte, North Yuba, South Yuba, Sutter, Vina, West Butte, Colusa, and Corning). The study unit extends in the north‐south direction for a distance of approximately 90 miles along the Sacramento River, and in the west‐east direction for approximately 40 miles between the Coast Ranges on the west and the Sierra Nevada on the east. The area’s weather is similar to the Mediterranean climate of the Southern Sacramento Valley, with hot, dry summers and cool, moist winters. Here, average annual rainfall ranges from 17 to 32 inches.
This study unit is more agricultural than the Southern Sacramento Valley at 67 percent, with a less distinguishable urban presence primarily at the cities of Chico and Yuba (3 percent), and also has a significant portion of land use maintained naturally (30 percent, primarily grassland).
Groundwater samples were analyzed for synthetic organic constituents (volatile organic compounds [VOCs], gasoline oxygenates and degradates, pesticides and pesticide degradates, and pharmaceutical compounds), constituents of special interest (perchlorate, N‐nitrosodimethylamine [NDMA], and 1,2,3‐trichloropropane), inorganic constituents (nutrients, major and minor ions, and trace elements), radioactive constituents, and microbial indicators, as well as naturally occurring isotopes (tritium, and carbon‐14, and stable isotopes of hydrogen, oxygen, nitrogen, and carbon), and dissolved noble gases. Most constituents that were detected in groundwater samples were found at concentrations below drinking‐water thresholds (USGS 2011). A summary of the well construction information for this network is given in Table 3‐4. Wells are plotted on Figure 3‐4.
3.2.4.3 Southern Sacramento Valley The USGS GAMA groundwater quality program identifies the Southern Sacramento Valley study unit as a 2,100‐square‐mile area encompassing Placer, Sacramento, Solano, Sutter, and Yolo Counties. Five subbasins (North American, Solano, South America, Suisun‐Fairfield, and Yolo) provide groundwater to the Southern Sacramento Valley. The study unit is bounded to the west by the Northern Coast Ranges, to the east by the Sierra Nevada, to the north by the central Sacramento Valley, and to the south by the Sacramento–San Joaquin Delta and the San Joaquin Valley. There is an average annual rainfall ranging from 17 to 23 inches, with more rain on the western and eastern sides of the valley than in the central region. The area has a Mediterranean climate with cool, moist winters and hot, dry summers.
The study unit is drained by several water bodies. The Bear, American, and Cosumnes Rivers, as well as their tributaries, drain the eastern portions of the study unit, while the western portion is drained by Putah and Cache Creeks and other smaller tributaries. These rivers, creeks, and tributaries eventually drain into the Sacramento River, the Sacramento–San Joaquin Delta, and the San Francisco Bay estuary. Southern Sacramento Valley land use is primarily agricultural (53 percent), 33 percent natural (consisting primarily of grassland), and 14 percent urban. The City of Sacramento is the largest urban area in the study unit.
The ground‐water samples were analyzed for a large number of man‐made organic constituents (VOCs, pesticides and pesticide degradates, pharmaceutical compounds, and wastewater‐indicator constituents), constituents of
SECTION 3 OVERVIEW OF WELL NETWORKS
WBG091013074126SAC 3-9
special interest (perchlorate, N‐nitrosodimethylamine [NDMA], and 1,2,3‐trichloropropane [1,2,3‐TCP]), naturally occurring inorganic constituents (nutrients, major and minor ions, and trace elements), radioactive constituents, and microbial indicators. Most constituents that were detected in groundwater samples were found at concentrations below drinking‐water thresholds (USGS 2011). A summary of the well construction information for this network is given in Table 3‐4. Wells are plotted on Figure 3‐4.
3.2.4.4 Sierra Nevada The USGS GAMA groundwater quality program identifies the Sierra Nevada study unit as a 25,500‐square‐mile area containing parts of the following counties: Lassen, Plumas, Butte, Sierra, Yuba, Nevada, Placer, El Dorado, Amador, Alpine, Calaveras, Tuolumne, Madera, Mariposa, Fresno, Inyo, Tulare, and Kern. The unit contains 22 groundwater basins and 61 watersheds. However, 97 percent of the study area consists mostly of areas not mapped as groundwater basins.
The study unit is bounded to the west by the eastern limit of the sediments of the Central Valley, to the east by the Basin and Range province and the Nevada state line, to the south by the Desert province, and to the north by the Modoc Plateau. Average annual rainfall ranges from 10 to 80 inches, which varies by elevation and latitude. The area has a Mediterranean climate with cool, moist winters and hot, dry summers. The Sierra Nevada study area contains a broad range of geologic, hydrologic, and land use settings. Runoff from Sierra Nevada watersheds, primarily snow melt, provides approximately 50 percent of California’s developed water.
Groundwater samples were analyzed for organic constituents (VOCs, pesticides and pesticide degradates, and pharmaceutical compounds), constituents of special interest (N‐nitrosodimethylamine [NDMA] and perchlorate), naturally occurring inorganic constituents (nutrients, major ions, TDS, and trace elements), and radioactive constituents (radium isotopes, radon‐222, gross alpha and gross beta particle activities, and uranium isotopes). All organic constituents and most inorganic and radioactive constituents that were detected in groundwater samples were detected at concentrations lower than regulatory and non‐regulatory health based standards. Constituents that exceed the health‐based benchmarks include arsenic, gross alpha particle activity, boron, fluoride, uranium, radon‐222, and selenium (USGS 2010).
3.2.4.5 Modoc Plateau and Cascades The 15,000‐square‐mile study unit of the Cascade Range and Modoc Plateau (CAMP) study area is located in parts of Butte, Lassen, Modoc, Plumas, Shasta, Siskiyou, and Tehama Counties. It is bounded on the west by the Klamath Mountain province, to the south by the Sierra Nevada province, to the southwest by the Central Valley province, to the north by the Oregon state line, and to the east by the Nevada state line. The climate in the study unit varies with elevation and longitude. Precipitation is greatest on the western side of the study unit, with the upper elevations of Lassen Volcanic National Park receiving up to 120 inches per year. The central and eastern parts of the study unit are in the rain shadow of the Cascade Range, and average annual precipitation ranges from 10 to 20 inches per year. The central and eastern part of the study area is classified as high, cold desert.
The CAMP study unit contains parts of three major watersheds: Sacramento River watershed, Klamath River watershed, and the closed basins of the north Lahontan region. The CAMP study unit consists of volcanic and sedimentary rocks and deposits.
Groundwater samples were collected from 90 wells and springs in the CAMP study unit. Groundwater samples were analyzed for field water‐quality indicators, organic constituents, perchlorate, inorganic constituents, radioactive constituents, and microbial indicators. Concentrations of all detected constituents were less than regulatory and non‐regulatory health‐based benchmarks, and were less than 1/10 of benchmark levels (USGS 2013b). A summary of the well construction information for this network is given in Table 3‐4. Wells are plotted on Figure 3‐4.
3.2.5 USGS NAWQA The USGS conducted a groundwater quality study on the southeastern side of the Sacramento Valley in 1996 as part of the National Water Quality Assessment Program (NAWQA). This program focused on sampling existing shallow domestic wells in the Sacramento Subunit Area.

SECTION 3 OVERVIEW OF WELL NETWORKS
3-10 WBG091013074126SAC
The NAWQA Sacramento Subunit Area, which comprises about 1,700 square miles and includes intense agricultural and urban development, was chosen for the program because it had the largest amount of groundwater use in the SVGB. The objective of a study‐unit survey was to assess the overall water quality in the aquifers that supply the highest amount of drinking water within the study basin. For this study, 29 shallow domestic and 2 monitoring wells were sampled (USGS 2001). The data from this network provide additional information on groundwater quality in shallow groundwater in and around rice land use areas. These wells were sampled twice by the NAWQA program: once in 1996 and again in 2008.
Generally, the network extends from Butte County to Sacramento County to the east of the Sacramento River. The 31 wells sampled ranged from approximately 70 to 260 feet deep. USGS analyzed groundwater samples from these wells for 6 field measurements, 14 inorganic constituents, 6 nutrient constituents, organic carbon, 86 pesticides, 87 volatile organic compounds, tritium (hydrogen‐3), radon‐222, deuterium (hydrogen‐2), and oxygen‐18.
3.2.6 DWR The DWR Water Data Library is an online tool that provides access to monitoring data for groundwater levels and quality via an interactive map. However, large data downloads from this online portal can become cumbersome, and contacting a DWR database manager is a more effective route to get access to the data in a user‐friendly format. The DWR wells monitored for water quality (specific conductivity, nitrate, or TDS) are shown on Figure 3‐5. This figure shows that DWR samples wells primarily in the designated groundwater basins that provide the most water supply. In addition, DWR has a dedicated groundwater level and quality monitoring network program at select multi‐completion wells located in the SVGVB. A few of those have been identified and are shown separately on Figure 3‐5.
3.2.7 DPR DPR performs monitoring and obtains pesticide sampling data from other agencies, including CDPH, USGS, and DWR. These data are incorporated into the DPR Well Inventory Database. DPR implements the Well Inventory Database to fulfill its obligations under the Pesticide Contamination Prevention Act (PCPA) as part of its Groundwater Protection Program.
DPR began addressing pesticide contamination of groundwater in the early 1980s in response to the discovery of groundwater contamination resulting from legal application of the soil fumigant and nematocide dibromochloropropane (DBCP). Reports of additional pesticides in groundwater led to the passage of the PCPA in 1985. The purpose of the PCPA is to prevent further pollution by agricultural pesticides of groundwater used for drinking water supplies. It established a program that required DPR to implement the following program of study:
Obtain environmental fate and chemistry data for agricultural pesticides before they can be registered for use in California
Identify agricultural pesticides with the potential to pollute groundwater
Sample wells for presence of agricultural pesticides in groundwater
Obtain, report, and analyze the results of well sampling for pesticides conducted by public agencies
Formally review detected pesticides to determine whether their continued use can be allowed
Adopt use modifications to protect groundwater from pollution if the formal review indicates that continued use can be allowed
SECTION 3 OVERVIEW OF WELL NETWORKS
WBG091013074126SAC 3-11
The records included in the DPR Well Inventory Database were collected by the various agencies consistent with their own programs and obligations. The database is a central statewide clearinghouse for pesticide data. The following briefly describes the purpose of each of the datasets included in the database:
DPR performs monitoring based on its evaluation of pesticide risk and historical data, and to address data gaps and follow‐up data needs.
CDPH regulates public (municipal) water systems, which are required to monitor their drinking water supply wells and report the results directly to CDPH. The list of analytes in public supply sampling includes those that are required by regulation and those identified by the municipal supplier for analysis. Well water quality monitoring data are reported to CDPH by municipal water suppliers, and the pesticide data are reported to DPR by CDPH.
DPR coordinates with USGS to incorporate the results of its pesticide groundwater analysis into the statewide database.
DPR provided the well inventory database for its groundwater protection program with the most recent available data. The earliest record dates to October 1983. Well depths are not included in the database because such information is considered confidential under DPR’s interpretation of California law. Likewise, precise location data are confidential; therefore, the location of each well is provided as the centroid of section in which the well is located. The network of wells included in the DPR Well Inventory Database is geographically extensive, and includes areas where farm lands do not predominate.
3.2.8 Well Networks Summary Regional databases of groundwater quality data maintained by state and federal agencies generally include much information and cover large areas of the Valley floor, but often do not include well construction information, which limits the defensibility of groundwater vulnerability analysis. In addition, limited trend data are available because multiple samples over a finite period of time are not available at many locations. Table 3‐5 summarizes the regional datasets that were included for evaluation in this GAR vulnerability analysis.
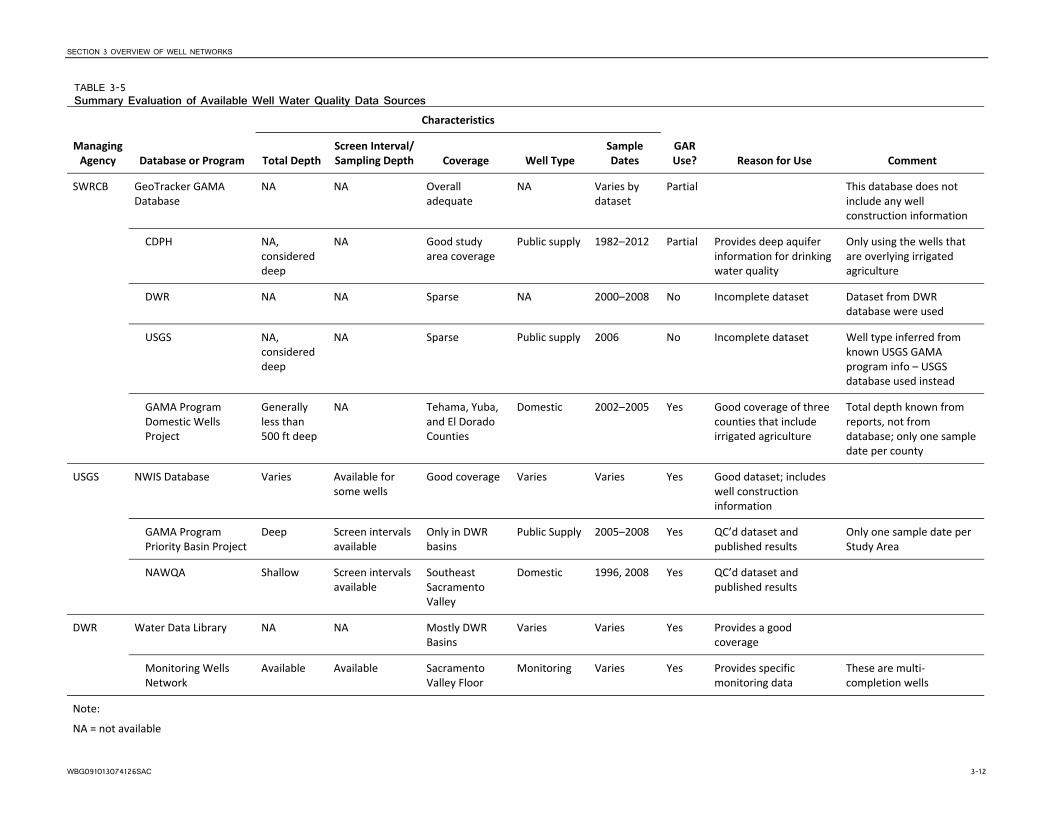
SECTION 3 OVERVIEW OF WELL NETWORKS
WBG091013074126SAC 3-12
TABLE 3-5 Summary Evaluation of Available Well Water Quality Data Sources
Managing Agency Database or Program
Characteristics
GAR Use? Reason for Use Comment Total Depth
Screen Interval/Sampling Depth Coverage Well Type
Sample Dates
SWRCB GeoTracker GAMA Database
NA NA Overall adequate
NA Varies by dataset
Partial This database does not include any well construction information
CDPH NA, considered deep
NA Good study area coverage
Public supply 1982–2012 Partial Provides deep aquifer information for drinking water quality
Only using the wells that are overlying irrigated agriculture
DWR NA NA Sparse NA 2000–2008 No Incomplete dataset Dataset from DWR database were used
USGS NA, considered deep
NA Sparse Public supply 2006 No Incomplete dataset Well type inferred from known USGS GAMA program info – USGS database used instead
GAMA Program Domestic Wells Project
Generally less than 500 ft deep
NA Tehama, Yuba, and El Dorado Counties
Domestic 2002–2005 Yes Good coverage of three counties that include irrigated agriculture
Total depth known from reports, not from database; only one sample date per county
USGS NWIS Database Varies Available for some wells
Good coverage Varies Varies Yes Good dataset; includes well construction information
GAMA Program Priority Basin Project
Deep Screen intervals available
Only in DWR basins
Public Supply 2005–2008 Yes QC’d dataset and published results
Only one sample date per Study Area
NAWQA Shallow Screen intervals available
Southeast Sacramento Valley
Domestic 1996, 2008 Yes QC’d dataset and published results
DWR Water Data Library NA NA Mostly DWR Basins
Varies Varies Yes Provides a good coverage
Monitoring Wells Network
Available Available Sacramento Valley Floor
Monitoring Varies Yes Provides specific monitoring data
These are multi‐completion wells
Note:
NA = not available

WBG091013074126SAC 4-1
SECTION 4
Vulnerability Analysis Approach The following discussion first explains the overall approach for applying data sources and assessing vulnerability to comply with the needs of developing the GAR per the WDR requirements. Next, it describes how the vulnerability assessment was organized and conducted across the study area’s valley floor area and for each of the 13 subwatersheds. Detailed data descriptions and assumptions for the analysis are provided.
4.1 Overview of Approach The GAR analysis is regional in nature, with an emphasis on identifying areas of known groundwater quality vulnerability to impacts from irrigated agriculture. The GAR provides the basis for a regional prioritization of monitoring, as well as identification of areas subject to the Groundwater Quality Management Plan and Management Practices Evaluation Programs (MPEP) implementation requirements of the WDR.
The technical analysis presented here evaluates land use in conjunction with soils and agronomy information and reviews potential hydrogeologic vulnerabilities to identify practices or physical characteristics that pose a greater risk to groundwater quality impact than other areas. Further analysis then pairs these results with groundwater quality data to refine the vulnerability conclusions and present information at the subwatershed level.
The technical approach was developed to:
Collectively consider the agronomic, soils and hydrogeology, and geographic/land use factors to consider groundwater vulnerability to water quality degradation
Perform a detailed evaluation of groundwater quality data
Groundwater quality for nitrate and salinity was evaluated with detailed mapping (geographic representation) and graphical analysis (trends)
Groundwater quality for pesticides was reviewed from DPR datasets
Groundwater quality for other constituents was evaluated based on information contained in other reports (GWMPs, DWR and USGS studies)
Use several lines of evidence to develop vulnerability conclusions:
Hydrogeology (geology, recharge rates, depth to groundwater)
Soils (texture and drainage class)
Agronomy and nutrient management practices
Irrigation methods
Groundwater quality
4.1.1 Evaluation of Factors Contributing to Groundwater Quality Vulnerability The intrinsic susceptibility of a groundwater basin to contamination is directly related to the ease with which water reaches and moves through the aquifer, and is dependent on properties and characteristics such as recharge rate, the presence or absence of an overlying confining layer, groundwater travel time, thickness and characteristics of the unsaturated zone, and groundwater pumping (USGS 2012). Further, aquifers can be suscep‐tible to contamination but may not be considered vulnerable until a contaminant source is present. “The vulnerability of groundwater to contamination is the probability for contaminants to reach a specific part of an aquifer after being introduced, usually at the land surface. Vulnerability is dependent on the properties of the groundwater system (susceptibility), the proximity of contaminant sources, and the contaminant’s chemical characteristics” (USGS 2012).
The susceptibility of groundwater quality to potential impacts from irrigated agriculture is based on a combination of factors, including intrinsic and anthropogenic factors. Intrinsic factors include hydrogeologic and soil conditions,

SECTION 4 VULNERABILITY ANALYSIS APPROACH
4-2 WBG091013074126SAC
the presence of naturally occurring contaminants, and geochemical characteristics. Anthropogenic factors include crop, irrigation, nutrient, and pesticide management. Groundwater quality observations provide an important source of information on the vulnerability and impacts of past land use practices.
Based on the knowledge of aquifer susceptibility and vulnerability to water quality degradation, the major factors analyzed in the GAR relate to hydrogeology, soil type, crop type, irrigation methods, and groundwater quality constituents of concern (primarily nitrate, salinity, and pesticides). Evaluating these factors individually, and in combination, enables a location specific assessment of groundwater quality susceptibility and vulnerability to be performed.
4.1.2 Regional Characteristics The characteristics of the Study Area create clear delineations of how groundwater quality is assessed because of the following variables:
Large geographic area
Crop diversity
Crop rotations in some areas
High rate of natural and artificial recharge to groundwater
Important surface water/groundwater interactions
Areas of shallow groundwater (for example in the Delta area and near rivers)
Coalition crop types interspersed with large areas of rice crops and flooded wildlife refuges
Lack of groundwater quality data in some upland areas
Legacy groundwater quality impacts
Thus, there is an inherent need to extrapolate from selected representative areas or data points to other areas in cases where data are not available or are insufficient to draw adequate conclusions.
4.2 Vulnerability Assessment Approach The purpose of this section is to provide the detailed description and assumptions used in compiling, summarizing, and evaluating the data collected during development of the GAR.
Due to the breadth and distinguishing physical characteristics of the study area, the vulnerability analysis is grouped into areas of similar hydrogeological and land use characteristics and also takes into account the nature, quality, and amount of available data. Based on these factors, the technical analysis was divided into the two main regions:
The Sacramento Valley floor: it encompasses one large alluvial groundwater basin, includes the most densely farmed area of the Sacramento River Watershed, and has the largest amount of available data for a robust technical analysis.
Upland bedrock and mountain valley areas (Upper subwatersheds): complex hydrogeology with sparse irrigated agriculture and limited data availability. The analysis for these regions is based on a more qualitative method.
Further, the results are evaluated at a subwatershed scale, as described below.
4.2.1 Subwatershed Scale Analysis The subwatershed‐scale analysis approach enables stakeholder outreach and implementation prioritization, and leverages the existing organizational structure of the SVWQC.
The subwatersheds were grouped by regional similarities—valley floor (or portions of the valley floor) and upper subwatersheds—and results are presented in the following sections in alphabetical order for each of the two regions, as shown in Table 4‐1. The factors evaluated in this technical analysis are further described below.

SECTION 4 VULNERABILITY ANALYSIS APPROACH
WBG091013074126SAC 4-3
TABLE 4-1 Grouping and Order of Subwatershed Sections in the GAR
Valley Floor (or portions of Valley Floor) Subwatersheds Upper Subwatersheds
Butte ‐Yuba‐ Sutter El Dorado
Colusa Glenn Goose Lake
Dixon/Solano Lake
Placer‐Nevada‐South Sutter‐North Sacramento Napa
Sacramento‐Amador Pit River
Shasta‐Tehama Upper Feather River
Yolo
4.2.2 Hydrogeology Consideration of hydrogeologic factors allows a review of subsurface properties and conditions that are relatively independent of man‐made (or anthropogenic) influence. For the GAR analysis, these factors include:
Depth to Water Table: The depth to the water table gives an indication of the vertical distance water (and dissolved constituents) need to travel in the unsaturated zone before reaching groundwater. The deeper the groundwater, the longer it takes for a constituent to reach the water table, allowing more time and opportunities for degradation and dilution. The opposite occurs when water levels are shallow.
Recharge Rate: Recharge, or deep percolation of precipitation and applied water from irrigation, occurs at varying rates based on the local climate, the crop irrigation needs, and the local geologic materials. A higher recharge rate means that water and dissolved constituents travel more rapidly to the water table than areas that have lower recharge rates.
Hydraulic Conductivity: The hydraulic conductivity of aquifer materials refers to the ease with which groundwater and dissolved constituents move through the subsurface. It is expressed in units of velocity to show the relative speed at which fluids move in the subsurface media (given similar hydraulic gradients, aquifer geometry, and transport porosity). A higher hydraulic conductivity means that constituents can move faster through the subsurface, whereas low hydraulic conductivity means that constituents move more slowly and may be subject to more extensive degradation during travel through the aquifer.
Aquifer Media: The properties of subsurface materials play an important role in transmitting water and dissolved constituents or impeding their flow. For example, alluvial materials and stream channel deposits generally have a higher transmissivity and provide a higher susceptibility for groundwater contamination than upland soils that are typically composed of less permeable, less transmissive materials.
Soil Media: The review of surface soils properties provide an understanding of the relative drainability of the soils. Soils that are well drained tend to promote the infiltration of water and constituents that can ultimately reach the groundwater table. On the contrary, soils that are poorly drained impede the flow of water into the subsurface.
Information on depth to water is usually provided from water level measurements at groundwater wells, which can also provide information on seasonal fluctuations of water levels at the monitored wells. Alternatively, modeling tools can be used to assess general regional depth to groundwater, if the model has been calibrated to observed groundwater level data.
Recharge rates are more difficult to estimate from basic measurements at a well. Recharge rates are typically estimated by direct field testing of infiltration rates, or the application of modeling tools that evaluate the overall
SECTION 4 VULNERABILITY ANALYSIS APPROACH
4-4 WBG091013074126SAC
groundwater budget and provide estimates of recharge rates that are consistent with known precipitation rates and irrigation practices, and are calibrated to observed seasonal groundwater level fluctuations.
Hydraulic conductivity can be estimated at the field scale by performing aquifer tests and measuring the drawdown response of the aquifer to pumping in both the pumping well and nearby observation wells. For a more generalized and regional scale analysis, numerical groundwater flow models are often used to estimate the hydraulic conductivity of an aquifer system through model calibration to measured groundwater elevations, flow rates, and other available calibration target information.
Aquifer media and soil media properties can be determined through field and laboratory investigations. Aquifer media refers to the consolidated or unconsolidated rock materials (e.g., sand and gravel, limestone) present in the subsurface and which form an aquifer. Aquifer media influence the groundwater flow system and attenuation potential, among other characteristics. Information on aquifer media can be found in published hydrologic or hydrogeologic reports such as those published by USGS or DWR. Soil media have a significant impact on the amount of recharge that can infiltrate into the subsurface and reach the water table, and therefore the ability for a contaminant to move vertically into the subsurface. Soil surveys published by the NRCS in forms of maps and geospatial information can be used for the identification of soil types and drainage characteristics in the study area.
4.2.3 Soils and Agronomy Agronomic components include a mix of natural and anthropogenic data types. Soils are an intrinsic parameter, similar to hydrogeology. However, the type of soils available in a region influence the types of crops that can be grown. In turn, the type of crop, soils, and the proximity of a water source (groundwater or surface water) often influence the irrigation practices in a region. These factors together determine the potential influence of irrigated agriculture on groundwater vulnerability to water quality degradation.
Soils that are more permeable and with lower rates of mineralization of nitrate create a more vulnerable environment for groundwater impact than less permeable soils. Crops with deeper rooting depths and higher rates of nitrogen uptake create less vulnerability than crops with shallower root systems and low nitrogen uptake. Irrigation practices that involve surface irrigation or flooding of fields create a higher risk to groundwater contamination than low‐volume irrigation practices such as sprinkler and drip irrigation, since they generally create less uniform and higher recharge rates to groundwater (see hydrogeology description above).
Detailed assumptions and limitations of the land use and irrigation practices data used for this analysis are presented in Appendix B.
The soil and agronomy factors are analyzed using the Nitrogen Hazard Index (NHI) tool, which was developed by a team of scientists at UC Riverside (UC‐ANR IWR 2013). This tool includes coefficients developed specifically for California soils, crops, and farming practices. The tool has been peer‐reviewed and used by others (Letey and Vaughan 2013). A detailed description of the tool’s assumptions is provided below. A number of other tools were also considered for this analysis, but the NHI tool was considered to be the most appropriate and relevant for this GAR, and the analysis related to groundwater nitrate vulnerability.
4.2.3.1 Vulnerability Screening Tool Evaluation and Application UC‐ANR and University of California’s Institute for Water Resources’ (IWR) Nitrate Leaching Potential Hazard Index (NHI) Tool was selected as a screening tool to initially identify areas vulnerable to groundwater contamination based on soil and crop distribution, as well as primary irrigation methods. The tool allows for the consideration of the combined effects of crop and root characteristics, soil texture and drainage, and irrigation methods on potential nitrate leaching. The tool bases groundwater vulnerability exclusively on factors that influence the likelihood of nitrate losses to groundwater from the cropping system.
A number of other tools and applications were evaluated for the assessment of nitrogen leaching hazards to groundwater based on crop cover and soils characteristics. Two of these nitrogen tools are available from the ARS/NRCS and are summarized below.
SECTION 4 VULNERABILITY ANALYSIS APPROACH
WBG091013074126SAC 4-5
4.2.3.2 Nitrogen Index 4.1 This tool allows entry of information about:
Soil (up to 3 soil layers; including percent organic matter, NO3, NH4, bulk density, pH)
Irrigation practice (including inches of applied water, and concentration of organic N and NO3 in the water)
Cropping (current and previous crop, rooting depth, yield)
Hydrogeologic factors (travel time to aquifer, position of aquifer, vulnerability of aquifer)
Water management, hydrology (precipitation, climate, hydrology), and qualitative factors (buffers, runoff class, rooting depths, etc.).
This tool requires numerous detailed inputs that are not available at this time for the GAR development and also was too detailed and above and beyond the scope of the analysis required for the GAR.
4.2.3.3 NLEAP 4.2 This tool can be used to determine nitrogen leaching. It can be tied to a SSURGO soil database file (soil survey data), and the user can apply different management scenarios to determine N output. NLEAP outputs include N loss graphs and estimates of N losses. Its emphasis on management practices requires detailed knowledge of the agronomy for each crop, which is not currently readily available on a region‐wide basis for the Sacramento River Watershed.
4.2.3.4 NHI Tool In the late 1990s, the SWRCB appointed the Nutrient Technical Advisory Committee (TAC) to develop a California‐based nutrient management tool for farmers. TAC proposed a nitrate groundwater pollution hazard index for field‐scale application based on three data categories: soil, crop, and irrigation systems. The University of California’s IWR expanded on the hazard index to create a web‐based matrix tool with more detailed consideration for crop characteristics affecting nutrient uptake efficiency, nitrogen chemical transformations under various site and soil conditions, and irrigation method influences on nutrient losses. The tool is based on overlaying USDA soil classifications, crops, and irrigation methods to result in one relative hazard index number.
Ultimately, the tool provides a relative measure of groundwater susceptibility associated with specific site conditions and agricultural crop production practices by estimating the tendency or likelihood for nitrogen to be leached from the root zone and become susceptible to transport to underlying groundwater. The NHI tool was developed to simply estimate this probability or likelihood in a semi‐quantitative manner and does not consider other hydrogeologic factors that would influence the effect on nitrate mass losses from the root zone on nitrate concentrations in the underlying groundwater.
The influence of each of the three factors (soil class, crop, and irrigation method) depends on their respective risk score and the combination of the factors, which are described in more detail below.
4.2.4 Groundwater Quality The main constituents of concern generally associated with irrigated agriculture are nutrients found in fertilizers, salinity indicators, and pesticides. The focus of the GAR is to evaluate the susceptibility and vulnerability of the aquifers underlying irrigated agriculture to contamination by nitrate, which is typically introduced at the surface in the form of nitrogen fertilizers. Through the evaluation of results provided by the NHI tool and the measurement of nitrate concentrations in groundwater, conclusions can be drawn as to the susceptibility and vulnerability of groundwater quality to nitrate contamination.
Salinity impacts from agriculture are usually not a significant problem in regions that predominantly rely upon low salinity surface water sources, such as the Sacramento Valley. However, localized use of groundwater and the evapoconcentration of salts during irrigation can contribute to localized increases in groundwater salinity. In addition, natural background concentrations of salt indicators give an understanding of the vulnerability of the aquifer to salts. The same is true for other potential constituents of concern, such as arsenic and boron.
SECTION 4 VULNERABILITY ANALYSIS APPROACH
4-6 WBG091013074126SAC
4.2.4.1 Nitrate Nitrate is the main constituent of concern found in fertilizers, and has been detected at high concentrations in localized areas of the SVWQC area (as described above). Nitrate can be measured as nitrogen (N) or nitrate (NO3). Most readily available datasets report nitrate as NO3. Therefore, nitrate as NO3 is used for all data reporting in this GAR. The Maximum Contaminant Level (MCL) for nitrate as NO3 is established at 45 mg/L. For this analysis, the observed nitrate concentrations at wells throughout the study area are compared to the MCL to evaluate if groundwater beneficial uses are impaired or if high vulnerability areas to nitrate concentrations exist.
4.2.4.2 Salinity Salinity is usually indicated with measurements of Total Dissolved Solids (TDS) or Specific Conductivity (SC or EC). TDS is a more reliable measurement of salinity as it indicates the concentration of suspended solids in the water sample and is evaluated in a laboratory setting. TDS was used in this analysis to evaluate the salinity levels, when available. If a sample had SC data but no TDS data, the SC value was converted to TDS by multiplying the SC value (in µS/cm) by 0.64. This allowed for a larger dataset to be used for the analysis. The California secondary drinking water standard for TDS is recommended at 500 milligrams per liter (mg/L) (taste and odor threshold). The upper limit secondary MCL is 1,000 mg/L, and the short term secondary MCL is 1,500 mg/L. As a comparison, the non‐regulatory agricultural water quality goal is 450 mg/L, just slightly below the secondary MCL threshold.
4.2.4.3 Pesticides Pesticides are monitored, analyzed, and reported by the Department of Pesticides Regulation (DPR). The most recent data from DPR are summarized in Appendix J.
4.2.4.4 Other Additional constituents of concern, such as boron and arsenic, which are naturally occurring in the Sacramento Valley, are not specifically included into the quantitative vulnerability analysis. However, data from recent reports by public agencies (such as DWR and USGS) were reviewed and summarized as needed to establish further groundwater vulnerabilities at the sub‐regional level.
4.2.5 Assumptions and Limitations Each dataset comes with its own limitations, based on availability of data in each region of the Study Area, and the quality of the available data. In some cases, assumptions have to be established to move forward with the technical analysis. At each step of the analysis, assumptions will be described.
Data limitations include:
Well data at section level and no well depth information (summary provided in Section 3)
Availability of irrigated crop locations and irrigation practices information
Data gaps at the geographic level and the temporal level (most recent land use information is not always available)
Regionalization of approaches and data (especially for the agronomy evaluation)
Data compiled during the development of the GAR and through stakeholder outreach are integrated to evaluate the potential vulnerability to groundwater quality for irrigated agriculture lands in the SVWQC area.
The vulnerability assessment approach incorporates a quantitative analysis for the Sacramento Valley floor and a more qualitative analysis for the upper subwatersheds comprising upland bedrock and mountain valley areas. The vulnerability assessment is implemented on a subwatershed level, as each subwatershed has unique physical, climatic, and agronomic characteristics.
4.2.6 Sacramento Valley Floor Approach Seven subwatersheds are located entirely or in portions of the Sacramento Valley floor area: Shasta‐Tehama, Colusa‐Glenn, Butte‐Yuba‐Sutter, Yolo, Dixon/Solano, Placer‐Nevada‐S. Sutter‐N. Sacramento, and Sacramento‐Amador. The vulnerability analysis was performed at a section level (1 mile square) for each Public Land Survey

SECTION 4 VULNERABILITY ANALYSIS APPROACH
WBG091013074126SAC 4-7
System (PLSS) section of the valley floor that includes irrigated agriculture. The section‐level analysis enables scaling of all the data sources to the same spatial scale and geographic representation; in addition, some water quality data are only available at the section level, not at a discrete point. The three types of datasets that are used for the semi‐quantitative approach include:
4. Hydrogeology a. Depth to water b. Recharge rate c. Hydraulic Conductivity d. Aquifer media e. Soil media
5. Soils and Agronomy a. Crop type b. Soil type c. Irrigation practice
6. Groundwater quality a. Nitrate b. Salinity
The detailed assumptions used in this analysis are further described below.
4.2.6.1 Hydrogeology The hydrogeology susceptibility analysis was based on a modified version from the USEPA‐developed DRASTIC methodology (USEPA 1987). The parameters used in the original DRASTIC methodology and the ones used for the modified GAR methodology are summarized in the Table 4‐2. Each parameter has a weight associated with it in accordance to its relative importance or potential to facilitate groundwater quality degradation. Each parameter is also grouped into ranges of similar properties, and the ranges are assigned a rating. The rating determines the relative significance of each range with respect to groundwater pollution potential.
TABLE 4-2 Modified DRASTIC Methodology Applied to GAR Approach
Parameter Weight Data Sources and Assumptions
D: Depth to water (feet) 5 Use SACFEM April 2010 values
R: Average annual recharge rate (inch/yr)
4 Use SACFEM Water Year 2010 total values
A: Aquifer media 3 Use simplified Sacramento Valley physiographic provinces (DWR Bulletin 118‐6)
S: Soil media 2 Use NRCS Drainage Classes
T: Topography 1 Not used in GAR analysis; considered negligible impact
I: Impacts of Vadose Zone 5 Not used in GAR analysis; not enough readily available information
C: Hydraulic conductivity (ft/day) 3 Use SACFEM estimates
Depth to water, recharge rate, and hydraulic conductivity estimates are readily available from the SACFEM groundwater flow model, developed and recently updated and recalibrated by CH2M HILL. The SACFEM model is an application of the finite‐element code MicroFEM (Hemker and Nijsten 2003) and includes the entire Sacramento Valley aquifer. SACFEM incorporates the major streams, rivers, and canals in the Sacramento Valley, and estimates of urban and agricultural pumping based on crop distributions and population census data. The model was calibrated to groundwater levels from an extensive water level monitoring well network from the DWR. The period of simulation is 1970 to 2010, on a monthly time step basis. The SACFEM model has a more

SECTION 4 VULNERABILITY ANALYSIS APPROACH
4-8 WBG091013074126SAC
recent period of simulation and a more refined spatial discretization of the model domain than the publicly available USGS Central Valley Hydrologic Model (CVHM) (land use and hydrology in CVHM ends in 2003). In addition, SACFEM has been calibrated to more recent water levels and incorporates recent land use changes in the valley. SACFEM is a Sacramento Valley‐specific model that has been used for various Sacramento Valley groundwater studies and efforts in the past and it is widely accepted by stakeholders and state and federal agencies.
For this analysis, depth to water values for April 2010 were extracted to represent the highest water elevations after spring runoff and before the irrigation season for the most recent year available in the model. Simulated recharge rate values for water year 2010 were extracted to evaluate the annual recharge rate under crop fields for the most recent year available in the model. Hydraulic conductivity values from the calibrated model were extracted for the first layer in the model. Each nodal value was overlaid on a section grid and section averages were computed from this dataset for the sections that include irrigated agriculture acreage. Ratings were assigned to each hydrogeology parameter on a section level.
For aquifer media, a review of the physiographic provinces in the Sacramento Valley as defined by DWR (1978), was used to develop relative ratings for the five major categories of geologic materials. For soil media, the SSURGO database includes soil drainage classes (as described in Section 1) that were used here to assign relative ratings. Similarly to the data extracted from SACFEM, the geospatial coverage for each of these two datasets was overlain on the section grid to assign a rating to each section that includes irrigated agricultural acreage.
Tables 4‐3 through 4‐7 show the ranges and assigned ratings for each hydrogeology parameter.
TABLE 4-3 TABLE 4-4Ranges and Ratings for Depth to Water Ranges and Ratings for Drainage Classes
Range (feet) Rating Range Rating
0–5 10 Very poorly drained 1
5–15 9 Poorly drained 2
15–30 7 Somewhat poorly drained 3
30–50 5 Moderately well drained 5
50–75 3 Well drained 7
75–100 2 Somewhat excessively drained 9
>100 1 Excessively drained 10
TABLE 4-5 TABLE 4-6Ranges and Ratings for Aquifer Media Ranges and Ratings for Net Recharge
Range Rating Range (inch/year) Rating
Sutter/Orland Buttes 1 0–5 1
Low Hills, Dissected Uplands, Terraces
3 5–7 3
Flood Basins 5 7–10 6
Alluvial Plains and Fans 8 10–15 8
Stream Channels and Floodplains
10 >15 9

SECTION 4 VULNERABILITY ANALYSIS APPROACH
WBG091013074126SAC 4-9
TABLE 4-7 Ranges and Ratings for Hydraulic Conductivity
Range (GPD/ft2) Range (ft/day) Rating
1‐100 0.134–13.4 1
100‐300 13.4–40.2 2
300‐700 40.2–93.8 4
700‐1,000 93.8–134 6
1,000‐2,000 134–268 8
>2,000 >268 10
The following assumptions were employed to develop ranges and ratings for the GAR:
Depth to water: used DRASTIC suggested ranges and ratings
Drainage class: used professional judgment to determine appropriate ratings based on NRCS defined ranges
Aquifer media: used professional judgment to determine appropriate ranges and ratings
Net recharge: slightly modified DRASTIC suggested ranges and ratings for more appropriate values for Sacramento Valley characteristics
Hydraulic conductivity: used DRASTIC suggested ranges and ratings (after conversion of units to SACFEM units)
The ratings and weights of the various parameters are then combined into a single equation to determine the relative hydrogeologic (HG) susceptibility index, such as:
HG Index = 5*D(rating) + 4*R(rating) + 3*A(rating) + 2*S(rating) + 3*C(rating)
Once incorporated into a GIS layer, this index can be mapped and used to help identify areas that are more likely to be susceptible to groundwater water contamination relative to one another (USEPA 1987). Results are shown on Figure 4‐1.
Next, the soils and agronomic practices are evaluated to assess the vulnerability of irrigated lands due to these factors.
4.2.6.2 Soils and Agronomy As described above, the NHI tool was selected for the soil and agronomy analysis.
4.2.6.2.1 Crops
Crop hazard index ratings range from 1 to 4 and are individually assessed and assigned based on the following considerations:
Crop rooting depth
Ratio of nitrogen in crop tops to recommended nitrogen application
Fraction of crop top nitrogen removed from the field with marketable product
Magnitude of the peak nitrogen uptake rate
Whether the crop is harvested at a time when the nitrogen uptake rate is high.
The crop hazard is classified into indices ranging between 1 and 4. The higher the assigned crop hazard index, the higher the likelihood that production of that crop is susceptible to nitrogen losses to groundwater. Appendix G, Table 1, shows the rating associated with each crop in the SVWQC Study Area based on the database of the NHI Tool. Crops that were not originally listed in the tool’s database were assigned a value based on conversations
SECTION 4 VULNERABILITY ANALYSIS APPROACH
4-10 WBG091013074126SAC
with the tool’s developer. In addition, organic crops were given the same rating as the corresponding conventional crops.
4.2.6.2.2 Irrigation Methods
The irrigation hazard is classified into an index ranging from 1 to 4 based on the irrigation method used. An irrigation hazard index of 1 is assigned to a micro‐irrigation system accompanied by fertigation, in which small amounts of water and nutrients can be frequently and uniformly applied in quantities matching the crop’s need with small deep percolation losses. On the opposite extreme, an irrigation hazard index of 4 is assigned to furrow or surface irrigation (also referred to as flood irrigation) systems, which generally result in the least uniform and greatest deep percolation rates facilitating higher nutrient losses to underlying groundwater. Based on the information received during stakeholder outreach, it was apparent that not enough information was available to determine where fertigation practices were in use. Therefore, for purposes of the GAR analysis, and using a conservative approach, the irrigation hazard index was based on a range from 2 to 4:
Irrigation Hazard Index of 2: micro‐irrigation or micro‐sprinklers
Irrigation Hazard Index of 3: sprinklers (all other types)
Irrigation Hazard Index of 4: furrow or flood irrigation
Irrigation practices in the SVWQC study area were gathered from two sources: (1) stakeholder input (subwatershed coordinators, Farm Advisors, County Farm Bureaus, RCDs), and (2) 2010 irrigation practices survey by DWR on common irrigation practices for crops grown in the Sacramento Valley (DWR 2011). Therefore, the classification and index were somewhat regionally specific, based on available information on agricultural and irrigation practices and, to some extent, water sources, and distribution systems. The input from subwatershed groups provided generalized information for each subwatershed for crops grown with certain practices within their boundaries, whereas DWR data were crop‐specific (percent distribution of different irrigation practices per crop type are reported), but did not distinguish between different areas within the Sacramento Valley. For the NHI analysis, subwatershed feedback was used first, and in areas where specific information was not available, DWR values were used (where the weighted average of each irrigation type percentage was used to determine the appropriate general irrigation index by crop type). It is noted that the farm management plans required under the LTILRP implementation will generate this type of information in the future.
4.2.6.2.3 Soils
The soil hazard index ranges from 1 to 5 based on the properties of soils that influence water and nitrogen movement and transformations in the subsurface. Soils classified with a soil hazard index of 1 are those that inhibit the flow of water and create an environment conducive to denitrification. Both denitrification and restrictive water flow decrease the potential migration of nitrate to groundwater. Conversely, soils classified with a soil hazard index of 5 are most vulnerable to groundwater degradation by nitrate because of the high surface infiltration rates, high transmission (permeability) rates throughout the profile, and low denitrification potential. Appendix G, Table G‐2, provides a more detailed description of the justifications for each of the soils classifications and respective classification factor.
The classification of soils on which irrigated agriculture exists in the SVWQC study area required some pre‐processing of existing geospatial soil information. SSURGO soil map units were extracted from the area of interest, and compared to the list of soil series given in the NHI tool. Soil map unit names matching a soil series in the NHI tool were assigned to that series (for example, the “Capay silty clay” map units were assigned to the “Capay” series in the tool). For soil map units with several named components (for example, the Altamont‐Dibble complex), the first named component was checked in the NHI first (as the first named component typically has the majority area). If that series was not available in the tool, the second named component was checked. If the soil map unit name did not match a soil series in the NHI tool, the area was not classified. Unclassified soils represent approximately 6 percent of the irrigated agriculture areas in the Study Area. Those areas were considered a data gap in the evaluation of agronomy and soils factors for the vulnerability analysis.
It should be noted that in areas where soils have been deep‐ripped and may have structurally changed, a different NHI evaluation is warranted. However, this information is not readily available on the spatial scale of this analysis

SECTION 4 VULNERABILITY ANALYSIS APPROACH
WBG091013074126SAC 4-11
and therefore was not taken into consideration for the final NHI calculation. In summary, the NHI Tool process is illustrated in a simple chart as shown below.
The multiplication of the three factors results in an overall nitrogen hazard index for a particular area, ranging between a minimum of 0 and a maximum of 80. In other words, the NHI GIS computations assign a risk score between 0 and 80, based on scoring determined for each individual component.
The final indices are grouped into three categories to identify relative areas of concern (as suggested by the authors of the tool):
Minor concern: hazard index between 0 and 20
Moderate concern: hazard index between 21 and 50
Major concern: hazard index between 51 and 80
The NHI score mapping is first developed at the field scale for each parcel given the identified irrigated crop. Subsequently, the field scores are area‐averaged over each section, similar to the hydrogeology factors, to provide a comparison of scores at the same scale as the hydrogeology scores. The NHI scores provide an indication of the geographic distribution of areas where aquifers are susceptible to groundwater contamination based on the past land use practices at the surface. Results are shown on Figure 4‐2.
The main NHI tool’s strengths include:
Location‐specific: crop and soil specific
Crop management considerations
Root‐zone science considerations
Current and potential risk assessment from soils and agronomy
Endorsed by local Farm Advisor
One of the main limitations of this tool relates to the fact that it does not consider crop rotations.
Crop
USDA Soil Class
Irrigation Method
Relative Nitrate Pollution
Hazard Index Rating
Groundwater Susceptibility: Likelihood for nitrogen to be leached from the root zone and become susceptible to transport to underlying groundwater

SECTION 4 VULNERABILITY ANALYSIS APPROACH
4-12 WBG091013074126SAC
4.2.6.3 Groundwater Quality Finally, an assessment of groundwater quality provides an indication of the vulnerability of the aquifer to existing contamination or the increase in concentration for certain constituents of concern.
Nitrate and TDS are evaluated with a similar geospatial analysis, which involves three steps:
1. Compile all relevant data from the available well networks after a thorough QC of the database information. Determine the most recent concentration at each well, and map the dataset on the Sacramento Valley floor. Data are color‐classified to show the wells that have a most recent value below the MCL, between half the MCL and the MCL, and above the MCL.
2. Use interpolation (with a kriging methodology in GIS) to approximate the constituent concentrations between known concentrations at available well locations. A 2‐mile buffer around each well with a measured concentration was deemed appropriate for the approximate computational representativeness for the aquifer surrounding that well.
3. Compute section averages of the interpolated groundwater concentrations. Some of the sections with irrigated agriculture areas are not represented by the 2‐mile buffer interpolated area, and thus represent a data gap for groundwater quality, with different areas for nitrate and TDS.
Data from the CDPH, DWR, USGS, and GeoTracker GAMA Domestic databases were evaluated together. Results are shown on Figure 4‐3.
In addition, where wells had more than five samples for nitrate and TDS, a statistical trend analysis of the data was performed using the Mann‐Kendall method. This method is a non‐parametric (for example, does not assume a distribution in the data) test for identifying trends in time‐series data. The test compares the relative magnitudes of sample data rather than the data values themselves. The nitrate and TDS concentrations were evaluated as an ordered time series by location where each concentration was compared with all subsequent data for each constituent. The initial value of the Mann‐Kendall statistic, S, was assumed to be 0 (that is, no trend). If a concentration from a later sampling event is higher than a concentration from an earlier sampling event, S is incremented by 1. Conversely, if the concentration from a later sampling event is lower than a concentration sampled earlier, S is decremented by 1. The final value of S is equal to the net result of all such increments and decrements. In addition to S, a confidence factor was estimated for each time series.
The Mann‐Kendall results were categorized for a given well as follows:
Probable increase: A time series with a positive S value and a confidence factor between 60 and 90 percent
Increase: A time series with a positive S value and a confidence factor greater than or equal to 90 percent
Probable decrease: A time series with a negative S value and a confidence factor between 60 and 90 percent
Decrease: A time series with a negative S value and a confidence factor greater than or equal to 90 percent
No trend: A time series with no statistically evident increase or decrease
4.2.6.3.1 Groundwater Quality Data Limitations
The data used in the water quality analysis include some limitations:
Some wells have samples (even the most recent) that are as old as from the 1930s, 1940s, or 1950s, which limits the analysis of current data.
There are limited trend data
The majority of the well sample data does not include sampling depth or well construction information, which limits the understanding of the depth of the water quality being analyzed.
These data limitations do not prevent a rigorous vulnerability analysis from being performed, as described below, with the integration of the susceptibility and water quality data and the refinement of conclusions to reflect local conditions at the subwatershed level.

SECTION 4 VULNERABILITY ANALYSIS APPROACH
WBG091013074126SAC 4-13
4.2.7 Upper Subwatersheds Approach For the remaining six subwatersheds that are not located on the valley floor (Goose Lake, Pit River, Upper Feather River, El Dorado, Lake, and Napa) and for the upland portions of subwatersheds that have a portion on the valley floor, a different type of approach is utilized for the vulnerability assessment.
Reasons for using a different approach than for the valley floor include:
Smaller irrigated agriculture acreages and less crop diversity
Significantly lower availability of hydrogeology and water quality information
Sparse USGS, DWR, CDPH datasets
General lack of local monitoring data
Fewer tools (no groundwater model)
Hydrogeology is more complex than valley floor
The vulnerability assessment in these upper subwatersheds focused on:
NHI evaluation results (same approach to valley floor)
Groundwater quality data as available, and also obtained from areas with similar cropping, soil, and irrigation practices
General understanding of hydrogeology from existing reports and existing depth to water contour maps
The qualitative review of the limited datasets enables an understanding of potential and existing vulnerabilities to groundwater contamination in the upland areas.
4.2.8 Pesticides Approach DPR performs monitoring and obtains pesticide sampling data from other agencies, including the California Department of Public Health (CDPH), USGS, and DWR. These data are incorporated into the DPR Well Inventory Database. DPR implements the Well Inventory Database to fulfill its obligations under the Pesticide Contamination Prevention Act (PCPA), as part of its Groundwater Protection Program.
DPR began addressing pesticide contamination of groundwater in the early 1980s in response to the discovery of groundwater contamination resulting from legal application of the soil fumigant and nematocide dibromochloropropane (DBCP). Reports of additional pesticides in groundwater led to the passage of the PCPA in 1985. The purpose of the PCPA is to prevent further pollution by agricultural pesticides of groundwater used for drinking water supplies. It established a program that required DPR to implement the following program of study:
Obtain environmental fate and chemistry data for agricultural pesticides before they can be registered for use in California
Identify agricultural pesticides with the potential to pollute groundwater
Sample wells for presence of agricultural pesticides in groundwater
Obtain, report, and analyze the results of well sampling for pesticides conducted by public agencies
Formally review detected pesticides to determine whether their continued use can be allowed
Adopt use modifications to protect groundwater from pollution if the formal review indicates that continued use can be allowed.
Parameters sampled include those identified by DPR for priority assessment and those selected for evaluation by other agencies. DPR maintains the Groundwater Protection List (GPL), pursuant to California Code of Regulations Title 3, Section 6800[b]. DPR publishes annual reports evaluating pesticide active ingredients and use information, and identifies pesticides with data exceeding Specific Numerical Values. The GPL includes two sections: (a) those pesticides detected in groundwater or soil pursuant to Section 13149 of the Food and Agriculture Code and (b) those pesticides identified pursuant to Section 13145(d) of the Food and Agricultural Code.
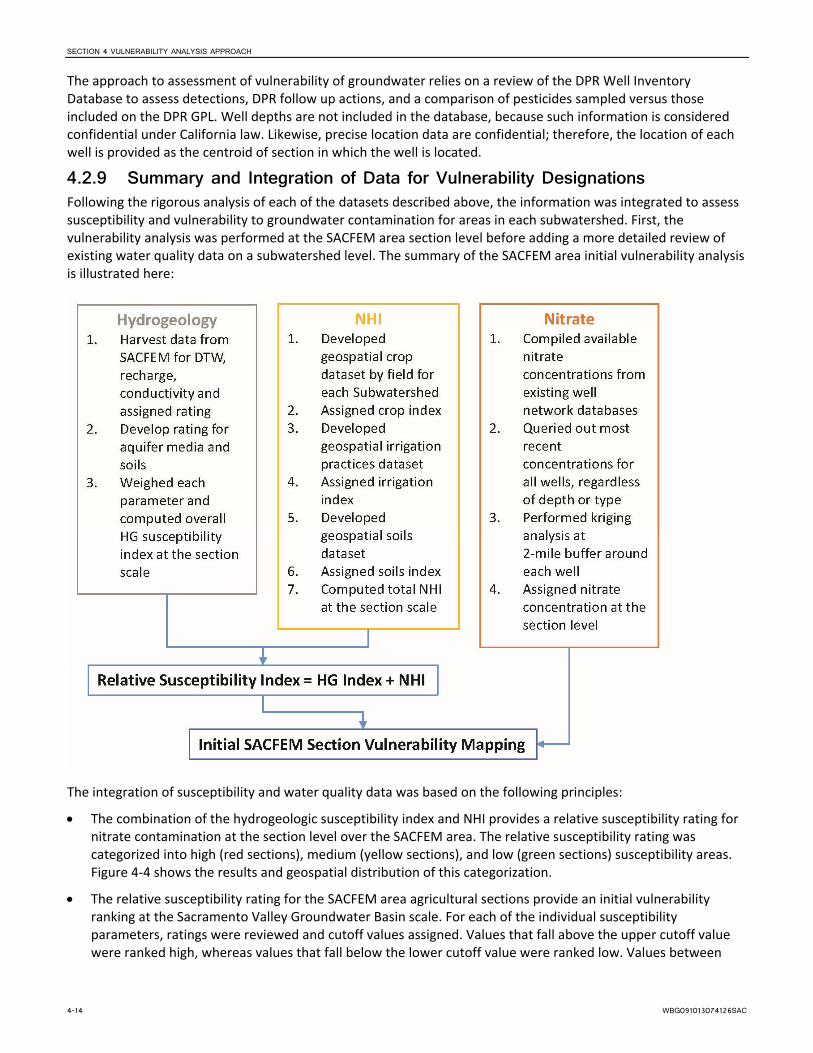
SECTION 4 VULNERABILITY ANALYSIS APPROACH
4-14 WBG091013074126SAC
The approach to assessment of vulnerability of groundwater relies on a review of the DPR Well Inventory Database to assess detections, DPR follow up actions, and a comparison of pesticides sampled versus those included on the DPR GPL. Well depths are not included in the database, because such information is considered confidential under California law. Likewise, precise location data are confidential; therefore, the location of each well is provided as the centroid of section in which the well is located.
4.2.9 Summary and Integration of Data for Vulnerability Designations Following the rigorous analysis of each of the datasets described above, the information was integrated to assess susceptibility and vulnerability to groundwater contamination for areas in each subwatershed. First, the vulnerability analysis was performed at the SACFEM area section level before adding a more detailed review of existing water quality data on a subwatershed level. The summary of the SACFEM area initial vulnerability analysis is illustrated here:
The integration of susceptibility and water quality data was based on the following principles:
The combination of the hydrogeologic susceptibility index and NHI provides a relative susceptibility rating for nitrate contamination at the section level over the SACFEM area. The relative susceptibility rating was categorized into high (red sections), medium (yellow sections), and low (green sections) susceptibility areas. Figure 4‐4 shows the results and geospatial distribution of this categorization.
The relative susceptibility rating for the SACFEM area agricultural sections provide an initial vulnerability ranking at the Sacramento Valley Groundwater Basin scale. For each of the individual susceptibility parameters, ratings were reviewed and cutoff values assigned. Values that fall above the upper cutoff value were ranked high, whereas values that fall below the lower cutoff value were ranked low. Values between
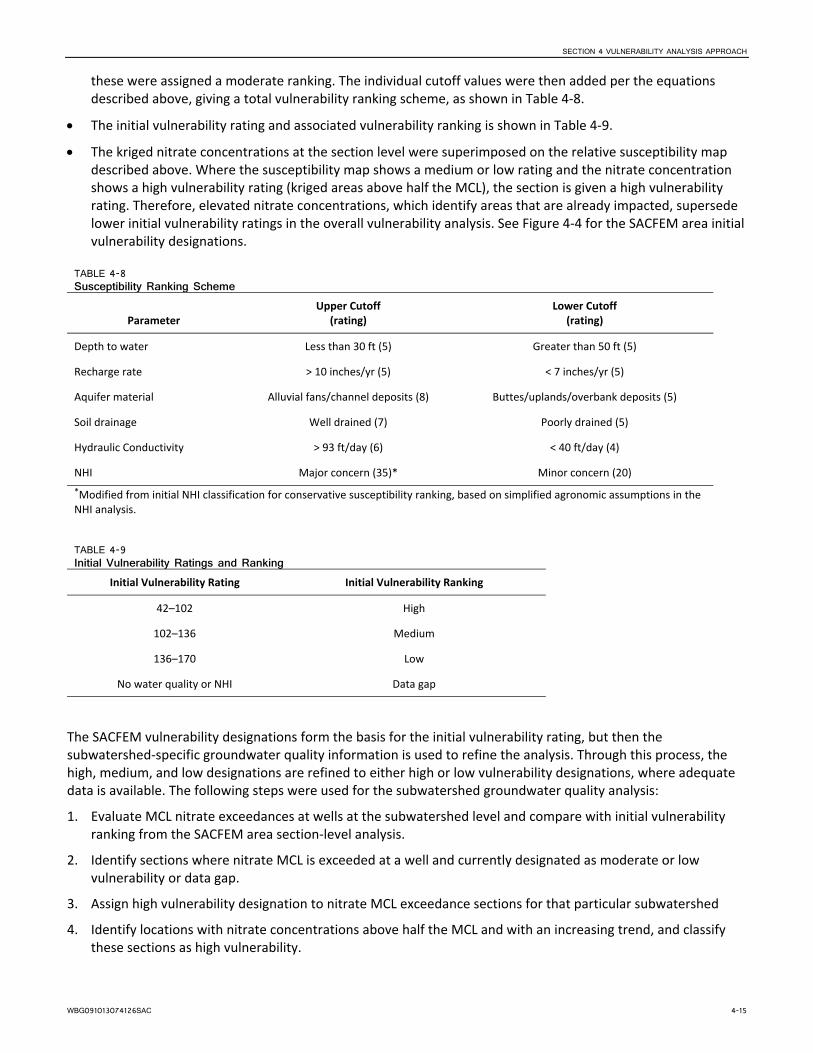
SECTION 4 VULNERABILITY ANALYSIS APPROACH
WBG091013074126SAC 4-15
these were assigned a moderate ranking. The individual cutoff values were then added per the equations described above, giving a total vulnerability ranking scheme, as shown in Table 4‐8.
The initial vulnerability rating and associated vulnerability ranking is shown in Table 4‐9.
The kriged nitrate concentrations at the section level were superimposed on the relative susceptibility map described above. Where the susceptibility map shows a medium or low rating and the nitrate concentration shows a high vulnerability rating (kriged areas above half the MCL), the section is given a high vulnerability rating. Therefore, elevated nitrate concentrations, which identify areas that are already impacted, supersede lower initial vulnerability ratings in the overall vulnerability analysis. See Figure 4‐4 for the SACFEM area initial vulnerability designations.
TABLE 4-8 Susceptibility Ranking Scheme
Parameter Upper Cutoff
(rating) Lower Cutoff
(rating)
Depth to water Less than 30 ft (5) Greater than 50 ft (5)
Recharge rate > 10 inches/yr (5) < 7 inches/yr (5)
Aquifer material Alluvial fans/channel deposits (8) Buttes/uplands/overbank deposits (5)
Soil drainage Well drained (7) Poorly drained (5)
Hydraulic Conductivity > 93 ft/day (6) < 40 ft/day (4)
NHI Major concern (35)* Minor concern (20)
*Modified from initial NHI classification for conservative susceptibility ranking, based on simplified agronomic assumptions in the NHI analysis.
TABLE 4-9 Initial Vulnerability Ratings and Ranking
Initial Vulnerability Rating Initial Vulnerability Ranking
42–102 High
102–136 Medium
136–170 Low
No water quality or NHI Data gap
The SACFEM vulnerability designations form the basis for the initial vulnerability rating, but then the subwatershed‐specific groundwater quality information is used to refine the analysis. Through this process, the high, medium, and low designations are refined to either high or low vulnerability designations, where adequate data is available. The following steps were used for the subwatershed groundwater quality analysis:
1. Evaluate MCL nitrate exceedances at wells at the subwatershed level and compare with initial vulnerability ranking from the SACFEM area section‐level analysis.
2. Identify sections where nitrate MCL is exceeded at a well and currently designated as moderate or low vulnerability or data gap.
3. Assign high vulnerability designation to nitrate MCL exceedance sections for that particular subwatershed
4. Identify locations with nitrate concentrations above half the MCL and with an increasing trend, and classify these sections as high vulnerability.

SECTION 4 VULNERABILITY ANALYSIS APPROACH
4-16 WBG091013074126SAC
5. For sections with wells that have nitrate concentrations above half the MCL and stable or decreasing concentration trends, or where wells have nitrate concentrations below half the MCL, the low susceptibility rating serves as the final vulnerability designation and the medium susceptibility ratings become low vulnerability designation for those sections.
This analysis is performed for each of the seven subwatersheds that have portions on the valley floor overlying the Sacramento Valley Groundwater Basin. The decision‐making process for the analysis is depicted in the following flow chart. For inconclusive results based on lack of data, the areas are considered a data gap, and additional assessment might be warranted.
Additional published information was reviewed to qualitatively assess if other factors or sources, besides agricultural operations, might be the sources of potential vulnerabilities or existing water quality impacts. These factors are not directly included into the vulnerability designation assessment; however, these other known water quality influencers will be used to help with monitoring implementation strategies. Additional factors (anthropogenic and natural) are considered for each subwatershed for the following types of categories, as applicable:
Anthropogenic:
Known septic tanks leakages
Known current or historic dairies

SECTION 4 VULNERABILITY ANALYSIS APPROACH
WBG091013074126SAC 4-17
Known historic contamination (for example fertilizer factory plumes or municipal wastewater ponds)
Irrigation source water quality that may result in an accumulation of naturally occurring constituents
Other urban‐footprint related items such as recycled water irrigation at industrial sites
Natural:
Known naturally occurring constituents from geologic materials
Hydrologic conditions that favor movement of certain natural constituents into areas of high quality groundwater
Conclusions were developed separately for each subwatershed based on mapping of data and review of existing information and other factors. A summary of vulnerability conclusions for the entire Sacramento River Watershed area is provided in Section 18.
This technical analysis was used to make vulnerability assessment conclusions and provide basic recommendations.


WBG091013074126SAC 5-1
SECTION 5
Butte/Yuba/Sutter Subwatershed This subwatershed section describes general background information related to geographic location, land use, and physical setting, as well as current groundwater quality monitoring programs. Next, results of the vulnerability analysis are presented, followed by conclusions on vulnerability designations and recommendations.
5.1 Background The Butte/Yuba/Sutter Subwatershed includes all of Butte and Yuba Counties and the majority of Sutter County, covering an area of approximately 1.8 million acres. Major rivers include the Sacramento, Feather, Yuba, and Bear, and major population centers are Chico, Oroville, and Yuba City.
This subwatershed is partially located on the Sacramento Valley floor, where most of the agricultural production occurs, and partially located in the northern Sierra Nevada foothills, encompassing the watershed that drains into Lake Oroville. Specifically, the Sutter County portion of the subwatershed is entirely within the Sacramento Valley floor, while Butte and Yuba Counties are partially within the valley floor and partially in the upland area. No agricultural lands are farmed upstream of Lake Oroville.
5.1.1 Land Use Agriculture is the main land use in this subwatershed. Major irrigated crops (excluding rice) include:
Orchards: almonds, walnuts, peaches, prunes, and olives
Row crops: beans and tomatoes
Alfalfa
Pasture
The pie chart below shows the relative percentage, based on acreage, of the predominant crop categories grown in this subwatershed to total irrigated agriculture based on PUR 2013 data.
SECTION 5 BUTTE/YUBA/SUTTER SUBWATERSHED
5-2 WBG091013074126SAC
The top left map in Figure 5‐1 illustrates the distribution of irrigated agriculture in the Butte/Yuba/Sutter Subwatershed by crop category.
The following summarizes the cropping patterns by county:
Butte County: field crops dominate the total agricultural production and have remained fairly stable over the last 5 years. Seed crops and vegetable crops have slightly increased in that same time period. Fruit and nut crops are also continuously increasing in acreage (Butte County 2012). Deciduous fruit and nut crops are mainly planted in northwestern Butte County, as well as along the Feather River.
Sutter County: Deciduous fruit and nut crops are mainly planted along the Feather River, whereas annual fruit, vegetables and seeds as well as field crops are grown primarily in western Sutter County.
Yuba County: Deciduous fruit and nut crops are the main type of crop in this county, and they are primarily grown along the Feather, Yuba, and Bear Rivers. Some pasture and field crops are also grown, primarily in southern Yuba County.
According to the Coalition data, there were approximately 218,000 acres of enrolled irrigated lands for this subwatershed in 2012 and 209,682 in 2013.
5.1.2 Soils Soils characteristics play a major role in cropping patterns and farming practices, and influence the retention or infiltration of water and nutrients/pesticides through the subsurface. Understanding soil properties under irrigated agricultural lands is therefore important in assessing potential vulnerabilities to groundwater quality degradation. A brief description of soils conditions in this subwatershed is summarized below.
Soil Texture:
Soils in the valley portion of the Subwatershed mainly consist of clay and clay loam.
The area around Chico has loamy soils, and Yuba County soils are mostly loam and sandy loam.
Soil Drainage:
The upland areas consist of well drained soils, whereas the valley floor mainly consists of poorly and very poorly drained soils, with the exception of the South Yuba County area, which includes moderately well drained soils.
The Chico area also includes well drained soils.
Soil Hydraulic Conductivity:
Soil hydraulic conductivity is generally low in the upland area and moderately low on the valley floor. Yuba County has moderately high hydraulic conductivity, as does the area around Chico.
Soil Salinity, Alkalinity, and Acidity:
This subwatershed has non‐saline soils.
The valley floor has alkaline soils, and the upland soils are more acidic.
5.1.3 Geology and Hydrogeology The Butte/Yuba/Sutter Subwatershed overlies six Sacramento Valley Groundwater Basin Subbasins: West Butte, East Butte, Sutter, North Yuba, South Yuba, and a portion of Vina. The valley floor contains basin deposits and the Modesto Formation outcrops west of the Feather River and east of the Sacramento River and in the Chico area. The Lower Tuscan formation constitutes one of the primary water bearing deposits in Butte County.
As shown on Figure 2‐10, initial HVAs and GPAs are located around the Chico area, along the northern portion of the Sacramento River, along the Feather River, and in the valley floor portion of Yuba County.
Groundwater flows from the upland areas toward the valley floor and then south along the rivers. Recharge to groundwater primarily occurs along the rivers. Other recharge areas include the Chico area and the Sutter Basin. A

SECTION 5 BUTTE/YUBA/SUTTER SUBWATERSHED
WBG091013074126SAC 5-3
spring 2012 groundwater elevation contour map for the Yuba subbasins is shown below and clearly demonstrates how groundwater flows form the Sierra Nevada at a steep gradient and then flows toward the center of the Sacramento Valley.
Depth to groundwater for sections containing irrigated agriculture, as simulated by SACFEM in April 2010, varies between 22 to 43 feet south of Chico and in Sutter and Yuba counties, with areas along the rivers close to 10 to 22 feet below ground surface. The Sutter Basin area exhibits very shallow, near‐surface groundwater levels (depth of less than 2 feet).
5.1.4 Current Programs and Groundwater Monitoring DWR regularly monitors wells in some areas of this subwatershed. USGS has done some monitoring in the past, but no regular groundwater quality monitoring is conducted by USGS in this area.
Local agencies have done some groundwater quality monitoring in the past and some have a more regular current monitoring network:
Butte County monitored 10 wells in 2003 (Butte County Department of Water and Resource Conservation 2004); for the past 12 years, Butte County has been monitoring parameters for evaluation of evidence of saline intrusion, such as temperature, pH, and EC; data collected from 14 wells throughout the county provide

SECTION 5 BUTTE/YUBA/SUTTER SUBWATERSHED
5-4 WBG091013074126SAC
basic groundwater quality trend monitoring results for Butte County. The Groundwater Management Ordinance (Chapter 33A of the Butte County Code) establishes monitoring parameters (temperature, pH, and EC) and frequency (once a year during peak groundwater use such as July or August) for groundwater quality. Other groundwater quality parameters are currently not measured regularly in Butte County.
Sutter County has a network of 34 monitoring wells that DWR samples for groundwater quality constituents every 3 years; the town of Robbins, which has the only public water supply system on groundwater in Sutter County, monitors privately owned wells regularly.
YCWA coordinates with DWR’s North Central Region Office, which regularly collects groundwater samples from five wells in the North Yuba Subbasin and five wells in the South Yuba Subbasin. These samples are analyzed for arsenic, nitrate, sodium, and TDS. This Yuba County groundwater quality monitoring network has wells of different depths (mostly shallow). New monitoring wells have also been installed by DWR in 2012 to supplement the existing monitoring network.
In addition, all three counties have wells that are regularly monitored by DWR and by CASGEM monitoring entities for groundwater levels. Those wells vary in depth and might be suitable for future groundwater quality monitoring. Maps of the location of CASGEM wells for each county are shown in Appendix H.
5.2 Vulnerability Analysis Results The vulnerability analysis was performed by reviewing groundwater quality data and susceptibility factors (hydrogeology, and soils and agronomy). The technical details related to the data processing that went into performing this analysis is described in Section 4.
The majority of the irrigated agricultural areas lie on the valley floor, and the SACFEM area‐based analysis is applicable for that region of the subwatershed. Maps of each susceptibility and vulnerability index distribution are shown in figures 5‐1 through 5‐8. A discussion of results and final scores for each of the susceptibility factors follows below.
5.2.1 Groundwater Quality The review of groundwater quality for the vulnerability analysis focuses on nitrate, salinity, and pesticides. Other constituents of concern are reviewed as necessary based on documented occurrences.
The following are previously documented water quality impairments:
Known areas of concern in the Butte/Yuba/Sutter Subwatershed exist in the Chico area, due to septic tank discharges, as identified in a 1983 study (DWR 1984). The study identified four nitrate plumes attributed to on‐site septic systems for wastewater disposal. Subsequently, in response to an order of the CVRWQCB in 1984, Butte County and the City of Chico prepared a Nitrate Action Plan (NAP) in 1985 to address the nitrate problem. A monitoring plan was put in place, and the City of Chico and Butte County regularly monitor wells for groundwater quality as part of the Chico Urban Area Nitrate Compliance Program adopted in 2000, which assesses nitrate in shallow groundwater wells. The third quarter 2009 groundwater monitoring report (the most recent available on the Butte County website) shows that two wells in northwest Chico had nitrate concentrations above the MCL as well as levels between half the MCL and the MCL in other areas (Butte County Public Health Department 2009).
Sutter County has reported high levels of nitrate in some areas, as well as high levels of manganese in most areas (Sutter County 2012).
In Yuba County, the area near the town of Wheatland has shown elevated EC (YCWA 2010).
In the North Yuba Subbasin, constituents of concern are primarily nutrients (nitrogen, phosphorus), salinity, pesticides, and trace elements. Trace elements are most likely naturally occurring (CVRWQCB 2008).
South Sutter County is an area with historically high levels of shallow salinity, as documented in DWR and USGS reports from the 1970s and 1980s.
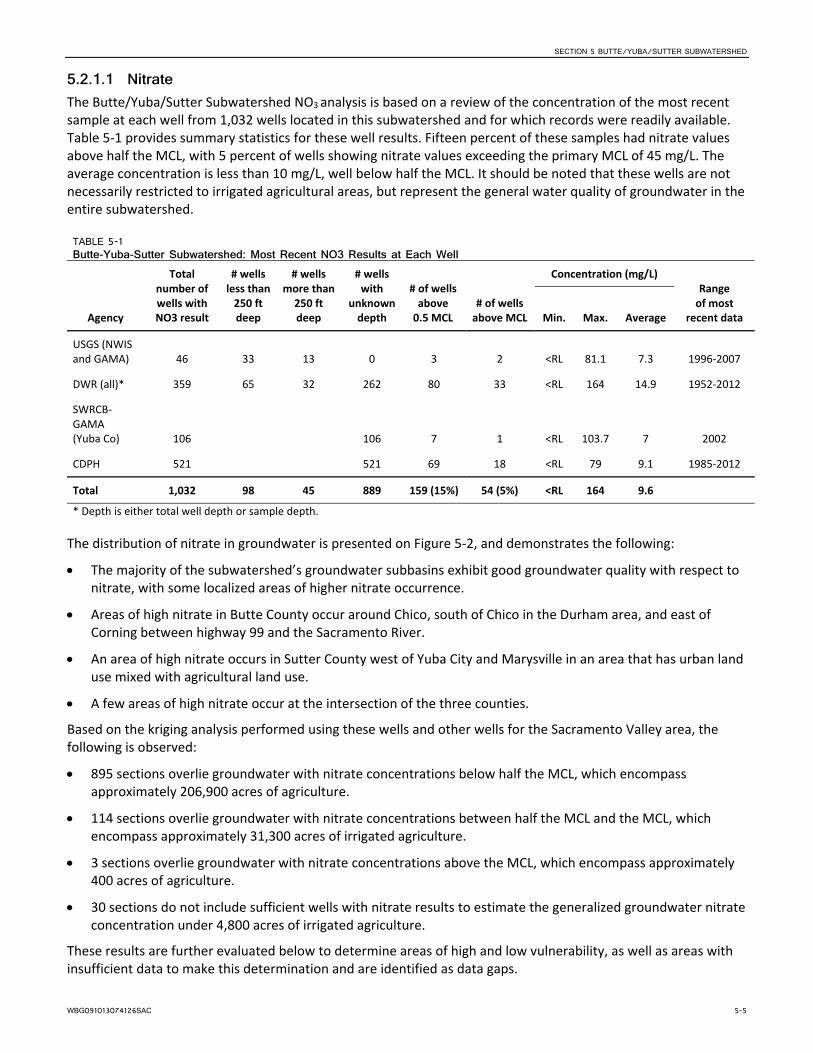
SECTION 5 BUTTE/YUBA/SUTTER SUBWATERSHED
WBG091013074126SAC 5-5
5.2.1.1 Nitrate The Butte/Yuba/Sutter Subwatershed NO3 analysis is based on a review of the concentration of the most recent sample at each well from 1,032 wells located in this subwatershed and for which records were readily available. Table 5‐1 provides summary statistics for these well results. Fifteen percent of these samples had nitrate values above half the MCL, with 5 percent of wells showing nitrate values exceeding the primary MCL of 45 mg/L. The average concentration is less than 10 mg/L, well below half the MCL. It should be noted that these wells are not necessarily restricted to irrigated agricultural areas, but represent the general water quality of groundwater in the entire subwatershed.
TABLE 5-1 Butte-Yuba-Sutter Subwatershed: Most Recent NO3 Results at Each Well
Agency
Total number of wells with NO3 result
# wells less than 250 ft deep
# wells more than 250 ft deep
# wells with
unknown depth
# of wells above 0.5 MCL
# of wells above MCL
Concentration (mg/L) Range of most
recent data Min. Max. Average
USGS (NWIS and GAMA) 46 33 13 0 3 2 <RL 81.1 7.3 1996‐2007
DWR (all)* 359 65 32 262 80 33 <RL 164 14.9 1952‐2012
SWRCB‐GAMA (Yuba Co) 106 106 7 1 <RL 103.7 7 2002
CDPH 521 521 69 18 <RL 79 9.1 1985‐2012
Total 1,032 98 45 889 159 (15%) 54 (5%) <RL 164 9.6
* Depth is either total well depth or sample depth.
The distribution of nitrate in groundwater is presented on Figure 5‐2, and demonstrates the following:
The majority of the subwatershed’s groundwater subbasins exhibit good groundwater quality with respect to nitrate, with some localized areas of higher nitrate occurrence.
Areas of high nitrate in Butte County occur around Chico, south of Chico in the Durham area, and east of Corning between highway 99 and the Sacramento River.
An area of high nitrate occurs in Sutter County west of Yuba City and Marysville in an area that has urban land use mixed with agricultural land use.
A few areas of high nitrate occur at the intersection of the three counties.
Based on the kriging analysis performed using these wells and other wells for the Sacramento Valley area, the following is observed:
895 sections overlie groundwater with nitrate concentrations below half the MCL, which encompass approximately 206,900 acres of agriculture.
114 sections overlie groundwater with nitrate concentrations between half the MCL and the MCL, which encompass approximately 31,300 acres of irrigated agriculture.
3 sections overlie groundwater with nitrate concentrations above the MCL, which encompass approximately 400 acres of agriculture.
30 sections do not include sufficient wells with nitrate results to estimate the generalized groundwater nitrate concentration under 4,800 acres of irrigated agriculture.
These results are further evaluated below to determine areas of high and low vulnerability, as well as areas with insufficient data to make this determination and are identified as data gaps.
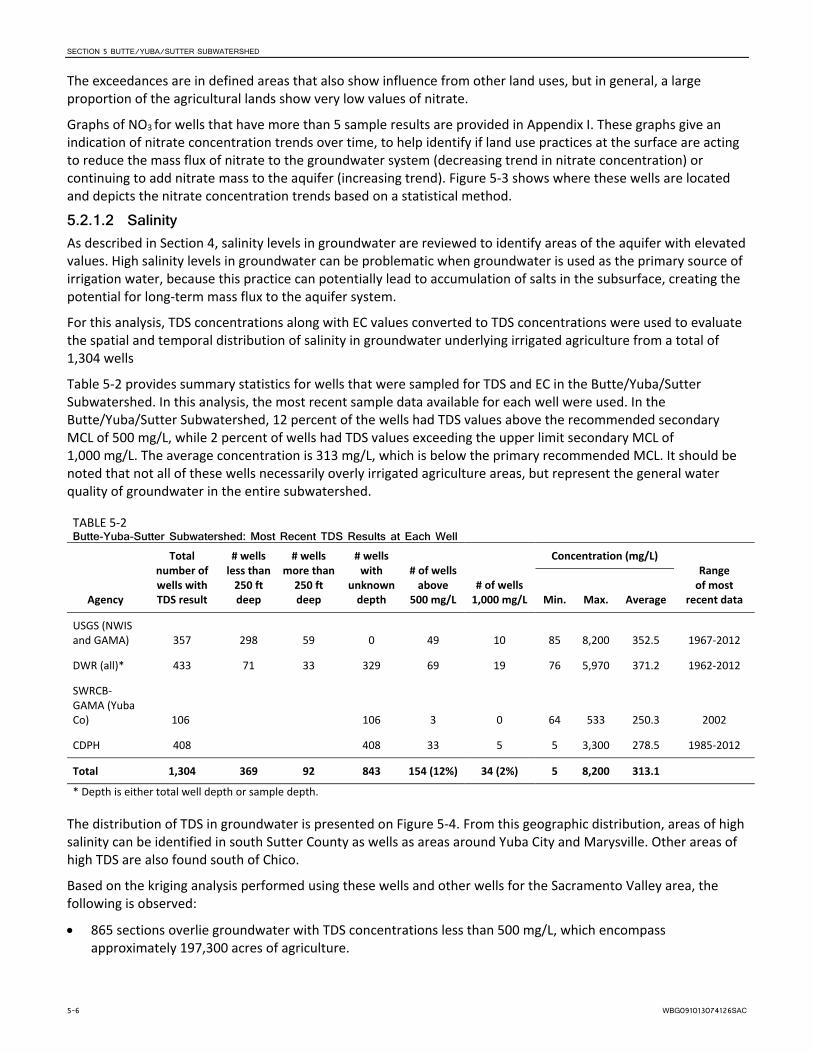
SECTION 5 BUTTE/YUBA/SUTTER SUBWATERSHED
5-6 WBG091013074126SAC
The exceedances are in defined areas that also show influence from other land uses, but in general, a large proportion of the agricultural lands show very low values of nitrate.
Graphs of NO3 for wells that have more than 5 sample results are provided in Appendix I. These graphs give an indication of nitrate concentration trends over time, to help identify if land use practices at the surface are acting to reduce the mass flux of nitrate to the groundwater system (decreasing trend in nitrate concentration) or continuing to add nitrate mass to the aquifer (increasing trend). Figure 5‐3 shows where these wells are located and depicts the nitrate concentration trends based on a statistical method.
5.2.1.2 Salinity As described in Section 4, salinity levels in groundwater are reviewed to identify areas of the aquifer with elevated values. High salinity levels in groundwater can be problematic when groundwater is used as the primary source of irrigation water, because this practice can potentially lead to accumulation of salts in the subsurface, creating the potential for long‐term mass flux to the aquifer system.
For this analysis, TDS concentrations along with EC values converted to TDS concentrations were used to evaluate the spatial and temporal distribution of salinity in groundwater underlying irrigated agriculture from a total of 1,304 wells
Table 5‐2 provides summary statistics for wells that were sampled for TDS and EC in the Butte/Yuba/Sutter Subwatershed. In this analysis, the most recent sample data available for each well were used. In the Butte/Yuba/Sutter Subwatershed, 12 percent of the wells had TDS values above the recommended secondary MCL of 500 mg/L, while 2 percent of wells had TDS values exceeding the upper limit secondary MCL of 1,000 mg/L. The average concentration is 313 mg/L, which is below the primary recommended MCL. It should be noted that not all of these wells necessarily overly irrigated agriculture areas, but represent the general water quality of groundwater in the entire subwatershed.
TABLE 5‐2 Butte-Yuba-Sutter Subwatershed: Most Recent TDS Results at Each Well
Agency
Total number of wells with TDS result
# wells less than 250 ft deep
# wells more than 250 ft deep
# wells with
unknown depth
# of wells above
500 mg/L # of wells 1,000 mg/L
Concentration (mg/L) Range of most
recent data Min. Max. Average
USGS (NWIS and GAMA) 357 298 59 0 49 10 85 8,200 352.5 1967‐2012
DWR (all)* 433 71 33 329 69 19 76 5,970 371.2 1962‐2012
SWRCB‐GAMA (Yuba Co) 106 106 3 0 64 533 250.3 2002
CDPH 408 408 33 5 5 3,300 278.5 1985‐2012
Total 1,304 369 92 843 154 (12%) 34 (2%) 5 8,200 313.1
* Depth is either total well depth or sample depth.
The distribution of TDS in groundwater is presented on Figure 5‐4. From this geographic distribution, areas of high salinity can be identified in south Sutter County as wells as areas around Yuba City and Marysville. Other areas of high TDS are also found south of Chico.
Based on the kriging analysis performed using these wells and other wells for the Sacramento Valley area, the following is observed:
865 sections overlie groundwater with TDS concentrations less than 500 mg/L, which encompass approximately 197,300 acres of agriculture.

SECTION 5 BUTTE/YUBA/SUTTER SUBWATERSHED
WBG091013074126SAC 5-7
119 sections overlie groundwater with TDS concentrations between 500 and 1,000 mg/L, which encompass approximately 32,500 acres of agriculture.
53 sections overlie groundwater with TDS concentrations above 1,000 mg/L, which encompass approximately 13,500 acres of agriculture.
5 sections do not include sufficient wells with TDS results to estimate the generalized groundwater TDS concentration under 100 acres of agriculture.
These results are further evaluated below to determine areas of high vulnerability, low vulnerability, and data gaps.
The areas with elevated TDS values discussed above occur in areas that may also be influenced by other land uses; but in general, a very high percentage of agricultural lands exhibit relatively low values of TDS.
Graphs of TDS for wells that have more than 5 sample results are provided in Appendix I. These graphs give an indication of TDS concentration trends over time to help identify if land use practices at the surface are acting to reduce the mass flux of TDS to the groundwater system (decreasing trend in TDS concentration). In areas where TDS concentrations are stable, natural conditions are probably the cause of salinity and where TDS concentrations increase, land use and irrigation water sources might influence the overall salinity in the aquifer. Figure 5‐5 shows where these wells are located and depicts the TDS concentration trends based on a statistical method.
5.2.1.3 Pesticides A summary of pesticides detected in groundwater in each of the counties and groundwater basins in the Sacramento River Watershed is provided in Appendix J.
5.2.1.4 Other Constituents of Concern As mentioned above, Sutter County has reported high levels of manganese, which is a naturally occurring constituent in the subsurface.
5.2.2 Susceptibility Factors 5.2.2.1 Hydrogeology The SACFEM results (Figure 5‐6) show that the areas of highest susceptibility from hydrogeology are located along the rivers, in South Sutter County, and in northwestern Butte County.
5.2.2.2 Soils and Agronomy Figure 5‐7 shows the section‐level analysis of the individual and total NHI scores. The total NHI score shows that areas of highest susceptibility to soils and agronomy occur in the Chico area (due to coarse soils) and in the Sutter County area along the Sacramento River south of the Sutter Buttes (an area dominated by field crops). Dispersed areas with high susceptibility to soils and agronomy also occur in Yuba County. Areas with unclassified soils include a few areas located around Chico and southwest of Chico, as well as in the foothill areas.
5.3 Conclusions The vulnerability of groundwater was assessed using a combination of susceptibility indicators and groundwater quality monitoring results. The vulnerability designation concepts and methodology are described in detail in Section 4. Based on this analysis, and taking into consideration the susceptibility and water quality results described above, a vulnerability map for potential groundwater contamination due to nitrate was developed for this subwatershed and is shown on Figure 5‐8.
The areas outside of the valley floor are considered low vulnerability due to the excellent water quality and sparse irrigated agricultural areas. On the valley floor, there are 262 sections designated low vulnerability, 352 sections designated moderate vulnerability, and 253 sections designated as high vulnerability. A few data gap areas also exist.
SECTION 5 BUTTE/YUBA/SUTTER SUBWATERSHED
5-8 WBG091013074126SAC
The major high vulnerability areas are:
1. Northwest and south of Chico – due to high nitrate values in recent samples (above MCL) as well as increasing trends in nitrate concentrations.
However, the Chico urban area has a history of high nitrate concentrations in groundwater due to leaking septic systems. Since irrigated agricultural lands exist in close proximity to the urban areas, this area needs further evaluation to identify if irrigated agriculture causes nitrate contamination problems in groundwater. The City of Chico is already monitoring shallow wells for nitrate; trend monitoring in areas downgradient of Chico (and upgradient of agricultural lands) is warranted to help quantify the nitrate concentration in those areas. Additional coordination with the City of Chico would be valuable to better understand the extent of the impacted area and to inform the development of the trend monitoring workplan required by the LTILRP.
2. West of Yuba City – due to high nitrate values in recent samples (above MCL) as well as increasing trends in nitrate concentrations.
3. A few sections at the boundary between the three counties as well as in south Sutter County– due to high nitrate values in recent samples (above the MCL), and high susceptibility factors (hydrogeology and soils/agronomy).
TDS concentrations are elevated in a few areas of the valley floor as well. However, known natural and anthropogenic influences on groundwater quality need to be taken into account for monitoring program development. The Sutter County high TDS area most likely results from natural causes because of regional geochemical conditions that exist throughout the aquifer, and are not likely to be related to near‐surface irrigation practices. In addition, these areas do not use groundwater as a source for irrigation water; therefore, agricultural practices do not pose a threat for the accumulation of salts in soil root zone. This area will not further be considered as part of the LTILRP. Therefore, there are no identified high‐vulnerability areas due to TDS.
Major data gaps exist southwest of Chico due to soils data gaps (no total NHI score) and limited nitrate concentration data. Another data gap area on the valley floor is located in south Butte County along the Feather River, again, due to lack of soils classifications for the NHI calculation. These areas need additional groundwater monitoring information to be compiled and assessed specifically since they are located in high geologic susceptibility areas.

WBG091013074126SAC 6-1
SECTION 6
Colusa Glenn Subwatershed This subwatershed section describes general background information related to geographic location, land use, and physical setting, as well as current groundwater quality monitoring programs. Next, results of the vulnerability analysis are presented, followed by conclusions on vulnerability designations and recommendations.
6.1 Background The Colusa Glenn Subwatershed includes all of Glenn County and most of Colusa County over an area of approximately 1.5 million acres. Major waterways include the Sacramento River, Stony Creek, Walker Creek, and the Colusa Basin Drain. Major population centers include Williams, Colusa, Willows, and Orland. This entire subwatershed is located within the Sacramento Valley Floor, from an irrigated agricultural lands perspective.
6.1.1 Land Use Agriculture is the major land use in this subwatershed. Major crops (excluding rice) include:
Orchards (almonds, prunes, walnuts)
Row crops (tomatoes, melons, squash, beets, and cucumbers)
Pasture, wheat alfalfa/hay, and corn
The pie chart below shows the relative percentage, based on acreage, of the predominant crop categories grown in this subwatershed to total irrigated agriculture based on PUR 2013 data.
Over 50% of the irrigated agriculture area is planted in orchards, with a recent trend toward an increase in tree or permanent crop plantings in these two counties.
The top left map in Figure 6‐1 illustrates the distribution of irrigated agriculture in the Colusa Glenn Subwatershed by crop category. The orchards tend to be clustered in northern Glenn County, southern Colusa County on the west side of I‐5, and, to some extent, near the Sacramento River. Field crops are farmed around Willows and on

SECTION 6 COLUSA GLENN SUBWATERSHED
6-2 WBG091013074126SAC
the southwestern and southeastern sides of Glenn County. Annuals are primarily located in southern Colusa County.
According to the Coalition data, there were approximately 278,249 acres of enrolled irrigated lands for this subwatershed in 2012 and 280,865 acres in 2013.
In addition to the diverse crop agriculture, which surrounds a large contiguous area planted in rice3 in the middle of the basin, three large National Wildlife Refuges (NWR) also are part this subwatershed (from North to South: Sacramento NWR, Delevan NWR, and Colusa NWR). These refuges provide important habitat for migrating birds along the Pacific Flyway.
6.1.2 Soils Soils characteristics play a major role in cropping patterns and farming practices, and they influence the retention or infiltration of water and nutrients/pesticides through the subsurface. Understanding soil properties under irrigated agricultural lands is therefore important in assessing potential vulnerabilities to groundwater quality degradation. A brief description of soils conditions in this subwatershed is summarized below.
Soil Texture:
Soils in the Colusa Glenn Subwatershed are dominated by clays (clay, silty clay, and clay loam), which is typical for historically flooded areas such as the Colusa Basin.
Soil Drainage:
This subwatershed has poorly drained soils in the center of the basin, where rice is grown, and ranges from somewhat poorly drained to well‐drained in most areas where other crops are grown.
Soil Hydraulic Conductivity:
Soil hydraulic conductivity is very low in the central portion of the Colusa Basin, and moderately low to moderately high in most other areas, with an area of high conductivity in the southwestern portion of Colusa County (where orchards tend to be grown).
Soil Salinity, Alkalinity, and Acidity:
The Colusa Basin includes slightly saline soils, while an area southwest of Willows has moderately saline soils and the rest of the subwatershed is ranked as nonsaline soils. This subwatershed has generally alkaline soils.
6.1.3 Geology and Hydrogeology The Colusa Glenn Subwatershed overlies a large portion of the Colusa Subbasin of the Sacramento Groundwater Basin, which is bounded on the east by the Sacramento River, on the west by the Coast Range, on the south by Cache Creek, and on the north by Stony Creek.
“The Colusa Subbasin aquifer system is composed of continental deposits of late Tertiary to Quaternary age. Quaternary deposits include Holocene stream channel and basin deposits and Pleistocene Modesto and Riverbank formations. The Tertiary deposits consist of the Pliocene Tehama Formation and the Tuscan Formation” (DWR 2003).
As shown in Figure 2‐10, initial HVAs and GPAs are located along Stony Creek and the Sacramento River. A few disconnected initial HVA areas are found in the southern portion of the subwatershed. An area west of Willows was delineated as a GPA by DPR.
Groundwater generally flows from the Coast Ranges toward the valley floor and then south along the Sacramento River. Recharge to groundwater primarily occurs along the rivers, and also from deep percolation of agricultural irrigation on the valley floor.
3 Rice agriculture is not evaluated as part of this GAR, but as part of the California Rice Commission Order GAR, which was adopted in March 2014.

SECTION 6 COLUSA GLENN SUBWATERSHED
WBG091013074126SAC 6-3
Depth to groundwater for sections containing irrigated agriculture, as simulated by SACFEM in April 2010, varies between 22 to 43 feet in the western portion of the subwatershed, and is generally deeper than 43 feet in the northwest and southwest portions. The area located in the Colusa Basin has shallower depth to groundwater, at less than 10 feet below ground surface. The southeastern portion of the subwatershed exhibits depths to groundwater less than 2 feet below ground surface.
6.1.4 Current Programs and Groundwater Monitoring DWR and USGS monitor groundwater wells sporadically and sometimes for specific reports (USGS); wells vary in depth and in type. Public supply wells in both Colusa and Glenn counties are monitored for drinking water purposes and results are submitted to CDPH.
In addition, many wells are regularly monitored by DWR and by CASGEM monitoring entities for groundwater levels. Those wells vary in depth and might be suitable for future groundwater quality monitoring. Maps of the location of CASGEM wells for each county are shown in Appendix H.
6.2 Vulnerability Analysis Results The vulnerability analysis was performed by reviewing groundwater quality data and susceptibility factors (hydrogeology, and soils and agronomy). The technical details related to the data processing that went into performing this analysis is described in Section 4.
Since the entire subwatershed portion that is farmed lies within the valley floor, the SACFEM area‐based analysis is applicable for the Colusa Glenn Subwatershed. Maps of each susceptibility and vulnerability index distribution are shown in Figures 6‐1 through 6‐8. A discussion of results and final scores for each of the factors follows below.
6.2.1 Groundwater Quality The review of groundwater quality for the vulnerability analysis focuses on nitrate, salinity, and pesticides. Other constituents of concern are reviewed as necessary, based on documented occurrences.
A few localized groundwater quality issues have been reported in this subwatershed. Groundwater quality problems exist between Maxwell and Arbuckle in Colusa County due to high concentrations of sodium, chloride, and sulfate, which are often related to salinity concerns (GCID 1995). Other local areas of concern in Colusa County include elevated levels of TDS, boron, and manganese (Colusa County 2008). From a drinking water perspective, saline water is an issue around Maxwell, and nitrates are found in the northern portion of Glenn County around Orland. In addition, elevated levels of arsenic have been reported around Grimes, and elevated levels of iron and manganese have been an issue in the water of the cities of Williams and Colusa (Glenn County 2005).
6.2.1.1 Nitrate The Colusa Glenn Subwatershed NO3 analysis is based on a review of the concentration of the most recent sampling at each well from 359 wells located in this subwatershed and for which records were readily available. Table 6‐1 provides summary statistics for wells that were sampled for NO3 in the Colusa Glenn Subwatershed. Thirteen percent of most recent wells had nitrate values above half the MCL, while 2 percent of wells had nitrate values exceeding the primary MCL of 45 mg/L. The average concentration is 8.3 mg/L, well below half the MCL. It should be noted that these wells are not necessarily restricted to irrigated agricultural areas, but represent the general water quality of groundwater in the entire subwatershed.
The distribution of nitrate in groundwater is presented on Figure 6‐2. From this geographic distribution, areas of high nitrate occur primarily in northern Glenn County and around the City of Willows. A few localized high levels of nitrate have been detected in wells in Colusa County in the past, but they are generally surrounded by wells with very low nitrate levels.
SECTION 6 COLUSA GLENN SUBWATERSHED
6-4 WBG091013074126SAC
Based on the kriging analysis performed using these wells and other wells within the Sacramento Valley area, the following is observed:
771 sections overlie groundwater with nitrate concentrations below half the MCL, which encompass approximately 227,500 acres of agriculture.
66 sections overlie groundwater with nitrate concentrations above half the MCL, which encompass approximately 27,200 acres of agriculture.
None of the sections overlie groundwater with nitrate concentrations above the MCL; even though 9 wells exceed the MCL, the section average of all nitrate data is below the MCL in this subwatershed.
93 sections do not include sufficient wells with nitrate results to estimate the generalized groundwater nitrate concentration under 27,700 acres of agriculture.
These results are further evaluated below to determine areas of high vulnerability and low vulnerability, as well as areas with insufficient data to make this determination and are identified as data gaps.
Graphs of NO3 for wells that have more than 5 sample results are provided in Appendix I. These graphs give an indication of nitrate concentration trends over time to help identify if land use practices at the surface are acting to reduce the mass flux of nitrate to the groundwater system (decreasing trend in nitrate concentration) or continuing to add nitrate mass to the aquifer (increasing trend) of groundwater quality. Figure 6‐3 shows where these wells are located and depicts the nitrate concentration trends based on a statistical method.
6.2.1.2 Salinity As described in Section 4, salinity levels in groundwater are reviewed to identify areas of the aquifer with elevated values. High salinity levels in groundwater can be problematic when groundwater is used as the primary source of irrigation water, because this practice can potentially lead to accumulation of salts in the subsurface, creating the potential for long‐term mass flux to the aquifer system.
For this analysis, TDS concentrations along with EC values converted to TDS concentrations were used to evaluate the spatial and temporal distribution of salinity in groundwater underlying irrigated agriculture, from a total of 678 wells.
Table 6‐2 provides summary statistics for wells that were sampled for TDS and EC in the Colusa Glenn Subwatershed. In this analysis, the most recent sample data available for each well was used. In the Colusa Glenn Subwatershed, 17 percent of most recent wells had TDS values above the recommended secondary MCL of 500 mg/L, and 3 percent of wells had TDS values exceeding the upper limit secondary MCL of 1,000 mg/L. The average concentration is 450 mg/L, which is below the secondary recommended MCL (and at the AGR Beneficial Use threshold for comparison). It should be noted that not all of these wells necessarily overly irrigated agriculture areas, but represent the general water quality of groundwater in the entire subwatershed.
The distribution of TDS in groundwater is presented on Figure 6‐4. From this geographic distribution, areas of high salinity are generally found in the Colusa County portion of the subwatershed, with high levels around the towns of Colusa and Williams. High salinity is also found in areas upgradient of agriculture, in the Coast Range, signifying the influence of the recharge from the Coast Range on the salinity of groundwater in the Colusa Basin and surrounding agricultural areas.
Based on the kriging analysis performed using these wells and other wells within the Sacramento Valley area, the following is observed:
677 sections overlie groundwater with TDS concentrations less than 500 mg/L, which encompass approximately 216,700 acres of agriculture.
199 sections overlie groundwater with TDS concentrations between 500 and 1,000 mg/L, which encompass approximately 52,700 acres of agriculture.

SECTION 6 COLUSA GLENN SUBWATERSHED
WBG091013074126SAC 6-5
None of the sections overlies groundwater with TDS concentrations above 1,000 mg/L; even though 23 wells (3%) have TDS concentrations above 1,000 mg/L, the section average of all salinity data is below 1,000 mg/L in this subwatershed.
54 sections do not include sufficient wells with TDS results to estimate the generalized groundwater TDS concentration under 12,800 acres of agriculture.
These results are further evaluated below to determine areas of high vulnerability, low vulnerability, and data gaps.
Graphs of TDS for wells that have more than 5 sample results are provided in Appendix I. These graphs give an indication of TDS concentration trends over time to help identify if land use practices at the surface are acting to reduce the mass flux of TDS to the groundwater system (decreasing trend in TDS concentration). In areas where TDS concentrations are elevated and stable, natural sources are likely the cause of salinity, and where TDS concentrations are increasing, land use and irrigation water sources may influence the overall salinity in the aquifer. Figure 6‐5 shows where these wells are located and depicts the TDS concentration trends based on a statistical method.
TABLE 6-1 Colusa Glenn Subwatershed: Most Recent NO3 Results at Each Well
Agency
Total number of wells with NO3 result
# wells less than 250 ft deep
# wells more than 250 ft deep
# wells with
unknown depth
# of wells above 0.5 MCL
# of wells above MCL
Concentration (mg/L) Range of most
recent data Min. Max. Average
USGS (NWIS and GAMA)** 25 21 3 1 0 0 <RL 21.8 4.4 1997‐2012
DWR (all)* 188 2 6 180 25 6 <RL 121 10.6 1952‐2012
CDPH 146 146 21 3 <RL 80.2 10 1985‐2012
Total 359 23 9 327 46 (13%) 9 (2%) <RL 121 8.3
* Depth is either total well depth or sample depth. ** Includes Rice Wells.
TABLE 6-2 Colusa Glenn Subwatershed: Most Recent TDS Results at Each Well
Agency
Total number of wells with TDS result
# wells less than 250 ft deep
# wells more than 250 ft deep
# wells with
unknown depth
# of wells above
500 mg/L
# of wells above
1,000 mg/L
Concentration (mg/L) Range of most
recent data Min. Max. Average
USGS (NWIS and GAMA)** 341 239 95 7 53 13 112 4,510 407.3 1971‐2012
DWR (all)* 222 1 7 214 42 8 138 27,400 544.4 1957‐2012
CDPH 115 115 19 2 42 1,460 388.5 1985‐2012
Total 678 240 102 336 114 (17%) 23 (3%) 42 27,400 446.7
* Depth is either total well depth or sample depth. ** Includes Rice Wells.

SECTION 6 COLUSA GLENN SUBWATERSHED
6-6 WBG091013074126SAC
6.2.1.3 Pesticides A summary of pesticides detected in groundwater in each of the counties and groundwater basins in the Sacramento River Watershed is provided in Appendix J.
6.2.1.4 Other Constituents of Concern Other constituents of concern in the Colusa Glenn Subwatershed include high concentrations of sodium, chloride, sulfate, boron, arsenic, iron, and manganese, primarily in Colusa County.
6.2.2 Susceptibility Factors 6.2.2.1 Hydrogeology The SACFEM results (Figure 6‐6) show that the areas of highest susceptibility from hydrogeology are located along the Sacramento River and in northeastern Glenn County. Areas around Orland, Willows, and Williams also show higher hydrogeologic susceptibility.
6.2.2.2 Soils and Agronomy Figure 6‐7 shows the section‐level analysis of the individual and total NHI scores. The total NHI score shows that areas of highest susceptibility to soils and agronomy occur along the Sacramento River in Colusa County, with some scattered areas in the northern Glenn County.
6.3 Conclusions The vulnerability of groundwater was assessed using a combination of susceptibility indicators and groundwater quality monitoring results. The vulnerability designation concepts and methodology are described in detail in Section 4. Based on this analysis, and taking into consideration the susceptibility and water quality results described above, a vulnerability map for potential groundwater contamination due to nitrate was developed for this subwatershed and is shown on Figure 6‐8.
On the valley floor of this subwatershed, there are 344 sections designated low vulnerability, 325 sections designated moderate vulnerability, and 184 sections designated as high vulnerability. A few data gap areas also exist.
The majority of the sections designated as high vulnerability are located in an area between Orland and Willows. This northern Glenn County portion of the subwatershed has high levels of nitrate, with a potential influence from dairy operations in that region. Another high‐vulnerability area exists around Willows and a few sections along the Sacramento River. In the Colusa County portion of the Subwatershed, sections of high vulnerability are less concentrated, with a few sections along the Sacramento River, around the town of Colusa, and south of Williams.
The Colusa County portion of the subwatershed exhibits high levels of salinity that can be attributed to natural conditions due to groundwater inflow from the Coast Range, which is formed of marine sediments. However, since most agricultural operations in this area are irrigated with surface water, with only two areas identified as being irrigated with groundwater, there is no major threat to increasing groundwater concentration of salinity from irrigated agricultural practices.
Potential data gap areas, due to a lack of nitrate data and soils classifications, include the northwestern portion of Glenn County (area of orchards).
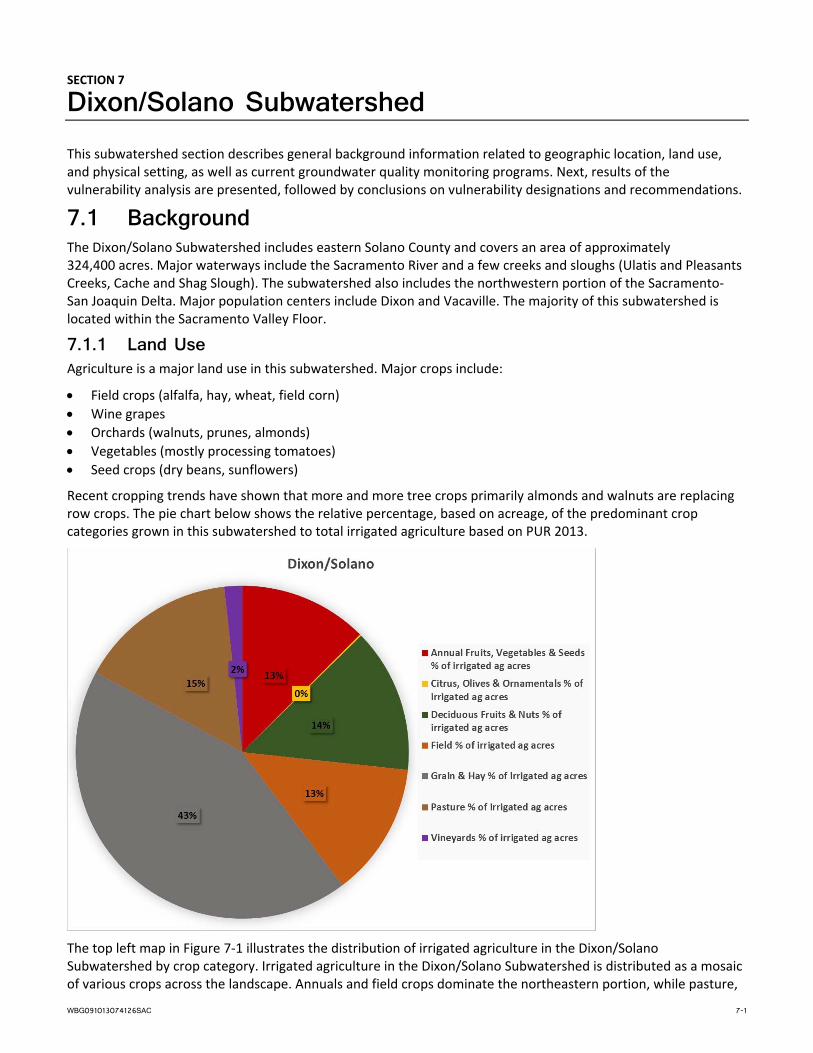
WBG091013074126SAC 7-1
SECTION 7
Dixon/Solano Subwatershed This subwatershed section describes general background information related to geographic location, land use, and physical setting, as well as current groundwater quality monitoring programs. Next, results of the vulnerability analysis are presented, followed by conclusions on vulnerability designations and recommendations.
7.1 Background The Dixon/Solano Subwatershed includes eastern Solano County and covers an area of approximately 324,400 acres. Major waterways include the Sacramento River and a few creeks and sloughs (Ulatis and Pleasants Creeks, Cache and Shag Slough). The subwatershed also includes the northwestern portion of the Sacramento‐San Joaquin Delta. Major population centers include Dixon and Vacaville. The majority of this subwatershed is located within the Sacramento Valley Floor.
7.1.1 Land Use Agriculture is a major land use in this subwatershed. Major crops include:
Field crops (alfalfa, hay, wheat, field corn)
Wine grapes
Orchards (walnuts, prunes, almonds)
Vegetables (mostly processing tomatoes)
Seed crops (dry beans, sunflowers)
Recent cropping trends have shown that more and more tree crops primarily almonds and walnuts are replacing row crops. The pie chart below shows the relative percentage, based on acreage, of the predominant crop categories grown in this subwatershed to total irrigated agriculture based on PUR 2013.
The top left map in Figure 7‐1 illustrates the distribution of irrigated agriculture in the Dixon/Solano Subwatershed by crop category. Irrigated agriculture in the Dixon/Solano Subwatershed is distributed as a mosaic of various crops across the landscape. Annuals and field crops dominate the northeastern portion, while pasture,

SECTION 7 DIXON/SOLANO SUBWATERSHED
7-2 WBG091013074126SAC
grain, and hay are mainly farmed in the central portion of the subwatershed. Historically, most of the orchards are primarily planted in the northern portion of the subwatershed, generally between Yolo County and Interstate 80. Vineyards are concentrated in the Delta area along with some field crops. However, increasing numbers of orchards are being planted in other areas of the subwatershed.
According to the Coalition data, there were approximately 114,052 acres of enrolled irrigated lands for this subwatershed in 2012 and 114,690 acres in 2013.
7.1.2 Soils Soils characteristics play a major role in cropping patterns and farming practices, and influence the retention or infiltration of water and nutrients/pesticides through the subsurface. Understanding soil properties under irrigated agricultural lands is therefore important in assessing potential vulnerabilities to groundwater quality degradation. A brief description of soils conditions in this subwatershed is summarized below.
Soil Texture:
Soils in the Dixon/Solano Subwatershed are dominated by clay in the eastern portion, with interspersed clay loam; and clay loam to sandy loam in the western portion.
Soil Drainage:
This subwatershed has moderately well drained soils in the central portion and well drained soils in the south (Delta) and the northwestern portions.
The southeastern portion within the Delta contains poorly drained soils.
Soil Hydraulic Conductivity:
Soil hydraulic conductivity is generally moderately low in the central portion and moderately high around the periphery of the subwatershed.
Soil Salinity, Alkalinity, and Acidity:
This subwatershed has mostly non‐saline soils with an area of very slightly to slightly saline soils in the Delta area. This subwatershed has alkaline soils.
7.1.3 Geology and Hydrogeology The Dixon/Solano Subwatershed overlies the Solano Subbasin of the Sacramento Valley Groundwater Basin. This subbasin is bounded by Putah Creek to the north, the Sacramento River on the East, the North Mokelumne River on the southeast, and the San Joaquin River on the south.
“The primary water‐bearing formations comprising the Solano Subbasin are sedimentary continental deposits of Late Tertiary (Pliocene) to Quaternary (Recent) age. Fresh water‐bearing units include younger alluvium, older alluvium, and the Tehama Formation. The units pinch out near the Coast Range on the west and thicken to a section of nearly 3000 feet near the eastern margin of the basin. Saline water‐bearing sedimentary units underlie the Tehama formation and are generally considered the saline water boundary” (DWR 2003).
As shown on Figure 2‐10, initial HVAs are mainly located in the northeastern portion of the Delta.
Groundwater generally flows from northwest to southeast, although localized pumping depression due to increased groundwater use in periods of drought tend to perturb this general flow direction.
Depth to groundwater for sections containing irrigated agriculture, as simulated by SACFEM in April 2010, varies between 22 and 43 feet in the northern portion of the subwatershed. The southern portion has shallow groundwater at or below 10 feet from the ground surface, with strong surface water/groundwater interaction in the Delta and near surface groundwater levels at less than 2 feet.
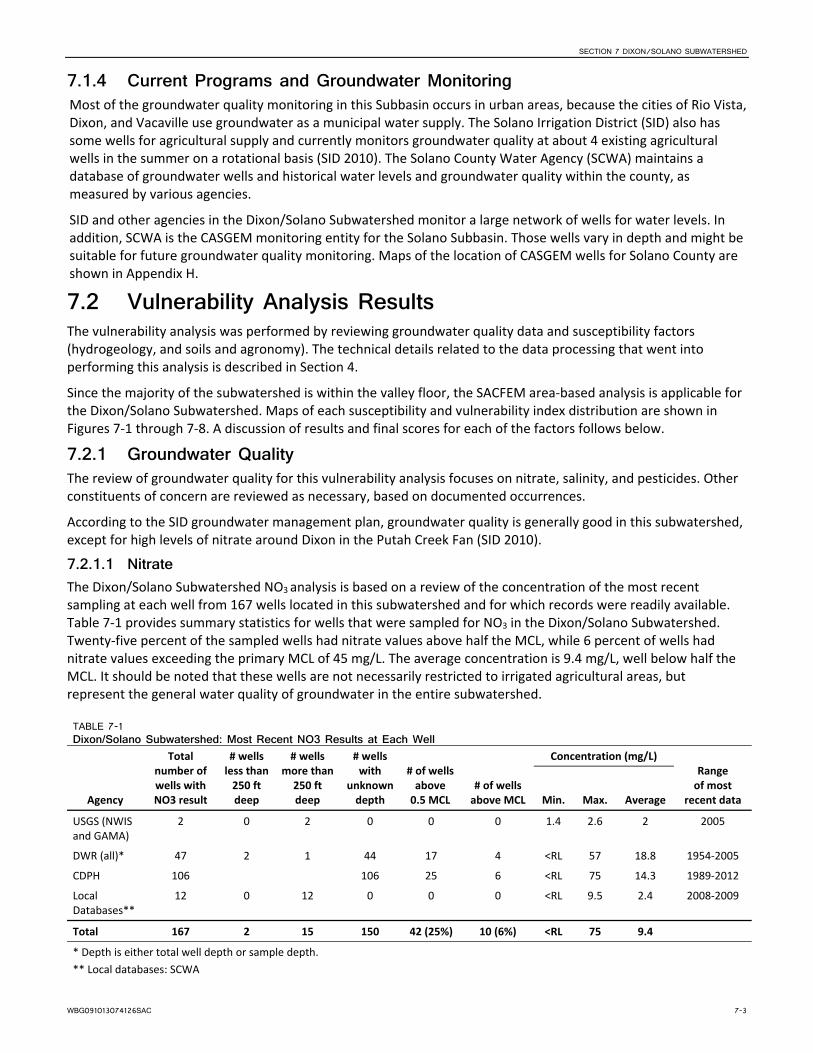
SECTION 7 DIXON/SOLANO SUBWATERSHED
WBG091013074126SAC 7-3
7.1.4 Current Programs and Groundwater Monitoring Most of the groundwater quality monitoring in this Subbasin occurs in urban areas, because the cities of Rio Vista, Dixon, and Vacaville use groundwater as a municipal water supply. The Solano Irrigation District (SID) also has some wells for agricultural supply and currently monitors groundwater quality at about 4 existing agricultural wells in the summer on a rotational basis (SID 2010). The Solano County Water Agency (SCWA) maintains a database of groundwater wells and historical water levels and groundwater quality within the county, as measured by various agencies.
SID and other agencies in the Dixon/Solano Subwatershed monitor a large network of wells for water levels. In addition, SCWA is the CASGEM monitoring entity for the Solano Subbasin. Those wells vary in depth and might be suitable for future groundwater quality monitoring. Maps of the location of CASGEM wells for Solano County are shown in Appendix H.
7.2 Vulnerability Analysis Results The vulnerability analysis was performed by reviewing groundwater quality data and susceptibility factors (hydrogeology, and soils and agronomy). The technical details related to the data processing that went into performing this analysis is described in Section 4.
Since the majority of the subwatershed is within the valley floor, the SACFEM area‐based analysis is applicable for the Dixon/Solano Subwatershed. Maps of each susceptibility and vulnerability index distribution are shown in Figures 7‐1 through 7‐8. A discussion of results and final scores for each of the factors follows below.
7.2.1 Groundwater Quality The review of groundwater quality for this vulnerability analysis focuses on nitrate, salinity, and pesticides. Other constituents of concern are reviewed as necessary, based on documented occurrences.
According to the SID groundwater management plan, groundwater quality is generally good in this subwatershed, except for high levels of nitrate around Dixon in the Putah Creek Fan (SID 2010).
7.2.1.1 Nitrate The Dixon/Solano Subwatershed NO3 analysis is based on a review of the concentration of the most recent sampling at each well from 167 wells located in this subwatershed and for which records were readily available. Table 7‐1 provides summary statistics for wells that were sampled for NO3 in the Dixon/Solano Subwatershed. Twenty‐five percent of the sampled wells had nitrate values above half the MCL, while 6 percent of wells had nitrate values exceeding the primary MCL of 45 mg/L. The average concentration is 9.4 mg/L, well below half the MCL. It should be noted that these wells are not necessarily restricted to irrigated agricultural areas, but represent the general water quality of groundwater in the entire subwatershed.
TABLE 7-1 Dixon/Solano Subwatershed: Most Recent NO3 Results at Each Well
Agency
Total number of wells with NO3 result
# wells less than 250 ft deep
# wells more than 250 ft deep
# wells with
unknown depth
# of wells above 0.5 MCL
# of wells above MCL
Concentration (mg/L) Range of most
recent data Min. Max. Average
USGS (NWIS and GAMA)
2 0 2 0 0 0 1.4 2.6 2 2005
DWR (all)* 47 2 1 44 17 4 <RL 57 18.8 1954‐2005
CDPH 106 106 25 6 <RL 75 14.3 1989‐2012
Local Databases**
12 0 12 0 0 0 <RL 9.5 2.4 2008‐2009
Total 167 2 15 150 42 (25%) 10 (6%) <RL 75 9.4
* Depth is either total well depth or sample depth.
** Local databases: SCWA
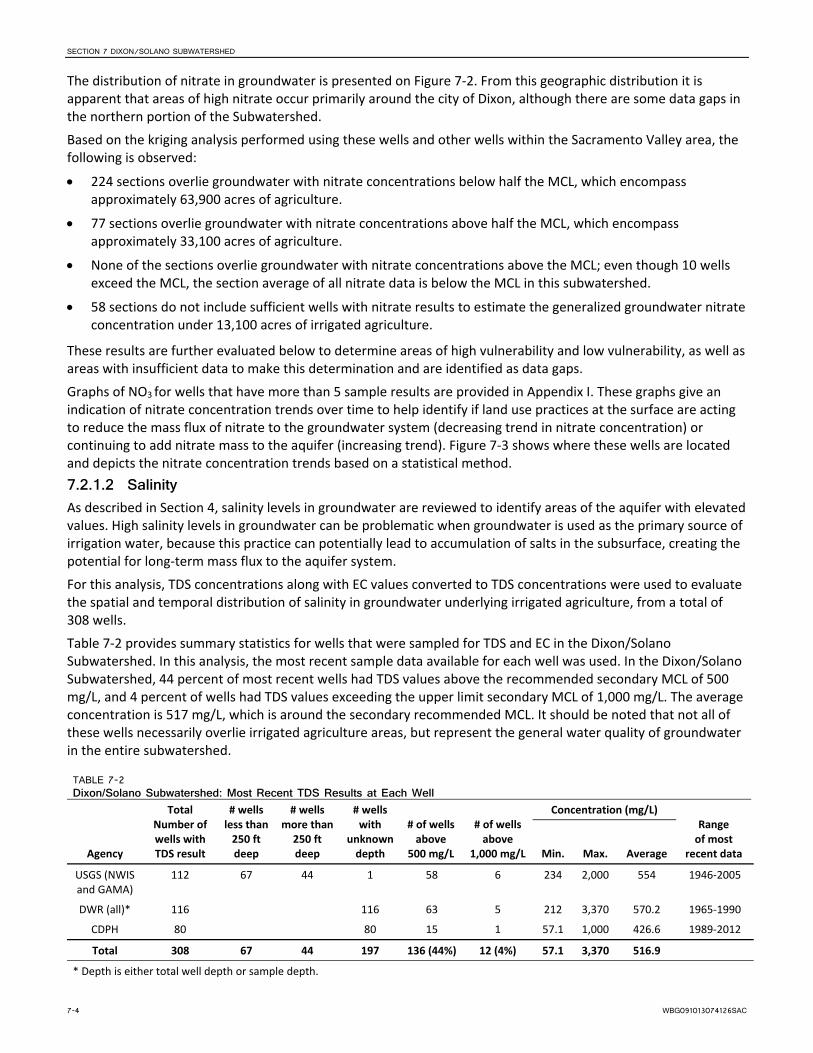
SECTION 7 DIXON/SOLANO SUBWATERSHED
7-4 WBG091013074126SAC
The distribution of nitrate in groundwater is presented on Figure 7‐2. From this geographic distribution it is apparent that areas of high nitrate occur primarily around the city of Dixon, although there are some data gaps in the northern portion of the Subwatershed.
Based on the kriging analysis performed using these wells and other wells within the Sacramento Valley area, the following is observed:
224 sections overlie groundwater with nitrate concentrations below half the MCL, which encompass approximately 63,900 acres of agriculture.
77 sections overlie groundwater with nitrate concentrations above half the MCL, which encompass approximately 33,100 acres of agriculture.
None of the sections overlie groundwater with nitrate concentrations above the MCL; even though 10 wells exceed the MCL, the section average of all nitrate data is below the MCL in this subwatershed.
58 sections do not include sufficient wells with nitrate results to estimate the generalized groundwater nitrate concentration under 13,100 acres of irrigated agriculture.
These results are further evaluated below to determine areas of high vulnerability and low vulnerability, as well as areas with insufficient data to make this determination and are identified as data gaps.
Graphs of NO3 for wells that have more than 5 sample results are provided in Appendix I. These graphs give an indication of nitrate concentration trends over time to help identify if land use practices at the surface are acting to reduce the mass flux of nitrate to the groundwater system (decreasing trend in nitrate concentration) or continuing to add nitrate mass to the aquifer (increasing trend). Figure 7‐3 shows where these wells are located and depicts the nitrate concentration trends based on a statistical method.
7.2.1.2 Salinity As described in Section 4, salinity levels in groundwater are reviewed to identify areas of the aquifer with elevated values. High salinity levels in groundwater can be problematic when groundwater is used as the primary source of irrigation water, because this practice can potentially lead to accumulation of salts in the subsurface, creating the potential for long‐term mass flux to the aquifer system.
For this analysis, TDS concentrations along with EC values converted to TDS concentrations were used to evaluate the spatial and temporal distribution of salinity in groundwater underlying irrigated agriculture, from a total of 308 wells.
Table 7‐2 provides summary statistics for wells that were sampled for TDS and EC in the Dixon/Solano Subwatershed. In this analysis, the most recent sample data available for each well was used. In the Dixon/Solano Subwatershed, 44 percent of most recent wells had TDS values above the recommended secondary MCL of 500 mg/L, and 4 percent of wells had TDS values exceeding the upper limit secondary MCL of 1,000 mg/L. The average concentration is 517 mg/L, which is around the secondary recommended MCL. It should be noted that not all of these wells necessarily overlie irrigated agriculture areas, but represent the general water quality of groundwater in the entire subwatershed.
TABLE 7-2 Dixon/Solano Subwatershed: Most Recent TDS Results at Each Well
Agency
Total Number of wells with TDS result
# wells less than 250 ft deep
# wells more than 250 ft deep
# wells with
unknown depth
# of wells above
500 mg/L
# of wells above
1,000 mg/L
Concentration (mg/L) Range of most
recent data Min. Max. Average
USGS (NWIS and GAMA)
112 67 44 1 58 6 234 2,000 554 1946‐2005
DWR (all)* 116 116 63 5 212 3,370 570.2 1965‐1990
CDPH 80 80 15 1 57.1 1,000 426.6 1989‐2012
Total 308 67 44 197 136 (44%) 12 (4%) 57.1 3,370 516.9
* Depth is either total well depth or sample depth.

SECTION 7 DIXON/SOLANO SUBWATERSHED
WBG091013074126SAC 7-5
The distribution of TDS in groundwater is presented on Figure 7‐4. From this geographic distribution, areas of high salinity are generally found in the Delta area and in the eastern portion of the Subwatershed. The proximity to the Delta probably has a large influence on the high salinity in groundwater for this subwatershed due to salt water intrusion and tidal influences.
Based on the kriging analysis performed using these wells and other wells within the Sacramento Valley area, the following is observed:
136 sections overlie groundwater with TDS concentrations less than 500 mg/L, which encompass approximately 41,700 acres of agriculture.
216 sections overlie groundwater with TDS concentrations between 500 and 1,000 mg/L, which encompass approximately 67,300 acres of agriculture.
4 sections overlie groundwater with TDS concentrations above 1,000 mg/L, which encompass approximately 1,200 acres of agriculture.
3 sections do not include sufficient wells with TDS results to estimate the generalized groundwater TDS concentration under 80 acres of agriculture.
These results are further evaluated below to determine areas of high vulnerability, low vulnerability, and data gaps.
Graphs of TDS for wells that have more than 5 sample results are provided in Appendix I. These graphs give an indication of TDS concentration trends over time to help identify whether land use practices at the surface are acting to reduce the mass flux of TDS to the groundwater system (decreasing trend in TDS concentration). In areas where TDS concentrations are elevated and stable, natural sources are likely the cause of salinity, and where TDS concentrations are increasing, land use and irrigation water sources may influence the overall salinity in the aquifer. Figure 7‐5 shows where these wells are located and depicts the TDS concentration trends based on a statistical method.
7.2.1.3 Pesticides A summary of pesticides detected in groundwater in each of the counties and groundwater basins in the Sacramento River Watershed is provided in Appendix J.
7.2.1.4 Other Constituents of Concern The Dixon/Solano Subwatershed has no particular documented constituents of concern apart from nitrate.
7.2.2 Susceptibility Factors 7.2.2.1 Hydrogeology The SACFEM results (Figure 7‐6) show that the areas of highest susceptibility from hydrogeology are located in an area between Dixon and Vacaville, in the Southern portion of the subwatershed in the Delta, and along the Putah Creek.
7.2.2.2 Soils and Agronomy Figure 7‐7 shows the section‐level analysis of the individual and total NHI scores. The total NHI score shows that areas of highest susceptibility to soils and agronomy occur in the area northeast of Dixon. Soil scores and irrigation practices dominate the total NHI score. The majority of the crops in this subwatershed are flood irrigated, which results in a high irrigation score with the NHI tool.
7.3 Conclusions The vulnerability of groundwater was assessed using a combination of susceptibility indicators and groundwater quality monitoring results. The vulnerability designation concepts and methodology are described in detail in Section 4. Based on this analysis, and taking into consideration the susceptibility and water quality results described above, a vulnerability map for potential groundwater contamination due to nitrate was developed for this subwatershed and shown on Figure 7‐8.
SECTION 7 DIXON/SOLANO SUBWATERSHED
7-6 WBG091013074126SAC
On the valley floor of this subwatershed, there are 91 sections designated low vulnerability, 148 sections designated moderate vulnerability, and 87 sections designated as high vulnerability. A few data gap areas also exist.
The high‐vulnerability sections are concentrated in the northeastern portion of the subwatershed, primarily due to high nitrate concentrations. Some of these sections surround the City of Dixon, which owns and operates a wastewater treatment facility located in farmland to the southeast of the city. Dixon is currently implementing a program to reduce the nitrate load percolating in from their wastewater storage and percolation ponds, which is regulated under its own WDR. The monitoring program workplan and implementation will have to take this potential source of nitrate load to groundwater into account, to better assess the influence of irrigated agriculture on groundwater quality impacts.
A large portion of the subwatershed also is vulnerable with respect to salinity with high TDS concentrations that result in 62% of the sections including irrigated agricultural lands overlying groundwater that has TDS concentrations above 500 mg/L. The Delta area is a known area of high salinity due to salt water intrusion from the Bay, and should not be considered high vulnerability with respect to salt from irrigated agriculture. Most of the areas of high salinity are irrigated with surface water; therefore, agricultural practices do not pose a threat for the accumulation of salts in soil root zone in those areas. However, areas that irrigate fields with groundwater in the northeastern portion of the subwatershed might need to be monitored more closely for salinity.
Data gap sections due to a lack of nitrate concentration results are located in the Delta area and in the corridor between Interstates 80 and 505. Additional data monitoring will be needed in these areas to assess the potential vulnerability of groundwater to irrigated agricultural practices.
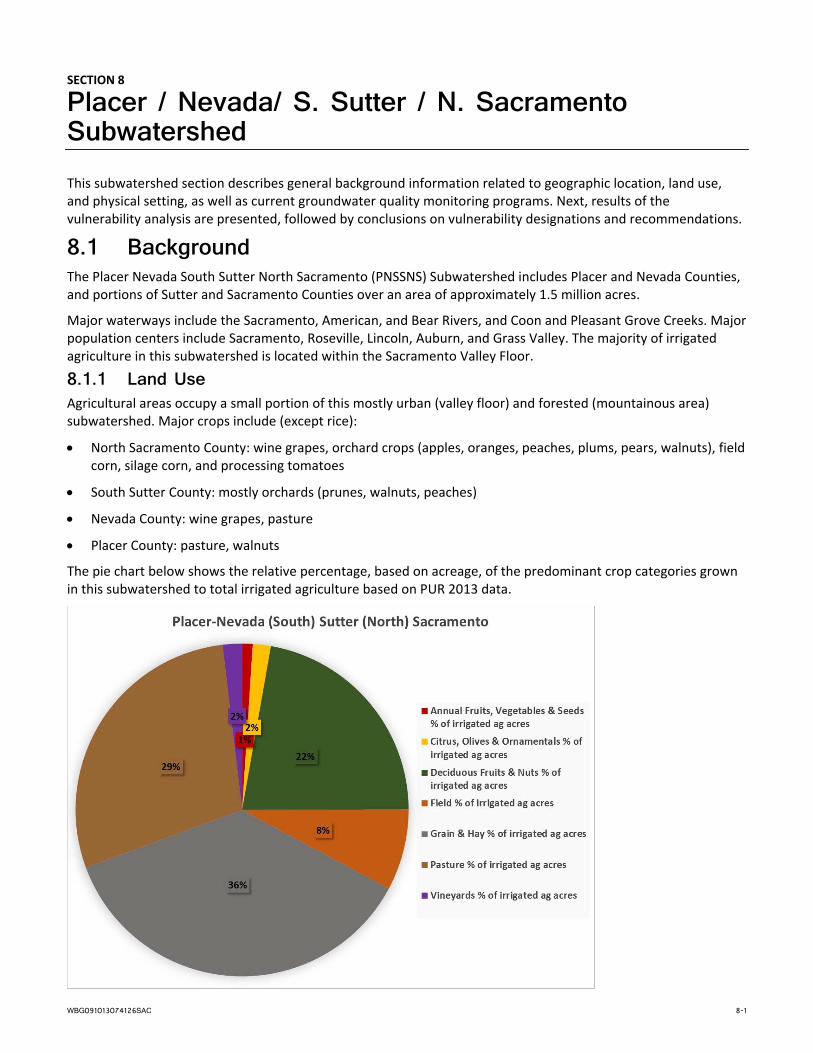
WBG091013074126SAC 8-1
SECTION 8
Placer / Nevada/ S. Sutter / N. Sacramento Subwatershed This subwatershed section describes general background information related to geographic location, land use, and physical setting, as well as current groundwater quality monitoring programs. Next, results of the vulnerability analysis are presented, followed by conclusions on vulnerability designations and recommendations.
8.1 Background The Placer Nevada South Sutter North Sacramento (PNSSNS) Subwatershed includes Placer and Nevada Counties, and portions of Sutter and Sacramento Counties over an area of approximately 1.5 million acres.
Major waterways include the Sacramento, American, and Bear Rivers, and Coon and Pleasant Grove Creeks. Major population centers include Sacramento, Roseville, Lincoln, Auburn, and Grass Valley. The majority of irrigated agriculture in this subwatershed is located within the Sacramento Valley Floor.
8.1.1 Land Use Agricultural areas occupy a small portion of this mostly urban (valley floor) and forested (mountainous area) subwatershed. Major crops include (except rice):
North Sacramento County: wine grapes, orchard crops (apples, oranges, peaches, plums, pears, walnuts), field corn, silage corn, and processing tomatoes
South Sutter County: mostly orchards (prunes, walnuts, peaches)
Nevada County: wine grapes, pasture
Placer County: pasture, walnuts
The pie chart below shows the relative percentage, based on acreage, of the predominant crop categories grown in this subwatershed to total irrigated agriculture based on PUR 2013 data.

SECTION 8 PLACER / NEVADA/ S. SUTTER / N. SACRAMENTO SUBWATERSHED
8-2 WBG091013074126SAC
The top left map in Figure 8‐1 illustrates the distribution of irrigated agriculture in the PNSSNS Subwatershed by crop category. From this geographic distribution, the following are observed:
South Sutter County has orchards along the Feather and Bear Rivers and interspersed field crops, pasture, and grain and hay crops.
North Sacramento County has field crops, pasture and grain and hay crops, primarily along the Sacramento River.
Nevada County has some vineyards and dispersed pasture crops.
Placer County has orchards, field crops, pasture, and grain and hay on the valley floor. No irrigated crops are grown in the mountainous portion of the county.
According to the Coalition data, there were approximately 27,543 acres of enrolled irrigated lands for this subwatershed in 2012 and 26,049 acres in 2013.
8.1.2 Soils Soils characteristics play a major role in cropping patterns and farming practices, and influence the retention or infiltration of water and nutrients/pesticides through the subsurface. Understanding soil properties under irrigated agricultural lands is therefore important in assessing potential vulnerabilities to groundwater quality degradation. A brief description of soils conditions in this subwatershed is summarized below.
Soil Texture:
Soils in the PNSSNS Subwatershed consist of clay and silty clay in the vicinity of the Sacramento River, sandy loam and loam on the Valley floor, and loam and sandy loam in the foothills.
Soil Drainage:
Soils are somewhat poorly drained to moderately well drained along the Sacramento River.
The rest of the Subwatershed consists of mostly well drained soils.
Soil Hydraulic Conductivity:
Soil hydraulic conductivity in the vicinity of the Sacramento River (Natomas Basin) is moderately low.
North of the American River, soils tend to have low soil hydraulic conductivity.
The rest of the subwatershed has moderately high soil hydraulic conductivity with areas of high soil hydraulic conductivity.
Soil Salinity, Alkalinity, and Acidity:
The PNSSNS Subwatershed has nonsaline soils.
The Natomas Basin area has slightly alkaline soils. North of the American River soils tend to be ultra acidic, while the rest of the subwatershed has soils ranging from slightly acidic to ultra acidic in a progression from the valley floor to the foothills and mountainous area.
8.1.3 Geology and Hydrogeology The PNSSNS Subwatershed overlies the North American Subbasin of the Sacramento Valley Groundwater Basin, which is bound to the north by the Bear River, to the west by the Feather River, and to the south by the Sacramento River. The eastern boundary is a north‐south line extending from the Bear River south to Folsom Lake, which passes about 2 miles east of the town of Lincoln and represents the approximate edge of the alluvial basin (DWR 2003). The general direction of drainage is west‐southwest at an average grade of about 5 percent.
DWR Bulletin 118 provides the following description of the North American Subbasin geology: “The water‐bearing materials are dominated by unconsolidated continental deposits including volcanics, older alluvium, and younger alluvium. The alluvium can be characterized as comprising the upper aquifer system, occupying the upper 200 to 300 feet below ground surface; older geologic units can be characterized as comprising the lower aquifer system,

SECTION 8 PLACER / NEVADA/ S. SUTTER / N. SACRAMENTO SUBWATERSHED
WBG091013074126SAC 8-3
occurring generally deeper than 300 feet toward the west side of the subbasin. The cumulative thickness of these deposits increases from a few hundred feet near the Sierra Nevada foothills on the east to over 2,000 feet along the western margin of the subbasin” (DWR 2003).
The North American subbasin underlies portions of Sutter, Placer, and Sacramento Counties, which include dense urban areas where concentrated groundwater extraction occurred since at least the 1950s, resulting in local cones of depression (for example, east of downtown Sacramento). In general, since around the mid‐1990s, water levels remain stable in the southern portion of the subbasin, and in some cases groundwater elevations are continuing to increase slightly in response to increases in conjunctive use. Groundwater levels in Sutter and northern Placer Counties generally have remained stable, although some wells in southern Sutter County have experienced declines (DWR 2003). The Nevada County portion of the Subwatershed does not overlie a groundwater basin as designated by DWR; fracture rock aquifers dominate this area.
As shown in Figure 2‐10, initial HVAs and GPAs are located along the Sacramento and American Rivers, in the Delta, and along some of the east side streams.
Depth to groundwater for sections containing irrigated agriculture, as simulated by SACFEM in April 2010, varies between 2 and 22 feet along the Sacramento and Feather Rivers, and is generally deeper than 43 feet in the rest of the valley floor.
8.1.4 Current Programs and Groundwater Monitoring Groundwater quality is well monitored in the major urban area of this subwatershed, the Sacramento Metro area. The Sacramento Groundwater Authority (SGA), which overlies a portion of the North American Subbasin, maintains a database of well data since the early 1990s. All SGA member agencies monitor their production wells for water quality, which includes approximately 260 public supply wells. Other cities and public water supply agencies that use groundwater monitor their wells to ensure groundwater quality compliance with CCR Title 22 as required by CDPH.
In addition, many wells are regularly monitored by DWR, SGA, USGS, and by CASGEM monitoring entities for groundwater levels in the PNSSNS groundwater subbasin. Those wells vary in depth and might be suitable for future groundwater quality monitoring. Maps of the location of CASGEM wells for each county are shown in Appendix H.
8.2 Vulnerability Analysis Results The vulnerability analysis was performed by reviewing groundwater quality data and susceptibility factors (hydrogeology, and soils and agronomy). The technical details related to the data processing that went into performing this analysis is described in Section 4.
Since the majority of the subwatershed portion that is farmed lies within the valley floor, the SACFEM area‐based analysis is applicable for the PNSSNS Subwatershed. Maps of each susceptibility and vulnerability index distribution are shown in Figures 8‐1 through 8‐8. A discussion of results and final scores for each of the factors follows below.
8.2.1 Groundwater Quality The review of groundwater quality for the vulnerability analysis focuses on nitrate, salinity, and pesticides. Other constituents of concern are reviewed as necessary, based on documented occurrences.
In Placer and Nevada Counties, groundwater quality is generally good (acceptable for drinking water purposes) with some exceptions in wells that have high arsenic concentrations and sometimes high manganese concentrations. Groundwater in the shallower aquifer is generally of higher quality than that of the lower aquifer; the lower aquifer tends to have higher TDS, iron, manganese, and arsenic levels than the shallow aquifer (City of Roseville et al. 2007). Similarly, in the SGA area, the upper aquifer tends to have higher quality groundwater than the lower aquifer. The groundwater has generally good chemistry (low nitrate), although there are several contaminant plumes and point sources of contamination (SGA 2008).

SECTION 8 PLACER / NEVADA/ S. SUTTER / N. SACRAMENTO SUBWATERSHED
8-4 WBG091013074126SAC
The area along the Sacramento River extending from Sacramento International Airport northward to the Bear River contains high levels of TDS, chloride, sodium, bicarbonate, manganese, and arsenic. The highest levels of TDS are found in an area extending between Reclamation District 1001 and the Sutter Bypass, with maximum reported TDS exceeding 1,000 mg/L. There are three sites within the North American Subbasin with significant groundwater contamination issues: the former McClellan Air Force Base, the Union Pacific Railroad Rail Yard in Roseville, and the Aerojet Superfund Site plume extending north under the American River. In the deeper portions of the aquifer, the groundwater geochemistry indicates the occurrence of connate water from the marine sediments underlying the freshwater aquifer, which mixes with the fresh water. Elevated levels of TDS, chloride, sodium, bicarbonate, boron, fluoride, nitrate, iron, manganese, and arsenic may be of concern in some areas of the Subbasin (DWR 2003).
8.2.1.1 Nitrate The PNSSNS Subwatershed NO3 analysis is based on a review of the concentration of the most recent sampling at each well from 410 wells located in this subwatershed and for which records were readily available. Table 8‐1 provides summary statistics for wells that were sampled for NO3 in the PNSSNS Subwatershed. Two percent of most recent wells had nitrate values above half the MCL, while less than 1 percent of wells had nitrate values exceeding the primary MCL of 45 mg/L. The average concentration is 5.8 mg/L, well below half the MCL. It should be noted that these wells are not necessarily restricted to irrigated agricultural areas, but represent the general water quality of groundwater in the entire subwatershed.
TABLE 8-1 PNSSNS Subwatershed: Most Recent NO3 Results at Each Well
Agency
Total number of wells with NO3 result
# wells less than 250 ft deep
# wells more than 250 ft deep
# wells with
unknown depth
# of wells above 0.5 MCL
# of wells above MCL
Concentration (mg/L) Range of most
recent data Min. Max. Average
USGS (NWIS and GAMA)
33 24 9 0 2 0 <RL 28.9 9.6 1997‐2012
DWR (all)* 158 12 25 121 0 0 <RL 21 3.5 1950‐2012
CDPH 219 219 6 1 <RL 52.2 4.4 1990‐2012
Total 410 36 34 340 8 (2%) 1 (0.2%) <RL 52.2 5.8
* Depth is either total well depth or sample depth.
The distribution of nitrate in groundwater is presented on Figure 8‐2. From this geographic distribution, available well data show that nitrate is generally found in low concentrations in this subwatershed.
Based on the kriging analysis performed using these wells and other wells within the Sacramento Valley area, the following is observed:
231 sections overlie groundwater with nitrate concentrations below half the MCL, which encompass approximately 28,987 acres of agriculture.
None of the sections overlie groundwater with nitrate concentrations between half the MCL and the MCL; even though 8 wells have concentrations above half the MCL, the section average of all nitrate data is below the half the MCL in this subwatershed.
None of the sections overlie groundwater with nitrate concentrations above the MCL.
8 sections do not include sufficient wells with nitrate results to estimate the generalized groundwater nitrate concentration under 802 acres of agriculture.
These results are further evaluated below to determine areas of high vulnerability and low vulnerability, as well as areas with insufficient data to make this determination and are identified as data gaps.

SECTION 8 PLACER / NEVADA/ S. SUTTER / N. SACRAMENTO SUBWATERSHED
WBG091013074126SAC 8-5
Graphs of NO3 for wells that have more than 5 sample results are provided in Appendix I. These graphs give an indication of nitrate concentration trends over time to help identify if land use practices at the surface are acting to reduce the mass flux of nitrate to the groundwater system (decreasing trend in nitrate concentration) or continuing to add nitrate mass to the aquifer (increasing trend) of groundwater quality. Figure 8‐3 shows where these wells are located and depicts the nitrate concentration trends based on a statistical method.
8.2.1.2 Salinity As described in Section 4, salinity levels in groundwater are reviewed to identify areas of the aquifer with elevated values. High salinity levels in groundwater can be problematic when groundwater is used as the primary source of irrigation water, because this practice can potentially lead to accumulation of salts in the subsurface, creating the potential for long‐term mass flux to the aquifer system.
For this analysis, TDS concentrations along with EC values converted to TDS concentrations were used to evaluate the spatial and temporal distribution of salinity in groundwater underlying irrigated agriculture, from a total of 618 wells.
Table 8‐2 provides summary statistics for wells that were sampled for TDS and EC in the PNSSNS Subwatershed. In this analysis, the most recent sample data available for each well was used. In the PNSSNS Subwatershed, 8 percent of most recent wells had TDS values above the recommended secondary MCL of 500 mg/L, and 2 percent of wells had TDS values exceeding the upper limit secondary MCL of 1,000 mg/L. The average concentration is 257 mg/L, which is below half the secondary recommended MCL of 500 mg/L. This attests to the very low salinity in this subwatershed. It should be noted that not all of these wells necessarily overlie irrigated agriculture areas, but represent the general water quality of groundwater in the entire subwatershed.
TABLE 8-2 PNSSNS Subwatershed: Most Recent TDS Results at Each Well
Agency
Total number of wells with TDS result
# wells less than 250 ft deep
# wells more than 250 ft deep
# wells with
unknown depth
# of wells above
500 mg/L
# of wells above
1,000 mg/L
Concentration (mg/L) Range of most
recent data Min. Max. Average
USGS (NWIS and GAMA)
234 162 69 3 21 5 58 1,740 262.5 1969‐2012
DWR (all)* 300 15 27 258 25 6 23 2,760 284.2 1955‐2012
CDPH 84 84 1 0 18 720 224.3 1990‐2012
Total 618 177 96 345 47 (8%) 11 (2%) 18 2,760 257.0
* Depth is either total well depth or sample depth.
The distribution of TDS in groundwater is presented on Figure 8‐4. From this geographic distribution, there is an area of higher salinity in the Sutter Basin (South Sutter County), which is known for shallow saline water, due to geologic conditions.
Based on the kriging analysis performed using these wells and other wells within the Sacramento Valley area, the following is observed:
200 sections overlie groundwater with TDS concentrations less than 500 mg/L, which encompass approximately 22,062 acres of agriculture.
34 sections overlie groundwater with TDS concentrations between 500 and 1,000 mg/L, which encompass approximately 7,510 acres of agriculture.
2 sections overlie groundwater with TDS concentrations above 1,000 mg/L, which encompass approximately 218 acres of agriculture.
These results are further evaluated below to determine areas of high vulnerability, low vulnerability, and data gaps.

SECTION 8 PLACER / NEVADA/ S. SUTTER / N. SACRAMENTO SUBWATERSHED
8-6 WBG091013074126SAC
Graphs of TDS for wells that have more than 5 sample results are provided in Appendix I. These graphs give an indication of TDS concentration trends over time to help identify if land use practices at the surface are acting to reduce the mass flux of TDS to the groundwater system (decreasing trend in TDS concentration). In areas where TDS concentrations are elevated and stable, natural sources are likely the cause of salinity and where TDS concentrations are increasing, land use and irrigation water sources may influence the overall salinity in the aquifer. Figure 8‐5 shows where these wells are located and depicts the TDS concentration trends based on a statistical method.
8.2.1.3 Pesticides A summary of pesticides detected in groundwater in each of the counties and groundwater basins in the Sacramento River Watershed is provided in Appendix J.
8.2.1.4 Other Constituents of Concern Other constituents of concern include arsenic, manganese, and iron, mostly in the deeper aquifer, and various contaminant plumes in the Sacramento Metropolitan area.
8.2.2 Susceptibility Factors 8.2.2.1 Hydrogeology The SACFEM results (Figure 8‐6) show that the areas of highest susceptibility from hydrogeology are located along the Sacramento and Feather Rivers.
8.2.2.2 Soils and Agronomy Figure 8‐7 shows the section‐level analysis of the individual and total NHI scores. The total NHI score shows that areas of highest susceptibility from soils and agronomy occur on the valley floor, interspersed with areas of low susceptibility. The majority of the subwatershed has areas of low susceptibility from soils and agronomy.
The portion of the subwatershed east of Lincoln and Roseville (foothill area) has irrigated agricultural areas with unclassified soil scores, which precludes a final NHI score calculation for these areas.
8.3 Conclusions The vulnerability of groundwater was assessed using a combination of susceptibility indicators and groundwater quality monitoring results. The vulnerability designation concepts and methodology are described in detail in Section 4. Based on this analysis, and taking into consideration the susceptibility and water quality results described above, a vulnerability map for potential groundwater contamination due to nitrate was developed for this subwatershed and is shown on Figure 8‐8.
The areas outside of the Valley floor are considered low vulnerability due to the excellent water quality and sparse irrigated agricultural areas. On the valley floor, there are 111 sections designated low vulnerability, 88 sections designated moderate vulnerability, and 20 sections designated as high vulnerability. A few data gap areas also exist.
The few sections designated as high vulnerability in this subwatershed are scattered along the Sacramento and Feather Rivers due to the higher geologic susceptibility in those areas. However, the effect of groundwater dilution from stream recharge to the aquifer might actually help lessen the potential for nitrate accumulation in the groundwater. In addition, based on the groundwater quality results described above, there are generally no high nitrate areas in groundwater underlying irrigated agricultural areas in the PNSSNS Subwatershed. Therefore, these areas might not be considered high vulnerability if nitrate concentration data were available for these specific sections.
Salinity is high in the Sutter Basin area due to natural conditions. Agricultural lands in this area do not use groundwater as a source for irrigation water; therefore, agricultural practices do not pose a threat for the accumulation of salts in soil root zone. No high vulnerability sections due to salinity are identified in this subwatershed.
SECTION 8 PLACER / NEVADA/ S. SUTTER / N. SACRAMENTO SUBWATERSHED
WBG091013074126SAC 8-7
Potential data gap areas, for groundwater quality, due to a lack of nitrate data, include the Sutter Basin area west of highway 99 and the Natomas Basin area.

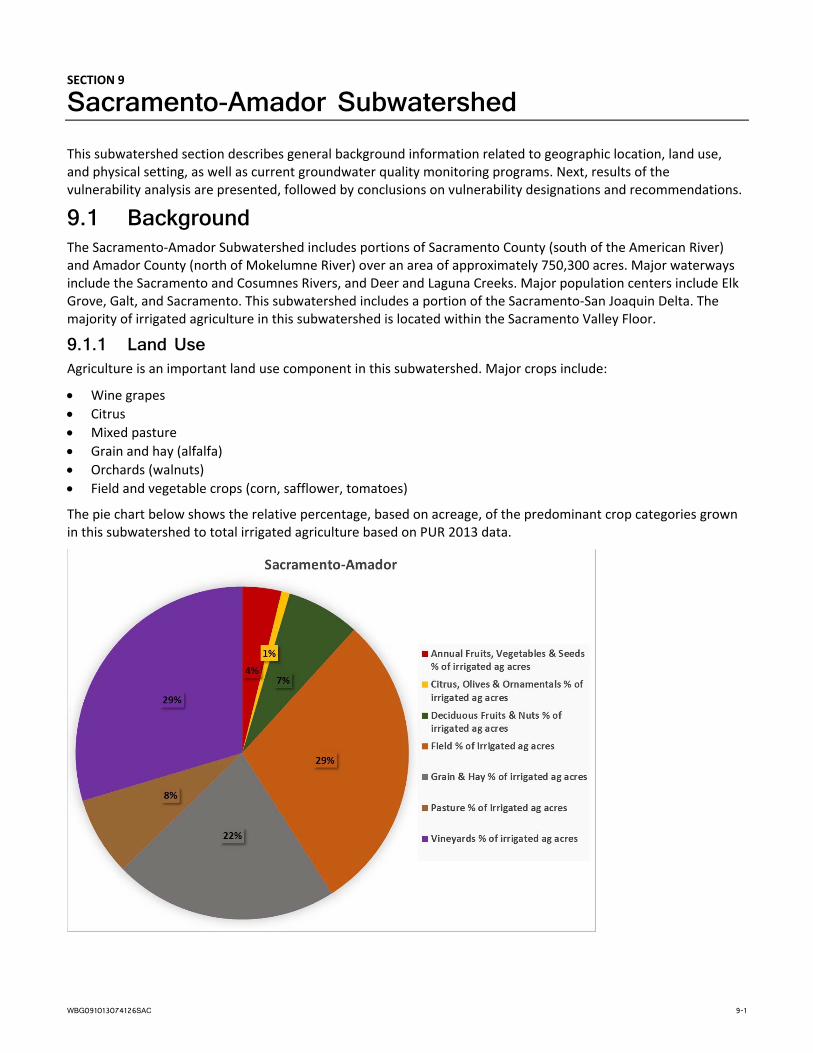
WBG091013074126SAC 9-1
SECTION 9
Sacramento-Amador Subwatershed This subwatershed section describes general background information related to geographic location, land use, and physical setting, as well as current groundwater quality monitoring programs. Next, results of the vulnerability analysis are presented, followed by conclusions on vulnerability designations and recommendations.
9.1 Background The Sacramento‐Amador Subwatershed includes portions of Sacramento County (south of the American River) and Amador County (north of Mokelumne River) over an area of approximately 750,300 acres. Major waterways include the Sacramento and Cosumnes Rivers, and Deer and Laguna Creeks. Major population centers include Elk Grove, Galt, and Sacramento. This subwatershed includes a portion of the Sacramento‐San Joaquin Delta. The majority of irrigated agriculture in this subwatershed is located within the Sacramento Valley Floor.
9.1.1 Land Use Agriculture is an important land use component in this subwatershed. Major crops include:
Wine grapes
Citrus
Mixed pasture
Grain and hay (alfalfa)
Orchards (walnuts)
Field and vegetable crops (corn, safflower, tomatoes)
The pie chart below shows the relative percentage, based on acreage, of the predominant crop categories grown in this subwatershed to total irrigated agriculture based on PUR 2013 data.

SECTION 9 SACRAMENTO-AMADOR SUBWATERSHED
9-2 WBG091013074126SAC
The top left map in Figure 9‐1 illustrates the distribution of irrigated agriculture in the Sacramento‐Amador Subwatershed by crop category. From this geographic distribution, the following are observed:
Vineyards and field crops make up over half of the irrigated crops in the subwatershed.
Vineyards are grown east of the Sacramento River, in the Delta along the Cosumnes River, and in the foothills of Amador County.
Field crops are mostly grown in the Delta portion of the subwatershed.
Some orchards are grown in the northern Delta.
Grain and hay crops and pasture are interspersed with the other dominant crops.
According to the Coalition data, there were approximately 121,093 acres of enrolled irrigated lands for this subwatershed in 2012, and 121,353 acres in 2013.
9.1.2 Soils Soils characteristics play a major role in cropping patterns and farming practices, and influence the retention or infiltration of water and nutrients/pesticides through the subsurface. Understanding soil properties under irrigated agricultural lands is therefore important in assessing potential vulnerabilities to groundwater quality degradation. A brief description of soils conditions in this subwatershed is summarized below.
Soil Texture:
Soils in the Sacramento‐Amador Subwatershed consist of clay and clay loam in the Delta area, silt loam, and loam intermixed with silt loam in the valley floor, and bands of silt loam and loam in the foothills.
Soil Drainage:
The Delta area has very poorly drained soils.
The valley floor has moderately well drained soils with a few areas of poorly drained soils.
The foothills have well drained to excessively well drained soils.
Soil Hydraulic Conductivity:
Soil hydraulic conductivity in the Delta is generally high, and moderately high with areas of high hydraulic conductivity in the rest of the subwatershed.
Soil Salinity, Alkalinity, and Acidity:
The Sacramento‐Amador Subwatershed has nonsaline soils, with some areas of very slightly saline soils in the Delta area.
The Delta has areas of ultra‐acidic soils, while the rest of the subwatershed also shows acidic soil properties, but to a lesser degree, ranging from strongly acidic to neutral.
9.1.3 Geology and Hydrogeology The Sacramento‐Amador Subwatershed overlies the South American Subbasin (in the northern portion of the subwatershed) and a small portion of the Solano Subbasin (in the Delta) of the Sacramento Valley Groundwater Basin, and a portion of the Cosumnes Subbasin of the San Joaquin River Groundwater Basin, according to the subbasins delineated by DWR in Bulletin 118 (DWR 2003).
In general, shallow groundwater conditions and extensive groundwater–surface water interaction characterize the Delta area. Spring runoff generated by melting snow in the Sierra Nevada increases flows in the Sacramento and San Joaquin rivers and their tributaries and cause groundwater levels near the rivers to rise. Because the Delta is a large floodplain and the shallow groundwater is hydraulically connected to the surface water, changes in river stages affect groundwater levels and vice versa. Groundwater levels in the central Delta are very shallow, and land subsidence on several islands has resulted in groundwater levels close to the ground surface. Maintaining groundwater levels below crop rooting zones is critical for successful agriculture, especially for islands

SECTION 9 SACRAMENTO-AMADOR SUBWATERSHED
WBG091013074126SAC 9-3
that lie below sea level. Many farmers rely on an intricate network of drainage ditches and pumps to maintain groundwater levels of about 3 to 6 feet below ground surface. The accumulated agricultural drainage is pumped through or over the levees and is discharged into adjoining streams and canals (USGS 2000). Groundwater generally flows from the Sierra Nevada on the east toward the low‐lying lands of the Delta to the west.
The South American Groundwater Subbasin is bounded on the east by the Sierra Nevada, on the west by the Sacramento River, on the north by the American River, and on the south by the Cosumnes and Mokelumne Rivers. DWR Bulletin 118 provides the following description of the South American Subbasin geology: “The South American Subbasin aquifer system is comprised of continental deposits of Late Tertiary to Quaternary age. These deposits include younger alluvium (consisting of flood basin deposits, dredge tailings and stream channel deposits), older alluvium, and volcanics. The cumulative thickness of these deposits increases from a few hundred feet near the Sierra Nevada foothills on the east to over 2,500 feet along the western margin of the subbasin. The maximum combined thickness of all the younger alluvial units is about 100 feet” (DWR 2003).
Groundwater levels in the South American and Cosumnes Subbasins have fluctuated over the past 40 years, with the lowest levels occurring during periods of drought. Over the past 60 years, a general lowering of groundwater elevations was caused by intensive use of groundwater in the region. A large cone of depression is centered on the southwestern portion of the basin. Areas affected by municipal pumping show a lower groundwater level recovery than other areas (DWR 2003).
As shown on in Figure 2‐10, initial HVAs and GPAs are located along the Sacramento and American Rivers, in the Delta, and along some of the east side streams.
Depth to groundwater for sections containing irrigated agriculture, as simulated by SACFEM in April 2010, is less than 2 feet below ground surface in the Delta and generally deeper than 43 feet below ground surface on the valley floor. East of the Delta, the area between the foothills and the valley floor has depth to water that transitions between 10 feet below groundwater surface closest to the Delta and over 75 feet below ground surface toward the foothills.
9.1.4 Current Programs and Groundwater Monitoring The Sacramento County Water Agency (SCWA) partners with DWR, USGS, and Sacramento State University to monitor groundwater levels and groundwater quality as part of several programs (SCWA 2006):
Monitoring of groundwater levels and quality through participation in the DWR Well Monitoring Program.
Monitoring of groundwater levels and quality at California State University, Sacramento (CSUS).
Monitoring of groundwater quality by the USGS as part of its National Water Quality Assessment Program (NAWQA).
The Southeast Sacramento County Agricultural Water Authority outlines a groundwater quality monitoring program in its 2002 GWMP.
Additional groundwater quality monitoring occurs along the Cosumnes River (Cosumnes River Preserve) with a collaboration between The Nature Conservancy and UC Davis.
In addition, many wells are regularly monitored by DWR, SCWA, Amador Water Agency, USGS, and by CASGEM monitoring entities for groundwater levels in the Sacramento‐Amador groundwater subbasins. Those wells vary in depth and might be suitable for future groundwater quality monitoring. Maps of the location of CASGEM wells for each county are shown in Appendix H.
9.2 Vulnerability Analysis Results The vulnerability analysis was performed by reviewing groundwater quality data and susceptibility factors (hydrogeology, and soils and agronomy). The technical details related to the data processing that went into performing this analysis is described in Section 4.
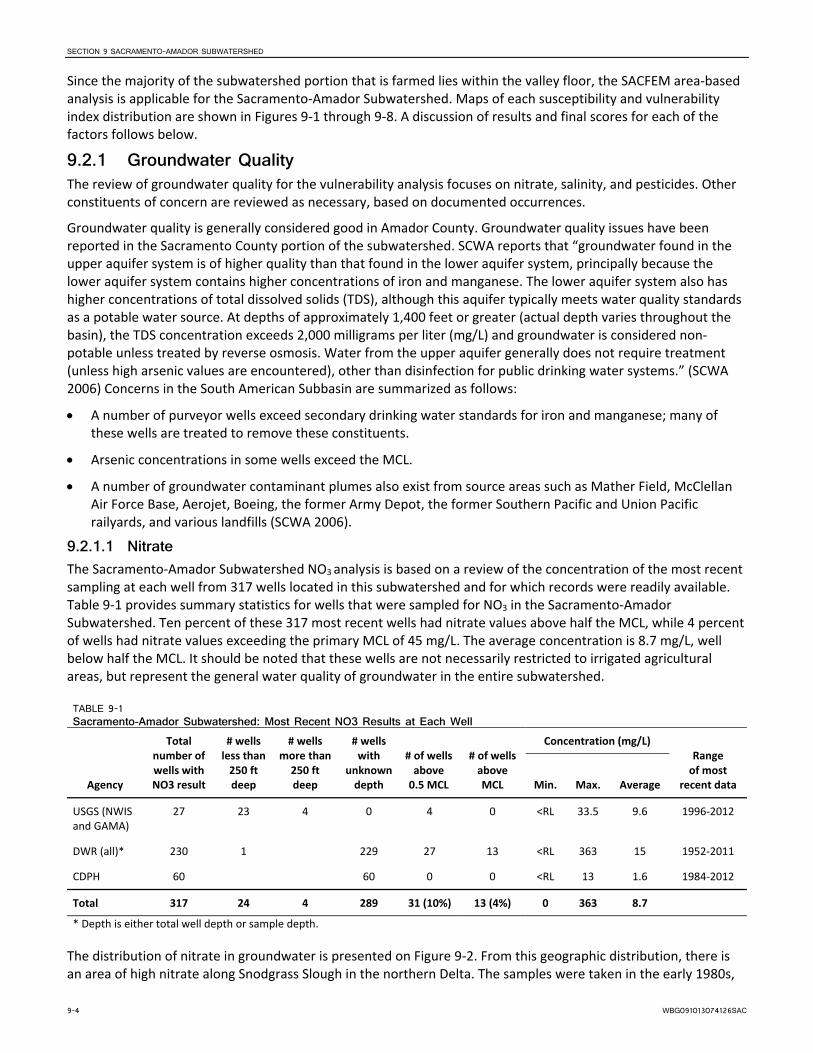
SECTION 9 SACRAMENTO-AMADOR SUBWATERSHED
9-4 WBG091013074126SAC
Since the majority of the subwatershed portion that is farmed lies within the valley floor, the SACFEM area‐based analysis is applicable for the Sacramento‐Amador Subwatershed. Maps of each susceptibility and vulnerability index distribution are shown in Figures 9‐1 through 9‐8. A discussion of results and final scores for each of the factors follows below.
9.2.1 Groundwater Quality The review of groundwater quality for the vulnerability analysis focuses on nitrate, salinity, and pesticides. Other constituents of concern are reviewed as necessary, based on documented occurrences.
Groundwater quality is generally considered good in Amador County. Groundwater quality issues have been reported in the Sacramento County portion of the subwatershed. SCWA reports that “groundwater found in the upper aquifer system is of higher quality than that found in the lower aquifer system, principally because the lower aquifer system contains higher concentrations of iron and manganese. The lower aquifer system also has higher concentrations of total dissolved solids (TDS), although this aquifer typically meets water quality standards as a potable water source. At depths of approximately 1,400 feet or greater (actual depth varies throughout the basin), the TDS concentration exceeds 2,000 milligrams per liter (mg/L) and groundwater is considered non‐potable unless treated by reverse osmosis. Water from the upper aquifer generally does not require treatment (unless high arsenic values are encountered), other than disinfection for public drinking water systems.” (SCWA 2006) Concerns in the South American Subbasin are summarized as follows:
A number of purveyor wells exceed secondary drinking water standards for iron and manganese; many of these wells are treated to remove these constituents.
Arsenic concentrations in some wells exceed the MCL.
A number of groundwater contaminant plumes also exist from source areas such as Mather Field, McClellan Air Force Base, Aerojet, Boeing, the former Army Depot, the former Southern Pacific and Union Pacific railyards, and various landfills (SCWA 2006).
9.2.1.1 Nitrate The Sacramento‐Amador Subwatershed NO3 analysis is based on a review of the concentration of the most recent sampling at each well from 317 wells located in this subwatershed and for which records were readily available. Table 9‐1 provides summary statistics for wells that were sampled for NO3 in the Sacramento‐Amador Subwatershed. Ten percent of these 317 most recent wells had nitrate values above half the MCL, while 4 percent of wells had nitrate values exceeding the primary MCL of 45 mg/L. The average concentration is 8.7 mg/L, well below half the MCL. It should be noted that these wells are not necessarily restricted to irrigated agricultural areas, but represent the general water quality of groundwater in the entire subwatershed.
TABLE 9-1 Sacramento-Amador Subwatershed: Most Recent NO3 Results at Each Well
Agency
Total number of wells with NO3 result
# wells less than 250 ft deep
# wells more than 250 ft deep
# wells with
unknown depth
# of wells above 0.5 MCL
# of wells above MCL
Concentration (mg/L) Range of most
recent data Min. Max. Average
USGS (NWIS and GAMA)
27 23 4 0 4 0 <RL 33.5 9.6 1996‐2012
DWR (all)* 230 1 229 27 13 <RL 363 15 1952‐2011
CDPH 60 60 0 0 <RL 13 1.6 1984‐2012
Total 317 24 4 289 31 (10%) 13 (4%) 0 363 8.7
* Depth is either total well depth or sample depth.
The distribution of nitrate in groundwater is presented on Figure 9‐2. From this geographic distribution, there is an area of high nitrate along Snodgrass Slough in the northern Delta. The samples were taken in the early 1980s,
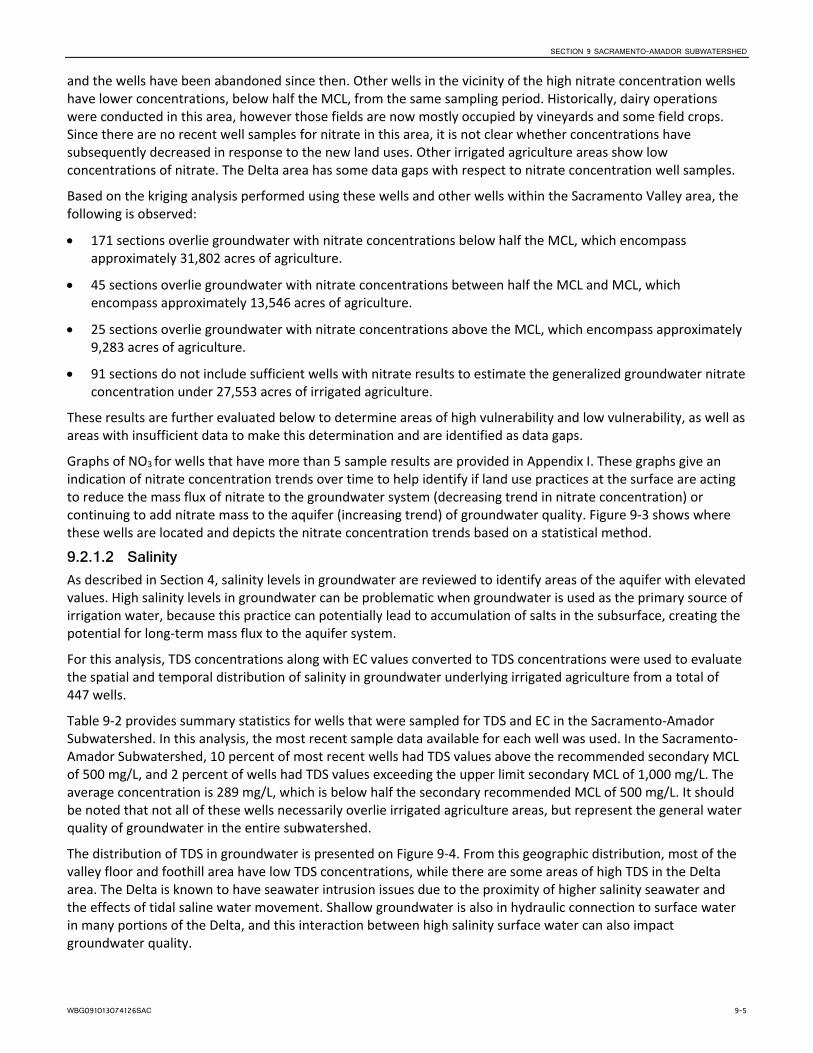
SECTION 9 SACRAMENTO-AMADOR SUBWATERSHED
WBG091013074126SAC 9-5
and the wells have been abandoned since then. Other wells in the vicinity of the high nitrate concentration wells have lower concentrations, below half the MCL, from the same sampling period. Historically, dairy operations were conducted in this area, however those fields are now mostly occupied by vineyards and some field crops. Since there are no recent well samples for nitrate in this area, it is not clear whether concentrations have subsequently decreased in response to the new land uses. Other irrigated agriculture areas show low concentrations of nitrate. The Delta area has some data gaps with respect to nitrate concentration well samples.
Based on the kriging analysis performed using these wells and other wells within the Sacramento Valley area, the following is observed:
171 sections overlie groundwater with nitrate concentrations below half the MCL, which encompass approximately 31,802 acres of agriculture.
45 sections overlie groundwater with nitrate concentrations between half the MCL and MCL, which encompass approximately 13,546 acres of agriculture.
25 sections overlie groundwater with nitrate concentrations above the MCL, which encompass approximately 9,283 acres of agriculture.
91 sections do not include sufficient wells with nitrate results to estimate the generalized groundwater nitrate concentration under 27,553 acres of irrigated agriculture.
These results are further evaluated below to determine areas of high vulnerability and low vulnerability, as well as areas with insufficient data to make this determination and are identified as data gaps.
Graphs of NO3 for wells that have more than 5 sample results are provided in Appendix I. These graphs give an indication of nitrate concentration trends over time to help identify if land use practices at the surface are acting to reduce the mass flux of nitrate to the groundwater system (decreasing trend in nitrate concentration) or continuing to add nitrate mass to the aquifer (increasing trend) of groundwater quality. Figure 9‐3 shows where these wells are located and depicts the nitrate concentration trends based on a statistical method.
9.2.1.2 Salinity As described in Section 4, salinity levels in groundwater are reviewed to identify areas of the aquifer with elevated values. High salinity levels in groundwater can be problematic when groundwater is used as the primary source of irrigation water, because this practice can potentially lead to accumulation of salts in the subsurface, creating the potential for long‐term mass flux to the aquifer system.
For this analysis, TDS concentrations along with EC values converted to TDS concentrations were used to evaluate the spatial and temporal distribution of salinity in groundwater underlying irrigated agriculture from a total of 447 wells.
Table 9‐2 provides summary statistics for wells that were sampled for TDS and EC in the Sacramento‐Amador Subwatershed. In this analysis, the most recent sample data available for each well was used. In the Sacramento‐Amador Subwatershed, 10 percent of most recent wells had TDS values above the recommended secondary MCL of 500 mg/L, and 2 percent of wells had TDS values exceeding the upper limit secondary MCL of 1,000 mg/L. The average concentration is 289 mg/L, which is below half the secondary recommended MCL of 500 mg/L. It should be noted that not all of these wells necessarily overlie irrigated agriculture areas, but represent the general water quality of groundwater in the entire subwatershed.
The distribution of TDS in groundwater is presented on Figure 9‐4. From this geographic distribution, most of the valley floor and foothill area have low TDS concentrations, while there are some areas of high TDS in the Delta area. The Delta is known to have seawater intrusion issues due to the proximity of higher salinity seawater and the effects of tidal saline water movement. Shallow groundwater is also in hydraulic connection to surface water in many portions of the Delta, and this interaction between high salinity surface water can also impact groundwater quality.
SECTION 9 SACRAMENTO-AMADOR SUBWATERSHED
9-6 WBG091013074126SAC
TABLE 9-2 Sacramento-Amador Subwatershed: Most Recent TDS Results at Each Well
Agency
Total number of wells with TDS result
# wells less than 250 ft deep
# wells more than 250 ft deep
# wells with
unknown depth
# of wells above
500 mg/L
# of wells above
1,000 mg/L
Concentration (mg/L) Range of most
recent data Min. Max. Average
USGS (NWIS and GAMA)
169 119 49 1 16 4 86.4 2,440 269.2 1969‐2012
DWR (all)* 237 1 2 234 21 7 77 5,380 280 1962‐2012
CDPH 41 41 7 0 26 984 318 1987‐2012
Total 447 120 51 276 44 (10%) 11 (2%) 26 5,380 289.1
* Depth is either total well depth or sample depth.
Based on the kriging analysis performed using these wells and other wells within the Sacramento Valley area, the following is observed:
208 sections overlie groundwater with TDS concentrations less than 500 mg/L, which encompass approximately 49,283 acres of agriculture.
103 sections overlie groundwater with TDS concentrations between 500 and 1,000 mg/L, which encompass approximately 29,519 acres of agriculture.
1 section overlies groundwater with TDS concentrations above 1,000 mg/L, which encompasses approximately 496 acres of agriculture.
20 sections do not include sufficient wells with TDS results to estimate the generalized groundwater TDS concentration under 2,885 acres of agriculture.
These results are further evaluated below to determine areas of high vulnerability, low vulnerability, and data gaps.
Graphs of TDS for wells that have more than 5 sample results are provided in Appendix I. These graphs give an indication of TDS concentration trends over time, to help identify if land use practices at the surface are acting to reduce the mass flux of TDS to the groundwater system (decreasing trend in TDS concentration). In areas where TDS concentrations are elevated and stable, natural sources are likely the cause of salinity and where TDS concentrations are increasing, land use and irrigation water sources may influence the overall salinity in the aquifer. Figure 9‐5 shows where these wells are located and depicts the TDS concentration trends based on a statistical method.
9.2.1.3 Pesticides A summary of pesticides detected in groundwater in each of the counties and groundwater basins in the Sacramento River Watershed is provided in Appendix J.
9.2.1.4 Other Constituents of Concern Other constituents of concern include iron, manganese, arsenic, and various contaminant plumes in the Sacramento Metropolitan area. Arsenic is a naturally occurring constituent that has also been found in surface water in the Grand Island region of the Delta.
9.2.2 Susceptibility Factors 9.2.2.1 Hydrogeology The SACFEM results (Figure 9‐6) show that the areas of highest susceptibility from hydrogeology are located in the Delta area and along the Sacramento River.
SECTION 9 SACRAMENTO-AMADOR SUBWATERSHED
WBG091013074126SAC 9-7
9.2.2.2 Soils and Agronomy Figure 9‐7 shows the section‐level analysis of the individual and total NHI scores. The total NHI score shows that areas of highest susceptibility from soils and agronomy occur in the dispersed areas on the valley floor (mostly due to flood irrigation) and the Amador County foothills (mostly due to coarse soils types). Those areas tend to be associated with high soils and irrigation scores. Some irrigated agricultural areas also have unclassified soil scores (notably in Amador County), which precludes a final NHI score calculation for these areas.
9.3 Conclusions The vulnerability of groundwater was assessed using a combination of susceptibility indicators and groundwater quality monitoring results. The vulnerability designation concepts and methodology are described in detail in Section 4. Based on this analysis, and taking into consideration the susceptibility and water quality results described above, a vulnerability map for potential groundwater contamination due to nitrate was developed for this subwatershed and is shown on Figure 9‐8.
The areas outside of the valley floor are considered low vulnerability due to the excellent water quality and sparse irrigated agricultural areas. On the valley floor (within the SACFEM model boundary), there are 108 sections designated low vulnerability, 133 sections designated moderate vulnerability, and 76 sections designated as high vulnerability. A few data gap areas also exist.
The only irrigated agriculture area that shows high vulnerability due to high nitrate values is along Snodgrass Slough in the Delta. However, there are no recent data available at those same shallow wells that were sampled in the 1980s, and the land use has significantly changed over the last 3 decades (shift from dairies to vineyards and field crops). Newer deeper wells in that area show elevated but stable nitrate concentrations. Since the susceptibility factors associated with hydrogeology are high, this area will be considered high vulnerability until better information is available.
In addition, based on the groundwater quality results described above, the Delta area has high levels of TDS that are naturally occurring from salt water intrusion, which does not constitute a high vulnerability designation due to salinity for this subwatershed.
Potential data gap areas for groundwater quality, due to a lack of nitrate and TDS data, include the southern Delta area.


WBG091013074126SAC 10-1
SECTION 10
Shasta/Tehama Subwatershed This subwatershed section describes general background information related to geographic location, land use, and physical setting, as well as current groundwater quality monitoring programs. Next, results of the vulnerability analysis are presented, followed by conclusions on vulnerability designations and recommendations.
10.1 Background The Shasta Tehama Subwatershed includes all of Tehama County and Shasta County below Shasta Dam over an area of approximately 3 million acres. Major waterways include the Sacramento River, and Thomes, Elder, Cottonwood, Red Bank, Burch, and Cow Creeks. Major population centers include Redding, Red Bluff, and Corning. The majority of irrigated agriculture in this subwatershed is located within the Sacramento Valley Floor.
10.1.1 Land Use Agriculture is a significant land use in this subwatershed. Major crops include:
Pasture
Orchards (walnuts, prunes, plums, almonds)
Olives
Field and forage crops (corn, dry beans, wheat)
The pie chart below shows the relative percentage, based on acreage, of the predominant crop categories grown in this subwatershed to total irrigated agriculture based on PUR 2013 data.
The top left map in Figure 10‐1 illustrates the distribution of irrigated agriculture in the Shasta Tehama Subwatershed by crop category. From this geographic distribution, the following are observed:
Orchards, the largest crop category in this subwatershed, are grown primarily along the Sacramento River.
Pasture, the second largest crop category, is grown throughout the subwatershed.
Citrus, primarily olive trees, are clustered around the Corning area.

SECTION 10 SHASTA/TEHAMA SUBWATERSHED
10-2 WBG091013074126SAC
Grain and hay crops tend to be grown on the western side along the Coast Range.
Field crops are scattered in‐between orchards and pasture.
According to the Coalition data, there were approximately 69,746 acres of enrolled irrigated lands for this subwatershed in 2012 and 71,603 acres in 2013.
10.1.2 Soils Soils characteristics play a major role in cropping patterns and farming practices, and influence the retention or infiltration of water and nutrients/pesticides through the subsurface. Understanding soil properties under irrigated agricultural lands is therefore important in assessing potential vulnerabilities to groundwater quality degradation. A brief description of soils conditions in this subwatershed is summarized below.
Soil Texture:
Soils in the Shasta Tehama Subwatershed are dominated by loam with silt loam and clay loam by the river beds.
Soil Drainage:
This subwatershed has well drained soils for the most part.
A few areas show moderately well drained soils, and the waterways tend to have excessively drained soils.
Soil Hydraulic Conductivity:
Soil hydraulic conductivity the western portion of the subwatershed tends to have moderately high hydraulic conductivity, while the eastern portion is dominated by high hydraulic conductivity soils.
Soil Salinity, Alkalinity, and Acidity:
The Shasta Tehama Subwatershed has nonsaline soils.
West of the Sacramento River, soils are generally neutral to moderately alkaline, with some pockets of strongly acidic soils.
East of the Sacramento River, soils are acidic, ranging from slightly acidic near the River to strongly acidic in the mountainous areas.
10.1.3 Geology and Hydrogeology The Shasta Tehama Subwatershed overlies the Corning, Red Bluff, Bend, Antelope, Dye Creek, Los Molinos, and a portion of the Vina Subbasins of the Sacramento Valley Groundwater Basin (in the Tehama County portion of the subwatershed). In addition, this subwatershed overlies the Redding Area Groundwater Basin, which is to the north of the Sacramento Valley Groundwater Basin.
In the Tehama County portion of the subwatershed, marine sediments forming a structural trough are overlain by subsequent deposits of mudflow‐transported volcanic materials, as well as alluvial sediments deposited from the surrounding mountains. These water‐bearing materials are between 1,000 and 2,000 feet deep (Tehama County 2012). Recharge to groundwater primarily occurs along the rivers, and also from deep percolation of agricultural irrigation on the valley floor.
“The Redding Basin is bounded on the east by the dissected alluvial terraces, which form the foothills of the Cascade Range. The interior of the Redding Basin is characterized by stream channels, floodplain, and natural levees of the Sacramento River and its tributaries. Alluvial fans are also present near the confluence of tributaries with the Sacramento River. The Redding Groundwater Basin consists of a sediment‐filled, southward‐plunging, symmetrical trough. Simultaneous deposition of material from the Coast Range and the Cascade Range resulted in two different formations, which are the principal freshwater‐bearing formations in the basin. The Tuscan Formation, in the east, is derived from Cascade Range volcanic sediments, and the Tehama Formation, in the western and northwest portion of the basin, is derived from Coast

SECTION 10 SHASTA/TEHAMA SUBWATERSHED
WBG091013074126SAC 10-3
Range sediments. These formations are up to 2,000 feet thick near the confluence of the Sacramento River and Cottonwood Creek; the Tuscan Formation is generally more permeable and productive than the Tehama Formation. Groundwater recharge occurs in the higher elevations through stream seepage and direct infiltration of precipitation. Rivers and streams transition to gaining streams at lower elevations and receive direct groundwater discharge” (Shasta County Water Agency 2007).
As shown in Figure 2‐10, initial HVAs and GPAs are located along the Sacramento River and some of the east side streams. The Redding Basin also has areas delineated as GPAs, particularly in the Rosewood, Anderson, Enterprise, and Millville Subbasins.
Depth to groundwater for sections containing irrigated agriculture, as simulated by SACFEM in April 2010, varies between 2 and 22 feet along the Sacramento River, and is generally deeper than 43 feet in the western portion of the subwatershed.
10.1.4 Current Programs and Groundwater Monitoring Tehama County has collaborated with public agencies (notably USGS, DWR, DPR, and SWRCB) to sample groundwater for various constituents in 34 deep wells and 223 shallow domestic wells in 2005‐2007. Tehama County does not currently own or manage a groundwater quality monitoring network (Tehama County 2012). Shasta County’s groundwater management plan includes provisions for adding groundwater quality monitoring wells in the Redding Basin.
In addition, many wells are regularly monitored by DWR, Tehama County, Shasta County, and by CASGEM monitoring entities for groundwater levels in both the Sacramento Valley and Redding Area Groundwater Basins. Those wells vary in depth and might be suitable for future groundwater quality monitoring, depending on available well construction information. Maps of the location of CASGEM wells for each county are shown in Appendix H.
10.2 Vulnerability Analysis Results The vulnerability analysis was performed by reviewing groundwater quality data and susceptibility factors (hydrogeology, and soils and agronomy). The technical details related to the data processing that went into performing this analysis is described in Section 4.
Since the majority of the subwatershed portion that is farmed lies within the valley floor, the SACFEM area‐based analysis is applicable for the Shasta Tehama Subwatershed. Maps of each susceptibility and vulnerability index distribution are shown in Figures 10‐1 through 10‐8. A discussion of results and final scores for each of the factors follows below.
10.2.1 Groundwater Quality The review of groundwater quality for the vulnerability analysis focuses on nitrate, salinity, and pesticides. Other constituents of concern are reviewed as necessary, based on documented occurrences.
Groundwater quality is generally considered good in Tehama County with a few localized exceptions. Groundwater quality issues have been reported in this subwatershed for the following areas:
The Red Bluff/Antelope area has nitrate issues, possibly due to septic systems (Glenn County 2005).
Los Molinos has arsenic, aluminum, and chromium issues in its drinking water wells (Tehama County 2012). However, Los Molinos is in the process of addressing some of its groundwater quality issues.
Boron is an issue in the Bend, Antelope, and Dye Creek Subbasins (Tehama County 2012).
Some of these constituents are found in levels that can negatively impact municipal/domestic and agricultural beneficial uses of groundwater.

SECTION 10 SHASTA/TEHAMA SUBWATERSHED
10-4 WBG091013074126SAC
10.2.1.1 Nitrate The Shasta Tehama Subwatershed NO3 analysis is based on a review of the concentration of the most recent sampling at each well from 1123 wells located in this subwatershed and for which records were readily available. Table 10‐1 provides summary statistics for wells that were sampled for NO3 in the Shasta Tehama Subwatershed. Six percent of most recent wells had nitrate values above half the MCL, while 2 percent of wells had nitrate values exceeding the primary MCL of 45 mg/L. The average concentration is 7.3 mg/L, well below half the MCL. It should be noted that these wells are not necessarily restricted to irrigated agricultural areas, but represent the general water quality of groundwater in the entire subwatershed.
TABLE 10-1 Shasta Tehama Subwatershed: Most Recent NO3 Results at Each Well
Agency
Total number of wells with NO3 result
# wells less than 250 ft deep
# wells more than 250 ft deep
# wells with
unknown depth
# of wells above 0.5 MCL
# of wells above MCL
Concentration (mg/L) Range of most
recent data Min. Max. Average
USGS (NWIS and GAMA)
71 49 15 2 3 1 <RL 45 4.7 1979‐2010
DWR (all)* 428 428 46 15 <RL 579 10.3 1935‐2013
SWRCB‐GAMA
194 194 10 2 1.1 60 8 2005
CDPH 430 430 11 1 <RL 102.8 6 1984‐2013
Total 1,123 49 15 1054 70 (6%) 19 (2%) 1.1 579 7.3
* Depth is either total well depth or sample depth.
The distribution of nitrate in groundwater is presented on Figure 10‐2. From this geographic distribution, areas of high nitrate occur primarily in and north of the Red Bluff area.
Based on the kriging analysis performed using these wells and other wells within the Sacramento Valley area, the following is observed:
419 sections overlie groundwater with nitrate concentrations below half the MCL, which encompass approximately 86,042 acres of agriculture.
6 sections overlie groundwater with nitrate concentrations between half the MCL and the MCL, which encompass approximately 351 acres of agriculture.
None of the sections overlies groundwater with nitrate concentrations above the MCL; even though 19 wells exceed the MCL, the section average of all nitrate data is below the MCL in this subwatershed.
29 sections do not include sufficient wells with nitrate results to estimate the generalized groundwater nitrate concentration under 3,568 acres of agriculture.
These results are further evaluated below to determine areas of high vulnerability and low vulnerability, as well as areas with insufficient data to make this determination and are identified as data gaps.
Graphs of NO3 for wells that have more than 5 sample results are provided in Appendix I. These graphs give an indication of nitrate concentration trends over time to help identify if land use practices at the surface are acting to reduce the mass flux of nitrate to the groundwater system (decreasing trend in nitrate concentration) or continuing to add nitrate mass to the aquifer (increasing trend) of groundwater quality. Figure 10‐3 shows where these wells are located and depicts the nitrate concentration trends based on a statistical method.
10.2.1.2 Salinity As described in Section 4, salinity levels in groundwater are reviewed to identify areas of the aquifer with elevated values. High salinity levels in groundwater can be problematic when groundwater is used as the primary source of

SECTION 10 SHASTA/TEHAMA SUBWATERSHED
WBG091013074126SAC 10-5
irrigation water, because this practice can potentially lead to accumulation of salts in the subsurface, creating the potential for long‐term mass flux to the aquifer system.
For this analysis, TDS concentrations along with EC values converted to TDS concentrations were used to evaluate the spatial and temporal distribution of salinity in groundwater underlying irrigated agriculture, from a total of 1,051 wells.
Table 10‐2 provides summary statistics for wells that were sampled for TDS and EC in the Shasta Tehama Subwatershed. In this analysis, the most recent sample data available for each well was used. In the Shasta Tehama Subwatershed, 2 percent of most recent wells had TDS values above the recommended secondary MCL of 500 mg/L, and less than 1 percent of wells had TDS values exceeding the upper limit secondary MCL of 1,000 mg/L. The average concentration is 235 mg/L, which is below half the secondary recommended MCL of 500 mg/L. This attests to the very low salinity in this subwatershed. It should be noted that not all of these wells necessarily underlie irrigated agriculture areas, but represent the general water quality of groundwater in the entire subwatershed.
TABLE 10-2 Shasta Tehama Subwatershed: Most Recent TDS Results at Each Well
Agency
Total number of wells with TDS result
# wells less than 250 ft deep
# wells more than 250 ft deep
# wells with
unknown depth
# of wells above
500 mg/L
# of wells above
1,000 mg/L
Concentration (mg/L) Range of most
recent data Min. Max. Average
USGS (NWIS and GAMA)
247 196 46 5 2 0 77 620 204 1970‐2010
DWR (all)* 306 306 5 2 58 27,800 316.6 1935‐2013
SWRCB‐GAMA
223 223 5 0 91 600 229.7 2005
CDPH 275 275 5 1 34 1,000 189.4 1988‐2013
Total 1,051 196 46 809 17 (2%) 3 (0.3%) 34 27,800 234.9
* Depth is either total well depth or sample depth.
The distribution of TDS in groundwater is presented on Figure 10‐4. From this geographic distribution, it is apparent that salinity is not an issue in the Shasta Tehama Subwatershed, with only a small area north of Red Bluff showing a few wells with elevated TDS values.
Based on the kriging analysis performed using these wells and other wells within the Sacramento Valley area, the following is observed:
405 sections overlie groundwater with TDS concentrations less than 500 mg/L, which encompass approximately 83,073 acres of agriculture.
None of the sections overlies groundwater with TDS concentrations between 500 and 1,000 mg/L; even though 17 wells have TDS concentrations above 500 mg/L, the section average of all salinity data is below 500 mg/L in this subwatershed.
None of the sections overlies groundwater with TDS concentrations above 1,000 mg/L; only 3 wells have TDS concentrations above 1,000 mg/L, and therefore the section average of all salinity data is below 1,000 mg/L in this subwatershed.
49 sections do not include sufficient wells with TDS results to estimate the generalized groundwater TDS concentration under 6,888 acres of agriculture.
These results are further evaluated below to determine areas of high vulnerability, low vulnerability, and data gaps.

SECTION 10 SHASTA/TEHAMA SUBWATERSHED
10-6 WBG091013074126SAC
Graphs of TDS for wells that have more than 5 sample results are provided in Appendix I. These graphs give an indication of TDS concentration trends over time to help identify if land use practices at the surface are acting to reduce the mass flux of TDS to the groundwater system (decreasing trend in TDS concentration). In areas where TDS concentrations are elevated and stable, natural sources are likely the cause of salinity and where TDS concentrations are increasing, land use and irrigation water sources may influence the overall salinity in the aquifer. Figure 10‐5 shows where these wells are located and depicts the TDS concentration trends based on a statistical method.
10.2.1.3 Pesticides A summary of pesticides detected in groundwater in each of the counties and groundwater basins in the Sacramento River Watershed is provided in Appendix J.
10.2.1.4 Other Constituents of Concern Other constituents of concern include arsenic, boron, aluminum, and chromium in some localized areas of the Shasta Tehama Subwatershed. These constituents are naturally occurring and are potentially the result of geological occurrences.
10.2.2 Susceptibility Factors 10.2.2.1 Hydrogeology The SACFEM results (Figure 10‐6) show that the areas of highest susceptibility from hydrogeology are located along the Sacramento River between Red Bluff and southeast of Corning. Note that the SACFEM model does not encompass the Redding Basin area of the Subwatershed. However, the vast majority of the irrigated agricultural areas lie within the SACFEM model area, and therefore, this analysis interprets hydrogeology data for the largest irrigated agricultural area of the subwatershed.
10.2.2.2 Soils and Agronomy Figure 10‐7 shows the section‐level analysis of the individual and total NHI scores. The total NHI score shows that areas of highest susceptibility to soils and agronomy occur in the Redding Basin due to a combination of high soil scores and irrigation scores. Some irrigated agricultural areas also have unclassified soil scores (on the margins of the valley floor and in the foothills to the east), which precludes a final NHI score calculation for these areas.
10.3 Conclusions The vulnerability of groundwater was assessed using a combination of susceptibility indicators and groundwater quality monitoring results. The vulnerability designation concepts and methodology are described in detail in Section 4. Based on this analysis, and taking into consideration the susceptibility and water quality results described above, a vulnerability map for potential groundwater contamination due to nitrate was developed for this subwatershed and is shown on Figure 10‐8.
On the valley floor of this subwatershed (within the SACFEM model boundary), there are 30 sections designated low vulnerability, 74 sections designated moderate vulnerability, and 273 sections designated as high vulnerability. A few data gap areas also exist.
The few high vulnerability sections for the Shasta Tehama Subwatershed are located in the Red Bluff area and east of Corning, mostly due to high nitrate concentrations and high susceptibility in these areas. Salinity is not an issue in the Shasta Tehama Subwatershed.
Potential data gap areas for groundwater quality, due to a lack of nitrate and TDS data, include areas in the western portion of the subwatershed. However, an assessment of actual irrigated lands should be performed before conducting any new monitoring in this area.

WBG091013074126SAC 11-1
SECTION 11
Yolo Subwatershed This subwatershed section describes general background information related to geographic location, land use, and physical setting, as well as current groundwater quality monitoring programs. Next, results of the vulnerability analysis are presented, followed by conclusions on vulnerability designations and recommendations.
11.1 Background The Yolo Subwatershed includes all of Yolo County and a small portion of Colusa County over an area of approximately 653,300 acres. Major waterways include the Sacramento River, Cache Creek, Putah Creek, and Willow Slough. Major population centers include West Sacramento, Davis, Woodland, and Winters. This entire subwatershed is located within the Sacramento Valley Floor.
The Yolo Bypass is located within Yolo County, and includes some agricultural operations, especially rice.
11.1.1 Land Use Agriculture is a major land use in this subwatershed. Major crops (excluding rice) include:
Field crops (alfalfa hay, wheat, field corn)
Wine grapes,
Orchards (walnuts, prunes, almonds)
Vegetables (mostly processing tomatoes)
Seed crops (dry beans, sunflowers)
The pie chart below shows the relative percentage, based on acreage, of the predominant crop categories grown in this subwatershed to total irrigated agriculture based on PUR 2013 data.
The top left map in Figure 11‐1 illustrates the distribution of irrigated agriculture in the Yolo Subwatershed by crop category. Irrigated agriculture in Yolo County is distributed as a mosaic of various crops across the landscape. Annuals and field crops dominate the northeastern portion of the County, along the Sacramento River. Vineyards
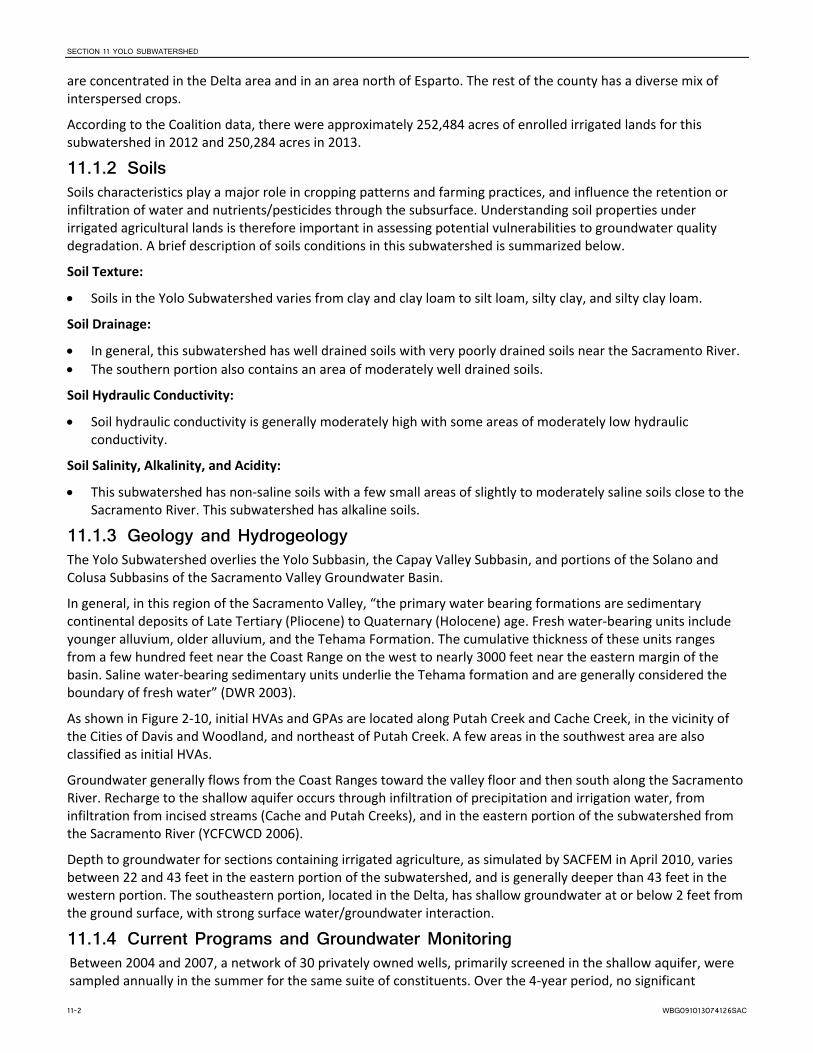
SECTION 11 YOLO SUBWATERSHED
11-2 WBG091013074126SAC
are concentrated in the Delta area and in an area north of Esparto. The rest of the county has a diverse mix of interspersed crops.
According to the Coalition data, there were approximately 252,484 acres of enrolled irrigated lands for this subwatershed in 2012 and 250,284 acres in 2013.
11.1.2 Soils Soils characteristics play a major role in cropping patterns and farming practices, and influence the retention or infiltration of water and nutrients/pesticides through the subsurface. Understanding soil properties under irrigated agricultural lands is therefore important in assessing potential vulnerabilities to groundwater quality degradation. A brief description of soils conditions in this subwatershed is summarized below.
Soil Texture:
Soils in the Yolo Subwatershed varies from clay and clay loam to silt loam, silty clay, and silty clay loam.
Soil Drainage:
In general, this subwatershed has well drained soils with very poorly drained soils near the Sacramento River.
The southern portion also contains an area of moderately well drained soils.
Soil Hydraulic Conductivity:
Soil hydraulic conductivity is generally moderately high with some areas of moderately low hydraulic conductivity.
Soil Salinity, Alkalinity, and Acidity:
This subwatershed has non‐saline soils with a few small areas of slightly to moderately saline soils close to the Sacramento River. This subwatershed has alkaline soils.
11.1.3 Geology and Hydrogeology The Yolo Subwatershed overlies the Yolo Subbasin, the Capay Valley Subbasin, and portions of the Solano and Colusa Subbasins of the Sacramento Valley Groundwater Basin.
In general, in this region of the Sacramento Valley, “the primary water bearing formations are sedimentary continental deposits of Late Tertiary (Pliocene) to Quaternary (Holocene) age. Fresh water‐bearing units include younger alluvium, older alluvium, and the Tehama Formation. The cumulative thickness of these units ranges from a few hundred feet near the Coast Range on the west to nearly 3000 feet near the eastern margin of the basin. Saline water‐bearing sedimentary units underlie the Tehama formation and are generally considered the boundary of fresh water” (DWR 2003).
As shown in Figure 2‐10, initial HVAs and GPAs are located along Putah Creek and Cache Creek, in the vicinity of the Cities of Davis and Woodland, and northeast of Putah Creek. A few areas in the southwest area are also classified as initial HVAs.
Groundwater generally flows from the Coast Ranges toward the valley floor and then south along the Sacramento River. Recharge to the shallow aquifer occurs through infiltration of precipitation and irrigation water, from infiltration from incised streams (Cache and Putah Creeks), and in the eastern portion of the subwatershed from the Sacramento River (YCFCWCD 2006).
Depth to groundwater for sections containing irrigated agriculture, as simulated by SACFEM in April 2010, varies between 22 and 43 feet in the eastern portion of the subwatershed, and is generally deeper than 43 feet in the western portion. The southeastern portion, located in the Delta, has shallow groundwater at or below 2 feet from the ground surface, with strong surface water/groundwater interaction.
11.1.4 Current Programs and Groundwater Monitoring Between 2004 and 2007, a network of 30 privately owned wells, primarily screened in the shallow aquifer, were sampled annually in the summer for the same suite of constituents. Over the 4‐year period, no significant

SECTION 11 YOLO SUBWATERSHED
WBG091013074126SAC 11-3
changes in concentrations were observed, and the program was halted in 2007. A few of these wells and some additional wells were also sampled in 2012 for a nitrate finger‐printing study (YCFCWCD 2012). Currently, there are no routine groundwater quality monitoring activities being conducted by agricultural entities in the subwatershed. DWR monitors a small number of wells for water quality on a regular basis.
The YCFCWCD and other agencies in the Yolo Subwatershed monitor a large network of wells for water levels semiannually (spring and fall). In addition, Yolo County has wells that are regularly monitored by DWR and by CASGEM monitoring entities for groundwater levels. Those wells vary in depth and might be suitable for future groundwater quality monitoring. Maps of the location of CASGEM wells for Yolo County are shown in Appendix H.
11.2 Vulnerability Analysis Results The vulnerability analysis was performed by reviewing groundwater quality data and susceptibility factors (hydrogeology, and soils and agronomy). The technical details related to the data processing that went into performing this analysis is described in Section 4.
Since the entire subwatershed is within the valley floor, the SACFEM area‐based analysis is applicable for the Yolo Subwatershed. Maps of each susceptibility and vulnerability index distribution in Figures 11‐1 through 11‐8. A discussion of results and final scores for each of the factors follows below.
11.2.1 Groundwater Quality The review of groundwater quality for this vulnerability analysis focuses on nitrate, salinity, and pesticides. Other constituents of concern are reviewed as necessary, based on documented occurrences.
As described in the 2006 Yolo County GWMP, “Groundwater quality is variable in Yolo County. The deep aquifer (601‐1500 ft) tends to be of higher quality than the shallow aquifer (0‐220 ft), while the intermediate aquifer (221‐600 ft) is of intermediate quality. Electrical Conductivity (saltiness) and nitrate are increasing in both the shallow and intermediate aquifers. Boron is a problem in some areas.”
Nitrate is particularly a problem near the Cities of Davis and Woodland, which currently rely on groundwater for their drinking water supply. Some public supply wells had to be abandoned because of high levels of nitrate. High levels of TDS and nitrate are most likely related to irrigated agricultural practices (CVRWQCB 2008).
It should be noted that, because of well‐documented nitrate and salt issues in groundwater, the Yolo County area is one of three selected areas by the CV‐Salts effort for an Implementation Study. This further indicates that this area has highly impacted groundwater and that implementation actions are necessary. A larger amount of detailed information on salt and nutrient loading is available for Yolo County than for other parts of the Sacramento Valley. In particular, draft modeling results for salt and nutrient loading were developed by the CV‐Salts technical team and show that nitrate loading to the aquifer is estimated at approximately 6.4 million pounds per year.
11.2.1.1 Nitrate The Yolo Subwatershed NO3 analysis is based on a review of the concentration of the most recent sampling at each well from 394 wells located in this subwatershed and for which records were readily available. Table 11‐1 provides summary statistics for wells that were sampled for NO3 in the Yolo Subwatershed. Twenty‐four percent of the sampled wells had nitrate values above half the MCL, while 7 percent of wells had nitrate values exceeding the primary MCL of 45 mg/L. The average concentration is less than 13.2 mg/L, well below half the MCL. It should be noted that these wells are not necessarily restricted to irrigated agricultural areas, but represent the general water quality of groundwater in the entire subwatershed.
The distribution of nitrate in groundwater is presented on Figure 11‐2. From this geographic distribution it is apparent that areas of high nitrate occur primarily around the cities of Davis and Woodland.
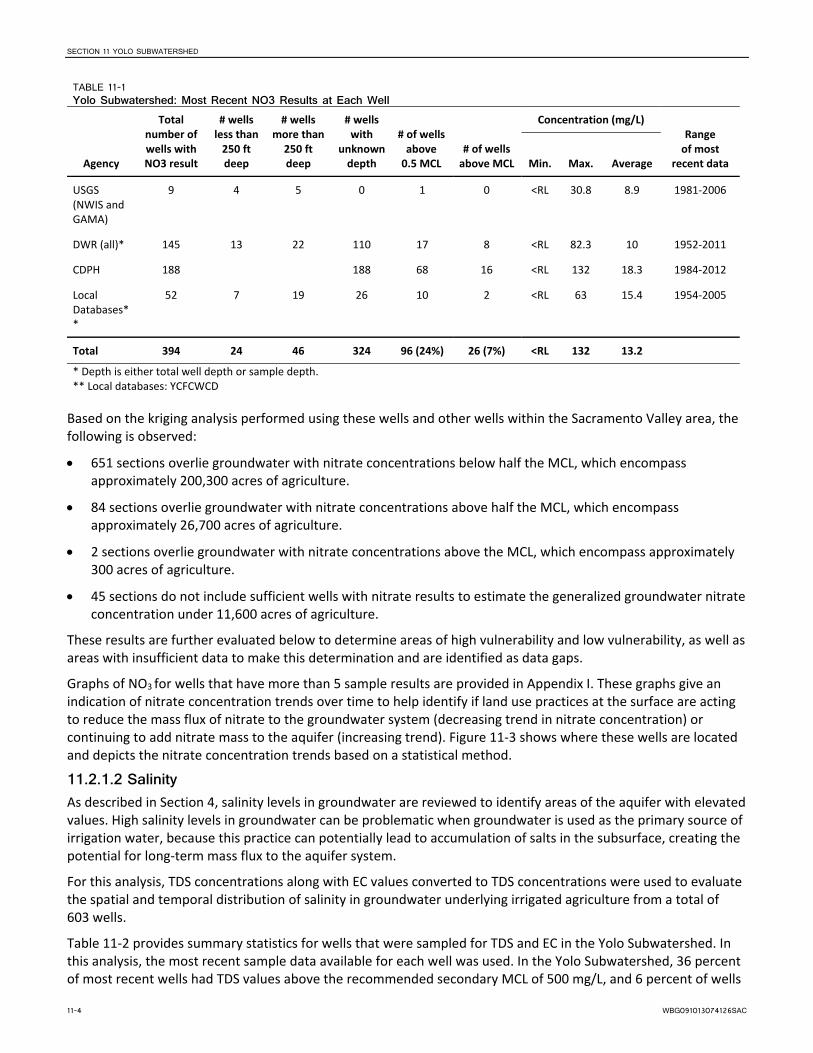
SECTION 11 YOLO SUBWATERSHED
11-4 WBG091013074126SAC
TABLE 11-1 Yolo Subwatershed: Most Recent NO3 Results at Each Well
Agency
Total number of wells with NO3 result
# wells less than 250 ft deep
# wells more than 250 ft deep
# wells with
unknown depth
# of wells above 0.5 MCL
# of wells above MCL
Concentration (mg/L) Range of most
recent data Min. Max. Average
USGS (NWIS and GAMA)
9 4 5 0 1 0 <RL 30.8 8.9 1981‐2006
DWR (all)* 145 13 22 110 17 8 <RL 82.3 10 1952‐2011
CDPH 188 188 68 16 <RL 132 18.3 1984‐2012
Local Databases**
52 7 19 26 10 2 <RL 63 15.4 1954‐2005
Total 394 24 46 324 96 (24%) 26 (7%) <RL 132 13.2
* Depth is either total well depth or sample depth. ** Local databases: YCFCWCD
Based on the kriging analysis performed using these wells and other wells within the Sacramento Valley area, the following is observed:
651 sections overlie groundwater with nitrate concentrations below half the MCL, which encompass approximately 200,300 acres of agriculture.
84 sections overlie groundwater with nitrate concentrations above half the MCL, which encompass approximately 26,700 acres of agriculture.
2 sections overlie groundwater with nitrate concentrations above the MCL, which encompass approximately 300 acres of agriculture.
45 sections do not include sufficient wells with nitrate results to estimate the generalized groundwater nitrate concentration under 11,600 acres of agriculture.
These results are further evaluated below to determine areas of high vulnerability and low vulnerability, as well as areas with insufficient data to make this determination and are identified as data gaps.
Graphs of NO3 for wells that have more than 5 sample results are provided in Appendix I. These graphs give an indication of nitrate concentration trends over time to help identify if land use practices at the surface are acting to reduce the mass flux of nitrate to the groundwater system (decreasing trend in nitrate concentration) or continuing to add nitrate mass to the aquifer (increasing trend). Figure 11‐3 shows where these wells are located and depicts the nitrate concentration trends based on a statistical method.
11.2.1.2 Salinity As described in Section 4, salinity levels in groundwater are reviewed to identify areas of the aquifer with elevated values. High salinity levels in groundwater can be problematic when groundwater is used as the primary source of irrigation water, because this practice can potentially lead to accumulation of salts in the subsurface, creating the potential for long‐term mass flux to the aquifer system.
For this analysis, TDS concentrations along with EC values converted to TDS concentrations were used to evaluate the spatial and temporal distribution of salinity in groundwater underlying irrigated agriculture from a total of 603 wells.
Table 11‐2 provides summary statistics for wells that were sampled for TDS and EC in the Yolo Subwatershed. In this analysis, the most recent sample data available for each well was used. In the Yolo Subwatershed, 36 percent of most recent wells had TDS values above the recommended secondary MCL of 500 mg/L, and 6 percent of wells
SECTION 11 YOLO SUBWATERSHED
WBG091013074126SAC 11-5
had TDS values exceeding the upper limit secondary MCL of 1,000 mg/L. The average concentration is 503 mg/L, which is around the secondary recommended MCL. It should be noted that not all of these wells necessarily overlie irrigated agriculture areas, but represent the general water quality of groundwater in the entire subwatershed.
TABLE 11-2 Yolo Subwatershed: Most Recent TDS Results at Each Well
Agency
Total Number of wells with TDS result
# wells less than 250 ft deep
# wells more than 250 ft deep
# wells with
unknown depth
# of wells above
500 mg/L # of wells 1,000 mg/L
Concentration (mg/L) Range of most
recent data Min. Max. Average
USGS (NWIS and GAMA)
233 113 113 7 75 14 126 1,710 491 1950‐2006
DWR (all)* 268 13 22 233 80 19 123 2,130 489.7 1962‐2011
CDPH 102 102 60 3 190 1,100 527.7 1986‐2012
Total 603 126 135 342 215 (36%) 36 (6%) 123 2,130 502.8
* Depth is either total well depth or sample depth.
The distribution of TDS in groundwater is presented on Figure 11‐4. From this geographic distribution, areas of high salinity are generally found in the Delta area and south of Cache Creek, with a high salinity area between I‐5 and the Sacramento River. The proximity to the Delta probably has a large influence on the high salinity in groundwater for this subwatershed, due to salt water intrusion and tidal influences.
Based on the kriging analysis performed using these wells and other wells within the Sacramento Valley area, the following is observed:
424 sections overlie groundwater with TDS concentrations less than 500 mg/L, which encompass approximately 132,200 acres of agriculture.
389 sections overlie groundwater with TDS concentrations between 500 and 1,000 mg/L, which encompass approximately 102,500 acres of agriculture.
None of the sections overlies groundwater with TDS concentrations above 1,000 mg/L.
19 sections do not include sufficient wells with TDS results to estimate the generalized groundwater TDS concentration under 4,200 acres of agriculture.
These results are further evaluated below to determine areas of high vulnerability, low vulnerability, and data gaps.
Graphs of TDS for wells that have more than 5 sample results are provided in Appendix I. These graphs give an indication of TDS concentration trends over time to help identify if land use practices at the surface are acting to reduce the mass flux of TDS to the groundwater system (decreasing trend in TDS concentration). In areas where TDS concentrations are elevated and stable, natural sources are likely the cause of salinity and where TDS concentrations are increasing, land use and irrigation water sources may influence the overall salinity in the aquifer. Figure 11‐5 shows where these wells are located and depicts the TDS concentration trends based on a statistical method.
11.2.1.3 Pesticides A summary of pesticides detected in groundwater in each of the counties and groundwater basins in the Sacramento River Watershed is provided in Appendix J.
11.2.1.4 Other Constituents of Concern Boron is a constituent found in high concentrations in the Yolo Subwatershed. Boron concentrations measured between 2000 and 2004 averaged between 660 mg/L in the western portion to 2,300 mg/L in the Capay Valley.

SECTION 11 YOLO SUBWATERSHED
11-6 WBG091013074126SAC
The average boron concentrations are highest in Capay Valley, and elevated levels occur along Cache Creek. Generally, historical records show that boron concentrations in the shallow and intermediate aquifers have remained stable for the most part. Data seem to indicate that the high levels of boron may be linked to the physical geohydrologic setting (YCFCWCD 2006).
Arsenic is another constituent that has been found in higher levels in portions of the Yolo Subwatershed. Limited sampling data are available for arsenic concentrations, and preliminary data show that the areas between approximately Woodland and Davis show a greater abundance of values ranging from 2.5 to 5 µg/L. Near Davis, there are instances of arsenic results that range from >5 to 10 µg/L (YCFCWCD 2006).
Other constituents of concern as reported in the 2006 GWMP are chromium and hexavalent chromium, manganese, and selenium. Limited data are available for these constituents and concentrations are variable across the area. Chromium and hexavalent chromium has been found in some municipal supply wells in Davis and are thought to be due to natural occurrences in the geologic formations in the area.
11.2.2 Susceptibility Factors 11.2.2.1 Hydrogeology The SACFEM results (Figure 11‐6) show that the areas of highest susceptibility from hydrogeology are located along the Sacramento River and the Creeks and in the southern portion of the subwatershed in the Delta.
11.2.2.2 Soils and Agronomy Figure 11‐7 shows the section‐level analysis of the individual and total NHI scores. The total NHI score shows that areas of highest susceptibility to soils and agronomy occur in the Woodland area and north of Woodland. A few areas of higher soils and agronomy susceptibility also occur near the Sacramento River and Cache Creek due to higher soils scores.
11.3 Conclusions The vulnerability of groundwater was assessed using a combination of susceptibility indicators and groundwater quality monitoring results. The vulnerability designation concepts and methodology are described in detail in Section 4. Based on this analysis, and taking into consideration the susceptibility and water quality results described above, a vulnerability map for potential groundwater contamination due to nitrate was developed for this subwatershed and is shown on Figure 11‐8.
In this subwatershed, there are 321 sections designated low vulnerability, 248 sections designated moderate vulnerability, and 135 sections designated as high vulnerability. A few data gap areas also exist.
The sections designated as high vulnerability are located in a concentrated area between Woodland and Davis, as well as southeast of Davis and in the Delta. A few scattered high vulnerability sections are also found along the Sacramento River and north of Woodland.
A large portion of the subwatershed also is vulnerable with respect to salinity with high TDS concentrations found along Cache Creek, the Delta area (probably from natural salt water intrusion), and the eastern half of the subwatershed.
Potential data gap areas due to a lack of nitrate concentration results are located in the Delta area, and in the central portion north and south of Cache Creek, outside of the major population centers.

WBG091013074126SAC 12-1
SECTION 12
El Dorado Subwatershed This subwatershed section describes general background information related to geographic location, land use, and physical setting, as well as current groundwater quality monitoring programs. Next, results of the vulnerability analysis are presented, followed by conclusions on vulnerability designations and recommendations.
12.1 Background The El Dorado Subwatershed includes all of El Dorado County over an area of approximately 1 million acres. Major waterways include South Fork American River and North and Middle Forks of Cosumnes River. Major population centers include Placerville, Shingle Springs, Cameron Park, and El Dorado Hills. This subwatershed lies entirely in the foothills and mountainous area of the Sacramento River Watershed and does not overlie a significant groundwater basin.
The majority of the agricultural water use within El Dorado County occurs on the western slope. Agricultural operations use surface water when they are in an area supplied by surface water from irrigation districts. Agricultural water use outside of the purveyor service areas is generally supplied from individually owned springs, wells, and ponds (EDCWA 2007). The majority of agricultural operations in this subwatershed are small family owned‐and‐operated farms; 38 acres is the average parcel size, with a 10‐acre irrigated agriculture production area (El Dorado County Agricultural Water Quality Management Corporation 2010).
12.1.1 Land Use El Dorado County is mostly rural with larger population centers in the western portion of the county and forested areas in the eastern portion of the county (notably Eldorado National Forest). Irrigated agricultural areas occur dispersed throughout the county, mostly along the rivers in the western half of the county. The irrigated crop distribution in El Dorado County is shown on the top left map in Figure 12‐1. Major irrigated crops include:
Wine grapes
Orchards (apples, pears, walnuts, cherries, peaches, plums)
The pie chart below shows the relative percentage, based on acreage, of the predominant crop categories grown in this subwatershed to total irrigated agriculture based on PUR 2013 data.

SECTION 12 EL DORADO SUBWATERSHED
12-2 WBG091013074126SAC
Vineyards make up the majority of the irrigated crops with 65% of the total acreage in El Dorado subwatershed. Deciduous fruits and nuts make up 19% of total irrigated crops, followed by pasture at 13%. Pasture is often not irrigated in El Dorado County. A small amount of berries (annual fruits, vegetables, and seeds crop category) and olives (citrus, olives, and ornamentals category) are also grown in El Dorado County.
According to the Coalition data, there were approximately 3,310 acres of enrolled irrigated lands for this subwatershed in 2012 and 3,144 acres in 2013.
12.1.2 Soils Soils characteristics play a major role in cropping patterns and farming practices, and influence the retention or infiltration of water and nutrients/pesticides through the subsurface. Understanding soil properties under irrigated agricultural lands is therefore important in assessing potential vulnerabilities to groundwater quality degradation. A brief description of soils conditions in this subwatershed is summarized below.
Soil Texture:
Soils in the El Dorado Subwatershed vary from silt loam and sandy loam in the western half of the subwatershed to loam and sandy loam in the eastern mountainous portion.
Soil Drainage:
This subwatershed has mostly well drained soils in the areas that are farmed.
Soil Hydraulic Conductivity:
Soil hydraulic conductivity in this subwatershed is moderately high to high.
Soil Salinity, Alkalinity, and Acidity:
The El Dorado Subwatershed has mostly nonsaline soils.
In the western, more urban portion of the subwatershed, soils tend to be slightly alkaline, while the rest of the subwatershed has slightly acidic to strongly acidic soils. A few areas in the western portion also show ultra‐acidic soils, but they are generally surrounded by less acidic and more alkaline soils.

SECTION 12 EL DORADO SUBWATERSHED
WBG091013074126SAC 12-3
12.1.3 Geology and Hydrogeology The El Dorado Subwatershed does not overlie a groundwater basin as defined by DWR in Bulletin 118 (DWR 2003). Therefore, no alluvial groundwater basins are present in this area, but groundwater can be found flowing in fractures below the ground surface. “The characteristics of a fractured hard rock system that affect the ability of water users to develop groundwater resources include the size and location of fractures, the interconnection between fractures, and the amount of material deposited within fractures” (SWRCB 2005). These characteristics of subsurface fractured rock materials greatly limit the recharge, flow, storage, and availability of groundwater resources in those areas.
On the western slope of El Dorado County, where most of the agricultural production occurs, groundwater exists primarily in hard rock. Alluvium consisting of unconsolidated deposits of clay, silt, sand, and gravel deposited by streams occurs only in small areas too thin to provide a significant amount of storage. Therefore, the amount of usable groundwater is limited (EDCWA 2007).
Many domestic and agricultural wells in El Dorado County are drilled in hard crystalline rock that lies at or near the ground surface or under the thin layers of alluvium. Rock formations enable water movement and limited storage in fractures in the rock mass. Fractured rock is also often referred to as “granitic fissures” when the fractures are very thin. Also, “the width of fractures typically decreases with depth, causing diminished water flow and storage capacity. The amount of water that can be stored and transmitted in such fractures is generally small compared to the amount that can be held and conveyed in a porous alluvial aquifer” (EDCWA 2007).
Residential wells are shown to generally produce less than 10 gallons per minute, with some that have flow rates less than 1 gpm and often go dry during droughts. Accordingly, groundwater has limitations as a dependable source of water for supplementing public water supply or augmenting surface water storage during droughts (EDCWA 2007).
There are no initial HVAs and GPAs as defined by the State Water Resources Control Board in the El Dorado Subwatershed.
12.1.4 Current Programs and Groundwater Monitoring The El Dorado Subwatershed has been implementing a Pilot Watershed Management Practices Program (Pilot Plan) since 2010. The main objective of this program is to minimize impacts to surface water from irrigated agricultural operations. This is achieved through best management practices for pesticides, irrigation water, erosion and sediment control, and nutrient input. Surveys of these practices help improve management practices.
Groundwater quality is not typically monitored in private domestic and agricultural wells in El Dorado County. Public supply wells are monitored for a variety of constituents and data are submitted to CDPH for compliance. El Dorado County was part of a Voluntary Domestic Well Assessment Project (Voluntary Project) initiated by the SWRCB in 2002. During 2003 and 2004, and as part of a small pilot study in 2001, the Voluntary Project sampled 398 private domestic wells in El Dorado County (SWRCB 2005).
The Environmental Management Division (EM) of the El Dorado County Community Development Agency permits public wells for small water systems in the county. According to a letter received from EM by the El Dorado Subwatershed (March 2014), “EM currently has 110 small water systems under permit throughout the west slope of the county.” EM has also recently started managing a database for tracking analytical results of the water systems, and currently includes 155 small water system samples that include nitrate data. EM reports that none of the samples analyzed exceeded the MCL for nitrate. EM continues to track water quality of the small water system wells.
Since the El Dorado Subwatershed does not overlie a DWR‐defined groundwater basin, the DWR CASGEM priority basins program does not apply and there are no CASGEM wells monitored by DWR or other entities in this subwatershed.

SECTION 12 EL DORADO SUBWATERSHED
12-4 WBG091013074126SAC
12.2 Vulnerability Analysis Results The vulnerability analysis was performed by reviewing groundwater quality data and susceptibility factors (hydrogeology, and soils and agronomy). The technical details related to the data processing that went into performing this analysis is described in Section 4.
Maps of each susceptibility and vulnerability index distribution are shown in Figures 12‐1 through 12‐4. A discussion of results and final scores for each of the factors follows below.
12.2.1 Groundwater Quality The review of groundwater quality for the vulnerability analysis focuses on nitrate, salinity, and pesticides. Other constituents of concern are reviewed as necessary, based on documented occurrences.
In general, groundwater quality in El Dorado County is considered good to excellent based on the data collected from the 2003‐2004 Voluntary Project (SWRCB 2005).
12.2.1.1 Nitrate The El Dorado Subwatershed NO3 analysis is based on a review of the concentration of the most recent sampling at each well from 511 wells located in this subwatershed and for which records were readily available. Well data are included from CDPH wells and domestic wells sampled under the Voluntary Project described above. Table 12‐1 provides summary statistics for wells that were sampled for NO3 in the El Dorado Subwatershed. Eight percent of most recent wells had nitrate values above half the MCL, while 2 percent of wells had nitrate values exceeding the primary MCL of 45 mg/L. The average concentration is 6 mg/L, well below half the MCL. It should be noted that these wells are not necessarily restricted to irrigated agricultural areas, but represent the general water quality of groundwater in the entire subwatershed.
TABLE 12-1 El Dorado Subwatershed: Most Recent NO3 Results at Each Well
Agency
Total number of wells with NO3 result
# wells less than 250 ft deep
# wells more than 250 ft deep
# wells with
unknown depth
# of wells above 0.5 MCL
# of wells above MCL
Concentration (mg/L) Range of most
recent data Min. Max. Average
SWRCB‐GAMA
400 400 37 8 <RL 84 7.4 2003‐2004
CDPH 111 111 4 0 <RL 33 4.5 1989‐2012
Total 511 0 0 511 41 (8%) 8 (2%) <RL 84 6.0
The distribution of nitrate in groundwater is presented on Figure 12‐2. From this geographic distribution, it is apparent that the majority of the wells show low nitrate concentrations, with only a few localized areas of higher nitrate concentrations.
12.2.1.2 Salinity As described in Section 4, salinity levels in groundwater are reviewed to identify areas of the aquifer with elevated values. High salinity levels in groundwater can be problematic when groundwater is used as the primary source of irrigation water, because this practice can potentially lead to accumulation of salts in the subsurface, creating the potential for long‐term mass flux to the aquifer system.
For this analysis, TDS concentrations along with EC values converted to TDS concentrations were used to evaluate the spatial and temporal distribution of salinity in groundwater underlying irrigated agriculture from a total of 423 wells.
Table 12‐2 provides summary statistics for wells that were sampled for TDS and EC in the El Dorado Subwatershed. In this analysis, the most recent sample data available for each well was used. In the El Dorado

SECTION 12 EL DORADO SUBWATERSHED
WBG091013074126SAC 12-5
Subwatershed, 1 percent of most recent wells had TDS values above the recommended secondary MCL of 500 mg/L, and none of the wells had TDS values exceeding the upper limit secondary MCL of 1,000 mg/L. The average concentration is 202.6 mg/L, which is below half the secondary recommended MCL of 500 mg/L. This attests to the very low salinity in this subwatershed, as further shown in Figure 12‐3. It should be noted that not all of these wells necessarily overlie irrigated agriculture areas, but represent the general water quality of groundwater in the entire subwatershed.
TABLE 12-2 El Dorado Subwatershed: Most Recent TDS Results at Each Well
Agency
Total number of wells with TDS result
# wells less than 250 ft deep
# wells more than 250 ft deep
# wells with
unknown depth
# of wells above
500 mg/L
# of wells above
1,000 mg/L
Concentration (mg/L) Range of
most recent data Min. Max. Average
SWRCB‐GAMA
400 400 6 0 24 890 230.1 2003‐2004
CDPH 23 23 0 0 19 480 175 1989‐2010
Total 423 0 0 423 6 (1%) 0 19 890 202.6
12.2.1.3 Pesticides A summary of pesticides detected in groundwater in each of the counties and groundwater basins in the Sacramento River Watershed is provided in Appendix J.
12.2.1.4 Other Constituents of Concern There are no particular constituents of concern in groundwater reported for this subwatershed.
12.2.2 Susceptibility Factors 12.2.2.1 Hydrogeology The hydrogeology in this subwatershed is characteristic of mountainous bedrock aquifers where fractures or fissures dominate the groundwater flow and storage. Given the well‐drained soils in the area, the greater precipitation quantities that occur at higher elevations, and the lack of thick soil profiles that can act to attenuate nitrate, these fractured rock aquifer systems have a relatively high susceptibility to groundwater contamination. Further, once contamination has reached the aquifer system, the complex fracture driven flow system can make assessment of contaminant sources challenging.
12.2.2.2 Soils and Agronomy As described in the Pilot Plan, “the largest commercial commodity in the Subwatershed is wine grapes where nutrient management is critical to fruit quality as opposed to quantity. This limits the amount of nitrogen to ≤50 pounds per acre per year. Tree crops require 1‐ to 2‐ pounds per tree per year” (El Dorado County Agricultural Water Quality Management Corporation 2010). This shows that nutrient input is limited and carefully managed in this subwatershed.
Figure 12‐4 shows the section‐level analysis of the individual and total NHI scores. The crop scores tend to be very low, as expected from a dominant vineyard and orchard crops distribution. Irrigation scores are conservatively representing mostly sprinkler irrigation practices, resulting in a medium score. At the time this analysis was performed, the soil categories in this subwatershed were not yet classified by the authors of the NHI tool. As a result, it is not possible to develop a total NHI score for this subwatershed that would take into account the scores for each of the three categories (crops, irrigation practices, and soils). However, based on a general distribution of soils, it is known that soils in this subwatershed are mostly composed of sandy to clay loams, which have coarse characteristics and allow for enhanced infiltration of water and nutrients into the subsurface.

SECTION 12 EL DORADO SUBWATERSHED
12-6 WBG091013074126SAC
12.3 Conclusions The vulnerability of groundwater was assessed using a combination of susceptibility indicators and groundwater quality monitoring results. The vulnerability designation concept developed during the preparation of the GAR (as described in Section 4) defines groundwater quality as the first item to consider when identifying potential areas of high vulnerability. Susceptibility factors will be used in the determination of prioritized areas for trend monitoring in low vulnerability areas.
In summary, based on the groundwater quality results described above, the El Dorado Subwatershed does not present any major groundwater quality issues and has very few MCL exceedances of nitrate concentrations that are not necessarily linked to irrigated agricultural impacts. Based on these results, it can be concluded that the El Dorado Subwatershed has low vulnerability to groundwater contamination.
Even though the bedrock aquifer high soil drainage conditions might create some susceptibility to groundwater contamination, the following are applicable and confirm the low vulnerability designation:
This Subwatershed has very low density and sparse distribution of irrigated lands.
The majority of the irrigated crops grown in this subwatershed are vineyards and orchards, which are farmed with low and carefully managed nutrient input.
The Pilot Plan was developed to help implement best management practices for irrigated agriculture, which minimize potential impacts to groundwater quality.
Because of the bedrock aquifer conditions, horizontal flow is very limited in the subsurface and it is not possible to accurately assess if potential impacts from irrigated agriculture operations might impact nearby domestic wells.
Groundwater quality is very good to excellent, and therefore impacts from irrigated agriculture are not an issue for groundwater quality.

WBG091013074126SAC 13-1
SECTION 13
Goose Lake Subwatershed This subwatershed section describes general background information related to geographic location, land use, and physical setting, as well as current groundwater quality monitoring programs. Next, results of the vulnerability analysis are presented, followed by conclusions on vulnerability designations and recommendations.
13.1 Background The Goose Lake Subwatershed is located in Modoc County and includes an area of approximately 233,500 acres, including abut three‐quarters of the Goose Lake. This high desert subwatershed includes land that drains from both the west and the east into Goose Lake, a closed‐basin lake system that no longer has a surface outlet to the nearby Pit River (Goose Lake RCD 2014a, Goose Lake Coalition 2008).
The major waterways in this subwatershed are Lassen and Willow Creeks. Major population centers include Davis Creek, Willow Ranch, and New Pine Creek. This subwatershed lies entirely in the mountainous area of the Sacramento River Watershed, outside (upstream) of the valley floor.
There are 30 members within the Goose Lake Subwatershed. Lake water is not used as a water supply, since it is a very shallow lake with poor water quality and is not a reliable source (completely dry in drought years). All domestic water supply comes from groundwater; irrigation water supply is from runoff and groundwater.
13.1.1 Land Use The Goose Lake Basin is mostly rural and includes diverse vegetation ranging from mixed conifer forests to sagebrush shrublands, grasslands, and marshes (Goose Lake RCD 2014a). This subwatershed has approximately 50 percent privately owned lands that are primarily used for livestock grazing and for dry and irrigated hay production. Land use has not changed much over the last 70 years in this subwatershed (Goose Lake RCD 2014b). Irrigated agricultural areas occupy less than 4 percent of the total area in the subwatershed, with the remainder being publicly owned by federal agencies (US Forest Service, BLM).
Major irrigated and non‐irrigated crops include hay and pasture. The pie chart below shows the relative percentage, based on acreage, of the predominant crop categories grown in this subwatershed to total irrigated agriculture based on DWR 1997 data for Modoc County (the most recent available for this subwatershed). It should be noted that DWR data do not differentiate between irrigated and non‐irrigated crops. Therefore, this analysis is conservative.

SECTION 13 GOOSE LAKE SUBWATERSHED
13-2 WBG091013074126SAC
Based on this dataset, 84 percent of agricultural lands are composed of pasture (including alfalfa), and 14 percent include grain and hay crops. The crop distribution per the DWR 1997 data in the Goose Lake Subwatershed is shown on the top left map in Figure 13‐1. The two main cultivated areas overlie the alluvial groundwater basins, in the south by Davis Creek, and in the northern portion between Willow Ranch and New Pine Creek.
According to the Coalition data, there were approximately 8,153 acres of enrolled irrigated lands for this subwatershed in 2012 and 8,326 acres in 2013.
13.1.2 Soils Soils characteristics play a major role in cropping patterns and farming practices, and influence the retention or infiltration of water and nutrients/pesticides through the subsurface. Understanding soil properties under irrigated agricultural lands is therefore important in assessing potential vulnerabilities to groundwater quality degradation. A brief description of soils conditions in this subwatershed is summarized below.
Soil Texture:
Soils in the cultivated areas of Goose Lake Subwatershed are mainly composed of clay loam and loam.
Soil Drainage:
This subwatershed has mostly well drained soils.
Soil Hydraulic Conductivity:
Soil hydraulic conductivity in this subwatershed is moderately high to high.
Soil Salinity, Alkalinity, and Acidity:
The Goose Lake Subwatershed has mostly nonsaline soils, except for an area in the southern tip of the lake that is moderately saline.
Soils are mostly neutral to alkaline.

SECTION 13 GOOSE LAKE SUBWATERSHED
WBG091013074126SAC 13-3
13.1.3 Geology and Hydrogeology The Goose Lake Subwatershed overlies the Goose Lake Valley Groundwater Basin as defined by DWR (2003), which is subdivided into two subbasins: Lower Goose Lake Valley in the south, and Fandango Valley to the north.
Both the Lower Goose Lake Valley Groundwater Subbasin and the Fandango Valley Groundwater Subbasin include numerous bounding faults on the west and east sides of the valley. According to DWR (2003), “the primary water‐bearing formations are Holocene sedimentary deposits (which include lake deposits, intermediate alluvium, and alluvial fan deposits), Pleistocene near‐shore deposits, Pliocene to Pleistocene lava flows.” Upland recharge areas are formed by permeable basalt flows where precipitation and surface runoff infiltrates and moves toward the valley flow and recharging the valley sediments (DWR 2003).
No initial HVAs and GPAs as defined by the State Water Resources Control Board have been determined in the Goose Lake Subwatershed.
13.1.4 Current Programs and Groundwater Monitoring There is currently no groundwater management plan in the Goose Lake Subwatershed area. Groundwater quality monitoring occurs sporadically in the two alluvial basins by public monitoring entities (mostly DWR).
Goose Lake itself is regularly monitored for water quality by the RWQCB and the UC Davis Cooperative Extension.
In addition, a few wells are regularly monitored by DWR and by CASGEM monitoring entities for groundwater levels in the Goose Lake Subwatershed groundwater basins. Those wells vary in depth and might be suitable for future groundwater quality monitoring (after review of well construction details, if available). A map of the location of CASGEM wells for Modoc County are shown in Appendix H.
13.2 Vulnerability Analysis Results The vulnerability analysis was performed by reviewing groundwater quality data and susceptibility factors (hydrogeology, and soils and agronomy). The technical details related to the data processing for this analysis is described in Section 4.
Maps of each susceptibility and vulnerability index distribution are shown in Figures 13‐1 through 13‐4. A discussion of results and final scores for each of the factors follows below.
13.2.1 Groundwater Quality The review of groundwater quality for the vulnerability analysis focuses on nitrate, salinity, and pesticides. Other constituents of concern are reviewed as necessary, based on documented occurrences.
Groundwater quality varies in the Goose Lake Subwatershed, with some areas exhibiting very high mineral content (sulfur, boron), which is naturally occurring, mainly close to the lake on the eastside. These water quality impairments can be detrimental to crops.
Particularly in the Fandango Valley Subbasin, thermal waters containing high concentrations of TDS, sodium, fluoride, and boron are associated with fault zones east of Goose Lake and south of New Pine Creek (DWR 2003).
13.2.1.1 Nitrate The Goose Lake Subwatershed NO3 analysis is based on a review of the concentration of the most recent sampling at each well from 30 wells (26 DWR wells and 4 CDPH wells) located in this subwatershed and for which records were readily available. The maximum NO3 concentration from this dataset is 12 mg/L, with an average of 2.3 mg/L. The results show that nitrate measurements are extremely low in this subwatershed, and well below half the MCL of 45 mg/L. It should be noted that these wells are not necessarily restricted to irrigated agricultural areas, but represent the general water quality of groundwater in the entire subwatershed.
The distribution of nitrate in groundwater is presented on Figure 13‐2. From this geographic distribution, it is apparent that the majority of the wells show low nitrate concentrations.

SECTION 13 GOOSE LAKE SUBWATERSHED
13-4 WBG091013074126SAC
13.2.1.2 Salinity As described in Section 4, salinity levels in groundwater are reviewed to identify areas of the aquifer with elevated values. High salinity levels in groundwater can be problematic when groundwater is used as the primary source of irrigation water, because this practice can potentially lead to accumulation of salts in the subsurface, creating the potential for long‐term mass flux to the aquifer system.
For this analysis, TDS concentrations along with EC values converted to TDS concentrations were used to evaluate the spatial and temporal distribution of salinity in groundwater underlying irrigated agriculture from a total of 11 wells. The maximum TDS concentration from this dataset is 1,260 mg/L (the only measurement above 1,000 mg/L), with an average of 270 mg/L. The results show that TDS measurements are generally very low in this subwatershed, with the majority of samples below the recommended SMCL of 500 mg/L. It should be noted that these wells are not necessarily restricted to irrigated agricultural areas, but represent the general water quality of groundwater in the entire subwatershed.
The distribution of TDS in groundwater is presented on Figure 13‐3. From this geographic distribution, it is apparent that the majority of the wells show low TDS concentrations, except for one well above 1,000 mg/L near New Pine Creek, which is likely associated with thermal waters.
13.2.1.3 Pesticides A summary of pesticides detected in groundwater in each of the counties and groundwater basins in the Sacramento River Watershed is provided in Appendix J.
13.2.2 Susceptibility Factors 13.2.2.1 Hydrogeology The hydrogeology in this subwatershed is characteristic of alluvial basins with lake deposits, volcanic materials and lava flows, as well as faults. Therefore, the geologic structures are very complex.
In general, the alluvial materials on which farming occurs drive the hydrogeology susceptibility. Well‐drained soils and relatively high soil hydraulic conductivity can increase the susceptibility to groundwater quality impairment.
13.2.2.2 Soils and Agronomy Figure 13‐4 shows the section‐level analysis of the individual and total NHI scores. The crop scores tend to be very low, as expected from a dominant pasture and hay crops distribution. Irrigation scores are high as most areas are surface irrigated (flood and center‐pivot), with a mix of irrigation practices on individual fields. The soil scores vary throughout the subwatershed, with areas of low scores (southern area) and areas of high scores (northern area). However, most agricultural areas had soils that were not classified at the time this analyses was performed, preventing a total score to be computed. For areas where all three scores were available, the total NHI score was computed and Figure 13‐4 shows that most areas have a very low total NHI score, below 20, due to the very low crop score. One exception is provided by the area close to New Pine Creek, where soils have the highest NHI score; therefore, those sections have a higher total NHI score and show higher susceptibility to groundwater quality degradation due to soils and agronomy.
However, most crops do not use much fertilization, such as pasture. Some of the higher value crop acreages use fertilizers and are also mostly sprinkler irrigated.
13.3 Conclusions The vulnerability of groundwater was assessed using a combination of susceptibility indicators and groundwater quality monitoring results. The vulnerability designation concept developed during the preparation of the GAR (as described in Section 4) is applied in the determination of vulnerability conclusions.
In summary, based on the limited groundwater quality results described above, the Goose Lake Subwatershed has very low concentrations of nitrate and TDS and does not present any major groundwater quality issues, except for the northern most area, due to naturally occurring minerals.
SECTION 13 GOOSE LAKE SUBWATERSHED
WBG091013074126SAC 13-5
Even though the alluvial aquifer high soil drainage conditions might create some susceptibility to groundwater contamination, the following are applicable and confirm the low vulnerability designation for this subwatershed:
The majority of the irrigated crops grown in this subwatershed are pasture crops, which use minimal fertilization.
Groundwater quality does not show any impacts from irrigated agriculture.
Since groundwater quality data are limited and missing in some areas, as well as no trends are available, is it recommended to work with DWR to develop or include additional wells in a trend monitoring program.


WBG091013074126SAC 14-1
SECTION 14
Lake Subwatershed This subwatershed section describes general background information related to geographic location, land use, and physical setting, as well as current groundwater quality monitoring programs. Next, results of the vulnerability analysis are presented, followed by conclusions on vulnerability designations and recommendations.
14.1 Background The Lake Subwatershed includes most of Lake County over an area of approximately 649,900 acres. Major waterways include Upper Cache, Middle, Scotts, and Kelsey Creeks. Clear Lake occupies the central portion of the subwatershed. Major population centers include Clearlake, Lower Lake, Kelseyville, Lakeport, Nice, Lucerne, Clearlake Oaks, and Middletown, mostly surrounding the lake. This subwatershed lies entirely in the foothills area of the Sacramento River Watershed, outside (upstream) of the valley floor.
The majority of agricultural water in Lake County is supplied by groundwater in the irrigated areas. Surface water use occurs primarily in the northwestern lake area near Scotts Creek and Middle Creek, and in Big Valley near Clear Lake (LCWPD 2006).
14.1.1 Land Use Lake County is mostly rural with larger population centers surrounding Clear Lake. Irrigated agricultural areas occur also around the lake for the most part, in areas overlying small alluvial aquifers. The irrigated crop distribution in the Lake Subwatershed is shown on the top left map in Figure 14‐1. The densest agricultural area occurs between Lakeport and Kelseyville. Major irrigated crops include:
Wine grapes
Orchards (pears, walnuts)
The pie chart below shows the relative percentage, based on acreage, of the predominant crop categories grown in this subwatershed to total irrigated agriculture based on DWR 2001 data (the most recent available for this subwatershed). The DWR 2001 data were used for the analysis, as it was the only available data in GIS format, which is necessary for a geographical distribution and analysis of the crops, to compare to groundwater quality data for the vulnerability analysis.

SECTION 14 LAKE SUBWATERSHED
14-2 WBG091013074126SAC
The DWR data show that deciduous fruits and nuts make up 42% of total irrigated crops, followed by vineyards at 34%, and some pasture (23%). There are approximately 8,500 acres of vineyards in Lake County farmed by 145 growers. In comparison to more recent data from the 2012 Lake County Crop Report, wine grape (vineyards) acreages have remained stable, while fruit and nuts crops have decreased by half. Pasture acreage have also decreased in the last decade, although it is difficult to accurately compare to DWR land use data because irrigated versus non‐irrigated acreage are not specified in the DWR data. This dataset provides a conservative approach to the overall vulnerability analysis.
According to the Coalition data, there were approximately 11,789 acres of enrolled irrigated lands for this subwatershed in 2012 and 12,546 acres in 2013.
14.1.2 Soils Soils characteristics play a major role in cropping patterns and farming practices, and influence the retention or infiltration of water and nutrients/pesticides through the subsurface. Understanding soil properties under irrigated agricultural lands is therefore important in assessing potential vulnerabilities to groundwater quality degradation. A brief description of soils conditions in this subwatershed is summarized below.
Soil Texture:
Soils in the Lake Subwatershed are mostly loam, with interspersed clay loam lenses.
Soil Drainage:
This subwatershed has mostly well drained and somewhat excessively drained soils. Most of the farmed areas are on well drained soils.
Soil Hydraulic Conductivity:
Soil hydraulic conductivity in this subwatershed is moderately high to high.
Soil Salinity, Alkalinity, and Acidity:
The Lake Subwatershed has mostly nonsaline soils.

SECTION 14 LAKE SUBWATERSHED
WBG091013074126SAC 14-3
Soils around Clear Lake and in the southern portion of the subwatershed are alkaline; and at the margins of the subwatershed, soils tend to be more acidic.
14.1.3 Geology and Hydrogeology The Lake Subwatershed overlies 13 small alluvial groundwater basins as defined by DWR in Bulletin 118 (DWR 2003). The basins that underlie the majority of the irrigated agricultural lands and with the highest water demand are Scotts Valley, Big Valley, Upper Lake Valley, Coyote Valley, and Collayomi Valley.
The Scotts Valley Basin is located adjacent to the west side of Clear Lake and extends northwesterly along Scotts Creek north to Hidden Lake. The basin shares a boundary with the Big Valley Basin to the south and may be hydrologically connected. According to DWR Bulletin 118, “the aquifer system in Scotts Valley Basin is composed primarily of Quaternary alluvial and terrace deposits, and Plio‐Pleistocene to Pleistocene lake and floodplain deposits. Plio‐Pleistocene Cache Formation sediments overlie bedrock” (DWR 2003). Recharge to this basin occurs through deep percolation from Scotts Creek and minor amounts from precipitation and applied irrigation water.
The Big Valley Basin is composed of extensive alluvial deposits, including fan deposits, lake bed and flood plain deposits, and terrace uplands. Primary water‐bearing formations are composed of alluvium, lake and terrace deposits and volcanic ash deposits (DWR 2003). Groundwater generally flows from the surrounding mountains to Clear Lake. Recharge to this basin occurs through deep percolation from Kelsey Creek and limited infiltration of precipitation and applied irrigation water, due to clayey soils. This basin has experienced periodic overdraft conditions during droughts, which affects water supply (Lake County 2003). Some areas of this subbasin show inflow and mixing of geothermal waters that poses a risk to the groundwater quality.
The Upper Lake Valley Basin is located at the north end of Clear Lake. The aquifer system in the Upper Lake Valley Basin is composed primarily of alluvial deposits and terrace, lake, and floodplain deposits, which fill the valley and provide the majority of the well yields. The majority of the recharge to this basin occurs through deep percolation of streamflow (DWR 2003).
The Coyote Valley Basin is located within the southeastern portion of Lake County along Putah Creek about 4 miles northeast of Middletown. The aquifer system of Coyote Valley Basin is primarily composed of alluvial deposits. The major source of groundwater recharge is from Putah Creek. The Collayomi Valley Basin is located southwest of the Coyote Valley basin, in the headwater area of Putah Creek. Most of the groundwater throughout the Collayomi Basin occurs in alluvium deposited as alluvial fans of shallow grade and in the gravel channels of Putah Creek, St. Helena Creek, and their tributaries. Also, “groundwater occurs in a series of confined, semi‐confined, and unconfined layers and lenses of permeable or semi‐impermeable materials that are partially merged and interconnected” (DWR 2003).
Groundwater levels are very shallow in some areas in the vicinity of the lake. As a result, some orchard farmers do not need to irrigate their crops. Groundwater levels in the majority of Lake County’s groundwater basins are high in the spring and decrease over the summer due to groundwater pumping for irrigation (LCWPD 2006).
In addition to these primary well‐defined groundwater basins, agricultural production also occurs in the southern portion of Clear Lake, in a bedrock aquifer area.
As shown in Figure 2‐10, initial HVAs and GPAs as defined by the State Water Resources Control Board are primarily located in lands overlying the Coyote Valley and Collayomi Basins.
14.1.4 Current Programs and Groundwater Monitoring The Lake County Watershed Protection District (District) developed a GWMP in 2006. Intermittent groundwater quality monitoring in Lake County is performed by DWR at about 36 wells. Groundwater quality parameters and constituents regularly measured include temperature, pH, TDS, metals, nitrogen compounds, dissolved potassium, sodium, calcium, magnesium, boron, and hardness (LCWPD 2006). Another groundwater quality monitoring program is also managed by Lake County, which began in 1985 (Lake County 2003).

SECTION 14 LAKE SUBWATERSHED
14-4 WBG091013074126SAC
The District also developed a water level Monitoring Plan for the CASGEM program. The District currently measures water levels at 85 wells in the spring and fall in 7 of the 13 DWR‐identified groundwater basins. Some of these wells were identified for the CASGEM monitoring program (LCWPD 2012).
A well inventory performed for the GWMP in 2006 showed that there are approximately 5,300 wells in Lake County. About 67 percent of these wells are domestic wells, 15 percent are agricultural wells, 4 percent are monitoring wells, 2 percent are municipal wells, and the rest of the wells are unclassified or “other” wells (LCWPD 2006).
In addition to groundwater monitoring activities, the farming industry is quite active in managing sustainable practices throughout the County. The Lake County Winegrape Commission is leading sustainable wine growing efforts with various certifications and programs for their members. For the pear growers, Scully Packing developed a rigorous food safety program that includes well audits, water safety, groundwater systems, irrigation methods, fertilizer programs, and pesticide information.
14.2 Vulnerability Analysis Results The vulnerability analysis was performed by reviewing groundwater quality data and susceptibility factors (hydrogeology, and soils, and agronomy). The technical details related to the data processing that went into performing this analysis is described in Section 4.
Maps of each susceptibility and vulnerability index distribution are shown in Figures 14‐1 through 14‐4. A discussion of results and final scores for each of the factors follows below.
14.2.1 Groundwater Quality The review of groundwater quality for the vulnerability analysis focuses on nitrate, salinity, and pesticides. Other constituents of concern are reviewed as necessary, based on documented occurrences.
In the Lake Subwatershed, some groundwater users have expressed concerns about saline intrusion and related TDS levels. In addition, most basins have issues with high levels of iron, manganese, and boron (LCWPD 2006).
In the Big Valley groundwater basin, apart from naturally occurring geothermal waters inflow, portions of the basin are experiencing a rise in nitrate levels, which are approaching regulatory limits (Lake County 2003). Elevated levels of iron and boron in this basin are caused by thermal waters (CVRWQCB 2008).
In the Collayomi Valley and the Coyote Valley basins, no apparent agriculturally related groundwater problems have been identified (CVRWQCB 2008).
14.2.1.1 Nitrate The Lake Subwatershed NO3 analysis is based on a review of the concentration of the most recent sampling at each well from 204 wells located in this subwatershed and for which records were readily available. Table 14‐1 provides summary statistics for wells that were sampled for NO3 in the Lake Subwatershed. Three percent of most recent wells had nitrate values above half the MCL, while less than 1 percent of wells had nitrate values exceeding the primary MCL of 45 mg/L. The average concentration is 4.2 mg/L, well below half the MCL. It should be noted that these wells are not necessarily restricted to irrigated agricultural areas, but represent the general water quality of groundwater in the entire subwatershed.
The distribution of nitrate in groundwater is presented on Figure 14‐2. From this geographic distribution, it is apparent that the majority of the wells show low nitrate concentrations.
Graphs of NO3 for wells that have more than 5 sample results are provided in Appendix I. These graphs give an indication of nitrate concentration trends over time, to help identify if land use practices at the surface are acting to reduce the mass flux of nitrate to the groundwater system (decreasing trend in nitrate concentration) or continuing to add nitrate mass to the aquifer (increasing trend) of groundwater quality.

SECTION 14 LAKE SUBWATERSHED
WBG091013074126SAC 14-5
TABLE 14-1 Lake Subwatershed: Most Recent NO3 Results at Each Well
Agency
Total number of wells with NO3 result
# wells less than 250 ft deep
# wells more than 250 ft deep
# wells with
unknown depth
# of wells above 0.5 MCL
# of wells above MCL
Concentration (mg/L) Range of most
recent data Min. Max. Average
USGS (NWIS and GAMA)
7 5 1 1 0 0 <RL 16.9 2.9 2009
DWR (all)* 86 86 4 1 <RL 61.1 6.1 1949‐2007
CDPH 111 111 2 0 <RL 28 3.5 1986‐2012
Total 204 5 1 198 6 (3%) 1 (0.5%) <RL 61.1 4.2
* Depth is either total well depth or sample depth.
14.2.1.2 Salinity As described in Section 4, salinity levels in groundwater are reviewed to identify areas of the aquifer with elevated values. High salinity levels in groundwater can be problematic when groundwater is used as the primary source of irrigation water, because this practice can potentially lead to accumulation of salts in the subsurface, creating the potential for long‐term mass flux to the aquifer system.
For this analysis, TDS concentrations along with EC values converted to TDS concentrations were used to evaluate the spatial and temporal distribution of salinity in groundwater underlying irrigated agriculture from a total of 135 wells.
Table 14‐2 provides summary statistics for wells that were sampled for TDS and EC in the Lake Subwatershed. In this analysis, the most recent sample data available for each well was used. In the Lake Subwatershed, 12 percent of most recent wells had TDS values above the recommended secondary MCL of 500 mg/L, and less than 1 percent of the wells had TDS values exceeding the upper limit secondary MCL of 1,000 mg/L. The average concentration is 292.2 mg/L, which is below the secondary recommended MCL of 500 mg/L. It should be noted that not all of these wells necessarily underlie irrigated agriculture areas, but represent the general water quality of groundwater in the entire subwatershed.
TABLE 14-2 Lake Subwatershed: Most Recent TDS Results at Each Well
Agency
Total number of wells with TDS result
# wells less than 250 ft deep
# wells more than 250 ft deep
# wells with
unknown depth
# of wells above
500 mg/L
# of wells above
1,000 mg/L
Concentration (mg/L) Range of most
recent data Min. Max. Average
USGS (NWIS and GAMA)
1 1 0 0 171 2009
DWR (all)* 55 55 8 1 76 1,240 330.3 1958‐2007
CDPH 79 79 8 0 56 930 254 1986‐2012
Total 135 0 0 135 16 (12%) 1 (0.7%) 56 1,240 292.2
* Depth is either total well depth or sample depth.
The distribution of TDS in groundwater is presented on Figure 14‐3. This geographic distribution shows that the majority of wells with TDS concentrations above half the secondary MCL are located in the Big Valley Basin.
Graphs of TDS for wells that have more than 5 sample results are provided in Appendix I. These graphs give an indication of TDS concentration trends over time to help identify if land use practices at the surface are acting to

SECTION 14 LAKE SUBWATERSHED
14-6 WBG091013074126SAC
reduce the mass flux of TDS to the groundwater system (decreasing trend in TDS concentration). In areas where TDS concentrations are elevated and stable, natural sources are likely the cause of salinity and where TDS concentrations are increasing, land use and irrigation water sources may influence the overall salinity in the aquifer.
14.2.1.3 Pesticides A summary of pesticides detected in groundwater in each of the counties and groundwater basins in the Sacramento River Watershed is provided in Appendix J.
14.2.1.4 Other Constituents of Concern Iron, manganese, and boron are other constituents of concern for domestic, municipal, and agricultural beneficial uses.
14.2.2 Susceptibility Factors 14.2.2.1 Hydrogeology The hydrogeology in this subwatershed is influenced by alluvial basins drained by many creeks and surrounding a large natural lake. Depth to water is generally shallow and fluctuates widely with irrigation pumping in the summer. Recharge to groundwater primarily occurs through deep percolation from streams and also from applied water during the irrigation season. The soils are mostly well drained in areas with irrigated agriculture. Properties related to hydrogeology, depth to water, and recharge rates are typical of alluvial basins in the Sacramento Valley near mid‐size streams, particularly in areas that grow orchards. The valley floor hydrogeologic susceptibility analysis results can be applied to this area to make some observations as to what the hydrogeologic susceptibility scores would be. For example, the hydrogeologic susceptibility analysis in the Butte‐Yuba‐Sutter Subwatershed, which includes large areas of orchards, shows that these areas tend to have high susceptibility due to the shallow groundwater table and drainability of soils, which would also apply to the alluvial basins of the Lake Subwatershed.
14.2.2.2 Soils and Agronomy Figure 14‐4 shows the section‐level analysis of the individual and total NHI scores. The crop scores tend to be very low, as expected from a dominant vineyard and orchard crops distribution. Irrigation scores are conservatively representing mostly sprinkler irrigation practices, resulting in a medium score. The soil scores vary throughout the subwatershed, with most areas having medium scores. Some areas had soils that were not classified at the time this analyses was performed, preventing a total score to be computed. For areas where all three scores were available, the total NHI score was computed, and Figure 14‐5 shows that most areas have a very low total NHI score, below 20. Only one area northwest of Lakeport had a score above 20 due to some coarser soils in that area.
14.3 Conclusions The vulnerability of groundwater was assessed using a combination of susceptibility indicators and groundwater quality monitoring results as described in Section 4.
In summary, based on the groundwater quality results described above, the Lake Subwatershed has 1 exceedance of nitrate MCL in the Big Valley Basin. From a salinity perspective, some areas of slightly higher TDS concentrations occur, notably in the Big Valley Groundwater Basin, where several wells show TDS above 500 mg/L. However, these wells are located near other wells with lower TDS concentrations and sampled around the same time. Depth of most of the wells are unknown, but some of the higher TDS wells are reported to be shallower than 250 feet below ground surface. This basin is also the most densely farmed area of the subwatershed, and has a predominant groundwater use for agricultural irrigation practices. If irrigation source water has higher salt levels, agricultural irrigation practices might concentrate salts in the shallow groundwater. However, salinity levels are not above the upper limit SMCL and trends are generally fluctuating, but stable over the long‐term.
SECTION 14 LAKE SUBWATERSHED
WBG091013074126SAC 14-7
The majority of the irrigated crops grown in this subwatershed are vineyards and orchards, which are farmed with low and carefully managed nutrient input, as evidenced by the sustainability programs developed by the two major commodities of the region, and the low crop NHI scores.
High vulnerability areas are considered the areas that have high nitrate and/or salinity with increasing trends in concentrations. The only area that has an occurrence of nitrate exceeding the MCL and higher salinity rates, is located in the Big Valley Groundwater Basin, northwest of Kelseyville. This basin would be designated as a temporary high vulnerability area for salinity until monitoring data and MPEPs suggest that irrigated agricultural practices are protective of groundwater resources. The section in which the nitrate exceedance well is located would be designated high vulnerability due to nitrate. The rest of the Big Valley basin might also need to be monitored based on observations of increasing nitrate concentration trends (Lake County 2003).
Potential data gap areas for groundwater quality due to a lack of nitrate data include the area west of Collayomi Valley, which includes pasture and vineyards farmed on volcanic deposits not associated with a defined groundwater basin. However, due to the large number of wells that exist in the subwatershed, it may be possible to identify additional wells that already have existing water quality information within the District that could be added to the monitoring program, or additional sampling could be performed to close the data gap.


WBG091013074126SAC 15-1
SECTION 15
Napa Subwatershed This subwatershed section describes general background information related to geographic location, land use, and physical setting, as well as current groundwater quality monitoring programs. Next, results of the vulnerability analysis are presented, followed by conclusions on vulnerability designations and recommendations.
15.1 Background The Napa Subwatershed includes eastern Napa County over an area of approximately 230,900 acres, which includes a portion of the Putah Creek Watershed. The major waterway in this subwatershed is the Upper Putah Creek, which discharges into Lake Berryessa. The lake occupies a large portion of the subwatershed, which does not include significant population or population centers. This subwatershed lies entirely in the foothills area of the Sacramento River Watershed, outside (upstream) of the valley floor.
Sources for irrigation water in the Putah Creek drainage of Napa County are generally limited. No organized purveyors of water (such as irrigation districts) exist, leaving growers to develop their own sources. Typical sources of irrigation water are private wells and surface diversion impoundment reservoirs (Napa County Putah Creek Watershed Group 2013).
15.1.1 Land Use The Napa Subwatershed is entirely rural. Irrigated agricultural areas mostly occur in the western portion of the subwatershed in an area overlying small alluvial aquifers. Major irrigated crops include wine grapes (98.5%) and olives (Napa County Putah Creek Watershed Group 2013). However, for this analysis, the most recent GIS‐based dataset available is from the PUR mapping database. The crop distribution per the PUR 2013 data in the Napa Subwatershed is shown on the top left map in Figure 15‐1.
The pie chart below shows the relative percentage, based on acreage, of the predominant crop categories grown in this subwatershed to total irrigated agriculture based on PUR 2013 data.

SECTION 15 NAPA SUBWATERSHED
15-2 WBG091013074126SAC
Based on this dataset, vineyards make up 76% of total irrigated crops. The Deciduous Fruit and Nuts (orchards) category may include some acreages of wine grapes alongside apples, pears, peaches, and nectarines. If only wine grapes are accounted for from the orchards category, the total vineyards would amount to 93% of total agricultural lands. Some pasture fields also occur in this subwatershed, which may or may not be irrigated.
According to the Coalition data, there were approximately 3,577 acres of enrolled irrigated lands for this subwatershed in 2012 and 3,687 acres in 2013.
15.1.2 Soils Soils characteristics play a major role in cropping patterns and farming practices, and influence the retention or infiltration of water and nutrients/pesticides through the subsurface. Understanding soil properties under irrigated agricultural lands is therefore important in assessing potential vulnerabilities to groundwater quality degradation. A brief description of soils conditions in this subwatershed is summarized below.
Soil Texture:
Soils in the Napa Subwatershed are mostly loam on in the western portion and silt loam east of Lake Berryessa.
Soil Drainage:
This subwatershed has mostly well drained to excessively drained soils. Most of the farmed areas are on well drained soils.
Soil Hydraulic Conductivity:
Soil hydraulic conductivity in this subwatershed is moderately high to high.
Soil Salinity, Alkalinity, and Acidity:
The Napa Subwatershed has mostly nonsaline soils.
Soils are mostly alkaline.
15.1.3 Geology and Hydrogeology The Napa Subwatershed overlies the Pope Valley Groundwater Basin as defined by DWR in Bulletin 118 (DWR 2003). This is the area where the majority of the irrigated agricultural production occurs in this subwatershed. The Pope Valley Basin occupies a northwest trending structural depression approximately 5 miles east of Lake Berryessa. The main water bearing deposit consists of the Quaternary alluvium that extends in depth to about 30 feet and is composed of silty to clayey sands and gravels. Recharge to groundwater occurs from deep percolation of precipitation on the valley floor (DWR 2003). Limited to no information is available on water levels and trends in this basin.
No initial HVAs and GPAs as defined by the State Water Resources Control Board have been determined in the Napa Subwatershed.
15.1.4 Current Programs and Groundwater Monitoring There is currently no established groundwater quality monitoring program in the Pope Valley Basin. There are no CASGEM wells in this Basin, although the 2013 Napa County Groundwater Monitoring Plan established the need to add a groundwater level monitoring well as part of the CASGEM program in this basin. Future groundwater quality monitoring might be implemented, but due to the low population density and low usage of groundwater, Pope Valley Basin is not considered a high‐priority monitoring basin for Napa County (Napa County 2013).
The Napa Subwatershed has been implementing a Pilot Watershed Management Practices Program (Pilot Plan) since 2010 to demonstrate irrigated agricultural practices are protective of surface water quality. The main objective of this program is to document management practices that minimize impacts to surface water from irrigated agricultural operations. This is achieved through best management practices for pesticides, irrigation water, erosion and sediment control, and nutrient input. Surveys of these practices help verify the management practices.

SECTION 15 NAPA SUBWATERSHED
WBG091013074126SAC 15-3
15.2 Vulnerability Analysis Results The vulnerability analysis was performed by reviewing groundwater quality data and susceptibility factors (hydrogeology, and soils and agronomy). The technical details related to the data processing that went into performing this analysis is described in Section 4.
Maps of each susceptibility and vulnerability index distribution are shown in Figures 15‐1 through 15‐4. A discussion of results and final scores for each of the factors follows below.
15.2.1 Groundwater Quality The review of groundwater quality for the vulnerability analysis focuses on nitrate, salinity, and pesticides. Other constituents of concern are reviewed as necessary based on documented occurrences.
In the Napa Subwatershed, very limited information is available on groundwater quality that characterizes the Pope Valley Basin (DWR 2003).
15.2.1.1 Nitrate The Napa Subwatershed NO3 analysis is based on a review of the concentration of the most recent sampling at each well from 13 wells located in this subwatershed and for which records were readily available. The maximum NO3 concentration from this dataset is 8.3 mg/L, with an average of 2.7 mg/L. The results show that nitrate measurements are extremely low in this subwatershed, and well below half the MCL of 45 mg/L. It should be noted that these wells are not necessarily restricted to irrigated agricultural areas, but represent the general water quality of groundwater in the entire subwatershed.
The distribution of nitrate in groundwater is presented on Figure 15‐2. From this geographic distribution, it is apparent that the majority of the wells show low nitrate concentrations. Note that most of these wells are from the CDPH data available from GeoTracker GAMA database, and the locations are available at the section level; therefore, numerous wells fall on top of each other on the map.
15.2.1.2 Salinity As described in Section 4, salinity levels in groundwater are reviewed to identify areas of the aquifer with elevated values. High salinity levels in groundwater can be problematic when groundwater is used as the primary source of irrigation water, because this practice can potentially lead to accumulation of salts in the subsurface, creating the potential for long‐term mass flux to the aquifer system.
For this analysis, TDS concentrations along with EC values converted to TDS concentrations were used to evaluate the spatial and temporal distribution of salinity in groundwater underlying irrigated agriculture from a total of 8 wells. The maximum TDS concentration from this dataset is 569 mg/L, with an average of 314 mg/L. The results show that TDS measurements are low in this subwatershed, and well below the SMCL of 1,000 mg/L. It should be noted that these wells are not necessarily restricted to irrigated agricultural areas, but represent the general water quality of groundwater in the entire subwatershed.
The distribution of TDS in groundwater is presented on Figure 15‐3. From this geographic distribution, it is apparent that the majority of the wells show low TDS concentrations. Note that most of these wells are from the CDPH data available from GeoTracker GAMA database, and the locations are available at the section level; therefore, numerous wells fall on top of each other on the map.
15.2.1.3 Pesticides A summary of pesticides detected in groundwater in each of the counties and groundwater basins in the Sacramento River Watershed is provided in Appendix J.
15.2.2 Susceptibility Factors 15.2.2.1 Hydrogeology As discussed above, the majority of the irrigated agricultural lands lie in the Pope Valley Basin. Information on this basin is limited, but it is defined by alluvial materials and well drained soils with high hydraulic conductivity at the

SECTION 15 NAPA SUBWATERSHED
15-4 WBG091013074126SAC
surface. These characteristics present higher susceptibility to groundwater quality impairment from surface activities, notably irrigated agriculture.
15.2.2.2 Soils and Agronomy Figure 15‐4 shows the section‐level analysis of the individual and total NHI scores. The crop scores tend to be very low, as expected from a dominant vineyard and orchard crops distribution. Irrigation scores are also low, since the majority of the crop acres are irrigated with micro‐sprinklers. Irrigation practices are efficient because sources of irrigation water in this subwatershed are generally limited. Average annual irrigation water application varies between 2 and 8 inches (Napa County Putah Creek Watershed Group 2013). In addition, the majority of the wine grape producers practice “deficit irrigation,” which calls for minimal irrigation water application and helps boost wine grape quality (Napa County Putah Creek Watershed Group 2013).
The soil scores vary throughout the subwatershed, with most areas having medium scores. Some areas had soils that were not classified at the time this analyses was performed, preventing a total score to be computed. For areas where all three scores were available, the total NHI score was computed, and Figure 15‐4 shows that most areas have a very low total NHI score below 20.
15.3 Conclusions The vulnerability of groundwater was assessed using a combination of susceptibility indicators and groundwater quality monitoring results described in Section 4.
In summary, based on the limited groundwater quality results described above, the Napa Subwatershed has very low concentrations of nitrate and TDS and does not present any major groundwater quality issues.
Even though the alluvial aquifer high soil drainage conditions might create some susceptibility to groundwater contamination, the following are applicable and confirm the low vulnerability designation for this subwatershed:
The majority of the irrigated crops grown in this subwatershed are vineyards, which use very little irrigation water.
Irrigated agricultural lands make up only 1.5% of the entire subwatershed area and are sparsely spread.
The Pilot Plan was developed to help implement best management practices for irrigated agriculture, which minimize potential impacts to groundwater quality.
Groundwater quality does not show any impacts from irrigated agriculture.

WBG091013074126SAC 16-1
SECTION 16
Pit River Subwatershed This subwatershed section describes general background information related to geographic location, land use, and physical setting, as well as current groundwater quality monitoring programs. Next, results of the vulnerability analysis are presented, followed by conclusions on vulnerability designations and recommendations.
16.1 Background The Pit River Subwatershed includes the majority of Modoc County and portions of Lassen and Shasta Counties over an area of approximately 3.2 million acres. Major waterways include Fall River and the North and South Forks of the Pit River. Major population centers include Burney, Fall River Mills, and Alturas. This subwatershed lies entirely in the mountainous area of the Sacramento River Watershed, outside (upstream) of the Valley floor. The majority of agricultural water in this subwatershed is supplied by groundwater in the irrigated areas.
16.1.1 Land Use The Pit River Subwatershed has a large forested area, with approximately 60 percent of its area owned by federal and State departments, and about 15 percent are covered by forest landowners. Therefore, irrigated agriculture occupies only a small portion of the overall subwatershed area, and is concentrated mostly in areas overlying alluvial aquifers to be able to pump groundwater for irrigation. The irrigated crop distribution in the Pit River Subwatershed is shown on the top left map in Figure 16‐1. Major irrigated crops include:
Pasture
Grain and hay (oats, barley, wheat)
The pie chart below shows the relative percentage, based on acreage, of the predominant crop categories grown in this subwatershed to total irrigated agriculture based on DWR 1997 data for Lassen County, DWR 1999 data for Modoc County (the most recent available for these counties), and Cal Ag PUR 2013 data for Shasta County.
Pasture crops are the majority of agricultural lands in the subwatershed at 65% of the total acreage, followed by grain and hay crops at 34%.

SECTION 16 PIT RIVER SUBWATERSHED
16-2 WBG091013074126SAC
According to the Coalition data, there were approximately 73,763 acres of enrolled irrigated lands for this subwatershed in 2012 and 63,191 acres (including Modoc Wildlife Refuge) in 2013.
16.1.2 Soils Soils characteristics play a major role in cropping patterns and farming practices, and influence the retention or infiltration of water and nutrients/pesticides through the subsurface. Understanding soil properties under irrigated agricultural lands is therefore important in assessing potential vulnerabilities to groundwater quality degradation. A brief description of soils conditions in this subwatershed is summarized below.
Soil Texture:
Soils in the Pit River Subwatershed are not characterized in all areas. In general, clay and clay loam soils dominate the eastern portion of the subwatershed south of Alturas. The dominant soil in the rest of the subwatershed is sandy loam, with loam on the subwatershed fringes.
Soil Drainage:
This subwatershed has mostly well drained soils, with areas of excessively drained soils in the western portion.
Soils overlying the alluvial basins tend to be moderately well drained and poorly to very poorly drained.
Soil Hydraulic Conductivity:
Soil hydraulic conductivity in this subwatershed is moderately high to high, with pockets of areas that have moderately low hydraulic conductivity.
Soil Salinity, Alkalinity, and Acidity:
The Pit River Subwatershed has mostly nonsaline soils. A few small areas in the east have moderately saline soils.
Soils in this subwatershed are more acidic in the west and more alkaline in the east, except for a few small pockets of ultra acidic areas in the east.
16.1.3 Geology and Hydrogeology The Pit River Subwatershed several alluvial groundwater basins as defined by DWR in Bulletin 118 (DWR 2003). The largest basins that underlie the majority of the irrigated agricultural lands are the Alturas Area Basins, Big Valley, and Fall River Valley:
Alturas Area: The Alturas Area Basin is split into two groundwater subbasins: South Fork Pit River and Warm Springs Valley. According to the DWR (2003) description, “the groundwater regime between Warm Springs Valley and South Fork Pit River Valley is continuous through a north‐to‐northwest trending highland, west and south of Alturas, that forms two distinct valleys with separate surface drainage. From the confluence of the North and South Forks of the Pit River, just to the east at Alturas, the Pit River flows westerly through Warm Springs Valley.” The main water‐bearing formations for both subbasins are Holocene sedimentary deposits that include alluvial fan deposits, intermediate alluvium, and basin deposits, as well as Pleistocene lava flows and near‐shore deposits, and Plio‐Pleistocene Alturas Formation and basalts (DWR 2003). Upland recharge areas consist of permeable lava flows. Deep percolation from precipitation constitutes and important groundwater recharge mechanism. Groundwater flows from the lava flows toward the valley floor (DWR 2003).
Big Valley: “Big Valley is a broad flat plain extending about 13 miles north‐to‐south and 15 miles east‐to‐west consisting of a series of depressed fault blocks surrounded by tilted fault block ridges. The Pit River enters the valley from the north and exits at the southernmost tip of the valley through a narrow canyon gorge” (DWR 2003). Similar to the Alturas Area Basin, the primary water‐bearing formations in the Big Valley Basin are Holocene sedimentary deposits, Pliocene and Pleistocene lava flows, and the Plio‐ Pleistocene Bieber

SECTION 16 PIT RIVER SUBWATERSHED
WBG091013074126SAC 16-3
Formation (DWR 2003). Big Valley provides the primary source of water for agriculture and public and domestic use (Lassen County 2007). However, surface water also provides an additional source.
Fall River Valley: The Fall River Valley Basin contains a series of major springs with substantial flows (1,400 to 2,000 cubic feet per second) discharging into the valley from the northerly plateau escarpment (DWR 2003). These springs have been extensively appropriated or diverted for irrigation and power development. Fall River is the primary stream draining the northern and central valley areas, and the Pit River is the primary stream in the easterly and southerly portion of the basin. The primary water‐bearing formations are Holocene sedimentary deposits, Holocene lava flows, Pleistocene lake and near‐shore deposits, and Pleistocene to Pliocene volcanic rocks (DWR 2003).
As shown in Figure 2‐10, there is one small area defined as an initial HVA as defined by the State Water Resources Control Board, and it is located in the area overlying the Jess Valley Groundwater Basin in the southeast corner of the subwatershed. In addition, an initial GPA, as defined by DPR, is located in the South Fork Pitt River Subbasin along the river.
16.1.4 Current Programs and Groundwater Monitoring Modoc County does not currently have a groundwater management plan. Similarly, the portion of Shasta County located in the Pit River Subwatershed does not include a groundwater management plan.
The portion of Big Valley in Lassen County includes 377 inventoried wells, with 137 domestic wells and 132 irrigation wells (Lassen County 2007). Domestic wells are usually shallow, with approximately 50 percent of the well depths below 150 feet deep. The agricultural wells tend to be drilled deeper with approximately 50 percent of the agricultural wells deeper than 450 feet (Lassen County 2007). Twenty‐seven monitoring wells also exist in the Big Valley Basin, mostly for water level monitoring. Groundwater quality monitoring is not routinely performed in the Big Valley.
In addition, many wells are regularly monitored by DWR and by CASGEM monitoring entities for groundwater levels in the Pit River Subwatershed groundwater basins. Those wells vary in depth and might be suitable for future groundwater quality monitoring (after review of well construction details, if available). Maps of the location of CASGEM wells for each county are shown in Appendix H.
16.2 Vulnerability Analysis Results The vulnerability analysis was performed by reviewing groundwater quality data and susceptibility factors (hydrogeology, and soils and agronomy). The technical details related to the data processing that went into performing this analysis is described in Section 4.
Maps of each susceptibility and vulnerability index distribution are shown in Figures 16‐1 through 16‐4. A discussion of results and final scores for each of the factors follows below.
16.2.1 Groundwater Quality The review of groundwater quality for the vulnerability analysis focuses on nitrate, salinity, and pesticides. Other constituents of concern are reviewed as necessary, based on documented occurrences.
Based on DWR (2003) descriptions, it is known that some wells in the Alturas Groundwater Basin have high concentrations of TDS, nitrate, iron, or boron. In addition, Kelly Hot Springs has water high in total dissolved solids, boron, and fluoride. High conductivity, sulfate, iron, nitrate, calcium, manganese, and boron are found in some areas of the Alturas Area Basin (DWR 2003).
In Big Valley, two hot springs and one well with sodium sulfate type water have been identified in the basin east of Bieber. In addition, local occurrences of high nitrates, manganese, fluoride, iron, sulfate, ammonia, phosphorus, conductivity, and TDS have been reported in the basin (DWR 2003).
In Fall River Valley, some well samples have shown high iron concentrations, and local occurrences of high nitrate, manganese, ammonia, and phosphorus have been reported in the basin (DWR 2003).

SECTION 16 PIT RIVER SUBWATERSHED
16-4 WBG091013074126SAC
16.2.1.1 Nitrate The Pit River Subwatershed NO3 analysis is based on a review of the concentration of the most recent sampling at each well from 330 wells located in this subwatershed and for which records were readily available. Table 16‐1 provides summary statistics for wells that were sampled for NO3 in the Pit River Subwatershed. Six percent of most recent wells had nitrate values above half the MCL, while 2 percent of wells had nitrate values exceeding the primary MCL of 45 mg/L. The average concentration is 4.3 mg/L, well below half the MCL. It should be noted that these wells are not necessarily restricted to irrigated agricultural areas, but represent the general water quality of groundwater in the entire subwatershed.
TABLE 16-1 Pit River Subwatershed: Most Recent NO3 Results at Each Well
Agency
Total number of wells with NO3 result
# wells less than 250 ft deep
# wells more than 250 ft deep
# wells with
unknown depth
# of wells above 0.5 MCL
# of wells above MCL
Concentration (mg/L) Range of most
recent data Min. Max. Average
USGS (NWIS and GAMA)
17 7 8 2 0 0 <RL 10 1.9 2010
DWR (all)* 221 221 18 8 <RL 310 9 1952‐2008
CDPH 92 92 2 0 <RL 24.3 2.1 1992‐2013
Total 330 7 8 315 20 (6%) 8 (2%) <RL 310 4.3
* Depth is either total well depth or sample depth.
The distribution of nitrate in groundwater is presented on Figure 16‐2. From this geographic distribution, it is apparent that there is a good distribution of wells with nitrate samples in this subwatershed. Each of the three major groundwater basins have had a few nitrate level exceedances, but they are surrounded by many wells that show low nitrate concentrations (below half the MCL). In addition, these one‐time nitrate exceedances (there are no trend data available for these wells) have been measured in the late 1950s and early 1960s, with no recent measurements available. None of the recent USGS‐measured wells from 2010 show nitrate concentrations higher than half the MCL. The older laboratory procedures had different detection and reporting limits; therefore, results from more recent wells should take precedence over the older well samples (which can be useful for looking at trends).
16.2.1.2 Salinity As described in Section 4, salinity levels in groundwater are reviewed to identify areas of the aquifer with elevated values. High salinity levels in groundwater can be problematic when groundwater is used as the primary source of irrigation water, because this practice can potentially lead to accumulation of salts in the subsurface, creating the potential for long‐term mass flux to the aquifer system.
For this analysis, TDS concentrations along with EC values converted to TDS concentrations were used to evaluate the spatial and temporal distribution of salinity in groundwater underlying irrigated agriculture from a total of 146 wells.
Table 16‐2 provides summary statistics for wells that were sampled for TDS and EC in the Pit River Subwatershed. In this analysis, the most recent sample data available for each well was used. In the Pit River Subwatershed, 5 percent of most recent wells had TDS values above the recommended secondary MCL of 500 mg/L, and less than 1 percent of the wells had TDS values exceeding the upper limit secondary MCL of 1,000 mg/L. The average concentration is 219 mg/L, which is below the secondary recommended MCL of 500 mg/L. It should be noted that not all of these wells necessarily overly irrigated agriculture areas, but represent the general water quality of groundwater in the entire subwatershed.

SECTION 16 PIT RIVER SUBWATERSHED
WBG091013074126SAC 16-5
TABLE 16-2 Pit River Subwatershed: Most Recent TDS Results at Each Well
Agency
Total number of wells with TDS result
# wells less than 250 ft deep
# wells more than 250 ft deep
# wells with
unknown depth
# of wells above
500 mg/L
# of wells above
1,000 mg/L
Concentration (mg/L) Range of most
recent data Min. Max. Average
USGS (NWIS and GAMA)
20 9 9 2 0 0 54 286 169.7 1980‐2010
DWR (all)* 78 78 8 1 45 1,620 290.2 1958‐2008
CDPH 48 48 0 0 58 378 196.9 1989‐2012
Total 146 9 9 128 8 (5%) 1 (0.7%) 45 1,620 218.9
* Depth is either total well depth or sample depth.
The distribution of TDS in groundwater is presented on Figure 16‐3. This geographic distribution shows that wells with TDS concentrations above 500 mg/L are located in the Alturas Area Basin. The other basins have low groundwater TDS concentrations.
16.2.1.3 Pesticides A summary of pesticides detected in groundwater in each of the counties and groundwater basins in the Sacramento River Watershed is provided in Appendix J.
16.2.1.3.1 Other Constituents of Concern
Alturas Area Groundwater Basin: iron, boron, sulfate, manganese
Big Valley Groundwater Basin: manganese, fluoride, iron, sulfate, ammonia, phosphorus
Fall River Valley Groundwater Basin: iron, manganese, ammonia, phosphorus
16.2.2 Susceptibility Factors 16.2.2.1 Hydrogeology The hydrogeology in this subwatershed is characteristic of alluvial basins underlain by volcanic materials and lava flows, as well as faults and hot springs. In some areas, fault zones may have created shattered permeable areas for groundwater movement in the volcanic rocks. In contrast, within the sedimentary deposits, faulting may have created barriers to groundwater movement (DWR 2003). Therefore, the geologic structures are very complex. In general, the alluvial materials on which farming occurs drive the hydrogeologic susceptibility. Well drained soils and relatively high soil hydraulic conductivity can increase the susceptibility to groundwater quality impairment.
16.2.2.2 Soils and Agronomy Figure 16‐4 shows the section‐level analysis of the individual and total NHI scores. The crop scores tend to be very low, as expected from a dominant hay and pasture agriculture. Irrigation scores are high because it was assumed that most areas are surface irrigated (flood and center‐pivot). The soil scores vary throughout the subwatershed with most areas having medium to low scores. Some areas had soils that were not classified at the time this analyses was performed, preventing a total score to be computed. For areas where all three scores were available, the total NHI score was computed and Figure 16‐4 shows that most areas have a very low total NHI score below 20.
From an agronomic perspective, farmers in this subwatershed use leaf testing for careful application of nitrogen fertilizers, which occurs several times (2 to 3) during the growing season. These tests help prevent over‐application of nutrients to the crops.

SECTION 16 PIT RIVER SUBWATERSHED
16-6 WBG091013074126SAC
16.3 Conclusions The vulnerability of groundwater was assessed using a combination of susceptibility indicators and groundwater quality monitoring results. The vulnerability designation concept developed during the preparation of the GAR (as described in Section 4) defines groundwater quality as the first item to consider when identifying potential areas of high vulnerability. Susceptibility factors will be used in the determination of prioritized areas for trend monitoring in low vulnerability areas.
In summary, based on the groundwater quality results described above, the Pit River Subwatershed has very few MCL exceedances of nitrate concentrations. In addition, these exceedances were measured 5 to 6 decades ago. More recent monitoring is necessary to evaluate whether the historic data is reflective of current conditions. Since the majority of the recently sampled wells by USGS, CDPH, and DWR show lower nitrate results than the older samples, it can be inferred that groundwater quality has been improving in this subwatershed. Trend monitoring would help confirm this hypothesis.
From a salinity perspective, the only basin with slightly elevated salinity levels is the Alturas Area Basin, where some wells have TDS concentrations above 500 mg/L. Groundwater tends to be an important source of irrigation water in this subwatershed. If irrigation source water has higher salt levels, agricultural irrigation practices might concentrate salts in the shallow groundwater. However, salinity levels are not above the upper limit SMCL.
High vulnerability areas are considered the areas that have high nitrate and/or salinity with increasing trends in concentrations. Since the available data generally show low nitrate concentrations except for wells with older samples, it can be inferred that this subwatershed has a low vulnerability designation for all basins.
Data gaps in this subwatershed are mostly related to the lack of very recent groundwater quality measurements and trend data. The geographic distribution of wells that have been sampled it the past seems adequate, but newer samples are necessary to confirm the vulnerability conclusions for this subwatershed.
WBG091013074126SAC 17-1
SECTION 17
Upper Feather River Subwatershed This subwatershed section describes general background information related to geographic location, land use, and physical setting, as well as current groundwater quality monitoring programs. Next, results of the vulnerability analysis are presented, followed by conclusions on vulnerability designations and recommendations. In addition to reports from DWR and local entities, information used to write this section was also compiled during subwatershed outreach.
17.1 Background The Upper Feather River Subwatershed includes all of Plumas County and portions of Sierra and Lassen Counties over an area of approximately 2.15 million acres. Major waterways include the North and Middle Forks of the Feather River. Major population centers include Quincy and Portola. This subwatershed lies entirely in the mountainous area of the Sacramento River Watershed, outside (upstream) of the valley floor. The availability of surface water (provided through snowmelt) for irrigation limits the need to pump groundwater for farming practices.
17.1.1 Land Use The Upper Feather River Subwatershed is very sparsely populated and has a diverse vegetation composed of mixed conifer and deciduous forests in the west and sparse sage/yellow pine plants in the east. The U.S. National Forest Service manages over 80 percent of this subwatershed. The alluvial valleys in the east are primarily privately owned lands that are used for livestock grazing and hay production (UFRW 2007).
Therefore, agriculture only occupies a small portion of the overall subwatershed area, and is concentrated mostly in areas overlying alluvial aquifers that have fertile soils. The crop distribution in the Upper Feather River Subwatershed is shown on the top left map in Figure 17‐1. Major crops include:
Pasture and alfalfa
Hay
Large areas of rangeland also occur, but they are not irrigated and therefore not considered in the evaluation of irrigated lands in this GAR. Pasturelands are also often not irrigated due to shallow groundwater and high precipitation in areas, but the exact location of known irrigated versus non‐irrigated pasture is not available. One small area shown as annual fruit, vegetables, and seeds is an old Christmas tree farm no longer in production, but the land use category has not been updated by DWR.
The pie chart below shows the relative percentage, based on acreage, of the predominant crop categories grown in this subwatershed to total irrigated agriculture based on DWR 1997 data for Plumas County, DWR 2002 data for Sierra County, and DWR 1997 data for Lassen County (the most recent available for these counties). No Cal Ag PUR data coverage is available, since there is very minimal use of pesticides on pasture and rangeland.

SECTION 17 UPPER FEATHER RIVER SUBWATERSHED
17-2 WBG091013074126SAC
Pasture crops are the majority of agricultural lands in the subwatershed and account for 98 percent of the total agricultural lands. It should be noted that for this analysis and using a conservative approach, it is assumed that all crops presented are irrigated even if this is probably not the case, because better information is not available.
According to the Coalition data, there were approximately 41,277 acres of enrolled irrigated lands for this subwatershed in 2012 and 30,646 acres in 2013.
17.1.2 Soils Soils characteristics play a major role in cropping patterns and farming practices, and influence the retention or infiltration of water and nutrients/pesticides through the subsurface. Understanding soil properties under irrigated agricultural lands is therefore important in assessing potential vulnerabilities to groundwater quality degradation. A brief description of soils conditions in this subwatershed is summarized below.
Soil Texture:
This subwatershed includes a variety of soil types. In areas that have irrigated agriculture, soils are composed of sandy loam and loamy sand, and an area of silt loam in the vicinity of Quincy.
Soil Drainage:
This subwatershed has mostly well drained soils.
Soils overlying the major alluvial basins tend to be moderately well drained, with some areas exhibiting somewhat poorly drained to very poorly drained soils.
Soil Hydraulic Conductivity:
Soil hydraulic conductivity in this subwatershed is moderately high to high.
Soil Salinity, Alkalinity, and Acidity:
The Upper Feather River Subwatershed has mostly nonsaline soils, except for the Sierra Valley area, which shows moderately saline soils.
Soils in this subwatershed are generally moderately to strongly acidic, while the Sierra Valley exhibits more alkaline soils.

SECTION 17 UPPER FEATHER RIVER SUBWATERSHED
WBG091013074126SAC 17-3
17.1.3 Geology and Hydrogeology The Upper Feather River Subwatershed overlies several alluvial groundwater basins as defined by DWR in Bulletin 118 (DWR 2003). The largest groundwater basins that underlie the majority of the irrigated agricultural lands are the Sierra Valley to the southeast, the Indian Valley to the north, and the American Valley in the vicinity of Quincy, to the south of the Indian Valley. The Sierra Valley is by far the largest and most productive groundwater basin in this subwatershed.
Sierra Valley: The Sierra Valley Basin is split into two groundwater subbasins: Sierra Valley and Chilcoot:
The Sierra Valley has an irregular shape and has complex faults (DWR 2003): “The primary water‐bearing formations in Sierra Valley are Holocene sedimentary deposits, Pleistocene lake deposits, and Pleistocene lava flows. The aquifers of the valley are mainly alluvial fan and lake deposits. The alluvial fans grade laterally from the basin boundaries into coarse lake and stream deposits. The deposits of silt and clay act as aquitards or aquicludes in the formation. Aquiclude materials are predominantly fine‐grained lake deposits. In the central part of the basin, alluvial, lake and basin deposits comprise the upper 30‐ to 200‐feet of aquitard material that overlies a thick sequence of interstratified aquifers and aquicludes. Most of the upland recharge areas are composed of permeable materials occurring along the upper portions of the alluvial fans that border the valley. Recharge to groundwater is primarily by way of infiltration of surface water from the streams that drain the mountains and flow across the fans.”
The Chilcoot Subbasin is located on the eastern side of the Sierra Valley Basin and has similar characteristics as the Sierra Valley Subbasin. The Chilcoot Subbasin is hydrologically connected to the Sierra Valley Subbasin to the west in the near surface but may be discontinuous at depth due to a bedrock sill (DWR 2003). “The primary water‐bearing formations in the Chilcoot Subbasin are the Holocene sedimentary deposits and silt and sand deposits, fractured and faulted Paleozoic to Mesozoic metamorphic and granitic rocks, and Tertiary volcanic rocks” (DWR 2003). Recharge to this subbasin is similar to recharge to the Sierra Valley Subbasin.
Indian Valley: The Indian Valley Basin is composed of marine, volcanic, and metavolcanic rocks (DWR 2003). Water‐bearing formations are not characterized for this basin.
American Valley: According to DWR (2003), “The American Valley Groundwater Basin is bounded to the southwest and northeast by a northwest trending fault system. The basin is bounded to the northeast by Paleozoic metavolcanic rocks and is bounded on all other sides by Paleozoic marine sedimentary and meta‐sedimentary rocks of the Sierra Nevada Mountains. Spanish Creek drains the valley and is tributary to the North Fork Feather River to the northwest.” Water‐bearing formations are not characterized for this basin.
As shown in Figure 2‐10, the Sierra Valley and two other smaller valleys west of the Sierra Valley are defined as initial HVAs by the State Water Resources Control Board. The Sierra Valley is marked by high groundwater levels (or a shallow water table), which creates susceptibility to groundwater impacts from irrigation and fertilization. In general, in the mountain meadows of this subwatershed, groundwater is very close to the surface, so in many years there is no need to irrigate crops. Snow runoff also provides valuable water to crops in this mountainous subwatershed.
17.1.4 Current Programs and Groundwater Monitoring There is currently no official groundwater management plan in this subwatershed. The regional IRWMP update will include information on groundwater management and include groundwater quality monitoring projects.
The Sierra Valley Groundwater Management District regularly monitors groundwater quality in the Subwatershed at several district‐owned monitoring wells, including newly developed nested monitoring wells, for the major groundwater basins.
The Sierra and Plumas County Health Departments also monitor groundwater quality at smaller public water supply systems.
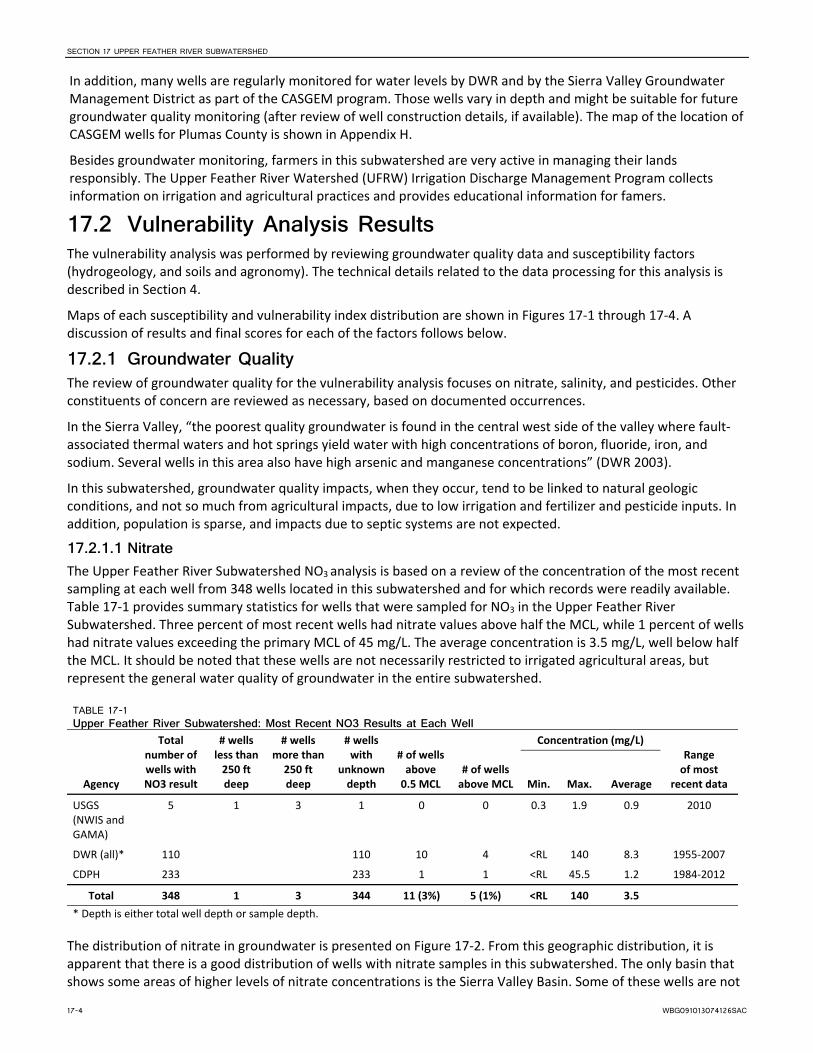
SECTION 17 UPPER FEATHER RIVER SUBWATERSHED
17-4 WBG091013074126SAC
In addition, many wells are regularly monitored for water levels by DWR and by the Sierra Valley Groundwater Management District as part of the CASGEM program. Those wells vary in depth and might be suitable for future groundwater quality monitoring (after review of well construction details, if available). The map of the location of CASGEM wells for Plumas County is shown in Appendix H.
Besides groundwater monitoring, farmers in this subwatershed are very active in managing their lands responsibly. The Upper Feather River Watershed (UFRW) Irrigation Discharge Management Program collects information on irrigation and agricultural practices and provides educational information for famers.
17.2 Vulnerability Analysis Results The vulnerability analysis was performed by reviewing groundwater quality data and susceptibility factors (hydrogeology, and soils and agronomy). The technical details related to the data processing for this analysis is described in Section 4.
Maps of each susceptibility and vulnerability index distribution are shown in Figures 17‐1 through 17‐4. A discussion of results and final scores for each of the factors follows below.
17.2.1 Groundwater Quality The review of groundwater quality for the vulnerability analysis focuses on nitrate, salinity, and pesticides. Other constituents of concern are reviewed as necessary, based on documented occurrences.
In the Sierra Valley, “the poorest quality groundwater is found in the central west side of the valley where fault‐associated thermal waters and hot springs yield water with high concentrations of boron, fluoride, iron, and sodium. Several wells in this area also have high arsenic and manganese concentrations” (DWR 2003).
In this subwatershed, groundwater quality impacts, when they occur, tend to be linked to natural geologic conditions, and not so much from agricultural impacts, due to low irrigation and fertilizer and pesticide inputs. In addition, population is sparse, and impacts due to septic systems are not expected.
17.2.1.1 Nitrate The Upper Feather River Subwatershed NO3 analysis is based on a review of the concentration of the most recent sampling at each well from 348 wells located in this subwatershed and for which records were readily available. Table 17‐1 provides summary statistics for wells that were sampled for NO3 in the Upper Feather River Subwatershed. Three percent of most recent wells had nitrate values above half the MCL, while 1 percent of wells had nitrate values exceeding the primary MCL of 45 mg/L. The average concentration is 3.5 mg/L, well below half the MCL. It should be noted that these wells are not necessarily restricted to irrigated agricultural areas, but represent the general water quality of groundwater in the entire subwatershed.
TABLE 17-1 Upper Feather River Subwatershed: Most Recent NO3 Results at Each Well
Agency
Total number of wells with NO3 result
# wells less than 250 ft deep
# wells more than 250 ft deep
# wells with
unknown depth
# of wells above 0.5 MCL
# of wells above MCL
Concentration (mg/L) Range of most
recent data Min. Max. Average
USGS (NWIS and GAMA)
5 1 3 1 0 0 0.3 1.9 0.9 2010
DWR (all)* 110 110 10 4 <RL 140 8.3 1955‐2007
CDPH 233 233 1 1 <RL 45.5 1.2 1984‐2012
Total 348 1 3 344 11 (3%) 5 (1%) <RL 140 3.5
* Depth is either total well depth or sample depth.
The distribution of nitrate in groundwater is presented on Figure 17‐2. From this geographic distribution, it is apparent that there is a good distribution of wells with nitrate samples in this subwatershed. The only basin that shows some areas of higher levels of nitrate concentrations is the Sierra Valley Basin. Some of these wells are not

SECTION 17 UPPER FEATHER RIVER SUBWATERSHED
WBG091013074126SAC 17-5
located in areas of irrigated agriculture and could be due to other potential sources (for example septic systems or other land use).
Graphs of NO3 for wells that have more than 5 sample results are provided in Appendix I. These graphs give an indication of nitrate concentration trends over time, to help identify if land use practices at the surface are acting to reduce the mass flux of nitrate to the groundwater system (decreasing trend in nitrate concentration) or continuing to add nitrate mass to the aquifer (increasing trend) of groundwater quality. Nitrate concentration trends for the Upper Feather River Subwatershed are decreasing or stable.
17.2.1.2 Salinity As described in Section 4, salinity levels in groundwater are reviewed to identify areas of the aquifer with elevated values. High salinity levels in groundwater can be problematic when groundwater is used as the primary source of irrigation water, because this practice can potentially lead to accumulation of salts in the subsurface, creating the potential for long‐term mass flux to the aquifer system.
For this analysis, TDS concentrations along with EC values converted to TDS concentrations were used to evaluate the spatial and temporal distribution of salinity in groundwater underlying irrigated agriculture, from a total of 242 wells.
Table 17‐2 provides summary statistics for wells that were sampled for TDS and EC in the Upper Feather River Subwatershed. In this analysis, the most recent sample data available for each well was used. In the Upper Feather River Subwatershed, 2 percent of most recent wells had TDS values above the recommended secondary MCL of 500 mg/L, and less than 1 percent of the wells had TDS values exceeding the upper limit secondary MCL of 1,000 mg/L. The average concentration is 142 mg/L, which is well below half the secondary recommended MCL of 500 mg/L. Therefore, salinity does not pose any major problems in this subwatershed. It should be noted that not all of these wells necessarily overly irrigated agriculture areas, but represent the general water quality of groundwater in the entire subwatershed.
TABLE 17-2 Upper Feather River Subwatershed: Most Recent TDS Results at Each Well
Agency
Total number of wells with TDS result
# wells less than 250 ft deep
# wells more than 250 ft deep
# wells with
unknown depth
# of wells above
500 mg/L
# of wells above
1,000 mg/L
Concentration (mg/L) Range of most
recent data Min. Max. Average
USGS (NWIS and GAMA)
5 1 3 1 0 0 77 191 108.2 2010
DWR (all)* 98 98 5 1 27 1,620 201.1 1955‐2007
CDPH 139 139 0 0 16 321 116.2 1984‐2012
Total 242 1 3 238 5 (2%) 1 (0.4%) 16 1,620 141.8
* Depth is either total well depth or sample depth.
The distribution of TDS in groundwater is presented on Figure 17‐3. This geographic distribution shows that wells with slightly higher TDS concentrations are located in the Sierra Valley Basin, but in general, most wells show very low salinity in this basin. The other basins have low groundwater TDS concentrations.
Graphs of TDS for wells that have more than 5 sample results are provided in Appendix I. These graphs give an indication of TDS concentration trends over time, to help identify if land use practices at the surface are acting to reduce the mass flux of TDS to the groundwater system (decreasing trend in TDS concentration). In areas where TDS concentrations are elevated and stable, natural sources are likely the cause of salinity, and where TDS concentrations are increasing, land use and irrigation water sources may influence the overall salinity in the aquifer. Recent samples generally show stable trends except for one or two wells.

SECTION 17 UPPER FEATHER RIVER SUBWATERSHED
17-6 WBG091013074126SAC
17.2.1.3 Pesticides A summary of pesticides detected in groundwater in each of the counties and groundwater basins in the Sacramento River Watershed is provided in Appendix J.
17.2.1.4 Other Constituents of Concern In the Sierra Valley, boron, fluoride, iron, sodium, arsenic, and manganese issues have been detected, probably due to natural subsurface conditions.
17.2.2 Susceptibility Factors 17.2.2.1 Hydrogeology The hydrogeology in this subwatershed is characteristic of alluvial basins with lake deposits, volcanic uplands, and faults. Therefore, the geologic structures are very complex.
The aquifers of the subwatershed are mainly alluvial fan and lake deposits, while most of the upland recharge areas are composed of permeable materials occurring along the upper portions of the alluvial fans. Recharge to groundwater is primarily by way of infiltration of surface water.
All of these conditions combined result in high groundwater recharge rates and shallow groundwater levels across the agricultural areas of the subwatershed, and creates high susceptibility conditions from a hydrogeologic perspective.
17.2.2.2 Soils and Agronomy Figure 17‐4 shows the section‐level analysis of the individual and total NHI scores. The crop scores tend to be very low, as expected from a dominant hay and pasture agriculture. Irrigation scores are high as it was assumed that most areas are surface irrigated (flood and center‐pivot). The soil scores vary throughout the subwatershed with areas of low scores and areas of high scores (northern Sierra Valley). However, most agricultural areas had soils that were not classified at the time this analyses was performed, preventing a total score to be computed. For areas where all three scores were available, the total NHI score was computed, and Figure 17‐4 shows that most areas have a very low total NHI score below 20 due to the very low crop score. Therefore, it is expected that the rest of the unclassified areas would also have very low NHI scores and as a result, this subwatershed has low susceptibility from an agronomic standpoint.
In addition, DPR has reported that pesticide use in Plumas and Sierra Counties is extremely limited (UFRW 2007), particularly on pasture and alfalfa fields. There is also very limited fertilizer use in this area. When fertilizer is used, it is on a sporadic, as‐needed basis to supplement depleted soils with needed nutrients periodically.
17.3 Conclusions The vulnerability of groundwater was assessed using a combination of susceptibility indicators and groundwater quality monitoring results as described in Section 4.
In summary, based on the groundwater quality results described above, the Upper Feather River Subwatershed has almost no MCL exceedances of nitrate and TDS, and those present are not necessarily linked to irrigated agricultural impacts. There have not been any reported issues of nitrate and TDS in this subwatershed, other constituents of concern are generally linked to natural subsurface conditions.
High vulnerability areas are considered the areas that have high nitrate and/or salinity with increasing trends in concentrations. The well sampling data generally show low nitrate and TDS concentrations. Even though the hydrogeologic susceptibility is high, the agronomic susceptibility is very low. This combined with the good groundwater quality found in the alluvial basins, it can be inferred that this subwatershed has a low vulnerability designation for all basins
No major data gaps are found in this subwatershed.

WBG091013074126SAC 18-1
SECTION 18
Results and Conclusions The Sacramento River Watershed GAR incorporates a detailed technical analysis to provide a regional‐scale evaluation of all readily available groundwater quality data and to correlate land use data with susceptibility indicators and groundwater quality data.
Section 1 provides a brief overview of the LTILRP and the Coalition, as well as a summary of data used for the analysis.
Section 2 provides the regional setting with a detailed overview of the physical characteristics of the Sacramento River Watershed agricultural areas.
Section 3 provides a description of the existing groundwater quality monitoring networks from which data used in the GAR analysis was obtained.
Section 4 provides a detailed overview of the assumptions, approach, and methods used for the technical analysis and vulnerability designations.
Sections 5 through 17 describe each subwatershed’s physical setting and vulnerability analysis results.
This section summarizes all the vulnerability analysis results and presents the major conclusions of this study.
The groundwater quality and vulnerability analysis presented in this GAR accomplished the following major outcomes:
Enables a big‐picture, initial regional assessment of groundwater quality and vulnerability of irrigated agricultural lands in the Sacramento River Watershed that acknowledges the range of diversity in agricultural practices within the valley by accounting for numerous sources of readily available data
Provides a framework for long‐term sustainable farming in the Sacramento River Watershed with an emphasis on groundwater quality protection by stewardship of the land
Establishes an initial framework to help prioritize groundwater monitoring activities
In the following discussion, the results of all individual subwatershed sections have been compiled into a summary assessment of overall Sacramento River Watershed vulnerability to water quality impairment.
18.1 Summary of Results 18.1.1 Groundwater Quality Summary The groundwater quality vulnerability analysis focused on nitrate and TDS concentrations measured in groundwater across the study area. However, since salinity issues are typically a result of source water quality or naturally occurring conditions rather than a constituent directly applied to agricultural fields, the analysis for salinity was performed differently than it was for nitrate. For salinity, the main impact of concern was the potential accumulation of salts in the root zone and vadose zone underlying irrigated croplands as a consequence of potential irrigation with high‐salinity groundwater, which could exacerbate high TDS concentrations in groundwater over time. In most of the Study Area, salinity issues were found to be caused primarily by naturally occurring geologic characteristics and conditions, and the majority of Sacramento Valley agricultural lands are irrigated with relatively low‐TDS surface water of very high quality; therefore, elevated salinity levels in groundwater due to agricultural irrigation is not a major issue in the Sacramento Valley. Results for TDS were reviewed and discussed for each subwatershed in the context of groundwater beneficial use. The remainder of this section will focus the discussion on the vulnerability analysis due to nitrate concentrations.
In general, nitrate concentrations are very low in the groundwater of the Sacramento River Watershed, with the exception of a few localized impacted areas. Generally, these areas showing elevated nitrate levels also tend to have associated land uses other than irrigated agriculture that might influence nitrate levels in groundwater.
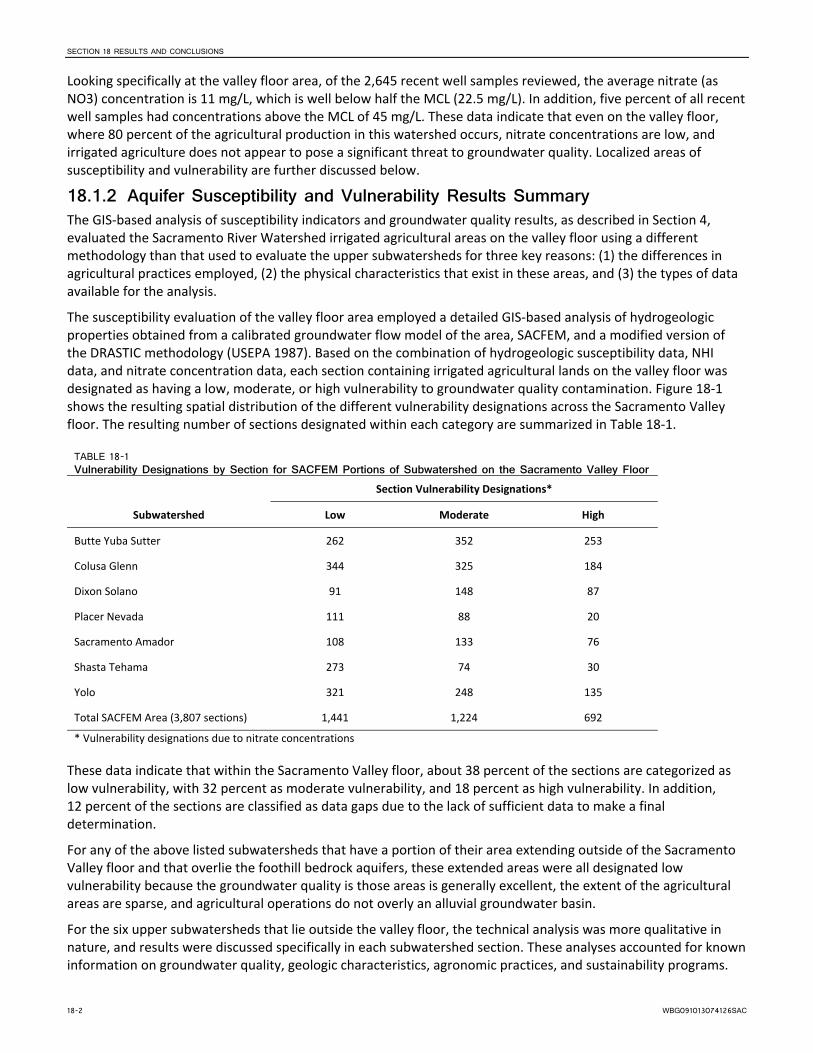
SECTION 18 RESULTS AND CONCLUSIONS
18-2 WBG091013074126SAC
Looking specifically at the valley floor area, of the 2,645 recent well samples reviewed, the average nitrate (as NO3) concentration is 11 mg/L, which is well below half the MCL (22.5 mg/L). In addition, five percent of all recent well samples had concentrations above the MCL of 45 mg/L. These data indicate that even on the valley floor, where 80 percent of the agricultural production in this watershed occurs, nitrate concentrations are low, and irrigated agriculture does not appear to pose a significant threat to groundwater quality. Localized areas of susceptibility and vulnerability are further discussed below.
18.1.2 Aquifer Susceptibility and Vulnerability Results Summary The GIS‐based analysis of susceptibility indicators and groundwater quality results, as described in Section 4, evaluated the Sacramento River Watershed irrigated agricultural areas on the valley floor using a different methodology than that used to evaluate the upper subwatersheds for three key reasons: (1) the differences in agricultural practices employed, (2) the physical characteristics that exist in these areas, and (3) the types of data available for the analysis.
The susceptibility evaluation of the valley floor area employed a detailed GIS‐based analysis of hydrogeologic properties obtained from a calibrated groundwater flow model of the area, SACFEM, and a modified version of the DRASTIC methodology (USEPA 1987). Based on the combination of hydrogeologic susceptibility data, NHI data, and nitrate concentration data, each section containing irrigated agricultural lands on the valley floor was designated as having a low, moderate, or high vulnerability to groundwater quality contamination. Figure 18‐1 shows the resulting spatial distribution of the different vulnerability designations across the Sacramento Valley floor. The resulting number of sections designated within each category are summarized in Table 18‐1.
TABLE 18-1 Vulnerability Designations by Section for SACFEM Portions of Subwatershed on the Sacramento Valley Floor
Subwatershed
Section Vulnerability Designations*
Low Moderate High
Butte Yuba Sutter 262 352 253
Colusa Glenn 344 325 184
Dixon Solano 91 148 87
Placer Nevada 111 88 20
Sacramento Amador 108 133 76
Shasta Tehama 273 74 30
Yolo 321 248 135
Total SACFEM Area (3,807 sections) 1,441 1,224 692
* Vulnerability designations due to nitrate concentrations
These data indicate that within the Sacramento Valley floor, about 38 percent of the sections are categorized as low vulnerability, with 32 percent as moderate vulnerability, and 18 percent as high vulnerability. In addition, 12 percent of the sections are classified as data gaps due to the lack of sufficient data to make a final determination.
For any of the above listed subwatersheds that have a portion of their area extending outside of the Sacramento Valley floor and that overlie the foothill bedrock aquifers, these extended areas were all designated low vulnerability because the groundwater quality is those areas is generally excellent, the extent of the agricultural areas are sparse, and agricultural operations do not overly an alluvial groundwater basin.
For the six upper subwatersheds that lie outside the valley floor, the technical analysis was more qualitative in nature, and results were discussed specifically in each subwatershed section. These analyses accounted for known information on groundwater quality, geologic characteristics, agronomic practices, and sustainability programs.

SECTION 18 RESULTS AND CONCLUSIONS
WBG091013074126SAC 18-3
The vulnerability results are further elaborated below in the context of low, moderate, and high designations.
18.2 Vulnerability Designations As described in Section 4, vulnerability designations were based on a combination of susceptibility and groundwater quality data, and followed a defined decision logic.
18.2.1 Low Vulnerability Areas designated as low vulnerability have the following characteristics:
Hydrogeologic susceptibility factors are low and present a low potential for impacts to groundwater quality.
Agronomic practices are protective of groundwater quality.
Current and historical groundwater quality data show low nitrate concentrations and no increasing trends.
Such areas primarily exist in foothill bedrock aquifer systems, where irrigated agriculture is sparse and where practices are well characterized and protective of groundwater quality. In addition, many sections on the valley floor show low vulnerability designations as a consequence of excellent groundwater quality and crop types, such as orchards, which have a low nitrate hazard index. These areas tend to be located in the northern Sacramento Valley area of the Shasta‐Tehama Subwatershed, and on the western side of the valley, close to the Coast Range. A few low vulnerability sections are also found on the eastern side of the valley around the Sutter Buttes, in the Feather River Basin, and along the Cosumnes River.
For the upper subwatersheds, El Dorado, Goose Lake, Napa, Pit River, and Upper Feather River were designated as entirely low‐vulnerability subwatersheds. These conclusions were based on low observed nitrate and TDS concentrations in groundwater, and crop types that are well managed and efficiently irrigated (such as vineyards and pasture) that result in low NHI scores.
These low‐vulnerability areas might require some basic trend monitoring per the WDR MRP requirements, which will be developed as part of the Groundwater Trend Monitoring Workplan.
18.2.2 Moderate Vulnerability Areas designated as moderate vulnerability have the following characteristics:
Hydrogeologic susceptibilities combined with NHI results classified in the medium range, although not conclusive enough to be categorized as either high or low vulnerability.
Areas having robust groundwater quality data available were further refined as either low or high vulnerability according to nitrate concentrations.
These areas are primarily located along the rivers, in the Delta, and in the northern Glenn and Solano Subwatersheds.
The moderate vulnerability areas should be considered “tentatively low vulnerability” and they should be considered for different monitoring and implementation requirements than the other two categories. A majority of these moderate vulnerability sections are located along the major river corridors (Sacramento and Feather Rivers) as well as in the Delta area. These areas have the potential for groundwater and surface water interaction. Many areas of the Delta also have a strong hydraulic connection between surface water and groundwater. Because shallow groundwater monitoring is often not available in these areas, a shallow well monitoring program could be implemented to verify the potential for a low‐vulnerability designation.
18.2.3 High Vulnerability Areas designated as high vulnerability have the following characteristics:
Overall high relative susceptibility conditions (hydrogeology and NHI)
and/or
High nitrate concentrations
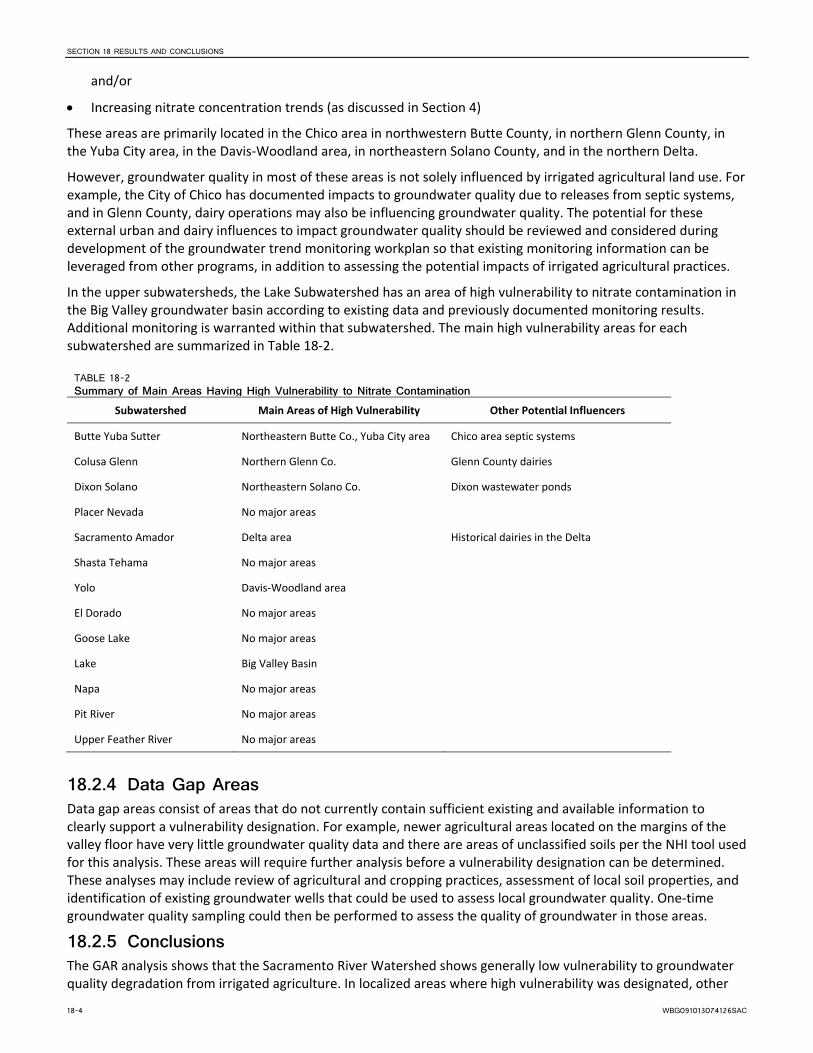
SECTION 18 RESULTS AND CONCLUSIONS
18-4 WBG091013074126SAC
and/or
Increasing nitrate concentration trends (as discussed in Section 4)
These areas are primarily located in the Chico area in northwestern Butte County, in northern Glenn County, in the Yuba City area, in the Davis‐Woodland area, in northeastern Solano County, and in the northern Delta.
However, groundwater quality in most of these areas is not solely influenced by irrigated agricultural land use. For example, the City of Chico has documented impacts to groundwater quality due to releases from septic systems, and in Glenn County, dairy operations may also be influencing groundwater quality. The potential for these external urban and dairy influences to impact groundwater quality should be reviewed and considered during development of the groundwater trend monitoring workplan so that existing monitoring information can be leveraged from other programs, in addition to assessing the potential impacts of irrigated agricultural practices.
In the upper subwatersheds, the Lake Subwatershed has an area of high vulnerability to nitrate contamination in the Big Valley groundwater basin according to existing data and previously documented monitoring results. Additional monitoring is warranted within that subwatershed. The main high vulnerability areas for each subwatershed are summarized in Table 18‐2.
TABLE 18-2 Summary of Main Areas Having High Vulnerability to Nitrate Contamination
Subwatershed Main Areas of High Vulnerability Other Potential Influencers
Butte Yuba Sutter Northeastern Butte Co., Yuba City area Chico area septic systems
Colusa Glenn Northern Glenn Co. Glenn County dairies
Dixon Solano Northeastern Solano Co. Dixon wastewater ponds
Placer Nevada No major areas
Sacramento Amador Delta area Historical dairies in the Delta
Shasta Tehama No major areas
Yolo Davis‐Woodland area
El Dorado No major areas
Goose Lake No major areas
Lake Big Valley Basin
Napa No major areas
Pit River No major areas
Upper Feather River No major areas
18.2.4 Data Gap Areas Data gap areas consist of areas that do not currently contain sufficient existing and available information to clearly support a vulnerability designation. For example, newer agricultural areas located on the margins of the valley floor have very little groundwater quality data and there are areas of unclassified soils per the NHI tool used for this analysis. These areas will require further analysis before a vulnerability designation can be determined. These analyses may include review of agricultural and cropping practices, assessment of local soil properties, and identification of existing groundwater wells that could be used to assess local groundwater quality. One‐time groundwater quality sampling could then be performed to assess the quality of groundwater in those areas.
18.2.5 Conclusions The GAR analysis shows that the Sacramento River Watershed shows generally low vulnerability to groundwater quality degradation from irrigated agriculture. In localized areas where high vulnerability was designated, other
SECTION 18 RESULTS AND CONCLUSIONS
WBG091013074126SAC 18-5
influencers might also be causing nitrate concentration increases. Furthermore, in cases where available well data were a few decades old, newer samples may yield different water quality results.
A review of previously published studies by the USGS (see Section 1) demonstrate that the results of this GAR correlate with the observations from previous recent groundwater quality technical analysis. In particular, the USGS studies found that nitrate is generally observed at low concentrations on the valley floor (less than half the MCL) in the upper 200 feet of the aquifer, with a few localized exceptions, as discussed throughout this GAR. In addition, due to the fine‐grained sediments present in the Sacramento Valley aquifers, and generally reduced conditions, the central basin area has very low predicted nitrate concentrations compared to areas at the basin’s margins.
The Sacramento River Watershed has unique characteristics, such as high precipitation rates, an important surface water system with high‐quality water for groundwater recharge and irrigation, efficient irrigation practices, well managed agricultural practices, and a dedication to stewardship of the land. These combined characteristics result in low vulnerability of groundwater quality contamination in the majority of the watershed.
The regional‐scale analysis presented in this GAR provides a technical basis for the prioritization for the initial implementation of the LTILRP WDR and MRP requirements, including the prioritization of trend monitoring programs and the implementation of agricultural water quality protection implementation activities. Subsequent to the RWQCB’s approval of the submitted GAR, a Groundwater Quality Monitoring Workplan will be developed. The Workplan will use the technical analysis presented herein to develop a prioritized monitoring program that seeks to rely on existing well networks, and focuses the density of monitoring activities in areas of higher vulnerability. Results collected during the monitoring phases of the program will be incorporated into annual monitoring reports, and will inform the update of the GAR that is required every 5 years.

WBG091013074126SAC 19-1
SECTION 19
References This Section provides the list of references applicable to each section of the GAR.
19.1 Section 1 Burow, Karen R.; Bryant C. Jurgens; Kenneth Belitz; and Neil M. Dubrovsky. 2013. Assessment of Regional Change in Nitrate Concentrations in Groundwater in the Central Valley, California, USA, 1950s‐2000s. Environmental Earth Sciences 69: 2609 ‐ 2621. DOI 10.1007/s12665‐012‐2082‐4. Springer Publishing.
CVRWQCB (Central Valley Regional Water Quality Control Board). 2008. Irrigated Lands Regulatory Program Existing Conditions Report. Rancho Cordova, CA. December.
NCWA (Northern California Water Association). 2011. Efficient Water Management for Regional Sustainability in the Sacramento Valley. Prepared by CH2M HILL, Davids Engineering, and MBK Engineers. July.
SWRCB (State Water Resources Control Board). 2000. Hydrogeologically Vulnerable Areas Map. http://www.waterboards.ca.gov/gama/docs/hva2_1.pdf. Accessed September 2013.
SVWQC (Sacramento Valley Water Quality Coalition). 2013. Watershed Map. http://www.svwqc.org/. Accessed September 2013.
SVWQC (Sacramento Valley Water Quality Coalition). 2014. Home page. http://www.svwqc.org/. Accessed June 10, 2014.
USGS (U.S. Geological Survey). 2012. Predicted Nitrate and Arsenic Concentrations in Basin‐Fill Aquifers of the Southwestern United States. Scientific Investigations Report 2012–5065. National Water‐Quality Assessment Program. Reston, VA.
19.2 Section 2 Ayers, R. S., and D. W. Westcot. 1985. Water Quality for Agriculture. FAO Irrigation and Drainage Paper 29 Rev. 1 (Reprinted 1989, 1994). Rome: Food and Agriculture Organization of the United Nations, 1985. http://www.fao.org/docrep/003/T0234E/T0234E02.htm.
Butte County DWRC (Department of Water and Resource Conservation). 2013. Lower Tuscan Aquifer Monitoring, Recharge, and Data Management Project. Final Report. Prepared by Brown and Caldwell. May.
CDPH (California Department of Public Health). 2012. Nitrate Fact Sheet. http://www.cdph.ca.gov/certlic/drinkingwater/Pages/Nitrate.aspx. Accessed May 16, 2013.
Central Valley RWQCB (Regional Water Quality Control Board). 1998. Water Quality Control Plan for the Sacramento River and San Joaquin River Basins. 4th ed. Sacramento, CA. http://water.epa.gov/scitech/ swguidance/standards/wqslibrary/upload/2009_03_16_standards_wqslibrary_ca_ca_9_central_valley.pdf.
DWR (California Department of Water Resources). 1978. Evaluation of Groundwater Resources: SacramentoValley. Bulletin 118‐6.
DWR (California Department of Water Resources). 2003a. California’s Groundwater. Bulletin 118‐03. http://www.water.ca.gov/groundwater/bulletin118/bulletin118update2003.cfm.
DWR (California Department of Water Resources). 2003b. Sacramento River Basinwide Water Management Plan. Groundwater Hydrology. http://www.swrcb.ca.gov/gama/. Accessed February 2012.
DWR (California Department of Water Resources). 2004. Sierra Valley Groundwater Basin Sierra Valley Groundwater Subbasin. As revised for Bulletin 118‐03. February.
DWR (California Department of Water Resources). 2009. California Water Plan Update 2009. Bulletin 160‐09.

SECTION 19 REFERENCES
19-2 WBG091013074126SAC
DWR (California Department of Water Resources). 2013. California Water Plan Update 2013. Public Review Draft. Vol. 2, Regional Reports: Sacramento River Hydrologic Region. http://www.waterplan.water.ca.gov/cwpu2013/prd/.
DWR (California Department of Water Resources). 2013a. Land Use Surveys by County. Vector data available at http://www.water.ca.gov/landwateruse/lusrvymain.cfm. Accessed September.Esser, B., B. Hudson, and J. Moran. 2002. “Nitrate Contamination in California Groundwater: An Integrated Approach to Basin Assessment and Resource Protection.” Lawrence Livermore National Laboratory. December 10.
NCWA (Northern California Water Association). 2011. Efficient Water Management for Regional Sustainability in the Sacramento Valley. Prepared by CH2M HILL, Davids Engineering, and MBK Engineers. July.
SRCSD (Sacramento Regional County Sanitation District). 2008. Sacramento’s Watershed. http://www.srcsd.com/sacramento‐watershed.php. Accessed September 2013.
SVWQC (Sacramento Valley Water Quality Coalition). 2013. Watershed Map. http://www.svwqc.org/. Accessed September 2013.
USDA (United States Department of Agriculture). 1993. Soil Survey Manual. Soil Conservation Service Soil Survey Division Staff. U.S. Department of Agriculture Handbook 18. http://soils.usda.gov/technical/manual/contents/chapter3.html.
USEPA (United States Environmental Protection Agency). 2012. Basic Information about Nitrite (Measured as Nitrogen) in Drinking Water. May 21, 2012. http://water.epa.gov/drink/contaminants/basicinformation/nitrite.cfm#four.
USGS (U.S. Geological Survey). 1984. Geochemistry of the Groundwater in the Sacramento Valley, California. Professional Paper 1401‐B. Washington, DC: United States Government Printing Office.
USGS (U.S. Geological Survey). 1985. Water Budget for Major Streams in the Central Valley, California, 1961–77. Regional Aquifer System Analysis. Open File Report 85‐401. Sacramento, CA.
USGS (U.S. Geological Survey). 1991. Groundwater in the Central Valley, California – A Summary Report. Regional Aquifer System Analysis – Central Valley, California. Professional Paper 1401‐A. Washington, DC: United States Government Printing Office.
USGS (U.S. Geological Survey). 1996. Nutrients in the Nation's Waters—Too Much of a Good Thing? D. K. Mueller and D. R. Helsel. U.S. Geological Survey Circular 1136.
USGS (U.S. Geological Survey). 2009. Groundwater Availability of the Central Valley Aquifer, California. Groundwater Resources Program. USGS Professional Paper 1766. Reston, VA.
USGS (U.S. Geological Survey). 2010. Conceptual Understanding and Groundwater Quality of Selected Basin‐fill Aquifers in the Southwestern United States. USGS Professional Paper 1781. Section 13: Conceptual Understanding and Groundwater Quality of the Basin‐Fill Aquifer in the Central Valley, California.
USGS (U.S. Geological Survey). 2012. County‐Level Estimates of Nitrogen and Phosphorus from Commercial Fertilizer for the Conterminous United States, 1987‐2006. Scientific Investigations Report 2012‐5207.
USGS and SWRCB (U.S. Geological Survey and State Water Resources Control Board). 2011. Groundwater Quality in the Middle Sacramento Valley, California. Fact Sheet 2011‐3005.
YCFCWCD (Yolo County Flood Control & Water Conservation District). 2012. Regional Conjunctive use Enhancement: Nitrate Fingerprinting and Groundwater Age Determination. December.
19.3 Section 3 SWRCB (State Water Resources Control Board). 2005. Voluntary Domestic Well Assessment Project; El Dorado County Data Summary Report. SWRCB GAMA Program. September.

SECTION 19 REFERENCES
WBG091013074126SAC 19-3
SWRCB (State Water Resources Control Board). 2009. GAMA Domestic Well Project Groundwater Quality Data Report Tehama County Focus Area. March.
SWRCB (State Water Resources Control Board). 2010. GAMA Domestic Well Project Groundwater Quality Data Report Yuba County Focus Area. July.
SWRCB (State Water Resources Control Board). 2011. GeoTracker GAMA. http://www.waterboards.ca.gov/gama/geotracker_gama.shtml. Accessed August 2013.
USGS (U.S. Geological Survey). 2001. Ground‐Water Quality in the Southeastern Sacramento Valley Aquifer, California, 1996. Water‐Resources Investigations Report 01‐4125. Sacramento, CA.
USGS (U.S. Geological Survey). 2010. Groundwater‐Quality Data for the Sierra Nevada Study Unit, 2008: Results from the California GAMA Program. Data Series 534. Reston, VA.
USGS (U.S. Geological Survey). 2011. Status of Groundwater Quality in the Southern, Middle, and Northern Sacramento Valley Study Units, 2005‐08: California GAMA Priority Basin Project. Scientific Investigations Report 2011‐5002. Reston, VA.
USGS (U.S. Geological Survey). 2013a. USGS Water‐quality Data for the Nation. http://waterdata.usgs.gov/nwis/qw. Accessed November 2013.
USGS (U.S. Geological Survey). 2013b. Groundwater‐quality data in the Cascade Range and Modoc study unit, 2010 – Results from the California GAMA Program. Data Series 688. Reston, VA.
19.4 Section 4 CVRWQCB (Central Valley Regional Water Quality Control Board). 2008. Irrigated Lands Regulatory Program Existing Conditions Report. Rancho Cordova, CA. December.
DWR (California Department of Water Resources). 1978. Evaluation of Groundwater Resources: Sacramento Valley. Bulletin 118‐6. August.
DWR (California Department of Water Resources). 2011. Statewide Irrigation Methods Survey. Available at: http://www.water.ca.gov/landwateruse/surveys.cfm.
Hemker, C.J., and G.J. Nijsten. 2003. Groundwater Flow Modeling Using MicroFEM©.
Letey, J., and P. Vaughan. 2013. Soil type, crop and irrigation technique affect nitrogen leaching to groundwater. UC‐ANR Research Article. Available at: http://californiaagriculture.ucanr.edu/landingpage.cfm?article=ca.E.v067n04p231&fulltext=yes
UC‐ANR IWR (University of California Agriculture & Natural Resources and California Institute for Water Resources). 2013. Nitrate Groundwater Pollution Hazard Index. http://ciwr.ucanr.edu/Tools/Nitrogen_Hazard_Index/. Accessed October 2013.
USEPA. 1987. DRASTIC: A Standardized System for Evaluating Ground Water Pollution Potential Using Hydrogeologic Settings. Robert S. Kerr Environmental Research Laboratory, Office of Research and Development. USEPA: Ada, OK. May.
USGS. 2012. Predicted Nitrate and Arsenic Concentrations in Basin‐Fill Aquifers of the Southwestern United States. National Water‐Quality Assessment Program. Scientific Investigations Report 2012‐5065.
19.5 Section 5 Butte County Department of Water and Resource Conservation. 2004. Butte County Groundwater Management Plan. September.
Butte County Public Health Department. 2009. Third Quarter 2009 Ground‐water monitoring report Chico Urban Area Nitrate Compliance Program. Butte County, CA. October.
SECTION 19 REFERENCES
19-4 WBG091013074126SAC
DWR (California Department of Water Resources). 1984. Study of Nitrates in the Groundwater of the Chico Area Butte County. January
Sutter County. 2012. Sutter County Groundwater Management Plan. Sutter County, CA. March.
YCWA (Yuba County Water Agency). 2010. Yuba County Groundwater Management Plan. Yuba County, CA. December.
19.6 Section 6 Colusa County. 2008. Groundwater Management Plan. September.
DWR (California Department of Water Resources). 2003. California’s Groundwater. Bulletin 118, Update 2003. Sacramento, California.
GCID (Glenn Colusa Irrigation District). 1995. Groundwater Management Plan.
Glenn County Department of Agriculture. 2005. Northern Sacramento Valley (Four County) Drinking Water Quality Strategy Document. June.
19.7 Section 7 DWR (California Department of Water Resources). 2003. California’s Groundwater. Bulletin 118, Update 2003. Sacramento, California.
SID (Solano Irrigation District). 2010. Water Management Plan 2008 Criteria. Final. February.
19.8 Section 8 City of Roseville, Placer County Water Agency, City of Lincoln, and California American Water. 2007. Western Placer County Groundwater Management Plan. November.
DWR (California Department of Water Resources). 2003. California’s Groundwater. Bulletin 118, Update 2003. Sacramento, California.
SGA (Sacramento Groundwater Authority). 2008. Sacramento Groundwater Authority Groundwater Management Plan. December.
19.9 Section 9 DWR (California Department of Water Resources). 2003. California’s Groundwater. Bulletin 118, Update 2003. Sacramento, California.
SCWA (Sacramento County Water Agency). 2006. Central Sacramento County Groundwater Management Plan. February.
USGS (U.S. Geological Survey). 2000. Delta Subsidence in California – The Sinking Heart of the State. USGS Fact Sheet 005‐00. April.
19.10 Section 10 CVRWQCB (Central Valley Regional Water Quality Control Board). 2008. Irrigated Lands Regulatory Program Existing Conditions Report. Rancho Cordova, CA. December.
Glenn County Department of Agriculture. 2005. Northern Sacramento Valley (Four County) Drinking Water Quality Strategy Document. June.
Shasta County Water Agency. 2007. Coordinated AB 3030 Groundwater Management Plan for the Redding Groundwater Basin. November.
Tehama County Flood Control and Water Conservation District. 2012. Coordinated AB 3030 Groundwater Management Plan.

SECTION 19 REFERENCES
WBG091013074126SAC 19-5
19.11 Section 11 DWR (California Department of Water Resources). 2003. California’s Groundwater. Bulletin 118, Update 2003. Sacramento, California.
YCFCWCD (Yolo County Flood Control and Water Conservation District). 2006. Groundwater Management Plan. June.
YCFCWCD (Yolo County Flood Control and Water Conservation District). 2012. Regional Conjunctive Use Enhancement: Nitrate Fingerprinting and Groundwater Age Determination Study. December.
19.12 Section 12 DWR (California Department of Water Resources). 2003. California’s Groundwater. Bulletin 118, Update 2003. Sacramento, California.
EDCWA (El Dorado County Water Agency). 2007. El Dorado County Water Resources Development and Management Plan. December.
El Dorado County Agricultural Water Quality Management Corporation. 2010. Pilot Watershed Management Practices Plan for the El Dorado Subwatershed. February.
EM (Community Development Agency, Environmental Management Division). 2014. Response to Request for Summary Well Data. Letter to El Dorado Subwatershed. March.
SWRCB (State Water Resources Control Board). 2005. Voluntary Domestic Well Assessment Project; El Dorado County Data Summary Report. SWRCB GAMA Program. September.
19.13 Section 13 CVRWQCB (Central Valley Regional Water Quality Control Board). 2008. Irrigated Lands Regulatory Program Existing Conditions Report. Rancho Cordova, CA. December.
DWR (California Department of Water Resources). 2003. California’s Groundwater. Bulletin 118, Update 2003. Sacramento, California.
Goose Lake Coalition. 2008. Lassen Creek Management Plan. June.
Goose Lake RCD. 2014a. Watershed Description. Available at: http://gooselakercd.sharepoint.com/Pages/WatershedInformation.aspx; accessed 6/8/2014.
Goose Lake RCD. 2014b. Land Use and Crop Information. Available at: http://gooselakercd.sharepoint.com/Pages/Landuse.aspx; accessed 6/8/2014.
19.14 Section 14 DWR (California Department of Water Resources). 2003. California’s Groundwater. Bulletin 118, Update 2003. Sacramento, California.
Lake County (Flood Control and Water Conservation District). 2003. Big Valley Ground Water Recharge Investigation Update. May.
LCWPD (Lake County Watershed Protection District). 2006. Lake County Groundwater Management Plan. April.
LCWPD (Lake County Watershed Protection District). 2012. Monitoring Plan Lake County, California. California Statewide Groundwater Elevation Monitoring System. March.
19.15 Section 15 DWR (California Department of Water Resources). 2003. California’s Groundwater. Bulletin 118, Update 2003. Sacramento, California.

SECTION 19 REFERENCES
19-6 WBG091013074126SAC
Napa County. 2013. Napa County Groundwater Monitoring Plan. January.
Napa County Putah Creek Watershed Group. 2013. Pilot Watershed Management Practices Annual Report. June.
19.16 Section 16 DWR (California Department of Water Resources). 2003. California’s Groundwater. Bulletin 118, Update 2003. Sacramento, California.
Lassen County. 2007. Lassen County Groundwater Management Plan. Final. June.
19.17 Section 17 DWR (California Department of Water Resources). 2003. California’s Groundwater. Bulletin 118, Update 2003. Sacramento, California.
UFRW (Upper Feather River Watershed). 2007. Irrigation Discharge Management Program. Irrigated Agricultural Practices in UFRW. Final. March.
19.18 Section 18 USEPA. 1987. DRASTIC: A Standardized System for Evaluating Ground Water Pollution Potential Using Hydrogeologic Settings. Robert S. Kerr Environmental Research Laboratory, Office of Research and Development. USEPA: Ada, OK. May.