Sacramento, California 95835 & COMPANY Fax: (916) 285-7194 · don cole 1 city of wheatland,...
97
CITY OF WHEATLAND, CALIFORNIA ANNUAL FINANCIAL REPORT INDEPENDENT AUDITOR’S REPORTS FOR THE FISCAL YEAR ENDED JUNE 30, 2017 DON COLE & COMPANY CERTIFIED PUBLIC ACCOUNTANT 2701 Del Paso Road, Suite 130-131 Sacramento, California 95835 Phone: (916) 925-5216 Fax: (916) 285-7194
Transcript of Sacramento, California 95835 & COMPANY Fax: (916) 285-7194 · don cole 1 city of wheatland,...

1
CITY OF WHEATLAND, CALIFORNIA ANNUAL FINANCIAL REPORT
INDEPENDENT AUDITOR’S REPORTS FOR THE FISCAL YEAR ENDED
JUNE 30, 2017
DON COLE & COMPANY
CERTIFIED PUBLIC ACCOUNTANT
2701 Del Paso Road, Suite 130-131
Sacramento, California 95835
Phone: (916) 925-5216
Fax: (916) 285-7194
2
CITY OF WHEATLAND ANNUAL FINANCIAL REPORT FOR THE FISCAL YEAR ENDED JUNE 30, 2017 TABLE OF CONTENTS INTRODUCTORY SECTION Transmittal Letter ..................................................................................................................................................... i-iii List of Officials ........................................................................................................................................................... iv Organization Chart ...................................................................................................................................................... v FINANCIAL SECTION Independent Auditor’s Report ................................................................................................................................. 1-2 Management’s Discussion and Analysis .............................................................................................................. 3-10 Basic Financial Statements: Government-wide Financial Statements: Statement of Net Position ............................................................................................................................ 11 Statement of Activities ................................................................................................................................. 12 Fund Financial Statements: Balance Sheet – Governmental Funds........................................................................................................ 13 Reconciliation of the Governmental Funds Balance Sheet to the Statement of Net Position ....................................................................................................................... 14 Statement of Revenues, Expenditures, and Changes in Fund Balances - Governmental Funds ............................................................................................................ 15 Reconciliation of the Governmental Funds Statement of Revenues, Expenditures and Changes in Fund Balances to the Statement of Activities ........................................ 16 Combining Statement of Net Position – Proprietary Funds ......................................................................... 17 Combining Statement of Revenues, Expenses, and Changes in Fund Net Assets - Proprietary Funds ..................................................................................................................... 18 Statement of Cash Flows- Proprietary Fund Types .................................................................................... 19 Statement of Net Position Fiduciary Fund Types ........................................................................................ 20 Notes to the Basic Financial Statements ............................................................................................................ 21-39 REQUIRED SUPPLEMENTARY INFORMATION Statement of Revenue, Expenditures, and Changes in Fund Balances – Budget and Actual – General Fund and Major Special Revenue Funds ................................................................................................................................ 40-41 SUPPLEMENTARY INFORMATION SECTION Non-Major Governmental Funds Non-Major Special Revenue Funds Combining Balance Sheet ..................................................................................................................... 42-49 Combining Statement of Revenues, Expenditures and Changes in Fund Balance .............................. 50-57 Fiduciary Funds Agency Funds Combining Statement of Assets and Liabilities ..................................................................................... 58-59 Combining Statement of Changes in Assets and Liabilities .................................................................. 60-64
3
CITY OF WHEATLAND ANNUAL FINANCIAL REPORT FOR THE YEAR ENDED JUNE 30, 2017 TABLE OF CONTENTS STATISTICAL SECTION (Unaudited) Net Position by Component – One Fiscal Year ........................................................................................................ 65 Changes in Net Position – One Fiscal Year ....................................................................................................... 66-67 Fund Balances, Governmental Funds – One Fiscal Year ........................................................................................ 68 Changes in Fund Balances, Governmental Funds – One Fiscal Year ..................................................................... 69 Assessed Value and Estimated Actual Value of Taxable Property – Last Ten Fiscal Years ................................... 70 Top Ten Property Taxpayers – Current Fiscal Year and Nine Years Ago ............................................................... 71 Top 25 Sales Tax Producers – Current Fiscal Year and Nine Years Ago ............................................................... 72 Property Tax Levies and Collections – Last Ten Fiscal Years ................................................................................. 73 Direct and Overlapping Tax Rates – Last Ten Fiscal Years .................................................................................... 74 Outstanding Debt – Last Ten Fiscal Years ............................................................................................................... 75 Legal Debt Margin Information – Last Ten Fiscal Years .......................................................................................... 76 Demographic and Economic Statistics – Last Ten Fiscal Years .............................................................................. 77 Capital Asset Statistics by Function – Last Five Fiscal Years .................................................................................. 78 Operating Indicators by Function – Last Five Fiscal Years ...................................................................................... 79 Full-time and Part-time City Employees by Function – Last Five Fiscal Years ........................................................ 80 Principal Employers in Yuba County – Current Fiscal Year and Nine Years Ago ................................................... 81

4
CITY OF WHEATLAND INTRODUCTORY SECTION
JUNE 30, 2017

i
111 C Street . Wheatland . California . 95692
____________________________________________________________________________________ December 11, 2017 To the Honorable Mayor and Members of the City Council and Citizens of the City of Wheatland: We are pleased to submit the City of Wheatland’s Comprehensive Annual Financial Report (CAFR) for the fiscal year ended June 30, 2017. It is the policy of the Council to have a licensed certified public accountant conduct an annual audit at the end of each fiscal year and to issue a complete set of financial statements for the Council and all stakeholders of the City. The financial statements are presented in conformity with generally accepted accounting principles (GAAP) and audited in accordance with generally accepted auditing standards. Responsibility for the accuracy of the data and the fairness of presentation, including all footnotes and disclosures, rests with the City. We believe the data presented in this report is accurate in material respects and all statements and disclosures necessary for the reader to obtain a thorough understanding of the City’s financial activities have been included. Management of the City has established an internal control framework that is designed both to protect the City’s assets from loss, theft, or misuse and to compile sufficient reliable information of the preparation of the City’s financial statements in conformity with GAAP. Because the cost of internal controls should not outweigh their benefits, the City’s framework of internal controls has been designed to provide reasonable rather than absolute assurance that the financial statements will be free from material misstatements. While traditionally addressed to the governing body of the City, this report is intended to provide relevant financial information to the citizens of the City of Wheatland, City staff, creditors, investors, and other concerned readers. We encourage all readers to contact the Finance Department with any questions or comments concerning this report. The City’s financial statements have been audited by Don Cole & Company Accountancy, a firm of certified public accountants. The goal of the independent audit is to provide reasonable assurance that the financial statements of the City for the fiscal year ended June 30, 2017 are free of material misstatements. The independent audit involved examining, on a test basis, evidence supporting the amounts and disclosures in the financial statements, assessing the accounting principles used and significant estimates made by management, and evaluating the overall financial statement presentation. Based upon the audit, the independent auditors concluded that there was a reasonable basis for rendering an unqualified opinion, which states that the City’s financial statements for the fiscal year ended June 30, 2017, are fairly presented in conformity with GAAP. The independent auditor’s report is presented as the first component of the financial section of this report. The independent audit of the financial statements of the City can be part of a broader, federally mandated “Single Audit” designed to meet the special needs of federal grantor agencies. A Single Audit is required when a state, local government, or not-for-profit organizations expends more than $750,000 per fiscal year in federal grant money. The standards governing Single Audit engagements require the independent auditor to report not only on the fair presentation of the financial statements, but also on the audited government’s internal controls and compliance with legal requirements, with special emphasis on internal controls and legal requirements

ii
involving the administration of federal awards. For the fiscal year ending June 30, 2017 the City was not required to issue a Single Audit Report. GAAP requires that management provide a narrative introduction, overview, and analysis to accompany the basic financial statements in the form of a Management’s Discussion and Analysis (MD&A). This letter of transmittal is designed to complement the MD&A and should be read in conjunction with it. The City’s MD&A can be found immediately following the report of the independent auditors. Profile of the City of Wheatland The City of Wheatland operates under a Council-Manager form of government and provides municipal services that include public safety, public works, parks and recreation, planning services, water and wastewater services, and general administration. This report includes all funds of the City of Wheatland. The City does not have Redevelopment Agency. The City Council establishes an annual budget with a mid-year review for the General Fund and all other funds. Budgetary control is legally maintained at the fund level. Department heads submit budget requests to the City Manager and Finance Director. The Finance Director prepares an estimate of revenues and prepares recommendations for the next year’s budget. After approval by the City Manager, the preliminary budget is presented to the City Council who may or may not make amendments. The budget is adopted by resolution by the City Council on or before June 30 in accordance with the municipal code. The City of Wheatland, incorporated in 1874, is one of two incorporated cities in Yuba County. It is nestled at the northeastern edge of California’s vast Sacramento Valley. Located 34 miles north of Sacramento, 107 miles northeast of San Francisco and 417 miles northwest of Los Angeles. With a population of more than 4,100 in a 42.2 square-mile area, Wheatland is valued by its residents for its small town atmosphere and rural setting. The City of Wheatland City Council consists of five members, elected at-large to four-year overlapping terms. Council members must be residents of the City. The position of Mayor and Vice Mayor are chosen by the City Council. The Mayor conducts the Council meetings and represents the City on ceremonial occasions. The City Council serves as the policy board for the municipality. As elected officials, the City Council provides policy direction, establishes goals, and sets priorities for the City government. In addition to serving as the policy makers for the community, the City Council also is responsible for numerous land use decisions within its borders in accordance with the General Plan and the Wheatland Municipal Code. The City Council appoints the City Manager, City Attorney, and all members of advisory boards and commissions. Current Economic Conditions and Outlook The City’s economic development efforts and implementation of the City’s financial policies help to promote Wheatland’s long-term fiscal stability. Each year, staff conducts a systematic review of operations to make sure the blend of contract services and in-house staffing promotes long-term savings and ensures long-term stability. The City anticipates significant growth in the next ten years in property tax revenue as planned subdivisions are being considered by several developers. Acknowledgements The preparation of this Financial Report could not be accomplished without the efficient and dedicated service of the entire staff of the Finance Department and the auditing firm of Don Cole & Company. I would like to express my appreciation to Don Cole, CPA and to the members of the Finance Department who assisted and
iii
contributed to its preparation – Cindy Brumlee, Accountant; Rafaela Vargas, Senior Account Clerk; and Anita Fabian, Account Clerk. I would also like to thank members of the City Council, the City Manager, and the various departments for their cooperation and support in planning and conducting the financial operations of the City during the fiscal year. Respectfully submitted, Susan Mahoney Finance Director

iv
CITY OF WHEATLAND
City Officials
For the Year Ended June 30, 2017
Elected Officials
Rick West, Mayor
Joseph Henderson, Vice Mayor
Robert Coe, Councilmember
Lisa McIntosh, Councilmember
James Pendergraph, Councilmember
Executive Team
Greg Greeson, City Manager
Susan Mahoney, Finance Director
Tim Raney, City Planner
Dane Schilling, City Engineer
Don Scott, Public Works Director
Lisa Thomason, City Clerk
Joe Waggerhauser, Fire Chief, Wheatland Fire Authority
Allyn Wightman, Police Chief

v
City of Wheatland
Organization Chart
FY 2016-2017
Citizens of Wheatland
Wheatland City Council ---- City Attorney
City Clerk ----- City Manager
Public Works Director
Chief Building Official
Police Chief
Planning Director
City Engineer
Finance Director
Maintenance Worker Lead
Administrative Assistant
Senior Accountant
Maintenance Worker (3)
Reserve Officer
Senior Account
Clerk
Water/Sewer Operator (2)
Sergeant
Account Clerk
Officer (6)

1
INDEPENDENT AUDITORS' REPORT To the City Council City of Wheatland, California Report on the Financial Statements I have audited the accompanying financial statements of the governmental activities, the business-type activities, each major fund and the aggregate remaining fund information of the City of Wheatland, California as of and for the year ended June 30, 2017, and the related notes to the financial statements, which collectively comprise the City of Wheatland’s basic financial statements as listed in the table of contents. Management’s Responsibility for the Financial Statements
Management is responsible for the preparation and fair presentation of these financial statements in accordance with accounting principles generally accepted in the United States of America; this includes the design, implementation, and maintenance of internal control relevant to the preparation and fair presentation of financial statements that are free from material misstatement, whether due to fraud or error. Auditor’s Responsibility My responsibility is to express an opinion on these financial statements based on my audit. I conducted my audit in accordance with auditing standards generally accepted in the United States of America, and Government Auditing Standards issued by the Comptroller General of the United States. Those standards require that I plan and perform the audit to obtain reasonable assurance about whether the financial statements are free of material misstatement. An audit involves performing procedures to obtain audit evidence about the amounts and disclosures in the financial statements. The procedures selected depend on the auditor’s judgment, including the assessment of the risks of material misstatement of the financial statements, whether due to fraud or error. In making those risk assessments, the auditor considers internal control relevant to the entity’s preparation and fair presentation of the financial statements in order to design audit procedures that are appropriate in the circumstances, but not for the purpose of expressing an opinion on the effectiveness of the entity’s internal control. Accordingly, I express no such opinion. An audit also includes evaluating the appropriateness of accounting policies used and the reasonableness of significant accounting estimates made by management, as well as evaluating the overall presentation of the financial statements. I believe that the audit evidence I have obtained is sufficient and appropriate to provide a basis for my opinion.
DON COLE & COMPANY
CERTIFIED PUBLIC ACCOUNTANT
2701 Del Paso Road, Suite 130-131
Sacramento, California 95835
Phone: (916) 925-5216
Fax: (916) 285-7194
2
Opinions In my opinion, the financial statements referred to above present fairly, in all material respects, the respective financial position of the governmental activities, the business-type activities, each major fund, and the aggregate remaining fund information of the City of Wheatland, California as of June 30, 2017, and the respective changes in financial position and, where applicable, cash flows thereof for the year then ended in accordance with accounting principles generally accepted in the United States of America. Other Reporting Required by Government Auditing Standards In accordance with Government Auditing Standards, I have also issued my report dated December 27, 2017, on my consideration of the City’s internal control over financial reporting and on my tests of its compliance with certain provisions of laws, regulations, contracts, grant agreements and other matters. The purpose of that report is to describe the scope of our testing of internal control over financial reporting and compliance and the results of that testing and not to provide an opinion on the internal control over financial reporting or on compliance. That report is an integral part of an audit performed in accordance with Government Auditing Standards and should be considered in assessing the results of my audit. Other Matters Accounting principles generally accepted in the United States of America require that the management’s discussion and analysis on pages 3-10 and budgetary comparison information on pages 40-41 be presented to supplement the basic financial statements. Such information, although not a part of the basic financial statements, is required by the Governmental Accounting Standards Board, who considers it to be an essential part of financial reporting for placing the basic financial statements in an appropriate operational, economic, or historical context. I have applied certain limited procedures to the required supplementary information in accordance with auditing standards generally accepted in the United States of America, which consisted of inquiries of management about the methods of preparing the information and comparing the information for consistency with management’s responses to our inquiries, the basic financial statements, and other knowledge we obtained during our audit of the basic financial statements. I do not express an opinion or provide any assurance on the information because the limited procedures do not provide me with sufficient evidence to express an opinion or provide any assurance. Other Information My audit was conducted for the purpose of forming opinions on the financial statements that collectively comprise the City of Wheatland, California’s basic financial statements. The supplementary information, introductory and statistical sections, as listed in the table of contents, are presented for purposes of additional analysis and are not a required part of the basic financial statements. The supplementary information is the responsibility of management and was derived from and relate directly to the underlying accounting and other records used to prepare the basic financial statements. Such information has been subjected to auditing procedures applied in the audit of the basic financial statements and certain additional procedures, including comparing and reconciling such information directly to the underlying accounting and other records used to prepare the basic financial statements or to the basic financial statements themselves, and other additional procedures in accordance with auditing standards generally accepted in the United States of America. In my opinion, the supplementary information is fairly stated in all material respects, in relation to the basic financial statements taken as a whole. The introductory and statistical sections have not been subjected to the auditing procedures applied in the audit of the basic financial statements, and accordingly, I do not express an opinion or provide any assurance on them. Don Cole & Company Sacramento, California December 27, 2017

3
CITY OF WHEATLAND
MANAGEMENT DISCUSSION & ANALYSIS JUNE 30, 2017

3
MANAGEMENT’S DISCUSSION AND ANALYSIS FOR THE FISCAL YEAR ENDED JUNE 30, 2017
INTRODUCTION As management of the City of Wheatland (the City), we offer readers this discussion and analysis of the City’s financial performance for the fiscal year ended June 30, 2017. Readers are encouraged to consider the information presented here in conjunction with additional information, which can be found in the City’s financial statements that follow this discussion.
FINANCIAL HIGHLIGHTS Government-wide:
The City’s total net position increased by $217,663 as of June 30, 2017. Governmental activities
increased the City’s net position by $491,608 and business-type activities reduced the City’s net position
by $273,945.
Government-wide governmental revenues include program revenues of $1,094,159 and general
revenues of $1,974,883 for a total of $3,069,042.
Government-wide governmental expenses were $2,577,434.
Government-wide Business-type revenues include program revenues of $1,680,239 and general
revenues of $53,697.
Government-wide Business-type expenses were $2,007,881.
Fund Level:
Governmental Fund balance increased to $2,135,522 in fiscal year 2016-17, up from $1,706,950 in the
prior year mainly due to a decrease in the amount due to other funds in the nonmajor governmental
funds.
Governmental Fund revenues were $2,894,562 in fiscal year 2016-17 up $625,763 from the prior year.
This increase was mainly due to the Safe Routes to School (SRTS) grant revenue totaling $625,014.
Governmental Fund expenditures were $2,776,278 in fiscal year 2016-17, up $337,446 from the prior
year also mainly due to the SRTS grant.
General Fund:
General Fund revenues of $1,840,214 were $42,766 lower than the prior year.
General Fund expenditures of $1,920,216 represented an increase of $36,627 over the prior year.
Other Financing Sources (Uses) was $102,336 in fiscal year 2016-17, which was $48,079 less than the
prior year.
The fund balance of the General Fund was 1,632,968 as of June 30, 2017 compared to the $1,610,634
(restated) fiscal year 2015-16 fund balance.
OVERVIEW OF THE FINANCIAL STATEMENTS
Government-Wide Financial Statements The Government-Wide Financial Statements are designed to provide readers with a broad overview of the City’s finances, in a manner similar to a private-sector business. These statements separate the City’s activities into two areas: Governmental Activities – these services are principally supported by taxes and intergovernmental revenues. Most of the City’s basic services are considered to be governmental activities including public safety, community development, public works, parks and recreation, and general administration.

4
Business-Type Activities – these services rely upon user fees and charges to help cover all or most of their costs. The City’s water and wastewater systems are reported here. Within the framework of these activities, a Statement of Net Position and a Statement of Activities report information about the City as a whole. These statements include all assets and liabilities of the City (i.e., infrastructure and long-term debt) and use the accrual basis of accounting in which all the current year revenues and expenses are taken into account regardless of when the cash is received or paid. The two statements can be generally described as follows: The Statement of Net Position presents information on all of the City’s assets and liabilities, with the difference between the two reported as net position. Over time, increases or decreases in net position may serve as a useful indicator of whether the financial position of the City of Wheatland is improving or deteriorating. The Statement of Activities presents information showing how the City’s net position changed during the fiscal year. All changes in net position are reported as soon as the underlying event giving rise to the change occurs, regardless of the timing of related cash flows. Notably, these statements differ from the Fund Financial Statements in that they include all assets of the City (including infrastructure) and all liabilities (including long-term debt) and exclude certain interfund receivables, payables and other interfund activity as prescribed by GASB Statement No. 34. A reconciliation between the two is provided on pages 14 and 16 of this report. Fund Financial Statements A fund is a grouping of related accounts that is used to maintain control over resources that have been segregated for specific activities or objectives. The City of Wheatland, like other state and local governments, uses fund accounting to ensure and demonstrate compliance with finance-related legal requirements. All of the funds in the City of Wheatland can be divided into three categories: governmental funds, proprietary funds, and fiduciary funds. Governmental funds - most of the City’s basic services are reported in governmental funds, which focus on how money flows into and out of those funds and the balances left at year-end that are available for spending. These funds are reported using modified accrual accounting, which measures cash and all other financial assets that can be converted to cash. The governmental fund statements provide a detailed short-term view of the City’s general government operations and the basic services it provides. This information helps determine whether there are more or fewer financial resources that can be spent in the near future to finance the City’s programs. We describe the relationship between governmental activities (reported in the Statement of Net Position and the Statement of Activities) and the governmental funds in reconciliation at the bottom of the fund financial statements. Proprietary Funds – when the City charges customers for services it provides, whether outside customers or to other units of the City, these services are generally reported in proprietary funds. Proprietary funds provide the same type of information as shown in the government-wide financial statements (i.e. business-type activities), only in more detail. The City uses proprietary funds to account for its water and wastewater operations. Fiduciary Funds – the City is the trustee, or fiduciary, for certain funds held on behalf of external parties. The City’s fiduciary activities are reported in separate Statement of Fiduciary Net Position. These activities are excluded from the City’s other financial statements because the resources of the funds are not available to support the City’s own programs. The City is responsible for ensuring that the assets reported in these funds are used for the intended purposes.
NOTES TO BASIC FINANCIAL STATEMENTS The notes provide additional information that is essential to a full understanding of the data provided in the government-wide and fund financial statements.

5
REQUIRED SUPPLEMENTARY INFORMATION In addition to the basic financial statements and accompanying notes, this report also presents the following required supplementary information: budgetary comparisons for the City’s General Fund and major special revenue funds as well as a description of the City’s accounting policies with regard to the annual budget.
FINANCIAL ANALYSIS OF THE GOVERNMENT-WIDE FINANCIAL STATEMENTS The government-wide financial statements provide long-term and short-term information about the City’s overall financial conditions. This analysis addresses the financial statements of the city as a whole. Following is a summary of net position:
Summary of Net Position Fiscal Years 2015-16 and 2016-17
Governmental Activities . Business-type Activities . TOTALS . 2017 . 2016 . 2017 . 2016 . 2017 . 2016 . ASSETS:
Current assets and outflows Capital assets, net
$ 2,222,932 4,688,118
restated
$ 1,967,471 4,469,897
$ 7,907,271 7,141,966
$ 7,836,125 7,603,855
$10,130,203 11,830,084
$ 9,803,596 12,073,752
TOTAL ASSETS $ 6,911,050 $ 6,437,368 $15,049,237 $15,439,980 $21,960,287 $21,877,348 LIABILITIES:
Long term liabilities Other liabilities and inflows
$ 183,297 156,631
$ 192,675 165,179
$ 6,588,931
247,583
$ 6,721,199 232,113
$ 6,772,228 404,214
$ 6,913,874 397,292
TOTAL LIABILITIES $ 339,928 $ 357,854 $ 6,836,514 $ 6,953,312 $ 7,176,442 $ 7,311,166 NET POSITION:
Invested in capital assets, net of related debt Restricted Unrestricted
$ 4,752,455
1,818,667
$ 4,543,137
24,187 1,512,190
$ 4,507,458
7,003,511 (3,298,246)
$ 4,900,993
7,816,848 (4,231,173)
$ 9,259,913
7,003,511 (1,479,579)
$ 9,444,130
7,841,035 (2,718,983)
TOTAL NET POSITION $ 6,571,122 $ 6,079,514 8,212,723 $ 8,486,668 $14,783,845 $14,566,182
Net position represents the difference between the City’s resources and its obligations. At June 30, 2017, the largest portion of the City’s total net position, 63 percent, reflects the investment in capital assets, less related debt outstanding. This component of net position, which reflects the total amount of funds used to acquire those assets less any outstanding debt used for such acquisition, was $9.26 million at June 30, 2017. These capital assets are used by the City to provide services to the citizens. Overall, the net position for the governmental portion of the City funds has improved due to both operating results and increase contributions from operating and capital grants. However, the net position of the business activities continues to shrink due to a decreasing position in capital assets. Restricted net position of $7 million represents resources subject to external restrictions as to how they may be used. The Governmental Activities Unrestricted net position of $1.82 million represents amounts that may be used to meet the City’s ongoing obligations to its residents, businesses, customers, and creditors. The Business-type Activities negative Unrestricted net position of $3.29 million reflects the lack of resources available for capital replacement.

6
Following is a summary of changes in net position:
Summary of Change in Net Position Fiscal Years 2016-17 and 2015-2016
Governmental Activities . Business-type Activities . TOTALS . 2017 . 2016 . 2017 . 2016 . 2017 . 2016 . PROGRAM REVENUES:
Charges for services Operating grants Capital grants
GENERAL REVENUES:
Property taxes Sales and use taxes Contingent transaction tax Reimbursements Intergovernmental Motor vehicle in-lieu Franchise fees Other revenues Investment income
$ 262,570 130,309 701,280
455,368 464,982 280,112
229 78,715
297,128 112,910
51,598 59,361
$ 282,758 124,121 138,612
435,211 401,799 275,565
54,915 84,459
291,074 94,651 37,565
48,069
$ 1,680,239 - -
- - - - - - - -
53,697
$1,651,978 - -
- - - - - - - -
30,934
$ 1,942,809 130,309 701,280
455,368 464,982 280,112
229 78,715
297,128 112,910
51,598 113,058
$ 1,934,736 124,121 138,612
435,211 401,799 275,565
54,915 84,459
291,074 94,651 37,565
79,003
TOTAL REVENUES 2,894,562 2,268,799 1,733,936 1,682,912 4,628,498 3,951,711 EXPENSES:
Governmental activities: General government Public safety Public works Parks and recreation Community development Interest expense
Business-type activities: Water Wastewater
634,638 1,277,664
356,079 69,777
235,532 3,744
-
-
526,346 1,096,788
337,539 56,619
395,428 4,195
-
-
- - - - - -
832,077 1,001,324
- - - - - -
812,572 977,004
634,638 1,277,664
356,079 69,777
235,532 3,744
832,077
1,001,324
526,346 1,096,788
337,539 56,619
395,428 4,195
812,572
977,004
TOTAL EXPENSES 2,577,434 2,416,915 1,833,401 1,789,576 4,410,835 4,206,491 EXCESS (DEFICIENCY) OF REVENUES OVER (UNDER) EXPENSES TRANSFERS
317,128
174,480
(148,116)
188,296
(99,465)
(174,480)
(106,664)
(188,296)
217,663
-
(254,780)
-
CHANGE IN NET POSITION 491,608 40,180 (273,945) (294,960) 217,663 (254,780) NET POSITION, July 1 6,079,514 5,896,553 8,486,668 8,781,628 14,566,182 14,678,181
NET POSITION, June 30 $ 6,571,122 $ 5,936,733 $ 8,212,723 $8,486,668 $14,783,845 $14,423,401
Governmental Activities: The City’s governmental activities increased the City’s net position by $491,608. Revenues were $2,894,562 which represented an increase of $625,763 or 27.6 percent over the prior year. This increase is attributed mainly to capital grant revenue. Expenses were $2,577,434 which represented an increase of $160,519 or 6.6 percent. Governmental activities highlights include the following:
Taxes provided $1,576,305 or 54.5 percent of the total governmental activities revenue of the City.
This amount is an increase of $88,197 from the prior year.
Charges for services, operating grants and capital grants provided $1,094,159 or 37.8 percent of the
total governmental activities revenue of the City. This amount is an increase of $548,668 from the
prior year.

7
The following tables show the cost of each of the City’s major programs and the net cost of the programs. Net cost is the total cost less fees and other direct revenues generated by the activities. The net cost reflects the financial burden that was placed on the City’s taxpayers by each of the programs. For the fiscal years ended June 30, 2017 and 2016, the net costs are as follows:
NET COST OF MAJOR PROGRAMS FOR THE FISCAL YEAR ENDED JUNE 30, 2017
Total cost
of services .
Charges for services .
Operating
grants .
Capital
grants .
Net (cost) revenue
of services . GOVERNMENTAL ACTIVITIES: General government Public safety Public works Parks & recreation Community development Interest expense
$ 634,638 1,277,664
356,079 69,777
235,532 3,744
$ 168,151 39,076
- 42,533 12,810
-
$ - 130,309
- - -
-
$ - -
701,280 - -
-
$ (466,487)
(1,108,279) 345,201 (27,244)
(222,722) (3,744)
$ 2,577,434 $ 262,570 $ 130,309 $ 701,280 $ (1,483,275)
NET COST OF MAJOR PROGRAMS FOR THE FISCAL YEAR ENDED JUNE 30, 2016
Total cost
of services .
Charges for services .
Operating
grants .
Capital
grants .
Net (cost) revenue
of services . GOVERNMENTAL ACTIVITIES: General government Public safety Public works Parks & recreation Community development Interest expense
$ 526,346 1,096,788
337,539 56,619
395,428 4,195
$ 179,744 52,280
- 50,734
- -
$ - 124,121
- - -
-
$ - -
138,612 - -
-
$ (346,602)
(920,387) (198,927)
(5,885) (395,428)
(4,195)
$ 2,416,915 $ 282,758 $ 124,121 $ 138,612 $ (1,871,424) Business Type Activities: The City’s business type activities decreased the city’s net position by $273,945. Revenues were $1,733,936 which represents an increase of $51,024 primarily due to increased charges for services. Business type activities highlights include the following:
Charges for services provided $1,680,239 or 96.9 percent of the total business type activities revenue of
the City.
Charges for Services revenue is not keeping up with depreciation expenses in both Water and
Wastewater Funds. The net position of investment in capital assets continues to shrink and there are
insufficient unrestricted reserves to replace aging capital assets.
CHANGES IN BUSINESS-TYPE NET POSITION NET REVENUES (EXPENSES) FROM SERVICES
FOR THE FISCAL YEAR ENDED JUNE 30,
2017 . 2016 .
Operating
Expenses .
Charges for services .
Net (cost) revenue
of services .
Operating
Expenses .
Charges for services .
Net (cost) revenue
of services . Water Wastewater
$ 832,077 1,001,324
$ 803,989 876,250
$ (28,088) (125,074)
$ 812,572 977,004
$ 778,735 873,243
$ (33,837) (103,761)
$ 1,833,401 $ 1,680,239 $ (153,162) $ 1,789,576 $ 1,651,978 $ (137,598)

8
FINANCIAL ANALYSIS OF THE FUND STATEMENTS The City uses fund accounting to assure and demonstrate compliance with finance-related legal requirements. The fund financial statements focus on individual parts of the City government, reporting the City’s operation in more detail than the government-wide statements. The City’s governmental funds provide information on near-term inflows, outflows and balances of spendable resources. The City’s governmental funds reported combined fund balance at June 30, 2017 of $2,135,522. The General Fund increased by $162,974 and other Governmental Funds increased by $265,598. The General Fund increase was due to a decrease in community development costs and a decrease in capital outlay. Within the Governmental Funds, the increase in fund balance was attributable to a decrease in capital outlay.
Analysis of the General Fund The General Fund is the primary operating fund of the City. It accounts for revenues and expenditures associated with police services, public works, engineering, planning, building inspections, finance, parks, city clerk, city attorney, and administration. General fund revenues totaled $1,840,214 in fiscal year 2016-17, a decrease of $42,766 over the prior year. The decrease was primarily caused by a decrease in grant revenue. General fund expenditures totaled $1,920,216 in fiscal year 2016-17, an increase of $36,627 over last year. This slight increase was primarily in the public safety department. At the end of fiscal year 2016-17, the fund balance for the City’s General Fund was $1,632,968 an increase of $22,334 from the restated balance of the prior year. The fund balance in the General Fund was comprised or $164,765 which is non-spendable for long-term receivables, $30,000 committed for an insurance reserve, and $1,438,203 which is unassigned. The unassigned portion of the fund balance in the General Fund decreased by $1,791. Analysis of Major Proprietary Funds Water The Water Fund is financed and operated in a manner similar to that of a private business. The Fund’s net position went from $598,024 in fiscal year 2015-16 to $486,646 in fiscal year 2016-17 representing a reduction of $111,378. Operating revenues were $803,989, a 3.2 percent increase due to increased charges for services. Operating expenses were $714,411, a 3.3 percent increase over the prior year. At present, the water charges are not recapturing funding for depreciation. The Fund’s invested equity in capital assets went from $654,214 in fiscal year 2015-16 to $559,375 in fiscal year 2016-17. The Fund ended the year with a negative unrestricted net position of $72,729. Due to the age of the water system infrastructure, significant investments will be required in future years to update water lines and equipment. Wastewater The Wastewater fund is financed and operated in a manner similar to that of a private business. The Fund’s net position went from $7,888,644 in fiscal year 2015-16 to $7,726,077 in fiscal year 2016-17, representing a reduction of $162,567. Operating revenues were $876,250, a 0.34 percent increase over the prior year. Like the Water Fund, the wastewater charges are not recapturing funding for depreciation. The Fund’s invested equity in capital assets went from $4,246,779 in fiscal year 2015-16 to $3,948,083 in fiscal year 2016-17. The Fund ended the year with a negative unrestricted reserve of $3,225,517. Due to the age of the Wastewater system infrastructure, significant investments will be required in future years to update wastewater lines and equipment.
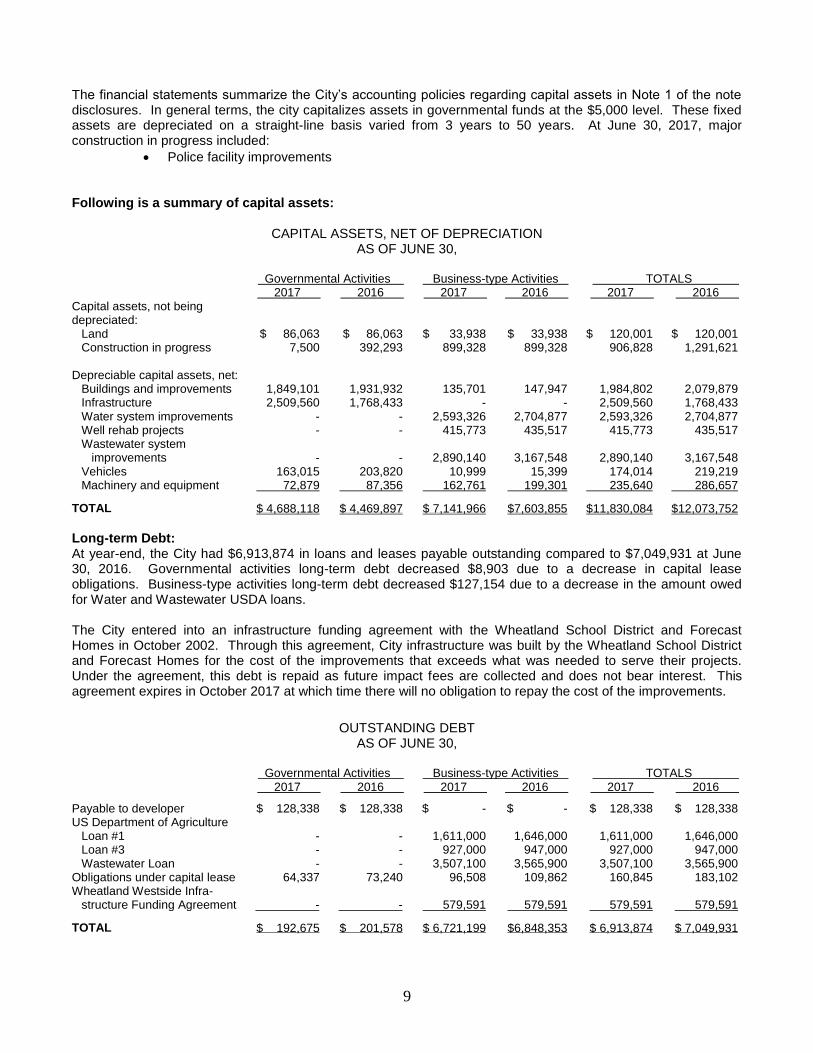
CAPITAL ASSETS AND LONG-TERM DEBT Capital assets The City has recorded all of its capital assets including infrastructure that were not recorded in prior years. At the end of fiscal year 2016-17, the City had invested $14,296,305 in a broad range of capital assets, including police and fire equipment, buildings, park facilities, street and storm drainage improvements and water and wastewater facilities. Additional detailed information on the City’s capital assets is presented Note 4 to the financial statements on pages 31 through 33.
9
The financial statements summarize the City’s accounting policies regarding capital assets in Note 1 of the note disclosures. In general terms, the city capitalizes assets in governmental funds at the $5,000 level. These fixed assets are depreciated on a straight-line basis varied from 3 years to 50 years. At June 30, 2017, major construction in progress included:
Police facility improvements
Following is a summary of capital assets:
CAPITAL ASSETS, NET OF DEPRECIATION AS OF JUNE 30,
Governmental Activities . Business-type Activities . TOTALS . 2017 . 2016 . 2017 . 2016 . 2017 . 2016 . Capital assets, not being depreciated:
Land Construction in progress
Depreciable capital assets, net: Buildings and improvements Infrastructure Water system improvements Well rehab projects Wastewater system improvements Vehicles Machinery and equipment
$ 86,063 7,500
1,849,101 2,509,560
- -
- 163,015
72,879
$ 86,063 392,293
1,931,932 1,768,433
- -
- 203,820
87,356
$ 33,938 899,328
135,701 -
2,593,326 415,773
2,890,140
10,999 162,761
$ 33,938 899,328
147,947 -
2,704,877 435,517
3,167,548
15,399 199,301
$ 120,001 906,828
1,984,802 2,509,560 2,593,326
415,773
2,890,140 174,014
235,640
$ 120,001 1,291,621
2,079,879 1,768,433 2,704,877
435,517
3,167,548 219,219
286,657
TOTAL $ 4,688,118 $ 4,469,897 $ 7,141,966 $7,603,855 $11,830,084 $12,073,752
Long-term Debt: At year-end, the City had $6,913,874 in loans and leases payable outstanding compared to $7,049,931 at June 30, 2016. Governmental activities long-term debt decreased $8,903 due to a decrease in capital lease obligations. Business-type activities long-term debt decreased $127,154 due to a decrease in the amount owed for Water and Wastewater USDA loans. The City entered into an infrastructure funding agreement with the Wheatland School District and Forecast Homes in October 2002. Through this agreement, City infrastructure was built by the Wheatland School District and Forecast Homes for the cost of the improvements that exceeds what was needed to serve their projects. Under the agreement, this debt is repaid as future impact fees are collected and does not bear interest. This agreement expires in October 2017 at which time there will no obligation to repay the cost of the improvements.
OUTSTANDING DEBT
AS OF JUNE 30, Governmental Activities . Business-type Activities . TOTALS . 2017 . 2016 . 2017 . 2016 . 2017 . 2016 .
Payable to developer US Department of Agriculture
Loan #1 Loan #3 Wastewater Loan
Obligations under capital lease Wheatland Westside Infra-
structure Funding Agreement
$ 128,338
- - -
64,337
-
$ 128,338
- - -
73,240
-
$ -
1,611,000 927,000
3,507,100 96,508
579,591
$ -
1,646,000 947,000
3,565,900 109,862
579,591
$ 128,338
1,611,000 927,000
3,507,100 160,845
579,591
$ 128,338
1,646,000 947,000
3,565,900 183,102
579,591
TOTAL $ 192,675 $ 201,578 $ 6,721,199 $6,848,353 $ 6,913,874 $ 7,049,931

10
ECONOMIC FACTORS AND NEXT YEAR’S BUDGET The City of Wheatland sales tax revenue has almost doubled since the 2008 great recession. The Measure S half cent add-on sales tax has added over $200,000 annually in additional sales tax revenue since its implementation in 2012. The City expects total sales tax to increase 5% in fiscal year 2017-18. A portion of the Transactions Tax revenue has been reserved as a hedge against possible future claims. Property tax revenues in fiscal year 2016-17 were at 91% of the pre-recession peak. Property tax revenues are expected to increase 3% in fiscal year 2017-18. The fiscal year 2017-2018 budget included a 3.8 percent salary increase for all City employees. There are no new positions added in the fiscal year 2017-18 budget. Capital equipment expenditures for fiscal year 2017-18 total $194,000, of which $84,000 will be paid by the General Fund. The City continues to work with various developers on their mapping and other requirements. We anticipate a limited level of building activity in the 2018 building season and more substantial activity in future years. The City completed the annexation of approximately 4,500 acres to the City in 2014. While preliminary planning is continuing for this annexation area, there are no immediate development plans for any of the property. Fiscal year 2017-18 service levels will remain the same as fiscal year 2016-17. It is anticipated that staffing levels will increase in future years as required by development activity.
REQUEST FOR INFORMATION This financial report is designed to provide a general overview of the City’s finances for all those with an interest in the government’s finances. Questions concerning any information provided in this report or request for additional financial information should be directed to:
City of Wheatland Finance Department 111 C Street
Wheatland, California 95692 (530) 633-2761

3
THIS PAGE INTENTIONALLY LEFT BLANK

3
CITY OF WHEATLAND BASIC FINANCIAL STATEMENTS
JUNE 30, 2017

11
CITY OF WHEATLAND, CALIFORNIA
GOVERNMENT-WIDE STATEMENT OF NET POSITION AS OF JUNE 30, 2017
Governmental Activities .
Business-type Activities .
Total . ASSETS:
CURRENT ASSETS: Cash and cash equivalents Receivables: Accounts receivable Interest receivable Prepaids Due from Agency funds Internal balances Restricted assets: Cash and cash equivalents
TOTAL CURRENT ASSETS
NONCURRENT ASSETS: Notes and loans receivable Capital assets, net
TOTAL NONCURRENT ASSETS
$ 1,598,849
194,715 6,050
20,716 219,070
(164,765)
-
1,874,635
348,297 4,688,118
5,036,415
$ 4,746,517
36,995 83,423 5,506
- 164,765
377,998
5,415,204
2,492,067 7,141,966
9,634,033
$ 6,345,366
231,710 89,473 26,222
219,070 -
377,998
7,289,839
2,840,364 11,830,084
14,670,448
TOTAL ASSETS $ 6,911,050 $ 15,049,237 $ 21,960,287 LIABILITIES:
CURRENT LIABILITIES: Accounts payable Accrued payroll liabilities Interest payable Compensated absences Deferred revenue Obligations under capital lease, due within one year Long-term debt, due within one year
TOTAL CURRENT LIABILITIES
NONCURRENT LIABILITIES: Payable to developer Infrastructure funding agreement Obligations under capital lease, due after one year Long-term debt, due after one year
TOTAL NONCURRENT LIABILITIES
$ 44,870 42,540
- 59,843
- 9,378
-
156,631
128,338 -
54,959 -
183,297
$ 22,794 15,761 33,628 43,132
- 14,068
118,200
247,583
- 579,591 82,440
5,926,900
6,588,931
$ 67,664 58,301 33,628
102,975 -
23,446 118,200
404,214
128,338 579,591 137,399
5,926,900
6,772,228
TOTAL LIABILITIES $ 339,928 $ 6,836,514 $ 7,176,442 NET POSITION:
Invested in capital assets, net of related debt Restricted for:
Restricted development impact fees Capital projects
Unrestricted
$ 4,752,455
- -
1,818,667
$ 4,507,458
7,003,511 -
(3,298,246)
$ 9,259,913
7,003,511 -
(1,479,579)
TOTAL NET POSITION $ 6,571,122 $ 8,212,723 $ 14,783,845
See accompanying notes to basic financial statements

10
CITY OF WHEATLAND, CALIFORNIA
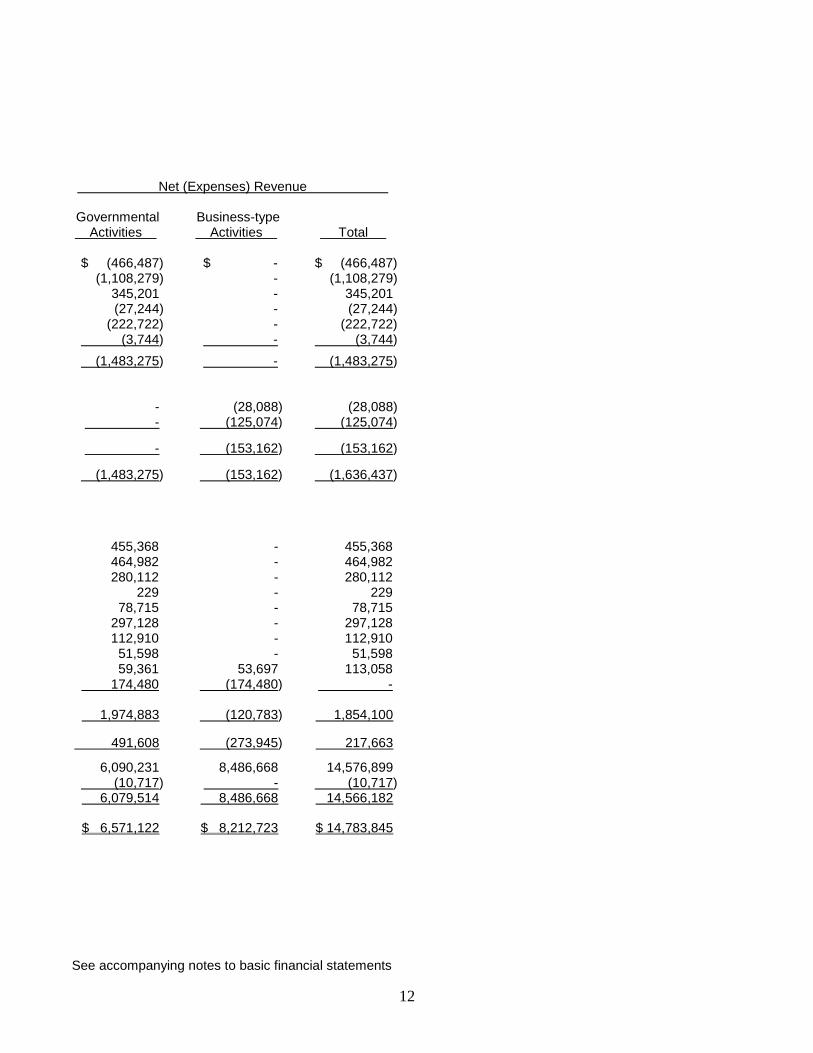
GOVERNMENT-WIDE STATEMENT OF ACTIVITIES FOR THE FISCAL YEAR ENDED JUNE 30, 2017
Program Revenues ..
Operating Expenses .
Charges for Services .
Grants and Other Contributions . Operating . Capital .
GOVERNMENTAL ACTIVITIES: General government Public safety Public works Parks & recreation Community development Interest expense
$ 634,638
1,277,664 356,079 69,777
235,532 3,744
$ 168,151
39,076 -
42,533 12,810
-
$ -
130,309 - - -
-
$ -
- 701,280
- -
-
TOTAL GOVERNMENTAL ACTIVITIES 2,577,434 262,570 130,309 701,280 BUSINESS-TYPE ACTIVITIES: Water Wastewater
832,077 1,001,324
803,989 876,250
- -
- -
TOTAL BUSINESS-TYPE ACTIVITIES 1,833,401 1,680,239 - -
TOTAL GOVERNMENT $ 4,410,835 $ 1,942,809 $ 130,309 $ 701,280
GENERAL REVENUES:
Property taxes Sales and use taxes Contingent transaction tax Reimbursements Intergovernmental Motor vehicle in-lieu Franchise fees Other revenues Investment income Transfers
TOTAL GENERAL REVENUES AND OTHER INCOME
CHANGES IN NET POSITION
Net position, beginning of year, reclassified Prior period adjustment Net position, beginning of year, restated
NET POSITION, END OF YEAR
12
Net (Expenses) Revenue .
Governmental Activities .
Business-type Activities .
Total .
$ (466,487)
(1,108,279) 345,201 (27,244)
(222,722) (3,744)
$ -
- - - -
-
$ (466,487)
(1,108,279) 345,201 (27,244)
(222,722) (3,744)
(1,483,275) - (1,483,275)
- -
(28,088) (125,074)
(28,088) (125,074)
- (153,162) (153,162)
(1,483,275) (153,162) (1,636,437)
455,368 464,982 280,112
229 78,715
297,128 112,910 51,598 59,361
174,480
- - - - - - - -
53,697 (174,480)
455,368 464,982 280,112
229 78,715
297,128 112,910 51,598
113,058 -
1,974,883
(120,783)
1,854,100
491,608 (273,945) 217,663
6,090,231 (10,717) 6,079,514
8,486,668 - 8,486,668
14,576,899 (10,717) 14,566,182
$ 6,571,122 $ 8,212,723 $ 14,783,845 See accompanying notes to basic financial statements

13
CITY OF WHEATLAND, CALIFORNIA
BALANCE SHEET GOVERNMENTAL FUNDS
AS OF JUNE 30, 2017 Major . Nonmajor .
General Fund .
Construction Fund .
Aggregate Nonmajor
Governmental Funds .
Total Governmental Funds .
ASSETS: Cash and cash equivalents Receivables:
Accounts receivable Interest receivable Loans receivable
Prepaids Due from other funds
$ 1,174,521
185,059
6,050 164,765 20,716
319,128
$ -
- - - -
-
$ 424,328
9,656
- 183,532
- 256,640
$ 1,598,849
194,715
6,050 348,297 20,716
575,768
TOTAL ASSETS $ 1,870,239 $ - $ 874,156 $ 2,744,395 LIABILITIES:
Accounts payable Accrued payroll liabilities Due to other funds
$ 35,451 37,055
164,765
$ - -
-
$ 9,419 5,485
356,698
$ 44,870 42,540
521,463
TOTAL LIABILITIES 237,271 - 371,602 608,873 FUND BALANCES:
Non-spendable for long-term receivables:
General fund Special Revenue funds
Committed: Insurance reserve:
General fund Unassigned:
General fund Special revenue funds
164,765
30,000
1,438,203 -
-
-
- -
183,532
-
- 319,022
164,765 183,532
30,000
1,438,203 108,716
TOTAL FUND BALANCES 1,632,968 - 502,554 2,135,522
TOTAL LIABILITIES AND FUND BALANCES
$ 1,870,239
$ -
$ 874,156
$ 2,744,395
See accompanying notes to basic financial statements

14
CITY OF WHEATLAND, CALIFORNIA
RECONCILIATION OF THE GOVERNMENTAL FUNDS BALANCE SHEET TO THE STATEMENT OF NET POSITION
FOR THE FISCAL YEAR ENDED JUNE 30, 2017
Total fund balances, governmental funds $ 2,135,522 Amounts reported for governmental activities in the Statement of Net Position are different because:
Capital assets used in governmental activities are not financial resources and therefore are not reported in the funds.
4,688,118
Long-term liabilities are not due and payable in the current period and therefore are not reported in the governmental funds balance sheet:
Developer deposits Obligations under capital lease
(128,338)
(64,337)
(192,675)
Compensated absences in the general fund are not due and payable in the current period and therefore are not reported in the general fund.
(59,843)
Total net position – governmental funds
$ 6,571,122
See accompanying notes to basic financial statements

15
CITY OF WHEATLAND, CALIFORNIA
STATEMENT OF REVENUES, EXPENDITURES, AND CHANGES IN FUND BALANCES GOVERNMENTAL FUNDS
FOR THE FISCAL YEAR ENDED JUNE 30, 2017 Major . Nonmajor .
General Fund .
Construction Fund .
Aggregate Nonmajor
Governmental Funds .
Total Governmental Funds .
REVENUES: Tax revenues Intergovernmental revenues Licenses, fees and permits Charges for services Fines, forfeitures and penalties Reimbursements and refunds Use of money and property Grant revenue Other revenue
$ 1,517,160
16,434 102,418
11 16,475
229 60,694 76,266
50,527
$ -
- - - - - -
625,014 -
$ 172,055
45,133 82,099
- - -
(1,333) 130,309
1,071
$ 1,689,215
61,567 184,517
11 16,475
229 59,361
831,589 51,598
TOTAL REVENUES 1,840,214 625,014 429,334 2,894,562
EXPENDITURES: Current:
General government Public safety Community development Public works Parks & recreation
Debt service: Principal Interest Capital outlay
454,235 1,094,560
235,532 -
69,777
8,903 3,744
53,465
7,570 - - - -
- -
519,719
41,962 58,231
- 228,580
-
- -
-
503,767 1,152,791
235,532 228,580 69,777
8,903 3,744
573,184
TOTAL EXPENDITURES 1,920,216 527,289 328,773 2,776,278 EXCESS OF REVENUES OVER EXPENDITURES
(80,002)
97,725
100,561
118,284 OTHER FINANCING SOURCES (USES): Transfers in Transfers out
487,984 (385,648)
31,398 -
330,439 (296,666)
849,821 (682,314)
TOTAL OTHER FINANCING 102,336 31,398 33,773 167,507
NET CHANGE IN FUND BALANCES
22,334
129,123
134,334
285,791
FUND BALANCE, July 1 reclassified Prior period adjustment FUND BALANCE, July 1 restated
1,623,846 (13,212) 1,610,634
(129,123) -
(129,123)
365,725 2,495 368,220
1,860,448 (10,717) 1,849,731
FUND BALANCE, June 30
$ 1,632,968
$ -
$ 502,554
$ 2,135,522 See accompanying notes to basic financial statements

16
CITY OF WHEATLAND, CALIFORNIA
RECONCILIATION OF THE STATEMENT OF REVENUES, EXPENDITURES AND CHANGES IN FUND BALANCES OF
GOVERNMENTAL FUNDS TO THE STATEMENT OF ACTIVITIES FOR THE FISCAL YEAR ENDED JUNE 30, 2017
Total net change in fund balance, governmental funds $ 285,791 Amounts reported for governmental activities in the statement of activities are different from amounts reported in government funds because:
Capital outlays are reported in government funds as expenditures. However, in the government-wide Statement of Activities and changes in net position, the cost of those assets is allocated over the estimated useful lives as depreciation expense. This is the amount of capital assets recorded in the current period.
Capital asset additions and deletions
540,503
Depreciation expense on capital assets is reported in the government-wide Statement of Activities and changes in net position, but they do not require the use of current financial resources. Therefore, depreciation expense is not reported as expenditure in governmental funds. (322,282)
Long-term debt proceeds provide current financial resources to governmental funds, but issuing debt increases long-term liabilities in the Statement of Net Position. Repayment and other reductions of principal are expenditures in the governmental funds, but in the Statement of Net Position the changes reduce long-term liabilities.
Payments on lease obligation on City Hall
8,903
Some expenses reported in the Statement of Activities do not require the use of current financial resources and therefore are not reported as expenditures in governmental funds. Decrease in the compensated absences balance
(21,307) Change in net position – governmental activities
$ 491,608
See accompanying notes to basic financial statements
17
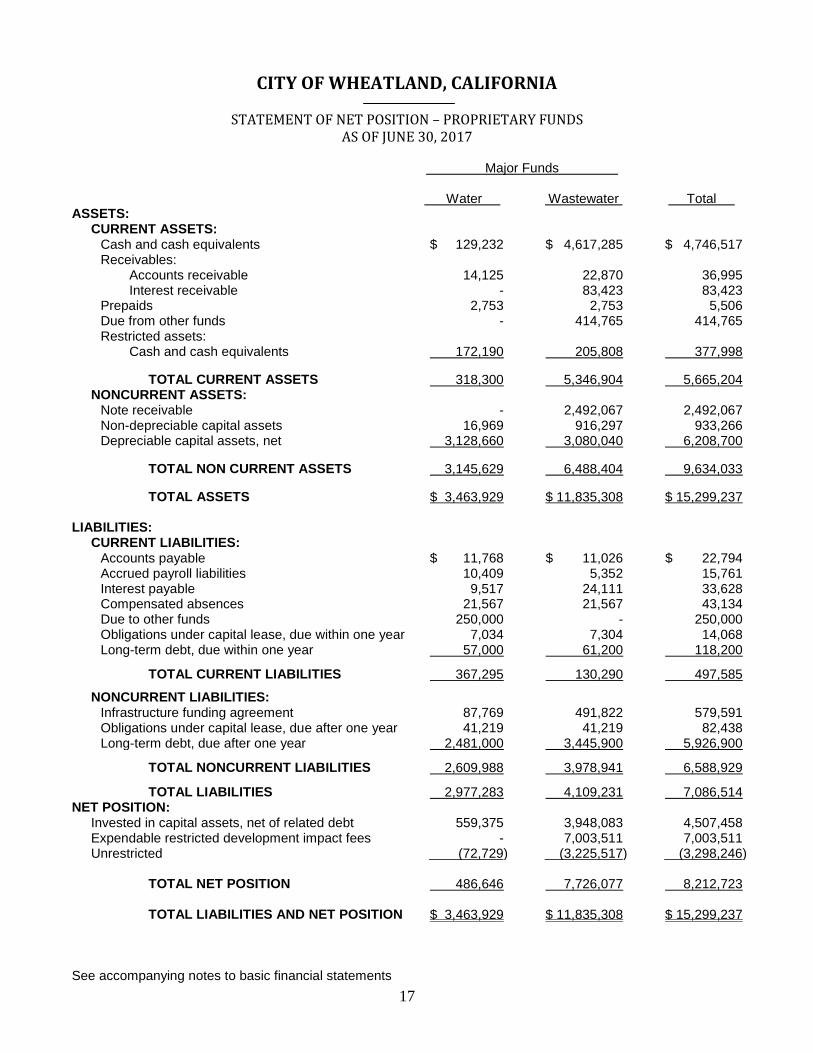
CITY OF WHEATLAND, CALIFORNIA
STATEMENT OF NET POSITION – PROPRIETARY FUNDS AS OF JUNE 30, 2017
Major Funds .
Water .
Wastewater .
Total . ASSETS:
CURRENT ASSETS: Cash and cash equivalents Receivables:
Accounts receivable Interest receivable
Prepaids Due from other funds Restricted assets:
Cash and cash equivalents
$ 129,232
14,125 -
2,753 -
172,190
$ 4,617,285
22,870 83,423 2,753
414,765
205,808
$ 4,746,517
36,995 83,423 5,506
414,765
377,998
TOTAL CURRENT ASSETS 318,300
5,346,904 5,665,204 NONCURRENT ASSETS:
Note receivable Non-depreciable capital assets Depreciable capital assets, net
- 16,969
3,128,660
2,492,067
916,297 3,080,040
2,492,067 933,266
6,208,700
TOTAL NON CURRENT ASSETS 3,145,629
6,488,404 9,634,033
TOTAL ASSETS $ 3,463,929
$ 11,835,308 $ 15,299,237 LIABILITIES:
CURRENT LIABILITIES: Accounts payable Accrued payroll liabilities Interest payable Compensated absences Due to other funds Obligations under capital lease, due within one year Long-term debt, due within one year
$ 11,768 10,409 9,517
21,567 250,000
7,034 57,000
$ 11,026 5,352
24,111 21,567
- 7,304
61,200
$ 22,794 15,761 33,628 43,134
250,000 14,068
118,200
TOTAL CURRENT LIABILITIES 367,295
130,290 497,585
NONCURRENT LIABILITIES: Infrastructure funding agreement Obligations under capital lease, due after one year Long-term debt, due after one year
87,769 41,219
2,481,000
491,822 41,219
3,445,900
579,591 82,438
5,926,900
TOTAL NONCURRENT LIABILITIES 2,609,988
3,978,941 6,588,929
TOTAL LIABILITIES 2,977,283
4,109,231 7,086,514 NET POSITION:
Invested in capital assets, net of related debt Expendable restricted development impact fees Unrestricted
559,375
- (72,729)
3,948,083 7,003,511
(3,225,517)
4,507,458 7,003,511
(3,298,246) TOTAL NET POSITION 486,646
7,726,077 8,212,723
TOTAL LIABILITIES AND NET POSITION $ 3,463,929
$ 11,835,308 $ 15,299,237
See accompanying notes to basic financial statements

18
CITY OF WHEATLAND, CALIFORNIA
STATEMENT OF REVENUES, EXPENSES, AND CHANGES IN NET POSITION PROPRIETARY FUNDS
FOR THE FISCAL YEAR ENDED JUNE 30, 2017 Major Funds .
Water .
Wastewater .
Total . OPERATING REVENUES:
Utility revenue Other revenue
$ 803,372 617
$ 874,733 1,517
$ 1,678,105 2,134
TOTAL OPERATING REVENUES 803,989
876,250 1,680,239 OPERATING EXPENSES:
Salaries and benefits Operations and maintenance Depreciation and amortization expense
315,198 221,332
177,881
339,909 200,287
312,392
655,107 421,619
490,273
TOTAL OPERATING EXPENSES 714,411
852,588 1,566,999 OPERATING INCOME
89,578
23,662
113,240
NONOPERATING INCOME (EXPENSE):
Interest revenue Interest expense
1,624 (117,666)
52,073 (148,736)
53,697 (266,402)
TOTAL NONOPERATING INCOME (EXPENSE)
(116,042)
(96,663)
(212,705)
GAIN (LOSS) BEFORE TRANSFERS (26,464) (73,001) (99,465)
TRANSFERS: Transfers in Transfers out
-
(84,914)
-
(89,566)
-
(174,480)
CHANGE IN NET POSITION (111,378) (162,567) (273,945) NET POSITION, July 1
598,024
7,888,644
8,486,668
NET POSITION, June 30 $ 486,646
$ 7,726,077 $ 8,212,723
See accompanying notes to basic financial statements

19
CITY OF WHEATLAND, CALIFORNIA
STATEMENT OF CASH FLOWS – PROPRIETARY FUNDS FOR THE FISCAL YEAR ENDED JUNE 30, 2017
Major Funds . Water . Wastewater . Total . CASH FLOWS FROM OPERATING ACTIVITIES: Cash received from customers Cash paid to suppliers Cash paid to employees and related benefits Interfund borrowings
$ 805,992
(218,030) (312,722)
(83)
$ 873,878
(196,901) (342,466)
(11,424)
$ 1,679,870
(414,931) (655,188)
(11,507)
NET CASH PROVIDED BY OPERATING ACTIVITIES 275,157
323,087 598,244 CASH FLOWS FROM CAPITAL FINANCING ACTIVITIES: Interest paid Payments on long-term debt Purchase of capital assets
(118,255) (61,678)
(21,366)
(149,902) (65,478)
(7,019)
(268,157) (127,156)
(28,385) NET CASH USED BY CAPITAL FINANCING ACTIVITIES (201,299) (222,399) (423,698) CASH FLOWS FROM NONCAPITAL FINANCING ACTIVITIES: Transfers out
(84,914)
(89,566)
(174,480)
NET CASH USED BY NONCAPITAL FINANCING ACTIVITIES
(84,914)
(89,566)
(174,480)
CASH FLOWS FROM INVESTING ACTIVITIES: Interest received
1,624
33,868
35,492
INCREASE (DECREASE) IN CASH AND CASH EQUIVALENTS (9,432) 44,990 35,558 Cash and cash equivalents, July 1
310,854
4,778,103
5,088,957
Cash and cash equivalents, June 30 $ 301,422 $ 4,823,093 $ 5,124,515
SUMMARY OF CASH AND CASH EQUIVALENTS: Cash and cash equivalents, unrestricted Cash and cash equivalents, restricted
$ 129,232 172,190
$ 4,617,285 205,808
$ 4,746,517 377,998
$ 301,422 $ 4,823,093 $ 5,124,515 Reconciliation of operating income from operations to cash provided (used) by operating activities: Operating income Adjustments to reconcile operating income to cash provided (used) by operating activities:
Depreciation and amortization expense (Increase) decrease in assets:
Accounts receivable Prepaids
Increase (decrease) in liabilities: Accounts payable Accrued payroll liability Compensated absences Due to other funds
$ 89,578
177,881
2,003 (2,753)
6,055
575 1,901
(83)
$ 23,662
312,392
(2,372) (2,753)
6,139
(4,458) 1,901
(11,424)
$ 113,240
490,273
(369) (5,506)
12,194 (3,883) 3,802
(11,507)
NET CASH PROVIDED BY OPERATING ACTIVITIES $ 275,157 $ 323,087 $ 598,244
See accompanying notes to basic financial statements

20
CITY OF WHEATLAND, CALIFORNIA
STATEMENT OF FIDUCIARY NET POSITION – AGENCY FUNDS AS OF JUNE 30, 2017
Agency .
ASSETS: Cash and cash equivalents Accounts receivable
$ 3,632 236,824
TOTAL ASSETS
$ 240,456 LIABILITIES: Accounts payable Accrued payroll liabilities Due to other funds
$ 18,119 -
219,070
TOTAL LIABILITIES
$ 237,189 NET POSITION
$ 3,267
See accompanying notes to basic financial statements

21
CITY OF WHEATLAND, CALIFORNIA
NOTES TO THE BASIC FINANCIAL STATEMENTS FOR THE FISCAL YEAR ENDED JUNE 30, 2017
Note 1 SUMMARY OF SIGNIFICANT ACCOUNTING POLICIES
The City of Wheatland (“the City”) was incorporated in 1874, under the laws and regulations of the State of California. The City operates under the City Council – Manager form of government and provides or contracts for the following services: public safety (Police and Fire), highways and streets, water, wastewater, culture-recreation, public improvements, planning and zoning, and general administration. Authority and responsibility for operations is given to the City Council by the voters of the City of Wheatland. The City Council has the authority to employ administrative and support personnel to carry out its directives. The primary method used to monitor the performance of the City’s management is the financial budget which is adopted annually by the City Council. The City operates as a self-governing governmental unit within the State of California. The financial statements of the City have been prepared in accordance with generally accepted accounting principles (GAAP) as applied to governmental units. The Governmental Accounting Standards Board (GASB) is the standard-setting body for governmental accounting and financial reporting. On June 15, 1987, the GASB issued a codification of the existing Governmental Accounting and Financial Reporting Standards which, along with subsequent GASB pronouncements (Statements and Interpretations), constitutes GAAP for governmental units. The City applies all GASB pronouncements. The City’s main funding sources include property taxes, other inter-governmental revenue from state and federal sources, user fees, and federal and state financial assistance. These financial statements are in compliance with GASB Statement No. 34, Basic Financial Statements – and Management Discussion and Analysis – for State and Local Governments. The financial statements include:
A Management Discussion and Analysis (MD&A) section providing an analysis of the City’s overall financial position and results of operations. This is required supplementary information.
Government-wide financial statements prepared using the economic resources measurement focus and the accrual basis of accounting for all of the City’s activities.
A change in the fund financial statements to focus on the major funds. These and other changes are reflected in the accompanying financial statements including these notes to the financial statements. Reporting Entity The reporting entity for the City of Wheatland includes all the funds and operations under the jurisdiction of the City Council. There are no component or blended component units that are part of the City’s operations. Basis of Accounting – Government-wide Financial Statements The statement of net position and the statement of activities display information about the City and the primary government as a whole. These statements distinguish between the governmental and business-type activities of the City. The City’s police and fire protection, parks, culture and recreation, public works, and general administrative services are classified as governmental activities. The City’s wastewater and water services are classified as business-type activities.
22
CITY OF WHEATLAND, CALIFORNIA
NOTES TO THE BASIC FINANCIAL STATEMENTS FOR THE FISCAL YEAR ENDED JUNE 30, 2017
Note 1 SUMMARY OF SIGNIFICANT ACCOUNTING POLICIES (Continued)
Basis of Accounting – Government-wide Financial Statements (Continued) The government-wide statements are reported using the economic resources measurement focus and the accrual basis of accounting. This is the same approach used in the preparation of the proprietary fund financial statements but differs from the manner in which governmental fund financial statements are prepared. Therefore, governmental fund financial statements include a reconciliation with brief explanations to better identify the relationship between the government-wide statements and the statements for governmental funds. The government-wide statement of activities presents a comparison between expenses, both direct and indirect, and program revenues for each segment of the business-type activities of the City and for each governmental program. Direct expenses are those that are specifically associated with a service, program, or department and are therefore clearly identifiable to a particular function. Program revenues include:
Charges to customers or applicants who purchase, use, or directly benefit from goods, services, or privileges provided by a given function or segment, and
Grants and contributions that are restricted to meeting the operational or capital requirements of a particular function or segment.
Revenues that are not classified as program revenues are presented as general revenues. Internally dedicated resources are reported as general revenues rather than as program revenue. Taxes and other items not properly included amount program revenues are reported instead as general revenues. In the government-wide Statement of Net Position, both the governmental and business-type activities columns are (a) presented on a consolidated basis by column, and (b) are reported on a full accrual, economic resource basis, which recognizes all long-term assets and receivables as well as long-term debt and obligations. The City’s net position is reported in three parts – invested in capital assets, net of related debt; restricted net position; and unrestricted net position. Fiduciary funds are not presented as part of the government-wide Statement of Net Position. When both restricted and unrestricted resources are available for use, it is the government’s policy to use restricted resources first, then unrestricted resources as they are needed. As a general rule the effect of interfund activity has been eliminated from the government-wide financial statements. This government-wide focus is more on the sustainability of the City as an entity and the change in the City’s net position resulting from the current year’s activities. Accounting Policies The City operates as a self-governing governmental unit within the State of California. The accounting policies of the City of Wheatland conform to accounting principles generally accepted in the United States of America as prescribed by the Governmental Accounting Standards Board and the Financial Accounting Standards Board.

23
CITY OF WHEATLAND, CALIFORNIA
NOTES TO THE BASIC FINANCIAL STATEMENTS FOR THE FISCAL YEAR ENDED JUNE 30, 2017
Note 1 SUMMARY OF SIGNIFICANT ACCOUNTING POLICIES (Continued)
Basic Financial Statements – Fund Financial Statements The accounts of the City of Wheatland are organized on the basis of funds or account groups, each of which is considered to be a separate accounting entity. The operations of each fund are accounted for with a separate set of self-balancing accounts that comprise its assets, liabilities, fund equity, revenues, and expenditures. City resources are allocated to and accounted for in individual funds based upon the purpose for which they are to be spent and the means by which spending activities are controlled. The emphasis in fund financial statements is on the major funds in either the governmental or business-type activities categories. Nonmajor funds by category are summarized into a single column. GASB No. 34 sets forth minimum criteria (percentage of the assets, liabilities, revenue or expenditures/expenses of either fund category or the governmental and enterprise combined) for the determination of major funds. The nonmajor funds are combined in a column in the fund financial statements.
Governmental Funds
General Fund is the general operating fund of the City. It is used to account for all financial resources except those required to be accounted for in another fund. Special Revenue Funds are used to account for the proceeds of specific revenue sources (other than special assessments, expendable trusts, or major capital projects) that are legally restricted to expenditures for specific purposes. Capital Projects Funds are used to account for revenues and expenditures restricted to the acquisition or construction of capital assets and are accounted for in a manner similar to the General Fund.
Proprietary Funds
Enterprise Funds are used to account for operations that are financed and operated in a manner similar to private business enterprises – where the intent of the governing body is that the costs (expenses, including depreciation) of providing goods or services to the general public on a continuing basis e financed or recovered primarily through user charges, or where the governing body has decided that periodic determination of revenues earned, expenses incurred, and/or net income is appropriate for capital maintenance, public policy, management control, accountability, or other purposes. The City reports the following major enterprise funds:
Wastewater Fund is used to account for all activities associated with the acquisition or construction, operation and maintenance, and treatment of sanitary wastewater.
Water Fund is used to account for all activities associated with the acquisition or construction, operation and maintenance, distribution and transmission of potable water to users.
Fiduciary Funds
Agency Funds are used to account for assets held by the City in a purely custodial capacity.
24
CITY OF WHEATLAND, CALIFORNIA
NOTES TO THE BASIC FINANCIAL STATEMENTS FOR THE FISCAL YEAR ENDED JUNE 30, 2017
Note 1 SUMMARY OF SIGNIFICANT ACCOUNTING POLICIES (Continued)
Basis of Accounting Basis of accounting refers to the point at which revenues or expenditures/expenses are recognized in the accounts and reported in the financial statements. It relates to the timing of the measurements made regardless of the measurement focus applied.
Accrual Both governmental and business-type activities in the government-wide financial statements and the proprietary and fiduciary fund financial statements are presented on the accrual basis of accounting. Property taxes are reported in the period for which levied. Other non-exchange revenues, including intergovernmental revenues and grants, are reported when all eligibility requirements have been met. Fees and charges and other exchange revenues are recognized when earned and expenses are recognized when incurred.
Modified Accrual The governmental funds financial statements are presented on the modified accrual basis of accounting. Under the modified accrual basis of accounting, revenues are recorded when susceptible to accrual: i.e., both measureable and available. “Available” means collectable within the current period or within 60 days after year end. Property taxes, franchise taxes, licenses, intergovernmental revenues, charges for services, and interest associated with the current fiscal period are all considered to be susceptible to accrual and so have been recognized as revenues of the current fiscal period. All other revenue items are considered to be measureable and available only when cash is received by the government. Expenditures are recognized when the related liability is incurred. Exceptions to this general rule include principal and interest on general obligation long-term debt and employee vacation and sick leave, which are recognized when due and payable.
Cash and Cash Equivalents For the purpose of the statement of cash flows, the City considers all highly liquid investments with an original maturity of three months or less when purchased to be cash equivalents. Capital Assets and Depreciation The accounting and reporting treatment applied to the capital assets associated with a fund are determined by its measurement focus. General capital assets are long-lived assets of the City as a whole. When purchased, such assets are recorded as expenditures in the governmental funds and capitalized. Capital assets are defined by the government as assets with an initial, individual cost of more than $5,000 and an estimated useful life in excess of three years. The valuation basis for general capital assets are historical cost, or where historical cost is not available, estimated historical cost based on replacement cost. Capital assets in the proprietary funds are capitalized in the fund in which they are utilized. The valuation basis for proprietary fund capital assets are the same as those used for the general capital assets. The City has made improvements to its water and wastewater system through a federal grant. Acquisition, construction, and installation costs incurred have been charged to (or capitalized in) capital assets.

25
CITY OF WHEATLAND, CALIFORNIA
NOTES TO THE BASIC FINANCIAL STATEMENTS FOR THE FISCAL YEAR ENDED JUNE 30, 2017
Note 1 SUMMARY OF SIGNIFICANT ACCOUNTING POLICIES (Continued)
Capital Assets and Depreciation (Continued) Depreciation of capital assets is computed using the straight-line method. The estimated useful lives for these depreciable assets are as follows:
Water and wastewater system 39 years
Improvements 50 years
Equipment and other improvements 3 to 20 years General infrastructure assets acquired prior to July 1, 2003 are not reported in the basic financial statements. Compensated Absences Accumulated unpaid employee vacation leave and sick leave are recognized as liabilities of the City. Unused vacation leave accrued is payable at 100% of the accrual at termination of employment. Unused sick leave is payable at 25% of accrual at termination of employment. At June 30, 2017, the unpaid vacation and sick leave liability of the City amounts to $102,975. Long-Term Obligations Long-term debt is recognized as a liability of a governmental fund when due or when resources have been accumulated in the debt service fund for payment early in the following year. For other long-term obligations, only that portion expected to be financed from expendable available financial resources is reported as a fund liability of a governmental fund. Long-term liabilities expected to be financed from proprietary fund operations are accounted for in those funds. Deferred Revenues Deferred revenue in governmental funds arise when a potential revenue does not meet both the “measureable” and “available” criteria for recognition in the current period. Deferred revenue also arise when resources are received by the City before it has legal claim to them (i.e., when grant monies are received prior to the incurrence of qualifying expenditures). Fund Balance Reserves represent those portions of fund equity not appropriable for expenditures or legally segregated for a specific future use. Designated fund balances represent tentative plans for future use of financial resources. Operating Revenues and Expenses in Proprietary Funds The City’s proprietary funds distinguish between operating and nonoperating revenues and expenses. Operating revenues and expenses of the City’s water and wastewater funds consist of charges for services (including tap fees for the water fund and systems development charges for the wastewater fund) and the costs of providing those services, including depreciation and excluding interest cost. All other revenues and expenses are reported as nonoperating.

26
CITY OF WHEATLAND, CALIFORNIA
NOTES TO THE BASIC FINANCIAL STATEMENTS FOR THE FISCAL YEAR ENDED JUNE 30, 2017
Note 1 SUMMARY OF SIGNIFICANT ACCOUNTING POLICIES (Continued)
Net Position The government-wide financial statements utilize a net position presentation. Net position are categorized as invested in capital assets (net of related debt), restricted, and unrestricted.
Invested in Capital Assets, Net of Related Debt – This category groups all capital assets into one component of net position. Accumulated depreciation and the outstanding balances of debt that are attributable to the acquisition, construction or improvement of these assets reduce the balance in this category.
Restricted Net Position – This category presents external restrictions imposed by creditors, grantors, contributors, laws or regulations of other governments and restrictions imposed by law through constitutional provisions or enabling legislation.
Unrestricted Net Position – This category represents net position of the City not restricted for any project or other purpose.
In the government-wide financial statements, when both restricted and unrestricted resources are available for use, it is the government’s policy to use restricted resources first, then unrestricted resources as they are needed. Fund Equity In accordance with Government Accounting Standards Board (GASB) No. 54, Fund Balance Reporting and Governmental Fund Type Definitions, the City classifies governmental fund balances as follows:
Non-spendable – includes amounts that cannot be spent either because it is not in spendable form or because of legal or contractual constraints.
Restricted – includes fund balance amounts that are constrained for specific purposes which are externally imposed by providers, such as creditors of amounts constrained due to constitutional provisions or enabling legislation.
Committed – includes fund balance amounts that are constrained for specific purposes that are internally imposed by the government through formal action of the highest level of decision making authority and does not lapse at year-end.
Assigned – includes fund balance amounts that are intended to be used for specific purposes that are neither considered restricted or committed. Fund balance maybe assigned by the City Manager or Department Heads with City Council approval.
Unassigned – includes positive fund balance within the General Fund which has not been classified within the above mentioned categories and negative fund balances in other governmental funds.
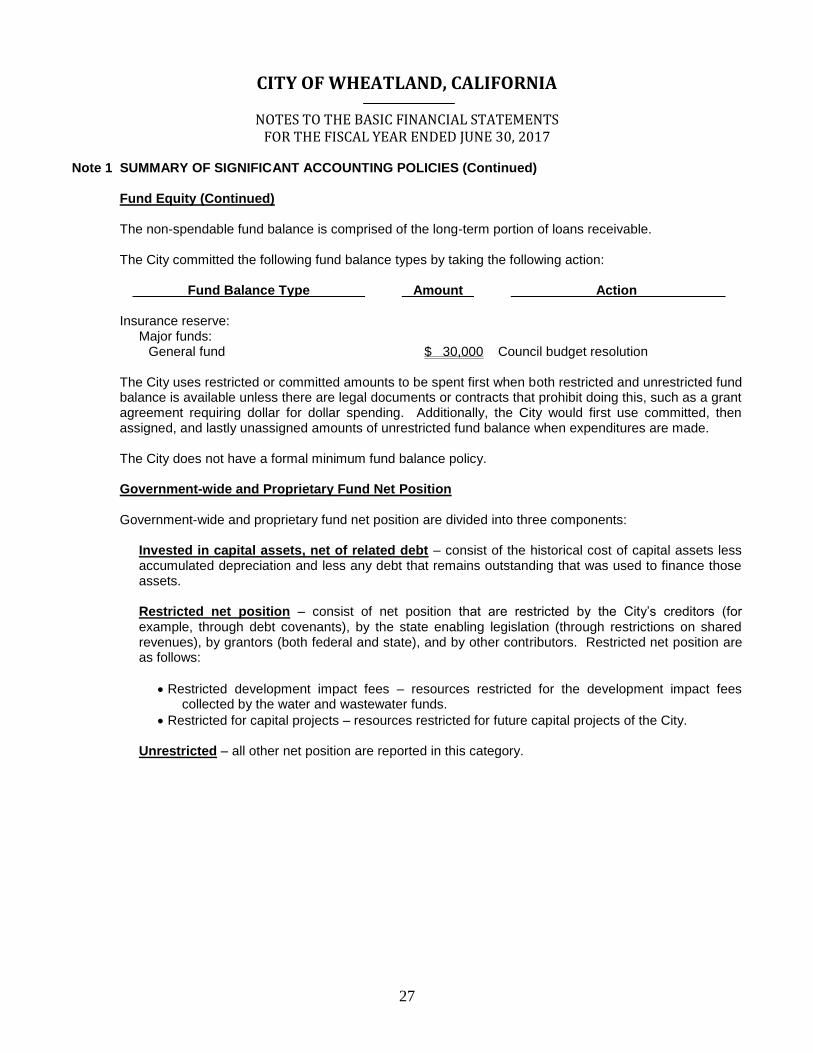
27
CITY OF WHEATLAND, CALIFORNIA
NOTES TO THE BASIC FINANCIAL STATEMENTS FOR THE FISCAL YEAR ENDED JUNE 30, 2017
Note 1 SUMMARY OF SIGNIFICANT ACCOUNTING POLICIES (Continued)
Fund Equity (Continued) The non-spendable fund balance is comprised of the long-term portion of loans receivable. The City committed the following fund balance types by taking the following action:
Fund Balance Type . Amount . Action . Insurance reserve:
Major funds: General fund $ 30,000 Council budget resolution
The City uses restricted or committed amounts to be spent first when both restricted and unrestricted fund balance is available unless there are legal documents or contracts that prohibit doing this, such as a grant agreement requiring dollar for dollar spending. Additionally, the City would first use committed, then assigned, and lastly unassigned amounts of unrestricted fund balance when expenditures are made. The City does not have a formal minimum fund balance policy. Government-wide and Proprietary Fund Net Position Government-wide and proprietary fund net position are divided into three components:
Invested in capital assets, net of related debt – consist of the historical cost of capital assets less accumulated depreciation and less any debt that remains outstanding that was used to finance those assets.
Restricted net position – consist of net position that are restricted by the City’s creditors (for example, through debt covenants), by the state enabling legislation (through restrictions on shared revenues), by grantors (both federal and state), and by other contributors. Restricted net position are as follows:
Restricted development impact fees – resources restricted for the development impact fees collected by the water and wastewater funds.
Restricted for capital projects – resources restricted for future capital projects of the City.
Unrestricted – all other net position are reported in this category.

28
CITY OF WHEATLAND, CALIFORNIA
NOTES TO THE BASIC FINANCIAL STATEMENTS FOR THE FISCAL YEAR ENDED JUNE 30, 2017
Note 1 SUMMARY OF SIGNIFICANT ACCOUNTING POLICIES (Continued)
Interfund Activity Interfund activity is reported as either loans, services provided, reimbursements or transfers. Loans are reported as interfund receivables and payables as appropriate and are subject to elimination upon consolidation. Services provided, deemed to be at market or near market rates, are treated as revenues and expenditure/expenses. Reimbursements are when one fund incurs a cost, charges the appropriate benefiting fund and reduces its related cost as a reimbursement. All other interfund transactions are treated as transfers. Transfers between governmental or between proprietary funds are netted as part of the reconciliation to the government-wide financial statements. Property Tax Secured property taxes attach as an enforceable lien on property as of July 1. Taxes are payable in two installments or November 1 and February 1. Yuba County bills and collects the taxes for the City. Tax revenue is recognized by the City when notification of collection is received. Sales Tax The State presently levies an 7.75% sales tax on taxable sales within the City of which 1.50% is allocated to the City. The sales tax is collected by the State and remitted to the City in the month following receipt. The 7.75% includes a .50% add-on tax approved by the Wheatland voters in November 2010. The tax sunsets in 2021. Budgetary Policy and Data The City Council annually adopts a city-wide budget for the City. The City Manager is responsible for preparing estimated revenues and expenditure recommendations for the next year’s budget. The City Council adopts the budget by resolution on or before June 30. Budget appropriations lapse at the end of the year. Loans Receivable As part of its participation in a Community Development Block Grant program, the City has loaned funds to qualifying property owners for the purpose of funding improvements to properties which have deteriorated significantly. In order to be eligible, property owners must meet certain income limitations. Loans bear no interest or nominal interest, and payment may be deferred for twenty to fifty years or until sale of the property.
Estimates and Assumptions The preparation of financial statements in conformity with accounting principles generally accepted in the United States of America requires management to make estimates and assumptions that affect the reported amounts of assets and liabilities and disclosure of contingent assets and liabilities at the date of the financial statements and the reported amounts of revenues and expenses during the reporting period. Actual results could differ from those estimates.

29
CITY OF WHEATLAND, CALIFORNIA
NOTES TO THE BASIC FINANCIAL STATEMENTS FOR THE FISCAL YEAR ENDED JUNE 30, 2017
Note 2 CASH AND CASH EQUIVALENTS
The City Treasurer is responsible for maintaining a cash and investment pool for all funds in accordance with the City investment policy that is updated as necessary. The City maintains one checking account and one savings account with a bank and invests cash in excess of immediate needs with the State of California Local Agency Investment Fund (LAIF). Funds invested with LAIF are treated as cash equivalents since they are immediately available. Total cash and investments are allocated to the City’s individual funds based on their equity in the pooled amount. Interest income is allocated to those funds that are required by law or administrative action to receive interest. Interest is allocated quarterly based on the aggregate cash balances in each fund receiving interest. Deposits at June 30, 2017 are:
Statement
Balance . Bank
Balance . Pooled deposits:
Pooled cash and cash equivalents Money market funds Local agency investment fund (uncategorized)
$ 406,659 3,692,760 2,627,377
$ 510,405 3,692,760 2,627,377
Non-pooled cash and cash equivalents: Petty cash 200 -
TOTAL DEPOSITS $ 6,726,996 $ 6,829,480 Cash and investments as of June 30, 2017 are classified in the accompanying financial statements as follows:
Government-wide
Statement of Net Position .
Governmental Activities .
Business-type Activities .
Agency Funds . Total .
Cash and cash equivalents Restricted assets: Cash and cash equivalents
$ 1,598,849
-
$ 4,746,517
377,998
$ 3,632
-
$ 6,348,998
377,998 TOTAL $ 1,598,849 $ 5,124,515 $ 3,632 $ 6,726,996
The restricted cash and cash equivalents are set aside as per the USDA loan requirements for the Water and Wastewater Enterprise Funds. Investment policy Investments are reported at fair value. California statutes authorize cities to invest idle or surplus funds in a variety of credit instruments as provided for in the California Government Code, Section 53600, Chapter 4 – Financial Affairs. The investment types that are authorized by the City’s council resolution no. 09-09 adopted on July 16, 2009 include United States treasury notes, bonds, bills; securities of the U.S. government; local agency investment funds; certificates of deposit; passbook savings and money market accounts.

30
CITY OF WHEATLAND, CALIFORNIA
NOTES TO THE BASIC FINANCIAL STATEMENTS FOR THE FISCAL YEAR ENDED JUNE 30, 2017
Note 2 CASH AND CASH EQUIVALENTS (Continued)
Custodial credit risk The California Government Code requires California banks and savings and loan associations to collateralize a City's deposits by pledging government securities. The market value of pledged securities must equal at least 110 percent of a City's deposits. California law also allows financial institutions to collateralize City deposits by pledging first trust deed mortgage notes having a value of 150 percent of a City's total deposits. The City may waive collateral requirements for deposits which are fully insured up to $250,000 by Federal Deposit insurance. At year end, the carrying amount of the City's cash was $4,099,419 and the bank balance was $4,203,165. Differences between the bank balance and the carrying amount represents outstanding checks and deposits in transit. The bank balances are insured/collateralized as noted above. Investment in Local Agency Investment Fund (LAIF) LAIF is stated at amortized cost, which approximates fair value. The LAIF is a special fund of the California State Treasury through which local governments may pool investments. The fair value of the City’s investment in this pool is reported in the accompanying financial statements at amounts based upon the City’s pro-rata share of the fair value provided by LAIF for the entire LAIF portfolio. At year end the carrying amount of the City’s cash invested in LAIF was $2,627,377. The City’s investment in LAIF and the money market fund are unrated.
Note 3 ACCOUNTS RECEIVABLE Accounts receivable for the governmental activities consist of various reimbursements, taxes and fees dated June 30 and prior received subsequent to June 30, 2017. They include:
General Fund .
Transportation Development Act Fund .
Supplement
Law Enforcement
Lighting and Landscaping Districts .
Wheatland Ryantown .
Park Place .
Comcast June Sales Tax Document Stamp Tax Fines, Fees Recology May Sales Tax Prop 172 T Mobile Sprint and ATT Fines, Fees Sacog Grant Mercy Housing Transit State Property Tax
$ 8,819 69,800 3,236
530 11,292 52,400
779 1,500 2,561
545 7,889
- -
25,707
$ - - - - - - - - - - -
3,854 -
-
$ - - - - - - - - - - - -
4,214 -
$ - - - - - - - - - - - - -
1,203
$ - - - - - - - - - - - - -
385
Total $ 185,059 $ 3,854 $ 4,214 $ 1,203 $ 385
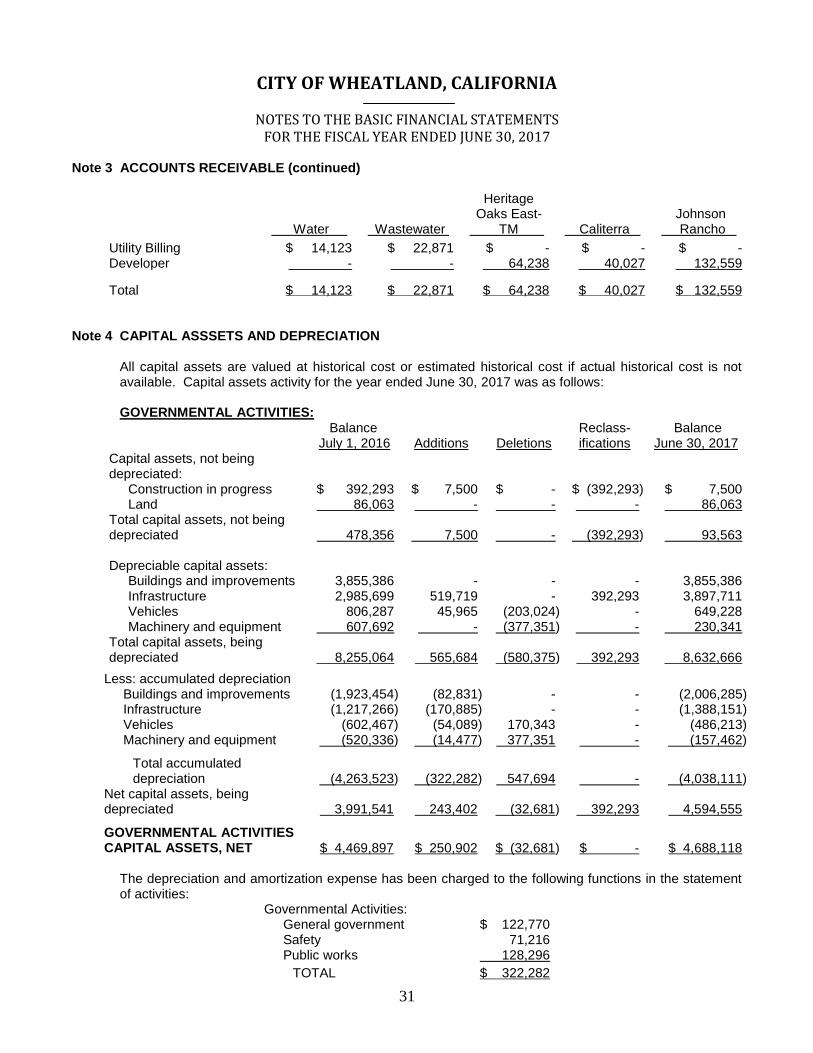
31
CITY OF WHEATLAND, CALIFORNIA
NOTES TO THE BASIC FINANCIAL STATEMENTS FOR THE FISCAL YEAR ENDED JUNE 30, 2017
Note 3 ACCOUNTS RECEIVABLE (continued)
Water . Wastewater .
Heritage Oaks East-
TM .
Caliterra . Johnson
Rancho .
Utility Billing Developer
$ 14,123 -
$ 22,871 -
$ - 64,238
$ - 40,027
$ - 132,559
Total $ 14,123 $ 22,871 $ 64,238 $ 40,027 $ 132,559
Note 4 CAPITAL ASSSETS AND DEPRECIATION
All capital assets are valued at historical cost or estimated historical cost if actual historical cost is not available. Capital assets activity for the year ended June 30, 2017 was as follows: GOVERNMENTAL ACTIVITIES:
Balance July 1, 2016.
Additions.
Deletions
Reclass- ifications
Balance June 30, 2017.
Capital assets, not being depreciated:
Construction in progress Land
$ 392,293 86,063
$ 7,500 -
$ - -
$ (392,293) -
$ 7,500 86,063
Total capital assets, not being depreciated 478,356 7,500 - (392,293) 93,563 Depreciable capital assets:
Buildings and improvements Infrastructure Vehicles Machinery and equipment
3,855,386 2,985,699
806,287 607,692
- 519,719 45,965
-
- -
(203,024) (377,351)
- 392,293
- -
3,855,386 3,897,711
649,228 230,341
Total capital assets, being depreciated 8,255,064 565,684 (580,375) 392,293 8,632,666
Less: accumulated depreciation Buildings and improvements Infrastructure Vehicles Machinery and equipment
Total accumulated depreciation
(1,923,454) (1,217,266)
(602,467) (520,336)
(4,263,523)
(82,831)
(170,885) (54,089)
(14,477)
(322,282)
- -
170,343 377,351
547,694
- - -
-
-
(2,006,285) (1,388,151)
(486,213) (157,462)
(4,038,111)
Net capital assets, being depreciated 3,991,541 243,402 (32,681) 392,293 4,594,555
GOVERNMENTAL ACTIVITIES CAPITAL ASSETS, NET
$ 4,469,897
$ 250,902
$ (32,681)
$ -
$ 4,688,118
The depreciation and amortization expense has been charged to the following functions in the statement of activities:
Governmental Activities: General government Safety Public works
$ 122,770
71,216 128,296
TOTAL $ 322,282

32
CITY OF WHEATLAND, CALIFORNIA
NOTES TO THE BASIC FINANCIAL STATEMENTS FOR THE FISCAL YEAR ENDED JUNE 30, 2017
Note 4 CAPITAL ASSSETS AND DEPRECIATION (Continued)
BUSINESS-TYPE ACTIVITIES:
Balance July 1, 2016.
Additions.
Deletions
Balance June 30, 2017.
WATER FUND: Capital assets, not being depreciated:
Land
$ 16,969
$ -
$ -
$ 16,969
Total capital assets, not being depreciated 16,969 - - 16,969
Capital assets, being depreciated: Water system improvements Well rehab projects Buildings and improvements Vehicles Machinery and equipment
4,290,021 710,425 113,045 76,891
404,137
- 21,365
- -
-
(2,681) - -
(50,697) (9,399)
4,287,340 731,790 113,045 26,194
394,738
Total capital assets, being depreciated 5,594,519 21,365 (62,777) 5,553,107
Less: accumulated depreciation Water system improvements Well rehab projects Buildings and improvements Vehicles Machinery and equipment
(1,585,144)
(371,138) (39,071) (69,191)
(244,799)
(111,551) (32,665) (6,123) (2,200)
(25,342)
2,681 - -
50,697 9,399
(1,694,014)
(403,803) (45,194) (20,694)
(260,742)
Total accumulated depreciation (2,309,343) (177,881) 62,777 (2,424,447)
Net capital assets, being depreciated 3,285,176 (156,516) - 3,128,660
TOTAL WATER FUND, NET $ 3,302,145 $ (156,516) $ - $ 3,145,629
WASTEWATER FUND: Capital assets, not being depreciated:
Construction in progress Land
$ 899,328 16,969
$ - -
$ - -
$ 899,328 16,969
Total capital assets, not being depreciated 916,296 - - 916,296
Capital assets, being depreciated: Wastewater system improvements Well rehab projects Buildings and improvements Vehicles Machinery and equipment
5,548,168 211,530 113,045 13,065
191,261
- - - -
7,020
- - -
(358) (7,276)
5,548,168 211,530 113,045 12,707
191,005
Total capital assets, being depreciated 6,077,069 7,020 (7,634) 6,076,455
Less: accumulated depreciation Wastewater system improvements Well rehab projects Buildings and improvements Vehicles Machinery and equipment
(2,380,620)
(115,300) (39,072) (5,366)
(151,298)
(277,408)
(8,444) (6,123) (2,200)
(18,218)
- - -
358 7,276
(2,658,028)
(123,744) (45,195) (7,208)
(162,240)
Total accumulated depreciation (2,691,656) (312,393) 7,634 (2,996,415)
Net capital assets, being depreciated 3,385,413 (305,373) - 3,080,040
TOTAL WASTEWATER FUND, NET $ 4,301,710 $ (305,373) $ - $ 3,996,337
BUSINESS-TYPE ACTIVITIES CAPITAL ASSETS, NET $ 7,603,855 $ (461,899)
$ - $ 7,141,966

33
CITY OF WHEATLAND, CALIFORNIA
NOTES TO THE BASIC FINANCIAL STATEMENTS FOR THE FISCAL YEAR ENDED JUNE 30, 2017
Note 4 CAPITAL ASSSETS AND DEPRECIATION (Continued)
The depreciation and amortization expense has been charged to the following functions in the statement of activities:
Water Enterprise Fund Wastewater Enterprise Fund
$ 177,881 312,393
TOTAL $ 490,274
Note 5 ACCOUNTS PAYABLE Accounts payable in the governmental funds are composed of payables to various vendors during the normal course of business. At June 30, 2017, the most significant general fund payable was the payable to Yuba County LAFCO totaling $16,296.50. The most significant non-major fund payable at June 30, 2017 was a $3,854.36 payable to Yuba Sutter Transit from the Transportation Development Fund.
Note 6 LONG-TERM DEBT The following is a summary of long-term debt transactions for the year ended June 30, 2017:
Balance July 1, 2016.
Additions
Deletions
Balance June 30, 2017.
Due in One Year.
GOVERNMENTAL ACTIVITIES:
Compensated absences Payable to developer Obligations under capital lease
$ 38,536 128,338
73,240
$ 21,307 -
-
$ - -
(8,903)
$ 59,843 128,338
64,337
$ 59,843 -
9,378
TOTAL GOVERNMENTAL ACTIVITIES $ 240,114 $ 21,307 $ (8,903) $ 252,518 $ 69,221
BUSINESS-TYPE ACTIVITIES:
Water Enterprise Fund:
Compensated absences United States department of Agriculture (USDA) Loans: Water loan #1 (dated May 8, 2000) Water loan #3 (dated October 31, 2002) Wheatland Westside Infra- structure Funding Agreement Obligations under capital lease
$ 19,666
1,646,000
947,000
87,769 54,931
$ 1,900
-
-
- -
$ -
(35,000)
(20,000)
- (6,677)
$ 21,566
1,611,000
927,000
87,769 48,254
$ 21,566
36,000
21,000
- 7,034
TOTAL WATER ENTERPRISE FUND 2,755,366 1,900 (61,677) 2,695,589 85,600

34
CITY OF WHEATLAND, CALIFORNIA
NOTES TO THE BASIC FINANCIAL STATEMENTS FOR THE FISCAL YEAR ENDED JUNE 30, 2017
Note 6 LONG-TERM DEBT (Continued)
Wastewater Enterprise Fund:
Compensated absences United States department of Agriculture (USDA) Loans: Wastewater loan (dated May 8, 2007) Wheatland Westside Infra- structure Funding Agreement Obligations under capital lease
19,666
3,565,900
491,822 54,931
1,900
-
- -
-
(58,800) -
(6,677)
21,566
3,507,100
491,822 48,254
21,566
61,200
- 7,034
TOTAL WASTEWATER ENTERPRISE FUND 4,132,319 1,900 (65,477) 4,068,742 89,800
TOTAL BUSINESS- TYPE ACTIVITIES $ 6,887,685 $ 3,800 $(127,154) $ 6,764,331 $ 175,400
Long-term debt as of June 30, 2017 is comprised of the following individual obligations: GOVERNMENTAL ACTIVITIES: Due to developer pursuant to a reimbursement agreement dated May 20, 1992. Payments
are made periodically from storm drainage impact fees collected and does not include interest.
On April 21, 2008, the City entered into a lease agreement for the purchase and
installation of the City Hall. The lease is due in semi-annual installments including interest at 5.27%, through April 2023. The lease has been allocated as follows: general government, 40%; water operation, 30%; wastewater operation 30%.
BUSINESS-TYPE ACTIVITIES: Water Enterprise Fund: On May 8, 2000, the City obtained a Rural Utilities Service loan from the United States
Department of Agriculture – Rural Development. The loan is to be repaid through Certificates of Participation issued December 18, 2001 with semi-annual payments due including interest at 4.5% through December 2041.
On October 31, 2002, the City obtained a Rural Utilities Service loan from the United
States Department of Agriculture – Rural Development. The loan is to be repaid through Certificates of Participation with semi-annual payments due with interest at 4.5% through December 2041.
$ 128,338
$ 64,337
$ 1,611,000
$ 927,000 The City, the School District, and Forecast Homes entered into the Wheatland Westside
Infrastructure Funding Agreement (WWIFA). The agreement requires the City to make payments to the School District and Forecast Homes as development impact fees are collected. This agreement expires October 29, 2017.
This amount represents the allocated 30% share of the lease agreement dated April 21,
2008 for the purchase and installation of the City Hall. The lease is due in semi-annual installments including interest at 5.27% through April 2023.
$ 87,769
$ 48,254

35
CITY OF WHEATLAND, CALIFORNIA
NOTES TO THE BASIC FINANCIAL STATEMENTS FOR THE FISCAL YEAR ENDED JUNE 30, 2017
Note 6 LONG-TERM DEBT (Continued)
Wastewater Enterprise Fund: On October 31, 2002, the City obtained a Rural Utilities Service loan from the United
States Department of Agriculture – Rural Development. The loan is to be repaid through Certificates of Participation with semi-annual payments due with interest at 4.5% through December 2041.
The City, the School District, and Forecast Homes entered into the Wheatland Westside
Infrastructure Funding Agreement (WWIFA). The agreement requires the City to make payments to the School District and Forecast Homes as development impact fees are collected. This agreement expires October 29, 2017.
This amount represents the allocated 30% share of the lease agreement dated April 21,
2008 for the purchase and installation of the City Hall. The lease is due in semi-annual installments including interest at 5.27% through April 2023.
$ 3,507,100
$ 491,822
$ 48,254
Debt service requirements for the long-term debt are due as follows: GOVERNMENTAL ACTIVITIES: Obligations under capital lease:
Fiscal year Ended
June 30, City Hall Lease
Principal . Interest .
2018 2019 2020 2021 2022 2023
$ 9,378 9,879
10,406 10,962 11,547
12,164
$ 3,269 2,768 2,240 1,685 1,099
483
$ 64,337 $ 11,544
Fiscal year ended
June 30,
United States Department of Agriculture . Water Loan 1 . Water Loan 3 . Wastewater Loan . Total .
Principal . Interest . Principal . Interest . Principal . Interest . Principal . Interest .
2018 2019 2020 2021 2022
2023 – 27 2028 – 32 2033 – 37 2038 – 42 2043 – 46
$ 36,000 38,000 40,000 41,000 43,000
247,000 307,000 382,000 477,000
-
$ 71,685 70,020 68,265 66,443 64,552
291,173 229,027 151,785
55,598 -
$ 21,000 22,000 23,000 24,000 25,000
142,000 176,000 220,000 274,000
-
$ 41,243 40,275 39,263 38,205 37,102
167,310 131,625
87,300 31,950
-
$ 61,200 63,800 66,400 69,100 72,000
407,000 498,100 609,700 746,300
913,500
$ 144,668 142,143 139,512 136,773 133,922 622,537 531,386 419,818 283,260
116,094
$ 118,200 123,800 129,400 134,100 444,000 870,000
1,074,100 1,327,700
910,300 913,500
$ 257,595 252,438 247,039 241,420 609,527
1,004,474 796,977 540,418 286,950
116,094
$1,611,000 $1,068,548 $ 927,000 $614,273 $3,507,100 $2,670,113 $6,045,100 $4,352,932

36
CITY OF WHEATLAND, CALIFORNIA
NOTES TO THE BASIC FINANCIAL STATEMENTS FOR THE FISCAL YEAR ENDED JUNE 30, 2017
Note 6 LONG-TERM DEBT (Continued)
Obligations under capital lease:
Fiscal year ended
June 30,
City Hall Lease .
Water Fund . Wastewater Fund . Total .
Principal . Interest . Principal . Interest . Principal . Interest .
2018 2019 2020 2021 2022 2023
$ 7,034 7,409 7,805 8,222 8,660
9,123
$ 2,451 2,076 1,680 1,264
825 362
$ 7,034 7,409 7,805 8,222 8,660
9,123
$ 2,451 2,076 1,680 1,264
825 362
$ 14,067 14,819 15,610 16,443 17,321
18,246
$ 4,903 4,152 3,361 2,527 1,649
724
$ 48,253 $ 8,658 $ 48,253 $ 8,658 $ 96,506 $ 17,316
ASSETS ACQUIRED UNDER CAPITAL LEASE: The assets acquired under capital lease are as follows for the fiscal year ended June 30, 2017:
Governmental Activities .
Business-type activities .
Water
Fund . Wastewater
Fund . TOTAL .
City hall building Less: accumulated depreciation
$ 130,000 (20,800)
$ 97,500 (41,437)
$ 97,500 (41,437)
$ 325,000 (103,674)
CAPITAL ASSET UNDER CAPITAL LEASE, NET $ 109,200 $ 56,063 $ 56,063 $ 221,326
Note 7 FUND BALANCE
The following funds had deficit fund balances as of June 30, 2017:
Fund . Deficit . Special Revenue Funds (Non-major):
Bear River Levee Caliterra Ranch Heritage Oaks East Public Meeting Facilities Fire Department Facilities
$ (43,560)
(24,899) (31,599)
(191,809) (51,048)

37
CITY OF WHEATLAND, CALIFORNIA
NOTES TO THE BASIC FINANCIAL STATEMENTS FOR THE FISCAL YEAR ENDED JUNE 30, 2017
Note 8 EXPENDITURES IN EXCESS OF APPROPRIATIONS
Not all of the City’s funds have a budget. Of the funds that have a budget, the following had expenditures in excess of the appropriations at June 30, 2017:
Expenditures
and transfers . Appropriations . Deficit . Major funds:
General Construction
Non-major special revenue funds: Lighting and Landscaping Districts:
Wheatland Ryantown
$ 2,305,864 527,289
60,144
$ 2,069,700 365,600
55,400
$ (236,164) (161,689)
(4,744)
Note 9 INTERFUND BLANCES AND TRANSFERS During the course of operations, transactions occur between funds to account for goods received or services rendered. These receivables and payables are classified as due from or due to other funds. In addition, when funds overdraw their share of pooled cash, the receivables and payables are also classified as due from or due to other funds. Summaries of the interfund balances for the fiscal year ended June 30, 2017 are as follows:
Fund .
Due From Other
Funds .
Due To Other
Funds . Major funds:
General Water Fund Wastewater Fund
Non-major funds: Special Revenue funds
Agency Funds
$ 319,128
- 414,765
256,640
-
$ 164,765
250,000 -
356,698 219,070
$ 990,533 $ 990,533 Transfers are used to (1) move revenues from the fund that statute or budget requires to collect them to the fund that statute or budget requires to expend them, and (2) subsidize various operations, and (3) reimburse various funds for services provided to other funds. Interfund transfers for the year ended June 30, 2017 were as follows:
Fund . Transfers In . Transfers Out . Major funds:
General Construction Water Fund Wastewater Fund
Non-major funds: Special Revenue funds
Agency Funds
$ 487,984
31,398 - -
330,439 48,089
$ 385,648
- 84,914 89,566
296,666
41,116
$ 897,910 $ 897,910

38
CITY OF WHEATLAND, CALIFORNIA
NOTES TO THE BASIC FINANCIAL STATEMENTS FOR THE FISCAL YEAR ENDED JUNE 30, 2017
Note 10 JOINT VENTURE
The City is a member of the Public Agency Risk Sharing Authority of California (PARSAC), a joint powers authority, for workers’ compensation and liability insurance purposes. PARSAC is organized under a joint powers agreement pursuant to the California Government Code. The purpose of PARSAC is to arrange and administer programs of insurance of risk pooling of self-insured losses and to purchase excess liability coverage. An annual audit of PARSAC is available at the Authority’s offices at 1525 Response Road, Suite One, Sacramento, California 95815 or at its website at www.parsac.org. There have been no significant reductions in insurance coverage in the prior year; and, settlements have not exceeded the insurance coverage for each of the past three fiscal years. The City of Wheatland and the Plumas Brophy Fire District create a joint powers authority called the Wheatland Fire Authority. Its purpose is to serve the City of Wheatland, whether developed or undeveloped and surrounding unincorporated area as a joined fire fighting organization.
Note 11 FUND BALANCE / NET POSITION RECLASSIFICATIONS Fund balance reclassifications:
General Fund .
Special Revenue
Funds .
Capital Project
Funds . Agency
Funds .
Previously presented as a General fund: Impact Fees Heritage Oaks West – DeValentine Heritage Oaks East – TM Heritage Oaks East – Trivest Wade Development – Jones Ranch
$ 354
1,137 65,978 4,885
81,498
$ (354)
- - -
-
$ -
- - - -
$ -
(1,137) (65,978) (4,885)
(81,498) Previously presented as a Capital Project fund:
Emergency Fire Storm Drainage Road Circulation Community Center City Hall Regional Bypass Traffic Safety Equipment Infrastructure Committee Facilities:
Law Enforcement Public Works Public Meeting Fire Department Parkland
Community Facilities District: Caliterra Heritage Oaks East
- - - - - - - - -
- - - - -
- -
7,105
37,603 196,611
3,403 149,580
4,190 1,059
3 (298)
342
3,430 (195,252)
(37,420) 12,687
1,683
(31,416)
(7,105)
(37,603) (196,611)
(3,403) (149,580)
(4,190) (1,059)
(3) 298
(342)
(3,430) 195,252 37,420
(12,687)
(1,683) 31,416
- - - - - - - - -
- - - - -
- -
Fund balance reclassifications 153,852 152,956 (153,310) (153,498)
FUND BALANCE, June 30, 2016 1,469,994 212,769 24,187 (123,668)
FUND BALANCE, July 1, 2016 reclassified $ 1,623,846 $ 365,725 $ (129,123) $ (277,166)

39
CITY OF WHEATLAND, CALIFORNIA
NOTES TO THE BASIC FINANCIAL STATEMENTS FOR THE FISCAL YEAR ENDED JUNE 30, 2017
Note 11 FUND BALANCE / NET POSITION RECLASSIFICATIONS (continued)
Net position reclassifications:
Governmental Funds .
Business-type
Funds . Total . Agency funds previously presented as Governmental funds:
Heritage Oaks West – DeValentine Heritage Oaks East – TM Heritage Oaks East – Trivest Caliterra
$ 1,137
65,978 4,885
81,498
$ -
- -
-
$ 1,137
65,978 4,885
81,498
Net position reclassifications 153,498 - 153,498
NET POSITION, June 30, 2016 5,936,733 8,486,668 14,423,401
NET POSITION, July 1, 2016 reclassified $ 6,090,231 $ 8,486,668 $ 14,576,899
Note 12 PRIOR PERIOD ADJUSTMENT
An adjustment was made in the current year to eliminate the prior year’s payroll clearing fund balance. An analysis of the Community Development Block Grant loans receivable disclosed the recorded balance was understated.
Note 13 SUBSEQUENT EVENT
Westside Infrastructure Funding Agreement As of October 29, 2017, this agreement expired. The City is no longer required to make payments to the School District or Forecast Homes. Road Repair and Accountability Act of 2017 (SB1) The Road Repair and Accountability Act imposes various gas and vehicle registration taxes beginning November 1, 2017. There is a growing movement to repeal the Act. Should this occur, the City will lose approximately $70,000 in Gas Tax revenue that is included in the fiscal year 2017-18 budget. Other than these, management of the City has evaluated the events subsequent to June 30, 2017 for disclosure and has determined that as of December 27, 2017 there are no material subsequent events that should be disclosed. If events requiring disclosure have occurred between the balance sheet date and the date the financial statements were available to be issued they would be disclosed here.
Note 14 OTHER NOTES The employees of the City accumulate retirement benefits through a defined contribution plan with the ICMA Retirement Corporation. The City makes bi-weekly contributions to a 401(a) plan amounting to 6% (General Employees) or 7% (Public Safety Employees) of the employee’s base salary`. A matching 3% contribution is required from the employee. Employees are 100% vested (employer portion) at five years of service, with the exception of those employees over 65 years old who are fully vested from the month of employment. The plan is administered and held in trust for the exclusive benefit of participants and are not assets of the City. The balance at June 30, 2017 is $771,544.59.

40
CITY OF WHEATLAND
REQUIRED SUPPLEMENTARY INFORMATION FOR THE FISCAL YEAR ENDED
JUNE 30, 2017

40
CITY OF WHEATLAND BUDGETARY COMPARISON SCHEDULE – GENERAL FUND JUNE 30, 2017
Budget Amounts . Variance
with Final Original . Final . Actual . Budget . REVENUES:
Tax revenues Intergovernmental revenues Licenses, fees and permits Charges for services Fines, forfeitures and penalties Reimbursements and refunds Use of money and property Grant revenue Other revenue
$ 1,112,500
18,000 116,000
600 10,500 3,000
58,000 30,000
13,000
$ 1,112,500
18,000 116,000
600 10,500 3,000
58,000 30,000
13,000
$ 1,517,160
16,434 102,418
11 16,475
229 60,694 76,266
50,527
$ 404,660
(1,566) (13,852)
(589) 5,975
(2,771) 2,694
46,266 37,527
TOTAL REVENUES 1,361,600 1,361,600 1,840,214 478,614
EXPENDITURES: Current:
General government Public safety Community development Public works Parks & recreation
Debt service: Principal Interest Capital outlay
413,400 961,700 215,000
- 56,900
6,800 5,500
113,000
413,400 961,700 215,000
- 56,900
6,800 5,500
113,000
454,235 1,094,560
235,532 -
69,777
8,903 3,744
53,465
(40,835) (132,860)
(20,532) -
(12,877)
(2,103) 1,756
59,535
TOTAL EXPENDITURES 1,772,300 1,772,300 1,920,216 (147,916) EXCESS OF REVENUES OVER EXPENDITURES
(410,700)
(410,700)
(80,002)
330,698
OTHER FINANCING SOURCES (USES): Transfers in Transfers out
250,100 (36,000)
250,100 (36,000)
487,984 (385,648)
237,884 (349,648)
TOTAL OTHER FINANCING
214,100
214,100
102,336
(111,764)
NET CHANGE IN FUND BALANCES
(196,600)
(196,600)
22,334
$ 218,934
FUND BALANCE, July 1 restated: 1,610,634 1,610,634 1,610,634
FUND BALANCE, June 30
$ 1,414,034
$ 1,414,034
$ 1,632,968

41
CITY OF WHEATLAND BUDGETARY COMPARISON SCHEDULE –CONSTRUCTION FUND JUNE 30, 2017
Budget Amounts . Variance
with Final Original . Final . Actual . Budget . REVENUES:
Tax revenues Intergovernmental revenues Licenses, fees and permits Charges for services Fines, forfeitures and penalties Reimbursements and refunds Use of money and property Grant revenue Other revenue
$ -
- - - - - -
364,600 7,000
$ -
- - - - - -
364,600 7,000
$ -
- - - - - -
625,014 -
$ -
- - - - - -
260,414 (7,000)
TOTAL REVENUES 371,600 371,600 625,014 253,414
EXPENDITURES: Current:
General government Public safety Community development Public works Parks & recreation
Debt service: Principal Interest Capital outlay
- - - - - - - -
365,600
- - - - - - - -
365,600
7,570 - - - - - - -
519,719
(7,570) - - - - - - -
(154,119)
TOTAL EXPENDITURES 365,600 365,600 527,289 (161,689) EXCESS OF REVENUES OVER EXPENDITURES
6,000
6,000
97,725
91,725
OTHER FINANCING SOURCES (USES): Transfers in Transfers out
- -
- -
31,398 -
31,398 -
TOTAL OTHER FINANCING
-
-
31,398
31,398
NET CHANGE IN FUND BALANCES
6,000
6,000
129,123
$ 123,123
FUND BALANCE, July 1: (129,123) (129,123) (129,123)
FUND BALANCE, June 30 $ (123,123) $ (123,123)
$ -

42
CITY OF WHEATLAND SUPPLEMENTARY INFORMATION SECTION
JUNE 30, 2017

42
CITY OF WHEATLAND COMBINING BALANCE SHEET NONMAJOR SPECIAL REVENUE FUNDS JUNE 30, 2017
CDBG Grant 1989 Fund .
Supplement Law
Enforcement
Vehicle
Abatement
General Plan
Update . ASSETS:
Cash and cash equivalents Receivables:
Accounts receivable Loans receivable Due from other governments
Due from other funds
$ -
-
78,826 -
-
$ 8,621
4,214
- -
-
$ -
- - -
-
$ 21,237
- - -
-
TOTAL ASSETS $ 78,826 $ 12,835 $ - $ 21,237 LIABILITIES:
Accounts payable Accrued payroll liabilities Deferred revenue Due to other funds
$ - - -
-
$ - - -
-
$ - - -
-
$ - - -
-
TOTAL LIABILITIES - - - - FUND BALANCES:
Non-spendable for long-term receivables
Committed: Subsequent year’s expenditures
Unassigned
78,826
- -
-
- 12,835
-
- -
-
- 21,237
TOTAL FUND BALANCES 78,826 12,835 - 21,237
TOTAL LIABILITIES AND FUND BALANCES $ 78,826 $ 12,835 $ - $ 21,237

43
CITY OF WHEATLAND COMBINING BALANCE SHEET (Continued) NONMAJOR SPECIAL REVENUE FUNDS (Continued) JUNE 30, 2017
Gas
Taxes .
Transportation Development Act Fund .
Bear River Levee .
Wheatland Community Gardens .
ASSETS: Cash and cash equivalents Receivables:
Accounts receivable Loans receivable Due from other governments
Due from other funds
$ 46,373
- - -
-
$ 48,370
3,854
- -
-
$ -
- - -
-
$ 12,074
- - -
-
TOTAL ASSETS $ 46,373 $ 52,224 $ - $ 12,074 LIABILITIES:
Accounts payable Accrued payroll liabilities Deferred revenue Due to other funds
$ 3,475 2,780
- -
$ 3,854 - -
-
$ - - -
43,560
$ - - -
-
TOTAL LIABILITIES 6,255 3,854 43,560 - FUND BALANCES:
Non-spendable for long-term receivables
Committed: Subsequent year’s expenditures
Unassigned
-
- 40,118
-
- 48,370
-
- (43,560)
-
- 12,074
TOTAL FUND BALANCES 40,118 48,370 (43,560) 12,074
TOTAL LIABILITIES AND FUND BALANCES $ 46,373 $ 52,224 $ - $ 12,074

44
CITY OF WHEATLAND COMBINING BALANCE SHEET (Continued) NONMAJOR SPECIAL REVENUE FUNDS (Continued) JUNE 30, 2017
CDBG Loan Fund 90.
Caliterra Ranch
Assessment District .
Vehicle and
Equipment .
Pumpkin Patch Joint
Admission . ASSETS:
Cash and cash equivalents Receivables:
Accounts receivable Loans receivable Due from other governments
Due from other funds
$ -
-
104,706 -
-
$ 159
- - -
-
$ 73,307
- - -
-
$ -
- - -
-
TOTAL ASSETS $ 104,706 $ 159 $ 73,307 $ - LIABILITIES:
Accounts payable Accrued payroll liabilities Deferred revenue Due to other funds
$ - - -
-
$ - - -
-
$ - - -
-
$ - - -
24,899
TOTAL LIABILITIES - - - 24,899 FUND BALANCES:
Non-spendable for long-term receivables
Committed: Subsequent year’s expenditures
Unassigned
104,706
- -
-
- 159
-
- 73,307
-
- (24,899)
TOTAL FUND BALANCES 104,706 159 73,307 (24,899)
TOTAL LIABILITIES AND FUND BALANCES $ 104,706 $ 159 $ 73,307 $ (24,899)

45
CITY OF WHEATLAND COMBINING BALANCE SHEET (Continued) NONMAJOR SPECIAL REVENUE FUNDS (Continued) JUNE 30, 2017
Heritage Oaks East Assessment District .
Lighting and Landscaping Districts .
Emergency Fire .
Wheatland Ryantown .
Park Place .
ASSETS: Cash and cash equivalents Receivables:
Accounts receivable Loans receivable Due from other governments
Due from other funds
$ -
- - -
-
$ 1,862
1,203
- -
-
$ 2,019
385
- -
-
$ 7,140
- - -
-
TOTAL ASSETS $ - $ 3,065 $ 2,404 $ 7,140 LIABILITIES:
Accounts payable Accrued payroll liabilities Deferred revenue Due to other funds
$ - - -
31,599
$ 998 1,394
- -
$ 1,092 1,311
- -
$ - - -
-
TOTAL LIABILITIES 31,599 2,392 2,403 - FUND BALANCES:
Non-spendable for long-term receivables
Committed: Subsequent year’s expenditures
Unassigned
-
- (31,599)
-
- 673
-
- 1
-
- 7,140
TOTAL FUND BALANCES (31,599) 673 1 7,140
TOTAL LIABILITIES AND FUND BALANCES $ - $ 3,065 $ 2,404 $ 7,140

46
CITY OF WHEATLAND COMBINING BALANCE SHEET (Continued) NONMAJOR SPECIAL REVENUE FUNDS (Continued) JUNE 30, 2017
Storm
Drainage .
Road
Circulation.
Community Center .
City
Hall . ASSETS:
Cash and cash equivalents Receivables:
Accounts receivable Loans receivable Due from other governments
Due from other funds
$ 46,190
- - -
-
$ 116,098
- - -
106,640
$ -
- - -
-
$ 738
- - -
150,000
TOTAL ASSETS $ 46,190 $ 222,738 $ - $ 150,738 LIABILITIES:
Accounts payable Accrued payroll liabilities Deferred revenue Due to other funds
$ - - -
-
$ - - -
-
$ - - -
-
$ - - -
-
TOTAL LIABILITIES - - - - FUND BALANCES:
Non-spendable for long-term receivables
Committed: Subsequent year’s expenditures
Unassigned
-
- 46,190
-
- 222,738
-
- -
-
- 150,738
TOTAL FUND BALANCES
46,190 222,738 - 150,738
TOTAL LIABILITIES AND FUND BALANCES
$ 46,190
$ 222,738
$ -
$ 150,738
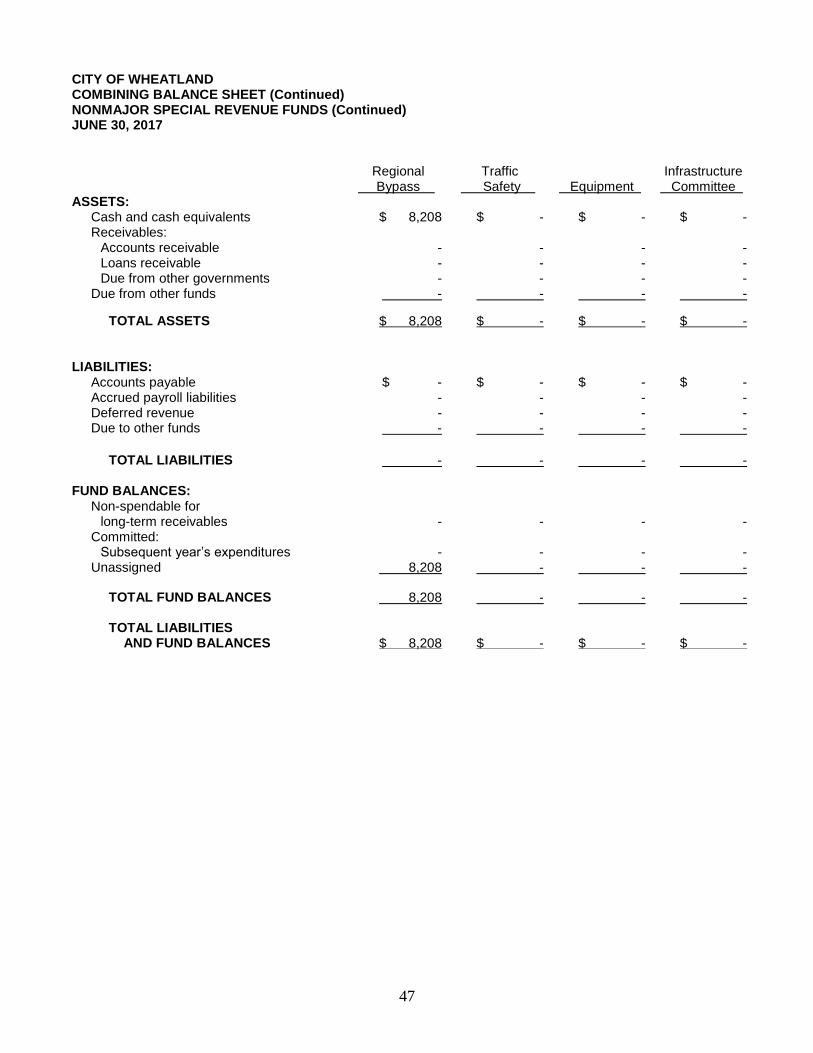
47
CITY OF WHEATLAND COMBINING BALANCE SHEET (Continued) NONMAJOR SPECIAL REVENUE FUNDS (Continued) JUNE 30, 2017
Regional
Bypass .
Traffic
Safety .
Equipment . Infrastructure
Committee . ASSETS:
Cash and cash equivalents Receivables:
Accounts receivable Loans receivable Due from other governments
Due from other funds
$ 8,208
- - -
-
$ -
- - -
-
$ -
- - -
-
$ -
- - -
-
TOTAL ASSETS $ 8,208 $ - $ - $ - LIABILITIES:
Accounts payable Accrued payroll liabilities Deferred revenue Due to other funds
$ - - -
-
$ - - -
-
$ - - -
-
$ - - -
-
TOTAL LIABILITIES - - - - FUND BALANCES:
Non-spendable for long-term receivables
Committed: Subsequent year’s expenditures
Unassigned
-
- 8,208
-
- -
-
- -
-
- -
TOTAL FUND BALANCES 8,208 - - -
TOTAL LIABILITIES AND FUND BALANCES
$ 8,208
$ -
$ -
$ -

48
CITY OF WHEATLAND COMBINING BALANCE SHEET (Continued) NONMAJOR SPECIAL REVENUE FUNDS (Continued) JUNE 30, 2017
Facilities .
Law Enforce- ment .
Public
Works .
Public
Meeting .
Fire
Department
Parkland . ASSETS:
Cash and cash equivalents Receivables:
Accounts receivable Loans receivable Due from other governments
Due from other funds
$ 1,292
- - -
-
$ 4,107
- - -
-
$ 8,191
- - -
-
$ 5,592
- - -
-
$ 12,750
- - -
-
TOTAL ASSETS $ 1,292 $ 4,107 $ 8,191 $ 5,592 $ 12,750 LIABILITIES:
Accounts payable Accrued payroll liabilities Deferred revenue Due to other funds
$ - - -
-
$ - - -
-
$ - - -
200,000
$ - - -
56,640
$ - - -
-
TOTAL LIABILITIES - - 200,000 56,640 - FUND BALANCES:
Non-spendable for long-term receivables
Committed: Subsequent year’s expenditures
Unassigned
-
- 1,292
-
- 4,107
-
- (191,809)
-
- (51,048)
-
- 12,750
TOTAL FUND BALANCES 1,292 4,107 (191,809) (51,048) 12,750
TOTAL LIABILITIES AND FUND BALANCES
$ 1,292
$ 4,107
$ 8,191
$ 5,592
$ 12,750
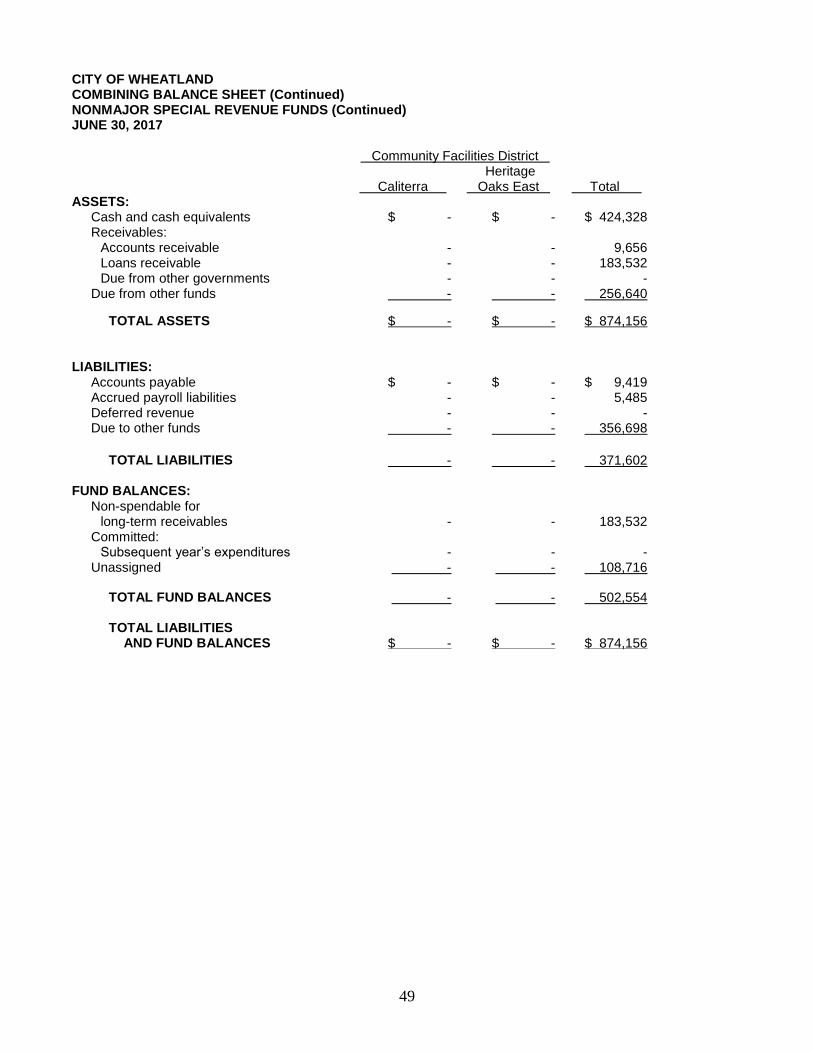
49
CITY OF WHEATLAND COMBINING BALANCE SHEET (Continued) NONMAJOR SPECIAL REVENUE FUNDS (Continued) JUNE 30, 2017
. Community Facilities District .
Caliterra . Heritage
Oaks East .
Total .
ASSETS: Cash and cash equivalents Receivables:
Accounts receivable Loans receivable Due from other governments
Due from other funds
$ -
- - -
-
$ -
- - -
-
$ 424,328
9,656
183,532 -
256,640
TOTAL ASSETS $ - $ - $ 874,156 LIABILITIES:
Accounts payable Accrued payroll liabilities Deferred revenue Due to other funds
$ - - -
-
$ - - -
-
$ 9,419 5,485
- 356,698
TOTAL LIABILITIES - - 371,602 FUND BALANCES:
Non-spendable for long-term receivables
Committed: Subsequent year’s expenditures
Unassigned
-
- -
-
- -
183,532
- 108,716
TOTAL FUND BALANCES - - 502,554
TOTAL LIABILITIES AND FUND BALANCES
$ -
$ -
$ 874,156
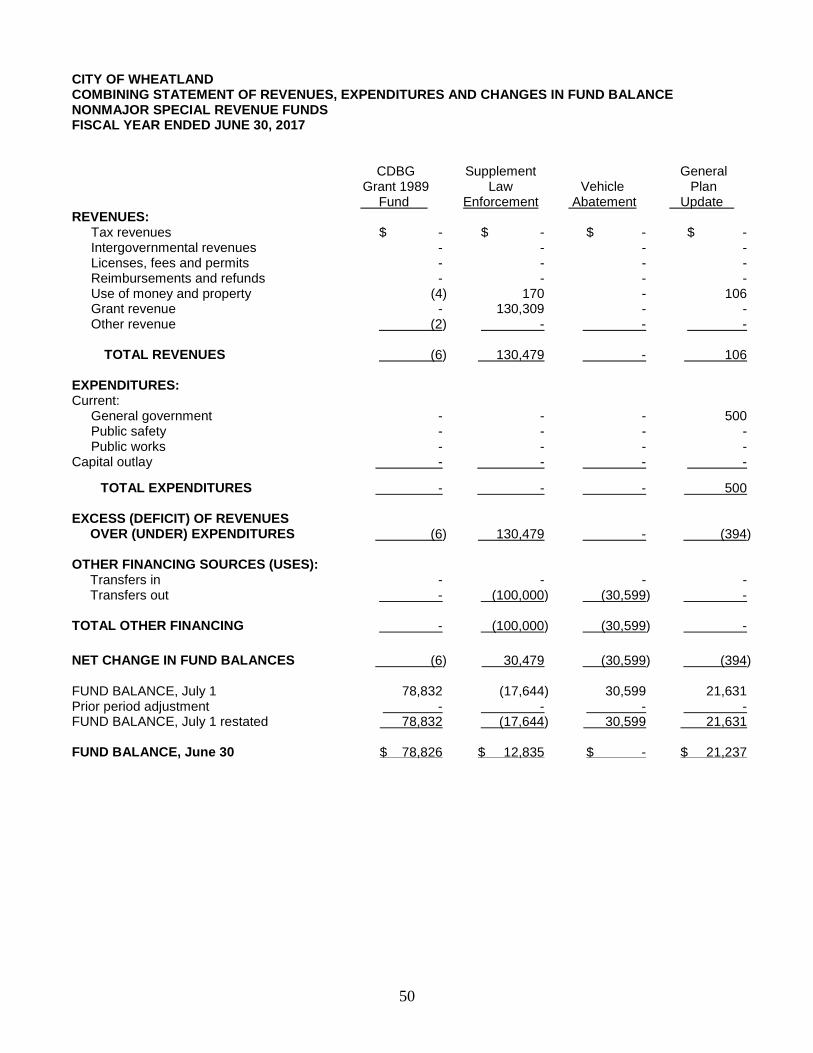
50
CITY OF WHEATLAND COMBINING STATEMENT OF REVENUES, EXPENDITURES AND CHANGES IN FUND BALANCE NONMAJOR SPECIAL REVENUE FUNDS FISCAL YEAR ENDED JUNE 30, 2017
CDBG
Grant 1989 Fund .
Supplement
Law Enforcement
Vehicle Abatement
General
Plan Update .
REVENUES: Tax revenues Intergovernmental revenues Licenses, fees and permits Reimbursements and refunds Use of money and property Grant revenue Other revenue
$ -
- - -
(4) -
(2)
$ -
- - -
170 130,309
-
$ -
- - - - -
-
$ -
- - -
106 -
-
TOTAL REVENUES (6) 130,479 - 106 EXPENDITURES: Current:
General government Public safety Public works
Capital outlay
- - -
-
- - -
-
- - -
-
500 - -
-
TOTAL EXPENDITURES - - - 500 EXCESS (DEFICIT) OF REVENUES OVER (UNDER) EXPENDITURES (6) 130,479
- (394) OTHER FINANCING SOURCES (USES): Transfers in Transfers out
- -
- (100,000)
- (30,599)
- -
TOTAL OTHER FINANCING - (100,000) (30,599) -
NET CHANGE IN FUND BALANCES (6)
30,479 (30,599) (394)
FUND BALANCE, July 1 Prior period adjustment FUND BALANCE, July 1 restated
78,832
- 78,832
(17,644) - (17,644)
30,599 - 30,599
21,631 - 21,631
FUND BALANCE, June 30
$ 78,826
$ 12,835
$ -
$ 21,237

51
CITY OF WHEATLAND COMBINING STATEMENT OF REVENUES, EXPENDITURES AND CHANGES IN FUND BALANCE (Continued) NONMAJOR SPECIAL REVENUE FUNDS (Continued) FISCAL YEAR ENDED JUNE 30, 2017
Gas Taxes .
Transportation Development Act Fund .
Bear River Levee .
Wheatland Community Gardens .
REVENUES: Tax revenues Intergovernmental revenues Licenses, fees and permits Reimbursements and refunds Use of money and property Grant revenue Other revenue
$ 78,715
- - -
(228) -
-
$ -
45,133 - -
(1,914) -
-
$ -
- 1,718
- (218)
- -
$ -
- - -
43 -
400
TOTAL REVENUES 78,487 43,219 1,500 443 EXPENDITURES: Current:
General government Public safety Public works
Capital outlay
25,941 -
134,575 -
- - -
-
- - -
-
81 - -
-
TOTAL EXPENDITURES 160,516 - - 81 EXCESS (DEFICIT) OF REVENUES OVER (UNDER) EXPENDITURES
(82,029) 43,219 1,500
362 OTHER FINANCING SOURCES (USES): Transfers in Transfers out
143,000 (20,770)
- -
- -
- -
TOTAL OTHER FINANCING
122,230 - - -
NET CHANGE IN FUND BALANCES
40,201 (43,219) 1,500 362
FUND BALANCE, July 1 Prior period adjustment FUND BALANCE, July 1 restated
(83)
- (83)
5,151
- 5,151
(45,060) - (45,060)
11,712 - 11,712
FUND BALANCE, June 30
$ 40,118
$ 48,370
$ (43,560)
$ 12,074

52
CITY OF WHEATLAND COMBINING STATEMENT OF REVENUES, EXPENDITURES AND CHANGES IN FUND BALANCE (Continued) NONMAJOR SPECIAL REVENUE FUNDS (Continued) FISCAL YEAR ENDED JUNE 30, 2017
CDBG Loan Fund 90.
Caliterra Ranch
Assessment District .
Vehicle and
Equipment .
Pumpkin Patch Joint
Admission . REVENUES:
Tax revenues Intergovernmental revenues Licenses, fees and permits Reimbursements and refunds Use of money and property Grant revenue Other revenue
$ -
- - - - -
-
$ -
- 156
- - -
-
$ -
- 20,936
- - -
-
$ -
- - - - -
-
TOTAL REVENUES - 156 20,936 - EXPENDITURES: Current:
General government Public safety Public works
Capital outlay
- - -
-
- - -
-
5,882 - -
-
- - -
-
TOTAL EXPENDITURES - - 5,882 - EXCESS (DEFICIT) OF REVENUES OVER (UNDER) EXPENDITURES - 156 15,054 - OTHER FINANCING SOURCES (USES): Transfers in Transfers out
- (29,659)
3 -
58,253 -
- (24,899)
TOTAL OTHER FINANCING (29,659) 3 58,253 (24,899)
NET CHANGE IN FUND BALANCES (29,659) 159 73,307 (24,899)
FUND BALANCE, July 1 Prior period adjustment FUND BALANCE, July 1 restated
131,870
2,495 134,365
-
- -
-
- -
-
- -
FUND BALANCE, June 30
$ 104,706
$ 159
$ 73,307
$ (24,899)

53
CITY OF WHEATLAND COMBINING STATEMENT OF REVENUES, EXPENDITURES AND CHANGES IN FUND BALANCE (Continued) NONMAJOR SPECIAL REVENUE FUNDS (Continued) FISCAL YEAR ENDED JUNE 30, 2017
Heritage Oaks East Assessment District .
Lighting and Landscaping Districts .
Emergency Fire .
Wheatland Ryantown .
Park Place .
REVENUES: Tax revenues Intergovernmental revenues Licenses, fees and permits Reimbursements and refunds Use of money and property Grant revenue Other revenue
$ -
- - - - -
-
$ 50,988
- - -
(130) -
673
$ 42,352
- - -
(36) -
-
$ -
- - -
35 -
-
TOTAL REVENUES - 51,531 42,316 35 EXPENDITURES: Current:
General government Public safety Public works
Capital outlay
27 - -
-
4,647 -
46,702 -
4,590 -
47,303 -
- - -
-
TOTAL EXPENDITURES 27 51,349 51,893 - EXCESS (DEFICIT) OF REVENUES OVER (UNDER) EXPENDITURES (27) 182 (9,577)
35 OTHER FINANCING SOURCES (USES): Transfers in Transfers out
- (31,572)
20,459 (8,795)
10,931 (8,287)
-
- TOTAL OTHER FINANCING
(31,572)
11,664
2,644 -
NET CHANGE IN FUND BALANCES (31,599) 11,846 (6,933)
35
FUND BALANCE, July 1 Prior period adjustment FUND BALANCE, July 1 restated
-
- -
(11,173)
- (11,173)
6,934
- 6,934
7,105
- 7,105
FUND BALANCE, June 30 $ (31,599)
$ 673
$ 1
$ 7,140

54
CITY OF WHEATLAND COMBINING STATEMENT OF REVENUES, EXPENDITURES AND CHANGES IN FUND BALANCE (Continued) NONMAJOR SPECIAL REVENUE FUNDS (Continued) FISCAL YEAR ENDED JUNE 30, 2017
Storm
Drainage .
Road
Circulation .
Community
Center .
City
Hall . REVENUES:
Tax revenues Intergovernmental revenues Licenses, fees and permits Reimbursements and refunds Use of money and property Grant revenue Other revenue
$ -
- 8,725
- 216
- -
$ -
- 25,497
- 630
- -
$ -
- - -
17 -
-
$ -
- 1,446
- 6 -
-
TOTAL REVENUES 8,941 26,127 17 1,450 EXPENDITURES: Current:
General government Public safety Public works
Capital outlay
- - -
-
- - -
-
- - -
-
294 - -
-
TOTAL EXPENDITURES - - - 294 EXCESS (DEFICIT) OF REVENUES OVER (UNDER) EXPENDITURES
8,941
26,127
17
1,158 OTHER FINANCING SOURCES (USES): Transfers in Transfers out
37,603 (37,603)
- -
- (3,420)
- -
TOTAL OTHER FINANCING - - (3,420) -
NET CHANGE IN FUND BALANCES
8,941
26,127
(3,403)
1,158
FUND BALANCE, July 1 Prior period adjustment FUND BALANCE, July 1 restated
37,249 - 37,249
196,611 - 196,611
3,403 - 3,403
149,580 - 149,580
FUND BALANCE, June 30
$ 46,190
$ 222,738
$ -
$ 150,738

55
CITY OF WHEATLAND COMBINING STATEMENT OF REVENUES, EXPENDITURES AND CHANGES IN FUND BALANCE (Continued) NONMAJOR SPECIAL REVENUE FUNDS (Continued) FISCAL YEAR ENDED JUNE 30, 2017
Regional
Bypass .
Traffic
Safety .
Equipment . Infrastructure
Committee . REVENUES:
Tax revenues Intergovernmental revenues Licenses, fees and permits Reimbursements and refunds Use of money and property Grant revenue Other revenue
$ -
- 3,983
- 35
- -
$ -
- - - - -
-
$ -
- - - - -
-
$ -
- - -
(1) -
-
TOTAL REVENUES 4,018 - - (1) EXPENDITURES: Current:
General government Public safety Public works
Capital outlay
- - -
-
- - -
-
- - -
-
- - -
-
TOTAL EXPENDITURES - - - - EXCESS (DEFICIT) OF REVENUES OVER (UNDER) EXPENDITURES
4,018 - - (1) OTHER FINANCING SOURCES (USES): Transfers in Transfers out
- -
- (1,059)
- (3)
299 -
TOTAL OTHER FINANCING - (1,059) (3) 299
NET CHANGE IN FUND BALANCES
4,018 (1,059) (3)
298
FUND BALANCE, July 1 Prior period adjustment FUND BALANCE, July 1 restated
4,190 - 4,190
1,059 - 1,059
3 - 3
(298) - (298)
FUND BALANCE, June 30
$ 8,208
$ -
$ -
$ -

56
CITY OF WHEATLAND COMBINING STATEMENT OF REVENUES, EXPENDITURES AND CHANGES IN FUND BALANCE (Continued) NONMAJOR SPECIAL REVENUE FUNDS (Continued) FISCAL YEAR ENDED JUNE 30, 2017
Facilities . Law
Enforce- ment .
Public
Works .
Public
Meeting .
Fire
Department
Parkland . REVENUES:
Tax revenues Intergovernmental revenues Licenses, fees and permits Reimbursements and refunds Use of money and property Grant revenue Other revenue
$ -
- 945
- 5 -
-
$ -
- 661
- 16
- -
$ -
- - -
23 -
-
$ -
- 5,222
- 20
- -
$ -
- - -
63 -
-
TOTAL REVENUES
950 677 23 5,242 63 EXPENDITURES: Current:
General government Public safety Public works
Capital outlay
- - -
-
- - -
-
- - -
-
- 18,870
- -
- - -
-
TOTAL EXPENDITURES - - - 18,870 - EXCESS (DEFICIT) OF REVENUES OVER (UNDER) EXPENDITURES
950 677
23 (13,628)
63 OTHER FINANCING SOURCES (USES): Transfers in Transfers out
- -
- -
3,420 -
- -
- -
TOTAL OTHER FINANCING - - 3,420 - -
NET CHANGE IN FUND BALANCES
950 677
3,443
(13,628)
63
FUND BALANCE, July 1 Prior period adjustment FUND BALANCE, July 1 restated
342 - 342
3,430 - 3,430
(195,252) -
(195,252)
(37,420) -
(37,420)
12,687 - 12,687
FUND BALANCE, June 30
$ 1,292
$ 4,107
$(191,809)
$ (51,048)
$ 12,750
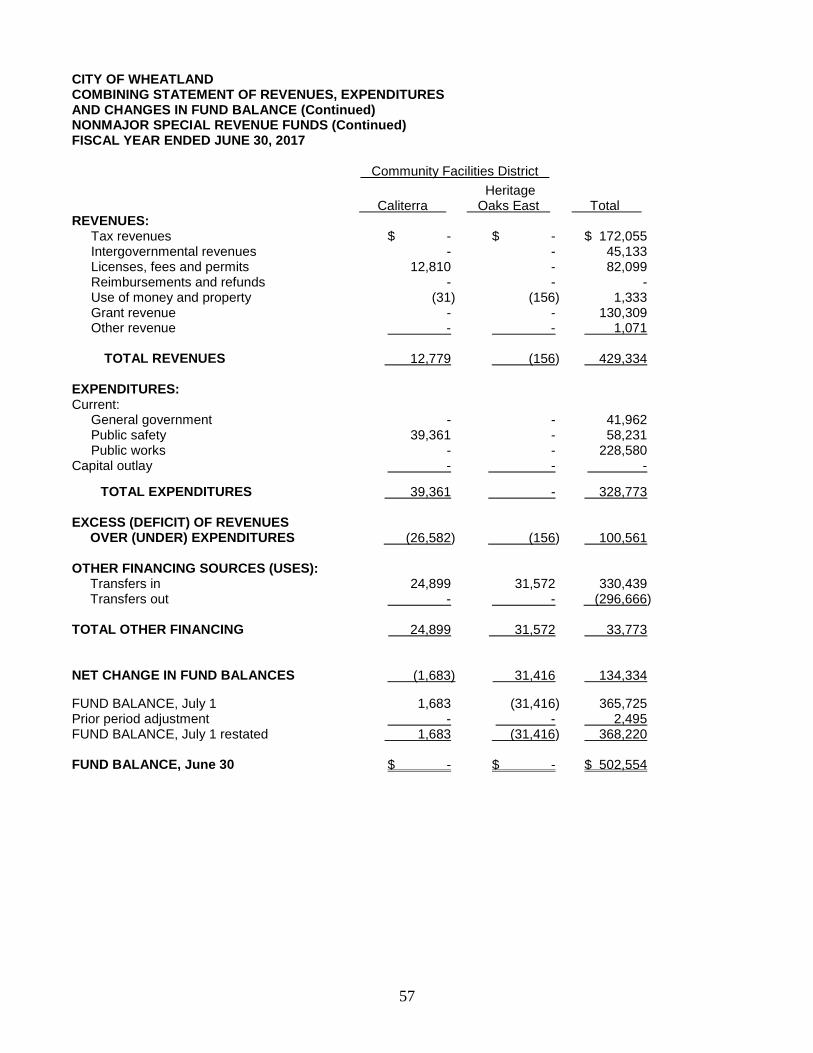
57
CITY OF WHEATLAND COMBINING STATEMENT OF REVENUES, EXPENDITURES AND CHANGES IN FUND BALANCE (Continued) NONMAJOR SPECIAL REVENUE FUNDS (Continued) FISCAL YEAR ENDED JUNE 30, 2017
. Community Facilities District .
Caliterra .
Heritage Oaks East .
Total .
REVENUES: Tax revenues Intergovernmental revenues Licenses, fees and permits Reimbursements and refunds Use of money and property Grant revenue Other revenue
$ -
- 12,810
- (31)
- -
$ -
- - -
(156) -
-
$ 172,055
45,133 82,099
- 1,333
130,309 1,071
TOTAL REVENUES 12,779 (156) 429,334
EXPENDITURES: Current:
General government Public safety Public works
Capital outlay
- 39,361
- -
- - -
-
41,962 58,231
228,580 -
TOTAL EXPENDITURES 39,361 - 328,773 EXCESS (DEFICIT) OF REVENUES OVER (UNDER) EXPENDITURES
(26,582)
(156) 100,561 OTHER FINANCING SOURCES (USES): Transfers in Transfers out
24,899 -
31,572 -
330,439 (296,666)
TOTAL OTHER FINANCING 24,899 31,572 33,773
NET CHANGE IN FUND BALANCES
(1,683) 31,416 134,334
FUND BALANCE, July 1 Prior period adjustment FUND BALANCE, July 1 restated
1,683 - 1,683
(31,416) -
(31,416)
365,725 2,495 368,220
FUND BALANCE, June 30
$ -
$ -
$ 502,554
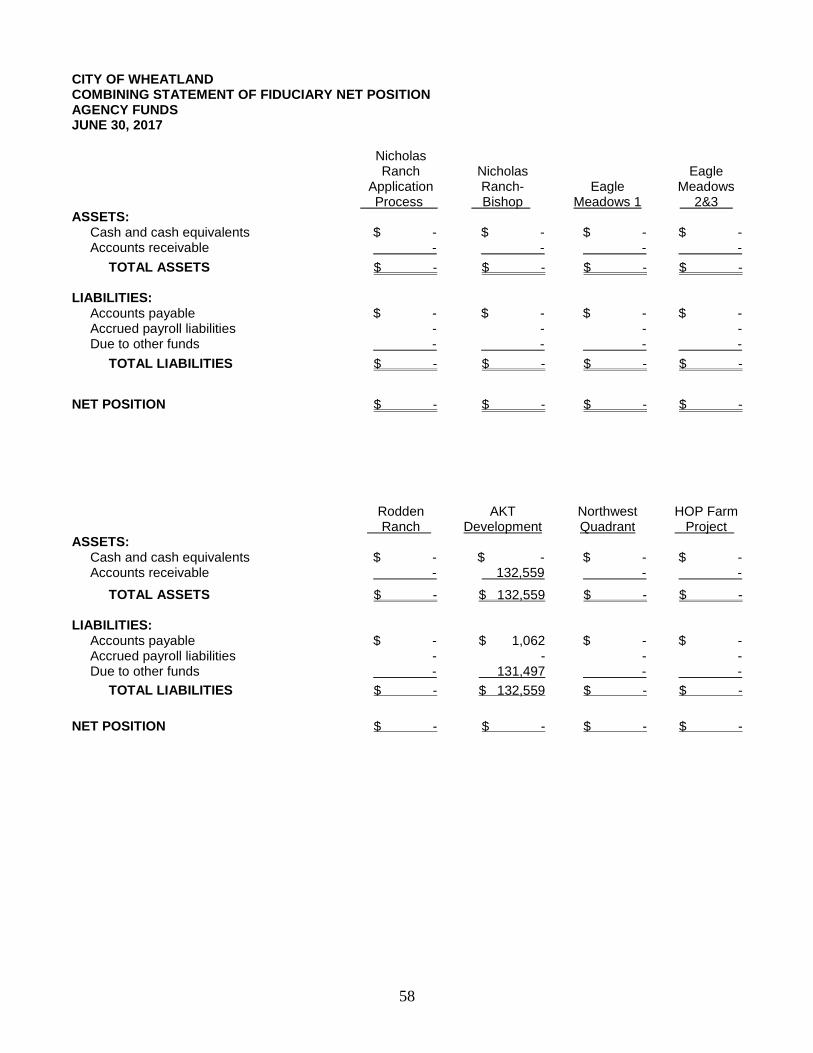
58
CITY OF WHEATLAND COMBINING STATEMENT OF FIDUCIARY NET POSITION AGENCY FUNDS JUNE 30, 2017 Nicholas
Ranch Application
Process .
Nicholas Ranch-
Bishop .
Eagle
Meadows 1
Eagle
Meadows 2&3 .
ASSETS: Cash and cash equivalents Accounts receivable
$ - -
$ - -
$ - -
$ - -
TOTAL ASSETS $ - $ - $ - $ - LIABILITIES: Accounts payable Accrued payroll liabilities Due to other funds
$ - -
-
$ - -
-
$ - -
-
$ - -
-
TOTAL LIABILITIES $ - $ - $ - $ -
NET POSITION $ - $ - $ - $ -
Rodden Ranch .
AKT Development
Northwest Quadrant
HOP Farm Project .
ASSETS: Cash and cash equivalents Accounts receivable
$ - -
$ - 132,559
$ - -
$ - -
TOTAL ASSETS $ - $ 132,559 $ - $ - LIABILITIES: Accounts payable Accrued payroll liabilities Due to other funds
$ - -
-
$ 1,062 -
131,497
$ - -
-
$ - -
-
TOTAL LIABILITIES $ - $ 132,559 $ - $ -
NET POSITION $ - $ - $ - $ -

59
CITY OF WHEATLAND COMBINING STATEMENT OF FIDUCIARY NET POSITION AGENCY FUNDS JUNE 30, 2017 Heritage
Oaks West Devalentine .
Heritage Oaks East
TM .
Heritage Oaks East
Trivest .
Caliterra
Ranch . ASSETS: Cash and cash equivalents Accounts receivable
$ 3,632 -
$ - 64,238
$ - -
$ - 40,027
TOTAL ASSETS $ 3,632 $ 64,238 $ - $ 40,027 LIABILITIES: Accounts payable Accrued payroll liabilities Due to other funds
$ 365 -
-
$ - -
64,238
$ - -
-
$ 16,692 -
23,335
TOTAL LIABILITIES $ 365 $ 64,238 $ - $ 40,027
NET POSITION $ 3,267 $ - $ - $ -
James Raney .
Sunset
Valley .
Total . ASSETS: Cash and cash equivalents Accounts receivable
$ - -
$ - -
$ 3,632 236,824
TOTAL ASSETS $ - $ - $ 240,456 LIABILITIES: Accounts payable Accrued payroll liabilities Due to other funds
$ - -
-
$ - -
-
$ 18,119 -
219,070
TOTAL LIABILITIES $ - $ - $ 237,189
NET POSITION $ - $ - $ 3,267

60
CITY OF WHEATLAND STATEMENT OF CHANGES IN FIDUCIARY NET POSITION AGENCY FUNDS JUNE 30, 2017
Balance at July 1, 2016 .
Additions .
Deletions .
Balance at
June 30, 2017 . NICHOLAS RANCH APPLICATION PROCESS
ASSETS: Cash and cash equivalents
$ -
$ -
$ -
$ -
TOTAL ASSETS $ - $ - $ - $ - LIABILITIES: Accounts payable Due to other funds
$ 70 9,024
$ - -
$ (70) (9,024)
$ - -
TOTAL LIABILITIES $ 9,094 $ - $ (9,094) $ -
NET POSITION
$ (9,094) $ 9,094 $ - $ -
NICHOLAS RANCH-BISHOP
ASSETS: Cash and cash equivalents
$ -
$ -
$ -
$ -
TOTAL ASSETS $ - $ - $ - $ - LIABILITIES: Accounts payable Due to other funds
$ - 423
$ - 1
$ - (423)
$ - -
TOTAL LIABILITIES $ 423 $ 1 $ (423) $ -
NET POSITION
$ (423) $ 423 $ - $ -
EAGLE MEADOWS 1
ASSETS: Cash and cash equivalents
$ 14,342
$ 33
$ (14,375)
$ -
TOTAL ASSETS $ 14,342 $ 33 $ (14,375) $ - LIABILITIES: Accounts payable Due to other funds
$ - -
$ - -
$ - -
$ - -
TOTAL LIABILITIES $ - $ - $ - $ -
NET POSITION
$ 14,342
$ 33 $ (14,375) $ -

61
CITY OF WHEATLAND STATEMENT OF CHANGES IN FIDUCIARY NET POSITION (Continued) AGENCY FUNDS (Continued) JUNE 30, 2017
Balance at July 1, 2016 .
Additions .
Deletions .
Balance at
June 30, 2017 . EAGLE MEADOWS 2 AND 3
ASSETS: Cash and cash equivalents
$ 15,869
$ -
$ (15,869)
$ -
TOTAL ASSETS $ 15,869 $ - $ (15,869) $ - LIABILITIES: Accounts payable Due to other funds
$ - -
$ - -
$ - -
$ - -
TOTAL LIABILITIES $ - $ - $ - $ -
NET POSITION
$ 15,869 $ - $ (15,869) $ -
RODDEN RANCH
ASSETS: Cash and cash equivalents
$ -
$ -
$ -
$ -
TOTAL ASSETS $ - $ - $ - $ - LIABILITIES: Accounts payable Due to other funds
$ - 3 193
$ - -
$ - (3,193)
$ - -
TOTAL LIABILITIES $ 3,193 $ - $ (3,193) $ -
NET POSITION
$ (3,193)
$ 3,193 $ - $ -
AKT DEVELOPMENT
ASSETS: Cash and cash equivalents Accounts receivable
$ - -
$ - 132,559
$ - -
$ - 132,559
TOTAL ASSETS $ - $ 132,559 $ - $ 132,559 LIABILITIES: Accounts payable Accrued payroll liabilities Due to other funds
$ 921 74
122,070
$ 141 -
9,427
$ - (74)
-
$ 1,062 -
131,497
TOTAL LIABILITIES $ 123,065 $ 9,568 $ (74) $ 132,559
NET POSITION
$ (123,065) $ 123,065 $ - $ -

62
CITY OF WHEATLAND STATEMENT OF CHANGES IN FIDUCIARY NET POSITION (Continued) AGENCY FUNDS (Continued) JUNE 30, 2017
Balance at July 1, 2016 .
Additions .
Deletions .
Balance at
June 30, 2017 . NORTHWEST QUADRANT
ASSETS: Cash and cash equivalents
$ -
$ -
$ -
$ -
TOTAL ASSETS $ - $ - $ - $ - LIABILITIES: Accounts payable Due to other funds
$ - 13,028
$ - 32
$ - (13,060)
$ - -
TOTAL LIABILITIES $ 13,028 $ 32 $ (13,060) $ -
NET POSITION
$ (13,028) $ 13,060
$ (32) $ -
HOP FARM PROJECT
ASSETS: Cash and cash equivalents
$ 4,206
$ 88
$ (4,294)
$ -
TOTAL ASSETS $ 4,206 $ 88 $ (4,294) $ - LIABILITIES: Accounts payable Due to other funds
$ 2,512 -
$ - -
$ (2,512) -
$ - -
TOTAL LIABILITIES $ 2,512 $ - $ (2,512) $ -
NET POSITION
$ 1,694 $ 88 $ (1,782) $ -
HERITAGE OAKS WEST - DeVALENTINE
ASSETS: Cash and cash equivalents
$ 3,663
$ -
$ (31)
$ 3,632
TOTAL ASSETS $ 3,663 $ - $ (31) $ 3,632 LIABILITIES: Accounts payable Due to other funds
$ - 4,800
$ 365 -
$ - (4,800)
$ 365 -
TOTAL LIABILITIES $ 4,800 $ 365 $ (4,800) $ 365
NET POSITION
$ (1,137) $ 4,404 $ - $ 3,267
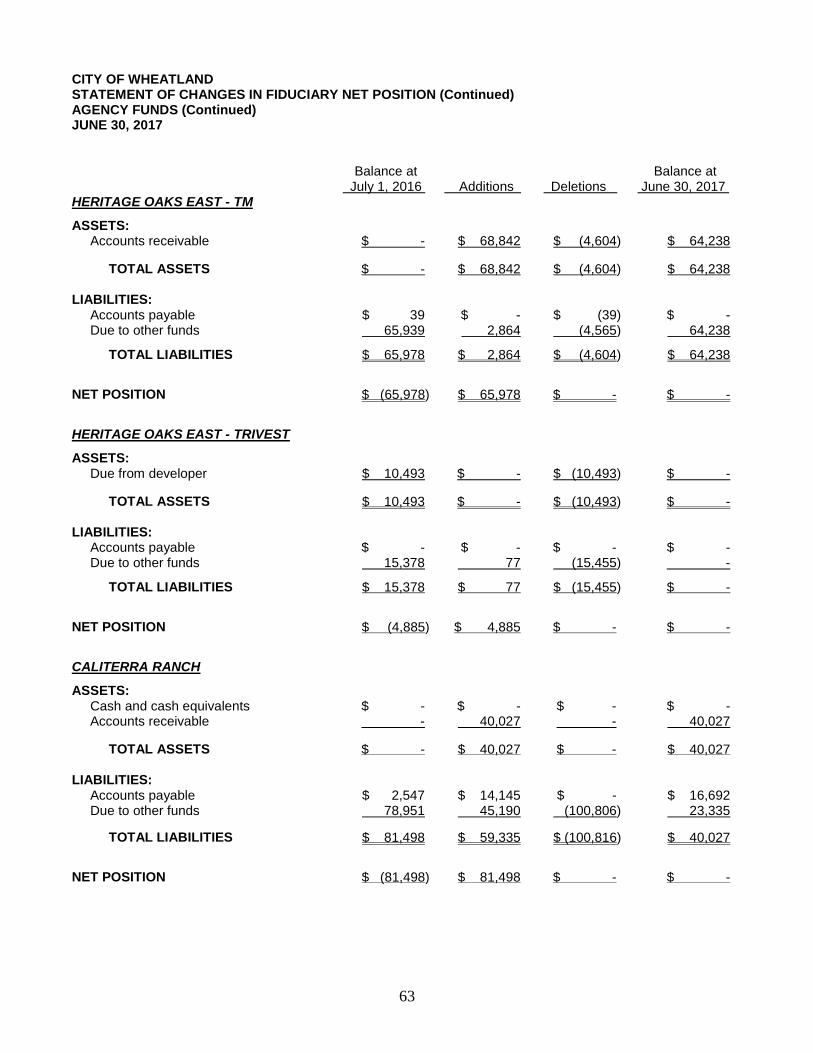
63
CITY OF WHEATLAND STATEMENT OF CHANGES IN FIDUCIARY NET POSITION (Continued) AGENCY FUNDS (Continued) JUNE 30, 2017
Balance at July 1, 2016 .
Additions .
Deletions .
Balance at
June 30, 2017 . HERITAGE OAKS EAST - TM
ASSETS: Accounts receivable
$ -
$ 68,842
$ (4,604)
$ 64,238
TOTAL ASSETS $ - $ 68,842 $ (4,604) $ 64,238 LIABILITIES: Accounts payable Due to other funds
$ 39 65,939
$ - 2,864
$ (39) (4,565)
$ - 64,238
TOTAL LIABILITIES $ 65,978 $ 2,864 $ (4,604) $ 64,238
NET POSITION
$ (65,978) $ 65,978 $ - $ -
HERITAGE OAKS EAST - TRIVEST
ASSETS: Due from developer
$ 10,493
$ -
$ (10,493)
$ -
TOTAL ASSETS $ 10,493 $ - $ (10,493) $ - LIABILITIES: Accounts payable Due to other funds
$ - 15,378
$ - 77
$ - (15,455)
$ - -
TOTAL LIABILITIES $ 15,378 $ 77 $ (15,455) $ -
NET POSITION
$ (4,885) $ 4,885 $ - $ -
CALITERRA RANCH
ASSETS: Cash and cash equivalents Accounts receivable
$ - -
$ - 40,027
$ - -
$ - 40,027
TOTAL ASSETS $ - $ 40,027 $ - $ 40,027 LIABILITIES: Accounts payable Due to other funds
$ 2,547 78,951
$ 14,145 45,190
$ - (100,806)
$ 16,692 23,335
TOTAL LIABILITIES $ 81,498 $ 59,335 $ (100,816) $ 40,027
NET POSITION
$ (81,498)
$ 81,498 $ - $ -

64
CITY OF WHEATLAND STATEMENT OF CHANGES IN FIDUCIARY NET POSITION (Continued) AGENCY FUNDS (Continued) JUNE 30, 2017
Balance at July 1, 2016 .
Additions .
Deletions .
Balance at
June 30, 2017 . JAMES RANEY
ASSETS: Cash and cash equivalents
$ -
$ -
$ -
$ -
TOTAL ASSETS $ - $ - $ - $ - LIABILITIES: Due to other funds
$ 6,714
$ -
$ (6,714)
$ -
TOTAL LIABILITIES $ 6,714 $ - $ (6,714) $ -
NET POSITION
$ (6,714) $ 6,714 $ - $ -
SUNSET VALLEY
ASSETS: Cash and cash equivalents Due from developers
$ - 2,444
$ - -
$ - (2,444)
$ - -
TOTAL ASSETS $ 2,444 $ - $ (2,444) $ - LIABILITIES: Due to other funds
$ 2,500
$ -
$ (2,500)
$ -
TOTAL LIABILITIES $ 2,500 $ - $ (2,500) $ -
NET POSITION
$ (56)
$ 56 $ - $ -
TOTAL OF ALL AGENCY FUNDS
ASSETS: Cash and cash equivalents Accounts receivable Due from developers
$ 38,080
- 12,937
$ 121
241,428 -
$ (34,569)
(4,604) (12,937)
$ 3,632
236,824 -
TOTAL ASSETS $ 51,017 $ 241,549 $ (36,982) $ 240,456 LIABILITIES: Accounts payable Accrued payroll liabilities Due to other funds Deferred revenue
$ 6,089 74
317,220 4,800
$ 14,651 -
57,590 -
$ (2,621)
(74) (155,740)
(4,800)
$ 18,119 -
219,070 -
TOTAL LIABILITIES $ 328,183 $ 72,241 $ (163,235) $ 237,189
NET POSITION
$ (277,166) $ 312,732
$ (32,058) $ 3,267

65
CITY OF WHEATLAND STATISTICAL SECTION
JUNE 30, 2017
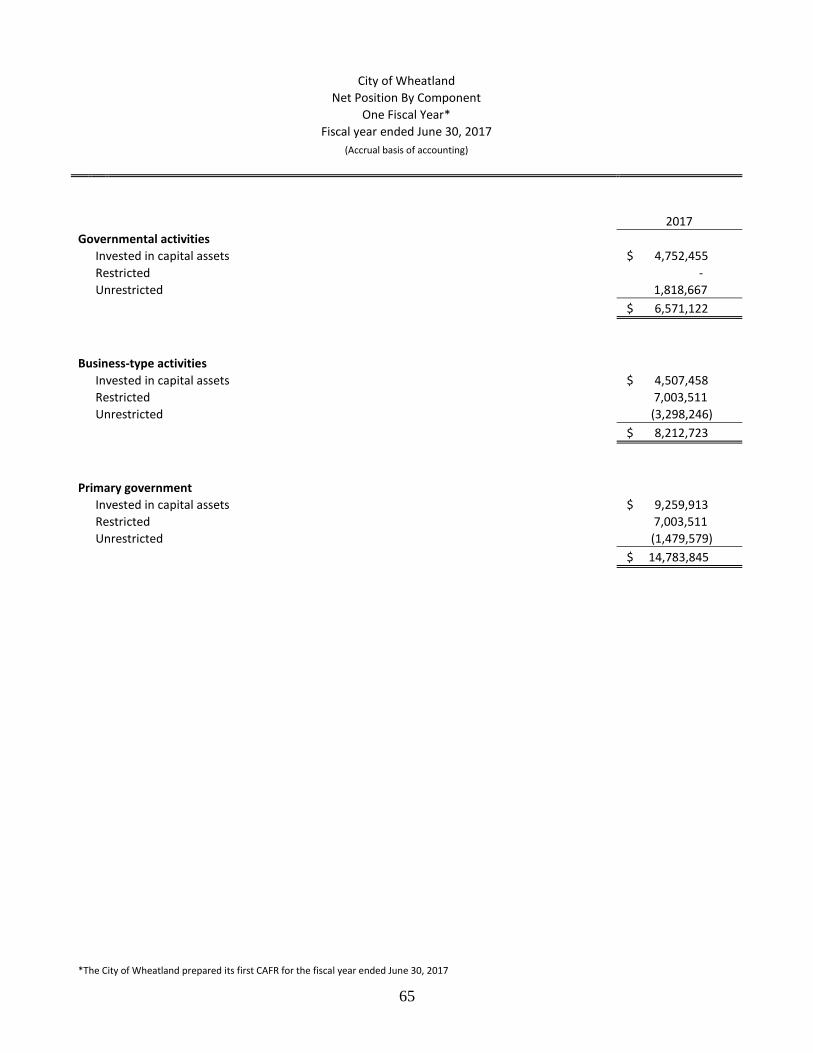
65
City of Wheatland
Net Position By Component
One Fiscal Year*
Fiscal year ended June 30, 2017
(Accrual basis of accounting)
2017
Governmental activities
Invested in capital assets $ 4,752,455
Restricted -
Unrestricted 1,818,667
$ 6,571,122
Business-type activities
Invested in capital assets $ 4,507,458
Restricted 7,003,511
Unrestricted (3,298,246)
$ 8,212,723
Primary government
Invested in capital assets $ 9,259,913
Restricted 7,003,511
Unrestricted (1,479,579)
$ 14,783,845
*The City of Wheatland prepared its first CAFR for the fiscal year ended June 30, 2017
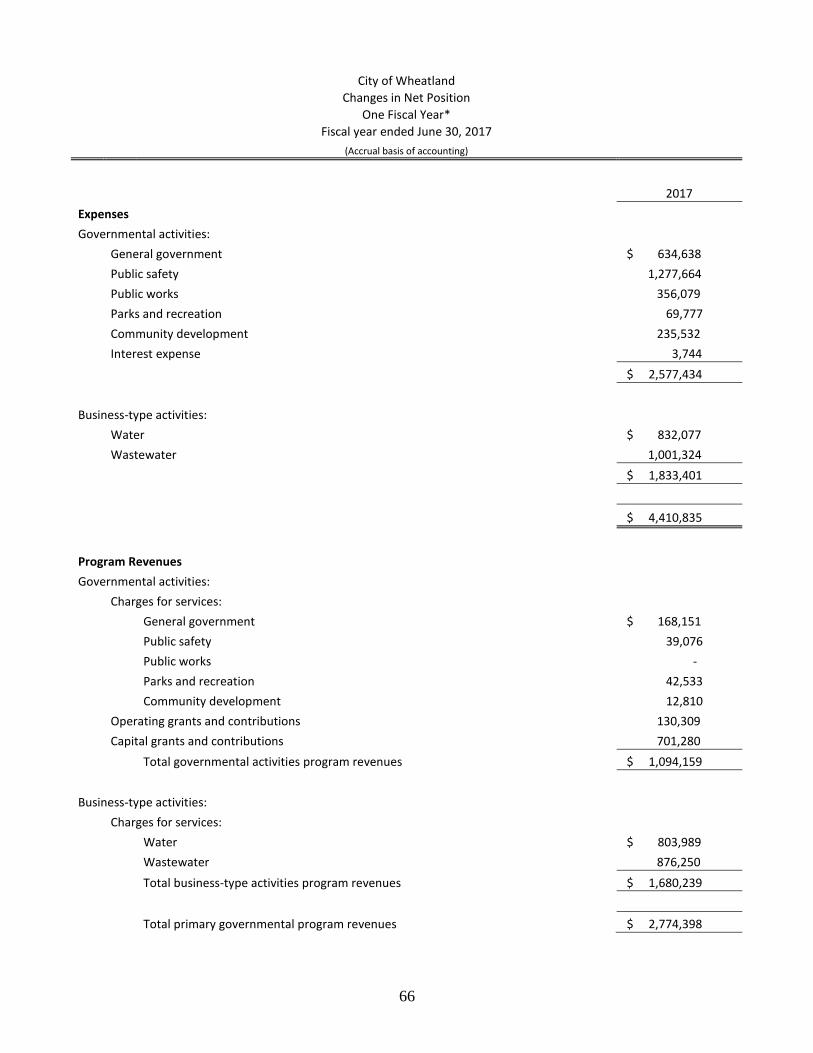
66
City of Wheatland
Changes in Net Position
One Fiscal Year*
Fiscal year ended June 30, 2017
(Accrual basis of accounting)
2017
Expenses Governmental activities:
General government $ 634,638
Public safety 1,277,664
Public works 356,079
Parks and recreation 69,777
Community development 235,532
Interest expense 3,744
$ 2,577,434
Business-type activities:
Water $ 832,077
Wastewater 1,001,324
$ 1,833,401
$ 4,410,835
Program Revenues Governmental activities:
Charges for services:
General government $ 168,151
Public safety 39,076
Public works -
Parks and recreation 42,533
Community development 12,810
Operating grants and contributions 130,309
Capital grants and contributions 701,280
Total governmental activities program revenues $ 1,094,159
Business-type activities:
Charges for services:
Water $ 803,989
Wastewater 876,250
Total business-type activities program revenues $ 1,680,239
Total primary governmental program revenues $ 2,774,398

67
Continued from previous page
2017
Net (Expense)/Revenue
Governmental activities $ (1,483,275)
Business-type activities $ (153,162)
Total primary government net expense $ (1,636,437)
General Revenues and Other Changes in Net Assets Governmental activities:
Taxes:
Property taxes $ 455,368
Sales and use taxes 464,982
Contingent transaction taxes 280,112
Franchise taxes 112,910
Shared intergovernmental revenues 376,072
Other revenues 51,598
Transfers 174,480
Investment income 59,361
Total governmental activities $ 1,974,883
Business-type activities:
Investment income $ 53,697
Transfers (174,480)
$ (120,783)
Total primary government $ 1,854,100
Changes in Net Assets
Governmental activities $ 491,608
Business-type activities (273,945)
$ 217,663
*The City of Wheatland prepared its first CAFR for the fiscal year ended June 30, 2017
Data Source: City of Wheatland Finance Department
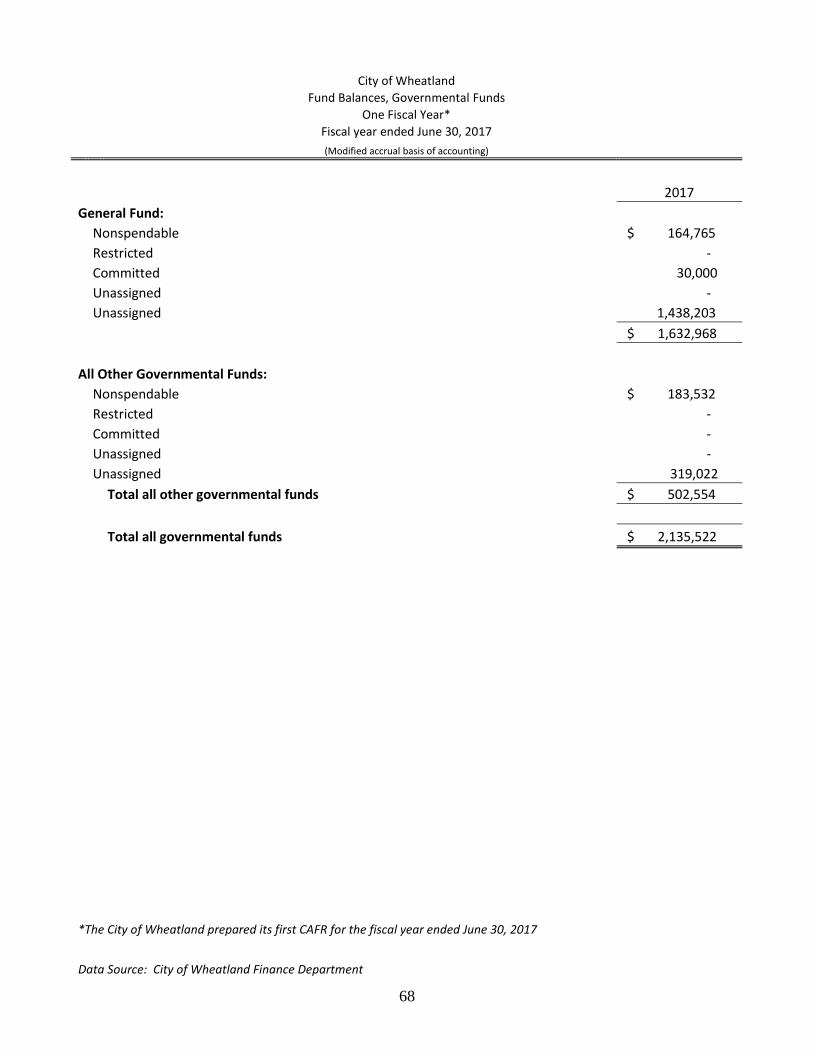
68
City of Wheatland
Fund Balances, Governmental Funds
One Fiscal Year*
Fiscal year ended June 30, 2017
(Modified accrual basis of accounting)
2017
General Fund:
Nonspendable $ 164,765
Restricted -
Committed 30,000
Unassigned -
Unassigned 1,438,203
$ 1,632,968
All Other Governmental Funds:
Nonspendable $ 183,532
Restricted -
Committed -
Unassigned -
Unassigned 319,022
Total all other governmental funds $ 502,554
Total all governmental funds $ 2,135,522
*The City of Wheatland prepared its first CAFR for the fiscal year ended June 30, 2017
Data Source: City of Wheatland Finance Department

69
City of Wheatland
Changes in Fund Balances, Governmental Funds
One Fiscal Year*
Fiscal year ended June 30, 2017
(Modified accrual basis of accounting)
2017
Revenues:
Taxes and assessments $ 1,689,215
Intergovernmental revenues 61,567
Licenses, fees and permits 184,517
Charges for services 11
Fines, forfeitures and penalties 16,475
Use of money and property 59,361
Grant revenue 831,589
Other revenue 51,827
Total revenues 2,894,562
Expenditures:
General government 503,767
Public safety 1,152,791
Community development 235,532
Public works and engineering 228,580
Parks and recreation 69,777
Capital Improvements 573,184
Debt service:
Principal 8,903
Interest 3,744
Total expenditures 2,776,278
Reconciliation of Governmental Revenues Less Expenditures to Fund Equity: Revenues over (under) expenditures 118,284
Other financing sources (uses):
Transfers in 849,821
Transfers out (682,314)
Total other financing sources (uses) 167,507
Net change in fund balances $ 285,791
Debt service as a percentage of noncapital expenditures 0.57%
*The City of Wheatland prepared its first CAFR for the fiscal year ended June 30, 2017
Data Source: City of Wheatland Finance Department

70
City of Wheatland
Assessed Value and Actual Value of Taxable Property
For the last ten fiscal years
Fiscal year ended June 30, 2017
Less: Taxable Total Direct
Secured Unsecured Exemptions Assessed Value Tax Rate
FY 2007-08 247,053,902 3,548,614 - 250,602,516 0.17900
FY 2008-09 252,383,040 3,943,412 - 256,326,452 0.17961
FY 2009-10 195,200,387 5,084,510 - 200,284,897 0.17574
FY 2010-11 188,342,984 5,128,091 - 193,471,075 0.17395
FY 2011-12 170,498,517 5,123,732 - 175,622,249 0.17419
FY 2012-13 161,954,723 5,282,470 - 167,237,193 0.17277
FY 2013-14 162,172,236 4,915,719 - 167,087,955 0.17204
FY 2014-15 187,241,765 4,582,604 - 191,824,369 0.17159
FY 2015-16 229,813,378 4,638,696 - 234,452,074 0.13888
FY 2016-17 238,789,220 4,892,773 - 243,681,993 0.13966
Notes: Exempt values are not included in Total.
In 1978 the voters of the State of California passed Proposition 13 which limited taxes to a total
maximum rate of 1%, based upon the assessed value of the property being taxed. Each year, the
assessed value of property may be increased by an "inflation factor" (limited to a maximum of 2%).
With few exceptions, property is only reassessed as a result of new construction activity or at the
time it is sold to a new owner. At that point, the property is reassessed based upon the added
value of the construction or at the purchase price (market value) or economic value of the property
sold. The assessed valuation data shown above represents the only data currently available with
respect to the actual market value of taxable property and is subject to the limitations described
above.
Source: Yuba County Assessor 2007/08 - 2016/17 Combined Tax Rolls

71
City of Wheatland
Top Ten Property Tax Payers
Current Year and Nine Years Ago
Fiscal year ended June 30, 2017
FY 2016-17
FY 2007-06
Rank Value % of Net AV
Rank Value % of Net AV
Bear River Walnut Ranch 1 $ 11,788,070 4.84%
AKT Wheatland Ranch 2 8,373,348 3.44%
Gibson Ranch 3 6,183,857 2.54%
Dale Investments 4 3,744,845 1.54%
Frank Dean and Frances Webb 5 2,675,704 1.10%
5 $ 1,741,350 0.69%
Raj Kumar and Namarta Sharma 6 2,435,998 1.00%
Settlers Village Center 7 2,399,750 0.98%
Lennar Homes of California 8 2,308,658 0.95%
Lewis Investment Company 9 2,306,606 0.95%
Paradise Petro 10 1,880,173 0.77%
Wheatland Heritage Oaks
1 20,605,030 8.22%
Premier Homes
2 4,538,989 1.81%
Thomas and Phyllis Dietrich
3 2,513,099 1.00%
Charles and Phyllis Wilson
4 2,253,341 0.90%
Hovnanian Forecast Homes
6 1,662,068 0.66%
Joyce Boehm Trustee
7 1,341,766 0.54%
Wheatland River Associates
8 1,029,745 0.41%
Comcast of North CA
9 944,715 0.38%
Louise Bradshaw Trustee
10 893,601 0.36%
Top Ten Total $ 44,097,009 18.11%
$ 37,523,704 14.97%
City Total $ 243,681,993 $ 250,602,516
Source: Yuba County Assessor Combined Tax rolls

72
City of Wheatland
Top 25 Sales Tax Producers*
Current Year and Nine Years Ago
Fiscal year ended June 30, 2017
2016-17
2007-08
(represents 99.4% of total sales tax)
(represents 99.24% of total sales tax)
Business Name Business Category
Business Name Business Category
Big Al's Market Grocery
Big Al's Market Grocery
Bills Place Dining
Bills Place Dining
Bishops Pumpkin Farm Specialty
Bills Place Dining
Cade Patrick Boeger Dining
City Grill Restaurant Dining
City Grill Dining
Elkins Frostie Dining
Dollar General Variety
Emma Olives Dining
Elkins Frosty Dining
Hunter's Footwear Shoe
Mi Pueblito Taqueria Dining
Jonathan Williamson Contractor
Primetime Pizza Dining
Nor Cal Elite Sporting Goods
Raj's Mini Mart Service Station
Primetime Pizza Dining
Ready to Help Estate Sales Business Service
Raj's Mini Mart Service Station
Robertos Restaurant Dining
Robertos Restaurant Dining
Sharp Legal Srvice Business Service
Spx Transformer Electrical Equip
Stacey Ann Whelan Specialty
Src Catering Dining
Subway Dining
Stacey Ann Whelan Specialty
Thrasher's Diesel Repair Auto Repair
Subway Dining
Tobacco Shop Cigarette/Cigar
Tj's Coffiee Dining
Vacation Rvs & Auto Sales Used Auto
Tobacco Shop Cigarette/Cigar
Village Pharmacy Drug
Village Pharmacy Drug
Wheatland 99 & liquor Convenience
Wheatland 99 & liquor Convenience
Wheatland Elementary School Government
Wheatland Auto Parts Auto Repair
Wheatland Smog & Repair Auto Repair
Wheatland Chevron Service Station
Wheatland Station Service Station
Wheatland Elementary School Government
Wheatland Tire Co Auto Repair
Wheatland Smog & Repair Auto Repair
Wonderful Chinese Restaurant Dining
Wonderful Chinese Restaurant Dining
*Firms listed alphabetically
Source: Hinderliter, de Llamas & Associates, State Board of Equalization

73
City of Wheatland
Property Tax Levies and Collections
For the last ten fiscal years
Fiscal year ended June 30, 2017
Collections within the
Fiscal Year of the Levy Total Collections to Date
Taxes
Fiscal for the Percent Percent
Year Fiscal Year Amount of Levy Amount of Levy
2007-08 $ 643,617 $ 643,617 100.00% $ 643,617 100.00%
2008-09 712,856 712,856 100.00% 712,856 100.00%
2009-10 502,364 502,364 100.00% 502,364 100.00%
2010-11 495,142 495,142 100.00% 495,142 100.00%
2011-12 491,184 491,184 100.00% 491,184 100.00%
2012-13 453,056 453,056 100.00% 453,056 100.00%
2013-14 542,753 542,753 100.00% 542,753 100.00%
2014-15 523,990 523,990 100.00% 523,990 100.00%
2015-16 629,472 629,472 100.00% 629,472 100.00%
2016-17 649,277 649,277 100.00% 649,277 100.00%
Note: Amounts are reported and collected under the Teeter Plan in which all taxes are
distributed to the City in the year of the levy with the County retaining any interest or
penalties on uncollected balances.
Source: City Finance Department

74
City of Wheatland
Direct and Overlapping Tax Rates
For the last ten fiscal years
Fiscal year ended June 30, 2017
City Assessed Valuation $243,681,993
FY 2007-08 FY 2008-09 FY 2009-10 FY 2010-11 FY 2011-12
Basic Levy1
1.00000 1.00000 1.00000 1.00000 1.00000
Western Placer Unified 1993 Series A 0.01343 0.01343 0.01343 0.02105 0.02609
Wheatland Union High School 2012A 0.00000 0.00000 0.00000 0.00000 0.00000
Yuba Community College 0.01404 0.01404 0.01404 0.01450 0.02510
Total Direct and Overlapping2 Tax Rates 1.02747 1.02747 1.02747 1.03555 1.05119
City's Share of 1% Levy Per Prop 133 0.17092 0.17092 0.17092 0.17092 0.17092
Total Direct Rate4
0.17900 0.17961 0.17574 0.17395 0.17419
FY 2012-13 FY 2013-14 FY 2014-15 FY 2015-16 FY 2016-17
Basic Levy1
1.00000 1.00000 1.00000 1.00000 1.00000
Western Placer Unified 1993 Series A 0.02521 0.02521 0.02504 0.02469 0.02526
Wheatland Union High School 2012A 0.00000 0.00000 0.02994 0.03000 0.03000
Yuba Community College 0.02471 0.02471 0.02500 0.02494 0.02635
Total Direct and Overlapping2 Tax Rates 1.04992 1.04992 1.07998 1.07963 1.08161
City's Share of 1% Levy Per Prop 133 0.17092 0.17092 0.17092 0.17092 0.17092
Total Direct Rate4
0.17277 0.17204 0.17159 0.13888 0.13966
1In 1978, California voters passed Proposition 13 which set the property tax rate at 1.00% fixed amount.
This 1.00% is shared by all taxing agencies for which the subject property resides within. In addition
to the 1.00% fixed amount, property owners are charged taxes as a percentage of assessed property
values for the payment of any voter approved bonds.
2Overlapping rates are those of local and county governments that apply to property owners
within the City. Not all overlapping rates apply to all city property owners.
3City's share of 1.00% levy is based on the City's share of the general fund tax rate area with the
largest net taxable value within the City.
4Total Direct Rate is the weighted average of all individual direct rates applied by the City /Agency
preparing the statistical section informaiton and excludes revenues derived from aircraft.
Data Source: Yuba County Assessor 2007/08 - 2016/17 Tax Rate Table

75
City of Wheatland
Outstanding Debt
For the last ten fiscal years
Fiscal year ended June 30, 2017
USDA Water Loan #1 USDA Water Loan #3 USDA Wastewater Loan Capital Lease
Debt
Debt
Debt
Debt Percentage
Fiscal Year
Debt Outstanding
Per Capita
Debt Outstanding
Per Capita
Debt Outstanding
Per Capita
Debt Outstanding
Per Capita
of Personal Income
2007-08 1,875,000 533.28 1,078,000 306.60 3,562,055 1,013.10 325,000 92.43 n/a
2008-09 1,851,000 523.47 1,064,000 300.90 3,903,969 1,104.06 310,320 87.76 n/a
2009-10 1,825,000 512.93 1,049,000 294.83 3,873,000 1,088.53 294,856 82.87 2.0%
2010-11 1,798,000 518.30 1,034,000 298.07 3,826,800 1,103.14 278,566 80.30 2.5%
2011-12 1,770,000 506.73 1,018,000 291.44 3,778,700 1,081.79 261,404 74.84 2.6%
2012-13 1,741,000 498.14 1,001,000 286.41 3,728,700 1,066.87 243,328 69.62 2.5%
2013-14 1,711,000 500.44 984,000 287.80 3,676,600 1,075.34 224,289 65.60 2.5%
2014-15 1,679,000 477.12 966,000 274.51 3,622,400 1,029.38 204,232 58.04 2.5%
2015-16 1,646,000 469.08 947,000 269.88 3,565,900 1,016.22 183,102 52.18 2.3%
2016-17 1,611,000 392.93 927,000 226.10 3,507,100 855.39 160,845 39.23 1.8%
Notes: Details regarding the City's outstanding debt can be found in the notes to the financial statements.
Source: City Finance Department

76
City of Wheatland
Legal Debt Margin Information
For the last ten fiscal years
Fiscal year ended June 30, 2017
Net Debt
Applicable
Adjusted Net Debt Legal to the Limit
Fiscal Assessed Assessed Debt Limit Applicable Debt as a % of
Year Value Secured Value* Percentage Debt Limit to Limit Margin Debt Limit
2007-08 246,994,752 61,748,688 15% 9,262,303 325,000 8,937,303 3.51%
2008-09 252,292,040 63,073,010 15% 9,460,952 310,320 9,150,632 3.28%
2009-10 195,109,387 48,777,347 15% 7,316,602 294,856 7,021,746 4.03%
2010-11 188,251,984 47,062,996 15% 7,059,449 278,566 6,780,883 3.95%
2011-12 170,407,517 42,601,879 15% 6,390,282 261,404 6,128,878 4.09%
2012-13 161,641,700 40,410,425 15% 6,061,564 243,328 5,818,236 4.01%
2013-14 162,023,838 40,505,960 15% 6,075,894 224,289 5,851,605 3.69%
2014-15 187,093,367 46,773,342 15% 7,016,001 204,232 6,811,769 2.91%
2015-16 229,664,980 57,416,245 15% 8,612,437 183,102 8,429,335 2.13%
2016-17 238,640,822 59,660,206 15% 8,949,031 160,845 8,788,186 1.80%
*The Government Code of the State of California provides for a legal debt limit of 15% of gross
assessed valuation. However, this provision was enacted when assessed valuation was based upon
25% of market value. Effective with the 1981-82 fiscal year, each parcel is now assessed at
100% of market value (as of the most recent change in ownership for that parcel). This
computations shown above reflect a conversion of assessed valuation data for each fiscal year
from the current full valuation perspective to the 25% level that was in effect at the time the
legal debt margin was enacted by the State of California for local governments.
Source: City Finance Department

77
City of Wheatland
Demographic and Economic Statistics
For the past ten fiscal years
Fiscal year ended June 30, 2016
Personal
Income Unemployment % of Pop % of Pop
City of Per Capita Rate 25+ with 25+ with
Fiscal Wheatland Personal City of Median High School Bachelor's
Year Population (in thousands) Income Wheatland Age Degree Degree
2006-07 3,517 n/a
9.1% n/a n/a n/a
2007-08 3,516 n/a
11.7% n/a n/a n/a
2008-09 3,536 n/a
17.2% n/a n/a n/a
2009-10 3,558 $ 96,810 $ 27,209 19.0% 32.6 79.9% 13.0%
2010-11 3,469 $ 80,311 $ 23,151 18.0% 33.2 79.3% 12.1%
2011-12 3,493 $ 73,880 $ 21,151 13.5% 32.9 83.7% 12.8%
2012-13 3,495 $ 77,124 $ 22,067 13.0% 32.3 84.0% 17.4%
2013-14 3,419 $ 77,447 $ 22,652 12.1% 33.2 83.6% 15.2%
2014-15 3,519 $ 74,642 $ 21,211 10.1% 35.9 83.5% 14.5%
2015-16 3,509 $ 80,286 $ 22,880 9.3% 34.3 84.3% 13.9%
Sources: Population: California State Department of Finance
Income, Age, and Education Data: US Census Bureau, most recent American Community Survey
Unemployment Data: California Employment Development Department

78
City of Wheatland
Capital Asset Statistics by Function
For the last 5 years
Fiscal year ended June 30, 2016
Function 2012 2013 2014 2015 2016
Police Stations 1 1 1 1 1
Fire Stations* 1 1 1 1 1
Public Works Street Miles 18.4 18.4 22.4 22.4 22.4
Street Lights 234 234 234 234 234
Parks and Recreation Parks 5 5 5 5 5
Community centers 1 1 1 1 1
Ball fields 1 1 1 1 1
Utilities Miles of municipal sewer mains 18 18 18 18 18
Miles of water mains 18 18 18 18 18
Water wells 6 6 6 6 6
Water storage tanks 2 2 2 2 2
Note: in 2014 the City annexed 4,300 acres in to the City
*Fire services are provided by the Wheatland Fire Protection District
Source: City Finance Department

79
City of Wheatland
Operating Indicators by Function
For the last 5 years
Fiscal year ended June 30, 2016
Function 2012 2013 2014 2015 2016
Police Calls for service 1,205 1,525 1,452 1,427 1,461
911 calls per year 295 330 331 354 315
Public Works Street Resurfacing (miles) 0.00 0.31 0.00 0.00 0.00
Encroachment permits 7 21 10 8 9
Parks and recreation Facility rental hours 175 152 166 112 144
Sports field rental hours 750 750 750 750 750
Building Valuations Building permits issued per year 76 81 231 127 95
Building valuation $ 494,509 $ 1,000,217 $ 11,209,358 $ 1,886,320 $ 2,465,854
Utilities Gallons of wastewater treated per 115 122 118 115 124
year (in millions)
Business Licenses Annual business licenses issued n/a 177 210 231 273
Source: City Finance Department

80
City of Wheatland
Full-time and Part-time City Employees by Function
For the last 5 fiscal years
Fiscal year ended June 30, 2017
Function 2013 2014 2015 2016 2017
General Government 4.3 4.3 4.3 5.3 5.3
Public Safety Non-Sworn 0.5 0.5 0.5 0.9 0.9
Public Safety Sworn 9.0 9.0 9.0 9.0 9.0
Engineering1 0.0 0.0 0.0 0.0 0.0
Community Development2 0.0 0.0 0.0 0.0 0.0
Public Works3 7.0 7.0 7.0 6.9 6.9
Total 20.8 20.8 20.8 22.1 22.1
1The City contracts with Coastland Engineering for engineering services
2The City contracts with Raney and Associates for planning and building inspection services
3Public Works includes street, building, and park maintenance and water and sewer operations
Source: City Finance Department
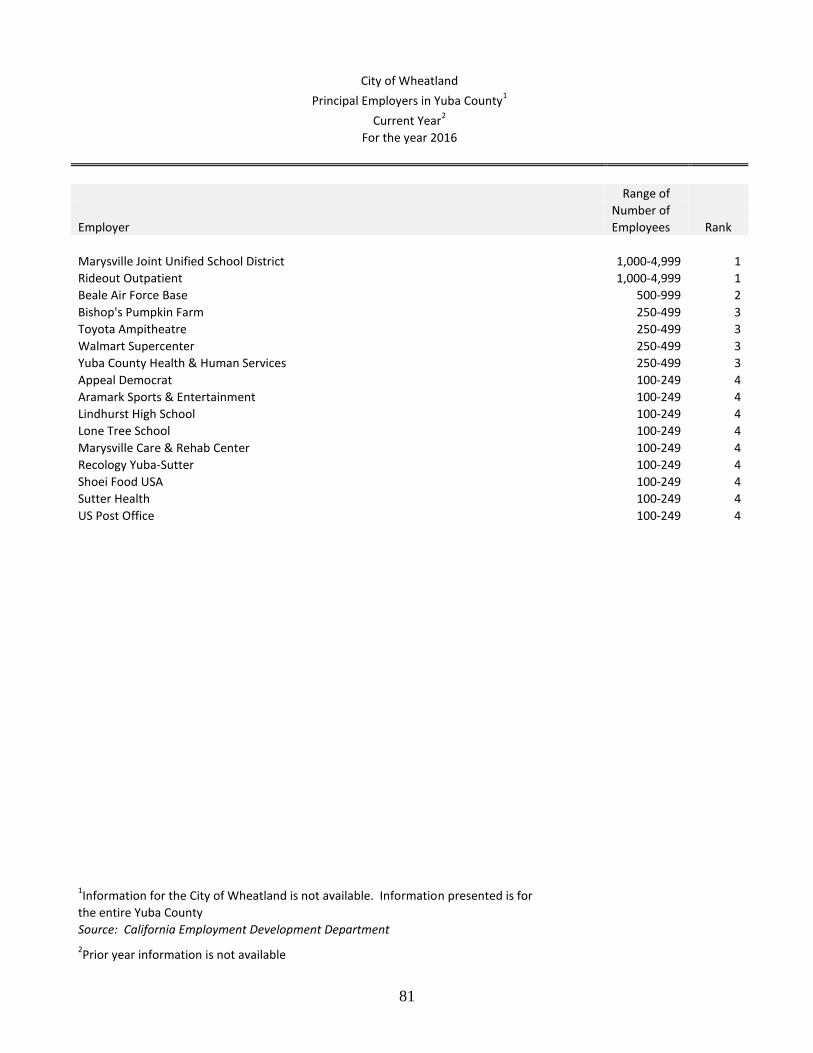
81
City of Wheatland
Principal Employers in Yuba County1
Current Year2
For the year 2016
Range of
Number of
Employer Employees Rank
Marysville Joint Unified School District 1,000-4,999 1
Rideout Outpatient 1,000-4,999 1
Beale Air Force Base 500-999 2
Bishop's Pumpkin Farm 250-499 3
Toyota Ampitheatre 250-499 3
Walmart Supercenter 250-499 3
Yuba County Health & Human Services 250-499 3
Appeal Democrat 100-249 4
Aramark Sports & Entertainment 100-249 4
Lindhurst High School 100-249 4
Lone Tree School 100-249 4
Marysville Care & Rehab Center 100-249 4
Recology Yuba-Sutter 100-249 4
Shoei Food USA 100-249 4
Sutter Health 100-249 4
US Post Office 100-249 4
1Information for the City of Wheatland is not available. Information presented is for
the entire Yuba County Source: California Employment Development Department
2Prior year information is not available