SACHETANA Project Experience with recharge - BIRD-K
67
-
Upload
india-water-portal -
Category
Technology
-
view
814 -
download
3
Transcript of SACHETANA Project Experience with recharge - BIRD-K


PROJECT LOCATION:- MUNDARAGI TALUK
1ST PHASE : 5 VILLAGES VIRUPAPUR, KALAKERI, MUSTIKOPPA , TIPPAPUR AND BUDIHAL
2ND PHASE: 4 VILLAGESHARUGERI, BASAPUR, MAKTUMPUR AND BENNIHALLI
SACHETANA NATURAL RESOURCE MANAGEMENT
FOR ADDRESSING POVERTY SITUATION IN MUNDARAGI TALUK OF
KARNATAKA

PROJECT PURPOSE :
IMPROVE THE LIVELIHOOD OF BASE OF 1200 FAMILIES IN 9 VILLAGES OF MUNDARAGI,THROUGH IMPROVED NATURAL RESOURCE MANAGEMENT & WATERSHED DEVELOPMENT.SELF HELP GROUPS FORMATION AND EMPOWERMENT OF THE TARGET GROUPS TO FUNCTION EFFECTIVELY AS A OWNER,.
TARGET GROUP : SMALL AND MARGINAL FARMERLAND LESS FAMILIESFEW BIG FARMER
AREA COVERAGE :- 4675 HECTARES
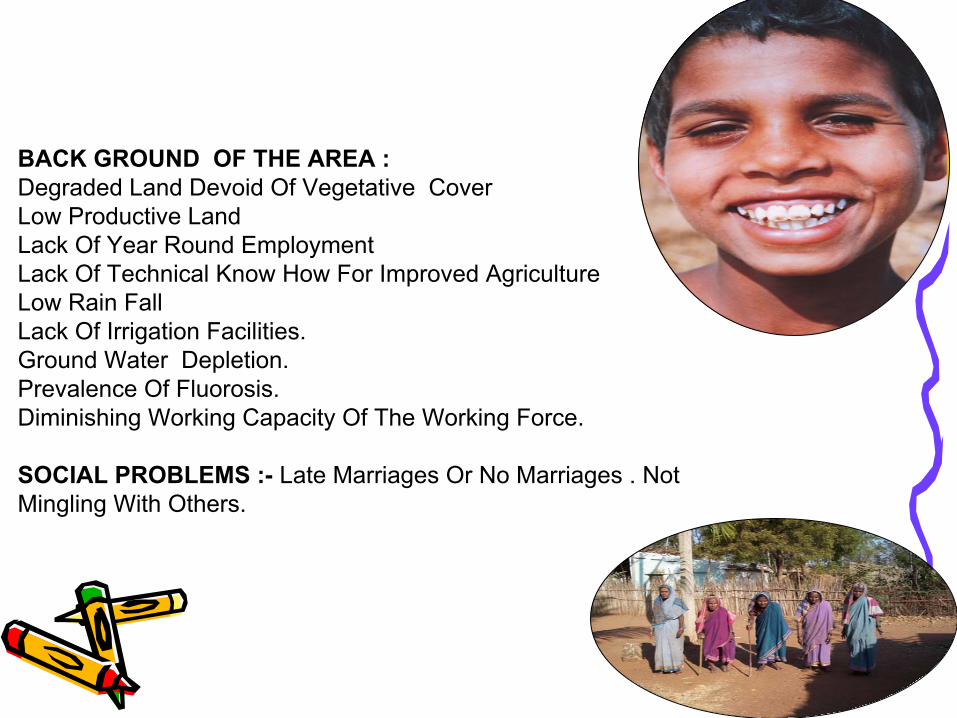
BACK GROUND OF THE AREA :Degraded Land Devoid Of Vegetative Cover Low Productive Land Lack Of Year Round EmploymentLack Of Technical Know How For Improved AgricultureLow Rain Fall Lack Of Irrigation Facilities.Ground Water Depletion.Prevalence Of Fluorosis.Diminishing Working Capacity Of The Working Force.
SOCIAL PROBLEMS :- Late Marriages Or No Marriages . Not Mingling With Others.
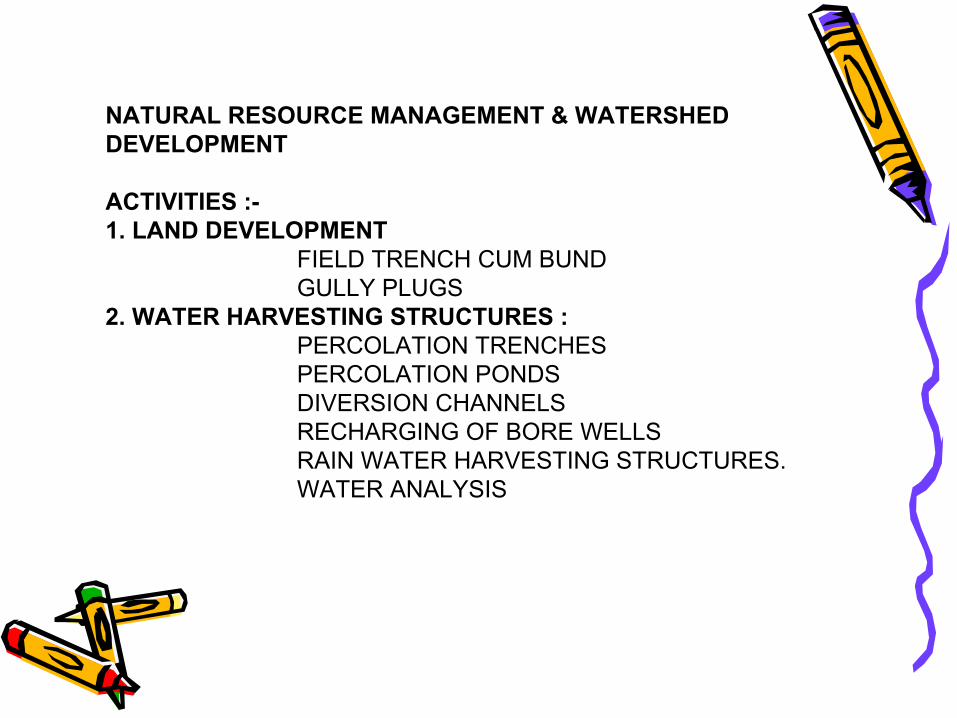
NATURAL RESOURCE MANAGEMENT & WATERSHED DEVELOPMENT
ACTIVITIES :-1. LAND DEVELOPMENT
FIELD TRENCH CUM BUNDGULLY PLUGS
2. WATER HARVESTING STRUCTURES :PERCOLATION TRENCHESPERCOLATION PONDSDIVERSION CHANNELSRECHARGING OF BORE WELLSRAIN WATER HARVESTING STRUCTURES.WATER ANALYSIS
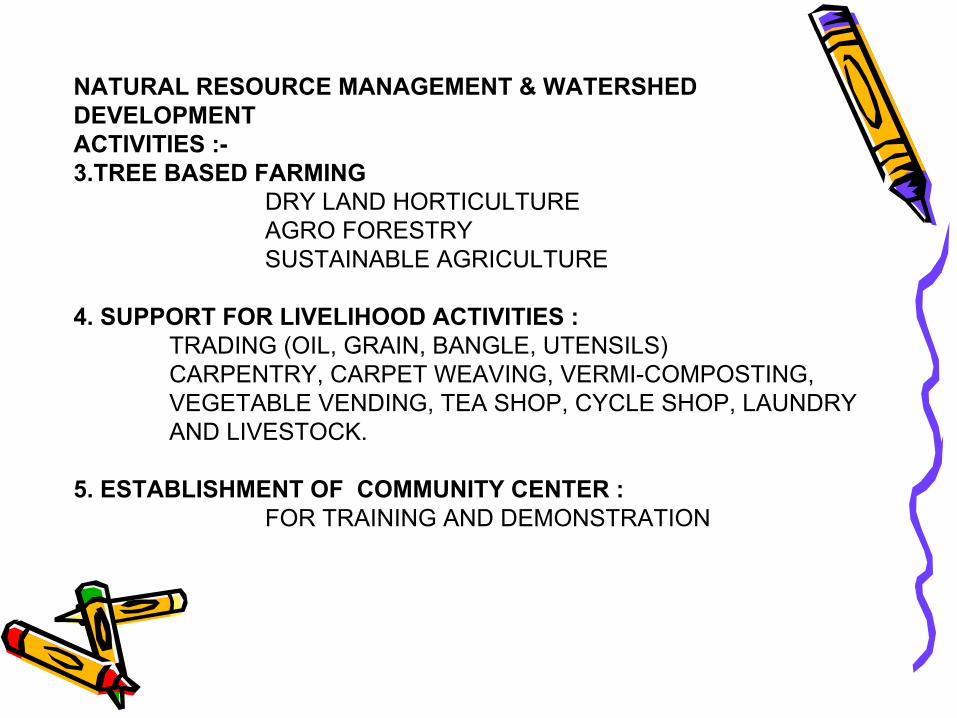
NATURAL RESOURCE MANAGEMENT & WATERSHED DEVELOPMENTACTIVITIES :-3.TREE BASED FARMING
DRY LAND HORTICULTUREAGRO FORESTRYSUSTAINABLE AGRICULTURE
4. SUPPORT FOR LIVELIHOOD ACTIVITIES :TRADING (OIL, GRAIN, BANGLE, UTENSILS) CARPENTRY, CARPET WEAVING, VERMI-COMPOSTING, VEGETABLE VENDING, TEA SHOP, CYCLE SHOP, LAUNDRY AND LIVESTOCK.
5. ESTABLISHMENT OF COMMUNITY CENTER :FOR TRAINING AND DEMONSTRATION

NATURAL RESOURCE MANAGEMENT & WATERSHED DEVELOPMENTACTIVITIES :-6. TRAINING AND AWARENESS :
EXPOSURE VISITSFARMING SYSTEM TRAINING TRAINING IN WATER RESOURCE DEVELOPMENTPADAYATRE / CYCLE JATHAHASIRU HABBA
2. LOCAL INSTITUTION BUILDING :-ACTIVITIES :-
FORMATION OF SELF HELP GROUPSHUMAN RESOURCE DEVELOPMENT (SSY)

DECENTRALISED WATER HARVESTING SYSTEM
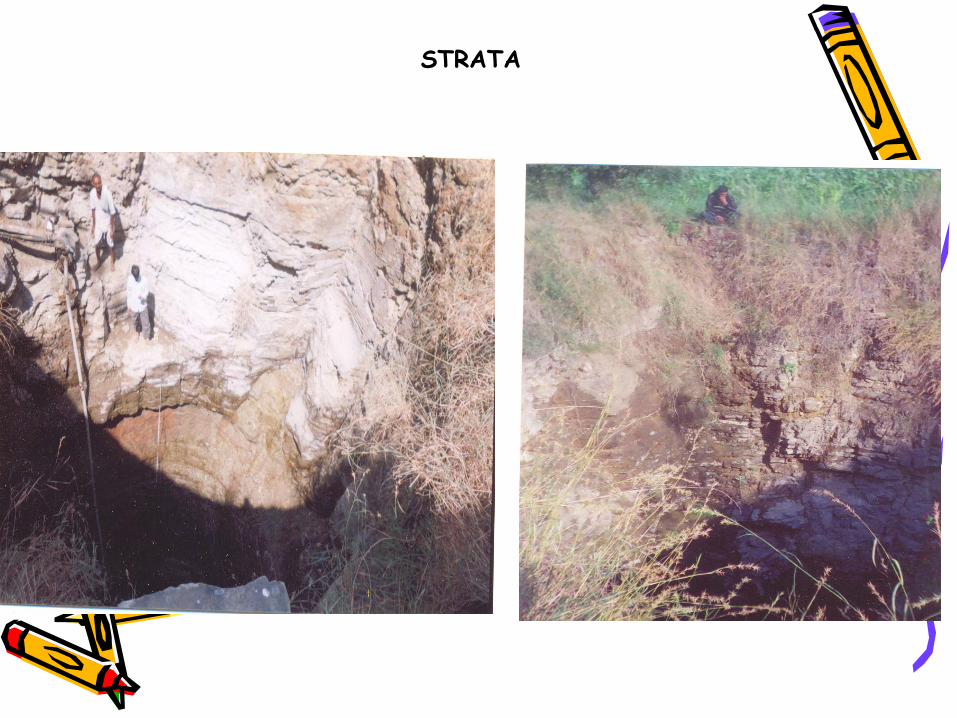
STRATA

311.6067
4674.123.21221204942481.4350.4997363.115024142.5
302.82.311166.721.769.617.913.8200715
316.631.774.948.49.526.410617.52.10.2200614
342.653.320.130.483.21160.838.4200513
312.73239.915415751.712.8200412
98.512.8380.29.46.42.129.6200311
153.443.54.434.113.138.16.214200210
228.756.21342412.91.820019
381.815372.447.911.360.836.320008
405.414079.26.348.95576.519997
642.5025.7133180148.870.266.718.219986
241.215.84.322.921.654.64.859.524.831.41.519975
543.802.612819815.524.912421.26.922.319964
281039.992.620.74.1082.438.82.519953
228.9001138.23.724.567.53.18.819942
194.27.45.21214.911.411.214.918.219931
TotalDecNovOctSepAuJulJuMayApMarFebJanYearSl no
Source:- KID Hirekoppa
Rain fall data of Bagojikoppa watershed area Taluk Ramadurg, Dt:- Belgaum
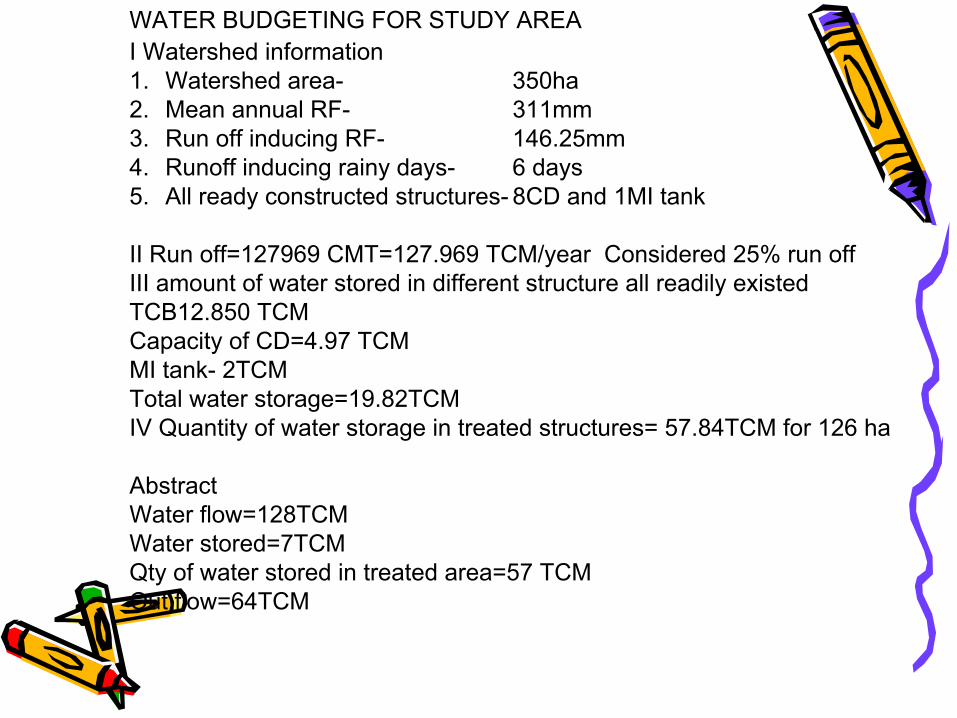
WATER BUDGETING FOR STUDY AREAI Watershed information1. Watershed area- 350ha2. Mean annual RF- 311mm3. Run off inducing RF- 146.25mm4. Runoff inducing rainy days- 6 days5. All ready constructed structures- 8CD and 1MI tank
II Run off=127969 CMT=127.969 TCM/year Considered 25% run offIII amount of water stored in different structure all readily existedTCB12.850 TCMCapacity of CD=4.97 TCMMI tank- 2TCMTotal water storage=19.82TCMIV Quantity of water storage in treated structures= 57.84TCM for 126 ha
AbstractWater flow=128TCMWater stored=7TCMQty of water stored in treated area=57 TCMOut flow=64TCM
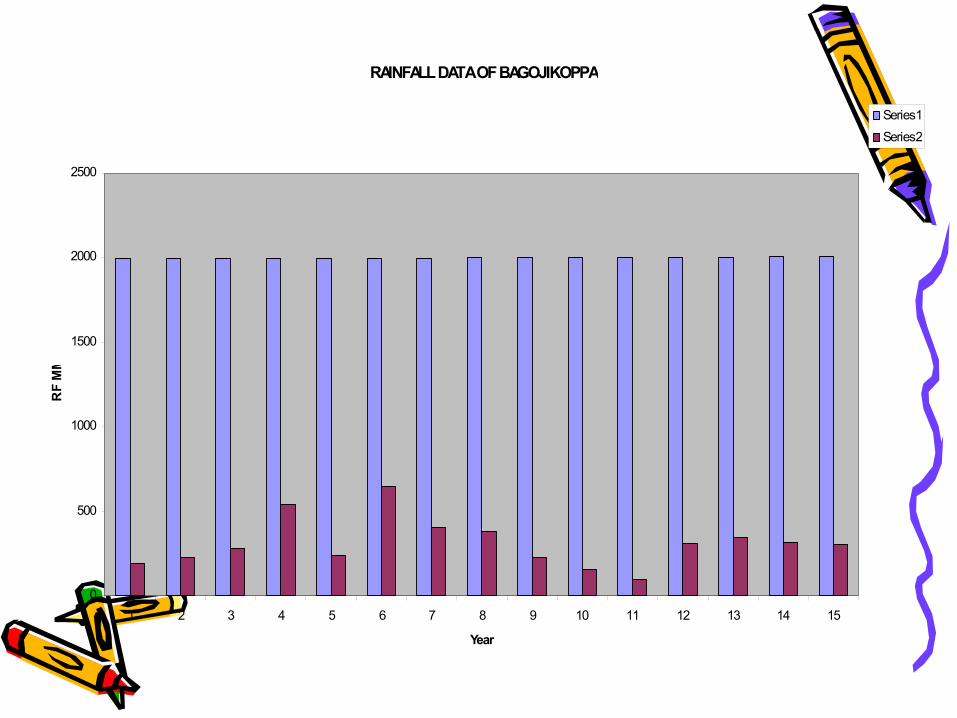
RAINFALL DATA OF BAGOJIKOPPA
0
500
1000
1500
2000
2500
1 2 3 4 5 6 7 8 9 10 11 12 13 14 15
Year
RF
MM
Series1
Series2

1.Mapping:-Well contour mapLocation structures in map Drainage map2. Base lines.Rain fall, Intensity of rainfall/ hour:- last 15 years2.71mmHighest rainfall in 24 hours inlast 15 years:-14.10/2000:-65.2mmAverage rainfall:- 311mmTemperature Average 36DCTemperature season wise
262835Min Dc
283038Max Dc
WinterMonsoonSummer
Data source:-PHC Hulkund
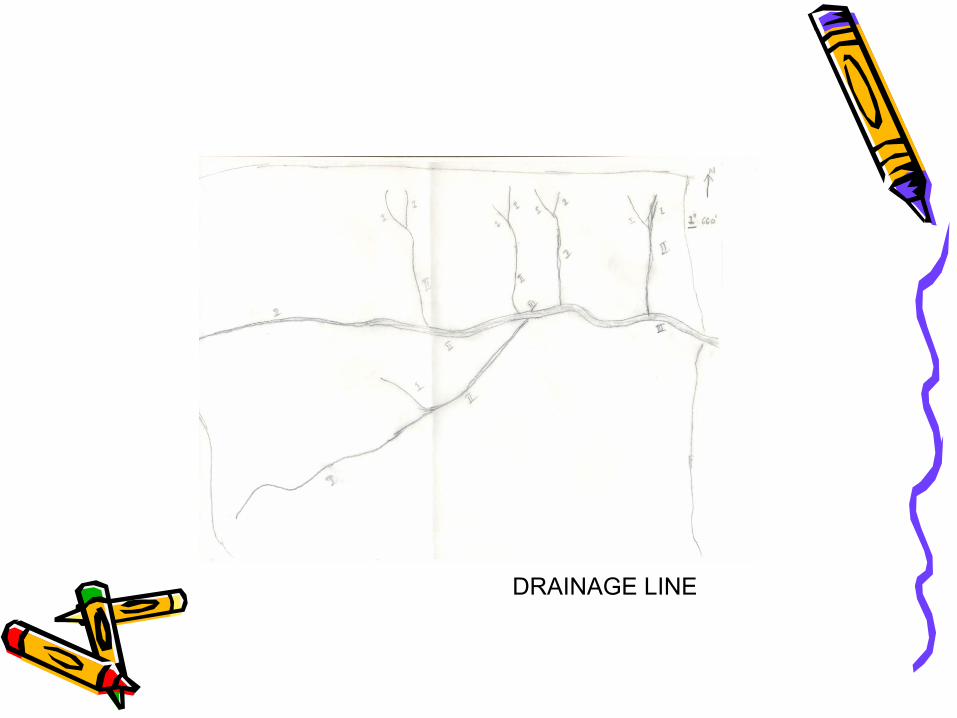
DRAINAGE LINE
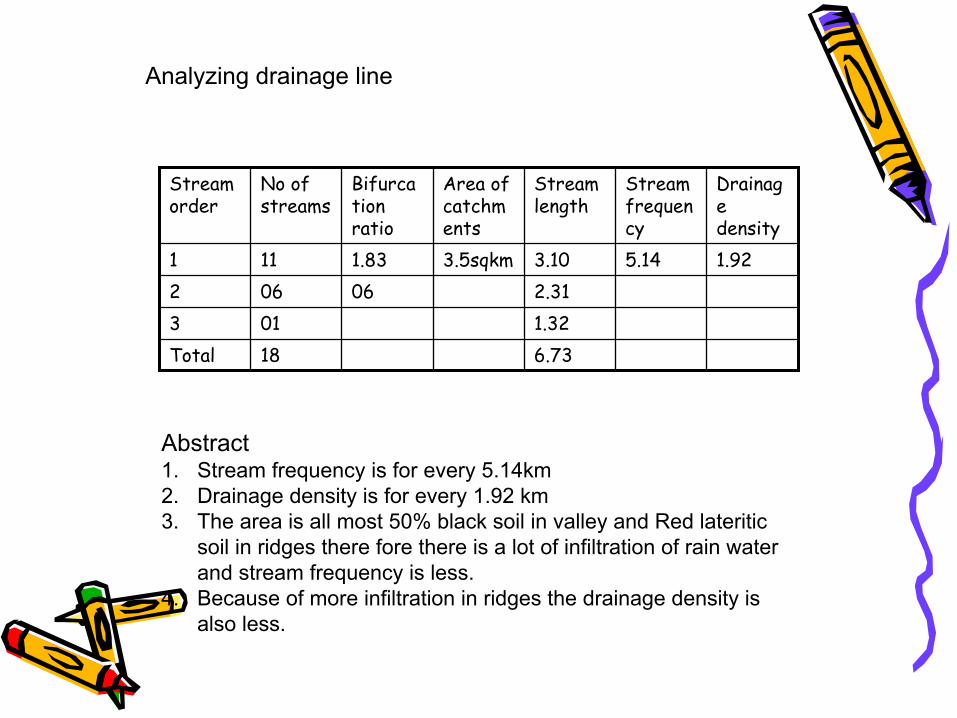
6.7318Total1.320132.3106062
1.925.143.103.5sqkm1.83111
Drainage density
Stream frequency
Stream length
Area of catchments
Bifurcation ratio
No of streams
Stream order
Abstract1. Stream frequency is for every 5.14km2. Drainage density is for every 1.92 km3. The area is all most 50% black soil in valley and Red lateritic
soil in ridges there fore there is a lot of infiltration of rain water and stream frequency is less.
4. Because of more infiltration in ridges the drainage density is also less.
Analyzing drainage line

RAIN FALL DATA FROM INHOUSE
Year 2008-09
191.6
6300002008-091
Marc-09
Feb-09
Jan-09
Dec-08
Nov-08
Oct-08
Sep-08
Aug-08
Jul-08
Jun-08
May-08
Ap-08
YearSl no
Heavy rain fall on 1.8.2008-79mm
4.8.2008-27.3mm
7.8.2008-42mm
During this time there was stream flow for 2 to 3 days
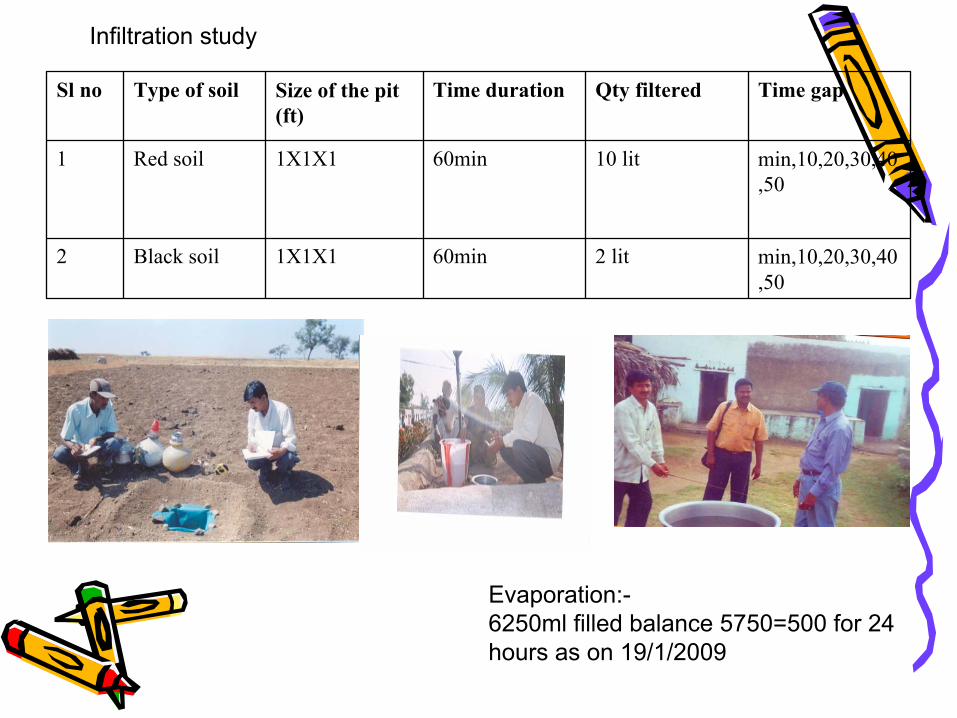
min,10,20,30,40,50
2 lit60min1X1X1Black soil2
min,10,20,30,40,50
10 lit60min1X1X1Red soil1
Time gapQty filteredTime durationSize of the pit (ft)
Type of soilSl no
Infiltration study
Evaporation:-6250ml filled balance 5750=500 for 24 hours as on 19/1/2009
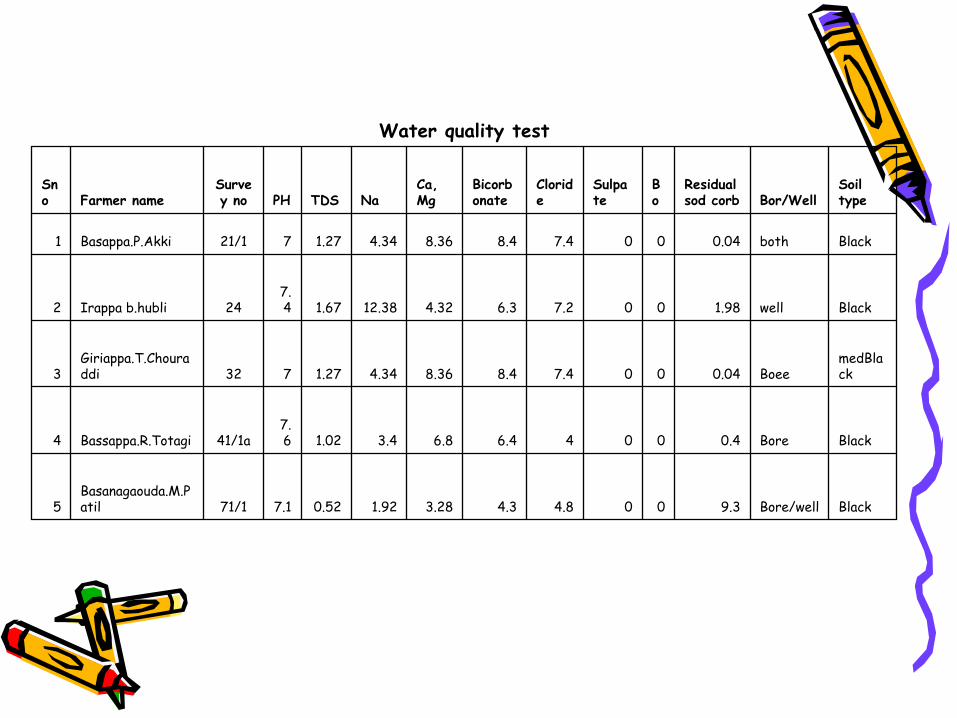
BlackBore/well9.3004.84.33.281.920.527.171/1Basanagaouda.M.Patil5
BlackBore0.40046.46.83.41.027.641/1aBassappa.R.Totagi4
medBlackBoee0.04007.48.48.364.341.27732
Giriappa.T.Chouraddi3
Blackwell1.98007.26.34.3212.381.677.424Irappa b.hubli2
Blackboth0.04007.48.48.364.341.27721/1Basappa.P.Akki1
Soil typeBor/Well
Residual sod corb
Bo
Sulpate
Cloride
Bicorbonate
Ca, MgNaTDSPH
Survey noFarmer name
Sno
Water quality test
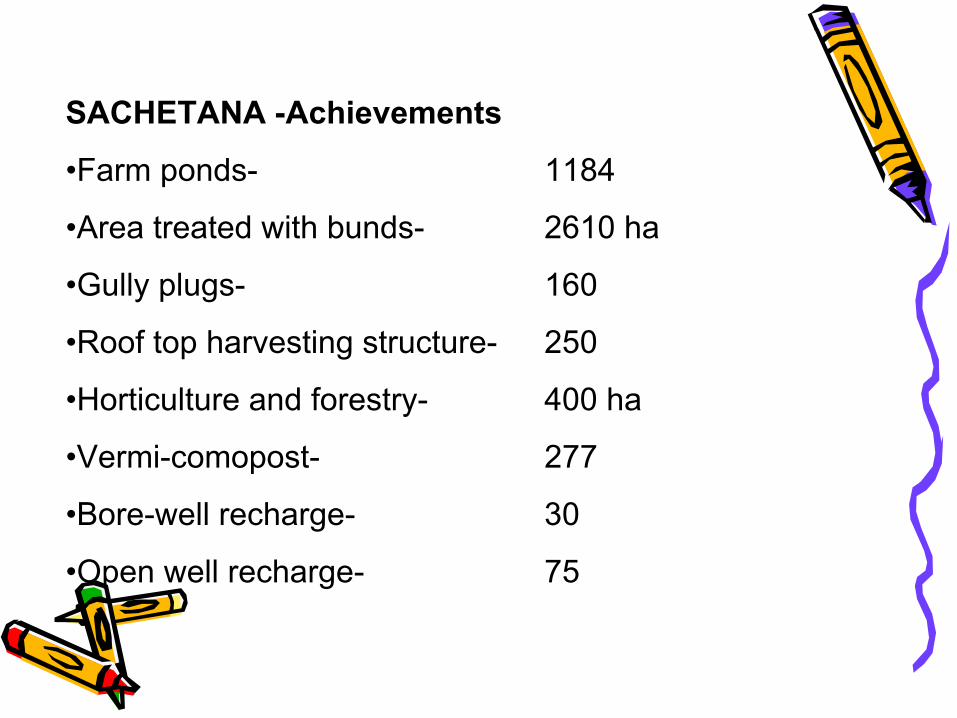
SACHETANA -Achievements
•Farm ponds- 1184
•Area treated with bunds- 2610 ha
•Gully plugs- 160
•Roof top harvesting structure- 250
•Horticulture and forestry- 400 ha
•Vermi-comopost- 277
•Bore-well recharge- 30
•Open well recharge- 75

•In areas with fluorides in top soils direct aquifer recharge can be an answer
Aquifer recharge structures
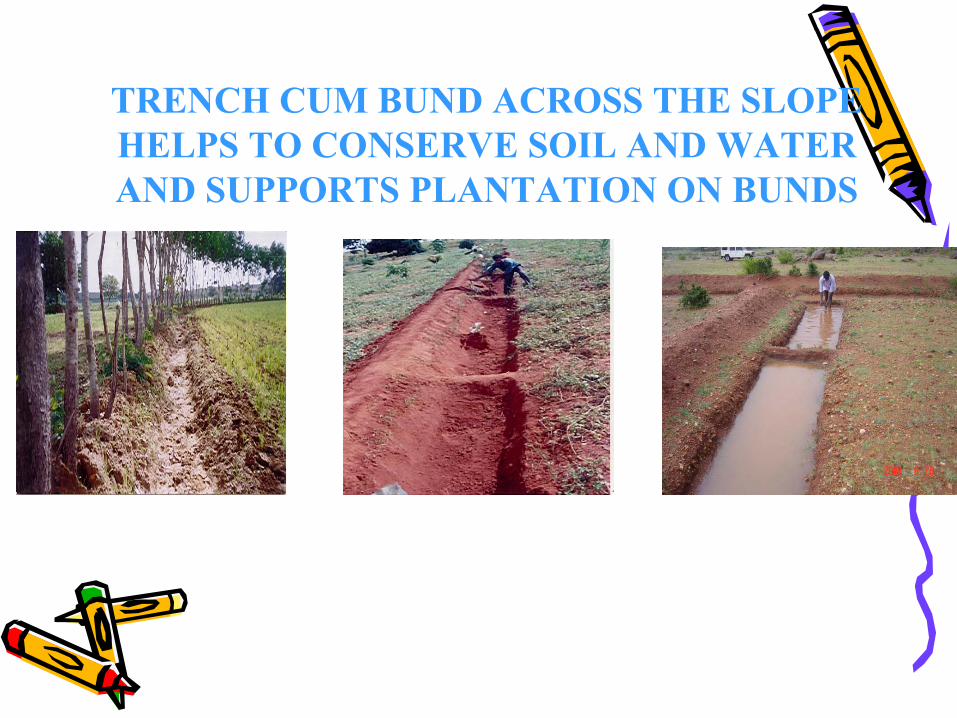
TRENCH CUM BUND ACROSS THE SLOPE HELPS TO CONSERVE SOIL AND WATER AND SUPPORTS PLANTATION ON BUNDS

•• SURFACE CONSERVATIONSURFACE CONSERVATION•• SUB SURFACE CONSERVARIONSUB SURFACE CONSERVARION•• VEGETATIVE CONSERVATIONVEGETATIVE CONSERVATION•• MECHANICAL CONSERVATIONMECHANICAL CONSERVATION
CONSERVATION OF RAIN WATERCONSERVATION OF RAIN WATER
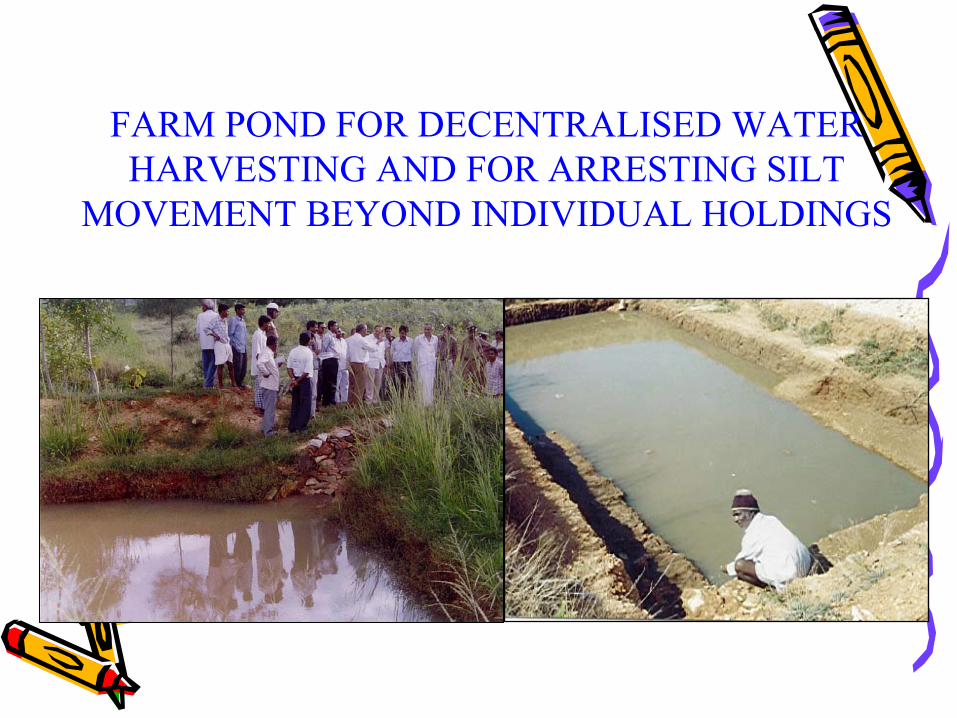
FARM POND FOR DECENTRALISED WATER HARVESTING AND FOR ARRESTING SILT
MOVEMENT BEYOND INDIVIDUAL HOLDINGS
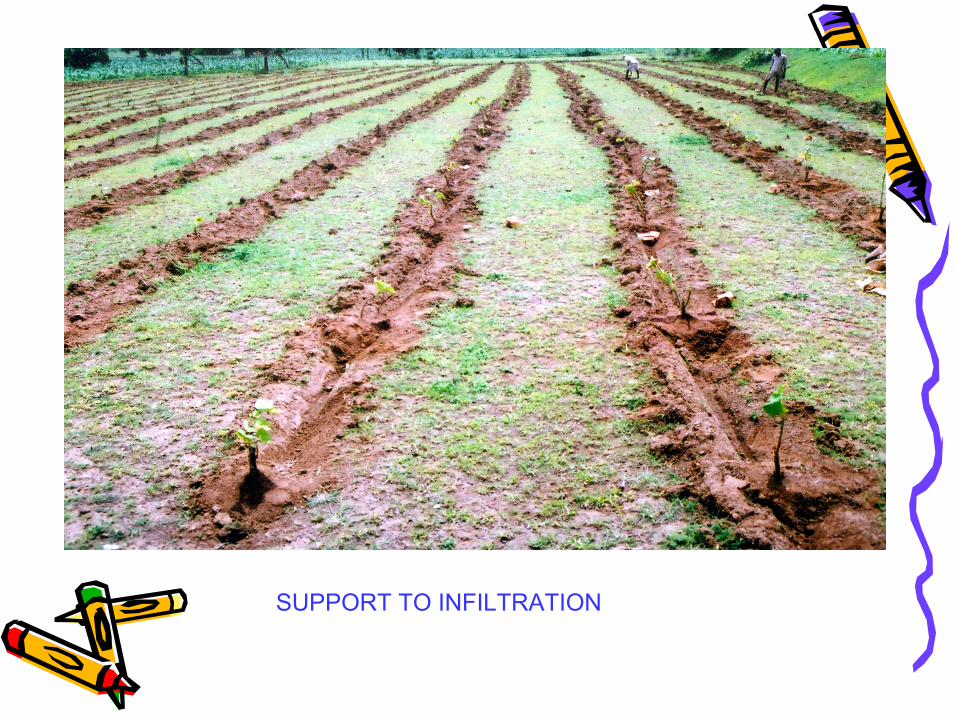
SUPPORT TO INFILTRATION

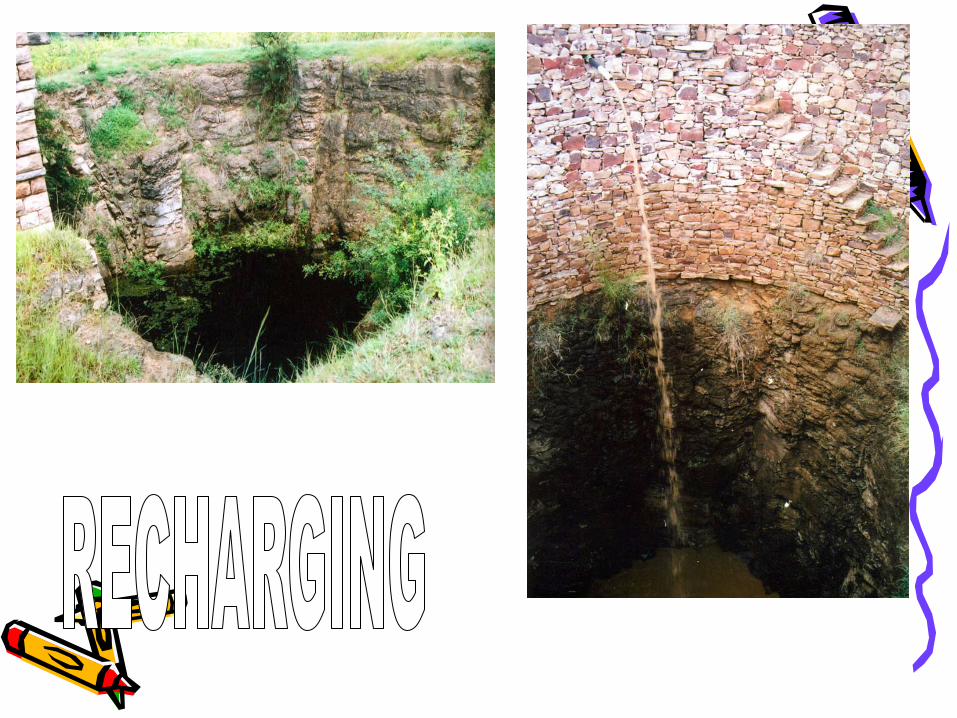

FILLING OF DUG PITRECHARGING OF BORE WELL ESCAVATION
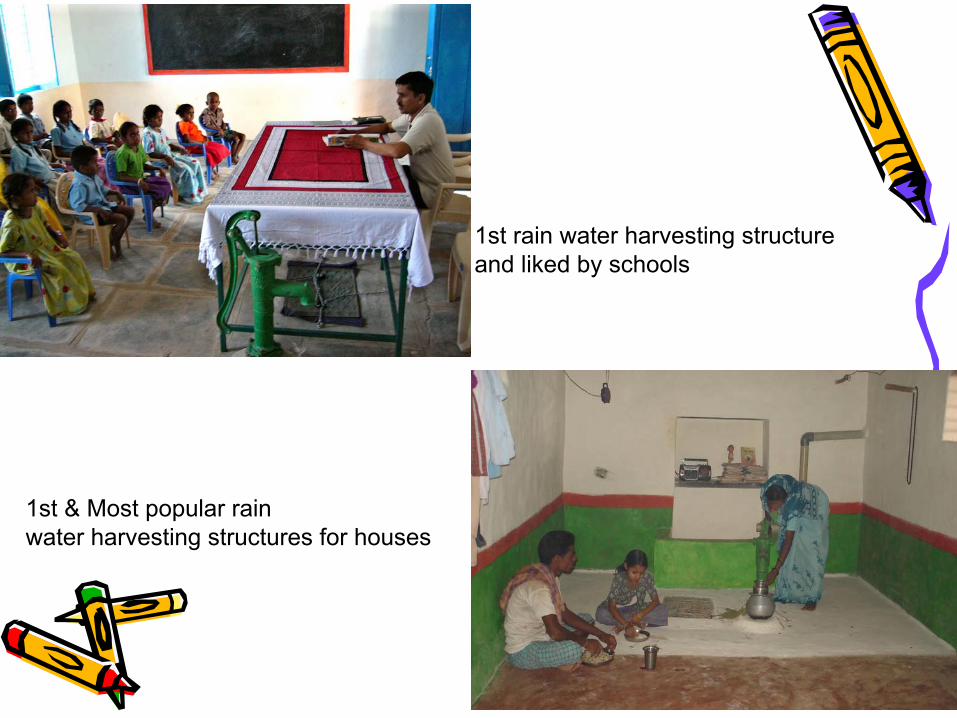
1st rain water harvesting structure and liked by schools
1st & Most popular rain water harvesting structures for houses
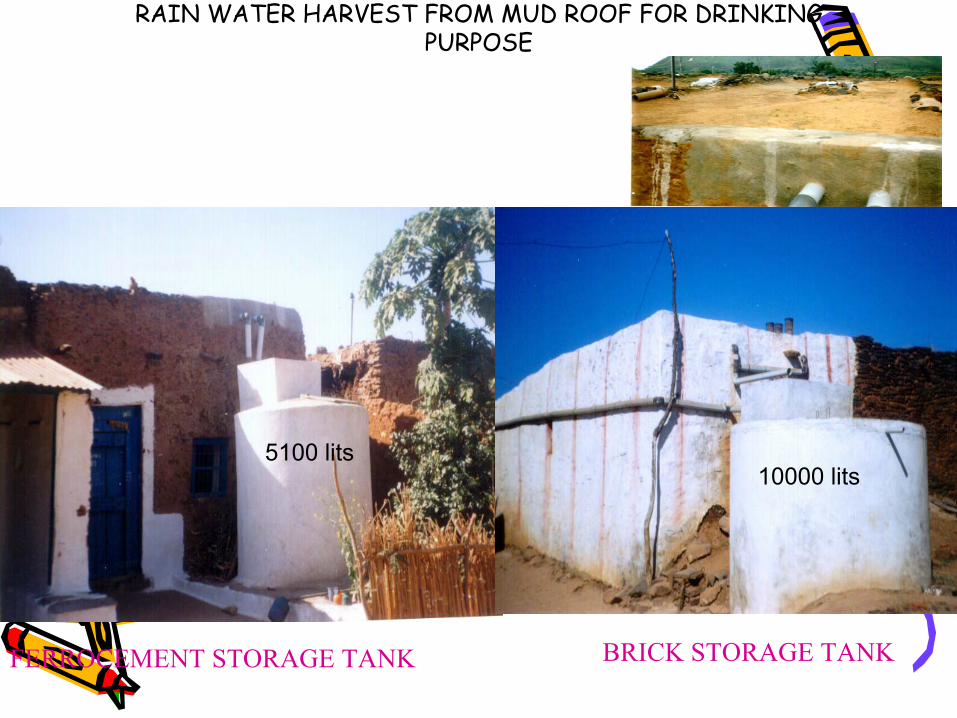
RAIN WATER HARVEST FROM MUD ROOF FOR DRINKING PURPOSE
FERROCEMENT STORAGE TANK BRICK STORAGE TANK
5100 lits10000 lits
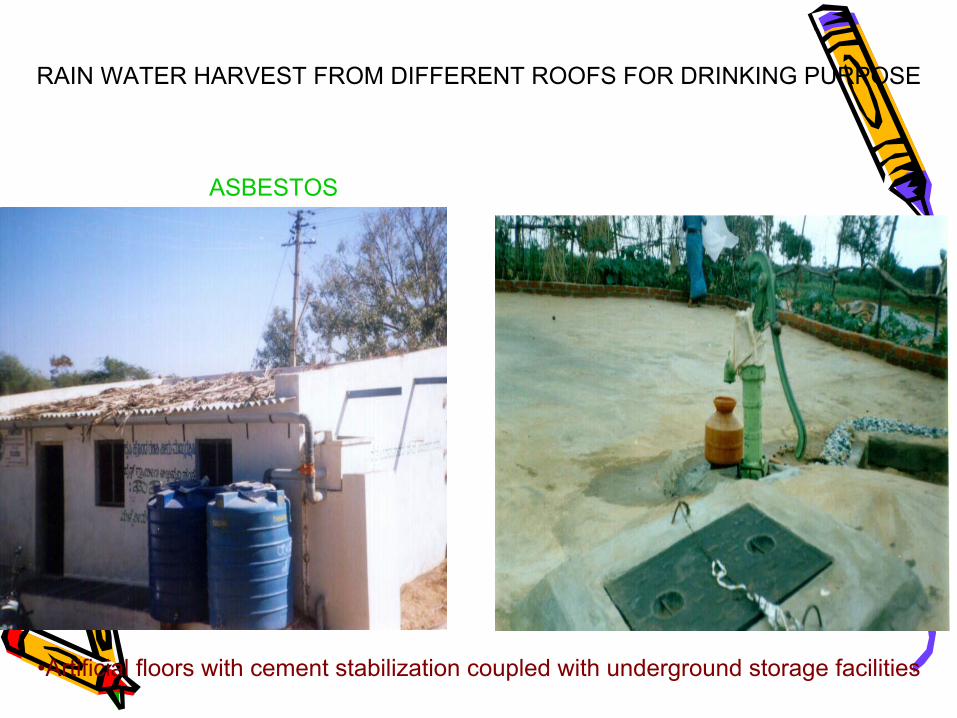
ASBESTOS
RAIN WATER HARVEST FROM DIFFERENT ROOFS FOR DRINKING PURPOSE
•Artificial floors with cement stabilization coupled with underground storage facilities

• Increased water level in bore wells

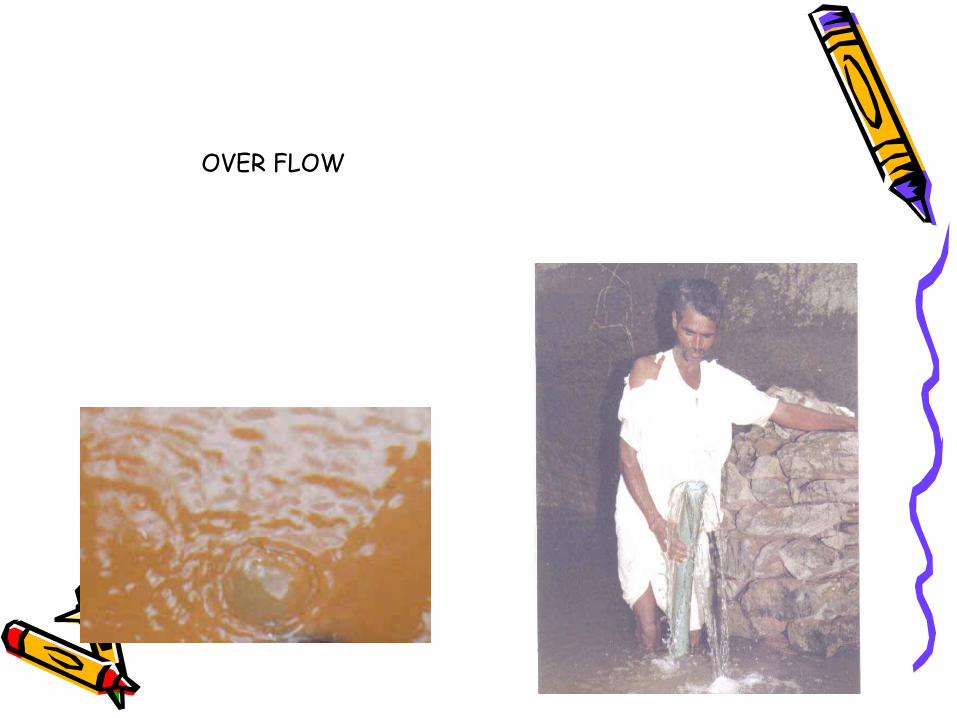
OVER FLOW

Impacts of the Programme• Increased availability of water
for drinking purpose
Survey of four villages, 432 families, shows that 173 families are drinking water of farm ponds in addition to other water resources

OUTPUT/ RESULT
Increased water level in open wells
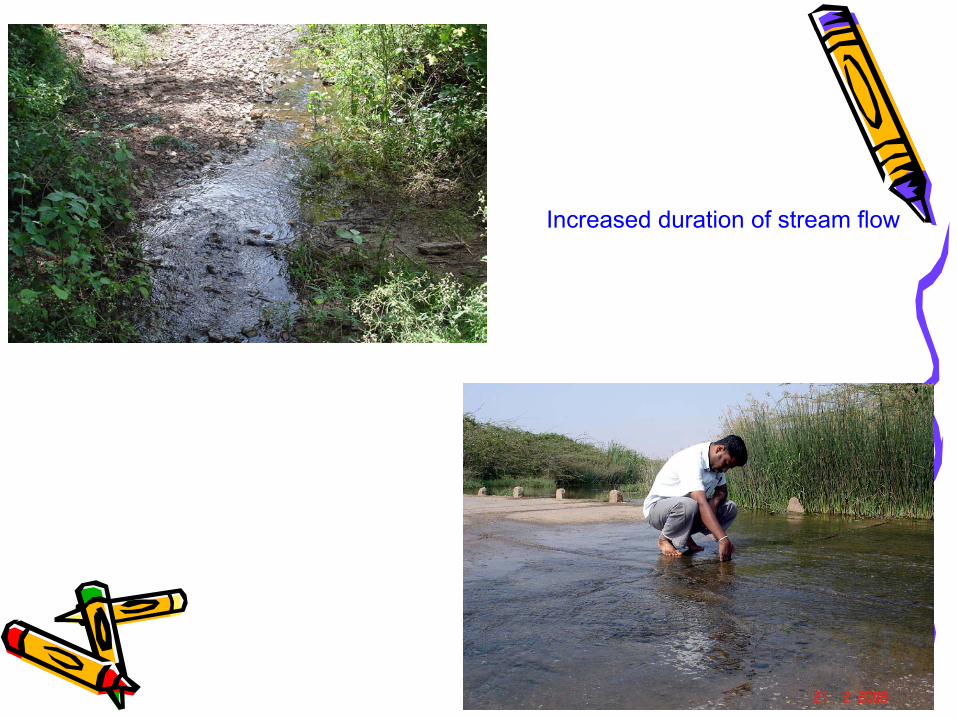
Increased duration of stream flow
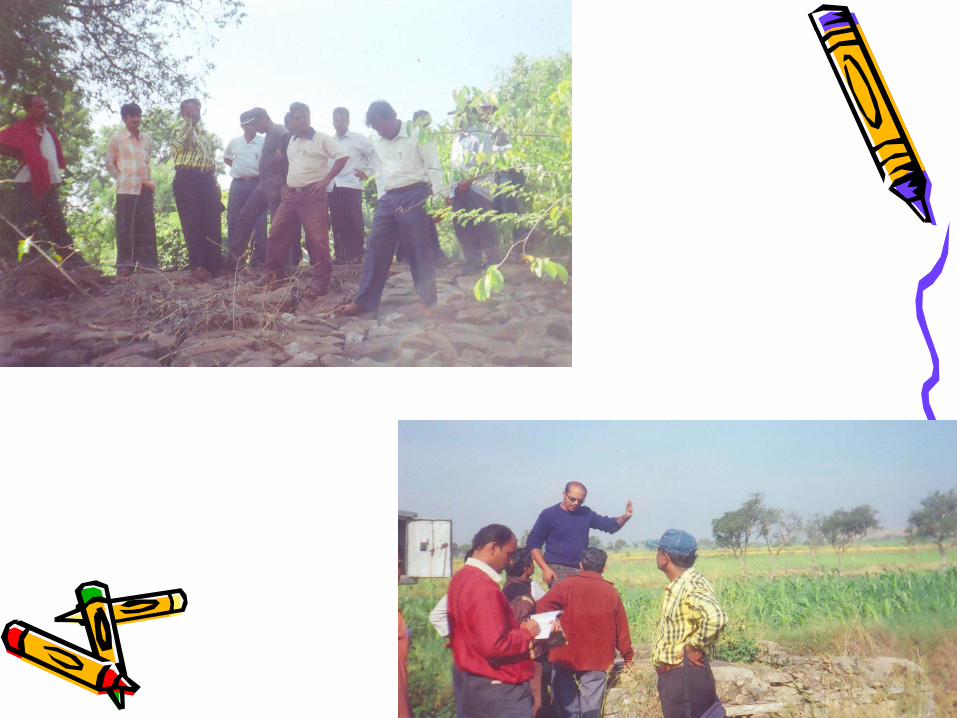

Progress review of the team
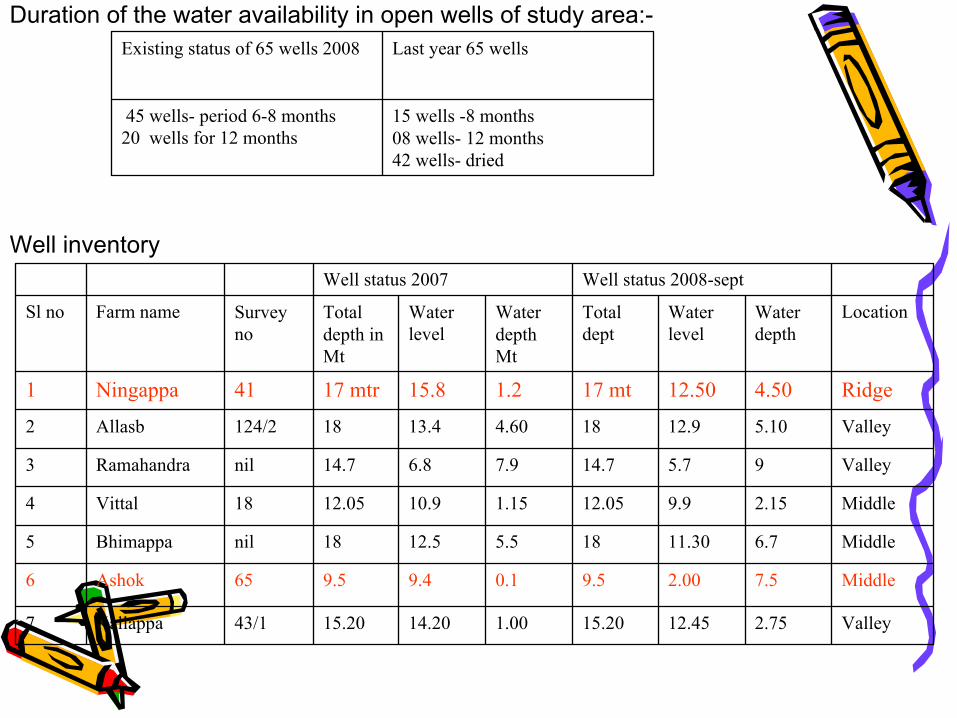
Duration of the water availability in open wells of study area:-
15 wells -8 months 08 wells- 12 months42 wells- dried
45 wells- period 6-8 months20 wells for 12 months
Last year 65 wells Existing status of 65 wells 2008
Well inventory
Valley2.7512.4515.201.0014.2015.2043/1Kallappa7
Middle7.52.009.50.19.49.565Ashok6
Middle6.711.30185.512.518nilBhimappa5
Middle2.159.912.051.1510.912.0518Vittal4
Valley95.714.77.96.814.7nilRamahandra3
Valley5.1012.9184.6013.418124/2Allasb2
Ridge4.5012.5017 mt1.215.817 mtr41Ningappa1
LocationWater depth
Water level
Total dept
Water depth Mt
Water level
Total depth in Mt
Survey no
Farm nameSl no
Well status 2008-septWell status 2007
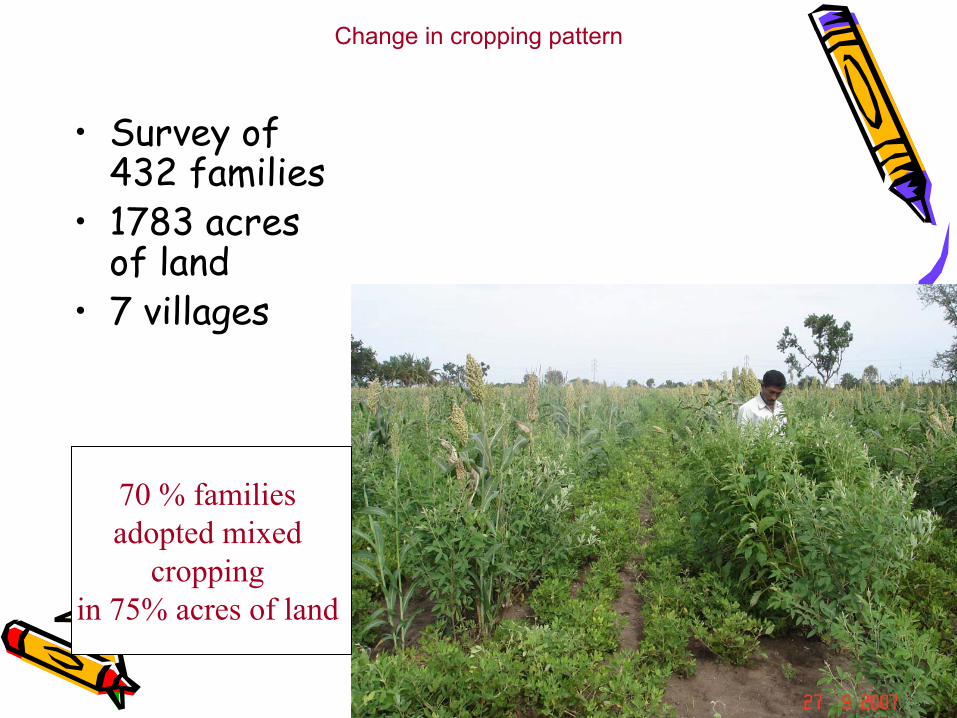
• Survey of 432 families
• 1783 acres of land
• 7 villages
Change in cropping pattern
70 % families adopted mixed
cropping in 75% acres of land
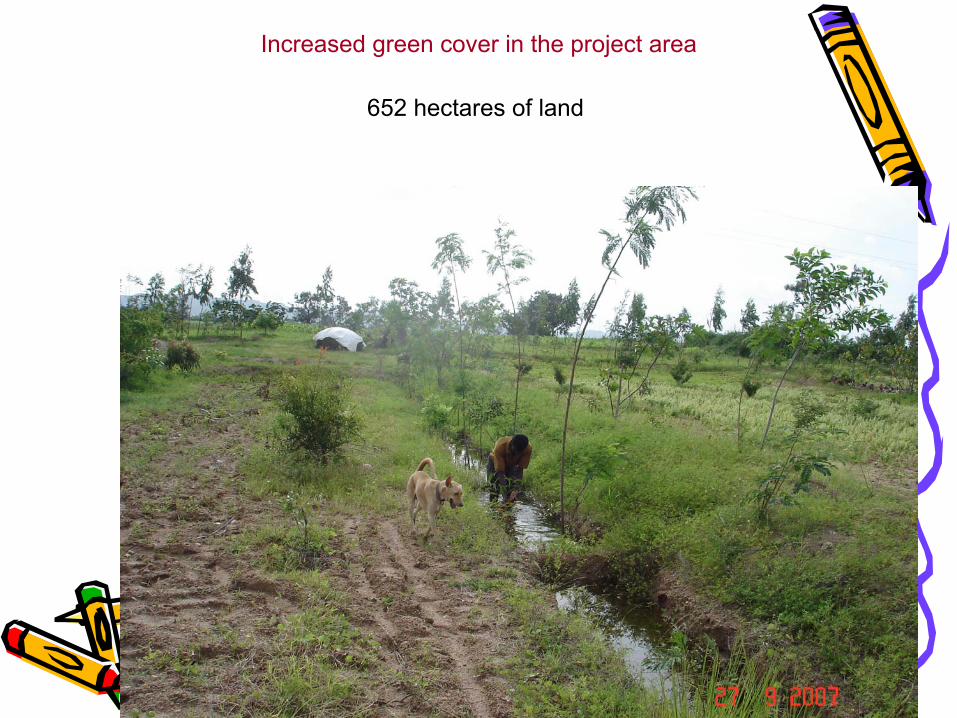
Increased green cover in the project area
652 hectares of land
Open well with
water
Average Water level in
ft
No. of dried open well
Open well with
water
Average Water level in
ft
No. of dried open well
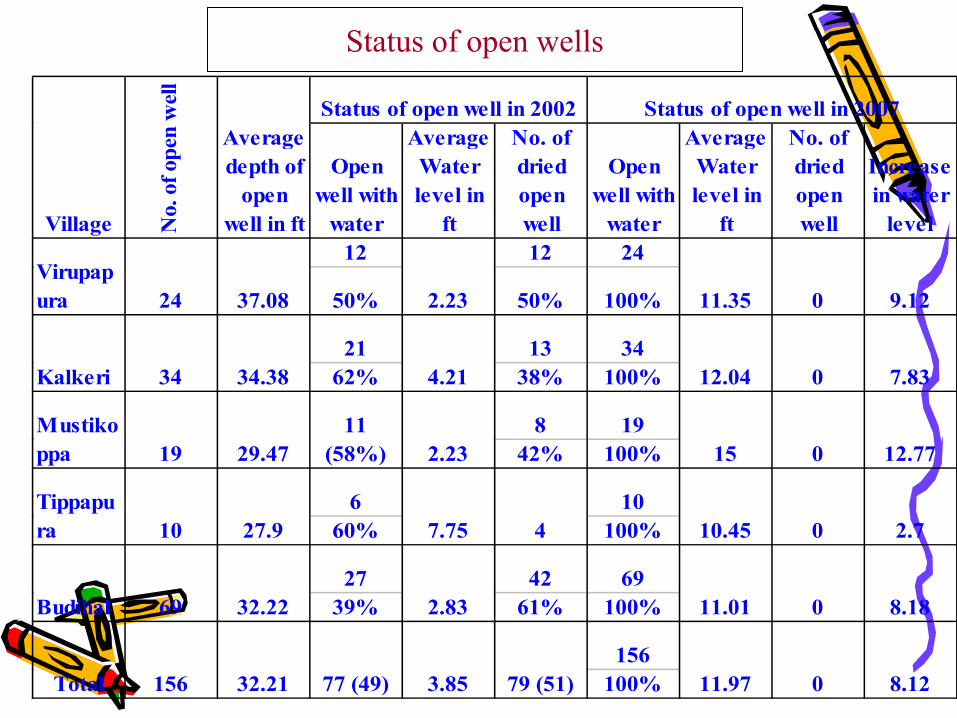
Increase in water
level12 12 24
50% 50% 100%
21 13 3462% 38% 100%
8 1942% 100%
6 1060% 100%
27 42 6939% 61% 100%
156100%
Village No.
of o
pen
wel
lAverage depth of
open well in ft
Status of open well in 2007
Virupapura 24 37.08 2.23 11.35 0 9.12
Status of open well in 2002
Kalkeri 34 34.38 4.21 12.04 0 7.83
Mustikoppa 19 29.47
11 (58%) 2.23 15 0 12.77
Tippapura 10 27.9 7.75 4 10.45 0 2.7
Budihal 69 32.22 2.83 11.01 0 8.18
Total 156 32.21 77 (49) 3.85 79 (51) 11.97 0 8.12
Status of open wells
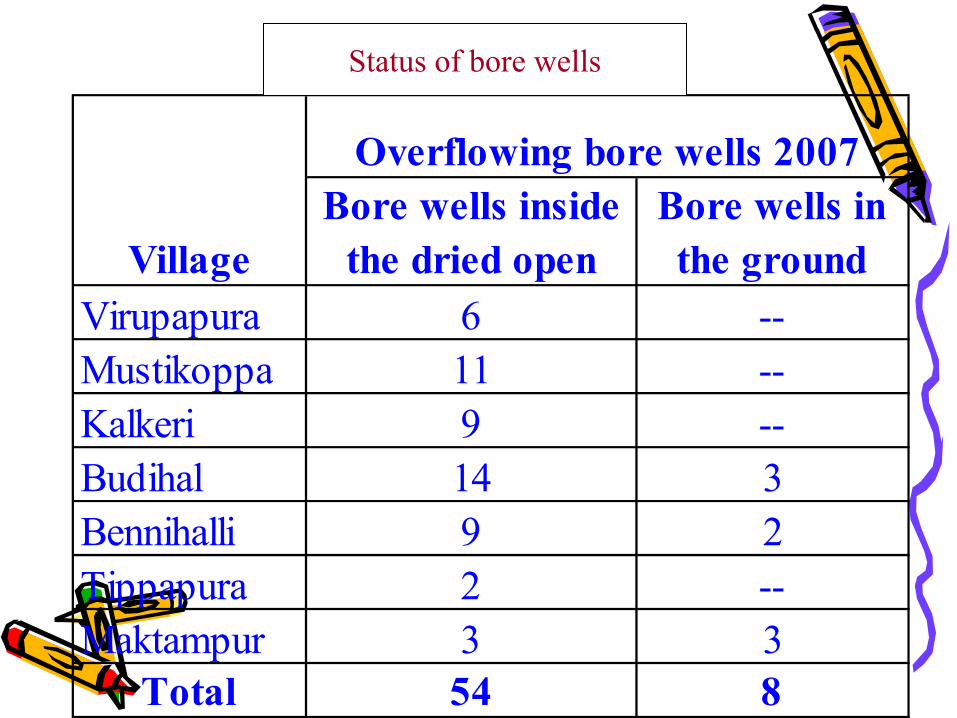
Bore wells inside the dried open
Bore wells in the ground
Virupapura 6 --Mustikoppa 11 --Kalkeri 9 --Budihal 14 3Bennihalli 9 2Tippapura 2 --Maktampur 3 3
Total 54 8
Village
Overflowing bore wells 2007
Status of bore wells
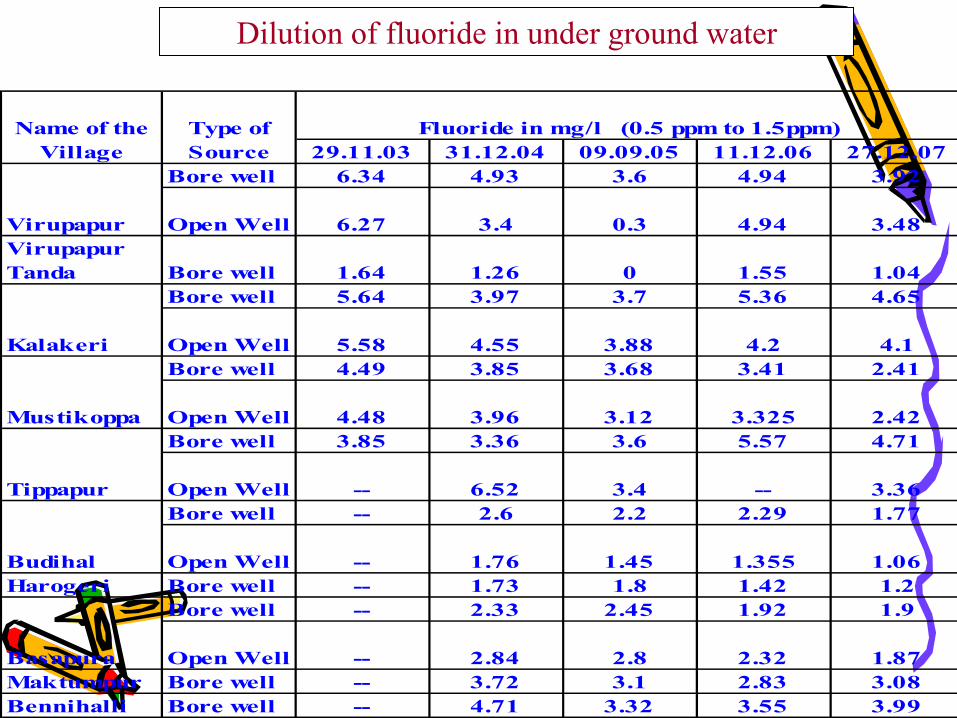
29.11.03 31.12.04 09.09.05 11.12.06 27.12.07Bore well 6.34 4.93 3.6 4.94 3.92
Open Well 6.27 3.4 0.3 4.94 3.48Virupapur Tanda Bore well 1.64 1.26 0 1.55 1.04
Bore well 5.64 3.97 3.7 5.36 4.65
Open Well 5.58 4.55 3.88 4.2 4.1Bore well 4.49 3.85 3.68 3.41 2.41
Open Well 4.48 3.96 3.12 3.325 2.42Bore well 3.85 3.36 3.6 5.57 4.71
Open Well -- 6.52 3.4 -- 3.36Bore well -- 2.6 2.2 2.29 1.77
Open Well -- 1.76 1.45 1.355 1.06Harogeri Bore well -- 1.73 1.8 1.42 1.2
Bore well -- 2.33 2.45 1.92 1.9
Open Well -- 2.84 2.8 2.32 1.87Maktumpur Bore well -- 3.72 3.1 2.83 3.08Bennihalli Bore well -- 4.71 3.32 3.55 3.99
Kalakeri
Name of the Village
Type of Source
Fluoride in mg/l (0.5 ppm to 1.5ppm)
Virupapur
Mustikoppa
Tippapur
Budihal
Basapura
Dilution of fluoride in under ground water

Increased crop production
Sl No
Name of the crop
Before the project
During 2007 Difference
% of Increase
1 Jowar 5 6.5 1.5 30%
2 Hoarse gram 2.5 3.5 1 39%
3 Red gram 3 3.5 0.5 17%4 Bangle gram 3 3.7 0.7 23%
5 Green gram 1 2.5 1.5 150%6 Ground nut 7 9 2 29%7 Sun flower 3 3.25 0.25 8%
Random survey of 125 families of 5 villages
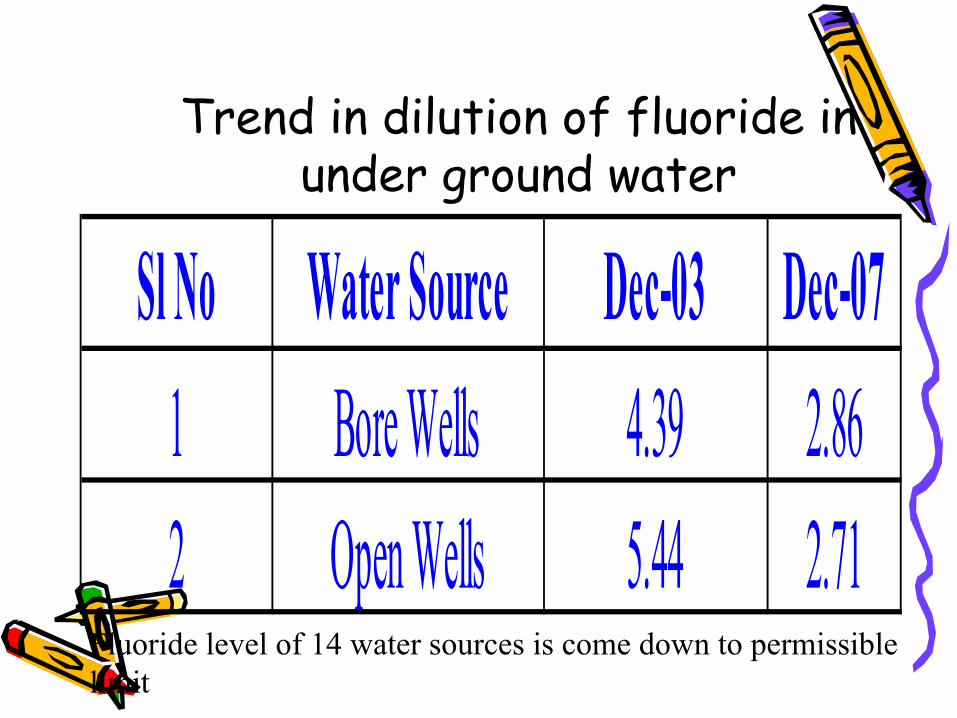
Sl No Water Source Dec-03 Dec-071 Bore Wells 4.39 2.862 Open Wells 5.44 2.71
Trend in dilution of fluoride in under ground water
Fluoride level of 14 water sources is come down to permissible limit


Before implementation-2004
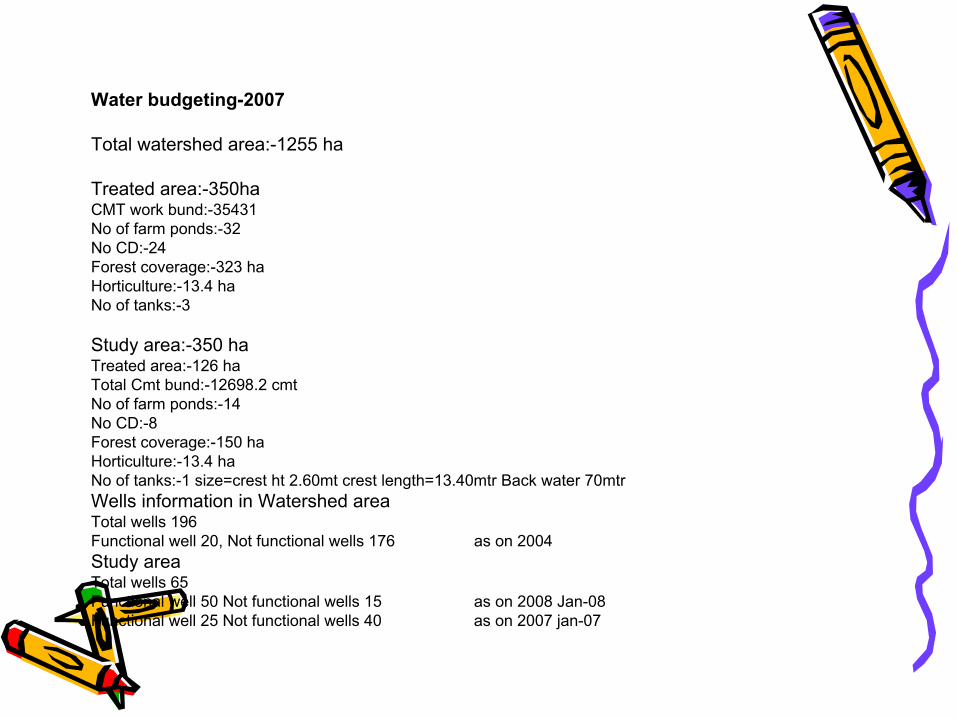
Water budgeting-2007
Total watershed area:-1255 ha
Treated area:-350ha CMT work bund:-35431No of farm ponds:-32No CD:-24Forest coverage:-323 haHorticulture:-13.4 haNo of tanks:-3
Study area:-350 haTreated area:-126 haTotal Cmt bund:-12698.2 cmtNo of farm ponds:-14No CD:-8Forest coverage:-150 haHorticulture:-13.4 haNo of tanks:-1 size=crest ht 2.60mt crest length=13.40mtr Back water 70mtrWells information in Watershed area Total wells 196Functional well 20, Not functional wells 176 as on 2004Study areaTotal wells 65Functional well 50 Not functional wells 15 as on 2008 Jan-08Functional well 25 Not functional wells 40 as on 2007 jan-07
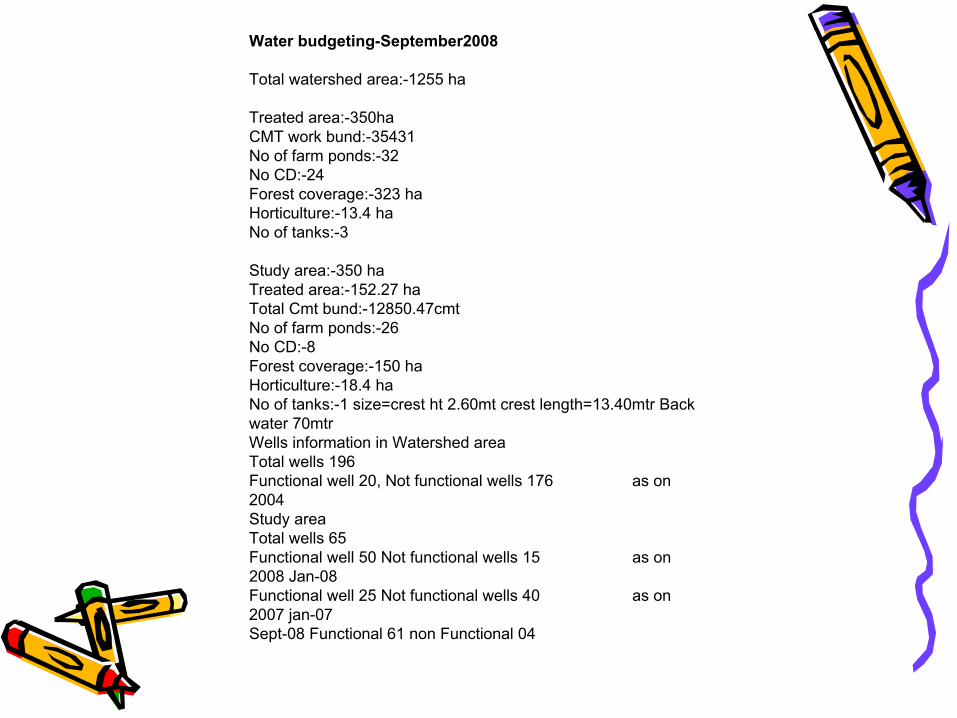
Water budgeting-September2008
Total watershed area:-1255 ha
Treated area:-350ha CMT work bund:-35431No of farm ponds:-32No CD:-24Forest coverage:-323 haHorticulture:-13.4 haNo of tanks:-3
Study area:-350 haTreated area:-152.27 haTotal Cmt bund:-12850.47cmtNo of farm ponds:-26No CD:-8Forest coverage:-150 haHorticulture:-18.4 haNo of tanks:-1 size=crest ht 2.60mt crest length=13.40mtr Back water 70mtrWells information in Watershed area Total wells 196Functional well 20, Not functional wells 176 as on 2004Study areaTotal wells 65Functional well 50 Not functional wells 15 as on 2008 Jan-08Functional well 25 Not functional wells 40 as on 2007 jan-07Sept-08 Functional 61 non Functional 04

Study area of Bagojikoppa and Mellikeri -126 haYield of the bores wells increased to 2 times irrigated area and
2 bore wells were over flowing 1bore well at chikkopa (water supply) and another bore well not fitted with motor because there was no water during drilling 2004
Monitoring of Bore wells:- Going on. One we found the irrigation area is increased compare to 2004 ieas per our data 100 ha now it is increased to double.
o30Not functional9969FunctionalAs on 2008As on 2004No of bore wells-99
Chikkoppa
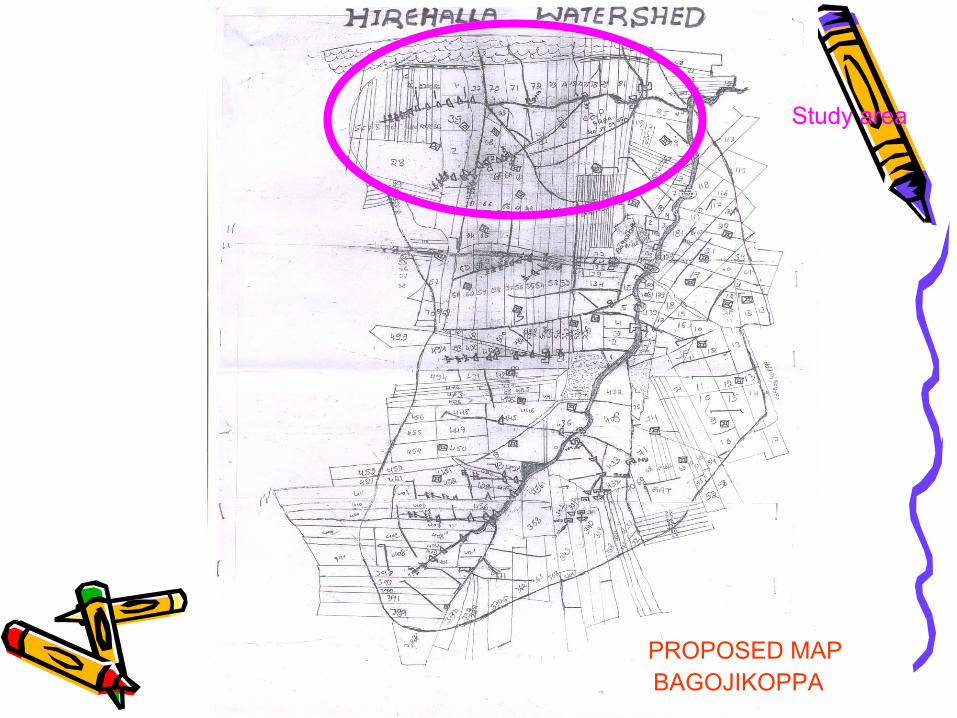
PROPOSED MAP
Study area
BAGOJIKOPPA
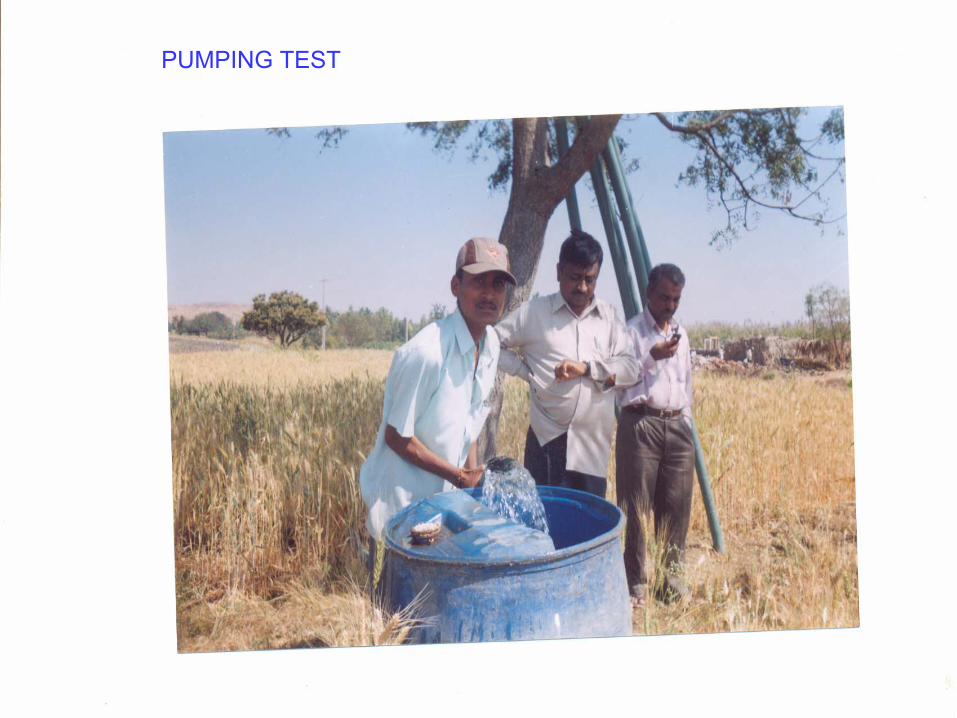
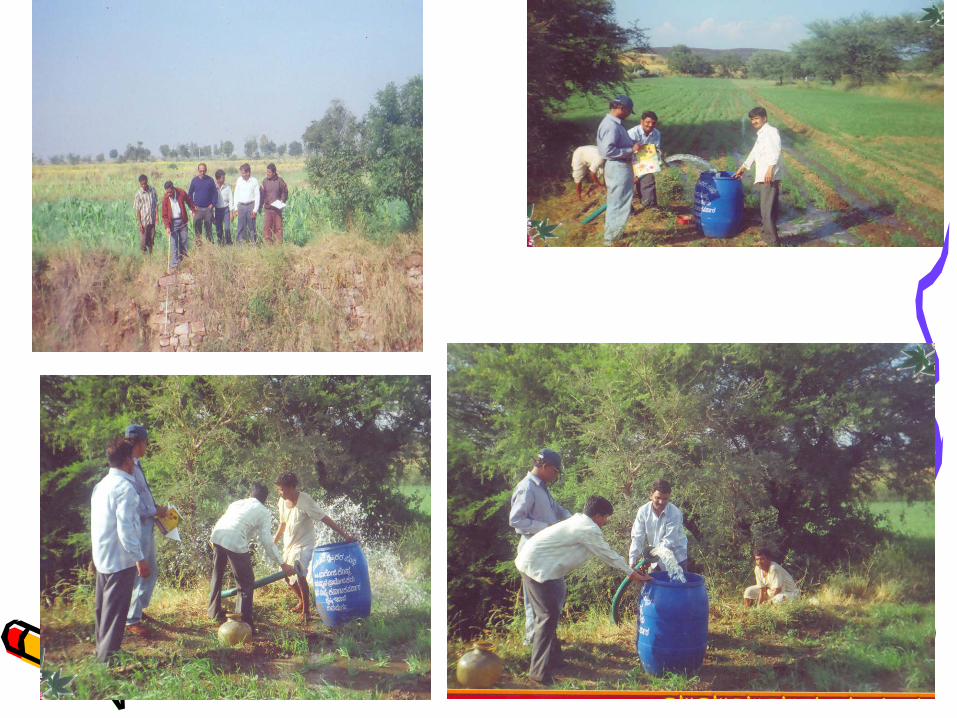
PUMPING TEST

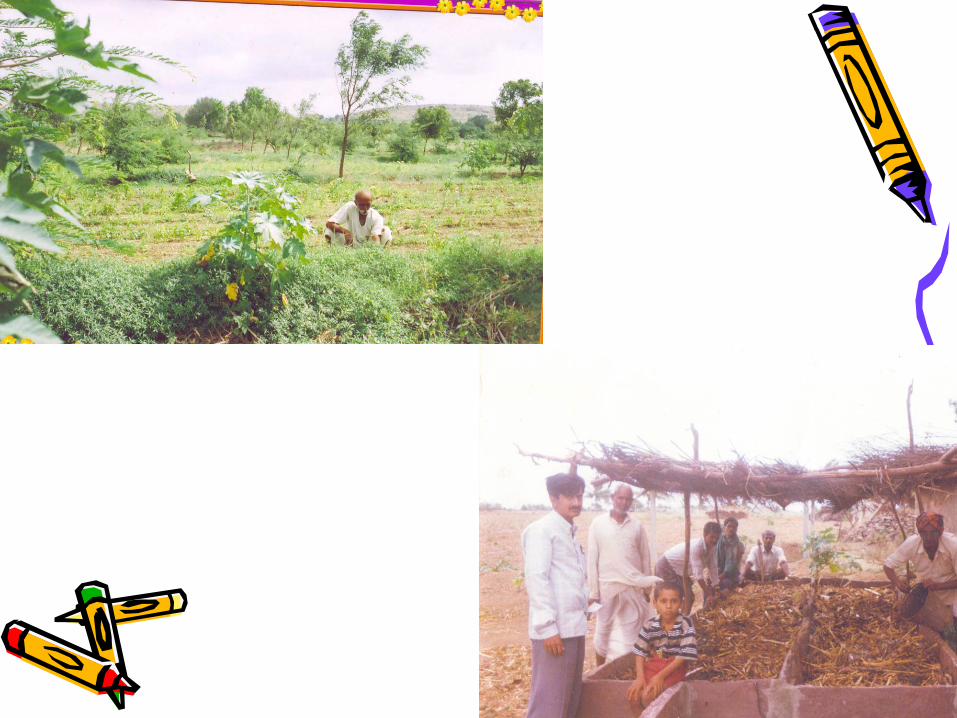
After study work
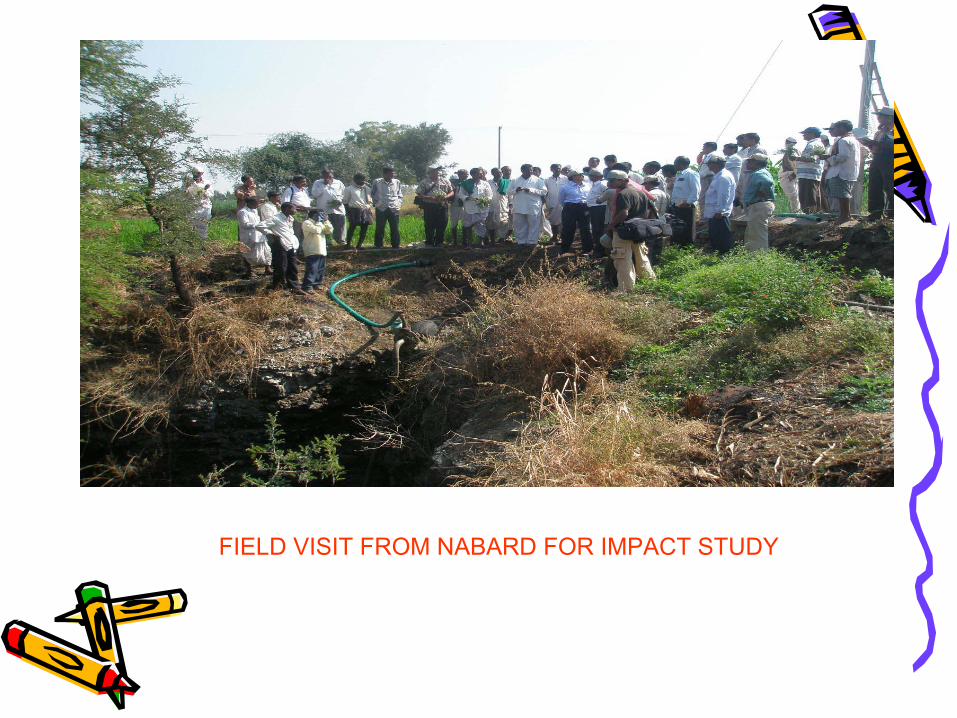
FIELD VISIT FROM NABARD FOR IMPACT STUDY
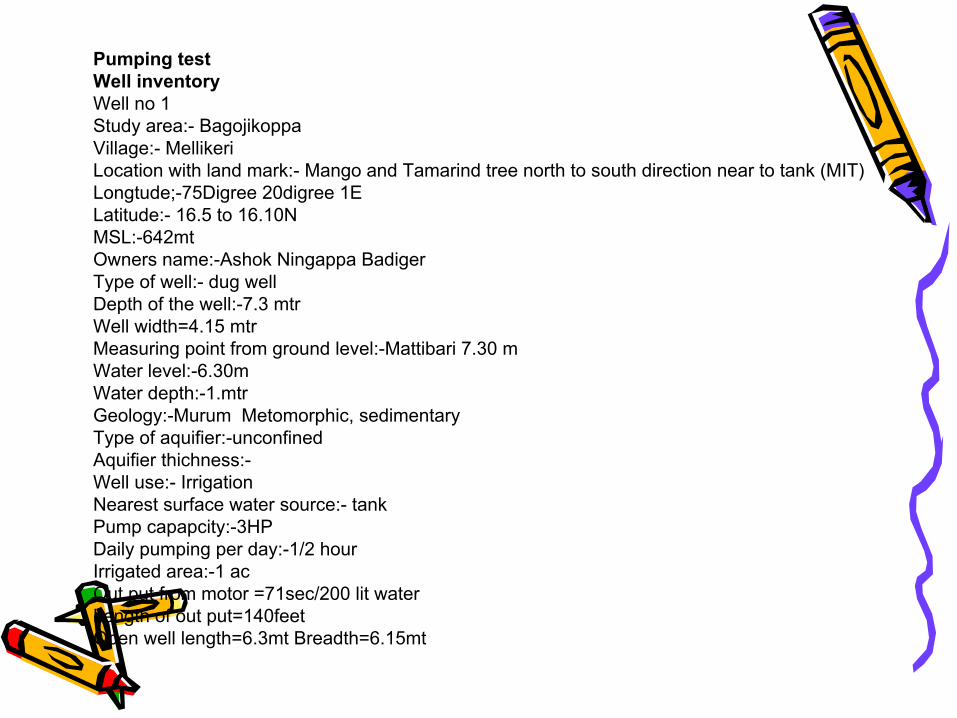
Pumping testWell inventoryWell no 1Study area:- BagojikoppaVillage:- MellikeriLocation with land mark:- Mango and Tamarind tree north to south direction near to tank (MIT)Longtude;-75Digree 20digree 1ELatitude:- 16.5 to 16.10NMSL:-642mtOwners name:-Ashok Ningappa BadigerType of well:- dug wellDepth of the well:-7.3 mtrWell width=4.15 mtrMeasuring point from ground level:-Mattibari 7.30 mWater level:-6.30mWater depth:-1.mtrGeology:-Murum Metomorphic, sedimentaryType of aquifier:-unconfinedAquifier thichness:-Well use:- IrrigationNearest surface water source:- tankPump capapcity:-3HPDaily pumping per day:-1/2 hourIrrigated area:-1 acOut put from motor =71sec/200 lit waterLength of out put=140feetOpen well length=6.3mt Breadth=6.15mt

Date Static level Reduced water level Well yield
0.04156.5012.31
0.01106.5312.26
0.0156.5312.21PM
006.5412.16PM
Recovery
0.24206.5412.16
0.19156.4912.11pm
0.16106.4612.06PM
0.0856.3812.01PM
006.30mtr11.56AM
Draw downTime minDraw down mtr
Time(min)
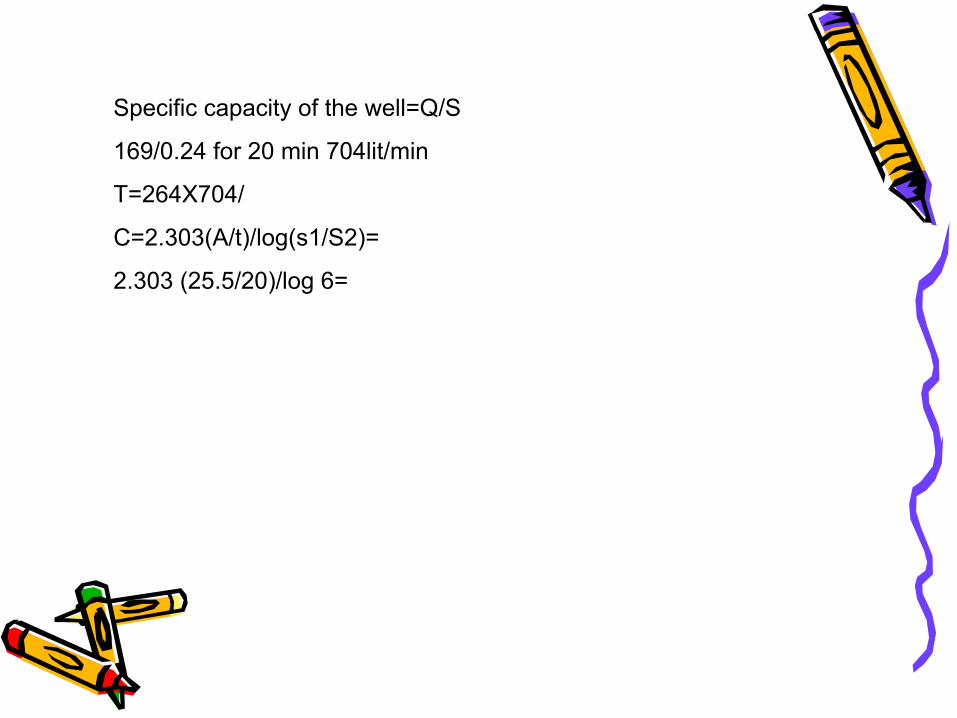
Specific capacity of the well=Q/S
169/0.24 for 20 min 704lit/min
T=264X704/
C=2.303(A/t)/log(s1/S2)=
2.303 (25.5/20)/log 6=
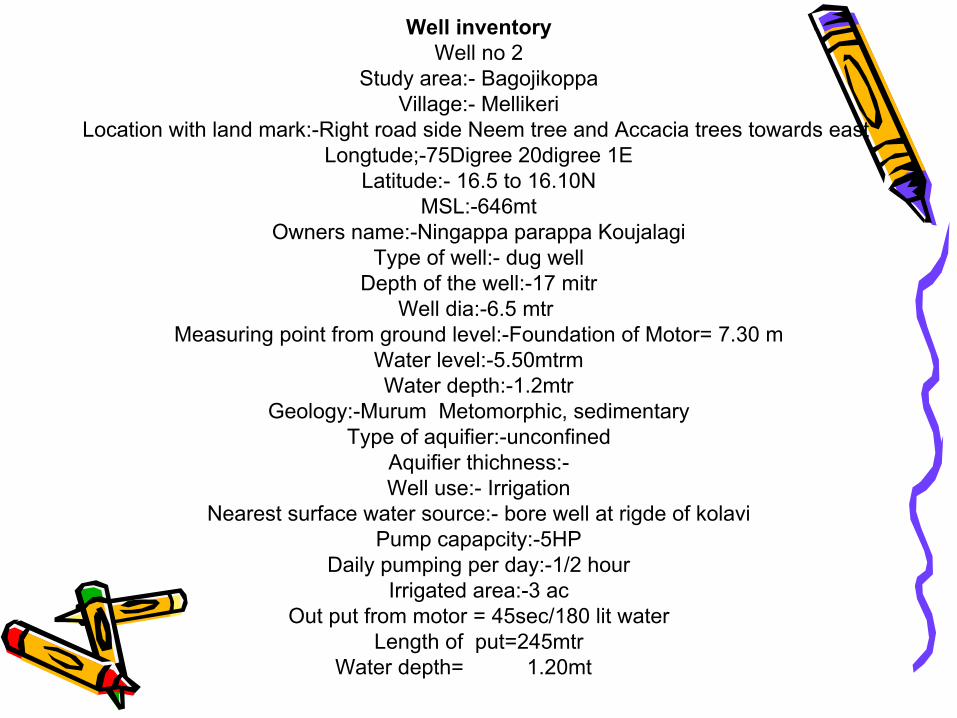
Well inventoryWell no 2
Study area:- BagojikoppaVillage:- Mellikeri
Location with land mark:-Right road side Neem tree and Accacia trees towards east Longtude;-75Digree 20digree 1E
Latitude:- 16.5 to 16.10NMSL:-646mt
Owners name:-Ningappa parappa KoujalagiType of well:- dug well
Depth of the well:-17 mitrWell dia:-6.5 mtr
Measuring point from ground level:-Foundation of Motor= 7.30 mWater level:-5.50mtrmWater depth:-1.2mtr
Geology:-Murum Metomorphic, sedimentaryType of aquifier:-unconfined
Aquifier thichness:-Well use:- Irrigation
Nearest surface water source:- bore well at rigde of kolaviPump capapcity:-5HP
Daily pumping per day:-1/2 hourIrrigated area:-3 ac
Out put from motor = 45sec/180 lit waterLength of put=245mtr
Water depth= 1.20mt
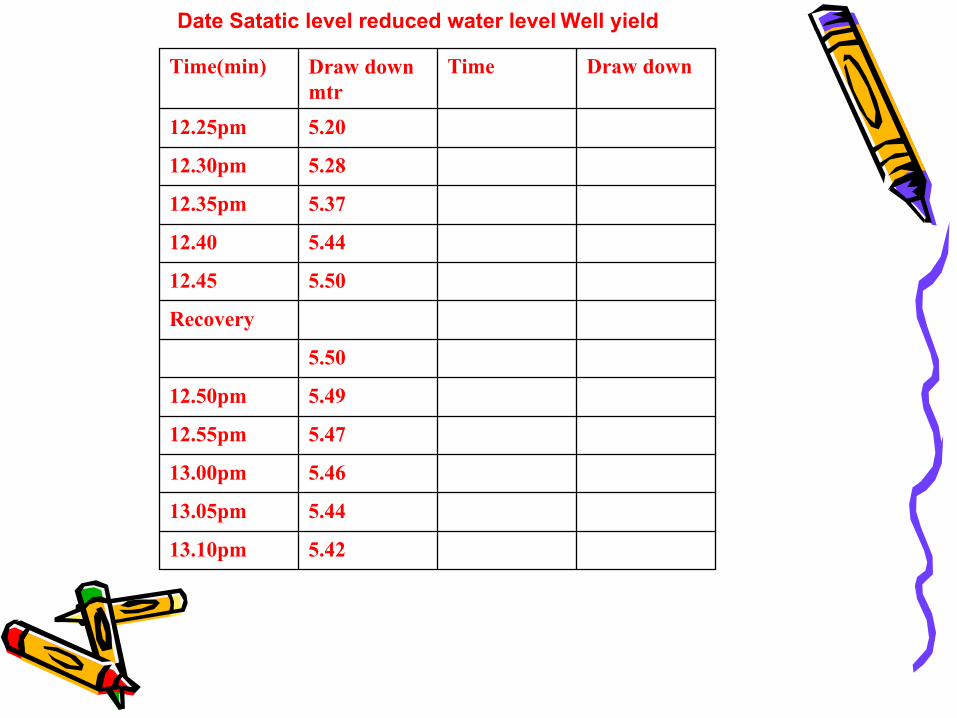
Date Satatic level reduced water level Well yield
5.4213.10pm
5.4413.05pm
5.4613.00pm
5.4712.55pm
5.4912.50pm
5.50
Recovery
5.5012.45
5.4412.40
5.3712.35pm
5.2812.30pm
5.2012.25pm
Draw downTimeDraw down mtr
Time(min)