SABAH BUSHAJ - inf-proj.epoka.edu.alinf-proj.epoka.edu.al/projects/thesis/Sabah_Bushaj.pdf ·...
42
INTRODUCING MOBILE APPLICATIONS IN SIMPLIFYING ECONOMETRIC PROBLEMS By SABAH BUSHAJ Thesis submitted to Faculty of Economics and Administrative Sciences, Epoka University, in Fulfillment of the Requirement for the Bachelor Degree of Business Informatics 2014
Transcript of SABAH BUSHAJ - inf-proj.epoka.edu.alinf-proj.epoka.edu.al/projects/thesis/Sabah_Bushaj.pdf ·...

INTRODUCING MOBILE APPLICATIONS IN SIMPLIFYING
ECONOMETRIC PROBLEMS
By
SABAH BUSHAJ
Thesis submitted to Faculty of Economics and Administrative Sciences, Epoka
University, in Fulfillment of the Requirement for the Bachelor Degree of Business
Informatics
2014

- 2 -
ABSTRACT
Faculty of Economics and Administrative Sciences
Advisor: Igli Hakrama
Nowadays, the technology has not only taken a very important place in simplifying
our most primitive daily need but it also has a crucial effect on the economy by
completely reformatting even the simplest economic activities and let alone the
solving of problems that the human could have never even dreamed about it.
Using technology and the new trends in economics is a great competitive advantage
for every business or organization. Especially in the statistics and econometrics the
software takes an important role in estimating equations that the men would take
days and weeks of calculations. By the assistance of programs like Eviews, SPSS etc.
every field of the economy is not only made easy but also more exact for prediction
and forecasting. With Eviews are performed the most important economical
concepts like Estimation, Forecasting, Statistical Analysis, Data Management,
Simulations and Graph. Every company, government agency, students, researchers
and corporations can use this powerful tool with its easy-to-use interface with its
functionalities and it would simplify its job and reduce labor force needs.
The technology is also a major factor causing globalization. As we may know every
one of us has the chance and it’s able to buy online, to work online, to study online
and so many other opportunities offered online for every person all around the world.
Another new trend, in which we will concentrate are the mobile technology. The
newest trend, the most influencing technology nowadays, offering the opportunity to
be online wherever you are. Connecting people all around the world the mobile
technology is a new exploding market with many ways to make profits.

- 3 -
With our program every person, be it a student, a researcher or a teacher, this
application with look forward to offer them the easiest way possible to gather data
and to make statistical analysis. There is no need to make so many efforts into the
roads just to select a sample space so that to perform analysis, this function is easily
done just by collecting information with the android application about all the surveys
that we want to make. After that there is no need to put it on Eviews also, because we
will offer some simple functionalities like running a regression, making estimations
and hopefully many more important functions by time.

- 4 -
ABSTRAKT
Fakulteti i Ekonomisë dhe Shkencave Administrative
Udhëheqës: Igli Hakrama
.Në ditët e sotme teknologjia jo vetëm që ka zënë një vend të rëndësishëm duke bërë
më të thjeshtë jetën tonë dhe veprimet tona më primitive por ka gjithashtu një efekt
themelor në ekonomi duke reformuar edhe activitetet më të thjeshta ekonomik madje
edhe problemat që njeriu I disa dekadave më parë nuk I ka imagjinuar.
Përdorimi i teknologjise dhe i risive të reja teknologjike në ekonomi është një
avantazh në konkurencë për çdo biznes dhe organizatë. Vexanërisht në statistika dhe
në ekonometri programet kompjuterike kanë një rol shumë të rënësihsëm vlerësimin
dhe zgjidhjen e ekuacioneve që njeriut do i duheshin javë të tëra llogaritje
matematikore. Me ndihmën e programeve të tilla si Eviews, SPSS etj. çdo fushe e
ekonomisë jo vetëm që bëhet më e thjeshtë por edhe më ekzakte për parashikim dhe
planifikim. Me Eviews kryhen funksionet më të rëndesishme ekonomike si
Parashikimi, Analizat Statistikore, Menaxhimi i të dhënave, Simulime dhe Grafikët.
Çdo kompani, agjensi qeveritare, hulumtues, student dhe korporatë mund të pëdori
këtë aplikacion me mjetet e tij dhe me grafikën e tij të thjeshtë për tu përdorur dhe do
ti thjeshtonte shumë pune dhe do i minimizonte shumë kosto të ndryshme.
Teknologjia është gjithashtu një factor madhor në globalizim. Sic mund ta
dijmë, secili nga ne ka mundësinë të blejë online në të gjithë botën, të punojë online,
të studiojë online dhe shumë e shumë mundësi të tjera për çdo person në të gjithë
botën.
Një risi e re e teknologjisë, në të cilën do të përqëndrohemi gjatë zhvillimit të
aplikcionit është ajo e smartphonëve. Risia më e re, më me ndikim në ditët tona,

- 5 -
duke ofruar mundësinë të jesh online kudë që të jesh. Duke sjellë së bashku njerëz
nga e gjithë bota kjo teknologji është një market “shpërthyes” me shumë mënyra për
fitim.
Me programin tonë cdo person, student, hulumtues apo mësues, aplikacioni ynë do
ketë si qëllim tju ofrojë atyre mënyrën më të thjeshtë të mbledhjes së informacionit
dhe të të kryerit të analizave statistikore të ndryshme. Nuk do të ketë më nevojë që të
lodhen aq shumë për të mbledhur informacion rrugëve që të mund të bëjnë analiza
statistikore, ky funksion bëhet tashmë shumë thjeshtë duke mbledhur informacion me
anë të një aplikacioni android për cdo studim që kërkojnë të bëjnë. Pastaj nuk do jetë
e nevojshme as vendosja e të dhënave në Eviews sepse ne do të implementojmë disa
funksione të thjeshta sic është bërja e një regresioni, vlerësimi i koeficientëve dhe
shpresojmë se do sjellim edhe me kohën.

- 6 -
ACKNOWLEDGEMENTS
I would like to thank all the professors that i got to meet during my 3 year education
at Epoka University. They all have left their traces on our education and life also. It
was them who leaded us to the world of education and studies helping us to get
knowledge regarding what we need and then to go out in the world and conquer.
Special thanks to Igli Hakrama, my thesis advisor, for guiding me through the steps
of making a regular thesis and application.

- 7 -
DECLARATION
I hereby declare that the thesis is based on my original work except for the quotations
and citations which have been duly acknowledged. I also declare that it has not been
previously or concurrently submitted for any other degree at Epoka University or any
other institutions.
SABAH BUSHAJ
Friday, June 6, 2014

- 8 -
TABLE OF CONTENTS
ABSTRACT ............................................................................................................................... 2
ABSTRAKT ............................................................................................................................... 4
ACKNOWLEDGEMENTS ....................................................................................................... 6
DECLARATION ....................................................................................................................... 7
CONTENTS ............................................................................................................................... 8
TABLE OF FIGURES ............................................................................................................... 9
LIST OF ABBREVIATIONS / NOTATIONS / GLOSSARY OF TERMS ........................... 10
CHAPTERS
1 Introduction ........................................................................................................................... 11
2 Literature Review .................................................................................................................. 14
2.1 Econometrics: ................................................................................................................. 15
2.1.1 How do we use Econometrics? ................................................................................ 17
2.2 ICT effect on the economic development ...................................................................... 19
2.2.1 The running world of the ICT .................................................................................. 20
2.2.2 The effect of mobile technology in daily life .......................................................... 22
Software Analysis and Design ................................................................................................. 24
3.1 Functional Requirements ................................................................................................ 24
3.1.1 Usability Requirements............................................................................................ 24
3.1.2 Performance Requirements ...................................................................................... 24
3.1.3 Supportability Requirements ................................................................................... 25
3.1.4 Security Requirements ............................................................................................. 25
3.2 Non-Functional Requirements........................................................................................ 26
3.2.1 Hardware Requirements .......................................................................................... 26
3.2.2 Software Requirements ............................................................................................ 26
3.3 User Profile ..................................................................................................................... 27
3.4 System Design ................................................................................................................ 28
4 Implementation ..................................................................................................................... 38
4.1 Technologies .................................................................................................................. 38
4.2 Database Structure .......................................................................................................... 39
4.2.1 Local Database ......................................................................................................... 40
4.3 Server Side Programming .............................................................................................. 40
4.4 Android Application ....................................................................................................... 41
5 Conclusion and Future Work ................................................................................................ 42
REFERENCES ......................................................................................................................... 43

- 9 -
TABLE OF FIGURES
FIGURE 1 – FROM PDA TO SMARTPHONES ................................................................................... 21
FIGURE 2 - USER USE CASE DIAGRAM ......................................................................................... 26
FIGURE 3 - ACTIVITY DIAGRAM – PROFILE MANAGEMENT .......................................................... 28
FIGURE 4 – ACTIVITY DIAGRAM – SURVEY MANAGEMENT ......................................................... 29
FIGURE 5 – USER STATE DIAGRAM – .......................................................................................... 31
FIGURE 6 – OVERVIEW OF CLASS DIAGRAM – ............................................................................. 32
FIGURE 7 – OVERVIEW OF OBJECT DIAGRAM – ........................................................................... 33
FIGURE 8 – OVERVIEW OF COMPONENT DIAGRAM – ................................................................... 34
FIGURE 9 – OVERVIEW OF DEPLOYMENT DIAGRAM – ................................................................. 35
FIGURE 10 – THE TECHNOLOGY INTERACTION ........................................................................... 37
FIGURE 11 - OVERALL VIEW OF THE DATABASE STRUCTURE ...................................................... 38
FIGURE 12 – A JSON RESPONSE FROM THE SERVER ..................................................................... 40

- 10 -
LIST OF ABBREVIATIONS / NOTATIONS / GLOSSARY OF
TERMS
OLS – Ordered Least Squares
BLUE – Best Linear Unbiased Estimator
ICT – Information and Communication Technology
IBM – International Business Machines Corporation
ITU – International Telecommunication Unit
GDP – Gross Domestic Product
PDA – Personal Digital Assistant
GCM – Google Cloud Messaging
- 11 -
CHAPTER 1
Introduction
“Many people see technology as the problem behind the so-called digital divide.
Others see it as the solution. Technology is neither. It must operate in conjunction
with business, economic, political and social system.”1
As it is clearly seen today by comparing the economic development just by having a
look at the time series and the difference between them the technology is the biggest
factor which takes a big credit in this change. Technology itself is born as an
economic advance and became the biggest factor in the development of the economy.
The impact of the technology itself is divided into five periods based on the Western
culture (Smihula, 2011):
1. Financial-agricultural revolution (1600–1740)
2. Industrial revolution (1780–1840)
3. Technical revolution (or Second Industrial Revolution) (1880–1920)
4. Scientific-technical revolution (1940–1970)
5. Information and telecommunications revolution (1985–2000)
During my paper I will base on the 5th
period. This period describes the newest trend
of using technology in the economic activities. The new trend is al based over the
importance of the information in economy. This period is described by (Weiner,
1948) as “information is information not matter not energy” stating that the
1 Carly Fiorina- Ex Executive and president of Hewlett-Packard Co

- 12 -
information is the third component that the world should consider alongside with the
matter and energy. Information nowadays is considered a very important business
activity because the businesses produce, collect, process, distribute and control the
information. Even the labor force is distinguished between its physical meaning and
intellectual form. This is where the technology fits into the economy pushing it to
develop further by creating ways to deal with information.
Nowadays this structure that hold the development of the information structuring and
transmission is called as ICT (Information and Communication Technology).
The most influencing innovations are the Laptop (1980), World Wide Web (1989),
and Smartphones (2010). The latest breakdown in the economic point of view for the
technology are the smartphones. They break the taboo of the accessing the web just
from a laptop or a desktop computer. In the context of the mobile applications there
are two types: web applications and native applications. They differ in the fact that
the native applications can directly access the devices hardware like the GPS, storage
etc.
Coming to our application, a combination of both mobile and also web
programming, offering an existing service in a more attracting and easy to manage
way. Survey conductors nowadays have to pass through many steps just to make a
simple survey, and even after that to write the information in the database and also in
the programs that they will use to make regressions.
While with this implementation, a web server with a database to store the collected
information done just by sending a form so that the users can fill the information, it
offers them a great and easy solution which is all done automatically. The web server
is needed because there will be too much information to be stored on the device
- 13 -
which makes it impossible to have just an android application making all the work
itself without needing to include a web server. So the best possible way is to create
communication between the android and the web server and store the information on
the database. With its simplicity to use this program will come to help to all the
students looking forward to make any statistics. As a result the student involvement
and participation in the practice terms of statistics with make them perform better.

- 14 -
CHAPTER 2
Literature Review
2.1 Econometrics:
The term “econometrics” is believed to have been crafted by Ragnar Frisch (1895-
1973) of Norway, one of the three principle founders of the Econometric Society,
first editor of the journal Econometrica, and co-winner of the first Nobel Memorial
Prize in Economic Sciences in 1969. It is therefore fitting that we turn to Frisch’s
own words in the introduction to the first issue of Econometrica to describe the
discipline.
Econometrics includes all the theories of mathematics and statistics so that we can be
able to test hypothesis and forecast the future of the economy. Econometrics uses
economic models and by testing them with statistics methods they are compared with
reality examples.
Econometrics is divided into two types: theoretical and applied. Econometrics is the
usage of probability, frequency distributions, statistical inference, regression analysis
and time series data to predict and calculate the expected values and returns of the
economy. A case would be to study a hypothesis that a person’s spending increases
while his income increases.
As it is seen above the first definition still remains valid but by time the usage of the
econometrics and its terms have evolved. The theoretical studies the development of
the methods and tools to be used to solve economic models while the applied
describes the econometrical application to these models by using the economic data.
A very important step in the evolution of the econometrics is also the paper of the
Trygve Haavelmo (1911-1999) “The probability approach in econometrics” which

- 15 -
also gave him the Nobel Memorial Prize in Economic Sciences. He initiated today’s
stochastic models which is the estimation of the probability of the outcomes within a
forecast using random variables.
Based on the structuring of the observations econometrics data are separated in 3
main data types: cross-sectional, time-series and panel data.
Cross-sectional data types generally have a large sample size and they have an
observation for each individual. The individuals may be persons, households, firms
or other economic data.
Time-series data are based on time. A feature of the time-series is the serial
dependence so there is no random sampling. Sample size is typically small since data
are only available at a low frequency.
Panel data is the combination of the cross-sectional data with the time-series data.
This data are based on the collection of the dataset from individuals repeatedly over
time.
In order to have an effective study all the data must be random. It means that all the
data should have the same probability to be chosen. In Econometrics is called as iid
(independent and identically distributed). We will assume that all our observations
are a result of a random sample.
2.1.1 How do we use Econometrics?

- 16 -
The 1st step is to identify the problem of the phenomena. What factors affect the
variable that we want to study? How is it determined? What type of relationship do
they have?
Then study the case, review all the information about the problem. Study all the
literature related to the problem so that you be effective in the next step. After that
we need to come up with the economic model for ex: price of a house = (floor space,
yard, location) etc.
This step is all you need form the economics point of view. After this step all you
need is statistics and econometric models. We will transform the economic model to
an econometric model which would be of a form:
y = β0 + β1x1+βixi + u
Finally we estimate the econometric model and test the results.
Simple Regression Model
A simple regression model is written as below:
y = β0 + β1x1+βixi + u
where y is called the explained or dependent variable and x-is are called as the
explanatory variable or the independent variables.
As we mentioned above, in order to make our calculations we have to hold some
assumptions. The 1st assumption we mentioned was the random sample.
The 2nd
is that it is important that the y value (the dependent) has a linear relationship
with other x-is and also with the error tem (u).

- 17 -
Another important assumption is the E(u) = 0 (Zero Conditional Mean). It states
assumes that:
E(u|x) = E(u) = 0 which means that : Cov(x,u) = E (x|u)=0
Translated to word it means that there should not exist any correlation between the x-
is and the error (u) must be 0 and on average the estimation should be equal to the
real thing. The intention of the assumption is to give us E(y|x) = β0+β1x1, meaning
that the estimation of the dependent variable (y) must be explained only by the x-is
and their coefficients. This is also called as the population regression function. It
shows that a one-unit increase x is expected to change the value of y by β1.
Another assumption which is considered as week is the sample variation in x-is. It
implies that x must not vary in the population. If the standard deviation of the x-is on
the sample is 0 then this assumption fails.
Based on these assumptions we conclude on a theorem:
Unbiasedness of OLS states that if the four assumptions hold then on average we hit
the target meaning that the estimators are distributed just around the real thing.
But with these assumptions we only know that the estimation of the β1 is centered on
the real β1 but we need to know our expectations. How far it will be away??? It is
needed to choose the best model among the unbiased models.
With the help of the four assumptions we can calculate the variance of the OLS.
The assumption on the variance is known as Homoscedasticity and it states that the
variance of (u) which is the unobserved variable, conditional on x, is constant. It is
written as Var(u|x)=α2.

- 18 -
These assumptions are known as the Gauss-Markov theorem and they are said to
give us the BLUE (Best Linear Unbiased Estimator).
2.2 ICT effect on the economic development
Many authors have written about the effect of ICT on economic growth. Many of the
authors could not find a positive significant of the ICT in the economic growth, but
on a regression2 made between GDP and ICT using panel data to explore the effect
of the ICT on economic growth the results show a significant positive coefficient in
the ICT measuring the effect in 159 countries. It is seen that in the countries with
larger GDP the ICT coefficient is higher and lower in the countries with lower GDP
implying that these countries should use more ICT in the economy.
Especially in the case of the econometrics the use of the ICT has made big steps for
the economists. A t-test is actually easy, can be done by hand, also an f-test can be,
why not??
But when it comes to testing about Heteroskedasticity, functional form, trend and
seasonality and many other function if it wasn’t for the help of the computers and
software’s economists would spend day’s just making calculations and hypothesis.
2.2.1 The running world of the ICT
2 A paper made by Rahmah Ismail, Masood Fooladi, Mayrem Farhadi in November 12, 2012

- 19 -
Nowadays the Internet and phones are seen as the main tool of ICT. According to
World Development Indicators 20133 there is a dramatic change in the last decade.
Since 2002 the mobile phone users have exceeded the subscriptions of the fixed line.
Until in 2011 there were 5.9 billion cellular users around the world and nearly a third
of the population of the world has access to the internet.
Based on this estimation the number of the Internet users worldwide has been
increasing nearly 33 users per 100 people in 2011 and 12 per 100 in 2003. But a
large difference is seen between the regions but the developing countries are quickly
catching up the developed counties by raising the number of the internet users by
using the mobile technology.
2.2.2 The effect of mobile technology in daily life
The mobile era had its footsteps in 1993 with the IBM Simon of the BellSouth, but
the real start of the smartphone are is the beginning of 2002 when the PDAs able to
make calls were introduced. Until the 2006, when Apple launched its iPhone the
mobiles were not spreading much more than the other technological inventions in the
decades before. Everything changed with the iPhone, when its sales reached over a
million despite the high prices that it had.
Mobiles have improved our lives in many ways. For instance, it helps people become
much closer through the texting, social networking and video calling. It provides the
people different platforms to contact and they can use the most suitable for them.
3 The collection of the development indicators done by the World Bank. It is the most accurate data available because it includes also the national and regional estimates

- 20 -
Furthermore, mobiles also can relax people in their free time through different
entertainments like surfing the Internet, paying games online with friends, taking
photos and videos and why not reading. The mobiles also help people in their
business a lot by being online everywhere and by using their systems on their mobile
or tablets.
And lastly mobile development has made life much easier. People benefit a lot from
their mobiles. The watch the weather directly without any effort, tourist can travel
easily, they don’t need a big map to find their road, and instead just an app can make
everything easier. Also the mobile offers directly radio, TV, newspaper and whatever
the users are interested in and it offers it real-time.
But from another point of view, it also has its negative sides. Today people suffer
from the effects of overusing the mobiles. Firstly it makes people lazy. All the people
try to simplify their life so that they become lazy. Why video chatting if you have the
opportunity to go out with that friend? Why buy all online if you have the store in the
city? This has side effects in people since it causes health issues to people from the
lack of the exercises.
Despite the physical health problem the mobiles damages peoples mind also. The
people does not communicate with each other, although it may look different but
video chat is way different than face to face talk and it give the wrong impression. It
look like people are more connected but it just seems so. And the worst effect of the
mobiles and technology in general is that they kill the innovation. People nowadays
does not go through the struggle to think their problem and solve them but rather
searches the internet and finds a ready-made solution.

- 21 -
As a conclusion, the ITU (International Telecommunication Unit) states that 90 % of
the world’s (Shein, 2012) population has access to mobile networks. So we can say
that like everything else mobile technology has its advantages and also
disadvantages. The solution is only applied by individuals. If they use it properly,
only then they will get the most benefit from it.
Figure 1 – From PDA to Smartphones

- 22 -
CHAPTER 3
Software Analysis and Design
As we discussed in the previous chapters, there is a big need of using technology in
the economic sciences, especially in statistics and econometrics. In our country there
is a great need for the help of the technology in order to make effective calculations
and give secure results relating to different surveys, not just economic but also
political and social.
Although there are many professional computer based applications that derive
models we will try and form a model to involve the most used new trends,
smartphones, on the process to help for simplifying the work and why not for more
random sampling and more general results
.
3.1 Functional Requirements
Defining functional requirements during the analysis phase of the project enables us
to identify what kind of services should be provided by the system, what kind of
inputs are expected and their output [1]. By doing so, it is possible for us to provide
to the audience enough information for them to approve the project and also support
it [2].The functional requirements of needed in our application are as follows:
3.1.1 Usability Requirements

- 23 -
The application will be easy to install and also to use. There will be an
implementation in menus and also the user will be guided through the application
with small text boxes explaining what they should do.
There will be different interfaces including login, register and profile page.
The other pages will gather information about the survey and submit it and off course
that the user will be able to see the results too, in the form of the statistics.
3.1.2 Performance Requirements
We will minimize requests of the user from the server so that to provide the highest
speed possible. The server’s response will be parsed in JSON format. There will be a
policy of preserving the user’s personal data from others access and making the
application more reliable including an automatically logout if not performing any
activity.
3.1.3 Supportability Requirements
The application will be very user friendly thus won’t require any training from the
users. As for updates and upgrades the user will be notified by the application
3.1.4 Security Requirements

- 24 -
The users will be able to log on to the system only if they provide the application
with the correct username and password. The users will be able to change their
profiles and their credentials if they desire.
3.2 Non-Functional Requirements
Non – functional requirements differently from functional requirements are
characteristics of the systems which actually do not do anything on the system, but
they are important to show to audience like the project manager, client/user or any
stakeholder the quality of the system, that’s why sometimes non – functional
requirements are also known as “Quality of Service” [3].
3.2.1 Hardware Requirements
We will use a Linux based server in order to store the data needed in our application.
An Android based smartphone so that we test the application, which may be possible
also with an emulator but it would take more time and also it is not that near to the
reality.

- 25 -
3.2.2 Software Requirements
The PHP programming of the application and the MySQL will be done using the
Notepad++. The Eclipse IDE with the installed Android SDK to deal with Android
Application Programming. Also the Android SDK Tools will be needed so that we
can test the application in the latest software versions of Android and create Android
Emulators.
3.3 User Profile
In this part I will describe the actors of the application. There are two man actors, the
user and the admin. The user will be in the Android application while the admin will
be in the PHP site application. The basic user stories are described in the table below:
No: User Story Name Description
1 Login The user and the admin have to log in to the system
2 Register The user must be registered to log in to the system
3 View Profile The users must be able to view their profiles
4 Change Credentials The users MUST be able to change their credentials
5 View Statistics The users can view the statistics gathered by the program
6 Fill survey The users can fill the surveys
7 Suggest survey The users can suggest a survey that they need

- 26 -
Figure 2 - User Use Case Diagram
User is one of the main actors in our system since we base all operation over their
activity. A user is the actor to whom the program is delivered for use and the user
makes the base operations so that our program fulfills its purpose. We will represent
the users operations through 3 subsystems: survey management, profile management
and statistics management. The Figure 2 shows an overall use case diagram and
describes the main functions of the program.

- 27 -
3.4 System Design
This part will describe the application in deep details because it is what differentiates
a good program from a casual one. For each subsystem described above I will show
an activity diagram so that describe the system better.
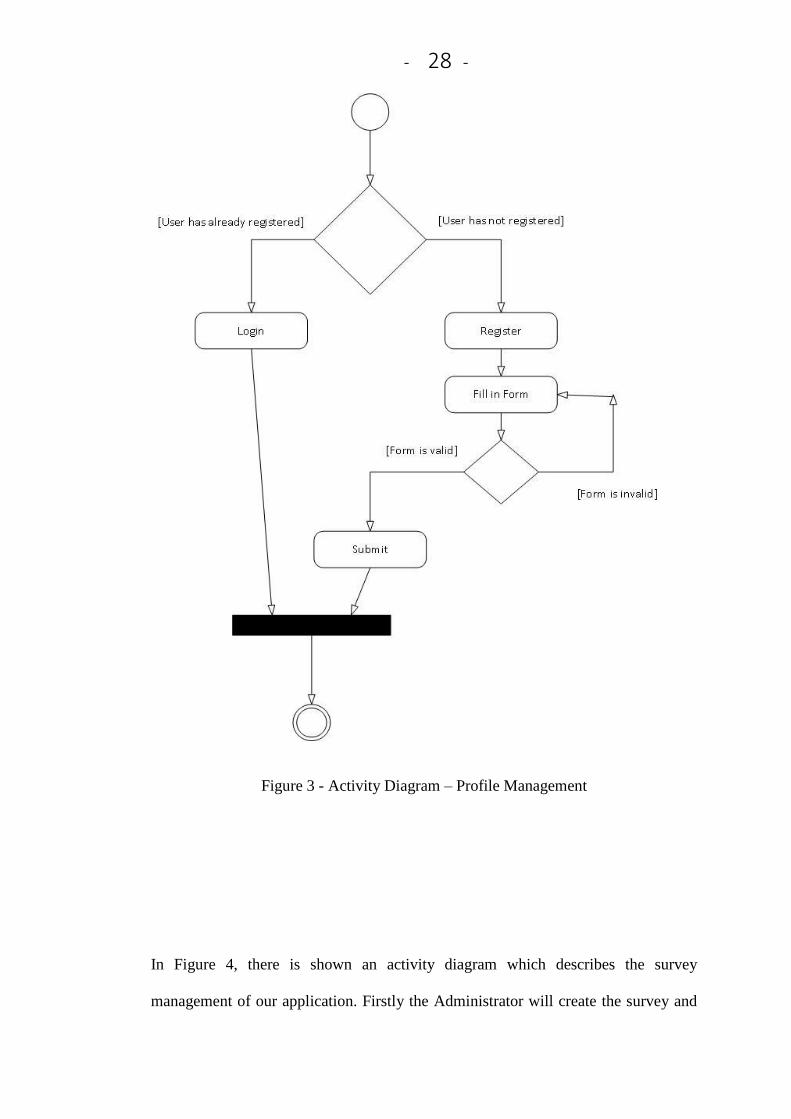
In the activity diagram, the figure 3, are shown the main activities that the user is
expected to use. As we mentioned above, the user will have to install the program in
their smartphones so that they use it. In this activity is show the user profile
management. He has to create an account, register, and after that he will be able to
enter directly from login and use the functionalities. He will also be able to view the
information stored in his profile and will have the possibility to change it. Most
importantly the user can change his/her credentials as he/she may wish.
- 28 -
Figure 3 - Activity Diagram – Profile Management
In Figure 4, there is shown an activity diagram which describes the survey
management of our application. Firstly the Administrator will create the survey and

- 29 -
send it to the user. User must be logged on in order to see and fill the survey. After
that the user may submit the survey with the data which will be gathered by the
Admin who will run a regression based on the purpose of the survey and post the
statistical result for the users to see.
Figure 4 – Activity Diagram – Survey Management
In the Figure 5, as described is the stated diagram of the application. It describes
different state that our application undergoes while performing different requests.
In order to have a clear explanation of the overall system we take in consideration a
case of user interacting with the application.

- 30 -
Firstly, the system is at idle state. When the user wants to login the system goes to
ready state so that to process the information. Then user enters the credentials which
are processed and if they are wrong the user is redirected again in the login state. If
the credentials are valid then the user is redirected at the main interface where he/she
will have a menu. If he/she chooses to change the credentials then he/she must go
under the user profile and change the password.
After changing the password the database will be updated and the user will be again
redirected in the main interface.
If the user wants to view statistics or to fill the survey so that to suggest his own
survey then he/she enters the survey menu and after that he/she can select between
filling survey and viewing statistics. In case of viewing statistics a request is
processed and the information is retrieved from the database in the JSON format.
Then the results are given and the user is again redirected at the menu selecting
between the viewing statistics and filling survey, where he can go back to the main
interface by clicking cancel.
In case of filling the survey user fills the data and processes a request. The data is
sent again in JSON format and saved in database. Then the user gets to suggest a
survey that he may need. And after that he/she is again redirected at the menu.

- 31 -
Figure 5 – User State Diagram –
In the figure 6, a class diagram of the application is shown. It presents a general view
of the interaction between the classes that we build the application upon. In this
diagram we use the MainInterface, MainMenu, Login, UserProfile, SurveyForm etc.
As you can see in each of the classes there are shown the attributes and methods that
each of them users and by the connections made are shown also the interaction and
dependencies between them. In order to understand better let’s see together how the
SurveyForm class works. As it is seen, the class has a one to one connection with
User class because after the Login the User class proceeds to be the main class and
the link to the form. This class provides the user the form to submit the filled survey
and is distinguished by the user’s id.

- 32 -
Figure 6 – Overview of Class Diagram –
In the figure 7, the overview of the object diagram is shown. In this figure the class
attributes are filled with arbitrary values like in the case of LoginArea where
username and password have taken values. This diagram helps the user understand
better how the system works in real-time and how classes interact with each other
through the objects.

- 33 -
Figure 7 – Overview of Object Diagram –
In the figure 8, it is shown the component diagram of our system. Component
diagrams are necessary in building sophisticated programs. In our diagram below are
shown the component with the interfaces we need in our system. I.e. as it is seen in
the smartphone we have 3 interfaces 1st for the applications menus, 2nd for the
user’s interfaces according to the user and 3rd SQLite interface responsible for
storing important data needed by the application to perform faster. Other components

- 34 -
are the web server and systems databases, which will contain information about the
statistics, surveys and also serve as a backend for parsing the information securely.
Figure 8 – Overview of Component Diagram –
Lastly, there is the deployment diagram which gives an overview of the architecture
of the system and the way how the software components are related with each part of
the system [4]. In the figure 9 we have constructed the deployment diagram of our
mobile application. As we mentioned it consist of the smartphone, the web server
and also the systems database.
The main device containing the application is the smartphone which is separated in
interfaces and will contain also the local database SQLite. The web server will
consist of PHP backend and the JSON parser, so that the survey information can be
retrieved from the application can be parsed. The system database will contain the
MySQL database and also the JSON parse, again so that to parse information related
to the users requests.

- 35 -
Figure 9 – Overview of Deployment Diagram –

- 36 -
CHAPTER 4
Implementation
With today’s technological expansion and development we live in an era where the
main question is not can we do it, but how to do it? With the available tools
everything that the innovative human mind can produce. So the main concern about
implementing it is to find the most efficient way of doing it, by analyzing the speed
of app and fast response time to the users. This chapter will be about which
technologies we have used to implement our application and why we have used
them.
4.1 Technologies
As said in the introduction, the selection of the technologies is the key to creating a
successful application. To implement the application I needed to use Java, PHP,
XML, JSON, MySQL, Android and also a web server.
Choosing Android for collecting the information is the best possible considering the
distribution of the android devices and their usage, also from the Econometrics point
of view since it would provide us a random sample of the data collected. As a
database I will use MySQL because of it flexibility and being easy to combine it with
our PHP script which will be the server side language. When it comes to the point of
interchanging data between the Android app and the database there are two
possibilities: JSON and XML. As mentioned above I will stick with the JSON
because it is very lightweight meaning that it is easier to parse and generate.

- 37 -
Research done in this topic has concluded that JSON is faster than XML4 so in our
case it is what we are looking for. Regarding the Android design, the eclipse with the
android adt- tools provides XML to structure its layouts. A very important process in
programming the application is that we should consider the limitations that we have
due to physical properties of the devices. So we have to do our best with the
optimization of the code. Having delays in the app would make the users not to want
to use it anymore. In this chapter we will explain how they interact in more details.
Figure 10 – The technology interaction
4.2 Database Structure
Due to the aim of this application the database is the most important structure since it
stores all the information that is going to be showed to the user and also the user’s
information itself. We must be very careful in designing the database because if we
4 B.Benz describes this in his study, XML programming bible in 2003

- 38 -
does not have a well-designed database the entire system will be affected and the
users will not be satisfied.
As we said in the introductory part the usage of MySQL database is very important
in our case because due to physical limitations from mobile devices we cannot store
all our information locally.
Figure 11 - Overall view of the database structure
In Figure 15 are shown the most important tables of the database that we will use for
the application. The student and the users table contain the information of the
registered user and his credentials. I.e. the student table will hold information of the
user such as an id which is a foreign key of the id used in users table, name, surname,

- 39 -
gender, birthdate and so on. The users table just holds the credentials of the users so
that to have a more efficient and fast login.
4.2.1 Local Database
Our applications local database is needed so that we prevent the application from
requesting every time the same data. In this way the application can perform faster
due to less traffic and also from the implementation point of view it has not any big
difficulties, not as much complex as MySQL, but having the same functionalities.
The SQLite database creates files locally in the device and similar like MySQL can
create and execute queries in order to get the needed information. Apart from faster
performance another benefit of the SQLite databases is that if the user is not
connected to a network he still can open his account and see the crucial data related
to his account because these data were previously stored in the local device.
4.3 Server Side Programming
As we described in the Technology section we will use PHP as a server side
programming language. The web will be used to publish statistics and also as a
backend for the administrator. The most important classes are config.inc, functions
and linear_regression. These classes are responsible to create the connection to the
database and undo magic quotes, in the case of config.inc, to store the most used
function during the website so that not to write those over and over for the functions
class and the linear_regression class which is responsible to conduct the regression
and show the statistical values.

- 40 -
These classes together with the other complementary and design classes will be used
when different request are made. There is also a response in JSON format for the
request that will be needed to parse in the Android app later.
Figure 12 – A JSON response from the server
In the figure above is a JSON response to a request made to the class of the
comments to show the available comments
4.4 Android Application
The Android application is the trend or the main source of data in this project. The
application will be used form the users to see statistics and demand statistics but its
most important part is to collect the data by providing a random sample. I used the
AsyncTask class provided by Android to retrieve information from the server. This
class has the feature to execute the requests in the background until it terminates and
then to be viewed by the user. I.e. in order to get the results from the linear
regression done in the web server, again using data collected from mobile, we send a
request to the server and then the server will generate a response in JSON format
using PHP. The function doInBackground() of the AsyncTask enables us to send the
request, get the response and parse it without effecting the main thread of the
application.

- 41 -
CHAPTER 5
Conclusion and Future Work
The importance of the mobiles nowadays is described through the thesis. The mobile
usages exceeds also the computers work by giving real-time updates and
notifications for any change made in the system. The best part is that you don’t need
to be in the office facing your computer but you will get them anywhere you are, as
long as you are connected to a network. That’s why mobile is a necessity nowadays.
The survey conductor application is a very important application for the businesses
and individuals dealing with statistics. It will extremely reduce their work and it will
be done in record timing.
I achieved only a simple prototype, so there is a lot to do for the survey conductor
application.
The first thing to do would be to include more functions from the econometrics such
as multiple regression, Heteroskedasticity test, trend and seasonality test, functional
form misspecification and so many other features. By doing so, the application will
definitely spread all over the world and achieve many users.
Another important feature to add is GCM. Google Cloud Messaging is a feature
which enables the developers to send data from servers to the Android application
even though the application might not be running. This data can be a lightweight
message notifying application that it needs to fetch data from the server up to other
more complicated tasks. (H.M.Deitel, 2011)
The user’s awareness, responses and suggestions will also be seen because we must
also fulfil their needs in order to offer a much more satisfying application.

- 42 -
REFERENCES
Gebauer, J. (2008). User requirements of mobile technology: A summery of research
results. In Information Knowledge System Management 7 (pp. 101-119).
H.M.Deitel. (2011). Java how to program. Pearson Education Limited.
R.S.Pressman. (2010). Software Engineering, a practiotioner's approach. New York:
McGraw-Hill.
Shein, E. (2012). Mobile Networks Penetrate 90% of World's Population.
Smihula, D. (2011). Long waves of technological innovations. Studia Politica Slovaca , 19.
Sommerville, I. (2011). Software Engineering. Boston: Pearson.
Weiner, N. (1948). Cybernetics. MIT Press, 155.