SA Mine - Homepage | PwC South Africa · SA Mine 7th edition Highlighting trends in the ... Section...
68
www.pwc.co.za/mining SA Mine 7th edition Highlighting trends in the South African mining industry October 2015
Transcript of SA Mine - Homepage | PwC South Africa · SA Mine 7th edition Highlighting trends in the ... Section...
www.pwc.co.za/mining
SA Mine7th edition
Highlighting trends in the South African mining industry
October 2015
The information contained in this publication is provided for general information purposes only, and does not constitute the provision of legal or professional advice in any way. Before making any decision or taking any action, a professional adviser should be consulted. No responsibility for loss to any person acting or refraining from action as a result of any material in this publication can be accepted by the author, copyright owner or publisher.
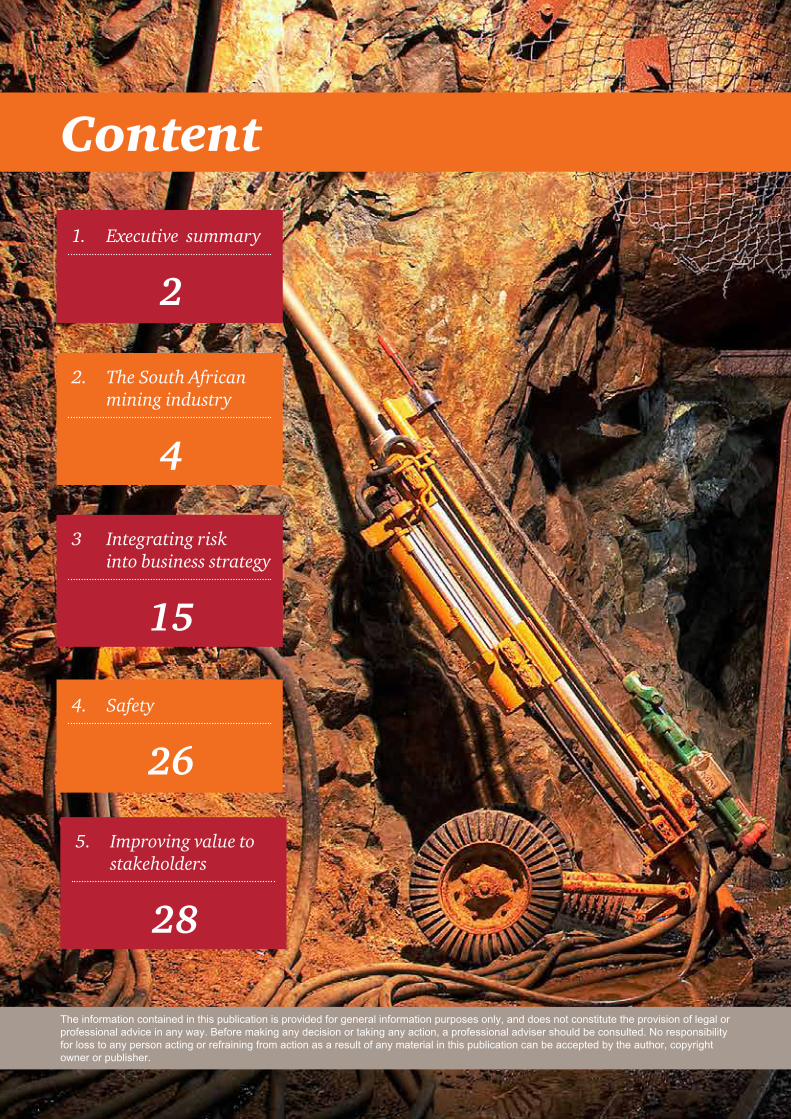
Content
1. Executive summary
2
5. Improving value to stakeholders
28
3 Integrating risk into business strategy
15
2. The South African mining industry
4
4. Safety
26

The information contained in this publication is provided for general information purposes only, and does not constitute the provision of legal or professional advice in any way. Before making any decision or taking any action, a professional adviser should be consulted. No responsibility for loss to any person acting or refraining from action as a result of any material in this publication can be accepted by the author, copyright owner or publisher.
Content
7. Financial performance
37
6. Boardroom dynamics
34
8. Glossary
52
9. Companies included in the analysis
54
10. Basis for compiling this report
56
11. About PwC
58

2 SA Mine: 7th edition – Highlighting trends in the South African mining industry
Executive summary1
The 2015 financial year was impacted by significant commodity price decreases and cost pressures, leaving the mining industry struggling for survival.
3PwC
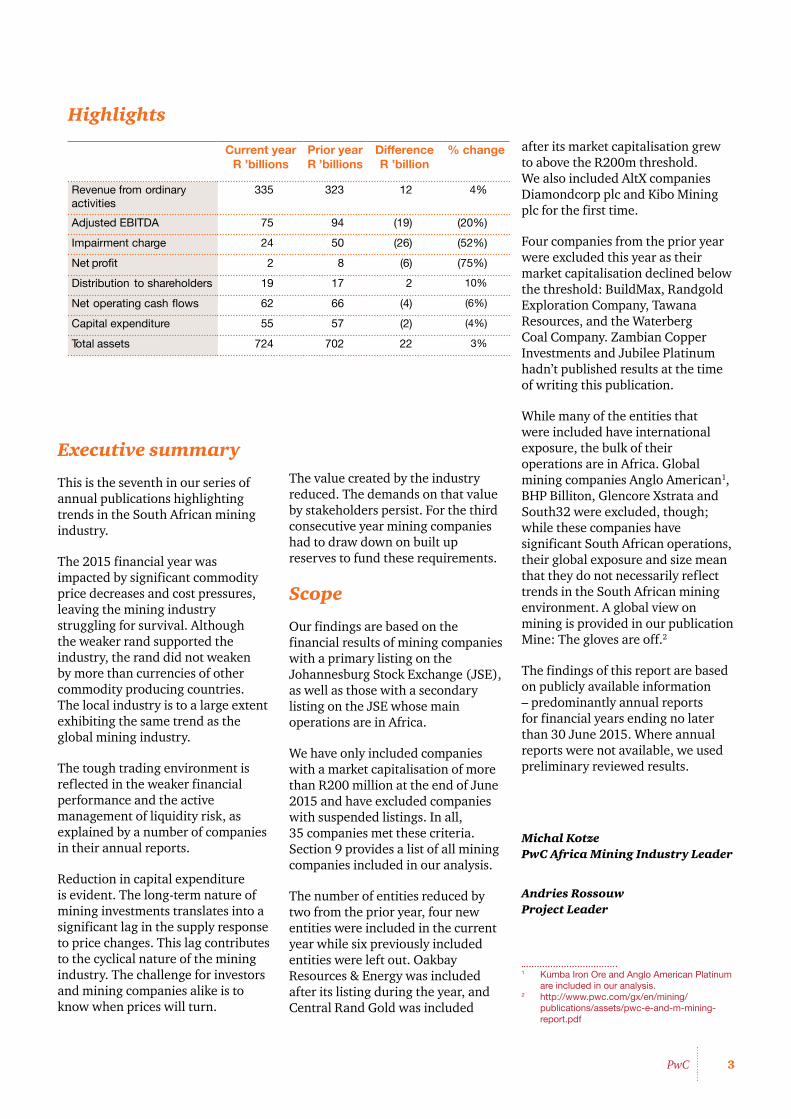
Highlights
Current year R ’billions
Prior year R ’billions
Difference R ’billion
% change
Revenue from ordinary activities
335 323 12 4%
Adjusted EBITDA 75 94 (19) (20%)
Impairment charge 24 50 (26) (52%)
Net profit 2 8 (6) (75%)
Distribution to shareholders 19 17 2 10%
Net operating cash flows 62 66 (4) (6%)
Capital expenditure 55 57 (2) (4%)
Total assets 724 702 22 3%
after its market capitalisation grew to above the R200m threshold. We also included AltX companies Diamondcorp plc and Kibo Mining plc for the first time.
Four companies from the prior year were excluded this year as their market capitalisation declined below the threshold: BuildMax, Randgold Exploration Company, Tawana Resources, and the Waterberg Coal Company. Zambian Copper Investments and Jubilee Platinum hadn’t published results at the time of writing this publication.
While many of the entities that were included have international exposure, the bulk of their operations are in Africa. Global mining companies Anglo American1, BHP Billiton, Glencore Xstrata and South32 were excluded, though; while these companies have significant South African operations, their global exposure and size mean that they do not necessarily reflect trends in the South African mining environment. A global view on mining is provided in our publication Mine: The gloves are off.2
The findings of this report are based on publicly available information – predominantly annual reports for financial years ending no later than 30 June 2015. Where annual reports were not available, we used preliminary reviewed results.
1 Kumba Iron Ore and Anglo American Platinum are included in our analysis.
2 http://www.pwc.com/gx/en/mining/publications/assets/pwc-e-and-m-mining-report.pdf
Executive summary
This is the seventh in our series of annual publications highlighting trends in the South African mining industry.
The 2015 financial year was impacted by significant commodity price decreases and cost pressures, leaving the mining industry struggling for survival. Although the weaker rand supported the industry, the rand did not weaken by more than currencies of other commodity producing countries. The local industry is to a large extent exhibiting the same trend as the global mining industry.
The tough trading environment is reflected in the weaker financial performance and the active management of liquidity risk, as explained by a number of companies in their annual reports.
Reduction in capital expenditure is evident. The long-term nature of mining investments translates into a significant lag in the supply response to price changes. This lag contributes to the cyclical nature of the mining industry. The challenge for investors and mining companies alike is to know when prices will turn.
Michal Kotze PwC Africa Mining Industry Leader
Andries Rossouw Project Leader
The value created by the industry reduced. The demands on that value by stakeholders persist. For the third consecutive year mining companies had to draw down on built up reserves to fund these requirements.
Scope
Our findings are based on the financial results of mining companies with a primary listing on the Johannesburg Stock Exchange (JSE), as well as those with a secondary listing on the JSE whose main operations are in Africa.
We have only included companies with a market capitalisation of more than R200 million at the end of June 2015 and have excluded companies with suspended listings. In all, 35 companies met these criteria. Section 9 provides a list of all mining companies included in our analysis.
The number of entities reduced by two from the prior year, four new entities were included in the current year while six previously included entities were left out. Oakbay Resources & Energy was included after its listing during the year, and Central Rand Gold was included
4 SA Mine: 7th edition – Highlighting trends in the South African mining industry
The South African mining industry2
5PwC
In what has turned out to be yet another challenging year for miners, 2015 has brought little cause for optimism thus far. Factors contributing to this included a slower than expected rate of economic growth, a prolonged and continuing downswing in commodity prices, an increase in short-term volatility, increased pressure on operating models, and regulatory uncertainty.
Adding to these challenges is the increased difficulty in raising capital due to a loss of confidence by investors. Low share prices have resulted in capital markets being seen as a last resort for finding capital.
This situation is not unique to South Africa, though. Mining companies the world over are facing the same challenges. All of them are looking at the Chinese growth rate, trying to infer the impact thereof on their commodities. In September 2015, the Asian Development Bank (ADB) revised its growth forecast for China from 7% to 6.8% for the current year, and it expects the economy to grow even slower at approximately 6.7% in the next year. This growth is moving from infrastructure growth towards consumer driven growth which will have different implications for different commodities.
While mining contributes only about 6% of South Africa’s GDP, it generates nearly 60% of the country’s exports. Changes in global demand therefore have a direct impact on its exchange rate.
The market’s message to miners seems to be clear: ‘Cut costs, refocus on your core business and limit the pursuit of growth opportunities.’ But is limiting the pursuit of growth opportunities the right answer? Within the current volatile environment – which is becoming the nature of the game – only time will tell. It will certainly make for some interesting planning and forecasting discussions in the coming year.
Market capitalisation
The 2015 financial year saw the declining trend in market capitalisation continue with few, if any, companies left unscathed. Market capitalisation for the 35 companies analysed in this publication declined to R414 billion as at 30 June 2015 (compared to R675 billion as at 30 June 2014). The decline continued when compared to market capitalisation as at 30 September 2015 of R304 billion, resulting in an aggregate decline of R371 billion when compared to 30 June 2014.
In our 2014 publication, we noted that diversified companies had been hardest hit by the significant decrease in iron ore and coal prices. This resulted in their share of the market capitalisation of the entities analysed at the time reducing from 47% to 38%. Although more subdued, 2015 saw a further erosion of their share to 36% of the market capitalisation.
With South Africa’s mining sector being in a fairly mature stage of development, companies are dealing with increasing operating costs and declining ore grades, putting pressure on operating models. These pressures are exacerbated by local infrastructure constraints, especially concerning current electricity supply, and ever increasing wages.
Mining companies are beginning to consider alternative means of addressing electricity capacity constraints, which have been severely felt in 2015. These alternatives include increasing capital spend to develop in-house power generation ability.
Wage negotiations and continuing tension between mining companies and labour unions appear to be a continuing trend in the industry. As at the date of writing this publication, four gold mining companies continue to be locked in a three-month wage ‘stalemate’ with unions and a coal strike has been announced. The companies are well aware of the significance of the impact of the protracted five-month strike in 2014 on the platinum sector, and with the gold sector often being referred to as a ‘sunset industry in terminal decline’, they realise that the industry can ill afford any prolonged strike action. While seeking to provide fair wages to their workers, the affordability of the wages is a significant consideration to the mining companies, especially regarding their impact on marginal mines.

6 SA Mine: 7th edition – Highlighting trends in the South African mining industry
Platinum and gold companies have not escaped the continuing downward slide in commodity prices. Platinum has not experienced real prices as low as those experienced in 2015 in ten years, and it is not certain yet if or when prices will start to recover. Gold’s decline was less severe than that noted for platinum (29% decrease in market capitalisation for gold vs a 40% decrease for platinum). For these entities, gold was able to increase its share of market capitalisation from 22% to 25%.
Figure 1: Market capitalisation by commodity
Source: I-Net Bridge and PwC analysis
The composition of the top ten companies analysed within this publication has seen some changes since 2014. Assore and Lonmin, which were ranked at 6th and 10th respectively in the 2014 publication, dropped off the top ten list as at 30 June 2015 to make way for Northam Platinum and newly listed entrant Oakbay Resource and Energy, a gold and uranium producer.
Market capitalisation for the top ten companies continued to decline, with a R243 billion or 41% decrease to R351 billion as at 30 June 2015, losing a further R85 billion to 30 September 2015.
36%38%
38%
39%
25%
22%
1% 2%
Diversified Platinum Gold Other20152014
2014
2015
The most notable market capitalisation decline was that of Kumba Iron Ore at R61 billion, or 56%, since June 2014, with a further R24 billion lost up to 30 September 2015. Kumba Iron Ore operates the continent’s largest iron ore mine, and margins and production have therefore been heavily impacted by the continuing significant decrease in iron ore prices (a decline of approximately 60% in the last two years alone), fuelled by an oversupply in the market.
Figure 2: Market capitalisation of the top 10 mining companies (R’ billions)
Source: I-Net Bridge
Northam Platinum and Goldfields were the only top ten entities not to reflect a decline in market capitalisation as at 30 June 2015 when compared to 30 June 2014. All these companies decreased in market value since June 2015.
African Rainbow Minerals
Northam Platinum
Sibanye Gold
Exxaro Resources
Impala Platinum
Oakbay Resources & Energy
Kumba Iron Ore
Gold Fields
AngloGold Ashanti
Anglo American Platinum
44
19
50
18
4118
11
2114
2518
14
31
6834
24
49
32-
24
110
72
25
3030
28
74
44
125
62
30 June 201530 September 2015 June 2014

7PwC
Figure 3: Market capitalisation: JSE mining index vs JSE All-share Index
June 2013 = 100 Source: I-Net Bridge
60
70
80
90
100
110
120
130
140
150
Sep
-15
Aug
-15
Jul-
15Ju
n-15
May
-15
Apr
-15
Mar
-15
Feb-
15Ja
n-15
Dec
-14
Nov
-14
Oct
-14
Sep
-14
Aug
-14
Jul-
14Ju
n-14
May
-14
Apr
-14
Mar
-14
Feb-
14Ja
n-14
Dec
-13
Nov
-13
Oct
-13
Sep
-13
Aug
-13
Jul-
13Ju
n-13
JSE Mining IndexJSE All Share Index
The South African mining sector’s performance continues to lag within the South African context.
As noted in the previous year, the scale of the challenges facing the industry is reflected in the relative continuing decline in the JSE mining index in comparison to the JSE all-share, as illustrated in Figure 3.
Despite the continued relatively strong performance of the JSE all-share index, with steady increases in overall market capitalisation since 2010, market capitalisation of the mining sector has been substantially lagging this performance as investors lose confidence in the ability of the industry to deliver adequate returns.
The continuing devaluation of the rand against the dollar continues to somewhat shield South African companies; however, it has not been enough to fully compensate for the declining commodity prices. Although the challenging local environment, particularly relating to labour and electricity constraints, played a role in the overall decrease in market capitalisation, the global economic climate was a significant contributor.
The impact of the global economic environment on the mining industry continues to be apparent when movement in the HSBC global mining index is compared to that in the JSE mining index in USD terms, which can be seen in Figure 4. There is an almost perfect correlation between these indices, with variances almost exclusively explained by price movements in the different baskets of commodities.
Figure 4: JSE mining index vs HSBC Global Mining Index
June 2013 = 100 Source: I-Net Bridge
40
50
60
70
80
90
100
110
120
130
140
Sep
-15
Aug
-15
Jul-
15Ju
n-15
May
-15
Apr
-15
Mar
-15
Feb-
15Ja
n-15
Dec
-14
Nov
-14
Oct
-14
Sep
-14
Aug
-14
Jul-
14Ju
n-14
May
-14
Apr
-14
Mar
-14
Feb-
14Ja
n-14
Dec
-13
Nov
-13
Oct
-13
Sep
-13
Aug
-13
Jul-
13Ju
n-13
JSE Mining Index (USD based)HSBC Global Minng Index
8 SA Mine: 7th edition – Highlighting trends in the South African mining industry
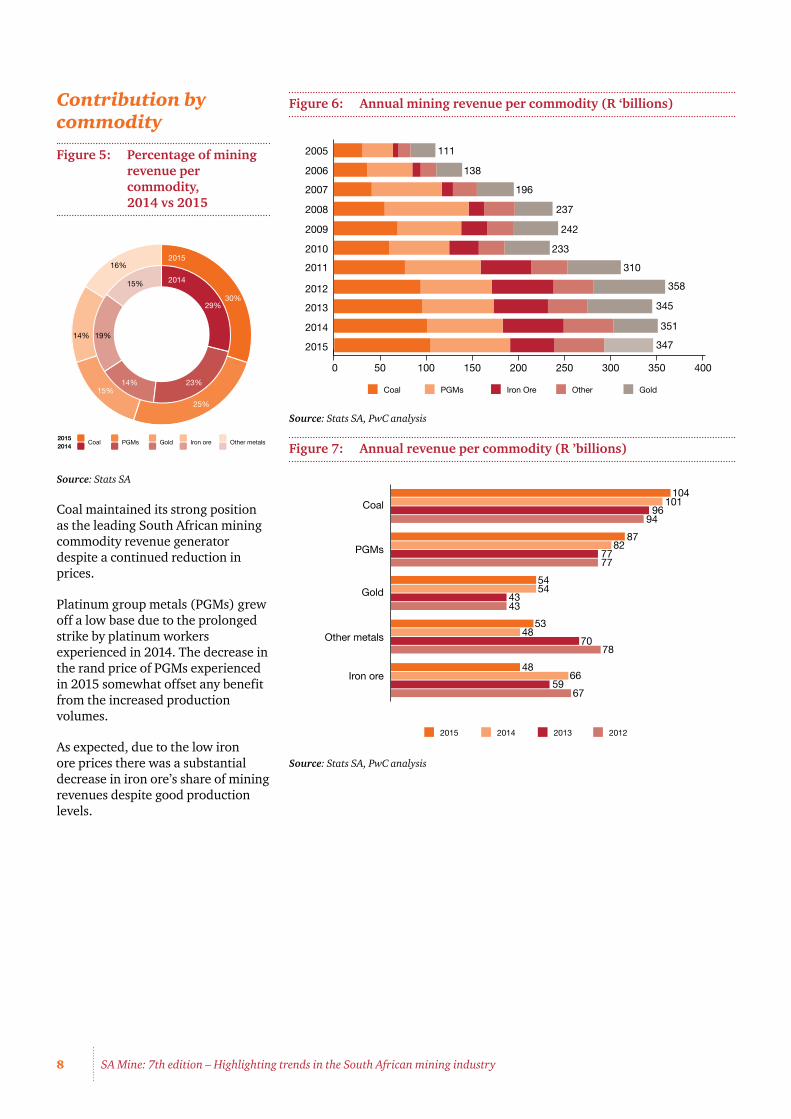
Figure 6: Annual mining revenue per commodity (R ‘billions)
Source: Stats SA, PwC analysis
Figure 7: Annual revenue per commodity (R ’billions)
Source: Stats SA, PwC analysis
500 100 150 200 250 300 350 400
Coal PGMs Iron Ore Other Gold
242
233
310
358
345
351
347
111
2009
2005
2006
2007
2008
2010
2011
2012
2013
2014
2015
237
196
138
2015 2014 2013 2012
Coal
Other metals
Gold
PGMs
54
96
104101
94
8782
7777
544343
5348
7078
4866
5967
Iron ore
Contribution by commodity
Figure 5: Percentage of mining revenue per commodity, 2014 vs 2015
Source: Stats SA
Coal maintained its strong position as the leading South African mining commodity revenue generator despite a continued reduction in prices.
Platinum group metals (PGMs) grew off a low base due to the prolonged strike by platinum workers experienced in 2014. The decrease in the rand price of PGMs experienced in 2015 somewhat offset any benefit from the increased production volumes.
As expected, due to the low iron ore prices there was a substantial decrease in iron ore’s share of mining revenues despite good production levels.
29%30%
23%
25%
14%15%
19%14%
15%
16%
2014
2015
Coal PGMs Gold Iron ore20152014
Other metals

9PwC
A slump in prices
Figure 8: Commodities at USD-indexed prices
June 2012 = 100 Source: World Bank, PwC analysis
Coal Gold Platinum Iron ore
0
20
40
60
80
100
120
Sep-15Jun-15Dec-14Jun-14Dec-13Jun-13Dec-12Jun-12
While the 2009-2011 period was characterised by a recovery in overall commodity prices from the lows of the 2008 financial crisis, 2012 saw a reverse in this recovery. SA’s main commodities have reflected a significant weakening over the last three years.
A weakening rand over the period gave the South African mining industry some protection against this decline, with rand prices, other than for iron ore, remaining relatively flat. Not even the weak rand could mask the impact of the weak iron ore price, though.
Unfortunately, flat prices will not support the industry’s significantly increased cost base. The weaker rand is also likely to add to inflationary cost pressure, which means that any respite will only be temporary.
Figure 9: Indexed ZAR price per commodity
June 2012 = 100 Source: World Bank, PwC analysis
Although the weakening rand certainly assisted the local industry, it should be noted that the rand’s weakening over the last couple of years was not as severe as experienced by a number of resource based economies. Figure 10 shows a basket of currencies indexed to the USD.
Coal Gold Platinum Iron ore
40
50
60
70
80
90
100
110
120
130
Sep-15Jun-15Dec-14Jun-14Dec-13Jun-13Dec-12Jun-12

10 SA Mine: 7th edition – Highlighting trends in the South African mining industry
Figure 10: Comparison of exchange rates against the US-dollar
June 2013=100 Source: World Bank, PwC analysis
Indianrupee
Canadiandollar
South Africanrand
Australiandollar
Brazilianreal
Russianruble
80
100
120
140
160
180
200
220
Sep
-15
Aug
-15
Jul-
15Ju
n-15
May
-15
Apr
-15
Mar
-15
Feb-
15Ja
n-15
Dec
-14
Nov
-14
Oct
-14
Sep
-14
Aug
-14
Jul-
14Ju
n-14
May
-14
Apr
-14
Mar
-14
Feb-
14Ja
n-14
Dec
-13
Nov
-13
Oct
-13
Sep
-13
Aug
-13
Jul-
13Ju
n-13
The rand has actually performed very much in line with other resource rich economies over the last 2 years.
We, along with the rest of the mining industry, have lamented the unsustainability of the current low commodity price environment. Basic supply and demand fundamentals imply that below-average prices will lead to either mine closures, resulting in lower supply and therefore an increase in prices, or an increase in demand, resulting in the supply being fully utilised and therefore pushing up prices.
There were a number of mine/shaft closures announced over the last 2 years.
The long-term nature of mining investments translates to a significant lag in the supply response to price changes. This lag contributes to the cyclical nature of the mining industry. The challenge for investors and mining companies alike is to know when prices will turn. However, increased prices do not necessarily imply increased profitability.
Figure 11 depicts real-rand price levels for South Africa’s main revenue-generating commodities. The rand prices were adjusted by applying standard consumer price index increases for the last ten years.
Figure 11: Indexed CPI-adjusted real-rand prices per commodity
June 2005 = 100 Source: World Bank, Stats SA and PwC analysis
0
50
100
150
200
250
300
350
Jun-
05
Jun-
06
Jun-
07
Jun-
10
Jun-
13
Jun-
15
Jun-
14
Jun-
12
Jun-
11
Jun-
09
Jun-
08
Coal Gold Platinum Iron ore
11PwC
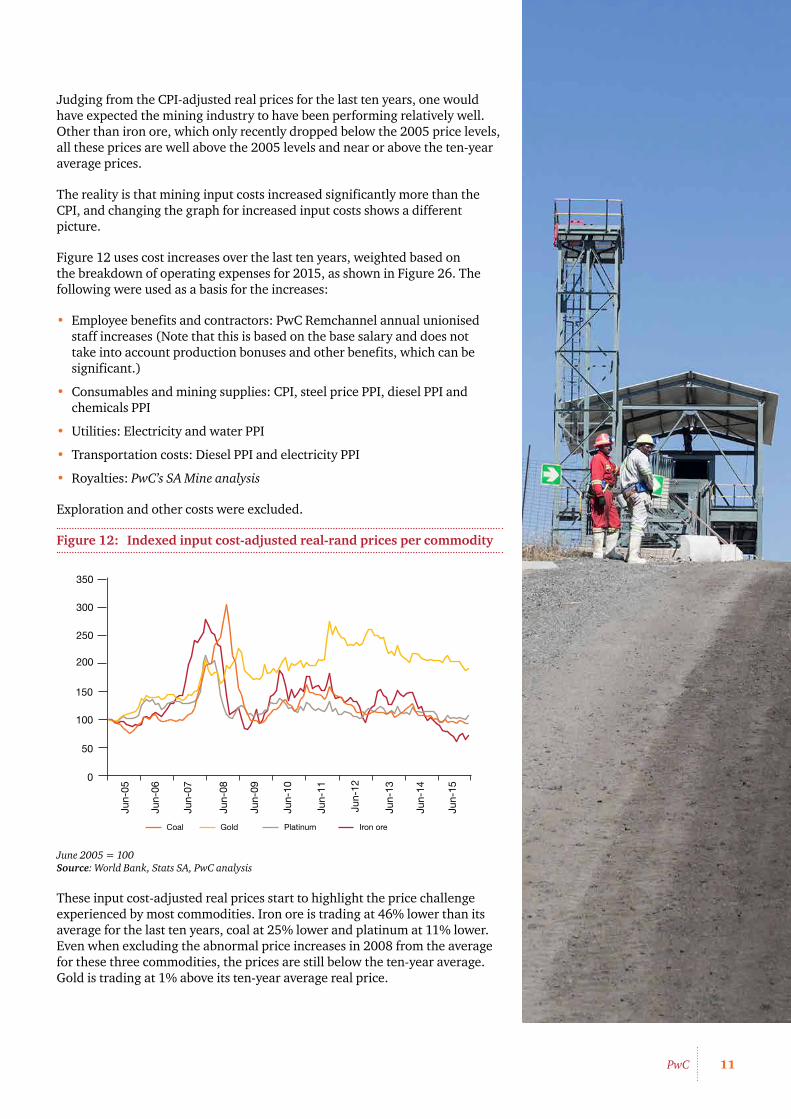
Judging from the CPI-adjusted real prices for the last ten years, one would have expected the mining industry to have been performing relatively well. Other than iron ore, which only recently dropped below the 2005 price levels, all these prices are well above the 2005 levels and near or above the ten-year average prices.
The reality is that mining input costs increased significantly more than the CPI, and changing the graph for increased input costs shows a different picture.
Figure 12 uses cost increases over the last ten years, weighted based on the breakdown of operating expenses for 2015, as shown in Figure 26. The following were used as a basis for the increases:
• Employee benefits and contractors: PwC Remchannel annual unionised staff increases (Note that this is based on the base salary and does not take into account production bonuses and other benefits, which can be significant.)
• Consumables and mining supplies: CPI, steel price PPI, diesel PPI and chemicals PPI
• Utilities: Electricity and water PPI
• Transportation costs: Diesel PPI and electricity PPI
• Royalties: PwC’s SA Mine analysis
Exploration and other costs were excluded.
Figure 12: Indexed input cost-adjusted real-rand prices per commodity
June 2005 = 100 Source: World Bank, Stats SA, PwC analysis
These input cost-adjusted real prices start to highlight the price challenge experienced by most commodities. Iron ore is trading at 46% lower than its average for the last ten years, coal at 25% lower and platinum at 11% lower. Even when excluding the abnormal price increases in 2008 from the average for these three commodities, the prices are still below the ten-year average. Gold is trading at 1% above its ten-year average real price.
0
50
100
150
200
250
300
350
Jun-
05
Jun-
06
Jun-
07
Jun-
10
Jun-
13
Jun-
15
Jun-
14
Jun-
12
Jun-
11
Jun-
09
Jun-
08
Coal Gold Platinum Iron ore

12 SA Mine: 7th edition – Highlighting trends in the South African mining industry
Although price plays a key role in profitability, there are large fixed cost elements associated with mining, and production levels therefore play a significant role in determining profitability.
Production
Figure 13: Indexed annual production per commodity
2005 = 100 Source: Stats SA, PwC analysis
Coal Gold PGMs Iron ore Diamonds
0
50
100
150
200
250
300
20082005 2006 2007 2009 2010 2011 2012 2013 2014 2015
Iron ore is still the only commodity with significant production gains over the last ten years. With new mines ramped up, production is likely to remain at these levels, subject to sufficient demand.
The long-term decline in gold production was temporarily halted in the last two years. This decline in gold production is indicative of the ever-increasing depths of existing mines, technical difficulties experienced by start-up operations and a continually growing cost base. The recent decrease in the gold price is likely to put further pressure on production as marginal mines are mothballed. However, a focus on modernising mines by companies like AngloGold Ashanti and a successful back-to-basics approach by companies like Sibanye Gold could potentially address the long-term decline in the sector.
Platinum group metal (PGM) production has been severely impacted by industrial action since 2012 and by mine closures in the low-price environment. The protracted strike in the Rustenburg platinum belt in the first half of 2014 had a severe impact on production in the six months to June 2014, and the impact was felt into the next six months as processing stock levels were rebuilt and affected mines ramped up (see Figure 14).
In the absence of a meaningful price increase, it is unlikely that platinum production levels will increase from the current lower base. Deferment of capital expenditure in the current low-price environment could even result in a further decrease before any recovery in supply.
Coal had a solid performance over the last ten years, with marginal increases in production in the last few years. The current low coal prices are likely to hamper any potential growth in short- to medium-term supply. The short-term trend already seems to indicate a marginal decrease.
Diamonds, which were the most severely impacted by the global economic crisis and pressure on disposable income, continued their comeback this year. However, lower prices are likely to put pressure on production for 2016.
13PwC
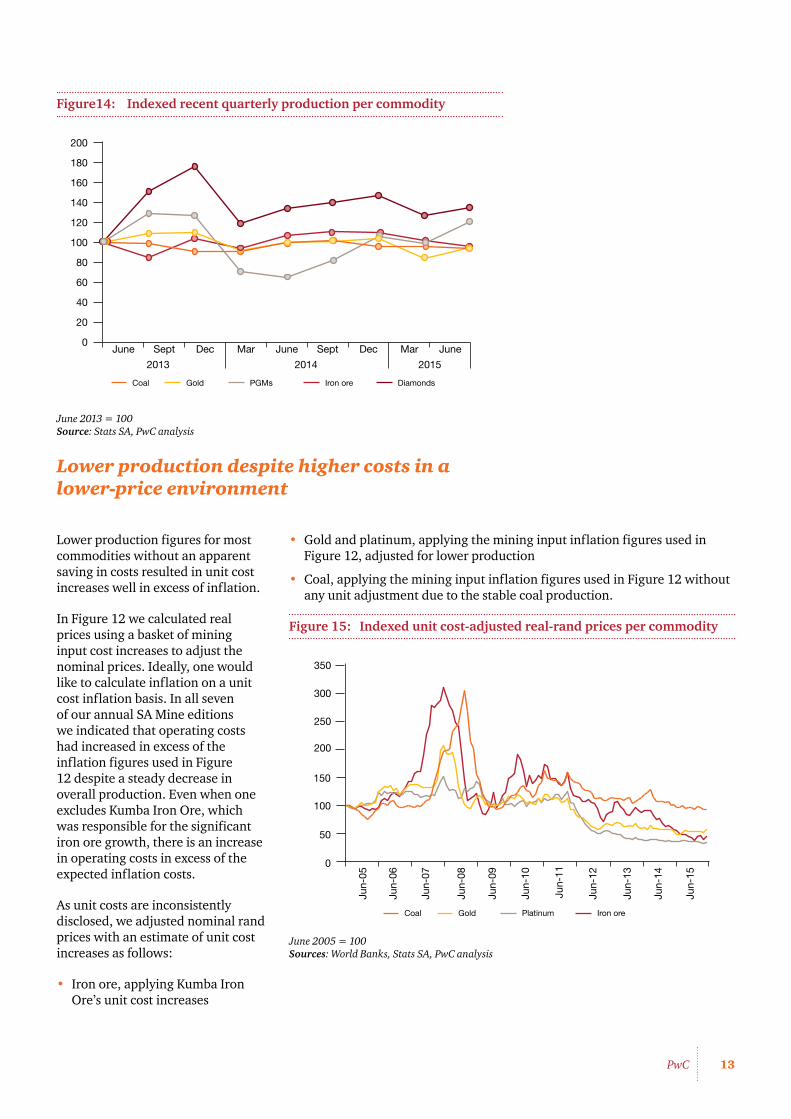
Figure14: Indexed recent quarterly production per commodity
June 2013 = 100 Source: Stats SA, PwC analysis
Lower production despite higher costs in a lower-price environment
0
20
40
60
80
100
120
140
160
180
200
JuneMarDecSeptJuneMarDecSept
2013 2014 2015
June
Coal Gold PGMs Iron ore Diamonds
Lower production figures for most commodities without an apparent saving in costs resulted in unit cost increases well in excess of inflation.
In Figure 12 we calculated real prices using a basket of mining input cost increases to adjust the nominal prices. Ideally, one would like to calculate inflation on a unit cost inflation basis. In all seven of our annual SA Mine editions we indicated that operating costs had increased in excess of the inflation figures used in Figure 12 despite a steady decrease in overall production. Even when one excludes Kumba Iron Ore, which was responsible for the significant iron ore growth, there is an increase in operating costs in excess of the expected inflation costs.
As unit costs are inconsistently disclosed, we adjusted nominal rand prices with an estimate of unit cost increases as follows:
• Iron ore, applying Kumba Iron Ore’s unit cost increases
• Gold and platinum, applying the mining input inflation figures used in Figure 12, adjusted for lower production
• Coal, applying the mining input inflation figures used in Figure 12 without any unit adjustment due to the stable coal production.
Figure 15: Indexed unit cost-adjusted real-rand prices per commodity
June 2005 = 100 Sources: World Banks, Stats SA, PwC analysis
0
50
100
150
200
250
300
350
Jun-
05
Jun-
06
Jun-
07
Jun-
10
Jun-
13
Jun-
15
Jun-
14
Jun-
12
Jun-
11
Jun-
09
Jun-
08
Coal Gold Platinum Iron ore
14 SA Mine: 7th edition – Highlighting trends in the South African mining industry
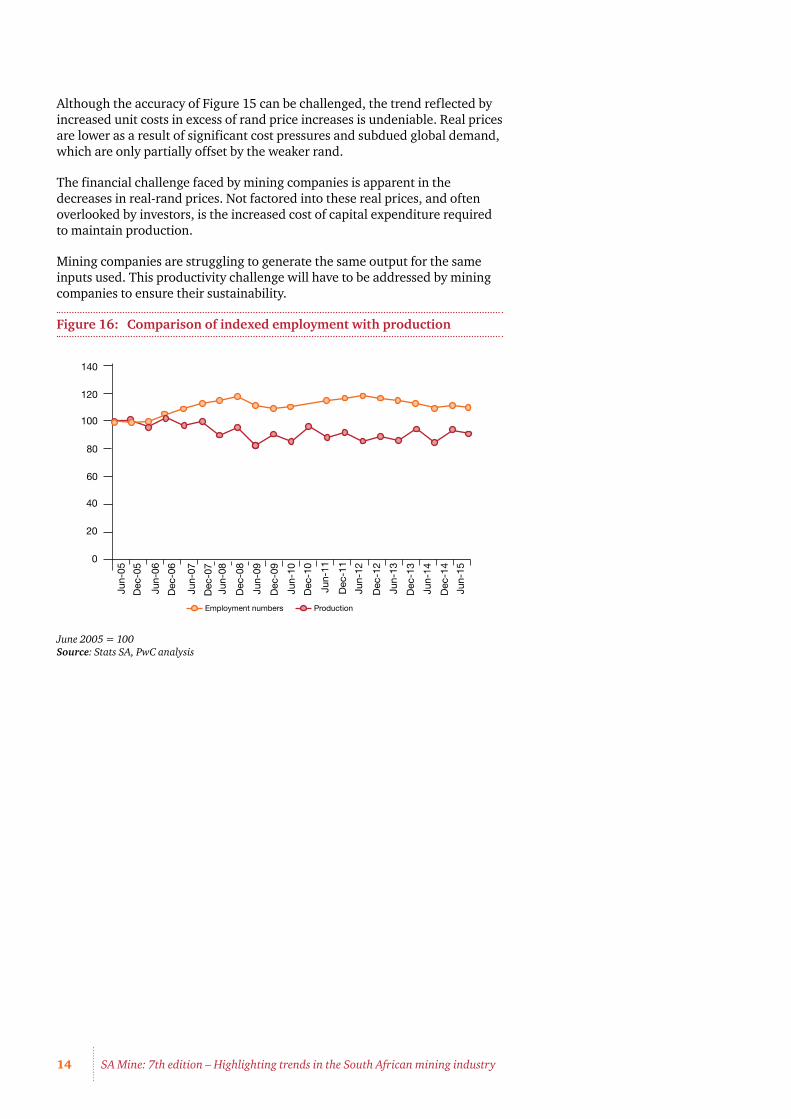
Although the accuracy of Figure 15 can be challenged, the trend reflected by increased unit costs in excess of rand price increases is undeniable. Real prices are lower as a result of significant cost pressures and subdued global demand, which are only partially offset by the weaker rand.
The financial challenge faced by mining companies is apparent in the decreases in real-rand prices. Not factored into these real prices, and often overlooked by investors, is the increased cost of capital expenditure required to maintain production.
Mining companies are struggling to generate the same output for the same inputs used. This productivity challenge will have to be addressed by mining companies to ensure their sustainability.
Figure 16: Comparison of indexed employment with production
June 2005 = 100 Source: Stats SA, PwC analysis
0
20
40
60
80
100
120
140
Jun-
15
Dec
-14
Jun-
14
Dec
-13
Jun-
13
Dec
-12
Jun-
12
Dec
-11
Jun-
11
Dec
-10
Jun-
10
Dec
-09
Jun-
09
Dec
-08
Jun-
08D
ec-0
7
Jun-
07
Dec
-06
Jun-
06
Dec
-05
Jun-
05
ProductionEmployment numbers

15PwC
Integrating risk into business strategy3

16 SA Mine: 7th edition – Highlighting trends in the South African mining industry
Risks facing the mining industry
The mining industry is faced with many challenges and risks which need to be effectively addressed. We analysed the risks disclosed by mining companies in their integrated reports as priorities.
There were limited changes in the disclosed risks compared to the prior year. In the prior year the highest-ranking risks included labour relations; sustainable business plans or budgets; the volatility of metal prices and exchange rates; infrastructure access and capacity; the regulatory, political and legal environments; high input costs; and skills availability. In the current year, most companies’ top exposures also include environmental compliance and liquidity risk.
The table below indicate the top risks disclosed by mining companies, but are by no means meant to present a comprehensive list of risks faced by the industry.
Risks disclosed by mining companies
Risk description Movement from prior year
Mitigation strategies
Labour relations
The industry has seen reduced labour unrest in 2015 compared to 2014; however, further wage negotiations are expected in the resources sector. Currently, not all key parties look like they will be involved, potentially leading to further strike action (and significant losses and stoppages).
The Mining Phakisa initiative to be held in October 2015 is aimed at formulating a way forward for all key stakeholders in the South African mining industry.
Increase the focus on direct communications with employees.
Achievable business plans or budgets
Mining companies continue to struggle to perform in line with business plans for both current and planned expansion projects.
Revisit operational plans to be more realistic in the current environment.
Reassess and change investment decisions where necessary.
Put a strong focus on productivity and cost-saving measures.
Volatile commodity prices and foreign exchange fluctuations
The market price for commodities continues to be significantly volatile due to global economic conditions that are beyond the control of South African companies. This could have a negative impact on revenue, cash flows, profitability and asset values.
Transactions denominated in foreign currencies expose companies to exchange rate fluctuations, which could result in significant accounting volatility.
Implement cost-reduction and efficiency measures. As sales prices are often outside management’s control, cost performance has become a key measure of management performance.
Understand the future demand for minerals and the corresponding industry supply-side profile.
Closely monitor the rand/dollar exchange rate.
High input costs
Input costs have increased as a result of energy tariff hikes and also from re-negotiated wage rates. Cost increases have been more than inflationary and put serious pressure on companies in the current low commodity price environment. Pressure from unions makes restructuring a difficult task and thus alternative means of cost cutting have to be found in many instances.
Introduce aggressive cost reduction (including restructuring).
Encourage efforts to drive higher productivity.

17PwC
Risk description Movement from prior year
Mitigation strategies
Reliance on third party infrastructure
Power shortages remain a key obstacle that could hinder growth in the mining sector in South Africa and elsewhere in Africa. At worst, power outages can impact production and employee safety; at best, it can add significantly to the cost of operations.
Bulk commodity exports are reliant on the road, rail and port infrastructure.
The unavailability of water in some areas poses a risk.
Change mind-sets in order to reduce energy and water consumption.
Adopt contingency plans such as back-up power generation capacity or investigate means of reducing dependency on the power grid.
Regulatory, political and legal environment
Regulatory uncertainty is still identified as a significant concern by many companies.
The date for Mining Charter compliance has passed and we are now in the period of assessment. The uncertainty surrounding the interpretation of and the enforceability of the Mining Charter metrics and the potential consequences of non-compliance are currently highly topical areas.
The Chamber of Mines and the Department of Mineral Resources (DMR) are currently involved in a legal petition to the High Court to determine the interpretation of and enforceability of the Mining Charter scorecard metrics.
A further lawsuit has been brought against the DMR regarding the constitutionality of the Mining Charter itself.
Employee safety and health
Exposure to noise and dust is a significant occupational health risk, especially given the focus on silicosis claims in the industry.
HIV and TB continue to impact employees’ health.
Continuous employee engagement and training.
Free testing and treatment for diseases such as TB and HIV.
Various behavioural safety initiatives.
Investment in various new safety support initiatives.
Human resource skills and capacity
Global competition for expertise and skills in technical fields, and the distance of operations from major urban areas are two of the more significant factors that are putting pressure on attracting and retaining skills.
Develop appropriate remuneration policies.
Develop policies and practices to retain key talent.
18 SA Mine: 7th edition – Highlighting trends in the South African mining industry
Risk description Movement from prior year
Mitigation strategies
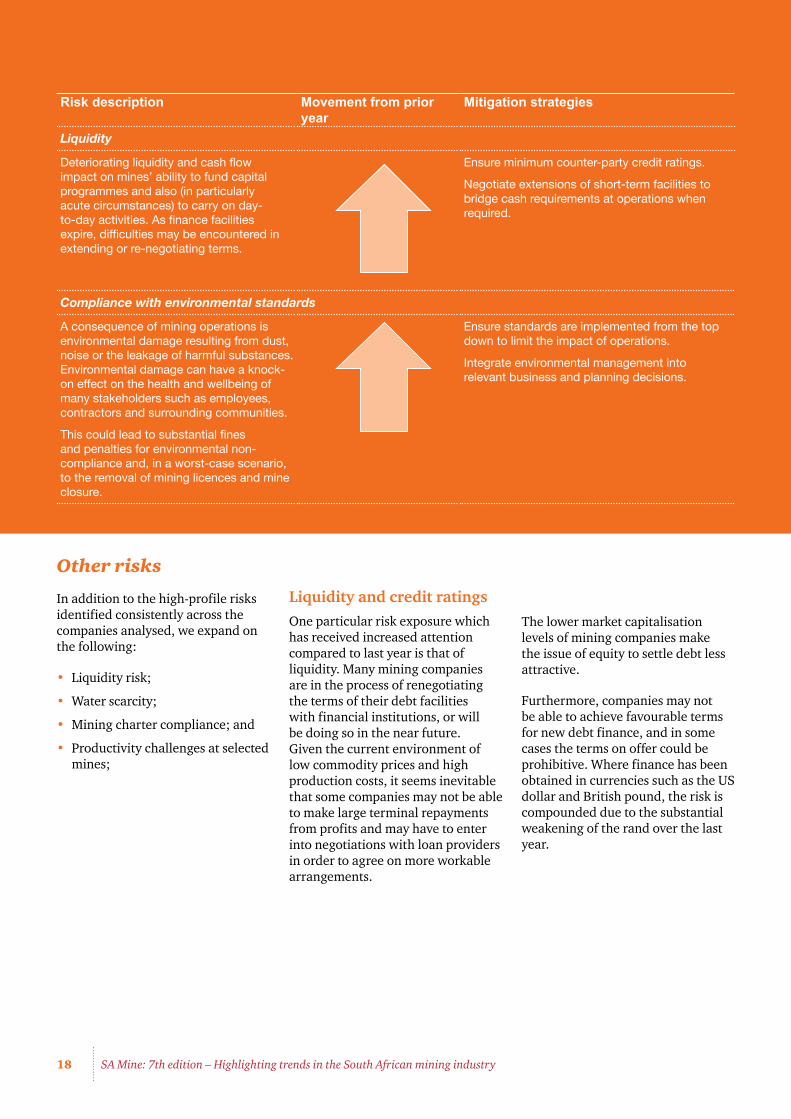
Liquidity
Deteriorating liquidity and cash flow impact on mines’ ability to fund capital programmes and also (in particularly acute circumstances) to carry on day-to-day activities. As finance facilities expire, difficulties may be encountered in extending or re-negotiating terms.
Ensure minimum counter-party credit ratings.
Negotiate extensions of short-term facilities to bridge cash requirements at operations when required.
Compliance with environmental standards
A consequence of mining operations is environmental damage resulting from dust, noise or the leakage of harmful substances. Environmental damage can have a knock-on effect on the health and wellbeing of many stakeholders such as employees, contractors and surrounding communities.
This could lead to substantial fines and penalties for environmental non-compliance and, in a worst-case scenario, to the removal of mining licences and mine closure.
Ensure standards are implemented from the top down to limit the impact of operations.
Integrate environmental management into relevant business and planning decisions.
Other risks
In addition to the high-profile risks identified consistently across the companies analysed, we expand on the following:
• Liquidity risk;
• Water scarcity;
• Mining charter compliance; and
• Productivity challenges at selected mines;
Liquidity and credit ratingsOne particular risk exposure which has received increased attention compared to last year is that of liquidity. Many mining companies are in the process of renegotiating the terms of their debt facilities with financial institutions, or will be doing so in the near future. Given the current environment of low commodity prices and high production costs, it seems inevitable that some companies may not be able to make large terminal repayments from profits and may have to enter into negotiations with loan providers in order to agree on more workable arrangements.
The lower market capitalisation levels of mining companies make the issue of equity to settle debt less attractive.
Furthermore, companies may not be able to achieve favourable terms for new debt finance, and in some cases the terms on offer could be prohibitive. Where finance has been obtained in currencies such as the US dollar and British pound, the risk is compounded due to the substantial weakening of the rand over the last year.

19PwC
Water scarcityWhen we talk about a license to operate, we focus on a broad set of obstacles that can prevent a company from working and continuing as a going concern. Those issues can be social (e.g. industrial action and community protests), environmental (pollution of land and water resources) or regulatory (laws and directives) that can stop operations or impose financial and criminal liability.
A few years ago, these issues almost never made it to the top ten risks identified by the World Economic Forum (WEF). This has changed, and changed significantly, in a very short time. Water crises were not even among the top ten risks five years ago. This year, water crises have been recognised as the biggest single global risk by the WEF. Climate change and biodiversity loss have also been included as the fifth and tenth highest risks, respectively.
Top 10 global risks in terms of impact
Source: WEF, Global Risks 2015
Water crisis1
Spread of infectiousdiseases
2
Weapons of massdestruction
3
Interstate conflict4
Failure of climatechange adaptation5
Energy price shock6
Critical informationinfrastructurebreakdown
7
Fiscal crises8
Unemployment orunderemployment9
Blodiversity loss andecosystem collape10
Water risk is echoed by 68% of FTSE 500 companies (increasing from 59% in 2011).
68%% FTSE 500 companies say:‘water is a substantive riskto business’
CDP Water 2014

20 SA Mine: 7th edition – Highlighting trends in the South African mining industry
South Africa is no exception to this. In fact, our water risk situation is even more severe than the global average. The Council for Scientific and Industrial Research (CSIR) released a research report in 2014, emphasising the availability of fresh water as one of the major limiting factors to South Africa’s development. It highlights the need for action to protect the ecosystems that support healthy water resources, eliminate water wastage and ensure usage of water in the most efficient and effective ways possible.
The report further highlights that South Africa’s water sources are inconveniently located away from the centres of major industry and are tied to seasonal cycles. The deterioration of water quality and quantity in these areas can have a disproportionately large negative effect on the functioning of downstream ecosystems and the overall sustainability of growth, development and economic progress in the country (reference: CSIR).
Projected water stress in 2050 was mapped against the top countries that CEOs consider to be most
important to their organisations’ future growth. From this it is evident that the majority of those countries are projected to have high to extreme water stress by 2050.
Recent public statements by water professionals indicate that South Africa will experience extreme water stress by as early as 2025, resulting, for example, in water shedding measures being necessary. South Africa could see a water deficit of between 2% and 13% by 2025, according to the CSIR (reference: Dr James Dabrowski, CSIR principal researcher).
Projected water stress in 2050 and the top countries that CEOs consider to be most important to their organisation’s future growth
Source: PwC’s 18th Annual CEO Survey and Centre for Environmental Systems Research, University of Kassel
US
Germany
India
UK
Brazil
China
Japan
Less than 0.5 - Extreme stress
0.5 to > 1.0 - High stress
1.0 > 1.7 - Moderate stress
1.7 and over - No stress
21PwC
Water availability is not the only concern. Also of concern is the quality of water in South Africa. Numerous sources of pollution are impacting on the quality of this scarce resource which could further impact its usability. Research conducted by numerous credible institutions has raised significant concerns about the quality of water in South Africa’s river systems and dams.
The consequences of this for mining in South Africa could be:
• Water availability (security) could affect entities as going concerns. Limitations on water consumption can damper production and subsequently profitability. This will force mining companies to optimise water consumption.
• Water pollution and associated cleaning and remediation costs can also pose a risk to entities as going concerns and impact on the profitability of entities.
• Water management throughout the mining lifecycle requires careful risk evaluation and planning. A failure to underestimate water risk and implement appropriate management controls could pose a risk in terms of mining entities’ status as going concerns.
For further information visit: www.pwc.com/gx/en/services/sustainability/water.html
‘Water as an asset class will, in my view, eventually become the single most important physical-commodity-based asset class, dwarfing oil, copper, agricultural commodities and precious metals.’Willem Buiter, Citi Economist
Mining Charter complianceThe measurement deadline in relation to compliance with the Mining Charter scorecard was 31 December 2014, with reporting having been due in March 2015. Even though the deadline has passed, there is still a lack of certainty around the impact of non-compliance with the Charter. President Zuma has stated that a total of 463 orders have been issued to companies in respect of their non-compliance with the Mining Charter, but potential punitive action remains unclear. A legal challenge has been mounted to set aside the Mining Charters of 2004 and 2010, arguing that they are unconstitutional, vague and contradictory. Also, there is no clause in the Charter that refers to the scorecard attached to the Charter, again making it difficult to draw inferences as to the potential scale of penalties for non-compliance.
The above is in addition to the dispute between the DMR and the Chamber of Mines on the definition of ‘ownership’ as it relates to the 26% target for black ownership contained in the Mining Charter scorecard. The dispute centres on the principle of whether shares are ‘once empowered, always empowered’. Both parties have asked the High Court to make a formal judgment on the interpretation in order to resolve the issue. The DMR’s interpretation is that at any given time black ownership must represent at least 26%. This means
that should companies’ BEE partners exit deals, then further shares must be issued or deals entered into in order to maintain the level of black ownership. The Chamber of Mines believes the opposite, namely that shares issued to black investors or through BEE deals should be deemed as ‘always empowered’, even if they are subsequently sold on. If the High Court’s interpretation is aligned with that of the DMR, then companies might have to enter into new BEE deals in order to comply with the Mining Charter scorecard – at a time when they are already feeling the pinch. The decision of the High Court will have far-reaching consequences and will have a significant impact on future participation in the South African mining industry by both local and global players alike.
All of the disputes and uncertainties surrounding the Mining Charters of 2002 and 2010 make it difficult for those companies served with non-compliance orders to make major investment decisions. They will be reluctant to invest heavily in projects for future growth until further clarification is provided and while the long-term landscape is unclear, coupled with a less than favourable economic outlook. It is the responsibility of all major stakeholders to ensure clarity about the interpretation and enforceability of the Mining Charter scorecard metrics as soon as possible in order to remove uncertainty within the mining industry.

22 SA Mine: 7th edition – Highlighting trends in the South African mining industry
Now that the date for submission of reporting regarding the Mining Charter has passed, the level of reporting on Mining Charter compliance varies significantly between companies. Some companies provide full details of their performance against each of the scorecard metrics, whilst others merely confirm that reporting to government has taken place. The main areas highlighted in SA Mine 2014 as requiring further improvement were housing and living conditions, services procurement and employment equity. Looking at progress on each of these in 2015 in turn (where information is available from company websites):
• Housing and living conditions – Most companies have met the 100% target for occupancy of one person per room and the establishment of family units (through hostel conversion). Those who have not met the target have plans to achieve compliance in the next two to three years.
• Services procurement – Services procurement from BEE entities ranges from 57% to 78%, with a number of companies still being below the 70% requirement in the Mining Charter.
• Employment equity – At each level of seniority the Mining Charter has a target of 40%. Results achieved are –
• Top management, 40% to 67%;
• Senior management, 25% to 71%;
• Middle management, 30% to 67%;
• Junior management, 40% to 83%; and
• Core skills, 40% to 100%.
These results are closely aligned with those disclosed in the prior year and show that some companies are still progressing towards compliance levels.
Productivity challengesSouth Africa’s declining productivity is one of the most important challenges for our economy. It calls into question the path to future prosperity and our global competitiveness unlike any other topic.
And when it comes to productivity, no industry has received greater attention of late than mining.
This section is based on research done in opencut mines. Although hard rock deep-level mines have different challenges, the same principles could be evaluated for relevance.
The popular tagline of the mining sector is that the miners are serious about productivity. We suggest that most are reducing costs and increasing volumes, but there are precious few with legitimate claims to improving core productivity in their open-cut operations. Miners are banking the first available dividend, selling or segregating mines deemed too hard to fix and tempering expectations of further productivity gains by citing a combination of labour laws, high costs, regulatory hold-ups and mine configuration constraints. There is no question that sustainable productivity dividends are harder to achieve, but if tackled properly they will drive superior long-term returns.
Many have been quick to point the finger at the overhang created by the volume maximisation strategies that prevailed during the commodity boom years, where absolute output was deliberately prioritised. But understanding why productivity fell during this period, and has continued to fall since, is a complex issue.
A focus on equipment performance promises to unlock billions of rands in productivity returns for miners…

23PwC
In a recent report we diagnosed the extent of the productivity challenge at both a macroeconomic and operating level, in South Africa and across the other major mining regions. For the latter, we drew upon operating data collected over 20 years from 136 mines and 4 760 individual machines – in all, this represents more than 47 million operating hours.
Key findings• The global mining industry’s
open-cut equipment productivity (i.e. annual output / capacity of input) has declined by 20% over the past seven years despite a push for increased output and declining market conditions.
• Mining equipment in South Africa runs at lower annual outputs than in most of its global peer countries. South Africa is not best-in-class for output from any category of equipment and is below the annual output of Australia, North America and South America across all classes of equipment.
• There is an inherent conflict between a productivity plan based on increased volumes and one based on cost reduction. Those mines with well-delineated strategies which are followed with discipline by their people make up the majority of those achieving top quartile equipment performance.
Figure 17: PwC’s Mining Equipment Productivity Index by region
Source: PwC’s Equipment Productivity and Reliability Database
• Company-wide equipment performance for many global miners sits in the second and third quartiles, and the differences between their best and worst performing mines are stark. The differences between median performance and best practice output by equipment category can be over 100%, as shown below, the majority of which can’t be attributed to different mining conditions or embedded issues associated with existing mine plans.
• For example, hard-rock mining conditions are a well-worn excuse for poor productivity performance, when in fact the data reveals there are many mines digging very hard materials who are achieving best practice. The extent to which these variances are monitored, rationalised or dismissed is unclear, as data capture management practices are still evolving compared with many other industries. The Tier 1 assets have the best ore bodies in the world. Imagine how profitable they would be if they also delivered best-in-class productivity performance.
Figure 18: Mining equipment performance by selected global large mining company
Source: PwC’s Equipment Productivity and Reliability Database
Australia
Index
2003 2004 2005 2006 2007 2008 2009 2010 2011 2012 2013
Africa Asia North America South America
70
80
90
100
110
120
130
140
Best time
Mining Company
Per
cent
age
of
bes
t p
ract
ice
Worst time Average time
0%
20%
40%
60%
80%
100%
120%
21 3 4 5 6 7 8 9 10

24 SA Mine: 7th edition – Highlighting trends in the South African mining industry
• Productivity is heavily dependent on the way people act. A better-rated piece of equipment might deliver 5%–10% output improvement and require additional capital, but changes in work practices can, in our experience, deliver 20%+ gains, often at little or no cost. Again, industrial relations (IR) issues are perceived as the primary constraint to productivity, yet the data shows significant divergences in performance from mines operating in close proximity, chasing the same commodity, and under very similar IR conditions.
Best practice equipment output gain versus median output, 2013
Dragline 56%
Electric rope shovel 64%
Hydraulic excavator 85%
Front end loader 156%
Mining (haul) trucks 82%
Source: PwC’s Equipment Productivity and Reliability Database
Best practice equipment output gain versus median output, MT per annum, 2013
Dragline 18.4
Electric rope shovel 11.9
Hydraulic excavator 11.4
Front end loader 6.1
Mining (haul) trucks 1.6
Source: PwC’s Equipment Productivity and Reliability Database
Implications
• Mining companies understand implicitly that productivity carries a value, but are not armed with the right data to make informed choices on the risks and rewards involved. Costs deferred or eliminated, as well as volume increases, have become the proxy for productivity gains. What’s more, in the current environment there is little patience for a productivity dividend that might be six or twelve months in the making, let alone one that needs an outlay of substantial capital to get there.
• Sizing the productivity prize will vary for each mine. To give some sense of the magnitude of the upside we considered the gains that could be made for a single item of equipment moving from median to best practice annual output, and then applied a conservative cost per tonne (representing the marginal cost of having that incremental material being moved by some other method such as an additional loader, truck, excavator, etc.). As an example, a front-end loader of average bucket capacity that could shift from median to best practice would increase annual output by 6.1 million tonnes and generate cost savings of between R20.00–R30.00 per tonne (i.e. a return of R122–R183 million per annum per machine). Best practice may not be possible on all sites, but apply this benefit to a substantial portion of a miner’s fleet and the financial upside quickly mounts.
The implications for improving productivity in the South African mining sector are clear. Companies serious about both cost control and productivity need to have a greater focus on the efficiency of their equipment. This means stepping beyond short term cost reduction initiatives and a preoccupation with extra tonnes leaving the mines.
25PwC
• Benchmarking of equipment performance has generated significant gains in some quarters and served to highlight diminished performance for others, and we have numerous case studies from mines across the globe.
• In our view, the easiest gains can be made in the areas of payload and availability. Annual performance is more highly leveraged to payload than any other metric, yet this is often overlooked. Maintenance practices can make the difference between equipment achieving typical availability rates of 85% and those achieving best practice of 90% or more.
• The implications for improving productivity in the South African mining sector are clear. Companies serious about both cost control and productivity need to have a greater focus on the efficiency of their equipment. This means stepping beyond short-term cost reduction initiatives and a preoccupation with extra tonnes leaving the mines. It’s about what’s happening inside the gates that is the key to arresting the industry’s productivity decline.
Mining Phakisa – the way forward?
On 31 August 2015, the mining industry, unions (excluding the Association of Mineworkers and Construction Union (AMCU)) and Government signed a declaration aimed at preventing further job cuts in the wake of falling commodity prices and increasing production costs. This will be followed by a Mining Phakisa discussion in October 2015. In the words of President Zuma, the purpose of Mining Phakisa is to ‘seek to position the industry as a catalyst for development, maximise the development of the industry across all value chains in the country, and find win-win solutions for mineral beneficiation’.
All participating stakeholders agreed to a number of initiatives aimed at sustaining jobs:
• Not unreasonably withholding extensions to consultation processes to allow for the implementation of interventions to address job losses;
• Enhancing productivity and managing cost pressures;
• Accelerating concurrent rehabilitation activities to create alternative jobs for mineworkers;
• Facilitating the sale of distressed and other mining assets; and
• Evaluating other alternatives to avoid job losses.
While involving all key industry players in finding a way forward for the mining industry is a sensible idea, it remains to be seen what impact AMCU’s absence will have for Phakisa
Given AMCU’s strong influence in the gold and platinum sectors, the question arises whether the collective declaration signed in August and Mining Phakisa will achieve their objectives without AMCU involvement. When one considers that the 2013 Framework Agreement for a Sustainable Mining Industry (signed by labour, government and industry) was unable to prevent the crippling strikes in the platinum sector in 2014, it is hard to see the Mining Phakisa and collective declaration achieving their goals without the involvement of all major stakeholders, especially when low commodity prices coupled with the constant demand for higher wages can intuitively only lead to job losses.

26 SA Mine: 7th edition – Highlighting trends in the South African mining industry
Safety4
27PwC
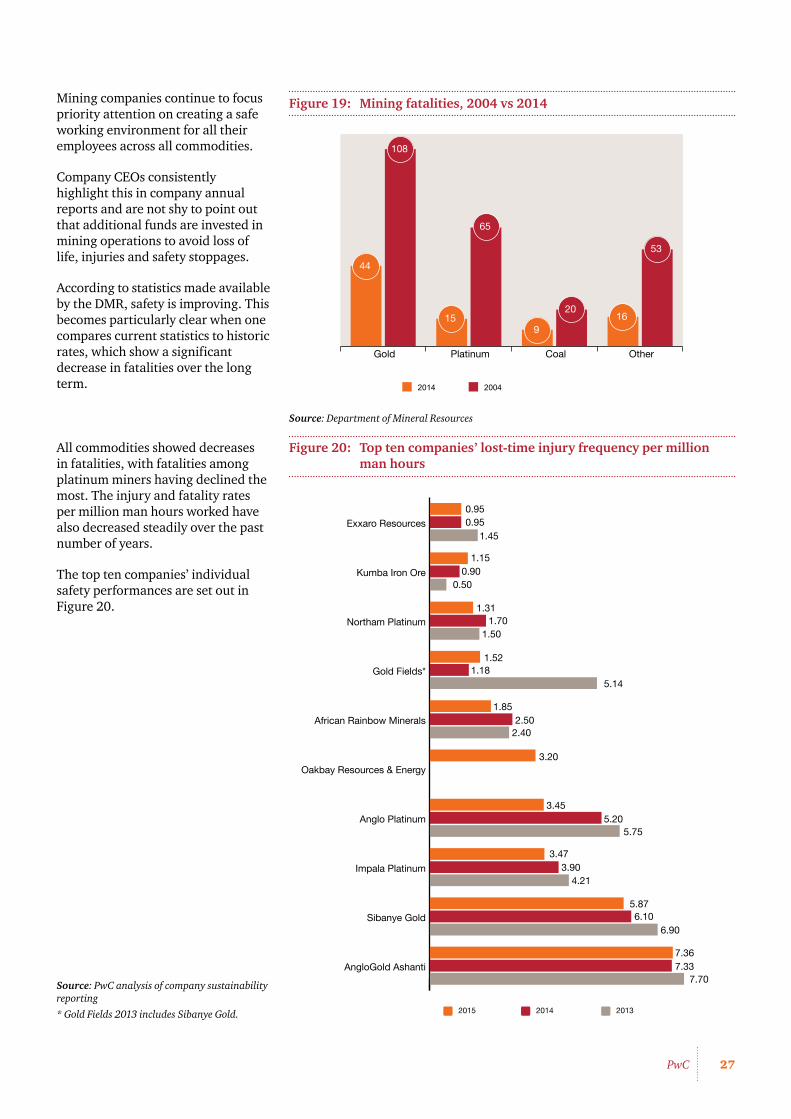
Mining companies continue to focus priority attention on creating a safe working environment for all their employees across all commodities.
Company CEOs consistently highlight this in company annual reports and are not shy to point out that additional funds are invested in mining operations to avoid loss of life, injuries and safety stoppages.
According to statistics made available by the DMR, safety is improving. This becomes particularly clear when one compares current statistics to historic rates, which show a significant decrease in fatalities over the long term.
Figure 19: Mining fatalities, 2004 vs 2014
Source: Department of Mineral Resources
2014 2004
OtherCoalPlatinumGold
44
169
15
108
65
20
53
All commodities showed decreases in fatalities, with fatalities among platinum miners having declined the most. The injury and fatality rates per million man hours worked have also decreased steadily over the past number of years.
The top ten companies’ individual safety performances are set out in Figure 20.
Figure 20: Top ten companies’ lost-time injury frequency per million man hours
AngloGold Ashanti
Sibanye Gold
Impala Platinum
Anglo Platinum
Oakbay Resources & Energy
African Rainbow Minerals
Gold Fields*
Northam Platinum
Kumba Iron Ore
Exxaro Resources
0.50
3.45
6.90
7.707.337.36
6.105.87
4.213.90
3.47
5.755.20
2.40
3.20
1.18
2.501.85
5.14
1.52
1.501.70
1.31
0.95
0.901.15
1.45
0.95
20142015 2013
Source: PwC analysis of company sustainability reporting
* Gold Fields 2013 includes Sibanye Gold.
28 SA Mine: 7th edition – Highlighting trends in the South African mining industry
Improving value to stakeholders5
29PwC
Improving value to stakeholders
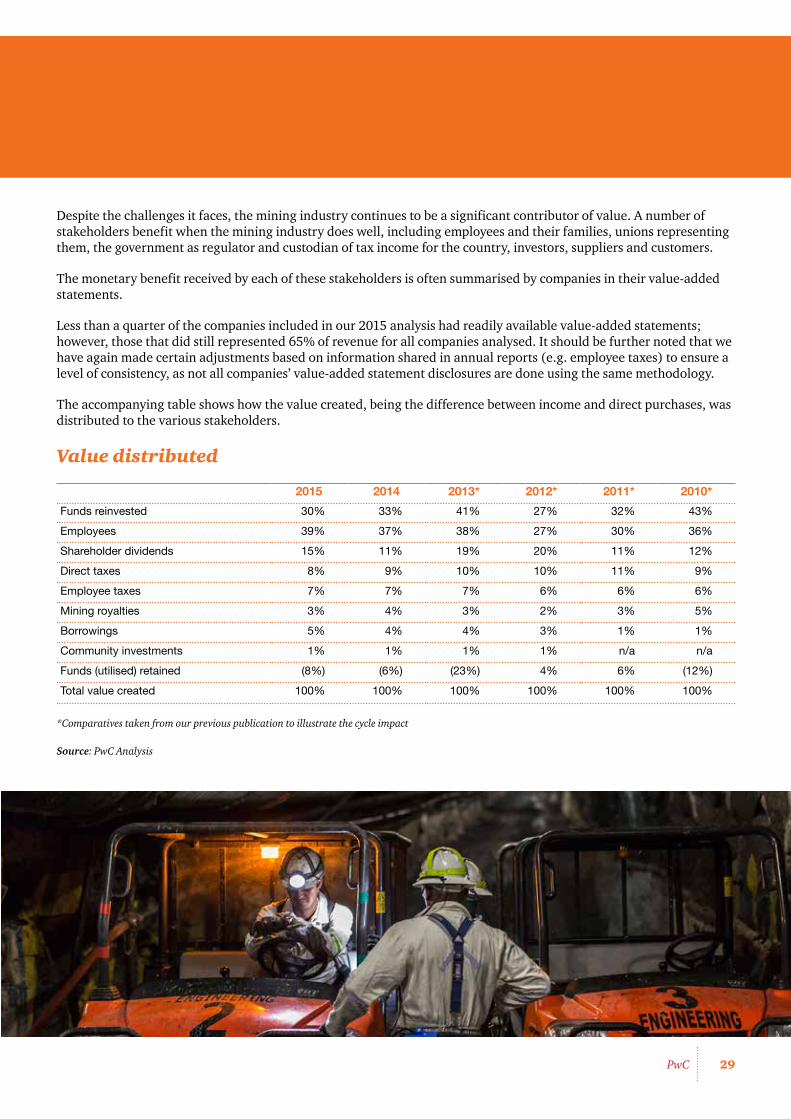
Despite the challenges it faces, the mining industry continues to be a significant contributor of value. A number of stakeholders benefit when the mining industry does well, including employees and their families, unions representing them, the government as regulator and custodian of tax income for the country, investors, suppliers and customers.
The monetary benefit received by each of these stakeholders is often summarised by companies in their value-added statements.
Less than a quarter of the companies included in our 2015 analysis had readily available value-added statements; however, those that did still represented 65% of revenue for all companies analysed. It should be further noted that we have again made certain adjustments based on information shared in annual reports (e.g. employee taxes) to ensure a level of consistency, as not all companies’ value-added statement disclosures are done using the same methodology.
The accompanying table shows how the value created, being the difference between income and direct purchases, was distributed to the various stakeholders.
Value distributed
2015 2014 2013* 2012* 2011* 2010*
Funds reinvested 30% 33% 41% 27% 32% 43%
Employees 39% 37% 38% 27% 30% 36%
Shareholder dividends 15% 11% 19% 20% 11% 12%
Direct taxes 8% 9% 10% 10% 11% 9%
Employee taxes 7% 7% 7% 6% 6% 6%
Mining royalties 3% 4% 3% 2% 3% 5%
Borrowings 5% 4% 4% 3% 1% 1%
Community investments 1% 1% 1% 1% n/a n/a
Funds (utilised) retained (8%) (6%) (23%) 4% 6% (12%)
Total value created 100% 100% 100% 100% 100% 100%
*Comparatives taken from our previous publication to illustrate the cycle impact
Source: PwC Analysis

30 SA Mine: 7th edition – Highlighting trends in the South African mining industry
Total value created by the entities analysed for purposes of the 2015 publication has declined by almost 9% when compared to 2014.
Most of this decrease is attributable to Anglo American Platinum Limited, Lonmin, and Kumba Iron Ore. The decrease was to be expected, seeing that the full impact of the five-month strike in the Rustenburg platinum belt experienced in the first half of 2014 has now been included in the reported results of both Anglo American Platinum and Lonmin. Furthermore, Kumba Iron Ore continues to be heavily impacted by the continuing significant decrease in iron ore price, exacerbated by an oversupply in the market. The outlook for the industry remains subdued as miners continue to be faced with a difficult operating environment, continued threats of labour unrest, increasing costs and continuously declining commodity prices, only slightly offset by a continuing weakening of the rand exchange rate.
Funds reinvested in the form of acquisitions and capital additions represented 30% (2014: 33%) of the total value created. This continues to highlight the long-term nature of capital investment required by mining companies to maintain
This trend of increasing wages is continuing to put pressure on operating models and will not be sustainable in the long term. If they cannot achieve a move back to the longer-term average through a return to profitability, which appears to be difficult in the current environment, companies are bound to consider reducing the number of employees. With the mining industry accounting for 5% of total direct employment, this is not the answer many stakeholders, including the government, would accept as the best option.
The state received 18% (2014: 20%) of value created, consisting of direct taxes, mining royalties and tax on employee income deducted from employees’ salaries. The actual contribution received by the state is significantly higher, however, with indirect taxes like VAT, import and export duties also being collected. As more companies start to report their total payments made to governments in line with the Extractive Industries’ Transparency Initiative, we will in future be able to assess that contribution better.
The challenge currently faced is determining how to increase the size of the pie to create more value for all stakeholders in an environment of ever increasing costs, reducing margins and increased volatility. Creating an environment with adequate infrastructure, less policy and regulatory uncertainty, and a skilled yet flexible workforce should go a long way towards attracting investment and benefiting all stakeholders.
production levels. The increased pressure from investors for mining companies to deliver returns is evident from a shrinkage in retained funds and the diversion of more funds towards increased shareholder dividends rather than making capital investments. Despite less funds being utilised to invest in capital, according to Statistics South Africa mining is still a significant contributor to the economy at 14% of capital expenditure as at 30 June 2015.
Shareholder dividends, as a percentage, represented 15% (2014: 11%) of total value created, which is an increase over the prior year. If Kumba Iron Ore’s results are excluded, the dividend percentage declines to 3% (2014: 2%). Kumba Iron Ore did also not declare a dividend at their recent half year results release which will reduce this percentage for next year.
The continued labour unrest felt by the mining sector is beginning to show as the value received by employees continues to increase. The value received by employees, as a percentage, represented 39% (2014: 37%) of the value created. The impact of the increased wages and relatively stable employment numbers in the lower price environment have contributed to this increase.
Figure 21: Directly employed mining employees (thousands)
Source: Stats SA
400
420
440
460
480
500
520
540
560
Jun
Mar
Dec
SepJu
nM
arD
ecS
epJun
Mar
Dec
SepJu
nM
arD
ecS
epJun
Mar
Dec
SepJu
nM
arD
ecS
epJun
Mar
Dec
SepJu
nM
arD
ec
20102007 2008 2009 2011 2012 2013 2014 2015
Sep
31PwC
Davis Tax Committee releases first interim report on mining
IntroductionThe Davis Tax Committee (DTC) has released its first interim report on mining for public comment. The report undertakes a review of the current mining income tax and royalty tax system (excluding oil and gas) and makes recommendations with regard to the reform thereof.
The Davis Tax Committee
Establishment of the Davis Tax Committee
Mr Pravin Gordhan, then Minister of Finance, announced upon tabling the 2013/2014 budget that a tax review committee would be established for the purpose of assessing:
…our tax policy framework and its role in supporting the objectives of inclusive growth, employment, development and fiscal sustainability.
On 17 July 2013, Mr Gordhan announced the members of the tax review committee, to be chaired by Judge Dennis Davis, and the terms of reference thereof.
Terms of reference of the Davis Tax Committee
The terms of reference (‘TOR’) of the DTC are to:
…inquire into the role of the [South African] tax system in the promotion of inclusive economic growth, employment creation, development and fiscal sustainability taking into account recent domestic and global developments and, in particular, the long-term objectives of the National Development Plan (NDP).
Process
The DTC is divided into various working streams, each with a different focus area. Based on its findings, the DTC is required to make recommendations to the Minister of Finance. These recommendations will be open to comment by the public at the discretion of the Minister, a process which is likely to be followed with respect to all reports. Any tax proposals arising from the recommendations of the DTC will be dealt with in the same manner as all tax policy proposals. As such, they will be announced as part of the annual budget and will be subject to consultation with the public and Parliamentary involvement.
The first interim report on mining
Introduction
The first interim report on mining released by the DTC contains provisional recommendations that are intended as a means of engaging stakeholders before final and conclusive recommendations are produced. The report was released for comment by the public that has to be submitted by 31 October 2015.
In its introduction to the first interim report, the DTC acknowledges that while some of the recommendations ‘represent a significant departure from the existing mining tax paradigm… the changes…represent the most appropriate long-term and sustainable direction for taxation in the industry’. The DTC cautioned, however, that the introduction of any changes would require sensitivity and careful management, and recognised the severe strain under which the industry was currently operating.
32 SA Mine: 7th edition – Highlighting trends in the South African mining industry
Recommendations of the Davis Tax Committee
Some of the most noteworthy recommendations are:
• Alignment of mining tax regime with non-mining tax regime:
— The corporate mining income tax regime should be aligned with the non-mining income tax regime, leaving the royalty system to respond to the non-renewable nature of mineral resources.
• Upfront capital expenditure tax allowance regime:
— The upfront capital expenditure write-off regime should be discontinued and replaced with accelerated capital depreciation in parity with the manufacturing industry’s write-off period of 40/20/20/20. Capital expenditure should be written off from the date on which expenditure is incurred as opposed to when capital is brought into use.
• Non-gold mining ring-fencing:
— The non-gold mining capital expenditure ring fences should be removed. The removal of the ring fences is pre-empted by the removal of the upfront capital expenditure tax allowance regime and should compensate taxpayers for the loss of the upfront allowance.
• The gold mining formula:
— The gold mining formula should be retained for existing gold mines only and should not apply to newly established gold mines. Alternatively, the gold mining formula should be phased out for all mines.
• Additional capital allowances for gold mining:
— Additional capital allowances available to gold mines should be phased out in order to align the gold mining tax regime with the non-gold mining tax regime.
• Mining royalties:
— The current royalty regime should be retained. Various aspects of the mineral royalty regime need to be clarified and improved, however, particularly with regard to the determination of EBIT and gross sales – for example:
• The exclusion therefrom of transport, handling and insurance costs after the condition specified; and
• The claiming of capital expenditure in determining EBIT in the event that the recommendations pertaining to the removal of the upfront capital expenditure allowance and the replacement thereof with an allowance on a 40/20/20/20 basis are accepted.
• Social labour plan expenditure
— Expenditure incurred in terms of a social and labour plan, including the infrastructure costs involved, should be allowed as a deduction for tax purposes.
• Recoupments
— Section 37 of the Income Tax Act, which provides for the calculation of capital expenditure on the disposal of mining property in the hands of the seller and the purchaser, should be removed with a view to bringing mining asset recoupments in line with the law applicable to non-mining taxpayers.
Other matters
Some matters dealt with in the report were deferred for discussion between other governmental stakeholders or work streams of the DTC. These include the promotion of research and development; incentives for employing additional labour; the relaxation of withholding tax on services paid to non-residents; rehabilitation funding; acid mine drainage; carbon tax; a review of the diesel rebate system; venture capital investment; and base erosion and profit-shifting (BEPS).
The full version of the first interim report on mining is available on the DTC’s website at www.taxcom.org.za and any comments thereon are to be submitted by 31 October 2015.
What can the mining industry expect?It is more than likely that the current South African tax regime applicable to mining companies will change. If the recommendations of the DTC are an indication of the extent of the change, it is clear that the mining industry can anticipate, at the minimum, that the mining tax regime will be largely aligned with the non-mining tax regime and that the current mining royalties regime will be refined.

33PwC
The relevance and sustainability of co-operative compliance models for tax in African countries
From a tax authority perspective the framework requires the provision of advance certainty on the taxpayer’s tax position, and a pre-defined oversight approach and audit plan based on the TCF provided.
The ultimate objectives of the concept are to reduce compliance costs and reputational risk and to achieve overall improved operational efficiency and effectiveness for both parties.
Co-operative compliance in African countriesThe African continent in particular has unique challenges, requiring unique solutions. Some practical recommendations on the effective operationalisation of programmes in African countries were considered in a paper issued by PwC and Vertex Inc at the first national congress of the Africa Tax Research Network (ATRN) held in Cape Town, South Africa from 2 to 4 September 2015.
A survey was conducted through a collaborative effort between PwC offices and clients representing the telecommunications sector in eight different African countries from the south west, central and eastern parts of the continent. The survey looked at the current environment from a co-operative compliance perspective, highlighting the major perceived challenges regarding general tax issues. It also included recommendations for the implementation of effective co-operative models in the African context.
Recommendations for African countries on the introduction of co-operative compliance modelsThe recommendations arising from the survey are listed below:
• Set up clear, measurable key performance indicators.
• Define the benefits for taxpayers – quid pro quo.
• Define the concept of trust in terms of the TCF, including the salient features thereof, as it relates to the following:
• Business and tax environment;
• Tax operations;
• Tax risk management;
• Monitoring and testing; and
• Tax assurance.
• Define an auditing standard for the TCF.
• Manage disputes within co-operative compliance programmes.
• Enable tax authorities’ employees.
• Leverage the available technology to ensure compliance, with due regard for the following:
• Cloud systems;
• Big data analytics;
• Security considerations;
• Interoperability of systems; and
• Tax reporting solutions.
Conclusion The search for new and effective ways of ensuring tax compliance is a common issue for countries worldwide, with tax authorities constantly needing to enhance and strengthen their domestic resource mobilisation and fiscal space. This includes, where appropriate, the introduction of modernised tax systems, more efficient tax collection, the broadening of the tax base and the effective combating of tax evasion and capital flight.
This drive has already seen requirements and guidance being issued by the Australian Tax Office and Her Majesty’s Revenue and Customs which refer to TCF and tax governance in line with the principles of a co-operative compliance model. These recent developments will influence the adoption of an African co-operative compliance model to follow suit, with similar outcomes.
IntroductionGlobalisation, climate change, resource scarcity, technological breakthroughs, public and political scrutiny of tax behaviour and emerging economies are only some of the factors affecting the global tax landscape. Tax authorities are under pressure to do more with less, while economies are faced with the struggle of how to optimise the collection of tax revenues while continuing to attract investment.
In response to the challenges faced by tax authorities today, approximately 30 jurisdictions worldwide have adopted a co-operative tax model – a concept that first emerged on the international tax scene around 2005 and has evolved into its current form after the conclusion of various studies commissioned by the OECD.
Although co-operative compliance is not a defined term, its main objectives are to improve tax compliance behaviour while lowering costs for both the paying party and the relevant tax administration authority. While the various participating countries are emphasising different elements of the model, its most notable characteristics are transparency, justified trust, and an understanding of the taxpayer’s business and risk profile.
How does the concept of co-operative compliance work?The essence of co-operative compliance can be said to involve enhanced communication between the various stakeholders in the tax cycle. It is understood that a major element of this communication is the adoption of a tax control framework (TCF) by tax payers. This TCF may be either internally or externally validated in order to provide assurance to the tax authorities that information within the framework is correct and hence the tax risks identified are appropriate.

34 SA Mine: 7th edition – Highlighting trends in the South African mining industry
Boardroom dynamics6

35PwC
Board composition
An analysis of the companies suggests that the mining industry currently exceeds the minimum empowerment levels of board representation required by the Mining Charter.
At present, 41% (prior year 41% of the companies analysed) of board members are represented by HDSAs. The Mining Charter required a minimum of 40% representation by 31 December 2014. When this board composition is analysed by age it interesting to note that 30% of board members are younger than 50 and 53% of these board members are HDSA.
Figure 22: Board composition by race and age
Source: PwC analysis
45%
43%
5%
6%
25%
3%
3%11%
13%23%
13%
11%
2014
2015
White <40 White 40-49 White 50+
HDSA <40 HDSA 40-49 HDSA 50+

36 SA Mine: 7th edition – Highlighting trends in the South African mining industry
Female representation at board level also exceeds the minimum requirements of 10% by 2014 set out in the Mining Charter.
Figure 23: Board composition by gender
Source: PwC analysis
83%
84%
17%
16%
2014
2015
Male Female
The changing mining and governance environments require a changed skill set. The average board size for the companies analysed was nine, which allows for an adequate spread of skills. The smallest board had three members and the biggest board 15 members.
Although qualifications are by no means the only indication of expertise and experience, the following categorisation of board members by their primary qualification provides an interesting spread. As expected, board members provide a wide array of experience.
Figure 24: Board skills represented
Source: PwC analysis
30%
28%
6%
37%
37%
6%
16%16%
13%
11%
2014
2015
Accountants Other Engineers
Legal Geologists

37PwC
Financial performance7
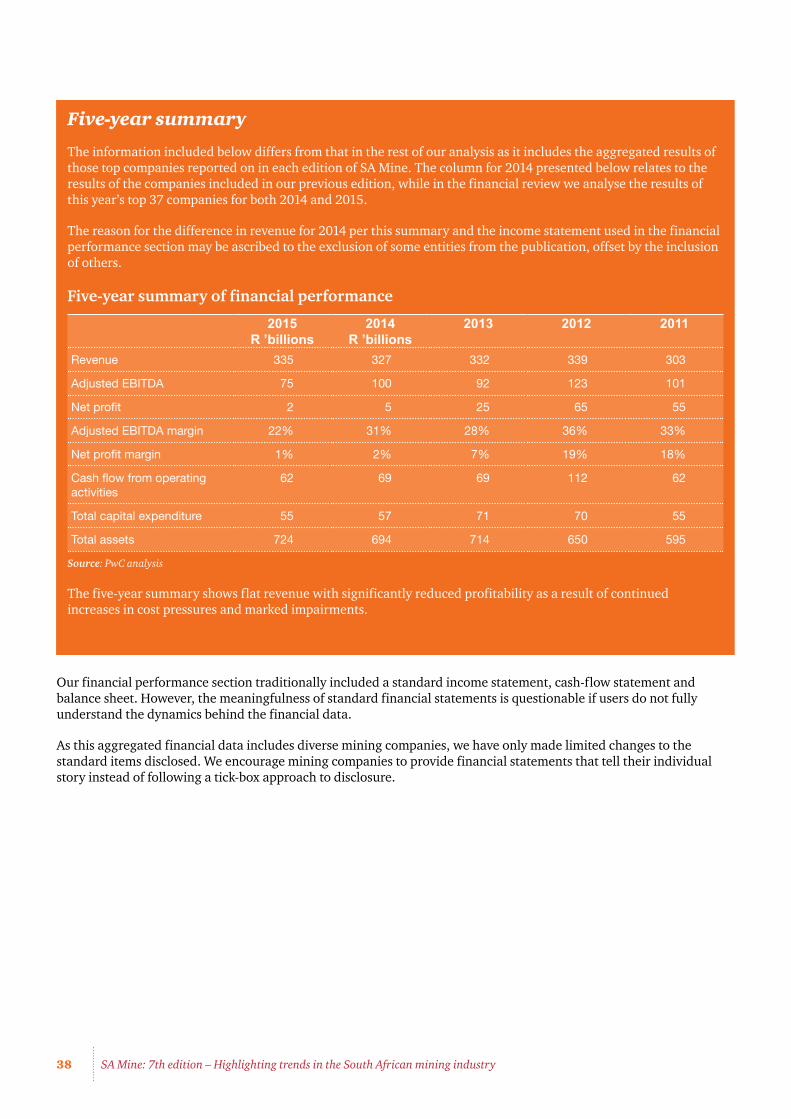
38 SA Mine: 7th edition – Highlighting trends in the South African mining industry
Our financial performance section traditionally included a standard income statement, cash-flow statement and balance sheet. However, the meaningfulness of standard financial statements is questionable if users do not fully understand the dynamics behind the financial data.
As this aggregated financial data includes diverse mining companies, we have only made limited changes to the standard items disclosed. We encourage mining companies to provide financial statements that tell their individual story instead of following a tick-box approach to disclosure.
Five-year summary
The information included below differs from that in the rest of our analysis as it includes the aggregated results of those top companies reported on in each edition of SA Mine. The column for 2014 presented below relates to the results of the companies included in our previous edition, while in the financial review we analyse the results of this year’s top 37 companies for both 2014 and 2015.
The reason for the difference in revenue for 2014 per this summary and the income statement used in the financial performance section may be ascribed to the exclusion of some entities from the publication, offset by the inclusion of others.
Five-year summary of financial performance
2015 R ’billions
2014 R ’billions
2013 2012 2011
Revenue 335 327 332 339 303
Adjusted EBITDA 75 100 92 123 101
Net profit 2 5 25 65 55
Adjusted EBITDA margin 22% 31% 28% 36% 33%
Net profit margin 1% 2% 7% 19% 18%
Cash flow from operating activities
62 69 69 112 62
Total capital expenditure 55 57 71 70 55
Total assets 724 694 714 650 595
Source: PwC analysis
The five-year summary shows flat revenue with significantly reduced profitability as a result of continued increases in cost pressures and marked impairments.
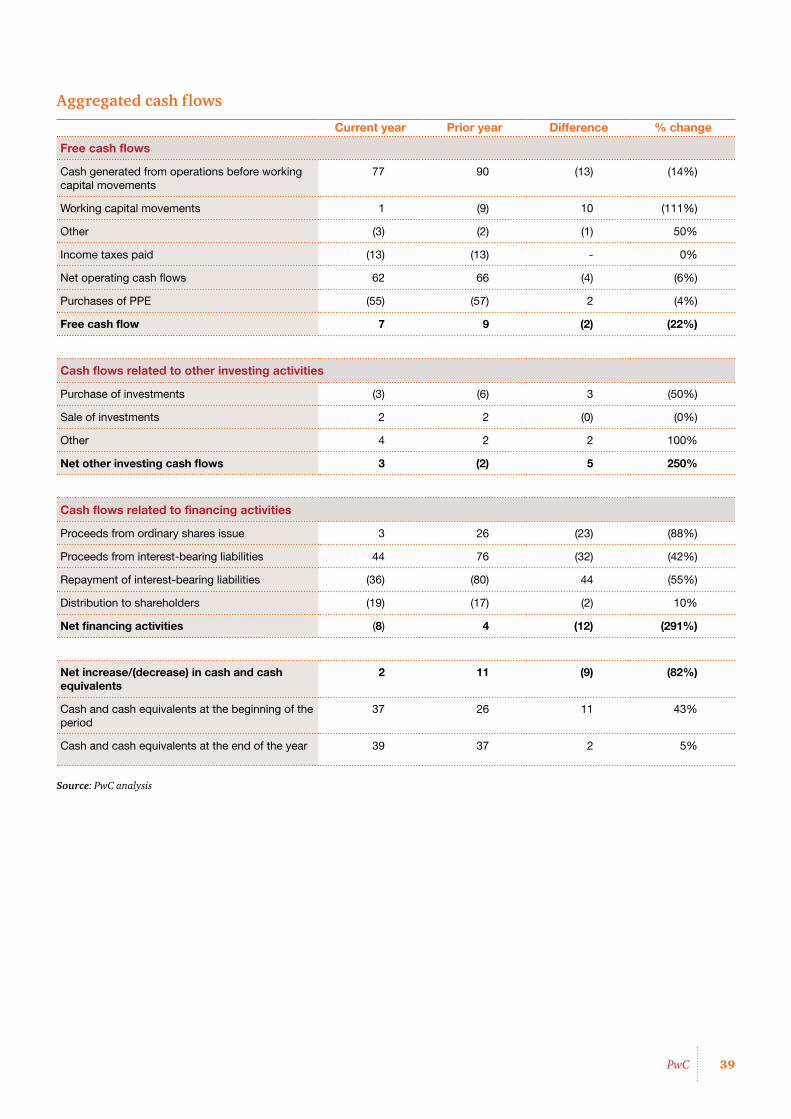
39PwC
Aggregated cash flows
Current year Prior year Difference % change
Free cash flows
Cash generated from operations before working capital movements
77 90 (13) (14%)
Working capital movements 1 (9) 10 (111%)
Other (3) (2) (1) 50%
Income taxes paid (13) (13) - 0%
Net operating cash flows 62 66 (4) (6%)
Purchases of PPE (55) (57) 2 (4%)
Free cash flow 7 9 (2) (22%)
Cash flows related to other investing activities
Purchase of investments (3) (6) 3 (50%)
Sale of investments 2 2 (0) (0%)
Other 4 2 2 100%
Net other investing cash flows 3 (2) 5 250%
Cash flows related to financing activities
Proceeds from ordinary shares issue 3 26 (23) (88%)
Proceeds from interest-bearing liabilities 44 76 (32) (42%)
Repayment of interest-bearing liabilities (36) (80) 44 (55%)
Distribution to shareholders (19) (17) (2) 10%
Net financing activities (8) 4 (12) (291%)
Net increase/(decrease) in cash and cash equivalents
2 11 (9) (82%)
Cash and cash equivalents at the beginning of the period
37 26 11 43%
Cash and cash equivalents at the end of the year 39 37 2 5%
Source: PwC analysis
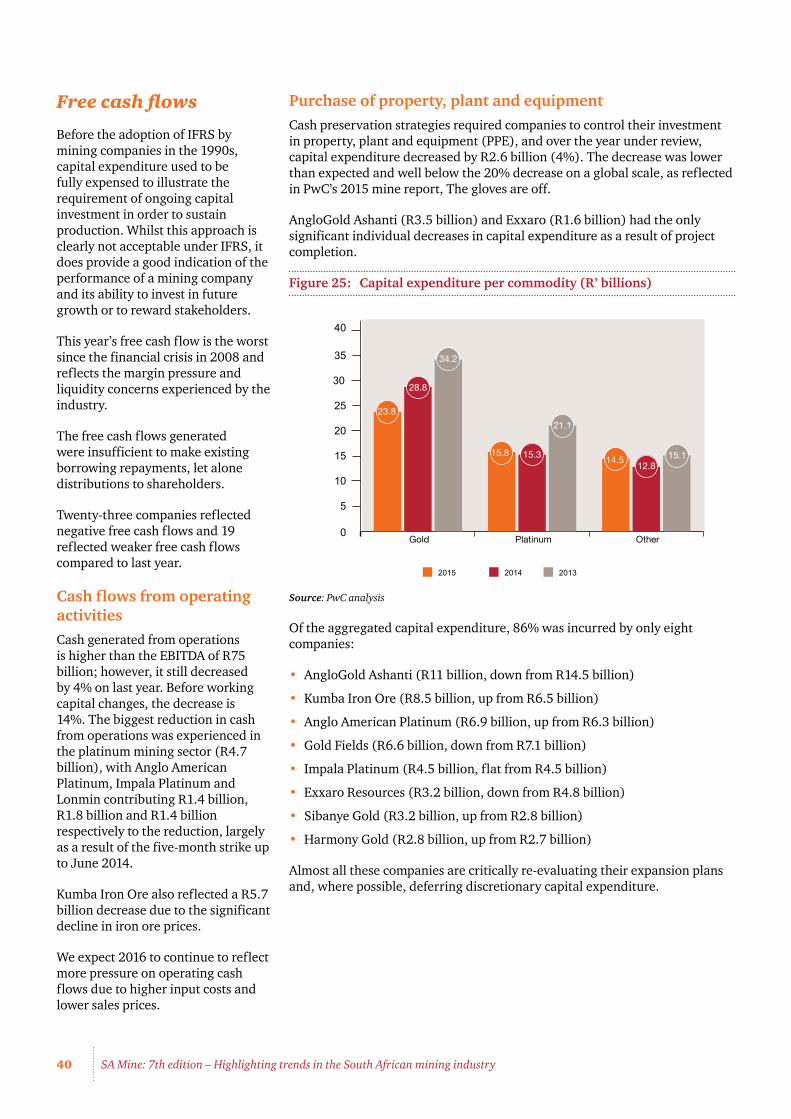
40 SA Mine: 7th edition – Highlighting trends in the South African mining industry
Free cash flows
Before the adoption of IFRS by mining companies in the 1990s, capital expenditure used to be fully expensed to illustrate the requirement of ongoing capital investment in order to sustain production. Whilst this approach is clearly not acceptable under IFRS, it does provide a good indication of the performance of a mining company and its ability to invest in future growth or to reward stakeholders.
This year’s free cash flow is the worst since the financial crisis in 2008 and reflects the margin pressure and liquidity concerns experienced by the industry.
The free cash flows generated were insufficient to make existing borrowing repayments, let alone distributions to shareholders.
Twenty-three companies reflected negative free cash flows and 19 reflected weaker free cash flows compared to last year.
Cash flows from operating activitiesCash generated from operations is higher than the EBITDA of R75 billion; however, it still decreased by 4% on last year. Before working capital changes, the decrease is 14%. The biggest reduction in cash from operations was experienced in the platinum mining sector (R4.7 billion), with Anglo American Platinum, Impala Platinum and Lonmin contributing R1.4 billion, R1.8 billion and R1.4 billion respectively to the reduction, largely as a result of the five-month strike up to June 2014.
Kumba Iron Ore also reflected a R5.7 billion decrease due to the significant decline in iron ore prices.
We expect 2016 to continue to reflect more pressure on operating cash flows due to higher input costs and lower sales prices.
Purchase of property, plant and equipmentCash preservation strategies required companies to control their investment in property, plant and equipment (PPE), and over the year under review, capital expenditure decreased by R2.6 billion (4%). The decrease was lower than expected and well below the 20% decrease on a global scale, as reflected in PwC’s 2015 mine report, The gloves are off.
AngloGold Ashanti (R3.5 billion) and Exxaro (R1.6 billion) had the only significant individual decreases in capital expenditure as a result of project completion.
Figure 25: Capital expenditure per commodity (R’ billions)
Source: PwC analysis
Of the aggregated capital expenditure, 86% was incurred by only eight companies:
• AngloGold Ashanti (R11 billion, down from R14.5 billion)
• Kumba Iron Ore (R8.5 billion, up from R6.5 billion)
• Anglo American Platinum (R6.9 billion, up from R6.3 billion)
• Gold Fields (R6.6 billion, down from R7.1 billion)
• Impala Platinum (R4.5 billion, flat from R4.5 billion)
• Exxaro Resources (R3.2 billion, down from R4.8 billion)
• Sibanye Gold (R3.2 billion, up from R2.8 billion)
• Harmony Gold (R2.8 billion, up from R2.7 billion)
Almost all these companies are critically re-evaluating their expansion plans and, where possible, deferring discretionary capital expenditure.
2015 2014 2013
0
5
10
15
20
25
30
35
40
OtherPlatinumGold
23.8
14.515.8
34.2
28.8
15.3
21.1
15.112.8

41PwC
Cash flows from other investing activities
Not surprisingly, few significant other investments were made during the year.
Over the last two years a number of companies have communicated their intention of disposing of non-core assets. AngloGold Ashanti realised proceeds of $105 million on the sale of their Navachab subsidiary in the USA. Others were less successful with local disposals, as potential buyers are in short supply in the current commodity price environment.
However, after year end, Anglo American Platinum concluded the sale of its Rustenburg mines to Sibanye Gold and Sibanye Gold announced the purchase of Aquarius Platinum.
The liquidity constraints in the industry at present are likely to create more opportunities for mergers and acquisitions for those companies that have readily available cash resources and long-term strategic views.
Cash flows from financing activities
EquityProceeds from the issuing of shares are down by R23 billion, from R26 billion in the prior year. The prior year’s number was inflated as a result of the Sibanye unbundling, but there had also been a R7.8 billion rights issue by Lonmin. However, the current low market capitalisation of the mining sector means that equity issues are not a first resort for capital.
In the current year, Royal Bafokeng Platinum issued R1.5 billion in equity.
After year end, a number of companies announced their intention to raise equity including Impala Platinum that announced a R4 billion share issue.
BorrowingsThere was a net debt increase in the current year of R9 billion.
Mining companies decreased debt incurred, with the exception of Kumba Iron Ore (R6.7 billion), Anglo American Platinum (R3.2 billion) and Lonmin (R1.8 billion), which recorded a net increase in borrowings.
Kumba Iron Ore and Anglo American Platinum borrowed within the Anglo American group, whilst Lonmin utilised facilities from commercial banks.
Distributions to shareholdersDistributions to shareholders increased from R17 billion in the prior year to R19 billion in the current year. The increase is largely as a result of an increase in distributions by Kumba Iron Ore (R1.5 billion), which paid dividends of R15.2 billion. Other notable distributions include R2 billion paid by Exxaro and R1 billion paid by Sibanye Gold.
Aggregated income statement
Current year
Prior year Difference % change
Revenue from ordinary activities
335 323 12 4%
Operating expenses (260) (229) (31) 14%
Adjusted EBITDA 75 94 (19) (20%)
Impairment (charge)/reversal
(24) (50) 26 (52%)
Depreciation (38) (34) (4) 12%
PBIT 13 10 3 30%
Net interest (7) (6) (1) 17%
Tax expense (8) (9) 1 (11%)
Equity-accounted income 4 9 (5) (56%)
Discontinued operations - 4 (4) (100%)
Net profit 2 8 (6) (75%)
Adjusted EBITDA margin 22% 29% (7%)
Net profit margin 1% 2% (1%)
Effective tax rate 47% 47% 0%
Source: PwC analysis

42 SA Mine: 7th edition – Highlighting trends in the South African mining industry
Revenue
Revenue has increased by a mere 4% or R12 billion on last year. For most December reporters, revenue increased on the back of the higher rand prices, offset by the impact of the industrial action from January to June 2014. For June reporters, lower rand prices were offset by increased production due to the fact that industrial action was mainly included in the impact of the prior year.
The significant decrease in iron ore prices could not be offset by increased production or the weaker rand and resulted in a R6.9 billion decrease in Kumba Iron Ore’s revenue.
Companies where increased production helped to increase revenue were Anglo Gold Ashanti (R3.3 billion), Exxaro Resources (R2.8 billion) and Gold Fields (R3.1 billion).
Gold mining companies have continued to be top contributors in terms of revenue. Their increased revenue this year was as a result of better production rather than improved prices. More than half of their gold revenue is generated from outside South Africa.
Revenue
Current year Prior year Difference % change
Gold 131 122 9 7%
Platinum 113 109 4 4%
Other 91 92 (1) (1%)
Operating expenses
Operating expenses increased by 14%, which is higher than the 13% of the previous financial year. However, when companies affected by the platinum strike are excluded, the increase climbs to 15%. Although some companies recorded increases in production, those aggregated increases are not sufficient to explain the difference between the cost increase and normal inflation.
A breakdown of the operating expenses for companies that disclosed expenses by nature (representing 81% of aggregated revenue) is depicted in the table below, with the year-on-year increase for these companies included in the table.
Breakdown of operating expenses
Year-on-year increases (decreases) in operating expenses
Cost component Current year excluding platinum strike companies
Current year Prior year
Employment benefits and contractors
11.4% 8.9% 10.5%
Consumables and mining supplies
12.1% 10.3% 6.0%
Utilities 19.7% 13.4% 12.2%
Transportation costs 2.2% 2.6% 12.70%
Royalties (13.2%) (32.0%) 24.6%
Exploration (35.2%) (31.9%) (7.0%)
Source: PwC analysis
Figure 26: Breakdown of operating expenses
Source: PwC analysis
10%
7%
2%1%
23%
22%
11%
3%
8%2%
2014
2015
13%
6%
47%
45%
Employment benefits andcontractorsConsumables and mining supplies
Utilities (Water and electricity)
Transportation costs
Exploration
Royalties
Other
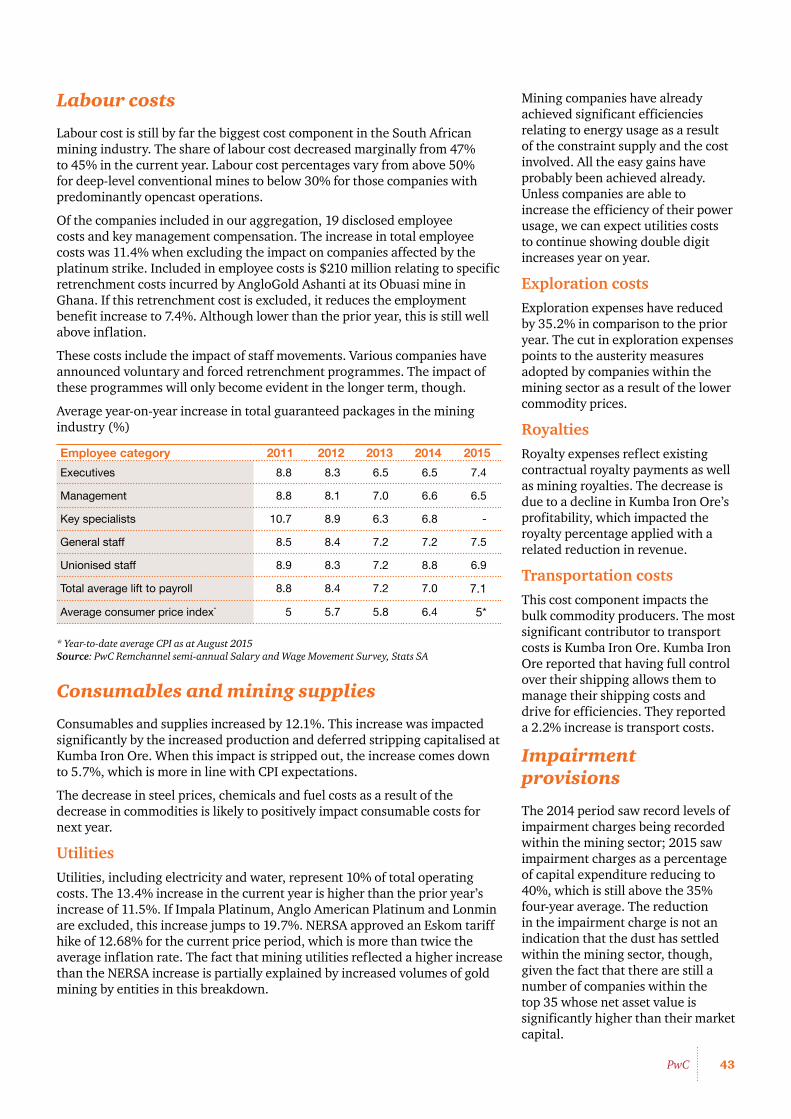
43PwC
Labour costs
Labour cost is still by far the biggest cost component in the South African mining industry. The share of labour cost decreased marginally from 47% to 45% in the current year. Labour cost percentages vary from above 50% for deep-level conventional mines to below 30% for those companies with predominantly opencast operations.
Of the companies included in our aggregation, 19 disclosed employee costs and key management compensation. The increase in total employee costs was 11.4% when excluding the impact on companies affected by the platinum strike. Included in employee costs is $210 million relating to specific retrenchment costs incurred by AngloGold Ashanti at its Obuasi mine in Ghana. If this retrenchment cost is excluded, it reduces the employment benefit increase to 7.4%. Although lower than the prior year, this is still well above inflation.
These costs include the impact of staff movements. Various companies have announced voluntary and forced retrenchment programmes. The impact of these programmes will only become evident in the longer term, though.
Average year-on-year increase in total guaranteed packages in the mining industry (%)
Employee category 2011 2012 2013 2014 2015
Executives 8.8 8.3 6.5 6.5 7.4
Management 8.8 8.1 7.0 6.6 6.5
Key specialists 10.7 8.9 6.3 6.8 -
General staff 8.5 8.4 7.2 7.2 7.5
Unionised staff 8.9 8.3 7.2 8.8 6.9
Total average lift to payroll 8.8 8.4 7.2 7.0 7.1
Average consumer price index* 5 5.7 5.8 6.4 5*
* Year-to-date average CPI as at August 2015 Source: PwC Remchannel semi-annual Salary and Wage Movement Survey, Stats SA
Consumables and mining supplies
Consumables and supplies increased by 12.1%. This increase was impacted significantly by the increased production and deferred stripping capitalised at Kumba Iron Ore. When this impact is stripped out, the increase comes down to 5.7%, which is more in line with CPI expectations.
The decrease in steel prices, chemicals and fuel costs as a result of the decrease in commodities is likely to positively impact consumable costs for next year.
UtilitiesUtilities, including electricity and water, represent 10% of total operating costs. The 13.4% increase in the current year is higher than the prior year’s increase of 11.5%. If Impala Platinum, Anglo American Platinum and Lonmin are excluded, this increase jumps to 19.7%. NERSA approved an Eskom tariff hike of 12.68% for the current price period, which is more than twice the average inflation rate. The fact that mining utilities reflected a higher increase than the NERSA increase is partially explained by increased volumes of gold mining by entities in this breakdown.
Mining companies have already achieved significant efficiencies relating to energy usage as a result of the constraint supply and the cost involved. All the easy gains have probably been achieved already. Unless companies are able to increase the efficiency of their power usage, we can expect utilities costs to continue showing double digit increases year on year.
Exploration costsExploration expenses have reduced by 35.2% in comparison to the prior year. The cut in exploration expenses points to the austerity measures adopted by companies within the mining sector as a result of the lower commodity prices.
RoyaltiesRoyalty expenses reflect existing contractual royalty payments as well as mining royalties. The decrease is due to a decline in Kumba Iron Ore’s profitability, which impacted the royalty percentage applied with a related reduction in revenue.
Transportation costsThis cost component impacts the bulk commodity producers. The most significant contributor to transport costs is Kumba Iron Ore. Kumba Iron Ore reported that having full control over their shipping allows them to manage their shipping costs and drive for efficiencies. They reported a 2.2% increase is transport costs.
Impairment provisions
The 2014 period saw record levels of impairment charges being recorded within the mining sector; 2015 saw impairment charges as a percentage of capital expenditure reducing to 40%, which is still above the 35% four-year average. The reduction in the impairment charge is not an indication that the dust has settled within the mining sector, though, given the fact that there are still a number of companies within the top 35 whose net asset value is significantly higher than their market capital.
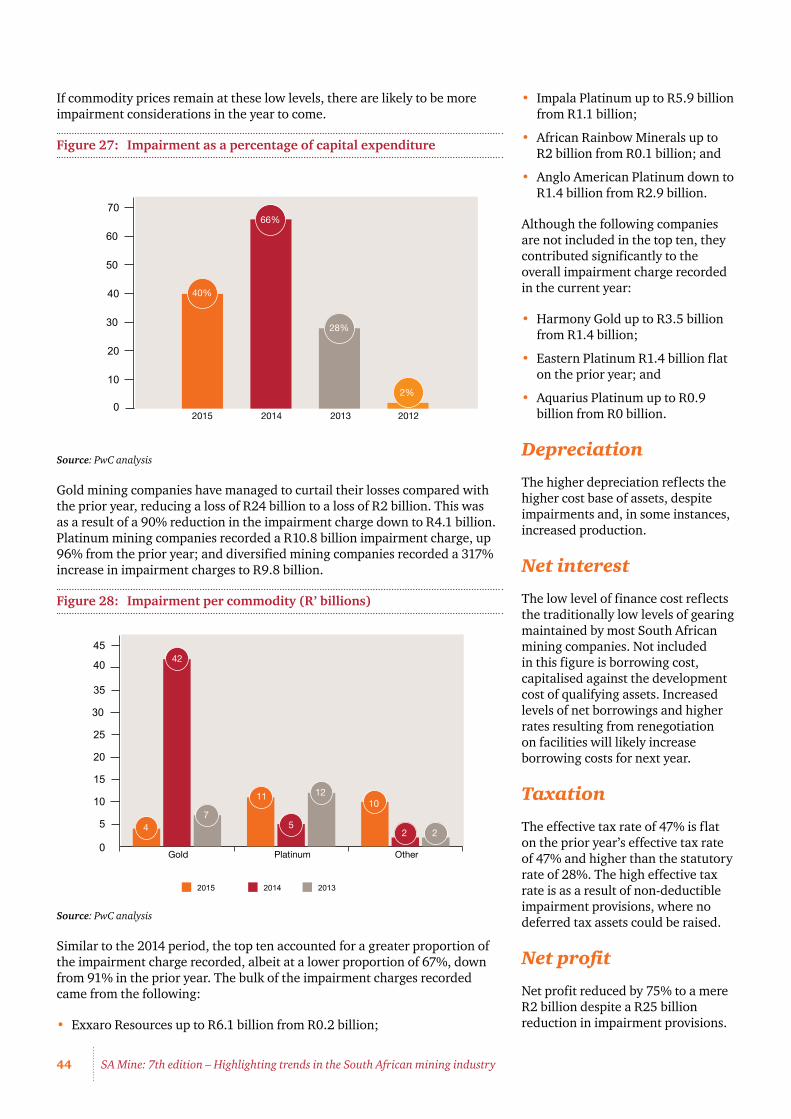
44 SA Mine: 7th edition – Highlighting trends in the South African mining industry
If commodity prices remain at these low levels, there are likely to be more impairment considerations in the year to come.
Figure 27: Impairment as a percentage of capital expenditure
Source: PwC analysis
Gold mining companies have managed to curtail their losses compared with the prior year, reducing a loss of R24 billion to a loss of R2 billion. This was as a result of a 90% reduction in the impairment charge down to R4.1 billion. Platinum mining companies recorded a R10.8 billion impairment charge, up 96% from the prior year; and diversified mining companies recorded a 317% increase in impairment charges to R9.8 billion.
Figure 28: Impairment per commodity (R’ billions)
Source: PwC analysis
Similar to the 2014 period, the top ten accounted for a greater proportion of the impairment charge recorded, albeit at a lower proportion of 67%, down from 91% in the prior year. The bulk of the impairment charges recorded came from the following:
• Exxaro Resources up to R6.1 billion from R0.2 billion;
2015 2014 2013 20120
10
20
30
40
50
60
70
40%
2%
28%
66%
2015 2014 2013
0
5
10
15
20
25
30
35
40
45
OtherPlatinumGold
4
1011
7
42
5
12
22
• Impala Platinum up to R5.9 billion from R1.1 billion;
• African Rainbow Minerals up to R2 billion from R0.1 billion; and
• Anglo American Platinum down to R1.4 billion from R2.9 billion.
Although the following companies are not included in the top ten, they contributed significantly to the overall impairment charge recorded in the current year:
• Harmony Gold up to R3.5 billion from R1.4 billion;
• Eastern Platinum R1.4 billion flat on the prior year; and
• Aquarius Platinum up to R0.9 billion from R0 billion.
Depreciation
The higher depreciation reflects the higher cost base of assets, despite impairments and, in some instances, increased production.
Net interest
The low level of finance cost reflects the traditionally low levels of gearing maintained by most South African mining companies. Not included in this figure is borrowing cost, capitalised against the development cost of qualifying assets. Increased levels of net borrowings and higher rates resulting from renegotiation on facilities will likely increase borrowing costs for next year.
Taxation
The effective tax rate of 47% is flat on the prior year’s effective tax rate of 47% and higher than the statutory rate of 28%. The high effective tax rate is as a result of non-deductible impairment provisions, where no deferred tax assets could be raised.
Net profit
Net profit reduced by 75% to a mere R2 billion despite a R25 billion reduction in impairment provisions.

45PwC
The EBITDA margin is 22% in the current year, down 7% on last year. This low EBITDA percentage, which serves as an approximation of cash earnings, is not sustainable.
Ten companies achieved a higher-than-average EBITDA.
Companies with EBITDA above 22%
Current year Prior year
Petmin 61% 70%
Kumba Iron Ore 47% 56%
Assore 39% 60%
Gold Fields 32% 30%
Royal Bafokeng Platinum 32% 31%
Oakbay Resources & Energy 31% (38%)
Sibanye Gold 28% 31%
AngloGold Ashanti 24% 34%
African Rainbow Minerals 23% 30%
Exxaro Resources 23% 26%
Source: PwC analysis
Different commodities achieved marked different results.
EBITDA by commodity
Current year Prior year Difference % change
Gold 32 37 (5) (14%)
Platinum 12 19 (7) (37%)
Other 31 39 (8) (21%)
Source: PwC analysis
EBITDA margin by commodity
Current year Prior year Difference
Gold 24% 30% (6%)
Platinum 11% 17% (6%)
Other 34% 42% (8%)
Source: PwC analysis
EBITDA by commodity adjusted for taxes and capital expenditure
Current year Prior year Difference
Gold 4 12 (8)
Platinum (3) 2 (5)
Other 12 16 (4)
Source: PwC analysis

46 SA Mine: 7th edition – Highlighting trends in the South African mining industry
These margins indicate that the industry barely generated enough profits to pay its tax and capital expenditure, let alone repaying borrowings and returning dividends to its investors.
Net profit/(loss) by commodity
Current year Prior year Difference % change
Gold (2) (24) 22 92%
Platinum (10) 0 (10) (100%)
Other 14 33 (19) (58%)
Source: PwC analysis
Foreign exchange impact
The impact of the rand exchange rate on performance is quite substantial. When converting the aggregated income statements at the relevant average USD exchange rates, a substantial difference in performance emerges.
In dollar terms, revenue declined by 9%, compared to a 4% increase in rand terms.
The prolonged weakening of the rand against the dollar since the end of 2013 has continued to have a pronounced impact on comparative performance based on presentation currency. With lower dollar commodity prices being masked by a weaker rand, the performance will be weaker in dollar terms than in rand terms.
Income statement
Current year
Prior year Difference % change
USD ‘billions
Revenue from ordinary activities
31 34 (3) (9%)
Operating expenses (24) (24) - (0%)
Adjusted EBITDA 7 10 (3) (30%)
Impairment (charge)/reversal (2) (5) 3 (60%)
Depreciation (3) (4) 1 (25)%
PBIT 2 1 1 100%
Net interest (1) (1) - 0%
Tax expense (1) (1) - 0%
Discontinued operations - - - 0%
Net profit - (1) 1 100%
Adjusted EBITDA margin 23% 29% (7%)
Net profit margin 0% (3%) 3%
Source: PwC analysis

47PwC
Aggregate financial position
Current year
Prior year Difference % change
Current assets
Cash and cash equivalents 38 34 4 12%
Inventories 60 60 - 0%
Receivables and other current assets
39 36 3 8%
Assets held for sale 1 3 (2) (67%)
Total current assets 138 133 5 4%
Non-current assets
Mining and production assets 425 416 9 2%
Goodwill 9 8 1 13%
Investments 91 89 2 2%
Other non-current assets 61 56 5 9%
Total non-current assets 586 569 17 3%
Total assets 724 702 22 3%
Share capital and reserves
Share capital 306 280 26 9%
Reserves and non-controlling interest
124 150 (26) (17%)
Total equity 430 430 - 0%
Current liabilities
Accounts payable and other liabilities
62 66 (4) (6%)
Interest-bearing liabilities 23 13 10 77%
Total current liabilities 85 79 6 8%
Non-current liabilities
Interest-bearing liabilities 100 92 8 9%
Deferred taxation liabilities 64 66 (2) (3%)
Other non-current liabilities 45 34 11 32%
Liabilities held for sale - 1 (1) (100%)
Total non-current liabilities 209 193 16 8%
Total liabilities 293 271 22 8%
Total equity and liabilities 722 701 21 3%

48 SA Mine: 7th edition – Highlighting trends in the South African mining industry
Key ratios
Current year Prior year Global mine ratios
Net borrowings (R’billion) 85 71
Gearing percentage (%) 17 14 43
Solvency ratio (times) 2.5 2.6 2.0
Current ratio (times) 1.6 1.7 1.5
Acid ratio (times) 0.9 0.9 1.1
Source: PwC analysis
Financial position
Solvency and liquidity ratios remained relatively strong. The solvency ratio has remained consistent with that of the prior year and is still significantly better than the global equivalent. The ratios indicate that the South African mining industry is less geared than the trend is globally. The liquidity ratios have remained fairly stable since the prior year despite the weakening in commodity prices. That said, the acid ratio of less than one and below the global average is of a concern. The average rate also hides the individual low liquidity experienced by some companies.
These ratios are all derived from historical cost-carrying amounts and therefore do not necessarily reflect the true fair-value trends. A better
indication of the weakening of the industry is a comparison between net assets and market capitalisation. The market capital as a multiple of the carrying amounts weakened from 1.7 to 1.0. This indicates a decrease in confidence about the sustainability of the industry.
At an individual company level as at 30 June 2015, there were 21 (2014: 13) companies with net book values exceeding the market capitalisation of the company. Ratios for only two of the entities included in the preceding year’s list improved to such an extent that they were excluded from the current year. The market capitalisation for four entities weakened to the extent that they are now excluded from the list and from this year’s analysis.
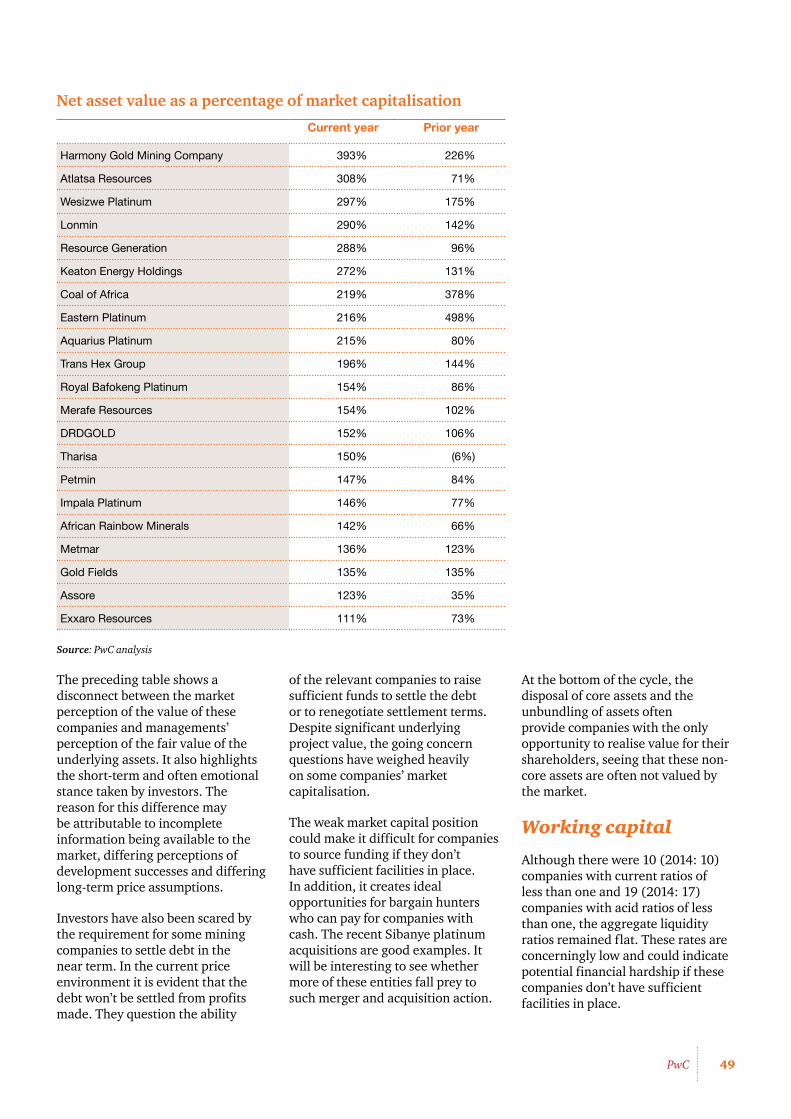
49PwC
Net asset value as a percentage of market capitalisation
Current year Prior year
Harmony Gold Mining Company 393% 226%
Atlatsa Resources 308% 71%
Wesizwe Platinum 297% 175%
Lonmin 290% 142%
Resource Generation 288% 96%
Keaton Energy Holdings 272% 131%
Coal of Africa 219% 378%
Eastern Platinum 216% 498%
Aquarius Platinum 215% 80%
Trans Hex Group 196% 144%
Royal Bafokeng Platinum 154% 86%
Merafe Resources 154% 102%
DRDGOLD 152% 106%
Tharisa 150% (6%)
Petmin 147% 84%
Impala Platinum 146% 77%
African Rainbow Minerals 142% 66%
Metmar 136% 123%
Gold Fields 135% 135%
Assore 123% 35%
Exxaro Resources 111% 73%
Source: PwC analysis
The preceding table shows a disconnect between the market perception of the value of these companies and managements’ perception of the fair value of the underlying assets. It also highlights the short-term and often emotional stance taken by investors. The reason for this difference may be attributable to incomplete information being available to the market, differing perceptions of development successes and differing long-term price assumptions.
Investors have also been scared by the requirement for some mining companies to settle debt in the near term. In the current price environment it is evident that the debt won’t be settled from profits made. They question the ability
of the relevant companies to raise sufficient funds to settle the debt or to renegotiate settlement terms. Despite significant underlying project value, the going concern questions have weighed heavily on some companies’ market capitalisation.
The weak market capital position could make it difficult for companies to source funding if they don’t have sufficient facilities in place. In addition, it creates ideal opportunities for bargain hunters who can pay for companies with cash. The recent Sibanye platinum acquisitions are good examples. It will be interesting to see whether more of these entities fall prey to such merger and acquisition action.
At the bottom of the cycle, the disposal of core assets and the unbundling of assets often provide companies with the only opportunity to realise value for their shareholders, seeing that these non-core assets are often not valued by the market.
Working capital
Although there were 10 (2014: 10) companies with current ratios of less than one and 19 (2014: 17) companies with acid ratios of less than one, the aggregate liquidity ratios remained flat. These rates are concerningly low and could indicate potential financial hardship if these companies don’t have sufficient facilities in place.

50 SA Mine: 7th edition – Highlighting trends in the South African mining industry
What is not taken into account in determining these ratios is what capital commitments mining companies have entered into and what pending borrowing repayments they have beyond the next 12 months. With a large number of companies not generating sufficient operating cash flows in the current low price environment, many will have to implement various strategies to survive.
The number of companies that indicated liquidity risk as a concern in their risk disclosure has increased notably in the current year.
Financing for sustainability
South African mining companies and banks have traditionally been conservative when it comes to funding mining projects. While the gearing ratio increased to 17% (2014: 14%) in the current year, this is still much lower than the global average of 43%.
Of the 37 companies aggregated, 23 (2014: 21) were in a net borrowing position. Of the top ten companies, 90% (2014: 90%) were in a net borrowing position, as opposed to 54% (2014: 46%) of the remainder of the 37 companies reviewed. The disparity in this ratio may indicate that financial institutions prefer to provide finance based on strong balance sheets rather than the project-specific finance required by mid-tier and junior miners.
A large number of funding facilities which were negotiated in the aftermath of the financial crisis while interest rates were low are up for renewal in the next couple of years. The table below sets out the borrowing payment profile. In
the current environment it is unlikely that companies will be able to settle all this debt from profits realised. Capital commitments, due to their long term nature are still a significant, but necessary, drain on cash resources. In aggregate there is not enough cash and other financial assets to settle this debt or to fund the capital commitments. Funding is therefore required.
The following table indicates the borrowings repayment profile based on liquidity risk disclosures in the financials
Less than 12 months
1-2 years 2-5 years More than 5 years
Interest bearing borrowings
22 144 29 339 31 043 27 217
Source: PwC analysis
The illustrated short term borrowing position is not uncommon for the industry. The trend is often for borrowings to be refinanced despite their short term nature. However, the renegotiation of facilities is likely to result in higher interest rates and borrowing costs. We’ve calculated indicative weighted average cost of capital for the JSE Mining and JSE Platinum entities.
The following graph provides a high level cost of capital calculation based on the JSE Mining and JSE Platinum indexes. After the post financial crises high cost of capital, rates decreased. However, there is a clear increase since commodity prices started struggling after 2012.
Figure 29: Indicative cost of capital
Source: PwC analysis
13.0%2010 2011 2012 2013 2014 2015
13.5%
14.0%
14.5%
15.0%
15.5%
16.0%
16.5%
JSE platinumJSE mining
51PwC
Streamlined financial statements: Paving the way to clearer financial reporting
It is generally accepted that financial reports are too complex and difficult to read. This results in companies struggling to tell the story of their performance to the market and in relevant information getting lost in the noise. This is largely due to the following factors:
• Many current accounting standards take a checklist approach, with these lists detailing disclosures rather than relying on broad disclosure objectives.
• A risk-averse mindset leads to preparers and regulators taking a ‘belt and braces’ approach to disclosure, focusing on the completeness of disclosures rather than on materiality and relevance.
• Boilerplate disclosures contain a large portion of standing data that obscures relevant information.
The result is that financial reports are now more about compliance than about relevant communication.
What do regulators think about reporting?In December 2014, the International Accounting Standards Board (IASB) issued an amendment to IAS 1 Presentation of Financial Statements as part of its initiative to improve the presentation of and disclosure in financial reports. The IASB hopes to encourage companies to apply professional judgement in determining what information to disclose in their financial statements.
The JSE, reporting back on the proactive monitoring of financial statements issued in February 2015, was concerned that ‘a poor approach to disclosure may obscure the understanding of important matters and to an extent diminish fair presentation of the financial statements’.
Moving from compliance to communicationIn a competitive market for capital, communication matters. Research shows that companies that communicate their strategy and performance credibly and effectively find it easier to access capital. Financial reports therefore should assist management in communicating effectively with the market.
If we look at the notes to the financial statements, most companies retain a more traditional approach. However, there is an increasing level of innovation by some, which raises an important question: do investment professionals find alternative formats more useful? And if so, how might companies adapt their financial statements and notes to turn them into the best communication tools they can be? We asked 85 investment professionals around the world for their views on what they find useful, and where companies might improve. What came back was interesting: 80% of investors said that the quality of reporting impacts investors’ perception of the quality of management.
How could you improve your reporting?As an overall theme to the feedback, users of financial statements want to be able to find information easily and see clear links between related content.
More specifically, these key action points for companies emerged from our research:
• Understand your stakeholders (e.g. regulators, unions, investors and senior management) and what they want to see in your financial statements.
• Create a clear link between your financial performance and your business model, strategy and risk disclosures.
• Combine accounting policies with the applicable note to provide a clearer picture of your company’s performance.
• Be clear about what has changed in your accounting policies, important judgements that were made and choices you have taken.
• Set your accounting policies in the context of your business, and explain how the policy links to the specific details of your business model.
• Create a structure to the order of the notes that speaks to your company’s key performance indicators, risks and achievements.
Companies should think about how they can better portray their business strategy and performance.

52 SA Mine: 7th edition – Highlighting trends in the South African mining industry
Glossary8
53PwC
acid ratio (current assets less inventory)/current liabilities
adjusted EBITDA EBITDA adjusted for impairment charges
adjusted EBITDA margin adjusted EBITDA/revenue
BEE black economic empowerment
CPI consumer price index, published by Statistics South Africa
current ratio current assets/current liabilities
DMR Department of Mineral Resources
DTC Davis Tax Committee
DWS Department of Water and Sanitation
EBITDA earnings before interest, tax, depreciation and amortisation
EBITDA margin EBITDA/revenue
EITI Extractive Industries Transparency Initiative
ETF exchange-traded fund
FDI foreign direct investment
gearing percentage net borrowings/(net borrowings plus equity)
HDSA historically disadvantaged South Africans
ICMM International Council on Mining and Metals
IMF International Monetary Fund
JSE Johannesburg Stock Exchange
LTIFR lost time injury frequency rate
market capitalisation The market value of the company calculated as the number of shares outstanding, multiplied by the share price
MPRDA Mineral and Petroleum Resources Development Act
NERSA National Energy Regulator of South Africa
net borrowings interest-bearing debt, less cash
NWA National Water Act
NWRS 2 National Water Resources Strategy 2
PBIT profit before interest and tax
PGMs platinum group minerals
PPI producer price index
SLP social and labour plan

54 SA Mine: 7th edition – Highlighting trends in the South African mining industry
Companies included in the analysis9
55PwC
Year end
African Rainbow Minerals Limited June 2015
Anglo American Platinum Limited December 2014
AngloGold Ashanti Limited December 2014
Aquarius Platinum Limited June 2015
Assore Limited June 2015
Atlatsa Resources Limited December 2014
Central Rand Gold Limited December 2014
Coal of Africa Limited June 2015
Diamondcorp plc December 2014
DRDGOLD Limited June 2015
Eastern Platinum Limited December 2014
Exxaro Resources Limited December 2014
Firestone Energy Limited June 2015
Gold Fields Limited December 2014
Goliath Gold Mining Limited December 2014
Harmony Gold Mining Company Limited June 2015
Impala Platinum Holdings Limited June 2015
Infrasors Holdings Limited February 2015
Keaton Energy Holdings Limited March 2015
Kibo Mining plc December 2014
Kumba Iron Ore Limited December 2014
Lonmin plc September 2014
Merafe Resources Limited December 2014
Metmar Limited February 2015
Northam Platinum Limited June 2015
Oakbay Resource & Energy Limited February 2015
Pan African Resources Limited June 2015
Petmin Limited June 2015
Resource Generation Limited June 2015
Royal Bafokeng Platinum Limited December 2014
Sibanye Gold Limited December 2014
Tharisa plc September 2014
Trans Hex Group Limited March 2015
Wescoal Holdings Limited March 2015
Wesizwe Platinum Limited December 2014

56 SA Mine: 7th edition – Highlighting trends in the South African mining industry
Basis for compiling this report
10
57PwC
We aggregated the financial results of mining companies with a primary listing on the Johannesburg Stock Exchange (JSE) and mining companies whose main operations are in Africa and that have a secondary listing on the JSE, for the financial year ends to June 2015. We used a cut-off market capitalisation of R200 million and excluded all companies with suspended listings.
Our selection criteria excluded global mining companies Anglo American, BHP Billiton, South32 and Glencore Xstrata. Although these companies have a significant South African footprint, their global exposure and size mean that they do not necessarily reflect trends in the South African mining environment. While a large number of the entities included also have international exposure, the bulk of their operations are in Africa.
The results aggregated in this report have been sourced from information that is publicly available and consists primarily of annual reports or reviewed results made available to shareholders. Companies have different year ends and report under different accounting regimes.
Information has been aggregated for the financial years of individual companies and no adjustments have been made to take into account different reporting requirements and year ends. As such, the financial information shown for 2015 covers reporting periods from 1 October 2013 to 30 June 2015, with each company’s results included for the 12-month financial reporting period that falls into this time frame.
Information for the previous year comprises information for the 35 companies selected in the current year, except where indicated otherwise.
All currency figures in this publication are reported in South African rand, except where specifically stated otherwise. The results of companies that report in currencies other than the rand have been translated at the average rand exchange rate for the financial year, with balance-sheet items translated at the closing rand exchange rate.
Some diversified companies undertake part of their activities outside the mining industry. No attempt has been made to exclude such non-mining activities from the aggregated financial information.
Contributors
• Nthato Makhetha
• Ashleigh Harrison
• Ashleigh Scott
• Ferdi Linde
• Juan Coetzee
• Julie Pousson
• Karine Roux
• Laetitia Le Roux
• Michelle Botas
• Pieter Theron
• Rene Richter
• Scott Williams

58 SA Mine: 7th edition – Highlighting trends in the South African mining industry
About PwC11
59PwC
Our global footprint as a firm means we have the right people to support you everywhere
Over 1 500 mining professionals across the globe located in all significant mining territories
Professionals in 157 countries, working collaboratively
More than 195 000 people who are committed to delivering quality in assurance, tax and advisory services
Our promise to you: ‘Our relationship with
you creates the value that you are looking for’.
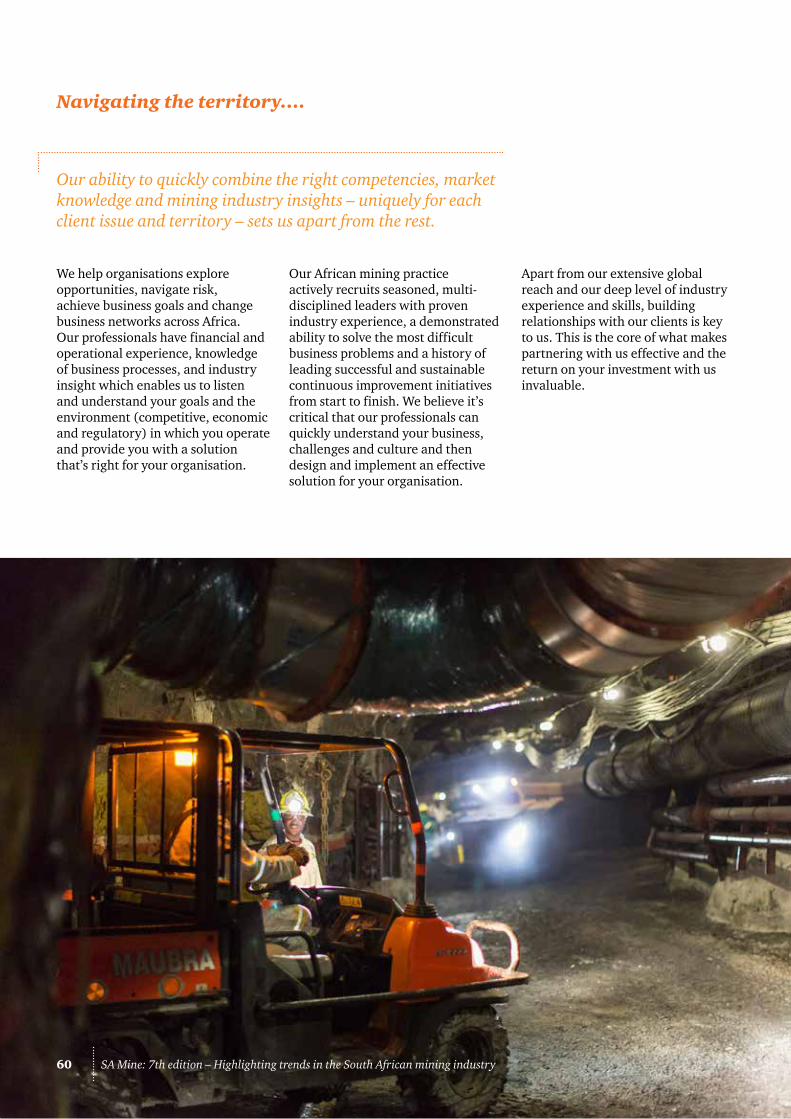
60 SA Mine: 7th edition – Highlighting trends in the South African mining industry
Navigating the territory….
Our ability to quickly combine the right competencies, market knowledge and mining industry insights – uniquely for each client issue and territory – sets us apart from the rest.
We help organisations explore opportunities, navigate risk, achieve business goals and change business networks across Africa. Our professionals have financial and operational experience, knowledge of business processes, and industry insight which enables us to listen and understand your goals and the environment (competitive, economic and regulatory) in which you operate and provide you with a solution that’s right for your organisation.
Our African mining practice actively recruits seasoned, multi-disciplined leaders with proven industry experience, a demonstrated ability to solve the most difficult business problems and a history of leading successful and sustainable continuous improvement initiatives from start to finish. We believe it’s critical that our professionals can quickly understand your business, challenges and culture and then design and implement an effective solution for your organisation.
Apart from our extensive global reach and our deep level of industry experience and skills, building relationships with our clients is key to us. This is the core of what makes partnering with us effective and the return on your investment with us invaluable.
60 SA Mine: 7th edition – Highlighting trends in the South African mining industry

61PwC
Africa is a vital part of our agenda…..
Our African mining practice focuses on delivering professional services to companies of all sizes across the region. We operate in 34 countries in Africa as a whole, with over 9 000 staff and more than 400 partners. This means that we’re able to provide our clients with seamless and consistent service, wherever they do business on the continent. Our in-depth knowledge and understanding of African operating environments enables us to offer tailored tax, assurance and advisory solutions for every business challenge.
Mining Centre of Excellence
Globally, our PwC mining network has benefited from a more co-ordinated market approach through our Mining Centres of Excellence (MCOEs).
Our Africa MCoE services the South, East and West Regions in Africa, and assists with requirements and requests of companies operating within the mining industry. Our strategies are developed and matured to ensure that we support all companies on the continent, which is made possible through concerted co-ordination between the centres in all three regions.
Our primary mandate is to ensure that we develop strategies aimed at establishing an integrated approach, so that we deliver a seamless service to mining clients to enhance the returns on their operations – thus delivering the real value you’re looking for.
An extensive African Footprint
Our offices…
Algeria
Tunisia
Egypt
Sudan
SouthSudan
Mauritania NigerChad Eritrea
EthiopiaCentral
African Republic
KenyaUga
nda
DemocraticRepublicof Congo
Camero
onNigeria
Benin
Togo
Gha
naCôted’Ivoire
Burkina
Faso
LiberiaSierra Leone
Guinea
SenegalGambia
Guinea Bissau
GabonCo
ngo
AngolaZambia
Malaw
i
Mozam
bique
Zimbabwe
NamibiaBotswana
SouthAfrica
Lesotho
Swaziland
Madag
asca
r
Mauritius
Comoros
Seychelles
Mayotte
Cape Verde
Morocco
Mali
Somalia
Djibouti
RwandaBurundi
Tanzania
Libya
For services in these territories please contact a neighbouring territory
Reunion
Equatorial Guinea
São Tomé and Príncipe
PwC offices

62 SA Mine: 7th edition – Highlighting trends in the South African mining industry
Contacts
With mining experts working in each key mining area across South Africa, our teams are helping clients deliver on specific projects and organisational growth aspirations. We offer advisory, tax and audit services to global corporations and locally-listed companies.
We complement this with:
• A suite of niche mining consulting capabilities focused on optimising value across mining operations and effectively managing risk; and
• A comprehensive client feedback programme to ensure we are consistently delivering on individual client needs.
For any mining related queries, services or assistance required, please contact our Mining Centre of Excellence at [email protected].
Jock O’CallaghanGlobal Mining LeaderMelbourne, AustraliaT: +61 (3) 8603 6137E: [email protected]
Michal KotzeAfrica Mining LeaderJohannesburg, South Africa T: +27 11 797 4603E: [email protected]
Stuart AbsolomDenver, U.S.AT: +1 (720) 931 7246E: [email protected]
Jim MoragaLatin America+51 (1) 211-6500 x 2080 [email protected]
Ronaldo ValinoRio de Janiero, BrazilT: + 55 21 3232 6139E: [email protected]
Alfredo RemyPeruLima +51 1 211 [email protected]
Evgeny OrlovskiyCentral and Eastern EuropeMoscow +7 495 223 51 76 [email protected]
Jason BurkittLondon, UKT: +44 (20) 7213 2515E: [email protected]
Ken SuBeijing, ChinaT: +86 (10) 6533 7290E: [email protected]
Kameswara RaoHyderabad, IndiaT: +91 40 6624 6688E: [email protected]
Sacha WinzenriedJakarta, IndonesiaT: +62 21 5289 0968E: [email protected]

Notes

64 SA Mine: 7th edition – Highlighting trends in the South African mining industry
....................................................................................................................................................................................
....................................................................................................................................................................................
....................................................................................................................................................................................
....................................................................................................................................................................................
....................................................................................................................................................................................
....................................................................................................................................................................................
....................................................................................................................................................................................
....................................................................................................................................................................................
....................................................................................................................................................................................
....................................................................................................................................................................................
....................................................................................................................................................................................
....................................................................................................................................................................................
....................................................................................................................................................................................
....................................................................................................................................................................................
....................................................................................................................................................................................
....................................................................................................................................................................................
....................................................................................................................................................................................
....................................................................................................................................................................................
....................................................................................................................................................................................
....................................................................................................................................................................................
....................................................................................................................................................................................
....................................................................................................................................................................................
....................................................................................................................................................................................
....................................................................................................................................................................................


©2015 PricewaterhouseCoopers (“PwC”), the South African firm. All rights reserved. In this document, “PwC” refers to PricewaterhouseCoopers in South Africa, which is a member firm of PricewaterhouseCoopers International Limited (PwCIL), each member firm of which is a separate legal entity and does not act as an agent of PwCIL. (15-17750)