s64 Water and Sewerage Contributions Policy
72
WATER AND SEWERAGE CONTRIBUTION POLICY Prepared for Dubbo City Council in November 2002 By Hunter Water Australia PO Box 5007, NEWCASTLE WEST NSW 2302, AUSTRALIA Telephone (02) 4979 9562 Facsimile (02) 4979 95654 HUNTER WATER AUSTRALIA ACN 080 869 905 Revision Report Status Prepared by Reviewed by Approved by (Signature) Issue Date B DRAFT NM GG 18 Dec 2001 C DRAFT NM GG 13 Mar 2002 D DRAFT NM GG 25 Mar 2002 E DRAFT NM GG 25 June 2002 F DRAFT NM GG 16 July 2002 G FINAL DRAFT NM GG 5 Sep 2002
Transcript of s64 Water and Sewerage Contributions Policy
WATER AND SEWERAGE CONTRIBUTION POLICY
Prepared for Dubbo City Council in November 2002
By Hunter Water Australia PO Box 5007, NEWCASTLE WEST NSW 2302, AUSTRALIA
Telephone (02) 4979 9562 Facsimile (02) 4979 95654
HUNTER WATER AUSTRALIA ACN 080 869 905
Revision Report Status Prepared by Reviewed by Approved by (Signature)
Issue Date
B DRAFT NM GG 18 Dec 2001 C DRAFT NM GG 13 Mar 2002 D DRAFT NM GG 25 Mar 2002 E DRAFT NM GG 25 June 2002 F DRAFT NM GG 16 July 2002 G FINAL DRAFT NM GG 5 Sep 2002

This page has been left blank
HUNTER WATER AUSTRALIA s64 Water and Sewerage Contributions Policy
R1451 July 2002 i
EXECUTIVE SUMMARY This Draft Water and Sewerage Contributions Policy (WSCP) details a review on behalf of Council by Hunter Water Australia (HWA) of Dubbo City Council’s (DCC) Combined Water and Sewerage Contributions Policy, adopted February 1998. This draft forms part of the rolling review of planning instruments and policies administered by Council’s Environmental Services Division. The Contributions Policy enables Dubbo City Council to levy contributions where the anticipated development will or is likely to increase the demand for water and/or sewerage services. Projected population and development growth will place additional demands and loadings on the Council’s water supply and sewerage systems respectively. Generally, additional capacity is required in the water supply and sewerage systems to accommodate increased demands and loadings. This normally requires system components, such as pumping stations and pipelines, to be upgraded. On occasions it is necessary to construct additional system components to service the growth. Under this Policy a developer contribution is determined by analysing the cost of existing infrastructure, existing demand, anticipated growth and the cost of works required to meet the demands created by growth. The total cost of these works is divided between demand units to determine the capital cost per unit, or unit contribution. The Policy contains relevant information used to calculate the unit contribution (developer contribution per Equivalent Tenement) for new development in the relevant water and/or sewerage catchment. The draft document incorporating the revised Development Contribution Policy will be placed on public exhibition for a 30-day period. This will provide an opportunity for examination by interested parties and for such parties to make submissions to Council on the draft Policy. Council will consider any submissions made and if considered relevant the draft WSCP will be amended. Following adoption by Council, the WSCP will then be forwarded to DLWC for registration. Any amendments to the document will follow the same process. The Policy applies to all land within the urban areas of the City of Dubbo, which are serviced or are proposed to be serviced by reticulated water supply and sewerage services, including villages such as Wongarbon and Ballimore and the Industrial Candidate Areas. This Policy applies to all developments and land uses within the areas defined and which utilise or propose to utilise reticulated water supply and/or sewerage infrastructure. The areas covered by this Policy are shown on Plan 1 for water supply and Plan 2 for sewerage. For the purposes of this Policy, Dubbo City Council has resolved to amalgamate service areas into single catchments for both water supply and sewerage. All water supply is distributed from the clear water pumps at the John Gilbert Water Treatment Plant (WTP) and hence can be considered a single water supply distribution system. Following the proposed decommissioning of the Bunglegumbie Sewerage Treatment Plant (STP), all sewage flows are now treated at the Troy Junction STP and hence can be considered a single sewerage catchment. Although Wongarbon will eventually have a ‘stand alone’ treatment plant instead of pumping sewage back to the Troy Treatment Plant, it is proposed to have a City-wide sewerage charging system.

HUNTER WATER AUSTRALIA s64 Water and Sewerage Contributions Policy
R1451 July 2002 ii
As Dubbo City Council also services a number of villages located outside the main urban area of Dubbo, allowance has been made in the growth projections for the servicing of these villages with water supply and sewerage facilities. The developer charge is the cost per unit of capacity within the relevant water and/or sewer infrastructure system. The measure for the standard unit of capacity is the capacity requirement relative to a single residential dwelling ie one residential dwelling equals one Equivalent Tenement (ET). The developer contribution payable for the respective water and/or sewer system is thus:
Assessed Demand or Loading (ET) x Developer Contribution ($/ET) The Developer Contribution is determined by analysing the cost of capital works, existing demand, anticipated growth and the cost of works required to meet the demand created by growth. The total cost of existing and proposed augmentation works required to service development is divided between demand units to determine the capital cost per unit. Any surplus income Council generates from development (ie operational income minus operational, maintenance and administration costs) is deducted from the capital cost to obtain the Developer Contribution. In order to account for the time value of money, all calculations are undertaken using Net Present Value (NPV). NPV is a standard commercial procedure for calculating the expected net monetary gain or loss from a project by discounting all expected future cash inflows and outflows to the present time, using the required return on investment. The Developer Contribution is therefore calculated as: • The Present Value (PV) of the cost over time of capital works required to service
development (referred to as the ‘capital contribution’)
less • The Present Value of expected net income (revenue less expenses) over time from
servicing development (referred to as the ‘reduction amount’). The developer contributions have been calculated with a proposed capital works cut-off year of 2021 and real discount rates of 3%, 7% and 7% for pre 1996 assets, post 1996 assets and the reduction amount respectively. The developer contributions for the Dubbo water supply and sewerage systems are shown in Table 1. The total applicable contribution is calculated as the capital contribution minus the reduction amount. Table 1 Calculated Developer Contributions for Water Supply and Sewerage Systems Water Supply
($/ET) Sewerage
($/ET) Capital Contribution $4,774 $5,891 Reduction Amount $1,404 $1,846
Total Applicable $3,370 $4,045
HUNTER WATER AUSTRALIA s64 Water and Sewerage Contributions Policy
R1451 July 2002 iii
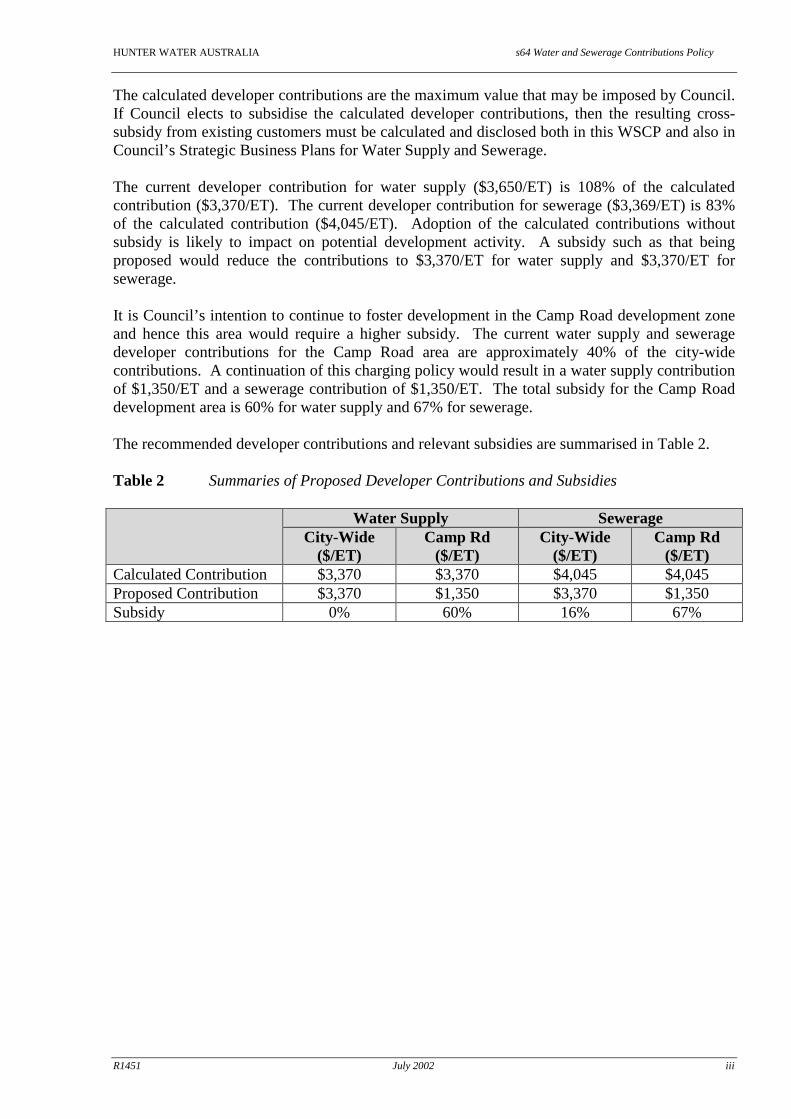
The calculated developer contributions are the maximum value that may be imposed by Council. If Council elects to subsidise the calculated developer contributions, then the resulting cross-subsidy from existing customers must be calculated and disclosed both in this WSCP and also in Council’s Strategic Business Plans for Water Supply and Sewerage. The current developer contribution for water supply ($3,650/ET) is 108% of the calculated contribution ($3,370/ET). The current developer contribution for sewerage ($3,369/ET) is 83% of the calculated contribution ($4,045/ET). Adoption of the calculated contributions without subsidy is likely to impact on potential development activity. A subsidy such as that being proposed would reduce the contributions to $3,370/ET for water supply and $3,370/ET for sewerage. It is Council’s intention to continue to foster development in the Camp Road development zone and hence this area would require a higher subsidy. The current water supply and sewerage developer contributions for the Camp Road area are approximately 40% of the city-wide contributions. A continuation of this charging policy would result in a water supply contribution of $1,350/ET and a sewerage contribution of $1,350/ET. The total subsidy for the Camp Road development area is 60% for water supply and 67% for sewerage. The recommended developer contributions and relevant subsidies are summarised in Table 2. Table 2 Summaries of Proposed Developer Contributions and Subsidies Water Supply Sewerage
City-Wide ($/ET)
Camp Rd ($/ET)
City-Wide ($/ET)
Camp Rd ($/ET)
Calculated Contribution $3,370 $3,370 $4,045 $4,045 Proposed Contribution $3,370 $1,350 $3,370 $1,350 Subsidy 0% 60% 16% 67%

HUNTER WATER AUSTRALIA s64 Water and Sewerage Contributions Policy
R1451 July 2002 iv
This page has been left blank

HUNTER WATER AUSTRALIA s64 Water and Sewerage Contributions Policy
R1451 July 2002 v
Table of Contents
1. INTRODUCTION ................................................................................................................ 1
2. BACKGROUND .................................................................................................................. 2
2.1 General .......................................................................................................................... 2 2.2 Previous developer contributions ................................................................................. 3
3. ADMINISTRATION ........................................................................................................... 4
3.1 Reference ...................................................................................................................... 4 3.2 What is the purpose of this Policy? .............................................................................. 4 3.3 Where does this Policy apply? ...................................................................................... 4
3.3.1 Urban areas .......................................................................................................... 4 3.3.2 Villages ............................................................................................................... 5 3.3.3 Rural areas ........................................................................................................... 5
3.4 When are developer contributions applicable? ............................................................. 6
3.5 How is the developer contribution applied? ................................................................. 6 3.5.1 Development not categorised by PWD Guidelines ............................................. 9
3.6 When are contributions payable?................................................................................ 10 3.6.1 Deferred or periodic payments .......................................................................... 11
3.7 Monitoring and review/update of developer contributions ........................................ 11
4. SYSTEMS BACKGROUND AND TIMING OF FUTURE WORKS .......................... 12
4.1 Water supply source, treatment and distribution system ............................................ 12
4.2 Sewage transportation and treatment system .............................................................. 13
5. METHODOLOGY ............................................................................................................. 14
5.1 General ........................................................................................................................ 14 5.2 Net Present Value process .......................................................................................... 14 5.3 Determination of demands/loadings ........................................................................... 14
5.3.1 General .............................................................................................................. 14 5.3.2 Future demands/loadings .................................................................................. 15 5.3.3 Historical demands/loadings ............................................................................. 15
5.4 Discount rates ............................................................................................................. 17 5.5 Assets .......................................................................................................................... 17
5.5.1 Definition of assets ............................................................................................ 17 5.5.2 Inclusion of pre-1996 capital works .................................................................. 17
5.5.3 Inclusion of post-1996 capital works ................................................................ 17
5.6 Pro-Rata of asset costs ................................................................................................ 18 5.6.1 Pre-1996 assets .................................................................................................. 18 5.6.2 Post-1996 assets ................................................................................................ 18
5.7 Calculation of capital contribution ............................................................................. 18 5.8 Reduction amount ....................................................................................................... 18
6. Developer contributions .................................................................................................... 19
6.1 Calculated contributions ............................................................................................. 19 6.2 Sensitivity analysis ..................................................................................................... 20 6.3 Comparison with current developer contributions ..................................................... 20

HUNTER WATER AUSTRALIA s64 Water and Sewerage Contributions Policy
R1451 July 2002 vi
7. RECOMMENDATIONS ................................................................................................... 22
8. REFERENCES ................................................................................................................... 23
9. GLOSSARY OF TERMS .................................................................................................. 24
TABLES Table 2.1 Current Developer Contributions ($ per unit of capacity) ............................................ 3
Table 3.1 ETs for Various Development Types ........................................................................... 7 Table 3.2 Calculation of Water Supply ETs ................................................................................. 8 Table 3.3 Domestic Household Daily Water Allowances ............................................................ 8
Table 3.4 Payment of Contributions ........................................................................................... 10 Table 5.1 Projected Demands on Water Supply System ............................................................ 15
Table 5.2 Projected Loadings on Sewerage System ................................................................... 15
Table 5.3 Historical Demands on Water Supply System............................................................ 16
Table 5.4 Historical Loadings on Sewerage Supply System ...................................................... 16
Table 6.1 Calculated Developer Contributions for Water Supply and Sewerage Systems ........ 19
Table 6.2 Summary of Proposed Developer Contributions and Subsidies ................................. 20
Table 6.3 Sensitivity of Developer Contributions to Lower Growth ......................................... 20
Table 6.4 Previous Calculated Developer Contributions............................................................ 20
Table 6.5 Current Developer Contributions ............................................................................... 21 Table 7.1 Recommended Developer Contributions .................................................................... 22
FIGURES Figure 5.1 Historical ETs for the Water Supply and Sewerage Systems ..................................... 16
PLANS Plan 1 Dubbo Water Supply System...................................................................................... 28 Plan 2 Dubbo Sewerage System ............................................................................................ 29 Plan 3 Ballimore Water Supply ............................................................................................. 30 Plan 4 Brocklehurst Water Supply......................................................................................... 31 Plan 5 Brocklehurst Sewerage ............................................................................................... 32 Plan 6 Eumungerie Water Supply .......................................................................................... 33 Plan 7 Wongarbon Sewerage ................................................................................................. 34 Plan 8 Wongarbon Water Supply .......................................................................................... 35 APPENDICES Appendix A Plans .......................................................................................................................... 27 Appendix B Population Projections - Dubbo City Council ........................................................... 36
Appendix C Developer Contribution Model (Water Supply System) ........................................... 36
Appendix D Developer Contribution Model (Sewerage System) ................................................. 36 Appendix E ET Equivalence of Sewerage Customers .................................................................. 36
HUNTER WATER AUSTRALIA s64 Water and Sewerage Contributions Policy
R1451 July 2002 1
1. INTRODUCTION This Draft Water and Sewerage Contributions Policy (WSCP) details a review undertaken on behalf of Council by Hunter Water Australia (HWA) of Dubbo City Council’s (Council) Combined Water and Sewerage Contributions Policy, adopted February 1998. This draft is part of the rolling review of planning instruments and policies administered by Council’s Environmental Services Division. The Contributions Policy enables Council to levy contributions where the anticipated development will or is likely to increase the demand for water and/or sewerage services. Projected population and development growth will place additional demands and loadings on the Council’s water supply and sewerage systems respectively. Generally, additional capacity is required in the water supply and sewerage systems to accommodate the increased demands and loadings as a consequence of new development. This normally requires system components, such as pumping stations and pipelines, to be upgraded. On occasions it is necessary to construct additional system components to service the growth. The main purpose of this Policy is to: • Identify the likely demand for capacity in water and sewer infrastructure as a result of
new development and to provide for that capacity, and • To identify the extension or augmentation of water supply and sewerage services that
has been provided in anticipation of development through developer contributions. Dubbo City Council maintains an asset register that includes details and timing of existing infrastructure. In addition, Council has prepared a schedule of capital works based on current projections of growth. In this WSCP a developer contribution is determined by analysing the cost of existing infrastructure, existing demand, anticipated growth and the cost of works required to meet the demands created by growth. The total cost of these works is divided between demand units to determine the capital cost per unit, or unit contribution. This Policy contains relevant information used to calculate the unit contribution (developer contribution per Equivalent Tenement) for new development in the relevant WSCP catchment.

HUNTER WATER AUSTRALIA s64 Water and Sewerage Contributions Policy
R1451 July 2002 2
2. BACKGROUND
2.1 General The development or redevelopment of land for residential, commercial or industrial purposes creates a need for additional capacity in water supply and sewerage systems. Water and sewerage providers recover the cost of providing this additional capacity predominantly through developer contributions. Council initiated its current s64 Developer Contributions Policy in 1996 and adopted a combined s64 Contribution Policy for Water Supply and Sewerage in February 1998 [Ref 1]. This s64 Policy relates to section 64 of the Local Government Act - 1993. This section of the Act details the provisions relating to the construction of works for developments. It states that the provisions of operation for water authorities, detailed in Division 5 of Part 2 of Chapter 6 of the Water Management Act 2000, apply to councils exercising functions in the same way. Developers are required to pay a contribution, to the water supply authority, towards the cost of existing and projected water management works. The water supply authorities are also authorised, when calculating a developer contribution, to take into consideration the value of the existing water management works and the estimated cost of projected water management works. Prior to the implementation of Development Contribution Polices for water supply and sewerage in local government areas of country NSW they are to be registered with the Department of Land and Water Conservation (DLWC). DLWC issued draft guidelines for the calculation of water supply and sewerage contributions in March 2000 [Ref 2]. These guidelines were based on a determination issued by the Independent Pricing and Regulatory Tribunal (IPaRT) in September 2000 [Ref 3]. IPaRT is an independent authority that regulates the pricing of declared government monopoly services. The Tribunal regulates urban water services under the Independent Pricing and Regulatory Tribunal Act 1992. Enquiries are undertaken under Section 11 of the Act for the following government agencies, which are Standing References under Schedule 1 of the Act: • Sydney Water Corporation • Hunter Water Corporation • Gosford City Council • Wyong Shire Council This draft document incorporating the revised Development Contribution Policy will be placed on public exhibition for a 30-day period. This is to provide an opportunity for examination by interested parties and for such parties to make submission to Council on the draft Policy. Council will consider any submissions made and where necessary include relevant amendments to the Policy. The Policy will then be forwarded to DLWC for registration. Subsequent amendments to the document will be required to follow the same process.

HUNTER WATER AUSTRALIA s64 Water and Sewerage Contributions Policy
R1451 July 2002 3
2.2 Previous developer contributions The current developer contributions adopted by Dubbo City Council in the 2002/2003 Budget are shown in Table 2.1. These developer contributions were based on water supply and sewerage contribution rates prepared by Scott Carver Pty Ltd in conjunction with Jon Hall and Associates [Ref 1], and have been indexed annually in line with CPI variations. The original contribution rates prepared by Scott Carver represented the upper limit of what could be justified in accordance with the IPaRT Guidelines that were relevant at that time. Council applied reduced contribution amounts in order to comply with Council’s broader infrastructure and development planning objectives. The contribution rates were calculated on the basis of a single, City-wide catchment. Council adopted lower contributions for the Camp Road area in order to promote development within this zone. Table 2.1 Current Developer Contributions ($ per unit of capacity)
Sewer Supply Contribution Water Supply Contribution City Precinct Camp Rd Precinct City Precinct Camp Rd Precinct
$3,369 $1,350 $3,650 $1,350

HUNTER WATER AUSTRALIA s64 Water and Sewerage Contributions Policy
R1451 July 2002 4
3. ADMINISTRATION
3.1 Reference This Policy is called the Dubbo Water and Sewerage Contribution Policy (WSCP). This Policy repeals the Combined Water and Sewerage Contributions Policy adopted by Council in February 1998.
3.2 What is the purpose of this Policy? The primary purpose of this Policy is to enable the Council to require contributions towards the provision, extension or augmentation of water and sewerage services that will or are likely to be required as a consequence of development or that have been provided in anticipation of, or to facilitate, such development. As a consequence of the implementation of this Policy: • The cost of servicing future developments with reticulated water and sewerage
infrastructure will be met by new developments through developer contributions and/or annual contributions. Existing ratepayers will not be financially disadvantaged by the application of the Policy.
• The process of collecting developer contribution will be fair, transparent and publicly accountable. The transparency will enable developers to understand and assess the calculated contributions in advance of making business decisions regarding proposed developments.
• The provision of water and sewerage infrastructure will occur in a timely and appropriate manner and in advance of future development.
3.3 Where does this Policy apply?
3.3.1 Urban areas The Policy applies to all land within the urban areas of the City of Dubbo, which are serviced or are proposed to be serviced by reticulated water supply and sewerage services, including villages such as Wongarbon and Ballimore. This Policy applies to all developments and land uses within the areas defined and which utilise or propose to utilise water supply and sewerage infrastructure. The areas covered by this WSCP are shown in Plan 1 for water supply and Plan 2 for sewerage. This Policy does not apply to: • Development in locations outside the areas defined above or identified on Plans 1 or 2; • Rural dwellings (not connected to water and/or sewerage services); • Developments which include an approved sewerage treatment package plant and
method of effluent disposal or alternative water supply service to the satisfaction of Council; or

HUNTER WATER AUSTRALIA s64 Water and Sewerage Contributions Policy
R1451 July 2002 5
• Developments that have a current development consent and which have either paid a contribution under a previous Contributions Policy or for which there is a valid development contributions agreement in place.
For the purposes of this Policy, Dubbo City Council has determined to consolidate service areas into single catchments for both water supply and sewerage. All water supply is distributed from the clear water pumps at the John Gilbert Water Treatment Plant (WTP) and hence can be considered a single water supply distribution system. Following the decommissioning of the Bunglegumbie Sewerage Treatment Plant (STP), all sewage flows are now to be treated at the Troy Junction STP and hence can be considered a single sewerage catchment. Although Wongarbon will eventually have a ‘stand alone’ treatment plant instead of pumping sewage back to Council’s Troy Treatment Plant, it is proposed to have a City-wide sewerage charging system. In the event that an application is received for an activity or use, or in a location for which there is no adopted contribution rate, Council may prepare an appropriate contribution rate. In the event that Council agrees to the provision of water supply and sewerage services to a development outside of the area to which this Policy applies, Council may apply the adopted contribution rate or it may be necessary for Council to prepare a new policy for that development as a stand alone catchment. The cost of preparing such a policy shall be borne by the applicant.
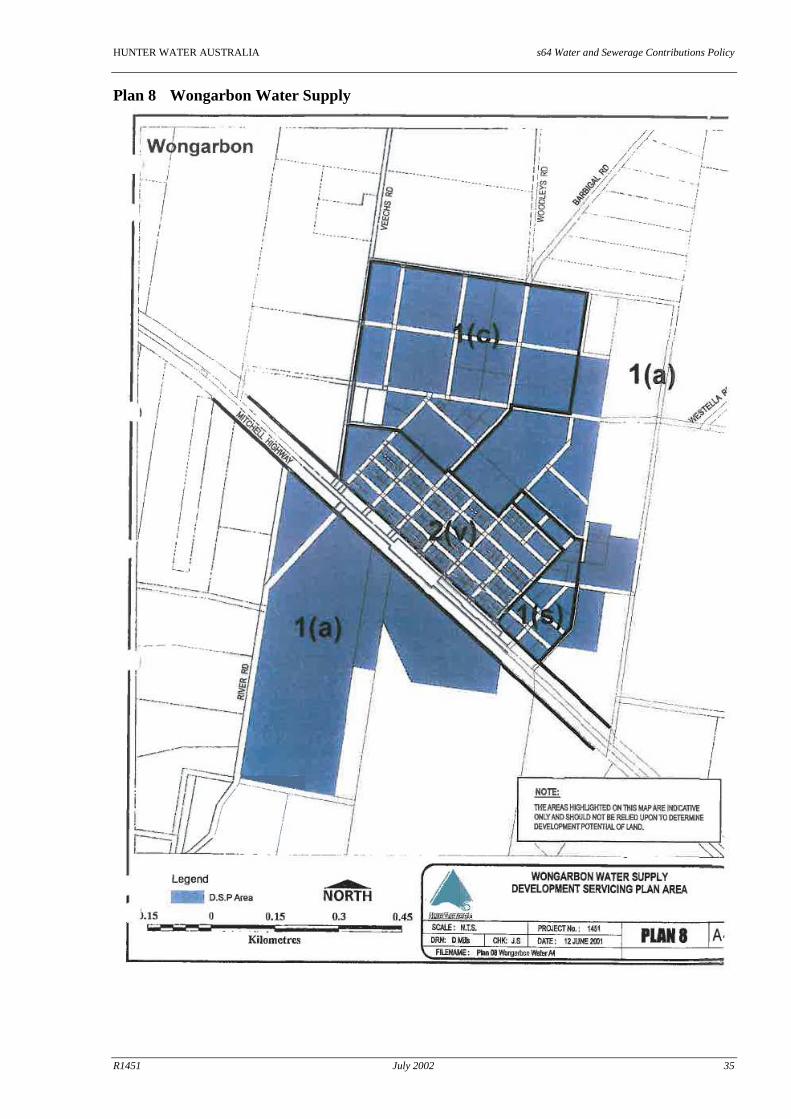
3.3.2 Villages Council also services a number of villages located outside the main urban area of Dubbo. Allowance has been made in the growth projections for the servicing of these villages with water supply and sewerage facilities. Two of these villages, Brocklehurst and Wongarbon, are already serviced with a reticulated water supply, and these are included within the boundary shown on Plan 1. Council is currently extending the water supply system to service the villages of Ballimore and Eumungerie. Once Ballimore and Eumungerie are connected to the water supply system they also will be included in the WSCP catchment area. Council plans to ultimately provide sewerage facilities to these villages, at which time they also would be included. Plans have been prepared for each of the villages showing the areas that are (or will be) included within the WSCP. These plans are as follows:
Plan 3: Ballimore Water Supply Plan 4: Brocklehurst Water Supply Plan 5: Brocklehurst Sewerage Plan 6: Eumungerie Water Supply Plan 7: Wongarbon Sewerage Plan 8: Wongarbon Water Supply
3.3.3 Rural areas Proposed trunk water mains linking Brocklehurst to Eumungerie and Wongarbon to Ballimore will pass through rural areas. Council will not allow connection to either trunk main. Increasing the standard of servicing in rural areas (such as the Dryland Agriculture zone) is not compliant

HUNTER WATER AUSTRALIA s64 Water and Sewerage Contributions Policy
R1451 July 2002 6
with Council’s adopted Rural Areas Strategy and legal planning instrument Dubbo Local Environmental Plan 1997 - Rural Areas. Allowing rural water connections along newly constructed trunk mains may place unreasonable pressure on Council to permit subdivision of farm land for ‘hobby’ farm development, thus increasing the risk of unnecessary and indiscriminate fragmentation of rural land.
3.4 When are developer contributions applicable? When a developer proposes to subdivide land, erect or extend a commercial/industrial building or multiple residential dwelling units, a Development Application is lodged with Council. If the new development is to be connected to Council’s water and/or sewer mains, Council will investigate the impact of the proposed development on its systems. Where additional demand is placed on its systems as a result of the development connecting to the water supply and/or sewerage system, Council will issue a notice stating the required developer contribution.
3.5 How is the developer contribution applied? The developer charge is the cost per unit of capacity within the relevant water and/or sewer infrastructure system. The measure for the standard unit of capacity is the capacity requirement relative to a single residential dwelling ie one residential dwelling equals one Equivalent Tenement (ET). The developer contribution payable for the respective water and/or sewer system is thus:
Assessed Demand or Loading (ET) x Developer Contribution ($/ET) In order to assess the developer contribution applicable to a specific development, it is necessary to assess the demand that the proposed development will place on the relevant water and/or sewer systems. For the case of a development involving the creation of additional residential lots, this is a relatively simple process. The additional demand or loading created by the development is the number of additional lots. The process is illustrated in the following example: Example 1 The developer contribution for a water supply system is determined to be $3,370/ET, and for sewer $3,370/ET. Council receives an application to connect a proposed subdivision which will create an additional 10 residential lots. The developer contribution for water is: 10 ET x $3,370/ET = $33,700.00 The developer contribution for sewer is: 10 ET x $3,370/ET = $33,700.00 Total developer contribution = $67,400.00 The process of assessing the demand or loading of a potential development can be more complex if the development contains non-residential elements. For this case it is necessary to estimate the number of standard residential dwellings required to generate an equivalent demand or loading to the proposed non-residential development.

HUNTER WATER AUSTRALIA s64 Water and Sewerage Contributions Policy
R1451 July 2002 7
In order to assist with the assessment of water and/or sewer demand, the Water Supply Investigation Manual (1986) [Ref 4], the Demand Criteria for Design Purposes for NSW Country Towns (1980) [Ref 5] and the Manual of Practice: Sewer Design (1984) [Ref 6] may be used. These documents were prepared by the Public Works Department and are widely used in the water industry to design water supply and sewerage systems. Table 3.1 identifies the ETs for various types of development for the provision of water supply and for sewerage services. These rates have been adopted by Council for various types of development and are based on industry standard design figures provided by the Department of Public Works and Services. Table 3.1 ETs for Various Development Types
Type of Land Use or Development Sewerage
Services ET Water Supply
ET
Residential
Detached housing 1 1
Green Street housing 0.67 0.67
Semi-detached houses and duplexes 0.67 0.67
Flats, town houses containing more than three units 0.5 0.5
SEPP 5 development 0.5 0.5
Commercial
Per 1,000m2 floorspace or per shop, whichever is the greater
0.125 or 0.04 As per Table
3.2 Plus public toilets per WC or urinal 0.5
Motel per unit 0.250
Industrial
(a) At subdivision stage assessed as one lot 1 1
(b) At development stage As per Appendix E for the specific
use minus 1
As per Table 3.2 for the
specific use minus 1
The approach to be adopted for the calculation of Water Supply ETs is outlined in Table 3.2. This approach is based on the peak daily demand figures contained in the above manuals.
HUNTER WATER AUSTRALIA s64 Water and Sewerage Contributions Policy
R1451 July 2002 8
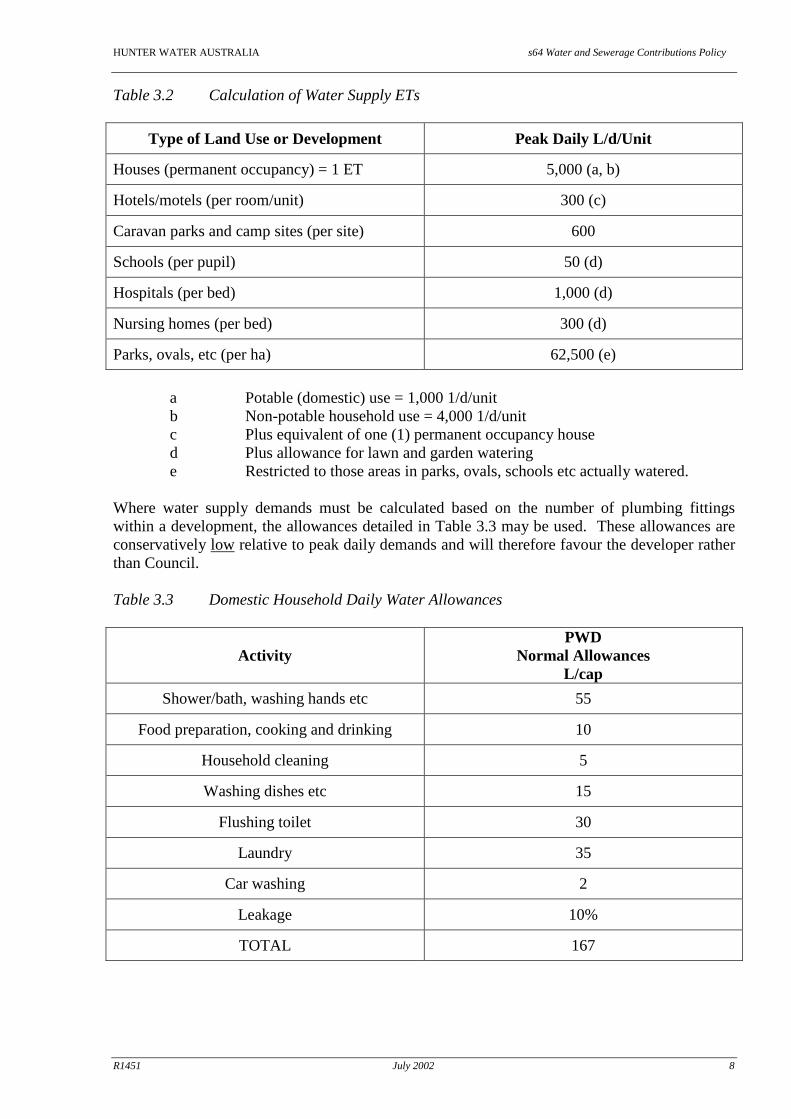
Table 3.2 Calculation of Water Supply ETs
Type of Land Use or Development Peak Daily L/d/Unit
Houses (permanent occupancy) = 1 ET 5,000 (a, b)
Hotels/motels (per room/unit) 300 (c)
Caravan parks and camp sites (per site) 600
Schools (per pupil) 50 (d)
Hospitals (per bed) 1,000 (d)
Nursing homes (per bed) 300 (d)
Parks, ovals, etc (per ha) 62,500 (e)
a Potable (domestic) use = 1,000 1/d/unit b Non-potable household use = 4,000 1/d/unit c Plus equivalent of one (1) permanent occupancy house d Plus allowance for lawn and garden watering e Restricted to those areas in parks, ovals, schools etc actually watered.
Where water supply demands must be calculated based on the number of plumbing fittings within a development, the allowances detailed in Table 3.3 may be used. These allowances are conservatively low relative to peak daily demands and will therefore favour the developer rather than Council. Table 3.3 Domestic Household Daily Water Allowances
Activity PWD
Normal Allowances L/cap
Shower/bath, washing hands etc 55
Food preparation, cooking and drinking 10
Household cleaning 5
Washing dishes etc 15
Flushing toilet 30
Laundry 35
Car washing 2
Leakage 10%
TOTAL 167
HUNTER WATER AUSTRALIA s64 Water and Sewerage Contributions Policy
R1451 July 2002 9
The following approach is to be adopted for the calculation of Sewerage Services ETs. This approach is based on the average dry weather flows per day (ADWF) contained in the Manual of Practice: Sewer Design [Ref 6]. The relevant sections of this manual are attached, refer Appendix E. Household sewage rates are based on:
Average Dry Weather Flow (ADWF) = 0.011 litres/sec/tenement = 960 litres/day/tenement
The process of determining a developer contribution for a non residential development, using these approaches, is illustrated in the following example: Example 2 The developer contribution for a water supply system is determined to be $3,370/ET, and for sewer $3,370/ET. Council receives an application to connect a proposed 100 bed motel to the water and sewer systems. The expected peak daily water demand for the proposed motel is 15 kL plus 5 kL (150 L/day/bed plus the equivalent of one permanent occupancy house). The peak daily water demand for a house (permanent occupancy) is 5 kL. Hence the assessed water demand for the motel is 20/5 = 4 ET. The assessed sewer loading for the motel is 100 beds x 0.125 = 12.5 ET. The developer contribution for water is: 4 ET x $3,370/ET = $13,480.00 The developer contribution for sewer is: 12.5 ET x $3,370/ET = $42,125.00 Total developer contribution = $55,605.00
3.5.1 Development not categorised by PWD Guidelines Council recognises that these PWD documents were not prepared for this purpose and cannot practically be applied to all development applications. Some developments will not ‘fit’ a category in the Guidelines. Additionally, data required to assess the demands/loadings will not always be available at the time of application, such as the expected annual water consumption. For this reason Council accepts that a small proportion of applications will be assessed on individual merit. Council will determine a demand/loading for the development using the best available data. Council’s Director of Technical Services (DTS) retains the discretion to assess an application on its merits and in situations requiring conflict resolution, to determine the appropriate course of action. Alternative sources to assist the determination include: • Plumbing fixtures code; and • Listings of water consumptions of typical developments prepared by other water
authorities.

HUNTER WATER AUSTRALIA s64 Water and Sewerage Contributions Policy
R1451 July 2002 10
In the case of some industrial and commercial development where the developer does not accept the determination of the DTS, the developer will have the option of paying the development contribution in full and having it assessed after a period of 12 months in the light of actual water usage and sewage flows. The developer is fully responsible for arranging and bearing the cost of recording the water and sewage flows, interpreting the results and preparing a submission to Council. If the submission indicated the determination was not correct and the DTS accepts the submission, then the contribution would be adjusted, either by Council refunding part of the contribution or the developer increasing their payment. It is proposed that Council will instigate a forum to mediate in the assessment of the ‘special case’ applications. This forum would receive input from both the Technical Services and Environmental Services Divisions of Council. However, the final decision rests with the Director Technical Services. If a developer disagrees with the assessment the onus would be on the developer to demonstrate that there is an improved assessment. The ET rating assigned to a development can be different for water and sewer. The water ET rating can be considered a function of the amount of water consumed by the development. For sewer however, a number of variables impact on the ET rating. For example the proportion of water consumed that is discharged to sewer can vary considerably depending on the type of development. Also it is acceptable practice when sizing sewer infrastructure to allow for inflow of stormwater. The allowance for storm inflow is a function of the area of the contributing catchment and the type of land use.
3.6 When are contributions payable? The contribution for the various types of consents and approvals and assessed in accordance with this Policy is payable in accordance with the following table. Table 3.4 Payment of Contributions
Type of Application When is Contribution Payable?
In the case of a consent for subdivision: Before the subdivision linen plan(s) (Subdivision Certificate) is released by the Council to the applicant.
In the case of a consent for development not involving subdivision but where a subsequent building Construction Certificate is required:
(a) Where an Occupation Certificate must be obtained for the building - prior to its issue; and
(b) Where an Occupation Certificate is not required - prior to occupation of the building
In the case of a consent for development involving both a subdivision and building works requiring a subsequent building Construction Certificate:
(a) Before the subdivision linen plan(s) (Subdivision Certificate) is released by the Council to the applicant; or
(b) Where an Occupation Certificate must be obtained for the building - prior to its

HUNTER WATER AUSTRALIA s64 Water and Sewerage Contributions Policy
R1451 July 2002 11
issue; or (c) Where an Occupation Certificate is not
required - prior to occupation of the buildings,
Whichever occurs first.
In the case of a consent for any other development:
Prior to occupation/use of the development.
3.6.1 Deferred or periodic payments The Council may accept the deferment of the payment of a contribution in respect of subdivisions subject to the following conditions: • Lodgement of an unconditional bank guarantee to cover the amounts of such
contributions; • All money due as part of such contributions being payable within twelve (12) months
from the date of uplifting of the Plan of Subdivision; • The proposal applies to subdivision releases of five (5) lots or more or other
developments with an equivalent value of five (5) lots or more; and • The decision to accept a deferred payment is at the sole discretion of the General
Manager or his delegate.
3.7 Monitoring and review/update of developer contributions The developer contribution calculated in this plan is based on current projections of growth in population and development and Council’s assessment of infrastructure that will be required to service this growth. It is important that trends are monitored to ensure that contributions received are spent in a manner that provides services in an efficient and effective way. Council’s commitment to future works will be dependent on development and any change in the current projections may necessitate the rescheduling of future works. This plan therefore will require periodic review, say every 5 to 6 years, to ensure the developer contributions remain valid. Any review of the plan would include a public exhibition period of 30 days. In the period between any review, the developer contribution will be adjusted annually (1 July each year) on the basis in the change in the Consumer Price Index (CPI) in the preceding 12 months to December, excluding the impact of GST. Reference in this Policy to CPI is to the Index supplied by the ABS for ‘Public Enterprises State and Local - Water Supply and Sewerage’.

HUNTER WATER AUSTRALIA s64 Water and Sewerage Contributions Policy
R1451 July 2002 12
4. SYSTEMS BACKGROUND AND TIMING OF FUTURE WORKS
4.1 Water supply source, treatment and distribution system Dubbo City Council operates a potable water supply scheme for the City of Dubbo, which currently serves an urban population of approximately 37,600 persons. A raw water pump station draws water through an inlet structure from the Macquarie River and delivers it to the John Gilbert Water Treatment Plant (WTP). Raw water for the treatment plant is also sourced from the South Dubbo Bore field. DLWC has requested that Council reduce bore output from the south-east bore field by 50% to protect the long-term viability of the bore field. However, due to poor river quality this objective is difficult to achieve. After treatment the potable water is pumped to several service reservoirs within the water supply system. Several villages surrounding Dubbo have either been recently connected or are proposed to be connected to the water supply system. The Wongarbon area was connected to the Dubbo water supply system in 2000 under the Wongarbon Water Supply Scheme. The Brocklehurst area was also connected to the water supply under a similar scheme also undertaken in 2000. A feasibility study of providing water supply services to the Ballimore area completed by Council recommended that the area could be serviced. A cost assessment of providing water supply services to the Eumungerie area is to also be carried out. There are five clear water pumps at the WTP. Since the upgrade in 1996, two of them discharge to West Dubbo supplying Bourke Hill Reservoir and Rifle Range Reservoir, while three clear water pumps supply the five Newtown Reservoirs. Water is reticulated from the Newtown Reservoirs to Elston Park and Erskine Street booster stations, which pump water to the Myall Street Reservoirs. The Myall Street pumping station, adjacent to the Reservoirs, discharges water into the eastern Buninyong and Eulomogo Reservoirs that reticulate water to East Dubbo. The North Dubbo reticulation area is serviced from either or both of the Myall Street Reservoirs and the Erskine Street booster station. An area of high elevation around the Newtown Reservoirs is serviced from a 24-metre standpipe reservoir filled with water from the adjacent Newtown Reservoirs, after being pumped from a booster station. The new Yarrandale Pumping Station pumps water from the Myall Street Reservoirs to the 3.8 Megalitre Yarrandale Reservoir, which was constructed in 1996. This reservoir currently services the Yarrandale Road and Boothenba Road industrial estates. Currently the John Gilbert WTP, constructed in 1980, is working at full available capacity. Commencing in 2002/2003 a new process train, capable of treating 30 ML/d, will be constructed on land adjoining the present John Gilbert WTP. The upgrade of the WTP is to provide for future growth. The timing and costing of existing and proposed capital works, relative to the water supply system, are shown in the developer contribution model asset schedules, located in Appendix C.
HUNTER WATER AUSTRALIA s64 Water and Sewerage Contributions Policy
R1451 July 2002 13
4.2 Sewage transportation and treatment system Dubbo City Council operates and maintains a sewage transportation and treatment system that currently serves approximately 34,600 persons. All sewage flows collected in the area serviced by the Dubbo sewerage system are currently transported to either the Bunglegumbie or Troy Junction Sewerage Treatment Plants (STP). The Bunglegumbie STP is a trickling filter type plant constructed in the 1930s and is expected to cease operation in 2002/2003 as part of Council’s previously adopted sewerage strategy. Following the decommissioning of the Bunglegumbie STP, all flows from within the Dubbo sewerage system will be directed to the Troy Junction STP. Several areas surrounding Dubbo have previously had no sewerage services. Council has conducted studies to assess the feasibility of providing sewerage services to the Wongarbon and Brocklehurst areas. Construction has been tentatively scheduled for the Wongarbon system for 2004/2005. The Brocklehurst system construction is scheduled for 2004/2005. Council has plans to provide sewerage services to the Ballimore and Eumungerie areas but implantation will depend on the results from individual cost assessments to be conducted in the future. Sewage in Dubbo, east of the Macquarie River, is collected by gravity at the Erskine Street, Troy Gully, Macquarie Street and Avian Estate Pump Stations. The Avian Estate Pump Station pumps to Troy Gully Pump Station. The Macquarie Street Pump Station pumps to Erskine Street Pump Station. In 1998 a small pump station was installed at the intersection of Margaret Crescent and Emerald Street to relieve a chronic overload situation in that vicinity. It will only operate in peak wet weather events. Erskine Street Pump Station pumps part of its sewage direct to Bunglegumbie STP and part to Troy Gully Pump Station via a rising main discharging into a gravity pipeline upstream of the pump station. The proportion is set so that the Bunglegumbie Plant is not overloaded. The Keswick Pump Station, at Hennessy Road in southeast Dubbo was completed in 1998. It is not yet operating but is awaiting commencement of subdivision development in the catchment it serves. Troy Gully Pump Station receives some sewage under gravity from East Dubbo and some pumped from Erskine Street Pump Station. All sewage at Troy Gully Pump Station is pumped to the Troy Junction STP. After the construction of the Troy Junction STP in 1986 the combined treatment capacity for the Dubbo sewerage transportation system was 36,000 EP (Equivalent Persons). The initial stage of the Troy Junction STP augmentation, expected to be completed in 2003, will increase its capacity to 41,000 EP. This will be followed by the second stage of the augmentation, proposed for 2006/2007, which will provide a capacity of 50,000 EP. The timing and costing of existing and proposed capital works, relative to the sewerage system, are shown in the developer contribution model asset schedules, located in Appendix D.

HUNTER WATER AUSTRALIA s64 Water and Sewerage Contributions Policy
R1451 July 2002 14
5. METHODOLOGY
5.1 General The Developer Contribution is determined by analysing the cost of existing augmentation works, existing demand, anticipated growth and the cost of works required to meet the demand created by growth. The total cost of existing and proposed augmentation works required to service development is divided between demand units to determine the capital cost per unit. Any surplus income Council generates from a development (ie operational income minus operational, maintenance and administration costs) is deducted from the capital cost to obtain the Developer Contribution.
5.2 Net Present Value process In order to account for the time value of money, all calculations are undertaken using Net Present Value (NPV). NPV is a standard commercial procedure for calculating the expected net monetary gain or loss from a project by discounting all expected future cash inflows and outflows to the present time, using the required return on investment. The Developer Contribution is therefore calculated as: • The present value (PV) of the cost over time of capital works required to service
less • The present value of expected net income (revenue less expenses) over time from
servicing development (referred to as the “reduction amount”).
5.3 Determination of demands/loadings
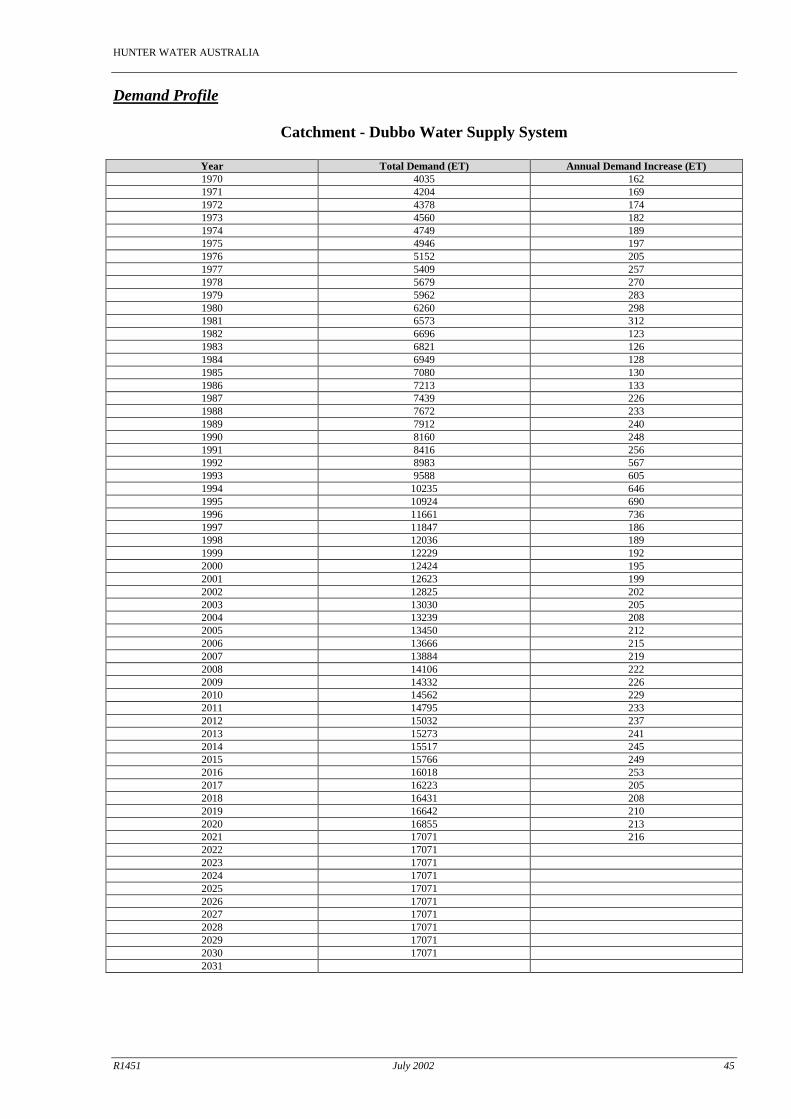
5.3.1 General An Equivalent Tenement (ET) is the basic unit of measure used to quantify the demand or loading on water supply or sewerage systems respectively. As previously stated, one ET represents the equivalent demand or loading from a standard residential household. An Equivalent Person (EP) is another basic unit of measure generally used to quantify loadings on a sewerage treatment works. One EP represents the equivalent loading from a standard person. EP loadings can be converted to an ET loading by defining an EP/ET ratio referred to as the occupancy ratio. For this study the average household density in the Dubbo City Council local government area is adopted as this ratio. A growth profile from 1970 to 2021 has been adopted for the Developer Contribution calculation. Assets commissioned prior to 1970 are not included. Future projections are limited
HUNTER WATER AUSTRALIA s64 Water and Sewerage Contributions Policy
R1451 July 2002 15
to 20 years as Council has considerable confidence in the growth projections over this period of time.
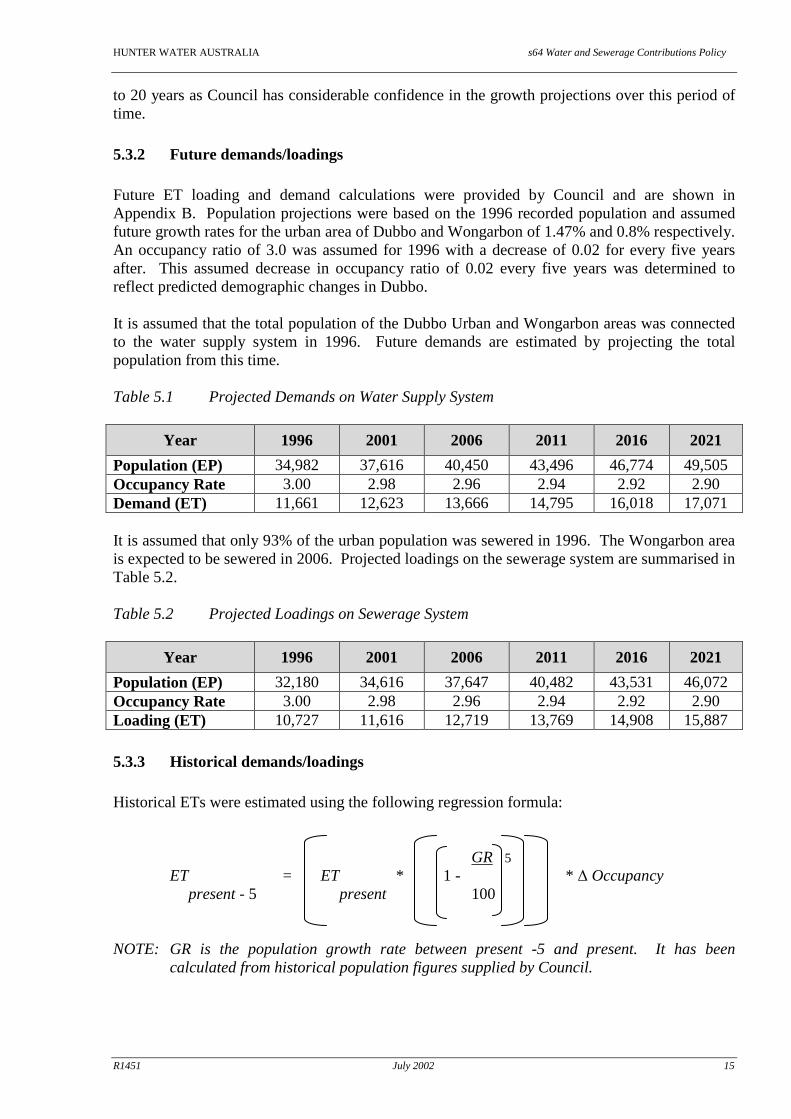
5.3.2 Future demands/loadings Future ET loading and demand calculations were provided by Council and are shown in Appendix B. Population projections were based on the 1996 recorded population and assumed future growth rates for the urban area of Dubbo and Wongarbon of 1.47% and 0.8% respectively. An occupancy ratio of 3.0 was assumed for 1996 with a decrease of 0.02 for every five years after. This assumed decrease in occupancy ratio of 0.02 every five years was determined to reflect predicted demographic changes in Dubbo. It is assumed that the total population of the Dubbo Urban and Wongarbon areas was connected to the water supply system in 1996. Future demands are estimated by projecting the total population from this time. Table 5.1 Projected Demands on Water Supply System
Year 1996 2001 2006 2011 2016 2021
Population (EP) 34,982 37,616 40,450 43,496 46,774 49,505 Occupancy Rate 3.00 2.98 2.96 2.94 2.92 2.90 Demand (ET) 11,661 12,623 13,666 14,795 16,018 17,071 It is assumed that only 93% of the urban population was sewered in 1996. The Wongarbon area is expected to be sewered in 2006. Projected loadings on the sewerage system are summarised in Table 5.2. Table 5.2 Projected Loadings on Sewerage System
Year 1996 2001 2006 2011 2016 2021
Population (EP) 32,180 34,616 37,647 40,482 43,531 46,072 Occupancy Rate 3.00 2.98 2.96 2.94 2.92 2.90 Loading (ET) 10,727 11,616 12,719 13,769 14,908 15,887
5.3.3 Historical demands/loadings Historical ETs were estimated using the following regression formula: GR 5 ET = ET * 1 - * ∆ Occupancy present - 5 present 100 NOTE: GR is the population growth rate between present -5 and present. It has been
calculated from historical population figures supplied by Council.

HUNTER WATER AUSTRALIA s64 Water and Sewerage Contributions Policy
R1451 July 2002 16
Historical occupancy rates were assumed to follow the same trend as the projected occupancy rates supplied by Council. Historical demands/loadings on the water supply and sewerage systems are summarised in Tables 5.3 and 5.4. Table 5.3 Historical Demands on Water Supply System
Year 1969 1971 1976 1981 1986 1991 1996
Population (EP) 12,613 13,606 16,443 20,619 22,446 25,908 34,982 Occupancy Rate 3.11 3.10 3.08 3.06 3.04 3.02 3.00 Demand (ET) 3,873 4,204 5,152 6,573 7,213 8,416 11,661 Table 5.4 Historical Loadings on Sewerage Supply System
Year 1969 1971 1976 1981 1986 1991 1996
Population (EP) 11,766 12,681 15,290 19,173 20,872 22,975 32,180 Occupancy Rate 3.11 3.10 3.08 3.06 3.04 3.02 3.00 Loading (ET) 3,604 3,908 4,777 6,094 6,688 7,425 10,727 The calculation of historical ETs for the water supply and sewerage systems can be found in Appendices C and D respectively. Figure 5.1 is a graphical representation of the historical ETs estimated for the water supply and sewerage systems. Figure 5.1 Historical ETs for the Water Supply and Sewerage Systems
0
2,000
4,000
6,000
8,000
10,000
12,000
14,000
1969 1971 1976 1981 1986 1991 1996
Water Supply System
Sewerage System
Equ
ival
ent
Ten
emen
t (E
T)
Year
HUNTER WATER AUSTRALIA s64 Water and Sewerage Contributions Policy
R1451 July 2002 17
5.4 Discount rates A discount rate calculates the present value of money arising in the future. The discount rate therefore converts the value of future money to today’s money. The discount rate used in the Developer Contribution calculation should reflect the opportunity cost to Council of funding infrastructure works. It should recognise that in providing infrastructure prior to development, Council faces a number of uncertainties or risks. These uncertainties include growth rates, cost of capital works and changes in interest rates. IPaRT has specified the discount rates to be used by Sydney Water Corporation, Hunter Water Corporation, Gosford City Council and Wyong Shire Council. The specified discount rates vary depending on whether the assets were commissioned prior to or following 1996. Similar values are recommended by DLWC for regional councils. For Dubbo City Council a pre-1996 asset real discount rate of 3% and a post-1996 asset real discount rate of 7% have been adopted. The commonly suggested values chosen for the real discount rate for the reduction amount vary between 7 and 12 percent. The value prescribed for the four major water authorities is 7% and this has also been adopted for Dubbo City Council.
5.5 Assets
5.5.1 Definition of assets IPaRT defines assets on the basis of whether they were commissioned before or after the initial application of the NPV methodology for calculating developer contributions, ie 1996. This ensures a consistent rate of return is applied to all assets in subsequent reviews of a WSCP.
5.5.2 Inclusion of pre-1996 capital works Assets constructed prior to 1970 have been excluded from the developer contribution calculation as it assumed the cost of these assets has been fully recovered. This practice is consistent with guidelines issued by both IPaRT and DLWC.
5.5.3 Inclusion of post-1996 capital works Council has prepared a future Capital Works Schedule that includes works proposed to be constructed until 2021. Sufficient confidence of the timing of construction and costing of these works governs their inclusion in the developer contribution calculation. An exception is the exclusion of the land sale credit expected from the sale of the former Bunglegumbie STP site, as there is not sufficient confidence in the timing or value of the sale.
HUNTER WATER AUSTRALIA s64 Water and Sewerage Contributions Policy
R1451 July 2002 18
5.6 Pro-Rata of asset costs
5.6.1 Pre-1996 assets The estimated present day value of assets was pro-rated with respect to the amount of capacity provided by the asset for development. Council has carried out estimates of the percentage of each asset’s capacity attributable to growth. The HWA developer contribution model recognises assets that service growth as ‘Upgrade’. Hence, for ‘Upgrade’ assets the present day value of each asset (MEERA value), also provided by Council, was multiplied by the corresponding percentage attributable to growth.
5.6.2 Post-1996 assets Council supplied details to the consultant of the works commissioned since 1996 and proposed works. All these assets are augmentations. The HWA developer contribution model recognises these assets as ‘Augment’. This means that the entire cost of the asset is fully recoverable.
5.7 Calculation of capital contribution The capital contribution is calculated in a spreadsheet model comprising a number of separate, but linked, worksheets. The initial pro-rata of asset costs occurs in the Above Ground, Below Ground and Future Works asset worksheets, where the assets constructed in each year, and their costs, are tabulated prior to being referred to the ‘Asset Schedule’ spreadsheet. This spreadsheet separates the total asset costs for each year into pre-1996 assets and post-1996 assets. The separate total costs are then referred to in the ‘Capital Contribution’ spreadsheet. The following formula is then applied to the pre 1996-assets and post-1996 assets to calculate the net present value contribution:
NPV (Contribution) = NPV (Σ ASSET COSTS)/NPV (Σ INCREMENTAL ETs) The calculations can be found in the developer contribution models located in Appendix C and Appendix D.
5.8 Reduction amount The reduction amount (cost) is determined as the difference between the operating revenue arising from a WSCP area and the operating, maintenance and administration costs for that area. Council has projected net revenues and costs until 2020 and hence a forecast horizon of 20 years was adopted to calculate the operating surplus. The calculations can be found in the developer contribution models located in Appendix C and Appendix D.
HUNTER WATER AUSTRALIA s64 Water and Sewerage Contributions Policy
R1451 July 2002 19
6. Developer contributions The developer contribution calculations are detailed in Appendix C (water supply) and Appendix D (sewerage).
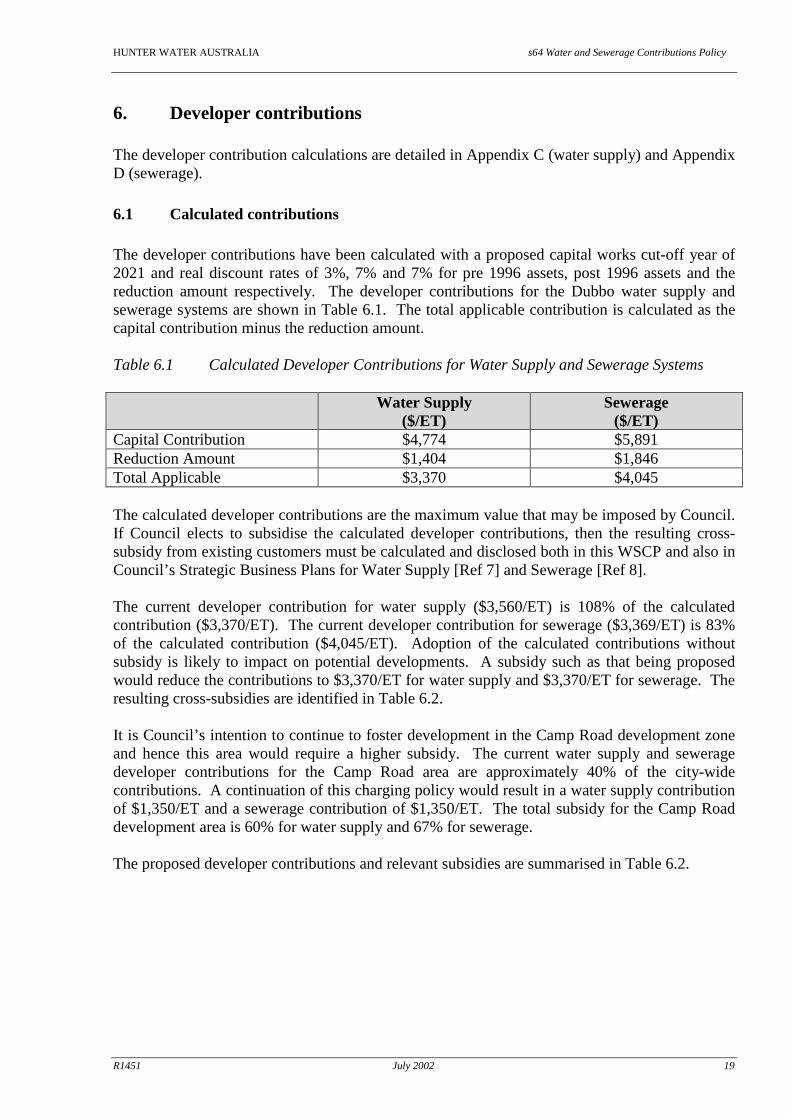
6.1 Calculated contributions The developer contributions have been calculated with a proposed capital works cut-off year of 2021 and real discount rates of 3%, 7% and 7% for pre 1996 assets, post 1996 assets and the reduction amount respectively. The developer contributions for the Dubbo water supply and sewerage systems are shown in Table 6.1. The total applicable contribution is calculated as the capital contribution minus the reduction amount. Table 6.1 Calculated Developer Contributions for Water Supply and Sewerage Systems
Water Supply ($/ET)
Sewerage ($/ET)
Capital Contribution $4,774 $5,891 Reduction Amount $1,404 $1,846 Total Applicable $3,370 $4,045 The calculated developer contributions are the maximum value that may be imposed by Council. If Council elects to subsidise the calculated developer contributions, then the resulting cross-subsidy from existing customers must be calculated and disclosed both in this WSCP and also in Council’s Strategic Business Plans for Water Supply [Ref 7] and Sewerage [Ref 8]. The current developer contribution for water supply ($3,560/ET) is 108% of the calculated contribution ($3,370/ET). The current developer contribution for sewerage ($3,369/ET) is 83% of the calculated contribution ($4,045/ET). Adoption of the calculated contributions without subsidy is likely to impact on potential developments. A subsidy such as that being proposed would reduce the contributions to $3,370/ET for water supply and $3,370/ET for sewerage. The resulting cross-subsidies are identified in Table 6.2. It is Council’s intention to continue to foster development in the Camp Road development zone and hence this area would require a higher subsidy. The current water supply and sewerage developer contributions for the Camp Road area are approximately 40% of the city-wide contributions. A continuation of this charging policy would result in a water supply contribution of $1,350/ET and a sewerage contribution of $1,350/ET. The total subsidy for the Camp Road development area is 60% for water supply and 67% for sewerage. The proposed developer contributions and relevant subsidies are summarised in Table 6.2.
HUNTER WATER AUSTRALIA s64 Water and Sewerage Contributions Policy
R1451 July 2002 20
Table 6.2 Summary of Proposed Developer Contributions and Subsidies Water Supply Sewerage
City-Wide ($/ET)
Camp Rd ($/ET)
City-Wide ($/ET)
Camp Rd ($/ET)
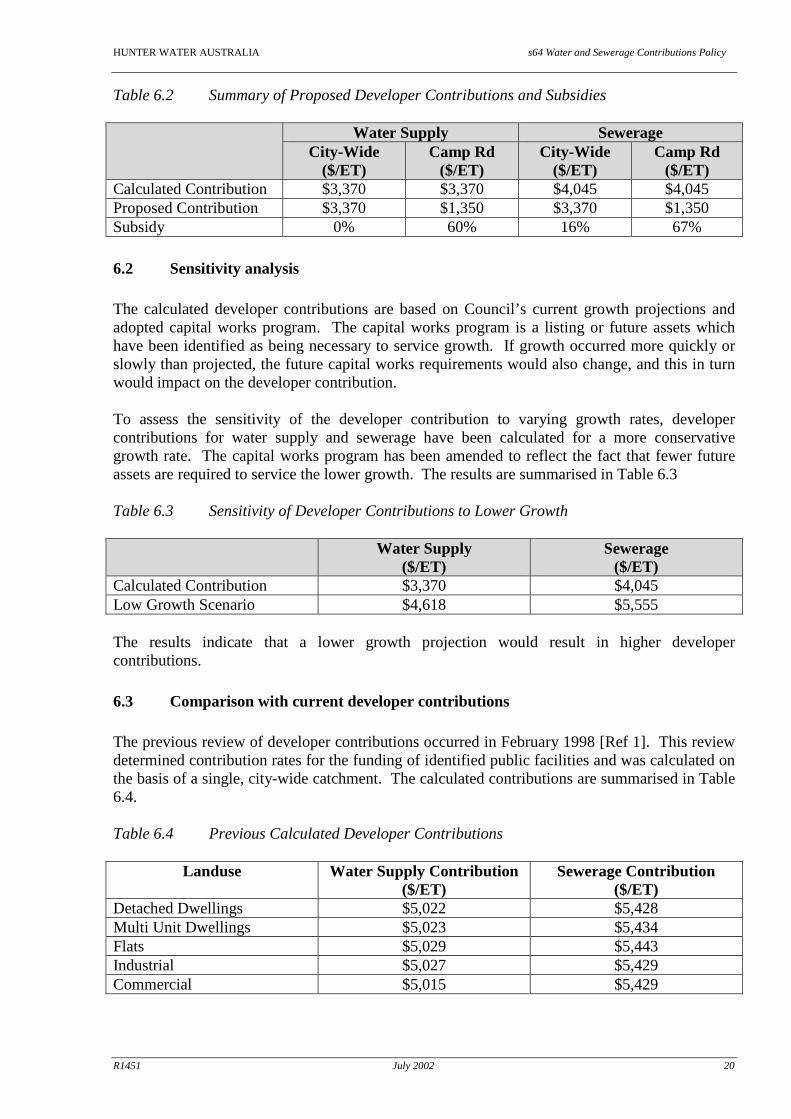
Calculated Contribution $3,370 $3,370 $4,045 $4,045 Proposed Contribution $3,370 $1,350 $3,370 $1,350 Subsidy 0% 60% 16% 67%
6.2 Sensitivity analysis The calculated developer contributions are based on Council’s current growth projections and adopted capital works program. The capital works program is a listing or future assets which have been identified as being necessary to service growth. If growth occurred more quickly or slowly than projected, the future capital works requirements would also change, and this in turn would impact on the developer contribution. To assess the sensitivity of the developer contribution to varying growth rates, developer contributions for water supply and sewerage have been calculated for a more conservative growth rate. The capital works program has been amended to reflect the fact that fewer future assets are required to service the lower growth. The results are summarised in Table 6.3 Table 6.3 Sensitivity of Developer Contributions to Lower Growth
Water Supply
($/ET) Sewerage
($/ET) Calculated Contribution $3,370 $4,045 Low Growth Scenario $4,618 $5,555 The results indicate that a lower growth projection would result in higher developer contributions.
6.3 Comparison with current developer contributions The previous review of developer contributions occurred in February 1998 [Ref 1]. This review determined contribution rates for the funding of identified public facilities and was calculated on the basis of a single, city-wide catchment. The calculated contributions are summarised in Table 6.4. Table 6.4 Previous Calculated Developer Contributions
Landuse Water Supply Contribution ($/ET)
Sewerage Contribution ($/ET)
Detached Dwellings $5,022 $5,428 Multi Unit Dwellings $5,023 $5,434 Flats $5,029 $5,443 Industrial $5,027 $5,429 Commercial $5,015 $5,429

HUNTER WATER AUSTRALIA s64 Water and Sewerage Contributions Policy
R1451 July 2002 21
The current contribution rates, which have been increased in line with the CPI, are summarised in Table 6.5. Table 6.5 Current Developer Contributions
Water Supply Contribution Sewerage Contribution City Precinct
($/ET) Camp Rd
($/ET) City Precinct
($/ET) Camp Rd
($/ET) $3,650 $1,350 $3,369 $1,350
The developer contributions calculated as part of this review (refer Table 6.1) are approximately 25% lower than those previously calculated (refer Table 6.4). The change in the magnitude of the developer contribution for the water supply and sewerage systems may be attributed to: • A review of capital works required to service future development. • The application of a discount rate to be recouped through developer contributions. The
previous assessment applied a discount rate of 7% to all assets. This would increase the rate of return and hence the calculated developer contribution when compared with the current assessment which discounted pre 1996 assets by 3%.
• The division of the capital contribution by the discounted ET take-up rate over the period 1970-2021. The previous assessment did not discount the ET take-up rate and hence the capital contribution was divided by a higher unit of capacity.
• The previous assessment calculated lower reduction amounts.
HUNTER WATER AUSTRALIA s64 Water and Sewerage Contributions Policy
R1451 July 2002 22
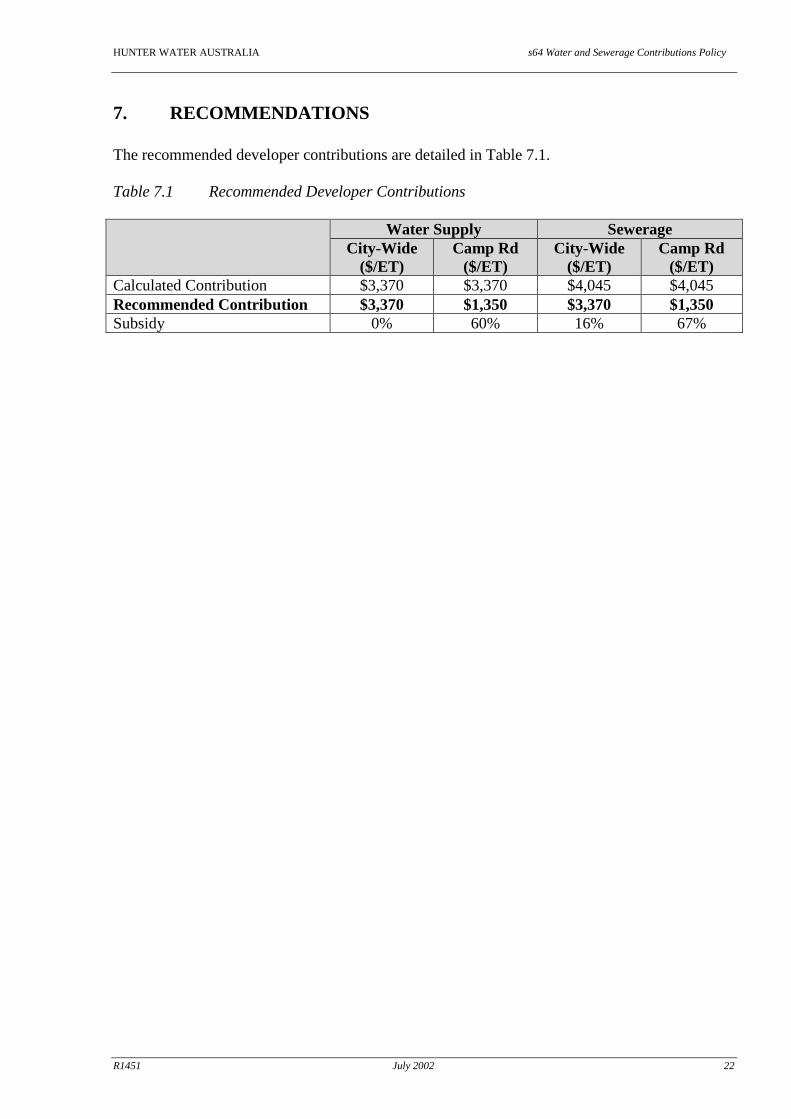
7. RECOMMENDATIONS The recommended developer contributions are detailed in Table 7.1. Table 7.1 Recommended Developer Contributions Water Supply Sewerage
City-Wide ($/ET)
Camp Rd ($/ET)
City-Wide ($/ET)
Camp Rd ($/ET)
Calculated Contribution $3,370 $3,370 $4,045 $4,045 Recommended Contribution $3,370 $1,350 $3,370 $1,350 Subsidy 0% 60% 16% 67%
HUNTER WATER AUSTRALIA s64 Water and Sewerage Contributions Policy
R1451 July 2002 23
8. REFERENCES [1] Scott Carver Pty Ltd (February 1998), Combined Water and Sewerage Contribution
Policy, Dubbo City Council [2] Department of Land and Water Conservation (May 2000), Developer Contributions for
Water Supply, Sewerage and Stormwater, Guidelines [3] Independent Pricing and Regulatory Tribunal of New South Wales (September 2000),
Developer Contributions, Determination No 9, 2000 [4] New South Wales Public Works Department (September 1996), Water Supply
Investigations Manual [5] New South Wales Public Works Department (November 1980), Demand Criteria for
Design Purposes for NSW Country Towns [6] New South Wales Public Works Department (January 1987), Manual of Practice, Sewer
Design [7] Strategic Business Plan for Water Supply Services, DCC [8] Strategic Business Plan for Sewerage Services, DCC

HUNTER WATER AUSTRALIA s64 Water and Sewerage Contributions Policy
R1451 July 2002 24
9. GLOSSARY OF TERMS In this Policy, unless the context or subject matter otherwise indicates or requires: ‘Area’ means the land within the jurisdiction of the Council of the City of Dubbo ‘Consent Authority’ means the Council of the City of Dubbo ‘Contribution’ means a monetary contribution or land dedication as referred to in section 64 of the Local Government Act 1993 ‘Contributions Policy’ means a Contributions Policy referred to in section 64 of the Local Government Act 1993 ‘Council’ refers to Dubbo City Council ‘DCC’ means Dubbo City Council ‘Development’ may include a reference to the erection of a building on land; the carrying out of a work in, on, over or under land; the use of land or of a building or work on that land and/or the subdivision of land ‘DLWC’ means the Department of Land and Water Conservation ‘EPAA’ means the Environmental Planning and Assessment Act 1979 ‘EP’ means the equivalent persons and is the unit of measure to describe the flow or demand associated with an average person ‘ET’ means the equivalent tenement and is the basic unit of measure used to describe flow or demand from contributing sources as a ratio to that expected from a single average residence. Other uses can be assessed as equivalent to a number of tenements ‘Headworks’ means those components that form the key infrastructure requirements for the supply of sewerage or water supply services to an area. Typically, headworks comprise such components as dams, bores, pumping stations, treatment plants, purification plants and trunk mains ‘GR’ means Growth Rate (% per annum) ‘HWA’ means Hunter Water Australia ‘Indexation’ means the percentage by which contributions are increased for each calculation period ‘IPaRT’ means the Independent Pricing and Regulatory Tribunal ‘LG Act’ means the Local Government Act 1993

HUNTER WATER AUSTRALIA s64 Water and Sewerage Contributions Policy
R1451 July 2002 25
‘ML/d’ means Megalitres per day ‘NPV’ means Net Present Value; a process to convert future incomes or expenditures to the value of today’s money ‘Occupancy Rate’ means the average number of people per household; commonly referred to as the EP/ET ratio ‘Rising Main’ means a pipeline pumped under high pressure to which water connections are prohibited ‘STP’ means Sewerage Treatment Plant ‘WSCP’ means Water and Sewerage Contribution Policy ‘WTP’ means Water Treatment Plant

HUNTER WATER AUSTRALIA s64 Water and Sewerage Contributions Policy
R1451 July 2002 26
This page has been left blank
HUNTER WATER AUSTRALIA s64 Water and Sewerage Contributions Policy
R1451 July 2002 27
Appendix A
Plans

HUNTER WATER AUSTRALIA s64 Water and Sewerage Contributions Policy
R1451 July 2002 28
Plan 1 Dubbo Water Supply System

HUNTER WATER AUSTRALIA s64 Water and Sewerage Contributions Policy
R1451 July 2002 29
Plan 2 Dubbo Sewerage System

HUNTER WATER AUSTRALIA s64 Water and Sewerage Contributions Policy
R1451 July 2002 30
Plan 3 Ballimore Water Supply

HUNTER WATER AUSTRALIA s64 Water and Sewerage Contributions Policy
R1451 July 2002 31
Plan 4 Brocklehurst Water Supply

HUNTER WATER AUSTRALIA s64 Water and Sewerage Contributions Policy
R1451 July 2002 32
Plan 5 Brocklehurst Sewerage

HUNTER WATER AUSTRALIA s64 Water and Sewerage Contributions Policy
R1451 July 2002 33
Plan 6 Eumungerie Water Supply

HUNTER WATER AUSTRALIA s64 Water and Sewerage Contributions Policy
R1451 July 2002 34
Plan 7 Wongarbon Sewerage
HUNTER WATER AUSTRALIA s64 Water and Sewerage Contributions Policy
R1451 July 2002 35
Plan 8 Wongarbon Water Supply

HUNTER WATER AUSTRALIA s64 Water and Sewerage Contributions Policy
R1451 July 2002 36
Appendix B
Population Projections - Dubbo City Council

HUNTER WATER AUSTRALIA s64 Water and Sewerage Contributions Policy
R1451 July 2002 37
This page has been left blank

HUNTER WATER AUSTRALIA s64 Water and Sewerage Contributions Policy
R1451 July 2002 38
DUBBO CITY COUNCIL POPULATION PREDICTIONS SOURCE YEAR 1996 2001 2006 2011 2016 2021 2026 2031 STRATEGIC PLANNERS Urban
1.47% 34602 37221 40039 43069 46329 49043 51973 54903 1.58% 34602 37423 40475 43775 47344 50275 53458 56642
2% 34602 38421 42262 46707 51619 55418 59650 63882 3% 34602 40013 46502 53909 62495 68409 75377 82345
City LGA
1.47% 37908 40777 43864 47184 50756 53729 56939 60149 1.58% 37908 40999 44342 47957 51867 55077 58565 62053
2% 37908 41895 46300 51169 56551 60733 65389 70045 3% 37908 43946 50945 59059 68466 74934 82556 90179
Urban/LGA (1.47%) 91% 91% 91% 91% 91% 91% 91% 91% CORPORATE PLAN City LGA
1.50% Population 36553 39294 42242 45410 48815 52477 56412 60643 Tenements 12184 13186 14271 15445 16718 18095 19588 21204 DUBBO LGA ECONOMIC PROFILE (basis of Dubbo’s Growing Business) City LGA 31000 32300 34000 35000 36330 37330 38801 40079 CURRENT DATA Apr-01 Mar-01 Assessments 13975 14747 Water Assessments 11939 12813 (87% of total) Sge Assessments 11280 11905 (93% of water) WATER, SEWERAGE POPULATIONS SERVED Water population served is based on the urban area plus Wongarbon. Urban (1.47%) 34602 37221 40039 43069 46329 49043 51973 54903 Wongarbon (0.8%) 380 395 411 427 445 462 481 500 TOTAL (EP) 34982 37616 40450 43496 46774 49505 52454 55403 Occ. Ratio 3.00 2.98 2.96 2.94 2.92 2.90 2.88 2.86 TOTAL (ET) 11661 12623 13666 14795 16018 17071 18213 19372 Sewerage population served is based on 93% of the urban area plus Wongarbon, in 2006 and thereafter. Urban (1.47%) 34602 37221 40039 43069 46329 49043 51973 54903 93% of Urban 32180 34616 37236 40054 43086 45610 48335 51060 Wongarbon (0.8%) 411 427 445 462 481 500 TOTAL (EP) 32180 34616 37647 40482 43531 46072 48816 51560 Occ. Ratio 3.00 2.98 2.96 2.94 2.92 2.90 2.88 2.86 TOTAL (ET) 10727 11616 12719 13769 14908 15887 16950 18028

HUNTER WATER AUSTRALIA s64 Water and Sewerage Contributions Policy
R1451 July 2002 39
This page has been left blank

HUNTER WATER AUSTRALIA s64 Water and Sewerage Contributions Policy
R1451 July 2002 40
Appendix C
Developer Contribution Model (Water Supply System)

HUNTER WATER AUSTRALIA s64 Water and Sewerage Contributions Policy
R1451 July 2002 41
This page has been left blank
HUNTER WATER AUSTRALIA s64 Water and Sewerage Contributions Policy
R1451 July 2002 42
Hunter Water Australia
DEVELOPER CHARGES MODEL
Dubbo Water Supply System
Year : 2001

HUNTER WATER AUSTRALIA s64 Water and Sewerage Contributions Policy
R1451 July 2002 43
Summary of Charges Catchment Dubbo Water Supply System 1.0 INPUT DATA YEAR OF CALCULATION 2001 DISCOUNT RATE (pa) FOR ASSETS CONSTRUCTED BEFORE 1 JANUARY 1996: 3% DISCOUNT RATE (pa) FOR ASSETS CONSTRUCTED ON OR AFTER 1 JANUARY 1996: 7% DISCOUNT RATE (pa) FOR EXPECTED NET REVENUES AND COSTS: 7% 2.0 RESULTS CAPITAL CHARGES TREATMENT (per ET)
$5,162
REDUCTION AMOUNT (per ET) $1,360
TOTAL DEVELOPER CHARGE per ET $3,802

HUNTER WATER AUSTRALIA s64 Water and Sewerage Contributions Policy
R1451 July 2002 44
Calculation of Reduction Amount
Year 2001 2002 2003 2004 2005 2006 2007 2008 2009 2010 2011 2012 2013 2014 2015 2016 2017 2018 2019 2020 2021 Incremental
Demand (ET) 199 202 205 208 212 215 219 222 226 229 233 237 241 245 249 253 205 208 210 213 216
Cum. Total Demand (ET)
12623 12825 13030 13239 13450 13666 13884 14106 14332 14562 14795 15032 15273 15517 15766 16018 16223 16431 16642 16855 17071
Total Income ($)
5845920 6057579 6154339 6253014 6345501 6448287 6551073 6653859 6756645 6859431 6962217 7065003 7167789 7270575 7373361 7476147 7578933 7681719 7784505 7887291 7990077
Total Cost ($) 3829473 3418238 3659671 3723173 3868883 3866999 3983009 4102499 4225574 4352341 4482912 4617399 4755921 4898599 5045557 5196923 5352831 5513416 5678818 5849183 6024658 Income per ET 463.12
Cost per ET 303.38 Income 91973.591 93533.911 95030.441 96550.915 98095.716 99665.234 101293.39 102914.6 104561.77 106235.3 107935.61 109763.85 111522.25 113308.82 115124.01 116968.28 95006.089 96222.811 97455.115 98703.201 99967.27
Cost 60248.923 61271.038 62251.366 63247.379 64259.329 65287.469 66354.02 67416.026 68495.031 69591.305 70705.124 71902.746 73054.618 74224.943 75414.016 76622.137 62235.414 63032.449 63839.692 64657.272 65485.324 Surplus 31724.668 32262.873 32779.074 33303.535 33836.387 34377.765 34939.367 35498.578 36066.738 36643.992 37230.485 37861.104 38467.634 39083.88 39709.998 40346.147 32770.675 33190.362 33615.423 34045.928 34481.947
Cum. Surplus 31724.668 63987.541 96766.616 130070.15 163906.54 198284.3 233223.67 268722.25 304788.99 341432.98 378663.46 416524.57 454992.2 494076.08 533786.08 574132.22 606902.9 640093.26 673708.68 707754.61 742236.56
NPV Operating Profit (Loss) per ET $1,360
HUNTER WATER AUSTRALIA
R1451 July 2002 45
Demand Profile
Catchment - Dubbo Water Supply System
Year Total Demand (ET) Annual Demand Increase (ET) 1970 4035 162 1971 4204 169 1972 4378 174 1973 4560 182 1974 4749 189 1975 4946 197 1976 5152 205 1977 5409 257 1978 5679 270 1979 5962 283 1980 6260 298 1981 6573 312 1982 6696 123 1983 6821 126 1984 6949 128 1985 7080 130 1986 7213 133 1987 7439 226 1988 7672 233 1989 7912 240 1990 8160 248 1991 8416 256 1992 8983 567 1993 9588 605 1994 10235 646 1995 10924 690 1996 11661 736 1997 11847 186 1998 12036 189 1999 12229 192 2000 12424 195 2001 12623 199 2002 12825 202 2003 13030 205 2004 13239 208 2005 13450 212 2006 13666 215 2007 13884 219 2008 14106 222 2009 14332 226 2010 14562 229 2011 14795 233 2012 15032 237 2013 15273 241 2014 15517 245 2015 15766 249 2016 16018 253 2017 16223 205 2018 16431 208 2019 16642 210 2020 16855 213 2021 17071 216 2022 17071 2023 17071 2024 17071 2025 17071 2026 17071 2027 17071 2028 17071 2029 17071 2030 17071 2031

HUNTER WATER AUSTRALIA
R1451 July 2002 46
Asset Schedule
Catchment - Dubbo Water Supply System
Year Expenditure Existing
(Pre 1996)
Expenditure Future
(Post 1996)
Description
$MEERA $ACTUAL 1 2 4
1970 2,458,902 - ABOVE GROUND: Buninyong Reservoir No 1
BELOW GROUND: Diam = mm, Length = 0m 1971 0 - 1972 210,540 - ABOVE GROUND: Riverbank bore
BELOW GROUND: Diam = mm, Length = 0m 1973 65,754 - ABOVE GROUND: West Dubbo PS 1974 313,370 - BELOW GROUND: Diam = mm, Length = 0m 1975 587,198 - ABOVE GROUND: Ronald Street Bore, Driftwell Bore, Harpers Bore
BELOW GROUND: Diam = mm, Length = 0m 1976 0 - 1977 291,450 - BELOW GROUND: Diam = mm, Length = 0m 1978 413,600 - BELOW GROUND: Diam = mm, Length = 0m 1979 1,955,016 - ABOVE GROUND: Shibbles Bore 1, Shibbles Bore 2, Wheelers Lane
Bore, Ronald Street BELOW GROUND: Diam = mm, Length = 0m
1980 12,294,534 - ABOVE GROUND: Water Treatment Plant BELOW GROUND: Diam = mm, Length = 0m
1981 51,490 - BELOW GROUND: Diam = mm, Length = 0m 1982 105,785 - ABOVE GROUND: Elston Park PS
BELOW GROUND: Diam = mm, Length = 0m 1983 1,745,370 - BELOW GROUND: Diam = mm, Length = 0m 1984 4,096,442 - ABOVE GROUND: Myall Street PS 2, Newtown Reservoir 1, Myall
Street Reservoir 2, Rifle Range Reservoir BELOW GROUND: Diam = mm, Length = 0m
1985 3,040,010 - BELOW GROUND: Diam = mm, Length = 0m 1986 235,984 - ABOVE GROUND: Thorby Ave Bore
BELOW GROUND: Diam = mm, Length = 0m 1987 81,890 - BELOW GROUND: Diam = mm, Length = 0m 1988 2,860 - BELOW GROUND: Diam = mm, Length = 0m 1989 0 - 1990 167,246 - ABOVE GROUND: No Name **********
BELOW GROUND: Diam = mm, Length = 0m 1991 91,483 - ABOVE GROUND: Newtown PS 1992 242,070 - BELOW GROUND: Diam = mm, Length = 0m 1993 107,760 - BELOW GROUND: Diam = mm, Length = 0m 1994 91,313 - ABOVE GROUND: No Name **********
BELOW GROUND: Diam = mm, Length = 0m 1995 70,750 - BELOW GROUND: Diam = mm, Length = 0m 1996 - 2,488,683 ABOVE GROUND: Yarrandale Reservoir
BELOW GROUND: Diam = mm, Length = 0m 1997 - 2,643,618 ABOVE GROUND: Buninyong Reservoir No 2
BELOW GROUND: Diam = mm, Length = 0m 1998 - 198,997 ABOVE GROUND: No Name **********
BELOW GROUND: Diam = mm, Length = 0m 1999 - 294,270 BELOW GROUND: Diam = mm, Length = 0m 2000 - 1,787,955 ABOVE GROUND: Wongarbon PS, Wongarbon Reservoir
BELOW GROUND: Diam = mm, Length = 0m 2001 - 0 2002 - 3,126,000 FUTURE WORKS: Pipelines - Sheraton/Buninyong (3.1km, DN 300) (S)
Pipelines - Sheraton/Buninyong (3.1km, DN 300) (C) Pipelines - Sheraton/Buninyong (3.1km, DN 300) (PC) Pipelines - Camp Rd/Rifle Range Rd (3.7km, DN 200) (PC) Pipelines - Camp Rd/Rifle Range Rd, (3.7km, DN 200) (S) Pipelines - Camp Rd/Rifle Range Rd, (3.7km, DN 200) (C) Pipelines - Obley/Newell Hwy, (0.9km, DN 300) (PC) Pipelines - Darling (Bultje/Erskine) (0.9km, DN 300) (PC) Pipelines - WTP/Wheelers Ln (1.8km, DN 600) (S) Pipelines - WTP/Wheelers Ln (1.8km, DN 600) (C) Pipelines - Newell/Minore Rd, (2km, DN 300) (PC) J.Gilbert WTP - Sludge Lagoons, Stage 4 (C,S) J.Gilbert WTP - New RW Pump No. 3 - Civil (C) J.Gilbert WTP - New RW Pump No. 3 - Pump (C) J.Gilbert WTP - New RW Pump No. 3 - Motor (C) J.Gilbert WTP - New RW Pump No. 3 - Power Supply (C) New WTP (30ML/D) - Option Study (PC) New WTP

HUNTER WATER AUSTRALIA
R1451 July 2002 47
(30ML/D) - Environment Review (PC) New WTP (30ML/D) - Prepare D&C Docs (PC) New WTP (30ML/D) - Project Management (S)
2003 - 9,430,000 FUTURE WORKS: Pipelines - Obley/Newell Hwy, (0.9km, DN 300) (S) Pipelines - Obley/Newell Hwy (0.9km, DN 300 (C) Pipelines - Darling (Bultje/Erskine) (0.9km, DN 300) (S) Pipelines - Darling (Bultje/Erskine)(0.9km, DN300) (C) Pipelines - Tamworth (Fitzroy/Darling) (0.6km, DN 300) (PC) Pipelines - Minore Rd (1.1km, DN300) (PC) Pipelines - Newell/Minore Rd (2km, DN 300) (S) Pipelines - Newell/Minore Rd (2km, DN 300) (C) Myall Street Reservoir 3, (5ML) - (PC) New WTP (30ML/D) - Project Management (S) New WTP (30ML/D) - Design & Construction (C) South Dubbo Oval & Park RW Scheme - Pipeline, PS (S) South Dubbo Oval & Park RW Scheme - Pipeline, PS (C) Ballimore Water Supply Scheme (S) Ballimore Water Supply Scheme (C) Eumungerie Water Supply Scheme (PC)
2004 - 8,386,000 FUTURE WORKS: Pipelines - Myall Res/Yarrandale PS (0.7km, DN 300) (PC) Pipelines - Tamworth (Fitzroy/Darling) (0.6km, DN 300) (S) Pipelines - Tamworth (Fitzroy/Darling) (0.6km, DN 300) (C) Pipelines - Elston Pk/Brigalow (1.1km, DN 300) (PC) Pipelines - Minore Rd (1.1km, DN 300) (S) Pipelines - Minore Rd (1.1km, DN 300) (C) Myall Street Reservoir 3, (5ML) - (S) Myall Street Reservoir 3, (5ML) - (C) Macquarie River Weir - Fish Ladder (PC) Old WTP Demolition (PC) New WTP (30ML/D) - Project Management (S) New WTP (30ML/D) - Design & Construction (C) Lady Cutler RW Scheme - Irrigation (S) South Dubbo Oval and Park RW Scheme - Irrigation (PC) South Dubbo Oval and Park RW Scheme - Irrigation (S) South Dubbo Oval and Park RW Scheme - Irrigation (C) Eumungerie Water Supply Scheme (S) Eumungerie Water
2005 - 1,026,000 FUTURE WORKS: Pipelines - Myall Res/Yarrandale PS (0.7km, DN 300) (S) Pipelines - Myall Res/Yarrandale PS (0.7km, DN 300) (C) Pipelines - Elston Pk/Brigalow (1.1km, DN 300) (S) Pipelines - Elston Pk/Brigalow (1.1km, DN 300) (C) Macquarie River Weir - Fish Ladder (S) Macquarie River Weir - Fish Ladder (C) Old WTP Demolition (S) Old WTP Demolition (C) West Dubbo RW Scheme - Pipelines (PC) West Dubbo RW Scheme - Intake (Civil) (PC) West Dubbo RW Scheme - Intake (Mech/Elect) (PC) West Dubbo RW Scheme - Irrigation (PC) Lady Cutler RW Scheme - Irrigation (PC) Lady Cutler RW Scheme - Irrigation (C)
2006 - 994,000 FUTURE WORKS: Bourke Hill Reservoir 2, (7.5ML) - (PC) West Dubbo RW Scheme - Pipelines (S) West Dubbo RW Scheme - Pipelines (C) West Dubbo RW Scheme - Intake (Civil) (S) West Dubbo RW Scheme - Intake (Civil) (C) West Dubbo RW Scheme - Intake (Mech/Elect) (S) West Dubbo RW Scheme - Intake (Mech/Elect) (C) West Dubbo RW Scheme - Irrigation (S) West Dubbo RW Scheme - Irrigation (C) North East Parks RW Scheme - Pipeline (PC) East Dubbo RW Scheme - Trunk Main (PC) East Dubbo RW Scheme - Irrigation (PC)
2007 - 1,387,000 FUTURE WORKS: Pipelines - Newell/Rifle Range Res (4.0km, DN 300) (PC) Pipelines - Trunk Mains for Bourke Hill Res No 2 (PC) Bourke Hill Reservoir 2, (7.5ML) - (S) Bourke Hill Reservoir 2 (7.5ML) - (C) North East Parks RW Scheme - Pipeline (S) North East Parks RW Scheme - Pipeline (C) North East Parks RW Scheme - Bore Pump (PC, C, S) North East Parks RW Scheme - Irrigation (PC, C, S) East Dubbo RW Scheme - Trunk Main (S) East Dubbo RW
2008 - 1,729,000 FUTURE WORKS: Pipelines - Erskine St, PS/Myall Res (2.6km, DN 300) (PC) Pipelines - Newell/Rifle Range Res (4.0km, DN 300) (S) Pipelines - Newell/Rifle Range Res. (4.0km, DN 300) (C) Pipeline - Trunk Mains for Bourke Hill Res. No. 2 (S) Pipeline - Trunk Mains for Bourke Hill Res. No. 2 (C) East Dubbo RW Scheme - Trunk Main (S) East Dubbo RW Scheme - Trunk Main (C) East Dubbo RW Scheme - Irrigation (S) East Dubbo RW Scheme - Irrigation (C)
2009 - 1,157,000 FUTURE WORKS: Pipelines - Erskine St, PS/Myall Res (2.6km, DN 300) (S) Pipelines - Erskine St, PS/Myall Res (2.6km, DN 300) (C) Pipeline - Trunk Mains for Bourke Hill Res No. 2 (S) Pipeline - Trunk Mains for Bourke Hill Res No. 2
2010 - 85,000 FUTURE WORKS: Eulomogo Reservoir 2, (10ML) - (PC) 2011 - 1,291,000 FUTURE WORKS: Pipeline - Trunk Mains for Rifle Range Res No. 2
(PC) Eulomogo Reservoir 2, (10ML) - (S) Eulomogo Reservoir 2, (10ML) - (C)
2012 - 2,211,000 FUTURE WORKS: Pipelines - Sheraton/Eulomogo (6.1km, DN 300) (PC) Pipelines - Bultje (Darling/River) (0.8km, DN 300) (PC) Pipeline - Trunk Mains for Rifle Range Res No. 2 (S) Pipeline - Trunk Mains for Rifle Range Res No. 2 (C)
2013 - 2,533,000 FUTURE WORKS: Pipelines - Sheraton/Eulomogo (6.1km, DN 300) (S) Pipelines - Sheraton/Eulomogo (6.1km, DN 300) (C) Pipelines - Bultje (Darling/River) (0.8km, DN 300) (S) Pipelines - Bultje (Darling River) (0.8km, DN 300 (C) Pipeline - Trunk Mains for Rifle Range Res No. 2 (S) Pipeline - Trunk Mains for Rifle Range Res No. 2 (C)

HUNTER WATER AUSTRALIA
R1451 July 2002 48
2014 - 565,000 FUTURE WORKS: Pipelines - Sheraton/Eulomogo (6.1km, DN 300)(S) Pipelines - Sheraton/Eulomogo (6.1km, DN 300) (C) Rifle Range Reservoir 2, (10ML) - (PC)
2015 - 971,000 FUTURE WORKS: Rifle Range Reservoir 2, (10ML) - (S) Rifle Range Reservoir 2, (10ML) - (C)
2016 - 200,000 FUTURE WORKS: Pipelines - Trunk Mains for Minore Rd, Res (PC) 2017 - 1,555,000 FUTURE WORKS: Pipeline - Trunk Mains for Minore Rd, Res (S)
Pipeline - Trunk Mains for Minore Rd, Res (C) Minore Road Reservoir, (12ML) - (PC)
2018 - 2,557,000 FUTURE WORKS: Pipeline - Trunk Mains for Minore Rd, Res (S) Pipeline - Trunk Mains for Minore Rd, Res (C) Minore Road Reservoir, (12ML) - (S) Minore Road Reservoir, (12ML) - (C) Minore Road Bulga Reservoir, (12ML) - (Access Road) (C) Minore Road Reservoir, (12ML) - (Land Matters) Augmentation of WTP (30ML/D) - Option Study (PC)
2019 - 230,000 FUTURE WORKS: Pipelines - Trunk Mains for Sappa Bulga Res (PC) Augmentation of WTP (30ML/D) - Env. Review (PC) Augmentation of WTP (30ML/D) - Documentation (PC)
2020 - 2,735,000 FUTURE WORKS: Pipeline - Trunk Mains for Sappa Bulga Res (S) Pipeline - Trunk Mains for Sappa Bulga Res (C) Sappa Bulga Reservoir, (12ML) - (PC) Augmentation of WTP (30ML/D) - Project Management (S) Augmentation of WTP (30ML/D) - Design Construction (C)
2021 - 3,707,000 FUTURE WORKS: Pipeline - Trunk Mains for Sappa Bulga Res (S) Pipeline - Trunk Mains for Sappa Bulga Res (C) Sappa Bulga Reservoir, (12ML) - (S) Sappa Bulga Reservoir, (12ML) - (C) Sappa Bulga Reservoir, (12ML) - Access Road (C) Sappa Bulga Reservoir (12ML) - (Land Matters) Augmentation of WTP (30ML/D) - Project Management (S) Augmentation of WTP (30ML/D) - Design, Construction (C)
2022 - 0 2023 - 0 2024 - 0 2025 - 0 2026 - 0 2027 - 0 2028 - 0 2029 - 0 2030 - 0 Total 28,720,818 53,288,523

HUNTER WATER AUSTRALIA
R1451 July 2002 49
Appendix D
Developer Contribution Model (Sewerage System)

HUNTER WATER AUSTRALIA
R1451 July 2002 50
This page has been left blank
HUNTER WATER AUSTRALIA
R1451 July 2002 51
Hunter Water Australia
DEVELOPER CHARGES MODEL
Dubbo Sewerage System
Year : 2001

HUNTER WATER AUSTRALIA
R1451 July 2002 52
Summary of Charges Catchment Dubbo Sewerage System 1.0 INPUT DATA YEAR OF CALCULATION 2001 DISCOUNT RATE (pa) FOR ASSETS CONSTRUCTED BEFORE 1 JANUARY 1996: 3% DISCOUNT RATE (pa) FOR ASSETS CONSTRUCTED ON OR AFTER 1 JANUARY 1996: 7% DISCOUNT RATE (pa) FOR EXPECTED NET REVENUES AND COSTS: 7% 2.0 RESULTS CAPITAL CHARGES - TREATMENT and SYSTEM (per ET)
$5,844
REDUCTION AMOUNT (per ET) $1,736
TOTAL DEVELOPER CHARGE per ET $4,107

HUNTER WATER AUSTRALIA
R1451 July 2002 53
Calculation of Capital Cost Catchment Dubbo Sewerage System YEAR OF CALCULATION 2001 Assumptions DISCOUNT RATE (pa) FOR ASSETS CONSTRUCTED BEFORE 1 JANUARY 1996: 3% DISCOUNT RATE (pa) FOR ASSETS CONSTRUCTED ON OR AFTER 1 JANUARY 1996: 7% DISCOUNT RATE (pa) FOR PROPOSED FUTURE ASSETS: 7% Existing Assets (Pre 1996) Existing Assets (Post 1996) Future Assets
Year Recoupable Capital
Expenditure
Annual ET Take-up
Year Recoupable Capital
Expenditure
Annual ET Take-up
Year Recoupable Capital
Expenditure
Annual ET Take-up
(MEERA $) (ET) $ (ET) ($) (ET) 1996 26,575,020 7123 1996 1,489,150 7123 1996 0 7123 1997 172 1997 164,970 172 1997 0 172 1998 175 1998 2,216,520 175 1998 0 175 1999 178 1999 0 178 1999 0 178 2000 181 2000 2,278,020 181 2000 0 181 2001 184 2001 0 184 2001 0 184 2002 213 2002 0 213 2002 9,153,000 213 2003 217 2003 0 217 2003 11,321,000 217 2004 220 2004 0 220 2004 4,405,000 220 2005 225 2005 0 225 2005 3,141,000 225 2006 229 2006 0 229 2006 2,421,000 229 2007 203 2007 0 203 2007 2,407,000 203 2008 207 2008 0 207 2008 697,000 207 2009 210 2009 0 210 2009 2,957,000 210 2010 213 2010 0 213 2010 957,000 213 2011 217 2011 0 217 2011 1,254,000 217 2012 221 2012 0 221 2012 1,701,000 221 2013 224 2013 0 224 2013 759,000 224 2014 228 2014 0 228 2014 1,493,000 228 2015 231 2015 0 231 2015 1,391,000 231 2016 235 2016 0 235 2016 2,580,000 235 2017 191 2017 0 191 2017 1,807,000 191 2018 193 2018 0 193 2018 1,548,000 193 2019 196 2019 0 196 2019 682,000 196 2020 198 2020 0 198 2020 2,927,000 198 2021 201 2021 0 201 2021 2,819,000 201 2022 - 2022 0 - 2022 0 - 2023 - 2023 0 - 2023 0 - 2024 - 2024 0 - 2024 0 - 2025 - 2025 0 - 2025 0 - 2026 - 2026 0 - 2026 0 - 2027 - 2027 0 - 2027 0 - 2028 - 2028 0 - 2028 0 - 2029 - 2029 0 - 2029 0 - 2030 - 2030 0 - 2030 0 - 2031 - 2031 0 - 2031 0 -
NPV Charge ($/ET)
2487 NPV Charge ($/ET)
561 NPV Charge ($/ET)
2796
TOTAL NPV CAPITAL WORKS CHARGE per ET $5,844
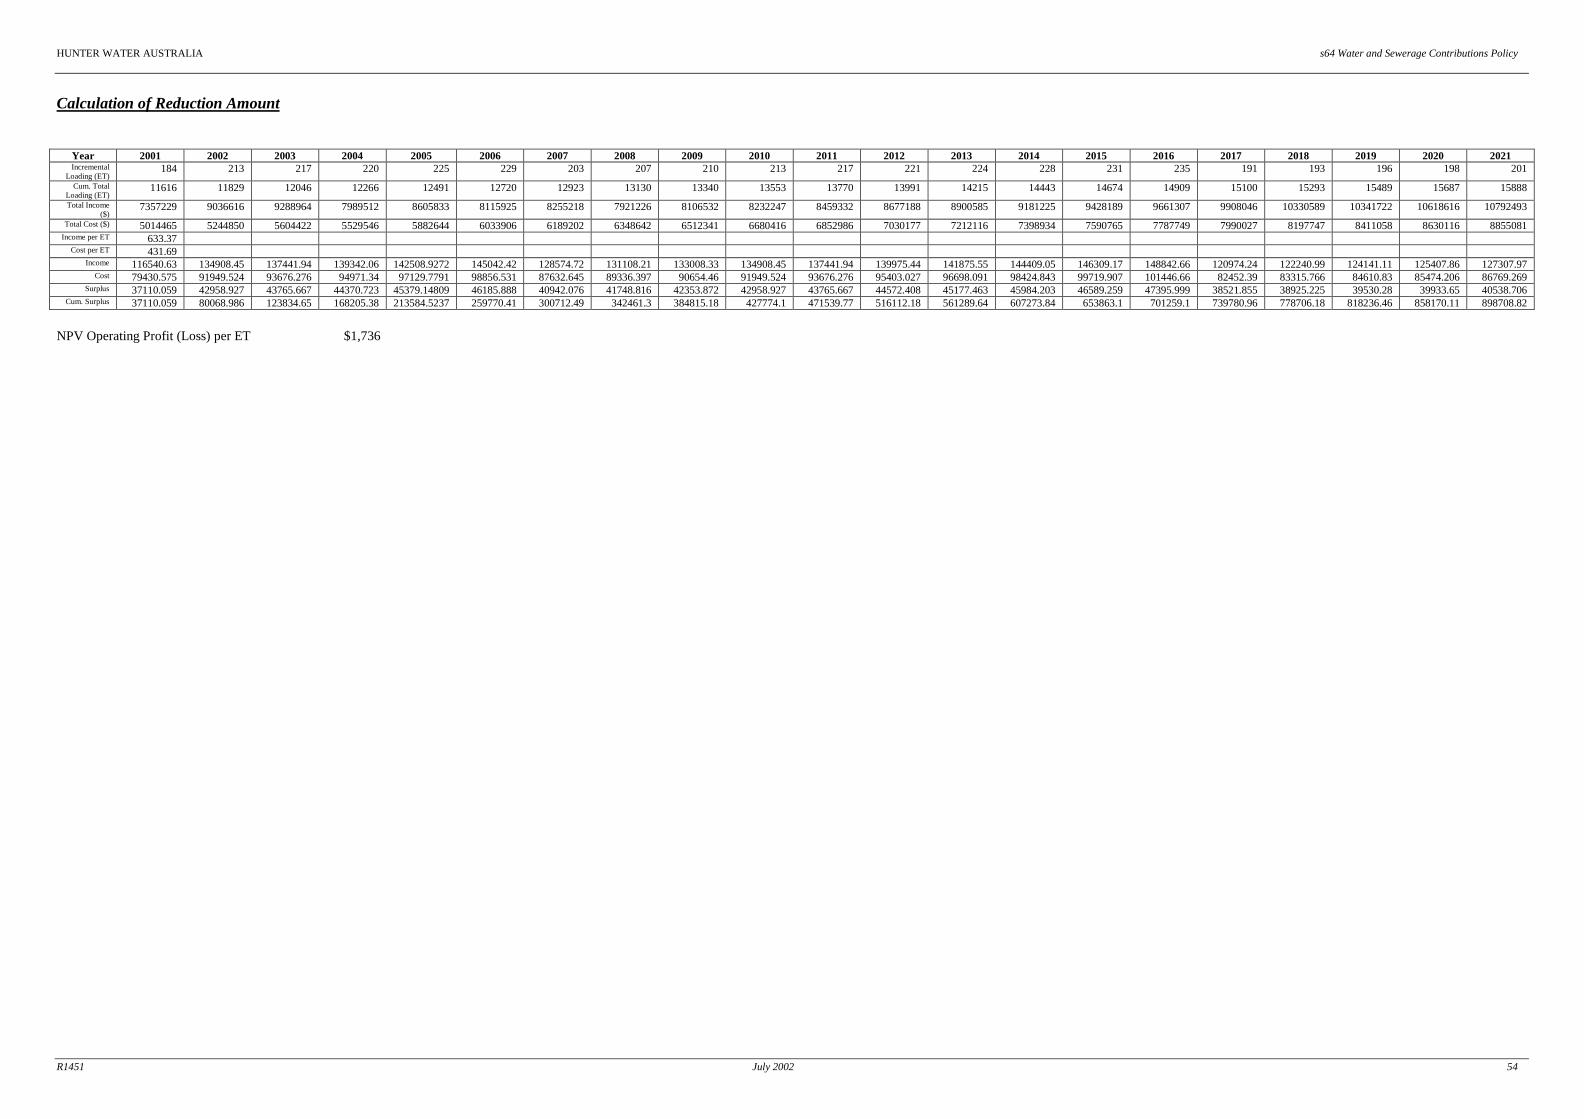
HUNTER WATER AUSTRALIA s64 Water and Sewerage Contributions Policy
R1451 July 2002 54
Calculation of Reduction Amount
Year 2001 2002 2003 2004 2005 2006 2007 2008 2009 2010 2011 2012 2013 2014 2015 2016 2017 2018 2019 2020 2021 Incremental
Loading (ET) 184 213 217 220 225 229 203 207 210 213 217 221 224 228 231 235 191 193 196 198 201
Cum. Total Loading (ET)
11616 11829 12046 12266 12491 12720 12923 13130 13340 13553 13770 13991 14215 14443 14674 14909 15100 15293 15489 15687 15888
Total Income ($)
7357229 9036616 9288964 7989512 8605833 8115925 8255218 7921226 8106532 8232247 8459332 8677188 8900585 9181225 9428189 9661307 9908046 10330589 10341722 10618616 10792493
Total Cost ($) 5014465 5244850 5604422 5529546 5882644 6033906 6189202 6348642 6512341 6680416 6852986 7030177 7212116 7398934 7590765 7787749 7990027 8197747 8411058 8630116 8855081 Income per ET 633.37
Cost per ET 431.69 Income 116540.63 134908.45 137441.94 139342.06 142508.9272 145042.42 128574.72 131108.21 133008.33 134908.45 137441.94 139975.44 141875.55 144409.05 146309.17 148842.66 120974.24 122240.99 124141.11 125407.86 127307.97
Cost 79430.575 91949.524 93676.276 94971.34 97129.7791 98856.531 87632.645 89336.397 90654.46 91949.524 93676.276 95403.027 96698.091 98424.843 99719.907 101446.66 82452.39 83315.766 84610.83 85474.206 86769.269 Surplus 37110.059 42958.927 43765.667 44370.723 45379.14809 46185.888 40942.076 41748.816 42353.872 42958.927 43765.667 44572.408 45177.463 45984.203 46589.259 47395.999 38521.855 38925.225 39530.28 39933.65 40538.706
Cum. Surplus 37110.059 80068.986 123834.65 168205.38 213584.5237 259770.41 300712.49 342461.3 384815.18 427774.1 471539.77 516112.18 561289.64 607273.84 653863.1 701259.1 739780.96 778706.18 818236.46 858170.11 898708.82
NPV Operating Profit (Loss) per ET $1,736
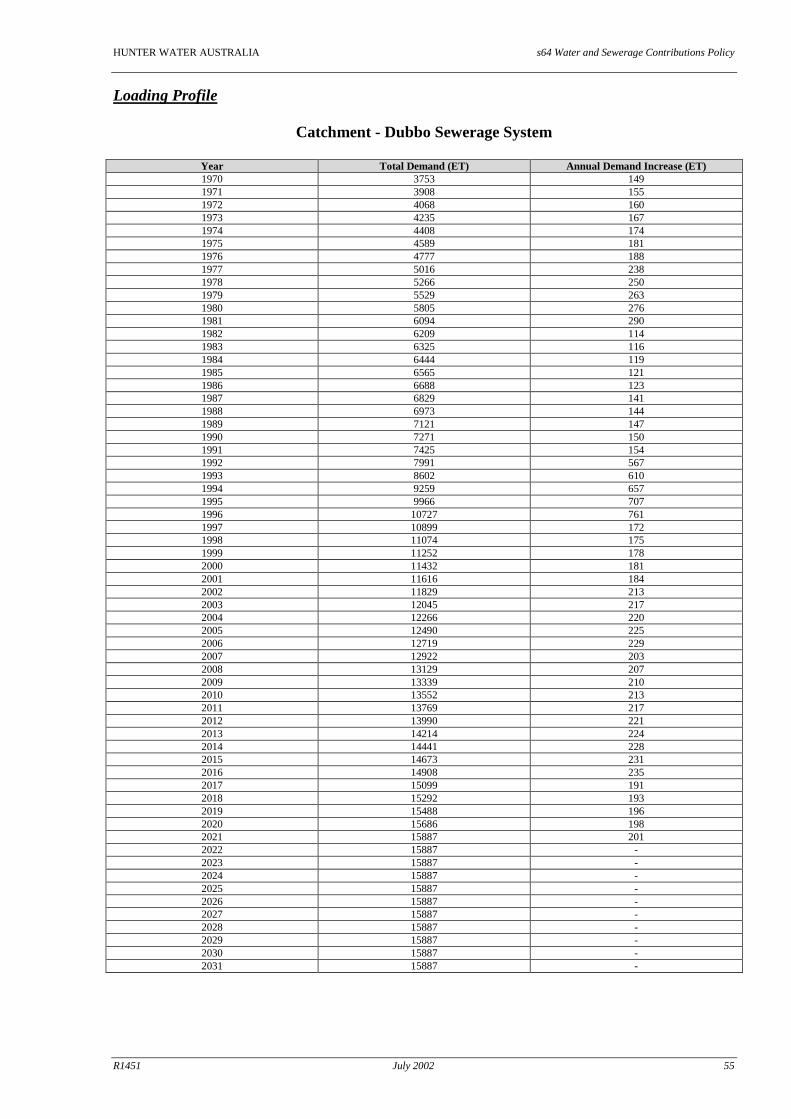
HUNTER WATER AUSTRALIA s64 Water and Sewerage Contributions Policy
R1451 July 2002 55
Loading Profile
Catchment - Dubbo Sewerage System
Year Total Demand (ET) Annual Demand Increase (ET) 1970 3753 149 1971 3908 155 1972 4068 160 1973 4235 167 1974 4408 174 1975 4589 181 1976 4777 188 1977 5016 238 1978 5266 250 1979 5529 263 1980 5805 276 1981 6094 290 1982 6209 114 1983 6325 116 1984 6444 119 1985 6565 121 1986 6688 123 1987 6829 141 1988 6973 144 1989 7121 147 1990 7271 150 1991 7425 154 1992 7991 567 1993 8602 610 1994 9259 657 1995 9966 707 1996 10727 761 1997 10899 172 1998 11074 175 1999 11252 178 2000 11432 181 2001 11616 184 2002 11829 213 2003 12045 217 2004 12266 220 2005 12490 225 2006 12719 229 2007 12922 203 2008 13129 207 2009 13339 210 2010 13552 213 2011 13769 217 2012 13990 221 2013 14214 224 2014 14441 228 2015 14673 231 2016 14908 235 2017 15099 191 2018 15292 193 2019 15488 196 2020 15686 198 2021 15887 201 2022 15887 - 2023 15887 - 2024 15887 - 2025 15887 - 2026 15887 - 2027 15887 - 2028 15887 - 2029 15887 - 2030 15887 - 2031 15887 -
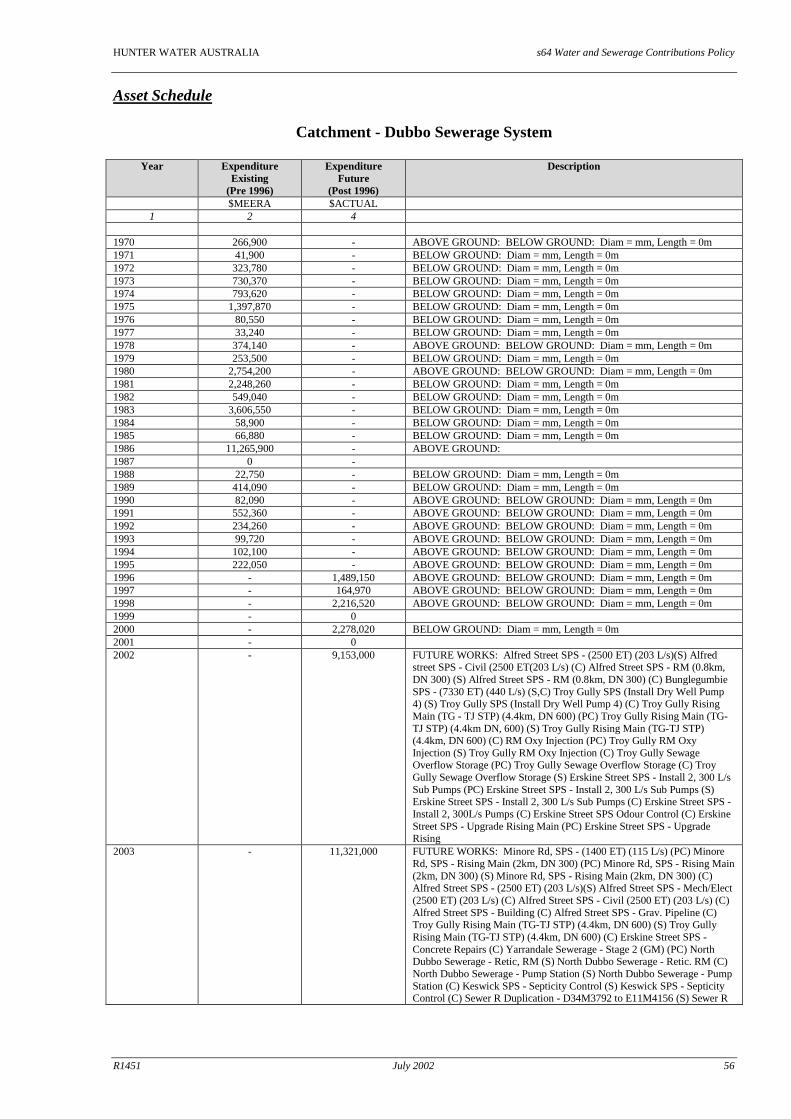
HUNTER WATER AUSTRALIA s64 Water and Sewerage Contributions Policy
R1451 July 2002 56
Asset Schedule
Catchment - Dubbo Sewerage System
Year Expenditure Existing
(Pre 1996)
Expenditure Future
(Post 1996)
Description
$MEERA $ACTUAL 1 2 4
1970 266,900 - ABOVE GROUND: BELOW GROUND: Diam = mm, Length = 0m 1971 41,900 - BELOW GROUND: Diam = mm, Length = 0m 1972 323,780 - BELOW GROUND: Diam = mm, Length = 0m 1973 730,370 - BELOW GROUND: Diam = mm, Length = 0m 1974 793,620 - BELOW GROUND: Diam = mm, Length = 0m 1975 1,397,870 - BELOW GROUND: Diam = mm, Length = 0m 1976 80,550 - BELOW GROUND: Diam = mm, Length = 0m 1977 33,240 - BELOW GROUND: Diam = mm, Length = 0m 1978 374,140 - ABOVE GROUND: BELOW GROUND: Diam = mm, Length = 0m 1979 253,500 - BELOW GROUND: Diam = mm, Length = 0m 1980 2,754,200 - ABOVE GROUND: BELOW GROUND: Diam = mm, Length = 0m 1981 2,248,260 - BELOW GROUND: Diam = mm, Length = 0m 1982 549,040 - BELOW GROUND: Diam = mm, Length = 0m 1983 3,606,550 - BELOW GROUND: Diam = mm, Length = 0m 1984 58,900 - BELOW GROUND: Diam = mm, Length = 0m 1985 66,880 - BELOW GROUND: Diam = mm, Length = 0m 1986 11,265,900 - ABOVE GROUND: 1987 0 - 1988 22,750 - BELOW GROUND: Diam = mm, Length = 0m 1989 414,090 - BELOW GROUND: Diam = mm, Length = 0m 1990 82,090 - ABOVE GROUND: BELOW GROUND: Diam = mm, Length = 0m 1991 552,360 - ABOVE GROUND: BELOW GROUND: Diam = mm, Length = 0m 1992 234,260 - ABOVE GROUND: BELOW GROUND: Diam = mm, Length = 0m 1993 99,720 - ABOVE GROUND: BELOW GROUND: Diam = mm, Length = 0m 1994 102,100 - ABOVE GROUND: BELOW GROUND: Diam = mm, Length = 0m 1995 222,050 - ABOVE GROUND: BELOW GROUND: Diam = mm, Length = 0m 1996 - 1,489,150 ABOVE GROUND: BELOW GROUND: Diam = mm, Length = 0m 1997 - 164,970 ABOVE GROUND: BELOW GROUND: Diam = mm, Length = 0m 1998 - 2,216,520 ABOVE GROUND: BELOW GROUND: Diam = mm, Length = 0m 1999 - 0 2000 - 2,278,020 BELOW GROUND: Diam = mm, Length = 0m 2001 - 0 2002 - 9,153,000 FUTURE WORKS: Alfred Street SPS - (2500 ET) (203 L/s)(S) Alfred
street SPS - Civil (2500 ET(203 L/s) (C) Alfred Street SPS - RM (0.8km, DN 300) (S) Alfred Street SPS - RM (0.8km, DN 300) (C) Bunglegumbie SPS - (7330 ET) (440 L/s) (S,C) Troy Gully SPS (Install Dry Well Pump 4) (S) Troy Gully SPS (Install Dry Well Pump 4) (C) Troy Gully Rising Main (TG - TJ STP) (4.4km, DN 600) (PC) Troy Gully Rising Main (TG-TJ STP) (4.4km DN, 600) (S) Troy Gully Rising Main (TG-TJ STP) (4.4km, DN 600) (C) RM Oxy Injection (PC) Troy Gully RM Oxy Injection (S) Troy Gully RM Oxy Injection (C) Troy Gully Sewage Overflow Storage (PC) Troy Gully Sewage Overflow Storage (C) Troy Gully Sewage Overflow Storage (S) Erskine Street SPS - Install 2, 300 L/s Sub Pumps (PC) Erskine Street SPS - Install 2, 300 L/s Sub Pumps (S) Erskine Street SPS - Install 2, 300 L/s Sub Pumps (C) Erskine Street SPS - Install 2, 300L/s Pumps (C) Erskine Street SPS Odour Control (C) Erskine Street SPS - Upgrade Rising Main (PC) Erskine Street SPS - Upgrade Rising
2003 - 11,321,000 FUTURE WORKS: Minore Rd, SPS - (1400 ET) (115 L/s) (PC) Minore Rd, SPS - Rising Main (2km, DN 300) (PC) Minore Rd, SPS - Rising Main (2km, DN 300) (S) Minore Rd, SPS - Rising Main (2km, DN 300) (C) Alfred Street SPS - (2500 ET) (203 L/s)(S) Alfred Street SPS - Mech/Elect (2500 ET) (203 L/s) (C) Alfred Street SPS - Civil (2500 ET) (203 L/s) (C) Alfred Street SPS - Building (C) Alfred Street SPS - Grav. Pipeline (C) Troy Gully Rising Main (TG-TJ STP) (4.4km, DN 600) (S) Troy Gully Rising Main (TG-TJ STP) (4.4km, DN 600) (C) Erskine Street SPS - Concrete Repairs (C) Yarrandale Sewerage - Stage 2 (GM) (PC) North Dubbo Sewerage - Retic, RM (S) North Dubbo Sewerage - Retic. RM (C) North Dubbo Sewerage - Pump Station (S) North Dubbo Sewerage - Pump Station (C) Keswick SPS - Septicity Control (S) Keswick SPS - Septicity Control (C) Sewer R Duplication - D34M3792 to E11M4156 (S) Sewer R

HUNTER WATER AUSTRALIA s64 Water and Sewerage Contributions Policy
R1451 July 2002 57
Duplication - D34M3792 to E11M4156 (C) Sewer R Duplication - E13M3584 to D34M3792 (PC) Troy Junction
2004 - 4,405,000 FUTURE WORKS: Minore Rd, SPS (1400 ET) (115 L/s) (S) Minore Rd, SPS - Mech/Elect (1400 ET (115 L/s) (C) Minore Rd, SPS - Civil (1400 ET (115 L/s) (C) Minore Rd, SPS - Building (1400 ET) (115 L/s) (C) Minore Rd, SPS - Rising Main (2km, DN 300) (S) Minore Rd, SPS - Rising Main (2km, DN 300) (C) Yarrandale Sewerage - Stage 2 (GM) (S) Yarrandale Sewerage - Stage 2 (GM) (C) Yarrandale Sewerage - Stage 3 (500 ET) (43 L/s) (PC) Keswick SPS Stage 1 - Demolish Avian PS (C) Sewer R Duplication - E13M3584 to D34M3792 (S) Sewer R Duplication - E13M3584 to D34M3792 (C) Sewer R Duplication - E41M3420 to E13M3584 (PC) Bunglegumbie STP Remediation - Env. Monitoring Troy Junction STP Automation - Upgrade Troy Junction STP - New Ideal (25000 EP) (S) Troy Junction STP - New Ideal (25000 EP) (C) South Dubbo - Tamworth St PS Gravity Main 2 (C) South Dubbo - Demolish Macquarie St PS (C) Effluent Irrig. “Greengrove” - Pivots, Pipework (S) Effluent Irrig. “Greengrove” - Pivots, Pipework (C)
2005 - 3,141,000 FUTURE WORKS: Yarrandale Sewerage - Stage 3 (500 ET) (43 L/s) (S) Yarrandale Sewerage - Stage 3 (500 ET) 43 L/s), (C) Sewer R Duplication - E41M3420 to E13M3584 (S) Sewer R Duplication - E41M3420 to E13M3584 (C) Bunglegumbie STP Remediation - Env. Monitoring Bunglegumbie STP - Demolition (PC) Troy Junction STP Automation - Upgrade South Dubbo - Tamworth St PS Gravity Main 3 (C) Wongarbon Sewerage (S) Wongarbon Sewerage - Collection (C) Wongarbon Sewerage - Treatment (C) Camp Road Sewerage - Pumps (PC) Camp Road Sewerage - RM (4.6km, DN 150) (PC) Camp Road Sewerage - Septicity Control (PC) Eumungerie Sewerage Options Study
2006 - 2,421,000 FUTURE WORKS: Bunglegumbie STP Remediation - Env. Monitoring Bunglegumbie STP - Demolition (S) Bunglegumbie STP - Demolition (C) Camp Road Sewerage - Pumps (S) Camp Road Sewerage - Pumps (C) Camp Road Sewerage - RM (4.6km, DN 150) (S) Camp Road Sewerage - RM (4.6km, DN 150) (C) Camp Road Sewerage - Septicity Control (S) Camp Road Sewerage - Septicity Control (C) Eumungerie Sewerage (PC) Ballimore Sewerage (S) Ballimore Sewerage (C)
2007 - 2,407,000 FUTURE WORKS: Bunglegumbie STP Remediation - Env. Monitoring Bunglegumbie Remediation (C) Additional Effluent Irrigation - Buy Land (C) Eumungerie Sewerage (S) Eumungerie Sewerage (C)
2008 - 697,000 FUTURE WORKS: Bunglegumbie STP Remediation - Env. Monitoring Bunglegumbie Remediation (C) West Dubbo Sewerage - Catchment C (PC)
2009 - 2,957,000 FUTURE WORKS: Cootha SPS - Upgrade (795 ET, 67 L/s) (PC) Bunglegumbie STP Remediation - Env. Monitoring Bunglegumbie Remediation (C) Additional Effluent Irrigation - Irrig Sys. (C) West Dubbo Sewerage - Catchment C (S) West Dubbo Sewerage - Catchment C (C).
2010 - 957,000 FUTURE WORKS: Cootha SPS - Upgrade (795 ET, 67 L/s) - Mech/Elect Cootha SPS - Upgrade (795 ET, 67 L/s) - Civil, Bunglegumbie STP Remediation - Env. Monitoring West Dubbo Sewerage - Catchment C (S) West Dubbo Sewerage - Catchment C (C) West Dubbo Sewerage - Catchment A (PC)
2011 - 1,254,000 FUTURE WORKS: Keswick SPS Stage 2 - RM (1.2km, DN 300) (PC) Troy Junction STP Effluent Storage Pond 3 (290ML) (PC) Bunglegumbie STP Remediation - Env. Monitoring West Dubbo Sewerage - Catchment C (S) West Dubbo Sewerage - Catchment C (C) West Dubbo Sewerage - Catchment A (S) West Dubbo Sewerage - Catchment A (C)
2012 - 1,701,000 FUTURE WORKS: Keswick SPS Stage 2 - RM (1.2km, DN 300) (S) Keswick SPS Stage 2 - RM (1.2km, DN 300) (C) Troy Junction STP Effluent Storage Pond 3 (290 ML) (S) Troy Junction STP Effluent Storage Pond 3 (290ML) (C) West Dubbo Sewerage - Catchment C (S) West Dubbo Sewerage - Catchment C (C) West Dubbo Sewerage - Catchment A (S) West Dubbo Sewerage - Catchment A (C)
2013 - 759,000 FUTURE WORKS: Keswick SPS Stage 2 - Catchment B, GM (PC) West Dubbo Sewerage - Catchment C (S) West Dubbo Sewerage - Catchment C (C) West Dubbo Sewerage - Catchment A (S) West Dubbo Sewerage - Catchment A (C)
2014 - 1,493,000 FUTURE WORKS: Keswick SPS Stage 2 - Catchment B, GM 1 (S) Keswick SPS Stage 2 - Catchment B, GM 1 (C) West Dubbo Sewerage - Catchment C (S) West Dubbo Sewerage - Catchment C (C) West Dubbo Sewerage - Catchment A (S) West Dubbo Sewerage - Catchment A (C)
2015 - 1,391,000 FUTURE WORKS: Keswick SPS Stage 2 - Catchment B, GM 2 (S) Keswick SPS Stage 2 - Catchment B, GM 2 (C) West Dubbo Sewerage - Catchment A (S) West Dubbo Sewerage - Catchment A (C)
2016 - 2,580,000 FUTURE WORKS: Additional Effluent Irrigation - Buy Land (C) West Dubbo Sewerage - Catchment A (S) West Dubbo Sewerage - Catchment A (C)
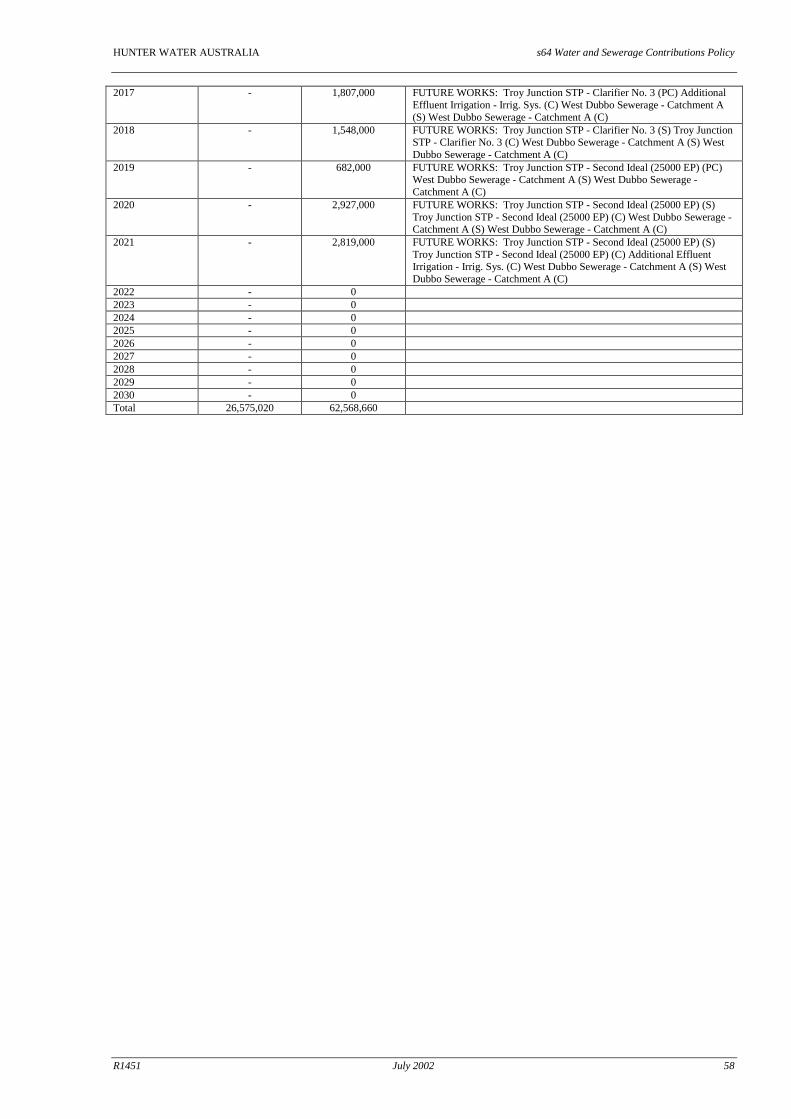
HUNTER WATER AUSTRALIA s64 Water and Sewerage Contributions Policy
R1451 July 2002 58
2017 - 1,807,000 FUTURE WORKS: Troy Junction STP - Clarifier No. 3 (PC) Additional Effluent Irrigation - Irrig. Sys. (C) West Dubbo Sewerage - Catchment A (S) West Dubbo Sewerage - Catchment A (C)
2018 - 1,548,000 FUTURE WORKS: Troy Junction STP - Clarifier No. 3 (S) Troy Junction STP - Clarifier No. 3 (C) West Dubbo Sewerage - Catchment A (S) West Dubbo Sewerage - Catchment A (C)
2019 - 682,000 FUTURE WORKS: Troy Junction STP - Second Ideal (25000 EP) (PC) West Dubbo Sewerage - Catchment A (S) West Dubbo Sewerage - Catchment A (C)
2020 - 2,927,000 FUTURE WORKS: Troy Junction STP - Second Ideal (25000 EP) (S) Troy Junction STP - Second Ideal (25000 EP) (C) West Dubbo Sewerage - Catchment A (S) West Dubbo Sewerage - Catchment A (C)
2021 - 2,819,000 FUTURE WORKS: Troy Junction STP - Second Ideal (25000 EP) (S) Troy Junction STP - Second Ideal (25000 EP) (C) Additional Effluent Irrigation - Irrig. Sys. (C) West Dubbo Sewerage - Catchment A (S) West Dubbo Sewerage - Catchment A (C)
2022 - 0 2023 - 0 2024 - 0 2025 - 0 2026 - 0 2027 - 0 2028 - 0 2029 - 0 2030 - 0 Total 26,575,020 62,568,660

HUNTER WATER AUSTRALIA s64 Water and Sewerage Contributions Policy
R1451 July 2002 59
Appendix E
ET Equivalence of Sewerage Customers

HUNTER WATER AUSTRALIA s64 Water and Sewerage Contributions Policy
R1451 July 2002 60
This page has been left blank

HUNTER WATER AUSTRALIA s64 Water and Sewerage Contributions Policy
R1451 July 2002 61
Jan 1984 Appendix B
CLASSIFICATION MODULE UNIT ADOPTED ET/UNIT STORM ALLOWANCE
(L/s) Residential (Unit Basis)
Single Cottage, Flat, Home Unit, Town House (Individual allotment thereof)
Tenement Flat
1 2/3
0.058/Unit 0.058/Module
Residential (Area Basis)
Single Dwelling Zone (30-50 persons/hectare) Medium Density Zone (60-150 persons/hectare) High Density Zone (150-250 persons/hectare) Abnormal Density Zone (250-500 persons/hectare) Intensive Density Zone (500 persons/hectare)
Gross Hectare Gross Hectare Gross Hectare Gross Hectare Gross Hectare
10 25 50 100 150
0.58/Unit 0.58/Unit 0.58/Unit 0.58/Unit 0.58/Unit
Note: Gross Hectare - total area of zone Built-up Hectare - floor area of building Net Hectare - area of land not including that set aside as public road or park

HUNTER WATER AUSTRALIA s64 Water and Sewerage Contributions Policy
R1451 July 2002 62
Jan 1984 Appendix B
CLASSIFICATION MODULE UNIT ADOPTED ET/UNIT STORM ALLOWANCE
(L/s) New Residential Hospital
Military Camp Hostel Day School Boarding School Hotel Motel Club (licensed) Public Toilets
Bed Soldier Bed Pupil Pupil Built-up Hectare Bed Occupant WC or Urinal
1 1/6 1/8 1/25 1/6 100 1/8 1/25 1/2
0.58/Module 0.58/Module 0.58/Module 0.58/Module 0.58/Module 0.058/Module 0.058/Module 0.058/Module 0.058/Module
Commercial (i) Unit Basis (ii) Area Basis
Shops etc. High Density Zone
Occupant Built-up Hectare (floor area for multi-storey)
1/25 10
0.058/Module 0.58/Net Ha
Entertainment Showground Racecourse etc Caravan Park Swimming Pool
Visitor Van lot Complex
1/100 1/2 15-25
0.58/Module 0.58/Module 0.58/Module
Industrial Multi Purpose Future use unknown Clean Dry Trades (no showers) Dirty Dry Trades (with showers)
Gross Hectare Gross Hectare Gross Hectare
30-50 2-4 4-10
0.58/Unit 0.58/Unit 0.58/Unit

HUNTER WATER AUSTRALIA s64 Water and Sewerage Contributions Policy
R1451 July 2002 63
Jan 1984 Appendix B
CLASSIFICATION MODULE UNIT ADOPTED ET/UNIT STORM ALLOWANCE
(L/s) Wet Industrial: (a) Meal Preparation
Restaurant ) Cafeteria ) Canteen ) Caterers )
Built-up Hectare 80 0.058/Module
(b) Food Manufacturer: (i) Dairy Milk
Cheese Ice-Cream
Built-up Hectare 1400 850 350
0.58/Net Hectare
(ii) Fruit and Vegetables
Cannery ) Condiments ) Sauces )
Built-up Hectare 550 0.58/Net Hectare
(iii) Meat Abattoir Rendering Tallow Gelatine and Glue Poultry Small Goods
Built-up Hectare 550 300 850 1100 550
0.58/Net Hectare
(iv) Grain Flour Milling Starch Edible Oils and Fats Cereals Bakery Biscuits and Cakes
Built-up Hectare 15 850 1100 150 15 150
0.58/Net Hectare
(v) Beverages Beer Soft Drinks and Cordials
Built-up Hectare 550 300
0.58/Net Hectare
(vi) Others Yeast Confectionery Salt
Built-up Hectare 1100 80 300
0.58/Net Hectare

HUNTER WATER AUSTRALIA s64 Water and Sewerage Contributions Policy
R1451 July 2002 64
Jan 1984 Appendix B
CLASSIFICATION MODULE UNIT ADOPTED ET/UNIT STORM ALLOWANCE
(L/s) (c) Textiles and Leather Tannery and Hides
Wool Scour Felt and Carpet Wool Dyeing and Spinning Cotton and Synthetic Dyeing and Spinning
Built-up Hectare 550 1100 300 300 550
0.58/Net Hectare
(d) Chemicals Oil Refinery Pharmaceutical Organic Liquids Resins, Polymers and Plastics Adhesives Soaps and Detergents Paint Manufacturing
Net Hectare Built-up Hectare
15 150 300 300 300 150 80
0.58/Net Hectare 0.58/Net Hectare
(e) Metal Processing Electroplating Anodising Galvanising Batteries
Built-up Hectare 300 300 300 150
0.58/Net Hectare
(f) Non-Metallic Manufacture
Paper Wood Glass Asbestos Cement
Built-up Hectare 80 80 80 40
0.58/Net Hectare
(g) Services Laundries Laboratories Film Processing
2100 550 300
Dry Industrial Clean Trade (no showers) Dirty Trade (with showers)
Employee Employee
1/25 1/10
0.58/Module 0.58/Module