· Table S2. Textural properties attributed to the different porous systems in SBA-15 and...
10
SUPPLEMENTARY INFORMATION Conformal sulfated zirconia monolayer catalysts for the one-pot synthesis of ethyl levulinate from glucose SI-1 Experimental Catalyst Preparation The primary goal of this preparation method was synthesis of uniformly coated ZrO 2 /SBA-15 materials exhibiting high dispersion and accessibility of zirconium using a layerwise deposition method to minimize growth of large crystallites. SBA- 15 was prepared the original method by Zhao et al. 1 First 10g of SBA-15 was dried at 300°C for 4 hours. Then the dried SBA-15 and 58.5g of zirconium precursor (70% zirconium propoxide in propanol, Sigma-Aldrich) were added to 300ml of dry hexane in a round bottom flask. The amount of zirconium precursor is based on the number of hydroxyl groups of SBA- 15 calculated according to thermal gravimetric analysis. So that each hydroxyl group could react with zirconium propoxide and a uniform layer would graft on SBA-15. The mixture was refluxed at 69°C overnight and then filtered and washed 3 times with hexane in order to remove any unreacted precursor. Afterwards, the material was rehydrated by adding it to 300ml deionized water under stirring for 4h to fully hydrolyze any residual propoxide groups. Finally the catalyst was filtered and dried at 80°C overnight. To get SBA-15 with 2 and 3 monolayers, the same procedure was repeated 2 and 3 times respectively. A subsequent step of sulphation with H 2 SO 4 was made by adding the ZrO 2 /SBA-15 catalysts to a 0.075M aqueous sulphuric acid solution (volume 10 ml acid per g sample) for 5h, after which the sample was filtered and dried at 80°C overnight. As a final step of preparation, the materials were calcined at 550°C for 3h. Catalyst Characterization Textural properties of the catalysts were evaluated through nitrogen adsorption-desorption isotherms recorded at 77 K using a Micromeritics TRISTAR 3000 system. Surface area values were calculated from isotherm data using the BET method and pores sizes distributions were obtained using the BJH method using a Harkins-Jura type equation specifically fitted for SBA- 15 materials. 2 Total pore volume was assumed to be that recorded at P/Po= 0.975. Structural ordering was evaluated by means of low-angle X-ray powder diffraction (XRD) on a PHILIPS X`PERT diffractometer using the Cu Kα line in the 2θ angle range from 0.6º to 5.0º with a step size of 0.02º. The presence of crystalline domains of Zr and/or Si species was evaluated by high-angle XRD analysis, in the 2θ angle range from 5.0º to 50.0º (step size of 0.04º). Structural characterization was completed by transmission electron microscopy (TEM) on a PHILIPS TECNAI-20T electronic microscope operating at 200kV, whereas particle morphology was evaluated by scanning electron microscopy (SEM) on a PHILIPS XL 30 ESEM electronic microscope. Bulk zirconium contents were determined by Inductively Coupled Plasma- Optical Emission Spectroscopy (ICP-OES) with a VARIAN VISTA AX apparatus. X-ray Photoelectron Spectroscopy (XPS) measurements were performed using a Kratos Axis HSi photoelectron spectrometer equipped with a charge neutralizer and a Mg Kα X-ray source (hν = 1253.6 eV). Spectra were recorded at normal emission using an analyzer pass energy of 20 eV and X-ray power of 225 W. ZrO 2 film thicknesses were calculated from the attenuation of the Si 2p signal using the following equation, where I is the peak intensity, is the inelastic mean free path taken to be 1.26 nm for Si 2p photoelectrons, d the film thickness and the angle of photo electron emission I = I 0 exp(-d/λcosθ) XRD patterns were recorded on a Panalytical X’pert-Pro diffractometer fitted with an X’celerator detector, using Cu Kα (1.54 Ǻ) sources with a nickel filter, calibrated against Si standards. Measurements of enthalpy of adsorption and acid sites content were carried out via flow adsorption calorimetry of NH 3 followed by Thermal Programmed Desorption (TPD) on a Setaram DSC111 system connected to gas flow and switching systems. Samples were outgassed at 450°C under flowing N 2 (10 ml min -1 ) for 2 h prior to pulse titration at 150°C. Gas flow rates were controlled by automated mass flow controllers. The sample (15-25 mg) was held on a glass frit in a vertical silica glass sample tube in the calorimeter. A steady 10 ml min -1 flow of N 2 was maintained across the sample for 3 h at 150°C to effect activation. A sequence of 10 probe gas pulses (1% of probe gas in N 2 ) were delivered to the carrier gas stream from a 2 ml sample loop for NH 3 using a two position Valco valve with an automated micro-electric actuator. Heat output associated with interaction between the probe gas and the sample was detected by DSC, and the concentration of NH 3 in the gas flow downstream of the DSC was measured with a HPR 20 Hiden MS gas analyzer via a heated capillary at 175°C. A pulse delay of 90 min for NH 3 was employed to allow reversibly adsorbed probe gas to desorb back into the pure N 2 stream and/or redistribute on the sample, and for baselines to stabilize. Electronic Supplementary Material (ESI) for ChemComm. This journal is © The Royal Society of Chemistry 2014
Transcript of · Table S2. Textural properties attributed to the different porous systems in SBA-15 and...

SUPPLEMENTARY INFORMATION
Conformal sulfated zirconia monolayer catalysts for the one-pot synthesis of ethyl levulinate from glucose
SI-1 Experimental
Catalyst Preparation
The primary goal of this preparation method was synthesis of uniformly coated ZrO2/SBA-15 materials exhibiting high dispersion and accessibility of zirconium using a layerwise deposition method to minimize growth of large crystallites. SBA-15 was prepared the original method by Zhao et al.1 First 10g of SBA-15 was dried at 300°C for 4 hours. Then the dried SBA-15 and 58.5g of zirconium precursor (70% zirconium propoxide in propanol, Sigma-Aldrich) were added to 300ml of dry hexane in a round bottom flask. The amount of zirconium precursor is based on the number of hydroxyl groups of SBA-15 calculated according to thermal gravimetric analysis. So that each hydroxyl group could react with zirconium propoxide and a uniform layer would graft on SBA-15. The mixture was refluxed at 69°C overnight and then filtered and washed 3 times with hexane in order to remove any unreacted precursor. Afterwards, the material was rehydrated by adding it to 300ml deionized water under stirring for 4h to fully hydrolyze any residual propoxide groups. Finally the catalyst was filtered and dried at 80°C overnight. To get SBA-15 with 2 and 3 monolayers, the same procedure was repeated 2 and 3 times respectively. A subsequent step of sulphation with H2SO4 was made by adding the ZrO2/SBA-15 catalysts to a 0.075M aqueous sulphuric acid solution (volume 10 ml acid per g sample) for 5h, after which the sample was filtered and dried at 80°C overnight. As a final step of preparation, the materials were calcined at 550°C for 3h.
Catalyst Characterization
Textural properties of the catalysts were evaluated through nitrogen adsorption-desorption isotherms recorded at 77 K using a Micromeritics TRISTAR 3000 system. Surface area values were calculated from isotherm data using the BET method and pores sizes distributions were obtained using the BJH method using a Harkins-Jura type equation specifically fitted for SBA-15 materials.2 Total pore volume was assumed to be that recorded at P/Po= 0.975. Structural ordering was evaluated by means of low-angle X-ray powder diffraction (XRD) on a PHILIPS X`PERT diffractometer using the Cu Kα line in the 2θ angle range from 0.6º to 5.0º with a step size of 0.02º. The presence of crystalline domains of Zr and/or Si species was evaluated by high-angle XRD analysis, in the 2θ angle range from 5.0º to 50.0º (step size of 0.04º). Structural characterization was completed by transmission electron microscopy (TEM) on a PHILIPS TECNAI-20T electronic microscope operating at 200kV, whereas particle morphology was evaluated by scanning electron microscopy (SEM) on a PHILIPS XL 30 ESEM electronic microscope. Bulk zirconium contents were determined by Inductively Coupled Plasma-Optical Emission Spectroscopy (ICP-OES) with a VARIAN VISTA AX apparatus. X-ray Photoelectron Spectroscopy (XPS) measurements were performed using a Kratos Axis HSi photoelectron spectrometer equipped with a charge neutralizer and a Mg Kα X-ray source (hν = 1253.6 eV). Spectra were recorded at normal emission using an analyzer pass energy of 20 eV and X-ray power of 225 W. ZrO2 film thicknesses were calculated from the attenuation of the Si 2p signal using the following equation, where I is the peak intensity, is the inelastic mean free path taken to be 1.26 nm for Si 2p photoelectrons, d the film thickness and the angle of photo electron emission
I = I0 exp(-d/λcosθ)
XRD patterns were recorded on a Panalytical X’pert-Pro diffractometer fitted with an X’celerator detector, using Cu Kα (1.54 Ǻ) sources with a nickel filter, calibrated against Si standards. Measurements of enthalpy of adsorption and acid sites content were carried out via flow adsorption calorimetry of NH3 followed by Thermal Programmed Desorption (TPD) on a Setaram DSC111 system connected to gas flow and switching systems. Samples were outgassed at 450°C under flowing N2 (10 ml min-1) for 2 h prior to pulse titration at 150°C. Gas flow rates were controlled by automated mass flow controllers. The sample (15-25 mg) was held on a glass frit in a vertical silica glass sample tube in the calorimeter. A steady 10 ml min-1 flow of N2 was maintained across the sample for 3 h at 150°C to effect activation. A sequence of 10 probe gas pulses (1% of probe gas in N2) were delivered to the carrier gas stream from a 2 ml sample loop for NH3 using a two position Valco valve with an automated micro-electric actuator. Heat output associated with interaction between the probe gas and the sample was detected by DSC, and the concentration of NH3 in the gas flow downstream of the DSC was measured with a HPR 20 Hiden MS gas analyzer via a heated capillary at 175°C. A pulse delay of 90 min for NH3 was employed to allow reversibly adsorbed probe gas to desorb back into the pure N2 stream and/or redistribute on the sample, and for baselines to stabilize.
Electronic Supplementary Material (ESI) for ChemComm.This journal is © The Royal Society of Chemistry 2014

Thermal Programmed Desorption consisted in increasing the temperature from 150°C to 400°C at 5°C min-1 followed by a hold of 1h at 400°C.
Ex-situ pyridine adsorption was performed by exposure of diluted samples (10wt% in KBr) to pyridine vapour in a desiccator overnight. Excess physisorbed pyridine was removed in a vacuum oven prior to sample loading in the environmental cell, with Diffuse Reflectance Infra-red Fourier Transform (DRIFT) spectra recorded at 25 °C in vacuo. The spectra were obtained using a Nicolet Avatar 370 MCT with Smart Collector accessory, mid/near infrared source and mercury cadmium telluride (MCT-A) photon detector at -196 °C (liquid N2). Then samples were then loaded into an environmental cell and subjected to additional drying under vacuum at 50 °C for 10 min prior to measurements to remove moisture physisorbed during air exposure.
Catalytic tests
Chemicals: Glucose (99.5% purity), ethyl levulinate (99% purity) and 1,4-butanediol (99% purity) were purchased from Sigma-Aldrich. Methanol (99.8% purity), ethanol (99.9% purity) and 2-propanol (99% purity) were obtained from Scharlau. Reaction procedure: Catalytic runs were carried out in liquid phase with a stirred stainless-steel 20 mL autoclave under autogenous pressure. Stirring was fixed for all the experiments at 500 rpm and the reaction time was set at 24 hours. Reaction temperature, ranging from 110 to 170 ºC, was controlled using a thermocouple immersed in the reaction mixture. Reaction media composition: 0.25g of glucose; 2/1 glucose/catalyst mass ratio; 1/100 glucose/alcohol molar ratio. The screening of the different alcohols was carried out under the optimized reaction conditions.Analysis procedure: Reaction samples were analyzed by GC (Varian 3900 gas chromatograph) using a ZB-WAX Plus column (30 m x 0.53 mm, DF=1.00 µm) and a FID detector. Reaction products detected by GC included alky levulinates but ethers coming from the intermolecular dehydration of alcohols, or other by-products were not observed under the relatively moderate reaction conditions tested in this work. The quantification of the alkyl levulinate was obtained using commercial EL to calculate the corresponding response factor. In order to calculate glucose conversion, reaction samples were also analyzed by high-pressure liquid chromatography (HPLC; Varian ProStar) using a Hi-Plex H+ column and a refractive index detector (Varian 356-LC). A flow rate of 0.6 mL/min of 0.005 M aqueous sulphuric acid was used as eluent, keeping the column temperature at 60ºC. Catalytic results are shown in terms of alkyl levulinate yield based on the chromatographic quantification of the alkyl levulinate (AL) remaining after the reaction using the following equation:
𝑌𝐴𝐿 =𝑓𝑜𝑟𝑚𝑒𝑑 𝑚𝑜𝑙 𝑜𝑓 𝐴𝑙𝑘𝑦𝑙 𝐿𝑒𝑣𝑢𝑙𝑖𝑛𝑎𝑡𝑒
𝑠𝑡𝑎𝑟𝑡𝑖𝑛𝑔 𝑚𝑜𝑙 𝑜𝑓 𝑔𝑙𝑢𝑐𝑜𝑠𝑒 𝑥 100
SI-2 Results
N2 adsorption-desorption isotherms
One of the deficiencies of zirconia-based catalysts is the low surface area which results in limited interface and therefore most of metal sites are located inside the zirconia crystals, being not accessible by the reactant molecules. Designing a zirconia-based catalyst with extended surface area is therefore of great interest. N2 adsorption-desorption experiments have been included in Fig. 1a. All of the samples exhibit type IV adsorption isotherms, typical of mesoporous materials such as SBA-15. The steep H1 hysteresis loops match with the existence of uniform pores for all of the samples, although their sizes decrease as the zirconium loadings increase. This trend suggests that the incorporation of Zr species mainly occurs onto the surface of mesopores, thus leading to the thickening of the mesopores walls and to the reduction of the void volume of the mesostructured porous system. These differences can be better observed through the analysis of the N2 adsorption-desorption isotherms by means of the t-plot method3, whose results have been included in Table S1.
Table S1. Surface area, pore volume and pore size of SBA-15 and SZ/SBA-15 samples as a function of nominal ZrO2 monolayer.
Sample Total pore volumea
/cm3·g-1Surface areab
/m2·g-1Pore sizec
/ÅSBA-15 0.964 647 75
1ML-SZ/SBA-15 0.655 437 71
2ML-SZ/SBA-15 0.474 367 63
3ML-SZ/SBA-15 0.449 321 64a Total pore volume recorded at P/P0=0.975; b Calculated by the B.E.T. method; c Calculated as the maximum of the pores sizes distribution calculated by the B.J.H.-K.J.S. method;

Table S2. Textural properties attributed to the different porous systems in SBA-15 and SZ/SBA-15 samples as a function of nominal ZrO2 monolayer.
Sample Vmicropores /cm3·g-1
Vmesopores /cm3·g-1
Vmacropores /cm3·g-1
Smicropores /m2·g-1
Smesopores /m2·g-1
Smacropores /m2·g-1
SBA-15 0.073 0.574 0.317 151 249 247
1ML-SZ/SBA-15 0.061 0.382 0.212 124 150 163
2ML-SZ/SBA-15 0.055 0.292 0.127 110 161 96
3ML-SZ/SBA-15 0.045 0.126 0.278 90 136 95
The grafting of the Zr precursor onto the surface of the SBA-15 parent material leads to a strong reduction of the mesopores volume, which is accentuated insofar as the amount of grafted zirconia onto the final material increases. This trend is accompanied by a great decreasing in the surface attributed to the mesostructured porous system, though in this case the reduction is not so progressive, mainly occurring during the grafting of the first zirconia layer. This behavior evidences that the incorporation of Zr is mainly occurring onto the surface of the mesopores. As for the microporous system, this is not greatly affected, at least not as much as the mesoporous system. Nevertheless, both the micropore volume and the surface area are diminished. With regards to the macropores and external surface, incorporating zirconia to the mesostructured material leads to an overall reduction of pore volume and surface area, unless in the case of the incorporation of the third and last zirconia layer, where a strong increase of macroporous volume is observed. The generation of this external porous system could be caused by the agglomeration of different particles, thus leading to new interparticular porosity resulting from the voids between adjacent bound particles.
X-Ray powder Diffraction (XRD)
Figure S1a presents low-angle diffraction patterns which evidence a major diffraction at 2θ ~1º, and two less intense signals at 2θ ~1.7º and 1.9º for all of the mesostructured samples. These diffractions can be attributed to the 100, 110 and 200 planar symmetries typical of a periodic mesoporous framework with a pmm6 hexagonal ordering. The X-ray diffraction patterns of the grafted samples were nearly identical to that of the support, verifying the retention of the pore structure even after grafting and sulfation.
Estimation of the pore wall thickness
Table S3 displays the unit cell sizes (a0) calculated for the different materials assuming a hexagonal array of pores with pmm6 topology. Pore wall thickness has also been calculated, in this case as the difference a0-Dp, where Dp is the mean pore size calculated from N2 adsorption-desorption experiments. Incorporating the successive layers of zirconium dioxide leads to a slight reduction in the unit cell size, probably because of the constriction of the mesoporous structure caused by the repeating calcination steps. However, the reduction of the pore size is more intense resulting in the thickening of the pore wall as the amount of Zr incorporated to the mesostructured material increases, confirming the preferential incorporation of the metal species onto the surface of the mesoporous system.
Table S3. Unit cell sizes and pore wall thickness calculated from XRD and N2 adsorption-desorption analyses.
Sample d100/Å
d110/Å
d200/Å
Unit cell size (a0)/Å
Pore size/Å
Pore wall thickness (tw)/Å
SBA-15 93.9 54.5 48.0 109.4 75 34.4
1ML-SZ/SBA-15 90.0 53.2 46.0 105.5 71 34.5
2ML-SZ/SBA-15 90.0 52.5 46.4 105.4 63 42.4
3ML-SZ/SBA-15 88.2 52.5 46.0 104.4 64 40.4

1 2 3 4 5
3ML-SZ/SBA-15 2ML-SZ/SBA-15 1ML-SZ/SBA-15 Parent SBA-15
Inte
nsity
(a.u
.)
2(degrees)
a)
10 20 30 40 50 60 70 80
Sulphated zirconia 1ML-SZ/SBA-15 2ML-SZ/SBA-15 3ML-SZ/SBA-15
Inte
nsity
(a.u
.)
2degrees)
b)
Fig S1. Powder X-ray diffractograms of SZ/SBA-15 materials as a function of nominal zirconium monolayer: a) Low-angle diffractograms, including the parent SBA-15 support; b) Wide angle diffractograms corrected by subtracting the SBA-15 support pattern, alongside a
reference bulk sulphated zirconia.
Transmission Electron Microscopy (TEM)
The TEM analysis (Fig. S2) shows the diameter of the SBA-15 channels and confirm a good dispersion of Zr species on the silica pore surface, and the avoidance of ZrO2 clusters suggesting the formation of a uniform zirconia crystal layer on the silica surface after calcinations.
Fig S2. TEM image of 2ML-SZ/SBA-15.

Atomic composition: X-ray Photoelectron Spectroscopy (XPS), Scanning Electron Microscopy (SEM) and Inductively Coupled Plasma-Optical Emission Spectroscopy (ICP-OES)
Surface zirconium and sulphur contents were determined by XPS, whereas bulk contents were obtained by EDX and ICP (in this case only for Zr). Table S4 shows the surface loading mirrors the bulk sulphur contents and exceeds it in all cases, consistent with surface specific grafting of zirconium and sulphur species over the SBA-15 framework.
Table S4. Surface and bulk compositions of SZ functionalized SBA-15 as a function of nominal zirconium monolayer.
Surface composition from XPS Bulk composition from EDX
Bulk composition from ICP-
OESSi
/ wt%O
/ wt%Zr
/ wt%S
/ wt%S/Zr atomic
ratioZr/Si
atomic ratioSi
/ wt%O
/ wt%Zr
/ wt%S
/ wt%S/Zr atomic
ratioZr/Si
atomic ratioZr
/ wt%SBA-15 38.9 61.1 - - - - - - - - - - -
1ML-SZ/SBA-15 32.3 58.0 8.3 1.4 0.7 0.1 38.3 54.7 6.0 1.0 0.5 0.05 7.12ML-SZ/SBA-15 21.0 50.1 26.6 2.4 0.4 0.4 32.3 47.0 19.0 2.0 0.3 0.18 17.43ML-SZ/SBA-15 18.2 47.1 31.7 3.0 0.3 0.5 31.7 46.3 20.4 1.7 0.2 0.20 20.4
Plots of the surface Zr:Si against bulk Zr:Si show no change on sulfation (Fig S3a), confirming there is no sintering of the ZrO2 overlayer. The surface S:Zr ratio remains above that of the bulk, again consistent with surface sulfation (Fig S3b). High resolution XP spectra for silicon, oxygen, zirconium and sulphur are shown in Fig. S4.
0 0.1 0.20
0.1
0.2
0.3
0.4
0.5
0.6SZ/SBA-15
ZrO2/SBA-15
Zr:Si Atomic ratio (EDX)
Zr:S
i Ato
mic
ratio
(XPS
)
Fig S3. Plot of surface and bulk from XPS and EDX measurements for a) Zr:Si atomic ratios for ZrO2/SBA-15 and SZ/SBA-15 series and b) S:Zr ratios for SZ/SBA-15 materials

0
500
1000
1500
2000
2500
3000
3500
95100105110
Si 2
p in
tens
ity
Binding Energy / eV
0
5
10
15
20
25
30
520525530535540
O 1
s int
ensi
ty×1
03
Binding Energy / eV
0
1000
2000
3000
4000
5000
6000
175180185190
Zr 3
d in
tens
ity
Binding Energy / eV
0
100
200
300
400
500
165170175
S 2p
inte
nsity
Binding Energy / eV
1ML-SZ/SBA-15 2ML-SZ/SBA-15 3ML-SZ/SBA-15
Fig S4. High resolution, background-subtracted silicon, oxygen, zirconium and sulphur XP spectra.
Adsorption and desorption of ammonia by microcalorimetry
NH3 adsorption calorimetry shows the different distribution of adsorption enthalpies as the SZ film increases from 1 to 3 ML (Fig. S5). 1 and 2 ML films both show a higher the initial enthalpy of adsorption which is attributed to strong Lewis sites. At 3ML these sites are diminised, with all samples exhibiting a NH3 adsorption strength associated with strong Bronsted acid sites. These results correlate to the distribution of Lewis and Brønsted acid sites from pyridine titration.
60
80
100
120
140
160
180
200
0 0.1 0.2 0.3 0.4 0.5
-ΔH
ads
/ kJ m
ol-1
Surface coverage / mmol g-1
1ML-SZ/SBA-152ML-SZ/SBA-153ML-SZ/SBA-15TPD - 1MLTPD - 2MLTPD - 3ML
0.22 mmol g-1 0.36 mmol g-1
0.40 mmol g-1
Fig S5. Adsorption enthalpies as a function of nominal zirconium monolayer.
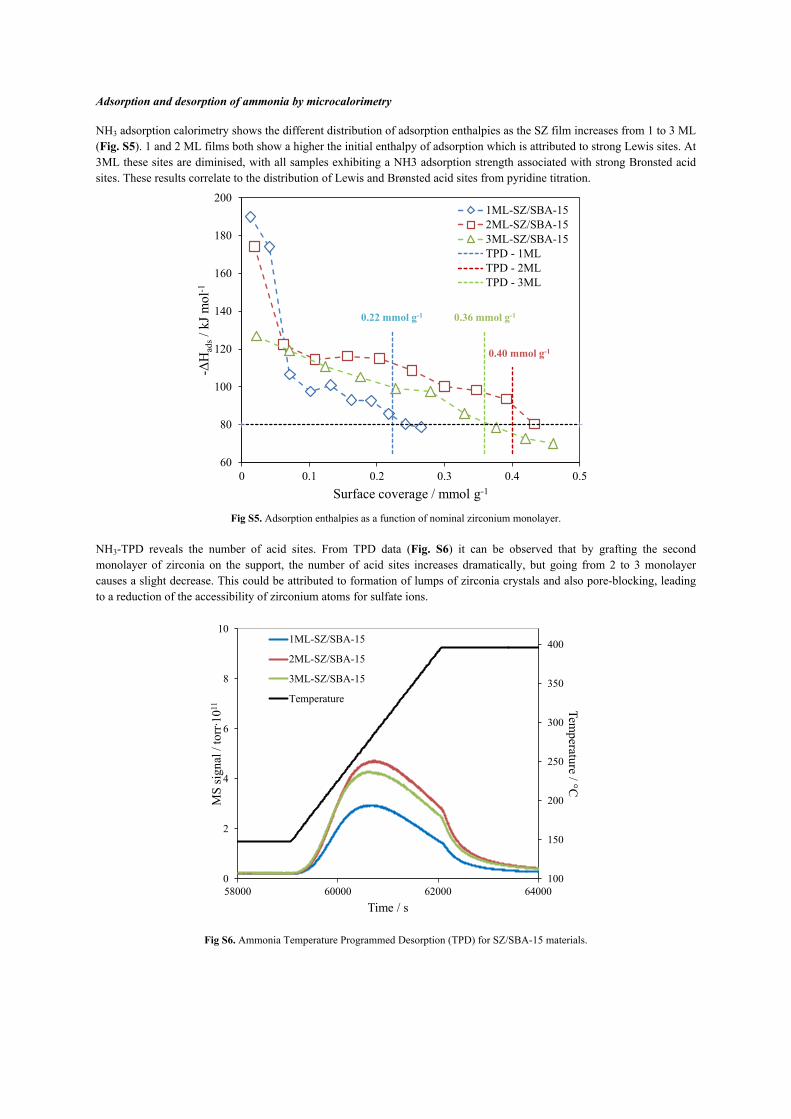
NH3-TPD reveals the number of acid sites. From TPD data (Fig. S6) it can be observed that by grafting the second monolayer of zirconia on the support, the number of acid sites increases dramatically, but going from 2 to 3 monolayer causes a slight decrease. This could be attributed to formation of lumps of zirconia crystals and also pore-blocking, leading to a reduction of the accessibility of zirconium atoms for sulfate ions.
100
150
200
250
300
350
400
0
2
4
6
8
10
58000 60000 62000 64000
Temperature / °C
MS
sign
al /
torr
∙1011
Time / s
1ML-SZ/SBA-15
2ML-SZ/SBA-15
3ML-SZ/SBA-15
Temperature
Fig S6. Ammonia Temperature Programmed Desorption (TPD) for SZ/SBA-15 materials.

Table S5. Acid site analysis from NH3 pulse titration/calorimetry and TPD
1ML-SZ/SBA-15 2ML-SZ/SBA-15 3ML-SZ/SBA-15
mmol.g-1 - ΔHads / kJ.mol-1 mmol.g-1 - ΔHads /
kJ.mol-1 mmol.g-1 - ΔHads/kJ.mol-1
Pulse 1 0.01 190.0 0.02 174.2 0.02 126.9
Pulse 2 0.04 174.0 0.06 122.4 0.07 119.4
Pulse 3 0.07 106.5 0.11 114.6 0.12 110.6
Pulse 4 0.10 97.5 0.16 116.3 0.18 105.2
Pulse 5 0.13 100.9 0.20 114.8 0.23 99.0
Pulse 6 0.16 92.9 0.25 108.8 0.28 97.6
Pulse 7 0.19 92.5 0.30 100.1 0.33 85.9
Pulse 8 0.22 85.8 0.35 98.3 0.38 78.6
Pulse 9 0.24 80.2 0.39 93.5 0.42 72.7
Pulse 10 0.27 78.7 0.43 80.3 0.46 69.9
Total acid site loadingfrom calorimetry / mmol g-1 0.24 0.43 0.37
Total acid site loadingfrom TPD / mmol g-1 0.22 0.40 0.36
Infrared pyridine titration (FTIR-Pyridine)
Infrared spectroscopic studies of pyridine adsorption on solid surfaces make possible to distinguish between Brønsted (1542 cm-1) and Lewis acid sites (1447 cm-1) (Fig. S7).3
14001450150015501600
Wavenumber / cm-1
3ML-SZ/SBA-15
2ML-SZ/SBA-15
1ML-SZ/SBA-15
Lewis1447 cm-1
Brønsted1542 cm-1
Fig S7. Brønsted and Lewis acid sites of SZ/SBA-15 as a function of nominal zirconium monolayer.

Catalyst reusability and alternative substrates
1 2 30
5
10
15
20
25
30
Ethy
l lev
ulin
ate
yiel
d (m
ol%
)
RUN
Fig S8. Reutilization assays. Catalyst 2ML-SZ/SBA-15. 140 ºC, 24 h, 1
:100 glucose:ethanol molar ratio.
0
10
20
30
40
50
60
70
Fruct 4h
Fruct24 h
Gluc 4h
Gluc 24h
Yiel
d (m
ol%
)
EL
EMF
HMF
Fig. S9. Direct transformation of glucose or fructose into ethyl levulinate at 130 °C over 2 ML grafted SZ/SBA-15. Reaction conditions: 24 h; 0.25 g of glucose; 4:1 glucose:catalyst mass ratio; 1:100 glucose:EtOH molar ratio.

Table S6. Influence of reactant on EL yield
Reaction substrate
Temp.(ºC)
Substrate/Cat(mass ratio)
Time(h)
Yield to EL(mol%)
Yield to EMF(mol%)
Yield to HMF(mol%)
Glucose 140 2:1 24 24.2 0.0 0.0Fructose 140 2:1 24 33.7 0.0 0.0
HMF 140 2:1 24 20.8 0.0 0.0Reaction conditions: 2ML-SZ-SBA-15 catalyst, 0.25 g of substrate; 1:100 substrate:EtOH molar ratio.
Table S7. Impact of ZrO2 Lewis acid co-catalyst addition
Reaction substrate
Temp.(ºC)
Glucose/Cat(mass ratio)
Time(h)
Yield to EL(mol%)
Yield to EMF(mol%)
Yield to HMF(mol%)
Glucose 140 2:1 24 30.7 0.0 0.0Reaction conditions: 2ML-SZ-SBA-15 catalyst, ZrO2 co-catalyst; 1/1 catalyst/co-catalyst mass ratio; 0.25g of glucose; 1/100 glucose/EtOH molar ratio.
References:
1. D. Zhao, J. Feng, Q. Huo, N. Melosh, G. H. Fredrickson, B. F. Chmelka, G. D. Stucky, Science, 1998, 279, 548-552.
2. R. van Grieken, G. Calleja, G.D. Stucky, J.A. Melero, R.A. García, J. Iglesias, Langmuir, 2003, 19, 3966-3973.3. C. K. Krishnan, T. Hayashi, M. Ogura, Advanced Materials, 2008, 20, 2131–2136.