S1600 #2 - Data Presentation #1 · column = measurement or variable CLASS DATA EXAMPLE: there are...
34
S1600 #2 Data Presentation #1 January 14, 2016
-
Upload
nguyenhanh -
Category
Documents
-
view
223 -
download
1
Transcript of S1600 #2 - Data Presentation #1 · column = measurement or variable CLASS DATA EXAMPLE: there are...

S1600 #2Data Presentation #1
January 14, 2016
Data Presentation #1
Outline
1 Data Presentation #1Statistics and DataVariable TypesSummarizing Categorical Data
(WMU) S1600 #2 S1600, Lecture 2 2 / 14

Data Presentation #1
Statistics and Data
StatisticsBroader sense: collection of techniques/procedures for analyzingdata, i.e., Statistics = Data AnalysisNarrower sense: statistics = numbers derived from data
Data = table/spreadsheet like collection of measurements madeon a number of subjects
row = subject or case or observationcolumn = measurement or variableCLASS DATA EXAMPLE: there are 10 subjects (students) and sixvariables: Sex, (Class) Level, GPA, Hours Taken, Transport, andSleep Hours Last Night. Note: the column ‘Student’ is forobservation labels.
(WMU) S1600 #2 S1600, Lecture 2 3 / 14

Data Presentation #1
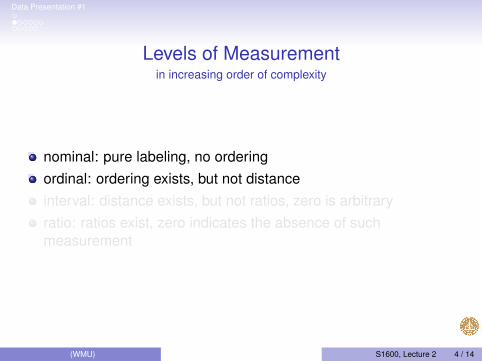
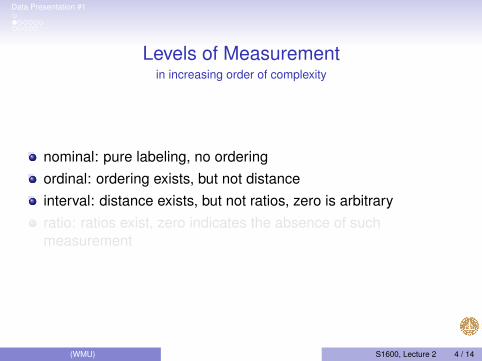
Levels of Measurementin increasing order of complexity
nominal: pure labeling, no orderingordinal: ordering exists, but not distanceinterval: distance exists, but not ratios, zero is arbitraryratio: ratios exist, zero indicates the absence of suchmeasurement
(WMU) S1600 #2 S1600, Lecture 2 4 / 14

Data Presentation #1
Levels of Measurementin increasing order of complexity
nominal: pure labeling, no orderingordinal: ordering exists, but not distanceinterval: distance exists, but not ratios, zero is arbitraryratio: ratios exist, zero indicates the absence of suchmeasurement
(WMU) S1600 #2 S1600, Lecture 2 4 / 14

Data Presentation #1
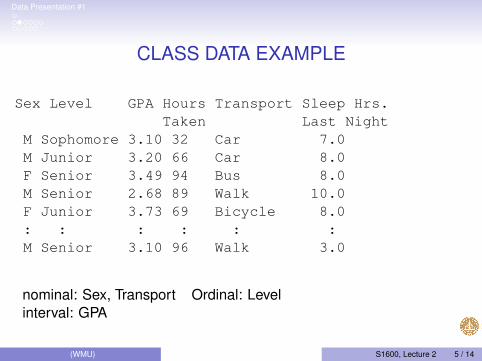
CLASS DATA EXAMPLE
Sex Level GPA Hours Transport Sleep Hrs.Taken Last Night
M Sophomore 3.10 32 Car 7.0M Junior 3.20 66 Car 8.0F Senior 3.49 94 Bus 8.0M Senior 2.68 89 Walk 10.0F Junior 3.73 69 Bicycle 8.0: : : : : :M Senior 3.10 96 Walk 3.0
nominal: Sex, Transport Ordinal: Levelinterval: GPA ratio: Hours Taken, Sleep Hrs. Last Night
(WMU) S1600 #2 S1600, Lecture 2 5 / 14

Data Presentation #1
CLASS DATA EXAMPLE
Sex Level GPA Hours Transport Sleep Hrs.Taken Last Night
M Sophomore 3.10 32 Car 7.0M Junior 3.20 66 Car 8.0F Senior 3.49 94 Bus 8.0M Senior 2.68 89 Walk 10.0F Junior 3.73 69 Bicycle 8.0: : : : : :M Senior 3.10 96 Walk 3.0
nominal: Sex, Transport
Ordinal: Levelinterval: GPA ratio: Hours Taken, Sleep Hrs. Last Night
(WMU) S1600 #2 S1600, Lecture 2 5 / 14

Data Presentation #1
CLASS DATA EXAMPLE
Sex Level GPA Hours Transport Sleep Hrs.Taken Last Night
M Sophomore 3.10 32 Car 7.0M Junior 3.20 66 Car 8.0F Senior 3.49 94 Bus 8.0M Senior 2.68 89 Walk 10.0F Junior 3.73 69 Bicycle 8.0: : : : : :M Senior 3.10 96 Walk 3.0
nominal: Sex, Transport Ordinal: Level
interval: GPA ratio: Hours Taken, Sleep Hrs. Last Night
(WMU) S1600 #2 S1600, Lecture 2 5 / 14
Data Presentation #1
CLASS DATA EXAMPLE
Sex Level GPA Hours Transport Sleep Hrs.Taken Last Night
M Sophomore 3.10 32 Car 7.0M Junior 3.20 66 Car 8.0F Senior 3.49 94 Bus 8.0M Senior 2.68 89 Walk 10.0F Junior 3.73 69 Bicycle 8.0: : : : : :M Senior 3.10 96 Walk 3.0
nominal: Sex, Transport Ordinal: Levelinterval: GPA
ratio: Hours Taken, Sleep Hrs. Last Night
(WMU) S1600 #2 S1600, Lecture 2 5 / 14

Data Presentation #1
CLASS DATA EXAMPLE
Sex Level GPA Hours Transport Sleep Hrs.Taken Last Night
M Sophomore 3.10 32 Car 7.0M Junior 3.20 66 Car 8.0F Senior 3.49 94 Bus 8.0M Senior 2.68 89 Walk 10.0F Junior 3.73 69 Bicycle 8.0: : : : : :M Senior 3.10 96 Walk 3.0
nominal: Sex, Transport Ordinal: Levelinterval: GPA ratio: Hours Taken, Sleep Hrs. Last Night
(WMU) S1600 #2 S1600, Lecture 2 5 / 14

Data Presentation #1
Numerical Versus Categorical Variables
Categorical: nominal & ordinalQuantitative (or numerical): interval & ratio
Categorical 6= non-numerical. E.g., SSN
(WMU) S1600 #2 S1600, Lecture 2 6 / 14
Data Presentation #1
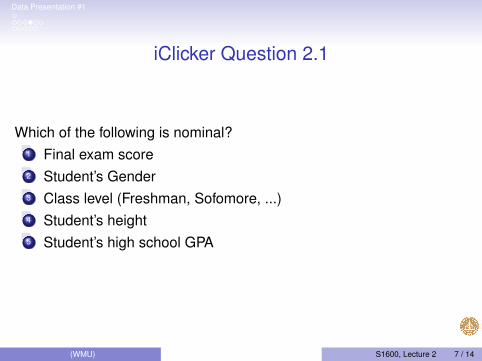
iClicker Question 2.1
Which of the following is nominal?1 Final exam score2 Student’s Gender3 Class level (Freshman, Sofomore, ...)4 Student’s height5 Student’s high school GPA
(WMU) S1600 #2 S1600, Lecture 2 7 / 14
Data Presentation #1
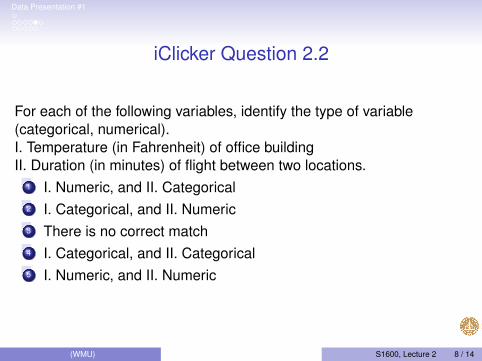
iClicker Question 2.2
For each of the following variables, identify the type of variable(categorical, numerical).I. Temperature (in Fahrenheit) of office buildingII. Duration (in minutes) of flight between two locations.
1 I. Numeric, and II. Categorical2 I. Categorical, and II. Numeric3 There is no correct match4 I. Categorical, and II. Categorical5 I. Numeric, and II. Numeric
(WMU) S1600 #2 S1600, Lecture 2 8 / 14
Data Presentation #1
Dependent Versus Independent Variablesterms used in cause-and-effect studies
independent variable: a probable causedependent variable: outcome being affected or caused
For the vaccine-autism study, the amount of mercury in thepreservative in vaccine is the independent variable, whereas the 42measures of brain function are dependent variables.Note: Likert items & Likert scale.
(WMU) S1600 #2 S1600, Lecture 2 9 / 14
Data Presentation #1
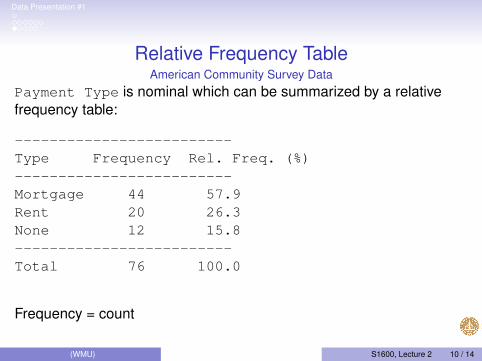
Relative Frequency TableAmerican Community Survey Data
Payment Type is nominal which can be summarized by a relativefrequency table:
-------------------------Type Frequency Rel. Freq. (%)-------------------------Mortgage 44 57.9
= (44/76) × 100%
Rent 20 26.3None 12 15.8-------------------------Total 76 100.0
Frequency = count
Rel. Freq.(%) = (Frequency / Total) × 100%
(WMU) S1600 #2 S1600, Lecture 2 10 / 14

Data Presentation #1
Relative Frequency TableAmerican Community Survey Data
Payment Type is nominal which can be summarized by a relativefrequency table:
-------------------------Type Frequency Rel. Freq. (%)-------------------------Mortgage 44 57.9 = (44/76) × 100%Rent 20 26.3None 12 15.8-------------------------Total 76 100.0
Frequency = countRel. Freq.(%) = (Frequency / Total) × 100%
(WMU) S1600 #2 S1600, Lecture 2 10 / 14

Data Presentation #1
Bar Charta plot of frequencies/relative frequencies
bar height = frequency (or rel. freq)
Mortgage Rent None
Monthly Payment Type
Fre
quen
cy
010
2030
40
Rel
. Fre
q. (
%)
015
3045
60(WMU) S1600 #2 S1600, Lecture 2 11 / 14
Data Presentation #1
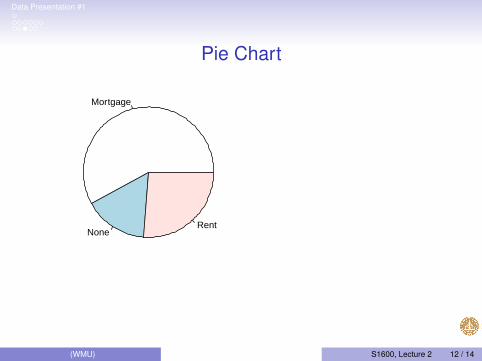
Pie Chart
Mortgage
NoneRent
a bad graphical tool
(WMU) S1600 #2 S1600, Lecture 2 12 / 14

Data Presentation #1
Pie Chart
Mortgage
NoneRent
Mortgage
NoneRent
57.9%
26.3%15.8%
a bad graphical tool
(WMU) S1600 #2 S1600, Lecture 2 12 / 14

Data Presentation #1
Pie Chart
Mortgage
NoneRent
Mortgage
NoneRent
57.9%
26.3%15.8%
a bad graphical tool
(WMU) S1600 #2 S1600, Lecture 2 12 / 14

Data Presentation #1
Pie Chart, continued
A
B
C
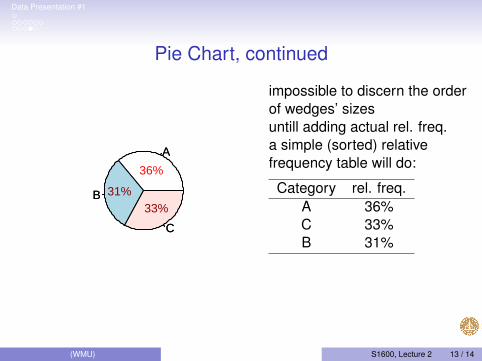
impossible to discern the orderof wedges’ sizes
untill adding actual rel. freq.a simple (sorted) relativefrequency table will do:
Category rel. freq.A 36%C 33%B 31%
(WMU) S1600 #2 S1600, Lecture 2 13 / 14

Data Presentation #1
Pie Chart, continued
A
B
C
A
B
C
36%
33%31%
impossible to discern the orderof wedges’ sizesuntill adding actual rel. freq.
a simple (sorted) relativefrequency table will do:
Category rel. freq.A 36%C 33%B 31%
(WMU) S1600 #2 S1600, Lecture 2 13 / 14
Data Presentation #1
Pie Chart, continued
A
B
C
A
B
C
36%
33%31%
impossible to discern the orderof wedges’ sizesuntill adding actual rel. freq.a simple (sorted) relativefrequency table will do:
Category rel. freq.A 36%C 33%B 31%
(WMU) S1600 #2 S1600, Lecture 2 13 / 14
Data Presentation #1
iClicker Question 2.3
In a frequency/relative frequency table, the total of the relativefrequencies is
1 50%2 75%3 100%4 150%5 Cannot determine
(WMU) S1600 #2 S1600, Lecture 2 14 / 14