S. White, LBS 17 May 2010 1 Van Der Meer Scans: Preliminary Observations.
14
S. White, LBS 17 May 2010 1 Van Der Meer Scans: Preliminary Observations
-
Upload
eleanor-claribel-shelton -
Category
Documents
-
view
216 -
download
2
Transcript of S. White, LBS 17 May 2010 1 Van Der Meer Scans: Preliminary Observations.

S. White, LBS 17 May 2010S. White, LBS 17 May 2010
1
Van Der Meer Scans:Preliminary Observations

The Van Der Meer MethodThe Van Der Meer Method
2
The effective overlap area can be determined by scans in separation:
• Perfect Gauss :
• Double Gauss:
)(2
exp)(22
21
2
uu
uuF
22
2
221
2
1 2exp
2exp)(
uu
uu
uA
uAuF
),(),( 0 yxFLyxL )0,0(
),0()0,(
F
ydyFxdxFAeff
eff
b
A
fnNNL 21
0 yxeffA effeff2
22
21eff uuu
uu
uuuuu AA
AA
21
2211eff

Intensity and LifetimeIntensity and Lifetime
3
• Intensity and lifetime over thefill 1089:
Þ Intensity very stable, lifetimeof several hundred hours.
Þ Scan ~20 minutes. Intensityvariations of the order of 0.1%over the duration of the scan.
Þ Luminosity lifetime clearly dominated by emittance blow-up.
Þ Absolute error on the intensitymeasurement: see talk by J. J. Gras.

EmittanceEmittance
4
VDMVDM
Þ Emittance blow up during the scan (left) : the effective beam size (right) measured during the scan is also affected.Þ The duration of a scan is about 20 minutes: the growth of the effective beam size duringone scan is ~1% is the worst case: full calibration 1-2%.Þ Looking at the trend over the fill there could be a small blow-up due to the scan itself.
Þ If significant this effect has to be added to the systematics. A possible solution would be to scan faster less points / shorter steps.
Effect on the RatesEffect on the Rates
5
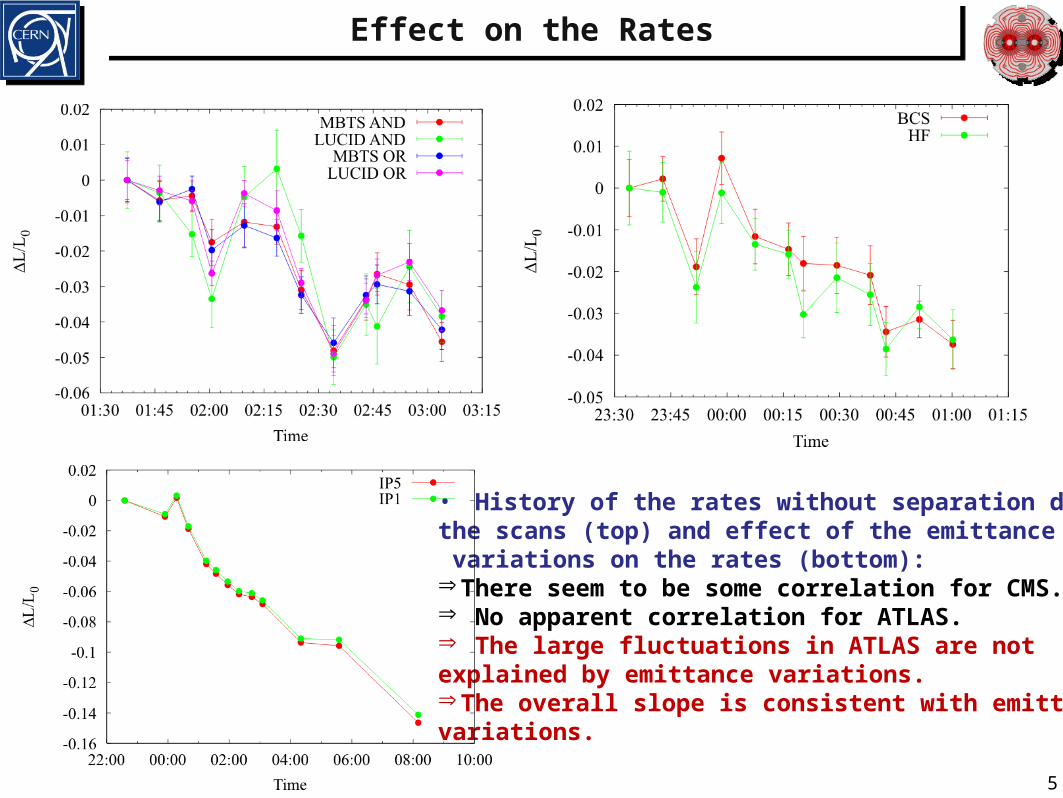
• History of the rates without separation duringthe scans (top) and effect of the emittance variations on the rates (bottom):Þ There seem to be some correlation for CMS.Þ No apparent correlation for ATLAS.Þ The large fluctuations in ATLAS are not explained by emittance variations.Þ The overall slope is consistent with emittance variations.

Hysteresis check - CMSHysteresis check - CMS
6
• For each plane scan in opposite direction to check for consistency and hysteresis: if hysteresisis relevant the overlap profile should be shifted.
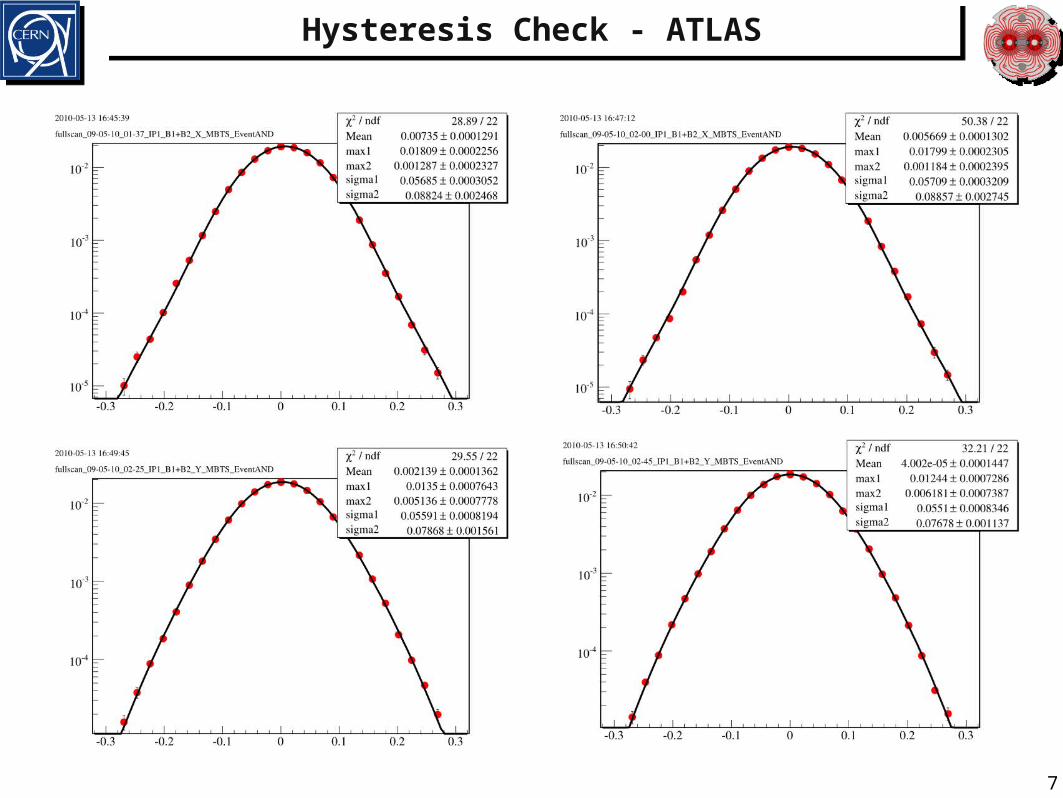
Hysteresis Check - ATLASHysteresis Check - ATLAS
7
Hysteresis Check - SummaryHysteresis Check - Summary
8
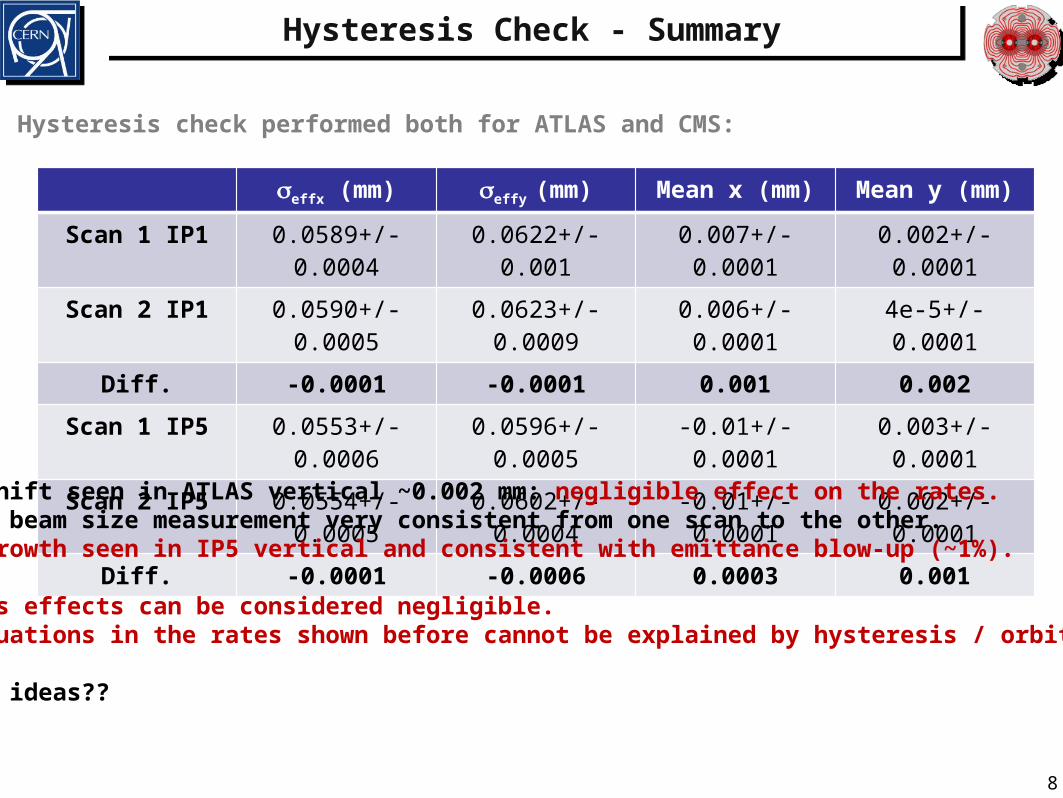
seffx (mm) seffy (mm) Mean x (mm) Mean y (mm)
Scan 1 IP1 0.0589+/-0.0004 0.0622+/-0.001 0.007+/-0.0001 0.002+/-0.0001
Scan 2 IP1 0.0590+/-0.0005 0.0623+/-0.0009 0.006+/-0.0001 4e-5+/-0.0001
Diff. -0.0001 -0.0001 0.001 0.002
Scan 1 IP5 0.0553+/-0.0006 0.0596+/-0.0005 -0.01+/-0.0001 0.003+/-0.0001
Scan 2 IP5 0.0554+/-0.0005 0.0602+/-0.0004 -0.01+/-0.0001 0.002+/-0.0001
Diff. -0.0001 -0.0006 0.0003 0.001
• Hysteresis check performed both for ATLAS and CMS:
Þ Largest shift seen in ATLAS vertical ~0.002 mm: negligible effect on the rates.Þ Effective beam size measurement very consistent from one scan to the other.Þ Largest growth seen in IP5 vertical and consistent with emittance blow-up (~1%).
Þ Hysteresis effects can be considered negligible.Þ The fluctuations in the rates shown before cannot be explained by hysteresis / orbit drifts.
Þ Any other ideas??

Comparison between ATLAS and CMSComparison between ATLAS and CMS
9
• ATLAS and CMS see the same bunch colliding and should get the same luminosity, unless the b* are different.
Horizontal B1 Vertical B1 Horizontal B2 Vertical B2
IP1 b* (m) 2.08+/-32 2.18+/-0.1 1.89+/-0.13 2.03+/-0.07
IP5 b* (m) 2.18+/-0.22 1.83+/-0.39 1.85+/-0.15 2.02+/-0.15
Þ According to b* measurement CMS should have ~3% more luminosity than ATLAS. Large error bars.
• Use values from previous table to compute the effective area:
Þ ATLAS : Aeff = 0.0230 +/- 0.0004 mm2
Þ CMS : Aeff = 0.0208 +/- 0.0002 mm2
Þ About 10% difference between the two. Correcting for emittance blow-up between the twomeasurements by 2% in horizontal and 4% in vertical we get a difference of 4%.Þ Very good agreement with b* measurements.
• Preliminary absolute luminosity (only statistical error shown):
Þ ATLAS : L = (1.9 +/- 0.032) x1028 cm-2 s-1 Þ CMS : L = (2.12 +/- 0.02) x1028 cm-2 s-1

Fill to Fill Consistency (Estimates)Fill to Fill Consistency (Estimates)
10
.
210
N
A
fnNNL
eff
b Should be constant regardless of beam conditions
• Data for two fills in ATLAS and CMS. Compare the ratio Nmax / L0.
• ATLAS: sending calibrated values, should get 1 if MC is right.Þ Fill 1059: Nmax / L0 = (0.98 +/- 0.027) x 10-30
Þ Fill 1089: Nmax / L0 = (1 +/- 0.016) x10-30
Þ Consistent within error bars. Seems like we are right on spot.
• CMS: in principle sending rates should get the effective cross sectionÞ Fill 1058: Nmax / L0 = (1.14 +/- 0.023) x 10-25
Þ Fill 1089: Nmax / L0 = (1.04 +/- 0.01) x 10-25
Þ 10% difference not explained by statistical errors bars. Fill 1089 error of about 2% fromemittance. Fill 1058 parasitic collisions, error on the rates???Þ Is this number consistent with a cross section??? (seems large).Þ Tried to look at HF but max rates go from ~650 to ~4150. Not consistent with beam parameters.Þ Beam size from HF smaller for fill 1058 : NmaxBCS / L0HF = (1.08 +/- 0.018) x 10-25

BRAN Data – IP5BRAN Data – IP5
11
• Two sets of BRANS present in IP1 and IP5 (BRANA, BRANP):Þ BRANA very noisy – low efficiency : only look at BRANP for now.

BRAN Data – IP1BRAN Data – IP1
12
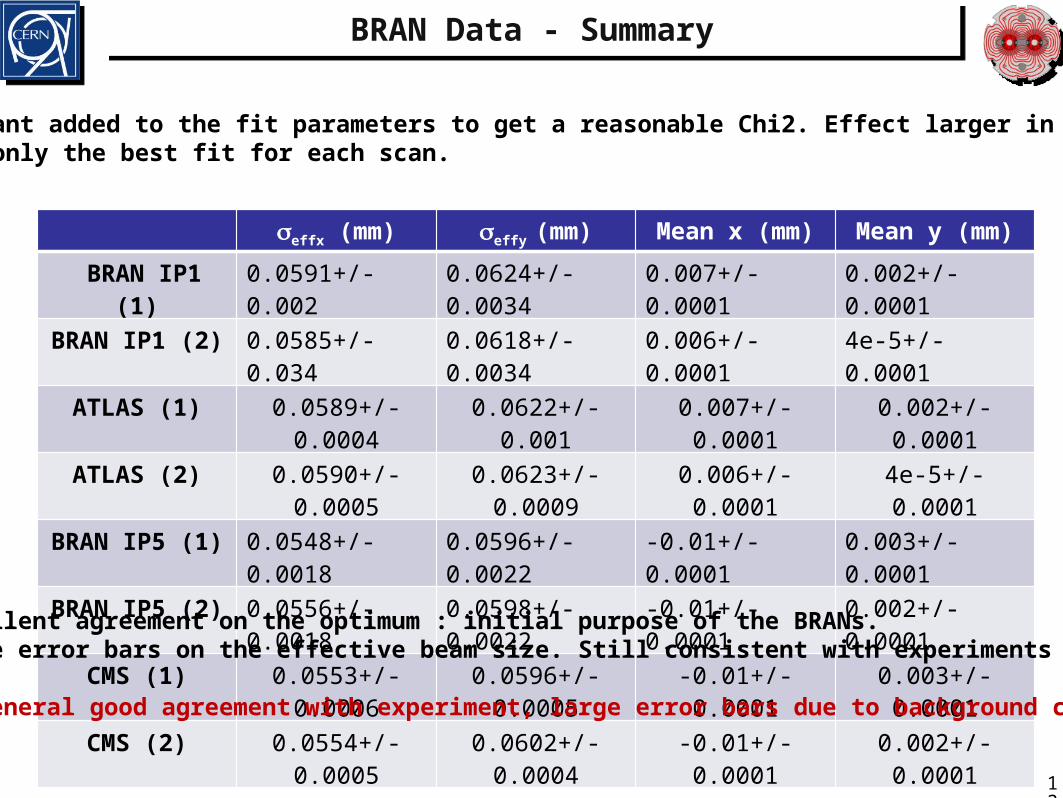
BRAN Data - SummaryBRAN Data - Summary
13
• Constant added to the fit parameters to get a reasonable Chi2. Effect larger in IP5.• Take only the best fit for each scan.
seffx (mm) seffy (mm) Mean x (mm) Mean y (mm)
BRAN IP1 (1) 0.0591+/-0.002 0.0624+/-0.0034 0.007+/-0.0001 0.002+/-0.0001
BRAN IP1 (2) 0.0585+/-0.034 0.0618+/-0.0034 0.006+/-0.0001 4e-5+/-0.0001
ATLAS (1) 0.0589+/-0.0004 0.0622+/-0.001 0.007+/-0.0001 0.002+/-0.0001
ATLAS (2) 0.0590+/-0.0005 0.0623+/-0.0009 0.006+/-0.0001 4e-5+/-0.0001
BRAN IP5 (1) 0.0548+/-0.0018 0.0596+/-0.0022 -0.01+/-0.0001 0.003+/-0.0001
BRAN IP5 (2) 0.0556+/-0.0018 0.0598+/-0.0022 -0.01+/-0.0001 0.002+/-0.0001
CMS (1) 0.0553+/-0.0006 0.0596+/-0.0005 -0.01+/-0.0001 0.003+/-0.0001
CMS (2) 0.0554+/-0.0005 0.0602+/-0.0004 -0.01+/-0.0001 0.002+/-0.0001
• Excellent agreement on the optimum : initial purpose of the BRANs.• Large error bars on the effective beam size. Still consistent with experiments data.
Þ In general good agreement with experiment, large error bars due to background component.
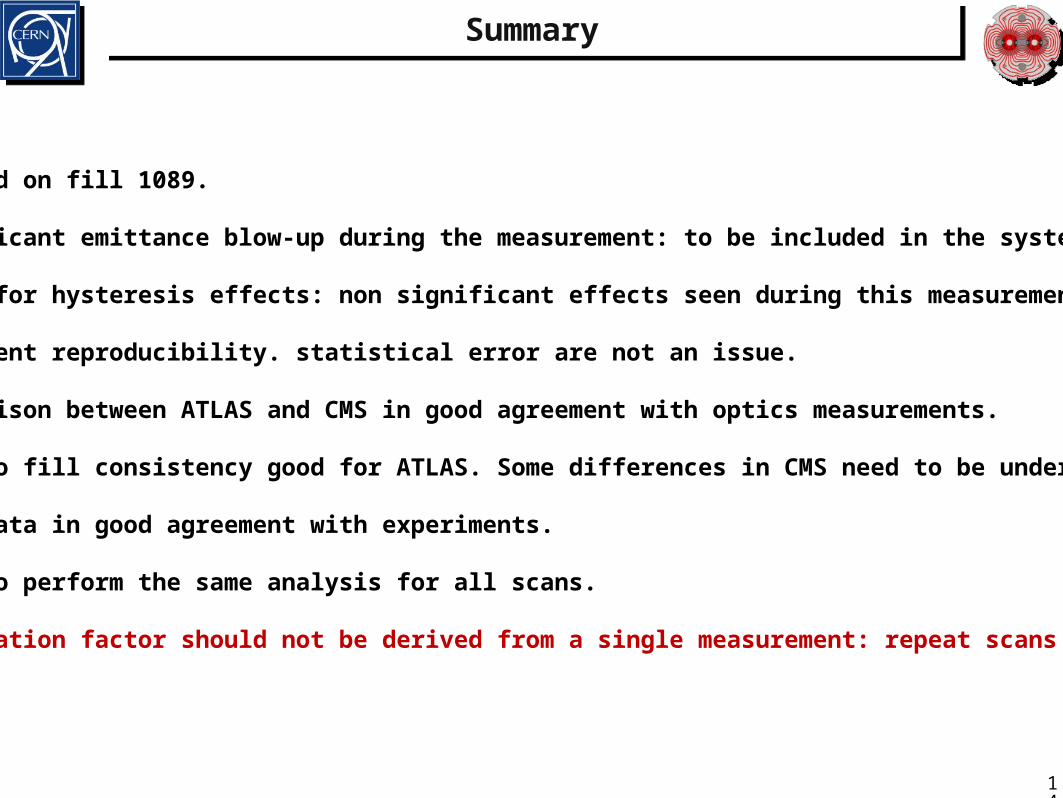
SummarySummary
14
• Focused on fill 1089.
• Significant emittance blow-up during the measurement: to be included in the systematics.
• Check for hysteresis effects: non significant effects seen during this measurement.
• Excellent reproducibility. statistical error are not an issue.
• Comparison between ATLAS and CMS in good agreement with optics measurements.
• Fill to fill consistency good for ATLAS. Some differences in CMS need to be understood.
• BRAN data in good agreement with experiments.
• Need to perform the same analysis for all scans.
• Calibration factor should not be derived from a single measurement: repeat scans in all IPs.