S UPPLEMENTAL - SNL · 3 Corporate Profile ... Goldman, Sachs & Co. Mr ... This Quarterly Financial...
35
Transcript of S UPPLEMENTAL - SNL · 3 Corporate Profile ... Goldman, Sachs & Co. Mr ... This Quarterly Financial...


p. 2 Kite Realty Group Supplemental Financial and Operating Statistics – 9/30/05
S UPPLEMENTAL I NFORMATION – S EPTEMBER 30, 2005 PAGE NO. TABLE OF CONTENTS
3 Corporate Profile4 Contact Information5 Important Notes6 Corporate Structure Chart7 Condensed Consolidated and Combined Balance Sheets8 Consolidated and Combined Statements of Operations For the Quarter Ended September 309 Consolidated and Combined Statements of Operations For Year-to-Date Ended September 3010 Funds From Operations and Other Financial Information For the Quarter Ended September 3011 Funds From Operations and Other Financial Information For Year-to-Date Ended September 3012 Market Capitalization13 Net Operating Income14 Summary of Outstanding Debt15 Schedule of Outstanding Debt18 Joint Venture Summary19 Condensed Combined Balance Sheets of Unconsolidated Properties20 Condensed Combined Statements of Operations of Unconsolidated Properties For the Three and Nine Months Ended September 3021 Top 10 Retail Tenants by Gross Leaseable Area22 Top 25 Tenants by Annualized Base Rent23 Lease Expirations – Operating Portfolio24 Lease Expirations – Retail Anchor Tenants25 Lease Expirations – Retail Shops26 Lease Expirations – Commercial Tenants27 Summary Retail Portfolio Statistics28 Summary Commercial Portfolio Statistics29 Development Pipeline30 Geographic Diversification – Operating Portfolio31 Operating Retail Properties33 Operating Commercial Properties34 Retail Operating Portfolio – Tenant Breakdown35 2005 Acquisitions of Operating Properties

p. 3 Kite Realty Group Supplemental Financial and Operating Statistics – 9/30/05
C ORPORATE P ROFILE General Description
Kite Realty Group Trust commenced operations in August 2004 as the successor to certain businesses of Kite Property Group, anationally recognized real estate owner and developer. We are a full service, vertically integrated real estate company focusedprimarily on the development, construction, acquisition, ownership and operation of high quality neighborhood and communityshopping centers in selected growth markets in the United States. As of September 30, 2005, we owned interests in 43 operatingproperties totaling approximately 6.3 million square feet and interests in 13 properties under development anticipated to total 1.8million square feet. We are organized as a real estate investment trust ("REIT") for federal income tax purposes.Our strategy is to maximize the cash flow of our operating properties, successfully complete the construction and lease-up of ourdevelopment portfolio and identify additional growth opportunities in the form of new developments and acquisitions. Newinvestments are focused in the shopping center sector, although we may selectively pursue commercial development or acquisitionopportunities in markets where we currently operate and where we believe we can leverage existing infrastructure and relationshipsto generate attractive risk adjusted returns.Company Highlights (as of September 30, 2005)
Operating Retail Properties 37 Operating Commercial Properties 6 Total Properties Under Development 13 States 9 Total GLA/NRA (operating) 6,347,972 Owned GLA/NRA (operating) 4,838,465 Percentage of Owned GLA Leased - Retail 95.6% Percentage of Owned NRA Leased – Commercial 97.7% Total Employees 87
Stock ListingNew York Stock Exchange symbol: KRG
p. 4 Kite Realty Group Supplemental Financial and Operating Statistics – 9/30/05
C ONTACT I NFORMATION Corporate Office
30 South Meridian Street, Suite 1100Indianapolis, IN 46204
1-888-577-5600317-577-5600
www.kiterealty.com
Investor Relations Contacts:
Daniel R. Sink, Chief Financial OfficerKite Realty Group Trust30 South Meridian Street, Suite 1100Indianapolis, IN 46204(317) [email protected] Ruth GroupStephanie Carrington(646) 536-7017
Transfer Agent:
LaSalle Bank, National Association135 South LaSalle StreetChicago, IL 60603-3499(312) 904-2000Stock Specialist:
Van der Moolen Specialists USA, LLC45 Broadway32nd FloorNew York, NY 10006(646) 576-2707
Analyst Coverage:
Goldman, Sachs & Co.Mr. Carey Callaghan(212) [email protected] NesbittMr. Paul E. Adornato, CFA(212) [email protected] Capital MarketsMr. Richard C. Moore II, CFA(216) [email protected] BrothersMr. David Harris(212) [email protected] JamesMr. Paul Puryear(727) [email protected], Nicholas & Company, Inc.Mr. Philip J. Martin(312) [email protected] SecuritiesMr. Jeffrey J. Donnelly, CFA(617) [email protected]

p. 5 Kite Realty Group Supplemental Financial and Operating Statistics – 9/30/05
I MPORTANT N OTES Interim Information
This Quarterly Financial Supplement contains historical information of Kite Realty Group Trust (the “Company”) and Kite Property Group (the “Predecessor”) and is intended to supplement the Company’sQuarterly Report on Form 10-Q for the three months ended September 30, 2005, which should be read in conjunction with this package. The supplemental information is unaudited, although it reflects alladjustments which, in the opinion of management, are necessary for a fair presentation of operating results for the interim periods.Forward-Looking Statements
This supplemental information package contains certain forward-looking statements within the meaning of Section 27A of the Securities Act of 1933 and Section 21E of the Securities Exchange Act of1934. Such statements are based on assumptions and expectations that may not be realized and are inherently subject to risks, uncertainties and other factors, many of which cannot be predicted withaccuracy and some of which might not even be anticipated. Future events and actual results, performance, transactions or achievements, financial or otherwise, may differ materially from the results,performance, transactions or achievements expressed or implied by the forward-looking statements. Risks, uncertainties and other factors that might cause such differences, some of which could bematerial, include, but are not limited to:
• national and local economic, business, real estate and other market conditions;• the ability of tenants to pay rent;• the competitive environment in which the Company operates;• financing risks;• property management risks;• the level and volatility of interest rates;• financial stability of tenants;• the Company’s ability to maintain its status as a REIT for federal income tax purposes;• acquisition, disposition, development and joint venture risks;• potential environmental and other liabilities;• other factors affecting the real estate industry generally; and• other risks identified in reports the Company files with the Securities and Exchange Commission (the “SEC”) or in other documents that it publicly disseminates.
The Company undertakes no obligation to publicly update or revise these forward-looking statements, whether as a result of new information, future events or otherwise.Funds From Operations
Funds from Operations (“FFO”) is a widely used performance measure for real estate companies and is provided here as a supplemental measure of operating performance. We calculate FFO in accordancewith the best practices described in the April 2002 National Policy Bulletin of the National Association of Real Estate Investment Trusts (NAREIT), which we refer to as the White Paper. The White Paperdefines FFO as net income (computed in accordance with GAAP), excluding gains (or losses) from sales of property, plus depreciation and amortization, and after adjustments for unconsolidatedpartnerships and joint ventures.Given the nature of our business as a real estate owner and operator, we believe that FFO is helpful to investors in measuring our operational performance because it excludes various items included in netincome that do not relate to or are not indicative of our operating performance such as gains (or losses) from sales of property and depreciation and amortization, which can make periodic and peeranalyses of operating performance more difficult. FFO should not be considered as an alternative to net income (determined in accordance with generally accepted accounting principles (“GAAP”)) as anindicator of our financial performance, is not an alternative to cash flow from operating activities (determined in accordance with GAAP) as a measure of our liquidity, and is not indicative of funds availableto fund our cash needs, including our ability to make distributions. Our computation of FFO may not be comparable to FFO reported by other REITs that do not define the term in accordance with thecurrent NAREIT definition or that interpret the current NAREIT definition differently than we do.Net Operating IncomeNet operating income (“NOI”) is provided here as a supplemental measure of operating performance. NOI is defined as property revenues less property operating expenses, excluding depreciation andamortization, interest expense and other items. We believe that this presentation of NOI is helpful to investors as a measure of its operational performance because it is widely used in the real estateindustry to measure the performance of real estate assets without regard to various items included in net income that do not relate to or are not indicative of operating performance, such as depreciationand amortization, which can vary depending upon accounting methods and book value of assets. We also believe NOI helps our investors to meaningfully compare the results of our operating performancefrom period to period by removing the impact of our capital structure (primarily interest expense on our outstanding indebtedness) and depreciation of our basis in our assets from our operating results.NOI should not, however, be considered as an alternative to net income (calculated in accordance with GAAP) as an indicator of our financial performance.Basis for Presentation
Kite Realty Group Trust commenced operations on August 16, 2004 upon completion of its initial public offering. Prior to that date, the entities that owned the properties and service companies that weacquired as part of our formation transactions were under the common control of Al Kite, John Kite and Paul Kite (the “Principals”). Certain line items in the accompanying financial information in theperiod beginning August 16, 2004 may not be comparable to prior periods due to acquisitions, including the purchase of minority partner and joint venture interests of the properties previously accountedfor under the equity method.

p. 6 Kite Realty Group Supplemental Financial and Operating Statistics – 9/30/05
C ORPORATE S TRUCTURE C HART
Kite Realty Group Trust(the “Company”)“General Partner”
Kite Realty Group, L.P.(the “Operating Partnership”)
KRG Construction, LLC
KRG Management, LLC
Kite Realty Holdings, LLC(Taxable REIT Subsidiary)
Kite Realty Development, LLCKite Realty Advisors, LLC(d/b/a KMI Realty Advisors)
KRG Development, LLC(d/b/a Kite Development)
Property Entities
Kite Realty Construction, LLC
100%
100%
100%
100%
69.0%Operating Partnership
Unit Holders“Limited Partners”31.0%
Build-to-Suit to sell entities
p. 7 Kite Realty Group Supplemental Financial and Operating Statistics – 9/30/05
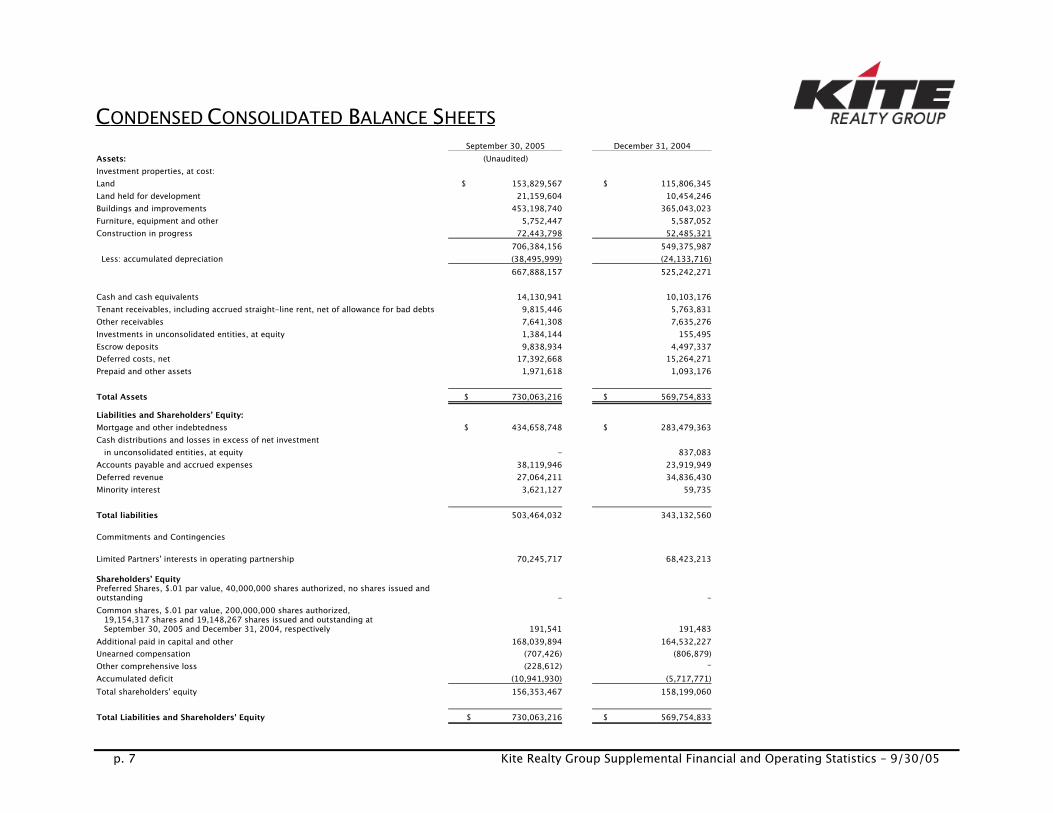
C ONDENSED C ONSOLIDATED B ALANCE S HEETS September 30, 2005 December 31, 2004
Assets: (Unaudited)Investment properties, at cost:Land $ 153,829,567 $ 115,806,345Land held for development 21,159,604 10,454,246Buildings and improvements 453,198,740 365,043,023Furniture, equipment and other 5,752,447 5,587,052Construction in progress 72,443,798 52,485,321
706,384,156 549,375,987 Less: accumulated depreciation (38,495,999) (24,133,716)
667,888,157 525,242,271
Cash and cash equivalents 14,130,941 10,103,176Tenant receivables, including accrued straight-line rent, net of allowance for bad debts 9,815,446 5,763,831Other receivables 7,641,308 7,635,276Investments in unconsolidated entities, at equity 1,384,144 155,495Escrow deposits 9,838,934 4,497,337Deferred costs, net 17,392,668 15,264,271Prepaid and other assets 1,971,618 1,093,176
Total Assets $ 730,063,216 $ 569,754,833Liabilities and Shareholders’ Equity:Mortgage and other indebtedness $ 434,658,748 $ 283,479,363Cash distributions and losses in excess of net investment in unconsolidated entities, at equity - 837,083Accounts payable and accrued expenses 38,119,946 23,919,949Deferred revenue 27,064,211 34,836,430Minority interest 3,621,127 59,735
Total liabilities 503,464,032 343,132,560
Commitments and Contingencies
Limited Partners' interests in operating partnership 70,245,717 68,423,213
Shareholders’ EquityPreferred Shares, $.01 par value, 40,000,000 shares authorized, no shares issued andoutstanding - -Common shares, $.01 par value, 200,000,000 shares authorized, 19,154,317 shares and 19,148,267 shares issued and outstanding at September 30, 2005 and December 31, 2004, respectively 191,541 191,483Additional paid in capital and other 168,039,894 164,532,227Unearned compensation (707,426) (806,879)Other comprehensive loss (228,612) -Accumulated deficit (10,941,930) (5,717,771)Total shareholders' equity 156,353,467 158,199,060
Total Liabilities and Shareholders' Equity $ 730,063,216 $ 569,754,833
p. 8 Kite Realty Group Supplemental Financial and Operating Statistics – 9/30/05
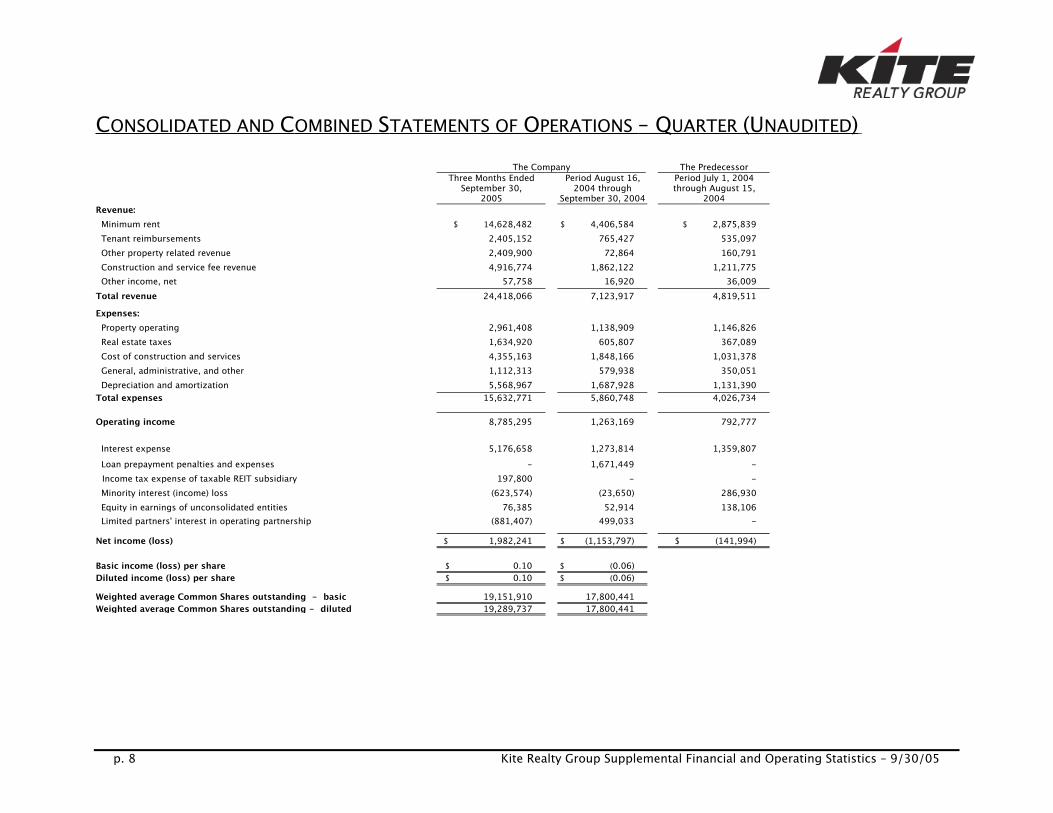
C ONSOLIDATED AND C OMBINED S TATEMENTS OF O PERATIONS – Q UARTER ( U NAUDITED ) The Company The Predecessor
Three Months EndedSeptember 30,
2005Period August 16,
2004 throughSeptember 30, 2004
Period July 1, 2004through August 15,
2004Revenue: Minimum rent $ 14,628,482 $ 4,406,584 $ 2,875,839 Tenant reimbursements 2,405,152 765,427 535,097 Other property related revenue 2,409,900 72,864 160,791 Construction and service fee revenue 4,916,774 1,862,122 1,211,775 Other income, net 57,758 16,920 36,009Total revenue 24,418,066 7,123,917 4,819,511Expenses: Property operating 2,961,408 1,138,909 1,146,826 Real estate taxes 1,634,920 605,807 367,089 Cost of construction and services 4,355,163 1,848,166 1,031,378 General, administrative, and other 1,112,313 579,938 350,051 Depreciation and amortization 5,568,967 1,687,928 1,131,390Total expenses 15,632,771 5,860,748 4,026,734
Operating income 8,785,295 1,263,169 792,777
Interest expense 5,176,658 1,273,814 1,359,807 Loan prepayment penalties and expenses - 1,671,449 -
Income tax expense of taxable REIT subsidiary 197,800 - - Minority interest (income) loss (623,574) (23,650) 286,930 Equity in earnings of unconsolidated entities 76,385 52,914 138,106 Limited partners' interest in operating partnership (881,407) 499,033 -Net income (loss) $ 1,982,241 $ (1,153,797) $ (141,994)
Basic income (loss) per share $ 0.10 $ (0.06)Diluted income (loss) per share $ 0.10 $ (0.06)Weighted average Common Shares outstanding - basic 19,151,910 17,800,441Weighted average Common Shares outstanding - diluted 19,289,737 17,800,441
p. 9 Kite Realty Group Supplemental Financial and Operating Statistics – 9/30/05
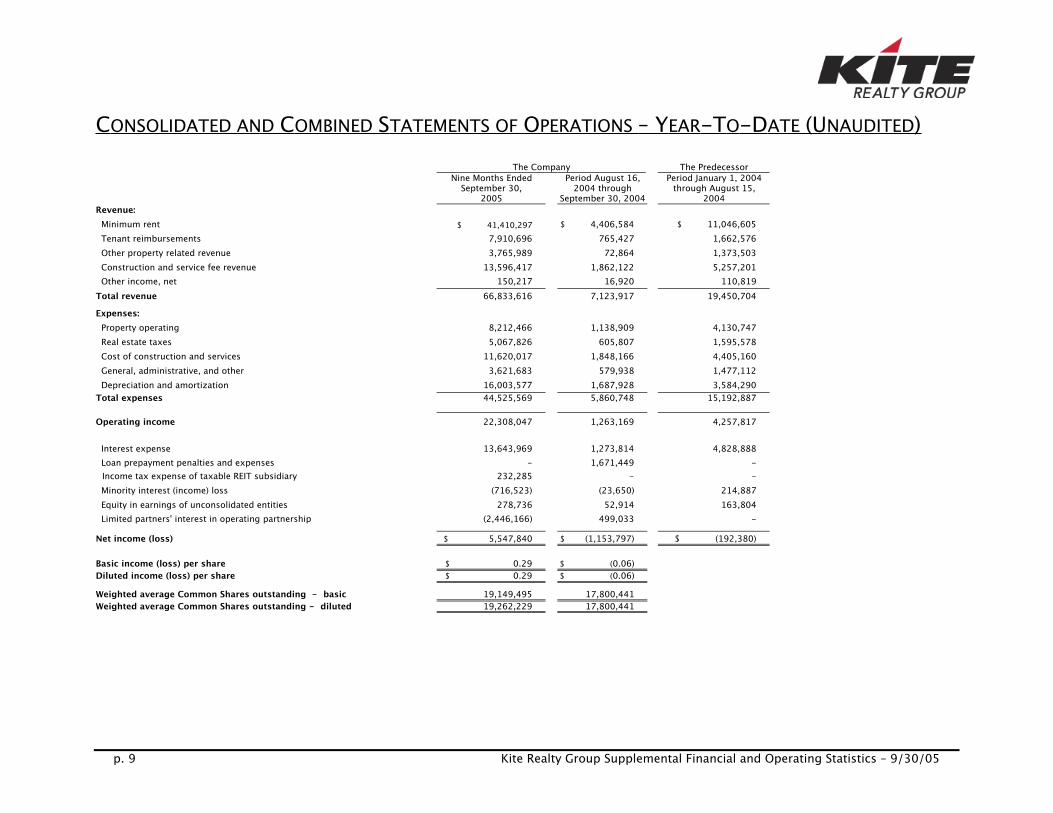
C ONSOLIDATED AND C OMBINED S TATEMENTS OF O PERATIONS – Y EAR -T O -D ATE ( U NAUDITED ) The Company The Predecessor
Nine Months EndedSeptember 30,
2005Period August 16,
2004 throughSeptember 30, 2004
Period January 1, 2004through August 15,
2004Revenue: Minimum rent $ 41,410,297 $ 4,406,584 $ 11,046,605 Tenant reimbursements 7,910,696 765,427 1,662,576 Other property related revenue 3,765,989 72,864 1,373,503 Construction and service fee revenue 13,596,417 1,862,122 5,257,201 Other income, net 150,217 16,920 110,819Total revenue 66,833,616 7,123,917 19,450,704Expenses: Property operating 8,212,466 1,138,909 4,130,747 Real estate taxes 5,067,826 605,807 1,595,578 Cost of construction and services 11,620,017 1,848,166 4,405,160 General, administrative, and other 3,621,683 579,938 1,477,112 Depreciation and amortization 16,003,577 1,687,928 3,584,290Total expenses 44,525,569 5,860,748 15,192,887
Operating income 22,308,047 1,263,169 4,257,817
Interest expense 13,643,969 1,273,814 4,828,888 Loan prepayment penalties and expenses - 1,671,449 -
Income tax expense of taxable REIT subsidiary 232,285 - - Minority interest (income) loss (716,523) (23,650) 214,887 Equity in earnings of unconsolidated entities 278,736 52,914 163,804 Limited partners' interest in operating partnership (2,446,166) 499,033 -Net income (loss) $ 5,547,840 $ (1,153,797) $ (192,380)
Basic income (loss) per share $ 0.29 $ (0.06)Diluted income (loss) per share $ 0.29 $ (0.06)Weighted average Common Shares outstanding - basic 19,149,495 17,800,441Weighted average Common Shares outstanding - diluted 19,262,229 17,800,441
p. 10 Kite Realty Group Supplemental Financial and Operating Statistics – 9/30/05
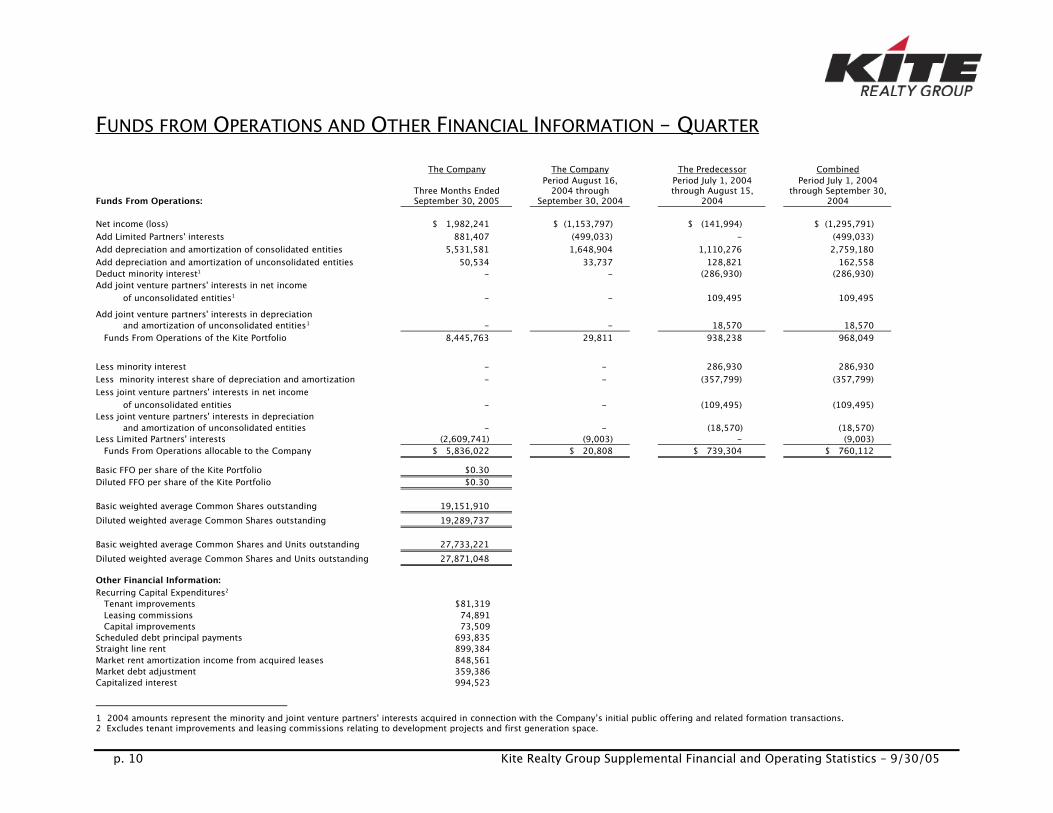
F UNDS FROM O PERATIONS AND O THER F INANCIAL I NFORMATION – Q UARTER The Company The Company The Predecessor Combined
Funds From Operations:Three Months EndedSeptember 30, 2005
Period August 16,2004 through
September 30, 2004Period July 1, 2004through August 15,
2004Period July 1, 2004
through September 30,2004
Net income (loss) $ 1,982,241 $ (1,153,797) $ (141,994) $ (1,295,791)Add Limited Partners' interests 881,407 (499,033) - (499,033)Add depreciation and amortization of consolidated entities 5,531,581 1,648,904 1,110,276 2,759,180Add depreciation and amortization of unconsolidated entities 50,534 33,737 128,821 162,558Deduct minority interest1 - - (286,930) (286,930)Add joint venture partners' interests in net income of unconsolidated entities1 - - 109,495 109,495Add joint venture partners' interests in depreciation and amortization of unconsolidated entities1 - - 18,570 18,570 Funds From Operations of the Kite Portfolio 8,445,763 29,811 938,238 968,049
Less minority interest - - 286,930 286,930Less minority interest share of depreciation and amortization - - (357,799) (357,799)Less joint venture partners' interests in net income of unconsolidated entities - - (109,495) (109,495)Less joint venture partners' interests in depreciation and amortization of unconsolidated entities - - (18,570) (18,570)Less Limited Partners' interests (2,609,741) (9,003) - (9,003) Funds From Operations allocable to the Company $ 5,836,022 $ 20,808 $ 739,304 $ 760,112Basic FFO per share of the Kite Portfolio $0.30Diluted FFO per share of the Kite Portfolio $0.30
Basic weighted average Common Shares outstanding 19,151,910Diluted weighted average Common Shares outstanding 19,289,737
Basic weighted average Common Shares and Units outstanding 27,733,221Diluted weighted average Common Shares and Units outstanding 27,871,048
Other Financial Information:Recurring Capital Expenditures2
Tenant improvements $81,319 Leasing commissions 74,891 Capital improvements 73,509Scheduled debt principal payments 693,835Straight line rent 899,384Market rent amortization income from acquired leases 848,561Market debt adjustment 359,386Capitalized interest 994,523
1 2004 amounts represent the minority and joint venture partners' interests acquired in connection with the Company’s initial public offering and related formation transactions.2 Excludes tenant improvements and leasing commissions relating to development projects and first generation space.

p. 11 Kite Realty Group Supplemental Financial and Operating Statistics – 9/30/05
F UNDS F ROM O PERATIONS AND O THER F INANCIAL I NFORMATION –Y EAR -T O -D ATE Nine Months Ended September 30, 2004
The Company The Company The Predecessor Combined
Funds From Operations:Nine Months EndedSeptember 30, 2005
Period August 16,2004 through
September 30, 2004Period January 1, 2004
through August 15,2004
Period January 1, 2004through September 30,
2004
Net income (loss) $ 5,547,840 $ (1,153,797) $ (192,380) $ (1,346,176)Add Limited Partners' interests 2,446,166 (499,033) - (499,033)Add depreciation and amortization of consolidated entities 15,895,620 1,648,904 3,563,176 5,212,080Add depreciation and amortization of unconsolidated entities 199,165 33,737 493,571 527,308Deduct minority interest1 - - (214,887) (214,887)Add joint venture partners' interests in net income of unconsolidated entities1 - - 288,675 288,675Add joint venture partners' interests in depreciation and amortization of unconsolidated entities1 - - 519,277 519,277 Funds From Operations of the Kite Portfolio 24,088,791 29,811 4,457,432 4,487,244
Less minority interest - - 214,887 214,887Less minority interest share of depreciation and amortization - - (1,014,248) (1,014,248)Less joint venture partners' interests in net income of unconsolidated entities - - (288,675) (288,675)Less joint venture partners' interests in depreciation and amortization of unconsolidated entities - - (519,277) (519,277)Less Limited Partners' interests (7,371,170) (9,003) - (9,003) Funds From Operations allocable to the Company $ 16,717,621 $ 20,808 $ 2,850,119 $ 2,870,928Basic FFO per share of the Kite Portfolio $0.87Diluted FFO per share of the Kite Portfolio $0.87
Basic weighted average Common Shares outstanding 19,149,495Diluted weighted average Common Shares outstanding 19,262,229
Basic weighted average Common Shares and Units outstanding 27,604,417Diluted weighted average Common Shares and Units outstanding 27,717,151Other Financial Information:Recurring Capital Expenditures2
Tenant improvements $243,991 Leasing commissions 126,195 Capital improvements 419,666Scheduled debt principal payments 1,970,838Straight line rent 1,438,252Market rent amortization income from acquired leases 2,650,049Market debt adjustment 1,078,159Capitalized interest 2,171,941
1 2004 amounts represent the minority and joint venture partners' interests acquired in connection with the Company’s initial public offering and related formation transactions.2 Excludes tenant improvements and leasing commissions relating to development projects and first generation space.

p. 12 Kite Realty Group Supplemental Financial and Operating Statistics – 9/30/05
M ARKET C APITALIZATION A S OF S EPTEMBER 30, 2005 (S EE N OTE )
Note: In October 2005, the Company completed an offering of 9.4 million common shares, (including theoverallotment option) resulting in net proceeds of approximately $134 million. The Company usedapproximately $127 million of the net proceeds from this offering to pay down indebtedness. Afterreflecting the proceeds from the offering and the reduction in indebtedness, equity capitalization anddebt capitalization represents approximately 63% and 37%, respectively of the Company’s total marketcapitalization.
Percent ofTotal Equity
TotalMarket
CapitalizationPercent of
Total MarketCapitalization
Equity Capitalization:Total Common Shares Outstanding 69.0% $ 19,159,967Operating Partnership ("OP") Units 31.0% 8,618,664 Combined Common Shares and OP Units 100.0% 27,778,631
Market Price at September 30, 2005 $ 14.92
Total Equity Capitalization $ 414,457,175 48%
Debt Capitalization:
Company Outstanding Debt $ 434,658,748Pro-rata Share of Joint Venture Debt 8,605,644
Total Debt Capitalization 443,264,392 52%
Total Market Capitalization $ 857,721,567 100%
p. 13 Kite Realty Group Supplemental Financial and Operating Statistics – 9/30/05
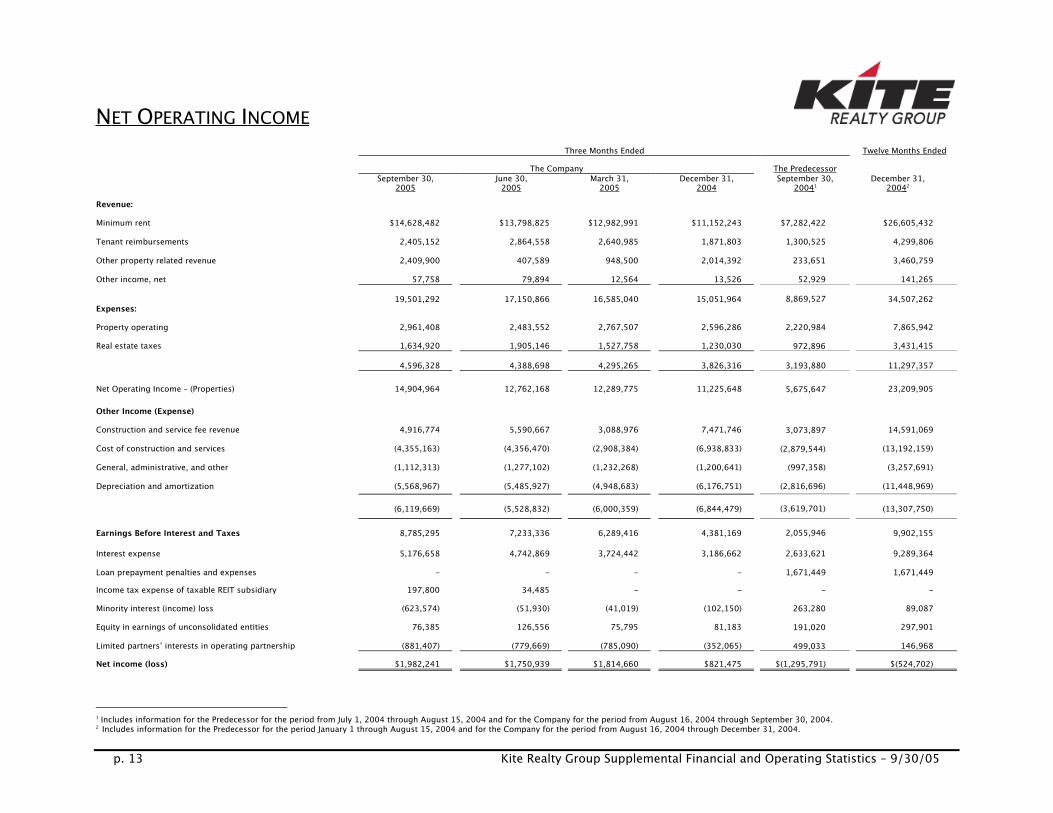
N ET O PERATING I NCOME
Three Months Ended Twelve Months EndedThe Company The Predecessor
September 30,2005
June 30,2005
March 31,2005
December 31,2004
September 30,2004 1
December 31,2004 2
Revenue:
Minimum rent $14,628,482 $13,798,825 $12,982,991 $11,152,243 $7,282,422 $26,605,432Tenant reimbursements 2,405,152 2,864,558 2,640,985 1,871,803 1,300,525 4,299,806Other property related revenue 2,409,900 407,589 948,500 2,014,392 233,651 3,460,759Other income, net 57,758 79,894 12,564 13,526 52,929 141,265
19,501,292 17,150,866 16,585,040 15,051,964 8,869,527 34,507,262Expenses:
Property operating 2,961,408 2,483,552 2,767,507 2,596,286 2,220,984 7,865,942Real estate taxes 1,634,920 1,905,146 1,527,758 1,230,030 972,896 3,431,415
4,596,328 4,388,698 4,295,265 3,826,316 3,193,880 11,297,357
Net Operating Income – (Properties) 14,904,964 12,762,168 12,289,775 11,225,648 5,675,647 23,209,905
Other Income (Expense)
Construction and service fee revenue 4,916,774 5,590,667 3,088,976 7,471,746 3,073,897 14,591,069Cost of construction and services (4,355,163) (4,356,470) (2,908,384) (6,938,833) (2,879,544) (13,192,159)General, administrative, and other (1,112,313) (1,277,102) (1,232,268) (1,200,641) (997,358) (3,257,691)Depreciation and amortization (5,568,967) (5,485,927) (4,948,683) (6,176,751) (2,816,696) (11,448,969)
(6,119,669) (5,528,832) (6,000,359) (6,844,479) (3,619,701) (13,307,750)
Earnings Before Interest and Taxes 8,785,295 7,233,336 6,289,416 4,381,169 2,055,946 9,902,155
Interest expense 5,176,658 4,742,869 3,724,442 3,186,662 2,633,621 9,289,364Loan prepayment penalties and expenses - - - - 1,671,449 1,671,449Income tax expense of taxable REIT subsidiary 197,800 34,485 - - - -Minority interest (income) loss (623,574) (51,930) (41,019) (102,150) 263,280 89,087Equity in earnings of unconsolidated entities 76,385 126,556 75,795 81,183 191,020 297,901Limited partners’ interests in operating partnership (881,407) (779,669) (785,090) (352,065) 499,033 146,968Net income (loss) $1,982,241 $1,750,939 $1,814,660 $821,475 $(1,295,791) $(524,702)
1 Includes information for the Predecessor for the period from July 1, 2004 through August 15, 2004 and for the Company for the period from August 16, 2004 through September 30, 2004.2 Includes information for the Predecessor for the period January 1 through August 15, 2004 and for the Company for the period from August 16, 2004 through December 31, 2004.
p. 14 Kite Realty Group Supplemental Financial and Operating Statistics – 9/30/05
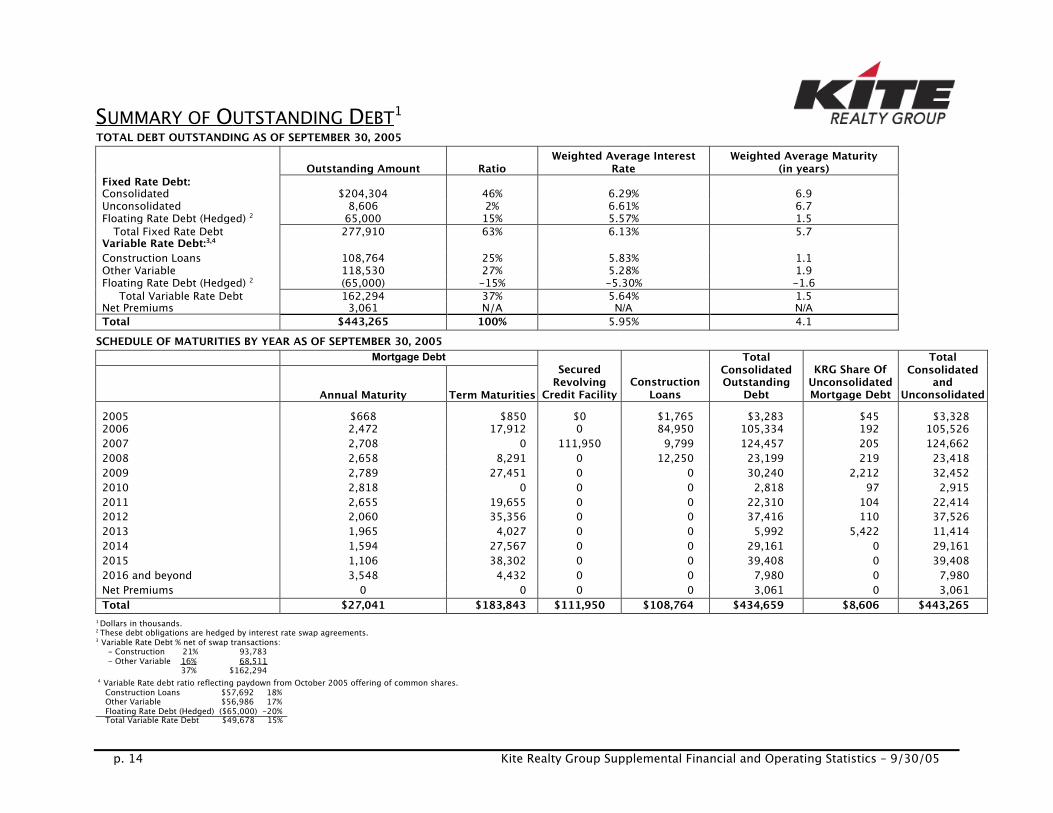
S UMMARY OF O UTSTANDING D EBT1 TOTAL DEBT OUTSTANDING AS OF SEPTEMBER 30, 2005
Outstanding Amount RatioWeighted Average Interest
RateWeighted Average Maturity
(in years)Fixed Rate Debt:
Consolidated $204,304 46% 6.29% 6.9Unconsolidated 8,606 2% 6.61% 6.7Floating Rate Debt (Hedged) 2 65,000 15% 5.57% 1.5
Total Fixed Rate Debt 277,910 63% 6.13% 5.7 Variable Rate Debt:3,4 Construction Loans 108,764 25% 5.83% 1.1 Other Variable 118,530 27% 5.28% 1.9 Floating Rate Debt (Hedged) 2 (65,000) -15% -5.30% -1.6
Total Variable Rate Debt 162,294 37% 5.64% 1.5 Net Premiums 3,061 N/A N/A N/A Total $443,265 100% 5.95% 4.1
SCHEDULE OF MATURITIES BY YEAR AS OF SEPTEMBER 30, 2005 Mortgage Debt
Annual Maturity Term Maturities
SecuredRevolving
Credit FacilityConstruction
Loans
TotalConsolidatedOutstanding
Debt
KRG Share OfUnconsolidatedMortgage Debt
TotalConsolidated
andUnconsolidated
Debt2005 $668 $850 $0 $1,765 $3,283 $45 $3,3282006 2,472 17,912 0 84,950 105,334 192 105,5262007 2,708 0 111,950 9,799 124,457 205 124,6622008 2,658 8,291 0 12,250 23,199 219 23,4182009 2,789 27,451 0 0 30,240 2,212 32,4522010 2,818 0 0 0 2,818 97 2,9152011 2,655 19,655 0 0 22,310 104 22,4142012 2,060 35,356 0 0 37,416 110 37,5262013 1,965 4,027 0 0 5,992 5,422 11,4142014 1,594 27,567 0 0 29,161 0 29,1612015 1,106 38,302 0 0 39,408 0 39,4082016 and beyond 3,548 4,432 0 0 7,980 0 7,980Net Premiums 0 0 0 0 3,061 0 3,061Total $27,041 $183,843 $111,950 $108,764 $434,659 $8,606 $443,265
1 Dollars in thousands.2 These debt obligations are hedged by interest rate swap agreements.3 Variable Rate Debt % net of swap transactions:
- Construction 21% 93,783- Other Variable 16% 68,511 37% $162,294
4 Variable Rate debt ratio reflecting paydown from October 2005 offering of common shares. Construction Loans $57,692 18% Other Variable $56,986 17% Floating Rate Debt (Hedged) ($65,000) -20% Total Variable Rate Debt $49,678 15%

p. 15 Kite Realty Group Supplemental Financial and Operating Statistics – 9/30/05
S CHEDULE OF O UTSTANDING D EBT1 CONSOLIDATED DEBT AS OF SEPTEMBER 30, 2005
Fixed Rate Debt: Lender/Servicer Interest Rate Maturity DateBalance as of
09/30/05Monthly Debt Service
as of 09/30/0550th & 12th Wachovia Bank 5.67% 11/11/2014 $4,652 $27176th & Meridian Wachovia Bank 5.67% 11/11/2014 4,226 25Boulevard Crossing Wachovia Bank 5.11% 12/11/2009 12,531 69Centre at Panola, Phase I JP Morgan Chase 6.78% 1/1/2022 4,335 37Corner Shops, The Sun Life Assurance Co. 7.65% 7/1/2011 1,882 17Fox Lake Crossing Wachovia Bank 5.16% 7/1/2012 12,156 69Indian River Square Wachovia Bank 5.42% 6/11/2015 13,300 62Indiana State Motor Pool Old National 5.38% 3/24/2008 4,064 19International Speedway Square Lehman Brothers Bank 7.17% 3/11/2011 19,754 139Plaza at Cedar Hill GECC 7.38% 2/1/2012 27,043 193Plaza Volente Wachovia Bank 5.42% 6/11/2015 28,680 134Preston Commons Wachovia Bank 5.90% 3/11/2013 4,607 28Ridge Plaza Wachovia Bank 5.15% 10/11/2009 16,789 93Sunland Towne Centre Nomura Asset Capital 8.85% 1/11/2006 17,496 155Thirty South CS First Boston 6.09% 1/11/2014 23,029 142Whitehall Pike Banc One Capital Funding 6.71% 7/5/2018 9,760 77Subtotal $204,304 $1,286
Floating Rate Debt (Hedged):Lender Interest Rate Maturity Date Balance as of
09/30/05 Monthly Debt Service
as of 09/30/05Collateral Pool Properties2 KeyBank 5.65% 8/1/2007 35,000 165Collateral Pool Properties2 KeyBank 5.38% 8/1/2007 15,000 67Cool Creek Commons3 LaSalle Bank 5.59% 5/1/2006 15,000 72Subtotal $65,000 $304TOTAL CONSOLIDATED FIXED RATE DEBT $269,304 $1,590 TOTAL NET PREMIUMS (FAS 141) $3,061Variable Rate Debt:Mortgages
Lender Interest Rate6 Maturity Date Balance as of09/30/05
Eagle Creek Phase II (Pad 1)4 Wachovia Bank LIBOR + 250 10/21/2005 850Fishers Station Shops5 National City Bank LIBOR + 275 9/1/2008 5,236Traders Point III4 Huntington Bank PRIME 10/6/2006 494Subtotal $6,5801 Dollars in thousands.2 The Company has entered into $35 million and $15 million fixed rate swap agreements which are designated as hedges against the line of credit.3 The Company has entered into a $15 million fixed rate swap agreement which is designated as a hedge against the Cool Creek Commons construction loan.4 This loan was paid off in October with proceeds from The Company’s offering of common shares and these properties are now available to expand availability under the revolving credit facility.5 The Company has a 25% interest in this property.5 At September 30, 2005, one-month LIBOR and Prime were 3.86% and 6.75%, respectively.
p. 16 Kite Realty Group Supplemental Financial and Operating Statistics – 9/30/05
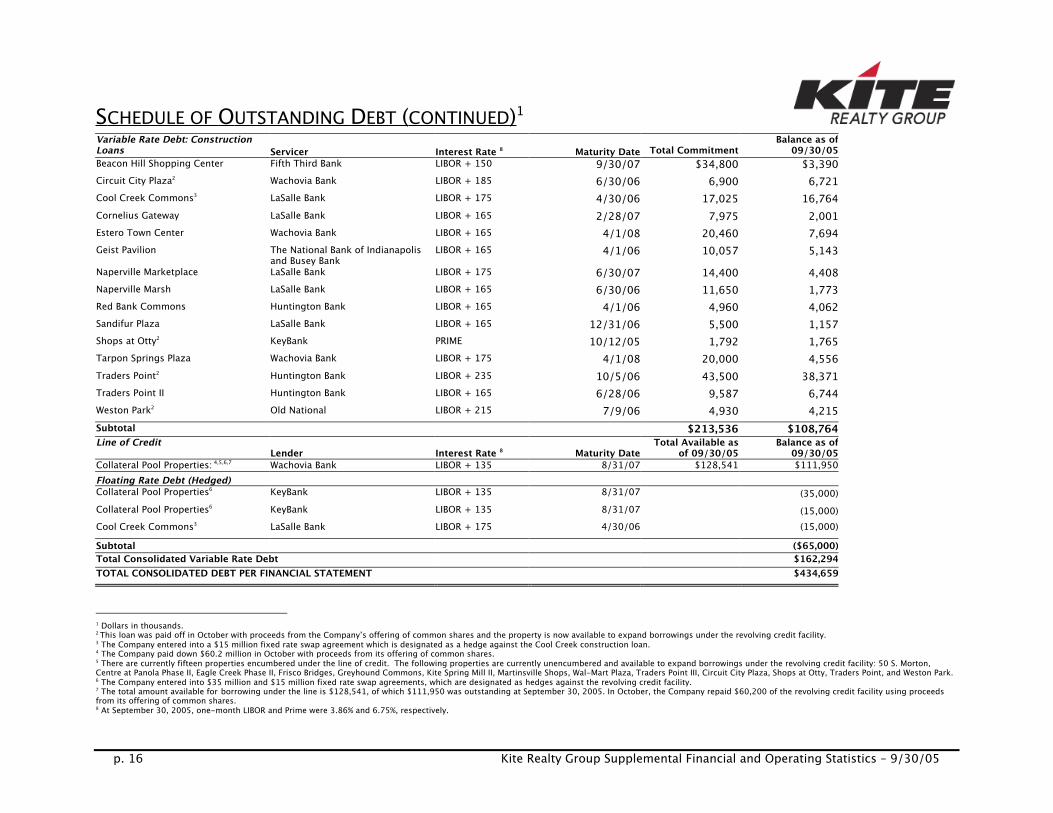
S CHEDULE OF O UTSTANDING D EBT ( CONTINUED ) 1 Variable Rate Debt: ConstructionLoans Servicer Interest Rate 8 Maturity Date Total Commitment
Balance as of09/30/05
Beacon Hill Shopping Center Fifth Third Bank LIBOR + 150 9/30/07 $34,800 $3,390Circuit City Plaza2 Wachovia Bank LIBOR + 185 6/30/06 6,900 6,721Cool Creek Commons3 LaSalle Bank LIBOR + 175 4/30/06 17,025 16,764Cornelius Gateway LaSalle Bank LIBOR + 165 2/28/07 7,975 2,001Estero Town Center Wachovia Bank LIBOR + 165 4/1/08 20,460 7,694Geist Pavilion The National Bank of Indianapolis
and Busey BankLIBOR + 165 4/1/06 10,057 5,143
Naperville Marketplace LaSalle Bank LIBOR + 175 6/30/07 14,400 4,408Naperville Marsh LaSalle Bank LIBOR + 165 6/30/06 11,650 1,773Red Bank Commons Huntington Bank LIBOR + 165 4/1/06 4,960 4,062Sandifur Plaza LaSalle Bank LIBOR + 165 12/31/06 5,500 1,157Shops at Otty2 KeyBank PRIME 10/12/05 1,792 1,765Tarpon Springs Plaza Wachovia Bank LIBOR + 175 4/1/08 20,000 4,556Traders Point2 Huntington Bank LIBOR + 235 10/5/06 43,500 38,371Traders Point II Huntington Bank LIBOR + 165 6/28/06 9,587 6,744Weston Park2 Old National LIBOR + 215 7/9/06 4,930 4,215Subtotal $213,536 $108,764Line of Credit
Lender Interest Rate 8 Maturity DateTotal Available as
of 09/30/05Balance as of
09/30/05Collateral Pool Properties: 4,5,6,7 Wachovia Bank LIBOR + 135 8/31/07 $128,541 $111,950Floating Rate Debt (Hedged) Collateral Pool Properties6 KeyBank LIBOR + 135 8/31/07 (35,000)Collateral Pool Properties6 KeyBank LIBOR + 135 8/31/07 (15,000)Cool Creek Commons3 LaSalle Bank LIBOR + 175 4/30/06 (15,000)Subtotal ($65,000)Total Consolidated Variable Rate Debt $162,294TOTAL CONSOLIDATED DEBT PER FINANCIAL STATEMENT $434,659
1 Dollars in thousands.2 This loan was paid off in October with proceeds from the Company’s offering of common shares and the property is now available to expand borrowings under the revolving credit facility.3 The Company entered into a $15 million fixed rate swap agreement which is designated as a hedge against the Cool Creek construction loan.4 The Company paid down $60.2 million in October with proceeds from its offering of common shares.5 There are currently fifteen properties encumbered under the line of credit. The following properties are currently unencumbered and available to expand borrowings under the revolving credit facility: 50 S. Morton,Centre at Panola Phase II, Eagle Creek Phase II, Frisco Bridges, Greyhound Commons, Kite Spring Mill II, Martinsville Shops, Wal-Mart Plaza, Traders Point III, Circuit City Plaza, Shops at Otty, Traders Point, and Weston Park.6 The Company entered into $35 million and $15 million fixed rate swap agreements, which are designated as hedges against the revolving credit facility.7 The total amount available for borrowing under the line is $128,541, of which $111,950 was outstanding at September 30, 2005. In October, the Company repaid $60,200 of the revolving credit facility using proceedsfrom its offering of common shares.8 At September 30, 2005, one-month LIBOR and Prime were 3.86% and 6.75%, respectively.
p. 17 Kite Realty Group Supplemental Financial and Operating Statistics – 9/30/05
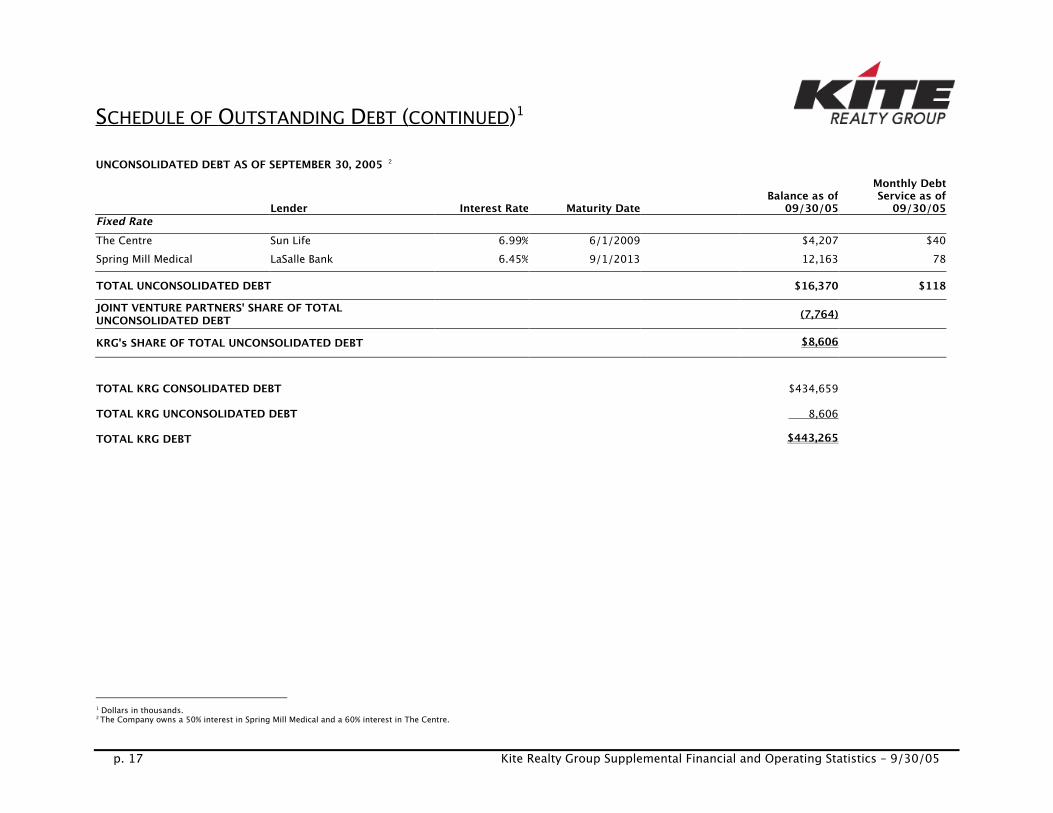
S CHEDULE OF O UTSTANDING D EBT ( CONTINUED)1 UNCONSOLIDATED DEBT AS OF SEPTEMBER 30, 2005 2
Lender Interest Rate Maturity Date Balance as of09/30/05
Monthly DebtService as of
09/30/05Fixed Rate The Centre Sun Life 6.99% 6/1/2009 $4,207 $40Spring Mill Medical LaSalle Bank 6.45% 9/1/2013 12,163 78
TOTAL UNCONSOLIDATED DEBT $16,370 $118JOINT VENTURE PARTNERS' SHARE OF TOTALUNCONSOLIDATED DEBT (7,764)
KRG's SHARE OF TOTAL UNCONSOLIDATED DEBT $8,606
TOTAL KRG CONSOLIDATED DEBT $434,659TOTAL KRG UNCONSOLIDATED DEBT 8,606TOTAL KRG DEBT $443,265
1 Dollars in thousands.2 The Company owns a 50% interest in Spring Mill Medical and a 60% interest in The Centre.

p. 18 Kite Realty Group Supplemental Financial and Operating Statistics – 9/30/05
J OINT V ENTURE S UMMARY – U NCONSOLIDATED P ROPERTIES The Company owns the following two unconsolidated properties with joint venture partners:
Property Percentage Owned by the CompanyThe Centre 60%Spring Mill Medical 50%

p. 19 Kite Realty Group Supplemental Financial and Operating Statistics – 9/30/05
C ONDENSED C OMBINED B ALANCE S HEETS OF U NCONSOLIDATED P ROPERTIES (THE CENTRE AND SPRING MILL MEDICAL)(Unaudited)
September 30, 2005 December 31, 2004
Assets:Investment properties, at costLand $ 2,404,211 $ 2,552,075Buildings and improvements 14,676,628 14,493,799
17,080,839 17,045,874 Less: accumulated depreciation (2,678,185) (2,338,829)
14,402,654 14,07,045Cash and cash equivalents 868,869 601,423Tenant receivables, including accrued straight line rent 101,728 254,883Other receivables - 5,661Deferred costs, net 689,428 768,825Prepaid and other assets 4,150 4,870Total Assets $ 16,066,829 $ 16,342,707Liabilities and Accumulated Equity (Deficit):Mortgage and other indebtedness $ 16,369,875 $ 16,609,675Accounts payable and accrued expenses 482,430 458,289Due to affiliate 1,388 -Total Liabilities 16,853,693 17,067,964Accumulated equity (deficit) (786,864) (725,257)Total Liabilities and Accumulated Equity (Deficit) $ 16,066,829 $ 16,342, 707
p. 20 Kite Realty Group Supplemental Financial and Operating Statistics – 9/30/05
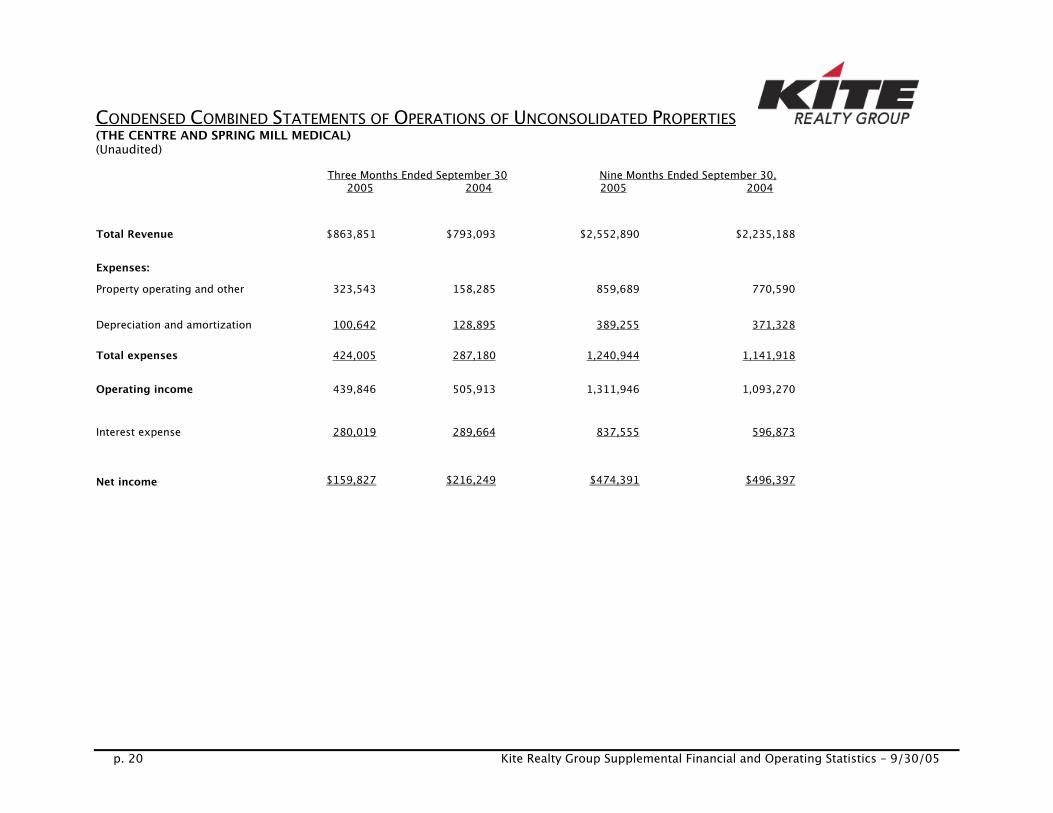
C ONDENSED C OMBINED S TATEMENTS OF O PERATIONS OF U NCONSOLIDATED P ROPERTIES (THE CENTRE AND SPRING MILL MEDICAL)(Unaudited)
Three Months Ended September 30 Nine Months Ended September 30,2005 2004 2005 2004
Total Revenue $863,851 $793,093 $2,552,890 $2,235,188
Expenses:Property operating and other 323,543 158,285 859,689 770,590
Depreciation and amortization 100,642 128,895 389,255 371,328
Total expenses 424,005 287,180 1,240,944 1,141,918
Operating income 439,846 505,913 1,311,946 1,093,270
Interest expense 280,019 289,664 837,555 596,873
Net income $159,827 $216,249 $474,391 $496,397
p. 21 Kite Realty Group Supplemental Financial and Operating Statistics – 9/30/05
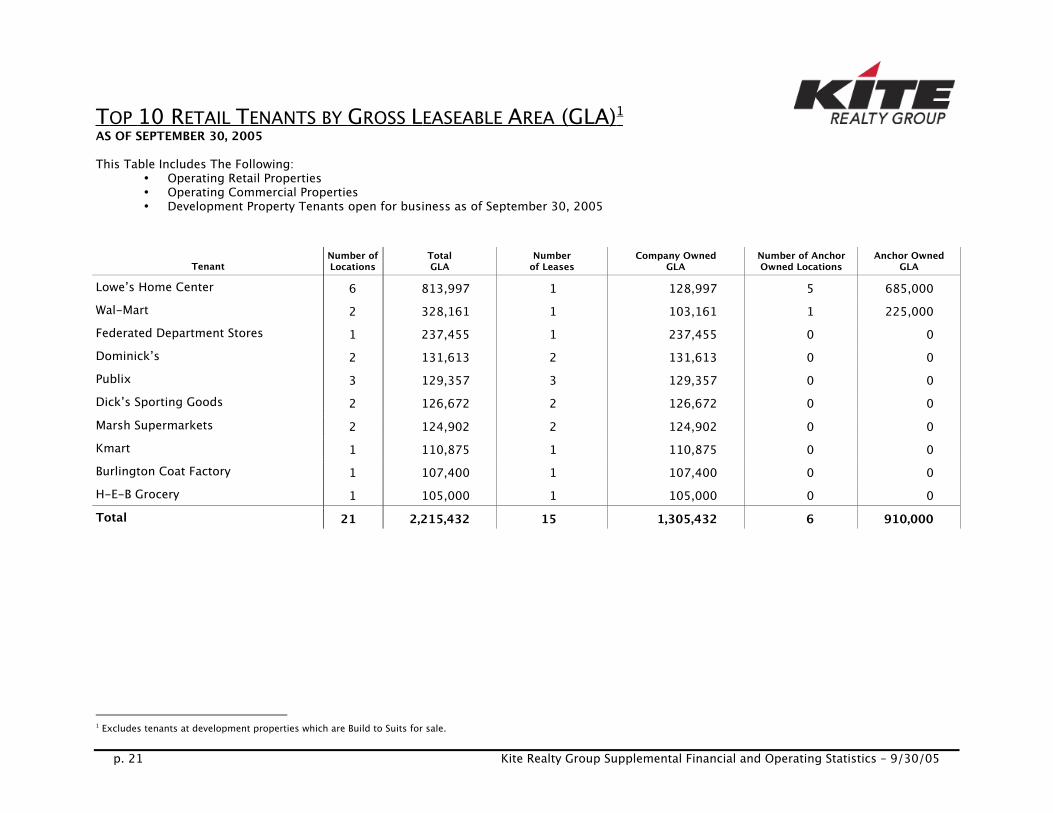
T OP 10 R ETAIL T ENANTS BY G ROSS L EASEABLE A REA (GLA) 1 AS OF SEPTEMBER 30, 2005
This Table Includes The Following:• Operating Retail Properties• Operating Commercial Properties• Development Property Tenants open for business as of September 30, 2005
TenantNumber ofLocations
TotalGLA
Numberof Leases
Company OwnedGLA
Number of AnchorOwned Locations
Anchor OwnedGLA
Lowe’s Home Center 6 813,997 1 128,997 5 685,000Wal-Mart 2 328,161 1 103,161 1 225,000Federated Department Stores 1 237,455 1 237,455 0 0Dominick’s 2 131,613 2 131,613 0 0Publix 3 129,357 3 129,357 0 0Dick’s Sporting Goods 2 126,672 2 126,672 0 0Marsh Supermarkets 2 124,902 2 124,902 0 0Kmart 1 110,875 1 110,875 0 0Burlington Coat Factory 1 107,400 1 107,400 0 0H-E-B Grocery 1 105,000 1 105,000 0 0Total 21 2,215,432 15 1,305,432 6 910,000
1 Excludes tenants at development properties which are Build to Suits for sale.
p. 22 Kite Realty Group Supplemental Financial and Operating Statistics – 9/30/05
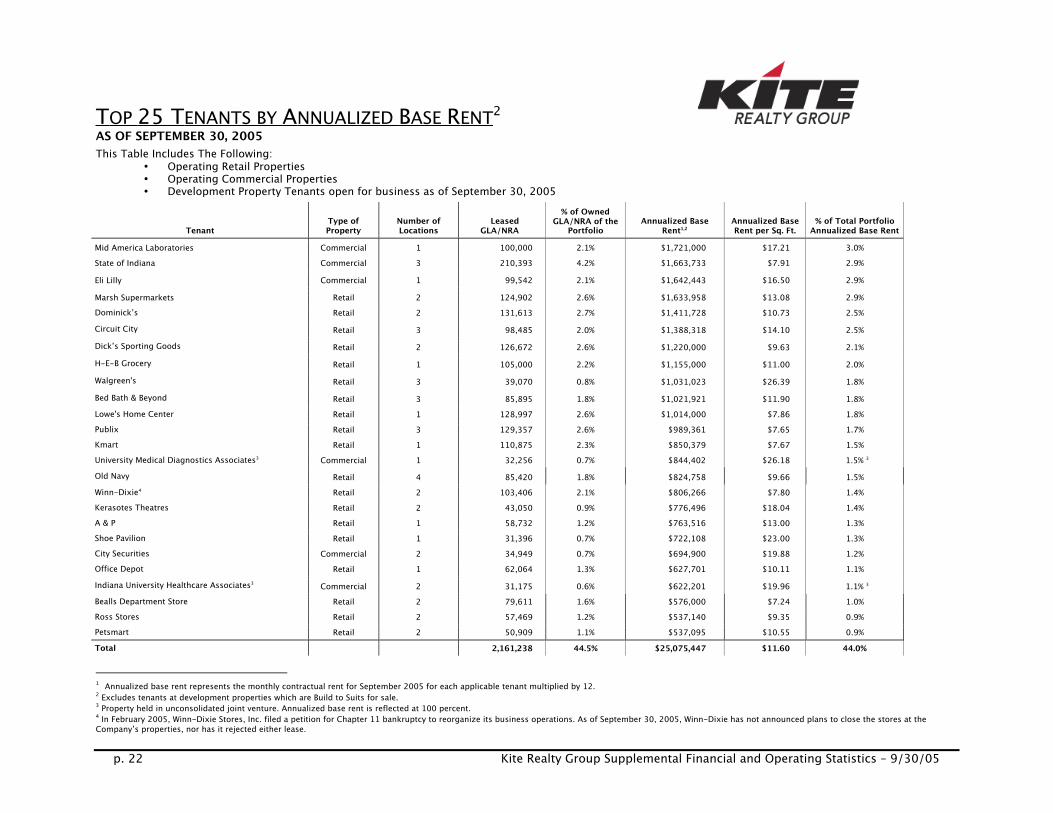
T OP 25 T ENANTS BY A NNUALIZED B ASE R ENT2 AS OF SEPTEMBER 30, 2005This Table Includes The Following:
• Operating Retail Properties• Operating Commercial Properties• Development Property Tenants open for business as of September 30, 2005
TenantType ofProperty
Number ofLocations
LeasedGLA/NRA
% of OwnedGLA/NRA of the
PortfolioAnnualized Base
Rent1,2Annualized BaseRent per Sq. Ft.
% of Total PortfolioAnnualized Base Rent
Mid America Laboratories Commercial 1 100,000 2.1% $1,721,000 $17.21 3.0%State of Indiana Commercial 3 210,393 4.2% $1,663,733 $7.91 2.9%Eli Lilly Commercial 1 99,542 2.1% $1,642,443 $16.50 2.9%Marsh Supermarkets Retail 2 124,902 2.6% $1,633,958 $13.08 2.9%Dominick’s Retail 2 131,613 2.7% $1,411,728 $10.73 2.5%Circuit City Retail 3 98,485 2.0% $1,388,318 $14.10 2.5%Dick’s Sporting Goods Retail 2 126,672 2.6% $1,220,000 $9.63 2.1%H-E-B Grocery Retail 1 105,000 2.2% $1,155,000 $11.00 2.0%Walgreen's Retail 3 39,070 0.8% $1,031,023 $26.39 1.8%Bed Bath & Beyond Retail 3 85,895 1.8% $1,021,921 $11.90 1.8%Lowe's Home Center Retail 1 128,997 2.6% $1,014,000 $7.86 1.8%Publix Retail 3 129,357 2.6% $989,361 $7.65 1.7%Kmart Retail 1 110,875 2.3% $850,379 $7.67 1.5%University Medical Diagnostics Associates3 Commercial 1 32,256 0.7% $844,402 $26.18 1.5% 3
Old Navy Retail 4 85,420 1.8% $824,758 $9.66 1.5%Winn-Dixie4 Retail 2 103,406 2.1% $806,266 $7.80 1.4%Kerasotes Theatres Retail 2 43,050 0.9% $776,496 $18.04 1.4%A & P Retail 1 58,732 1.2% $763,516 $13.00 1.3%Shoe Pavilion Retail 1 31,396 0.7% $722,108 $23.00 1.3%City Securities Commercial 2 34,949 0.7% $694,900 $19.88 1.2%Office Depot Retail 1 62,064 1.3% $627,701 $10.11 1.1%Indiana University Healthcare Associates3 Commercial 2 31,175 0.6% $622,201 $19.96 1.1% 3
Bealls Department Store Retail 2 79,611 1.6% $576,000 $7.24 1.0%Ross Stores Retail 2 57,469 1.2% $537,140 $9.35 0.9%Petsmart Retail 2 50,909 1.1% $537,095 $10.55 0.9%Total 2,161,238 44.5% $25,075,447 $11.60 44.0%
1 Annualized base rent represents the monthly contractual rent for September 2005 for each applicable tenant multiplied by 12.2 Excludes tenants at development properties which are Build to Suits for sale.3 Property held in unconsolidated joint venture. Annualized base rent is reflected at 100 percent.4 In February 2005, Winn-Dixie Stores, Inc. filed a petition for Chapter 11 bankruptcy to reorganize its business operations. As of September 30, 2005, Winn-Dixie has not announced plans to close the stores at theCompany’s properties, nor has it rejected either lease.

p. 23 Kite Realty Group Supplemental Financial and Operating Statistics – 9/30/05
L EASE E XPIRATIONS – O PERATING P ORTFOLIO1 This Table Includes The Following:
• Operating Retail Properties• Operating Commercial Properties• Development Property Tenants open for business as of September 30, 2005
Number ofExpiringLeases2
ExpiringGLA/NRA3
% of TotalGLA/NRAExpiring
ExpiringAnnualizedBase Rent4
% of TotalAnnualizedBase Rent
ExpiringAnnualizedBase Rentper Sq. Ft.
ExpiringGround Lease
Revenue2005 25 50,573 1.1% $542,192 1.0% $10.72 $02006 64 198,823 4.3% $2,074,280 3.8% $10.43 $02007 75 230,576 5.0% $3,089,465 5.6% $13.40 $02008 40 298,769 6.4% $2,486,013 4.5% $8.32 $02009 55 201,721 4.3% $3,063,787 5.6% $15.19 $02010 58 414,287 8.9% $4,722,507 8.6% $11.40 $02011 29 554,162 11.9% $4,806,411 8.8% $8.67 $02012 32 261,637 5.6% $3,525,338 6.4% $13.47 $85,0002013 17 178,784 3.8% $2,517,716 4.6% $14.08 $02014 29 297,893 6.4% $3,657,302 6.7% $12.28 $427,900Beyond 79 1,974,277 42.3% $24,283,947 44.4% $12.30 $1,672,280
Total 503 4,661,502 100.0% $54,768,958 100.0% $11.75 $2,185,180
1 Excludes tenants at development properties which are Build to Suits for sale.2 Lease expiration table reflects rents in place as of September 30, 2005 and does not include option periods; 2005 expirations include month-to-month tenants. This column also excludes ground leases.3 Expiring GLA excludes square footage for non-owned ground lease structures.4 Annualized base rent represents the monthly contractual rent for September 2005 for each applicable property multiplied by 12. Excludes ground lease revenue.

p. 24 Kite Realty Group Supplemental Financial and Operating Statistics – 9/30/05
L EASE E XPIRATIONS –R ETAIL A NCHOR T ENANTS1 This Table Includes The Following:
• Operating Retail Properties• Development Property Tenants open for business as of September 30, 2005
Number ofExpiringLeases2
ExpiringGLA3
% of TotalGLA
Expiring
ExpiringAnnualized Base
Rent4
% of TotalAnnualizedBase Rent
ExpiringAnnualizedBase Rentper Sq. Ft.
ExpiringGround Lease
Revenue2005 0 0 0.0% $0 0.0% $0.00 $02006 3 66,964 1.4% $170,982 0.3% $2.55 02007 6 91,926 2.0% $744,076 1.4% $8.09 02008 2 210,561 4.5% $792,783 1.5% $3.77 02009 3 69,389 1.5% $669,318 1.2% $9.65 02010 11 284,459 6.1% $2,566,106 4.7% $9.02 02011 6 393,766 8.5% $1,882,968 3.4% $4.78 02012 4 120,399 2.6% $987,158 1.8% $8.20 02013 1 11,960 0.3% $161,460 0.3% $13.50 02014 5 91,602 2.0% $983,243 1.8% $10.73 0Beyond 39 1,652,391 35.3% $17,825,099 32.5% $10.79 240,000
Total 80 2,993,417 64.2% $26,783,193 48.9% $8.95 $240,000
1 Retail anchor tenants are defined as tenants which occupy 10,000 square feet or more. Excludes tenants at development properties which are Build to Suits for sale.2 Lease expiration table reflects rents in place as of September 30, 2005 and does not include option periods; 2005 expirations include month-to-month tenants. This column also excludes ground leases.3 Expiring GLA excludes square footage for non-owned ground lease structures.4 Annualized base rent represents the monthly contractual rent for September 2005 for each applicable property multiplied by 12. Excludes ground lease revenue.

p. 25 Kite Realty Group Supplemental Financial and Operating Statistics – 9/30/05
L EASE E XPIRATIONS – R ETAIL S HOPS This Table Includes The Following:
• Operating Retail Properties• Development Property Tenants open for business as of September 30, 2005
Number ofExpiringLeases1 Expiring GLA2
% of TotalGLA
Expiring
ExpiringAnnualizedBase Rent3
% of TotalAnnualizedBase Rent
ExpiringAnnualizedBase Rentper Sq. Ft.
ExpiringGround Lease
Revenue2005 25 50,573 1.1% $542,192 1.0% $10.72 $02006 59 124,756 2.7% $1,789,650 3.3% $14.35 $02007 67 134,695 2.9% $2,269,897 4.1% $16.85 $02008 37 80,243 1.7% $1,533,292 2.8% $19.11 $02009 52 132,332 2.9% $2,394,469 4.4% $18.09 $02010 46 120,950 2.6% $1,976,622 3.6% $16.34 $02011 20 60,854 1.3% $1,281,000 2.3% $21.05 $02012 26 104,186 2.2% $1,947,473 3.6% $18.69 $85,0002013 12 38,470 0.8% $770,737 1.4% $20.03 $02014 22 56,342 1.2% $1,285,709 2.4% $22.82 $427,900Beyond 33 117,484 2.5% $2,570,215 4.6% $21.88 $1,432,280
Total 399 1,020,885 21.9% $18,361,256 33.5% $17.99 $1,945,180
1 Lease expiration table reflects rents in place as of September 30, 2005 and does not include option periods; 2005 expirations include month-to-month tenants. This column also excludes ground leases.2 Expiring GLA excludes square footage for non-owned ground lease structures.3 Annualized base rent represents the monthly contractual rent for September 2005 for each applicable property multiplied by 12. Excludes ground lease revenue.

p. 26 Kite Realty Group Supplemental Financial and Operating Statistics – 9/30/05
L EASE E XPIRATIONS – C OMMERCIAL T ENANTS
Number ofExpiringLeases1 Expiring NRA
% of TotalNRA
Expiring
ExpiringAnnualizedBase Rent2
% of TotalAnnualizedBase Rent
ExpiringAnnualizedBase Rentper Sq. Ft.
2005 0 0 0.0% $0 0.0% $0.002006 2 7,103 0.2% $113,648 0.2% $16.002007 2 3,955 0.1% $75,493 0.1% $19.092008 1 7,965 0.2% $159,938 0.3% $20.082009 0 0 0.0% $0 0.0% $0.002010 1 8,878 0.2% $179,780 0.3% $20.252011 3 99,542 2.1% $1,642,443 3.0% $16.502012 2 37,052 0.8% $590,708 1.1% $15.942013 4 128,354 2.8% $1,585,519 2.9% $12.352014 2 149,949 3.2% $1,388,350 2.5% $9.26Beyond 7 204,402 4.3% $3,888,631 7.2% $19.02
Total 24 647,200 13.9% $9,624,510 17.6% $14.87
1 Lease expiration table reflects rents in place as of September 30, 2005 and does not include option periods; 2005 expirations include month-to-month tenants. This column also excludes ground leases.2 Annualized base rent represents the monthly contractual rent for September 2005 for each applicable property multiplied by 12.

p. 27 Kite Realty Group Supplemental Financial and Operating Statistics – 9/30/05
S UMMARY R ETAIL P ORTFOLIO S TATISTICS (INCLUDES JOINT VENTURE PROPERTIES)
Retail Portfolio 9/30/05 6/30/05 3/31/05 12/31/04 9/30/04
Company Owned GLA1 – Operating Retail 4,175,813 3,923,243 3,611,708 3,391,900 3,078,616Total GLA1 – Operating Retail 5,685,320 5,356,973 4,806,438 4,566,374 4,108,090Projected Company Owned GLA Under Development2 628,100 946,700 854,300 560,300 545,500Projected Total GLA Under Development 1,772,825 1,927,802 1,736,402 1,252,331 1,382,202
Number of Operating Retail Properties 37 36 33 30 27Number of Retail Properties Under Development 13 12 10 9 10
Percentage Leased – Operating Retail 95.6% 93.8% 93.8% 95.3% 94.9%
Annualized Base Rent & Ground Lease Revenue - RetailProperties3
$46,701,031 $41,304,284 $38,076,654 $35,187,179 $31,814,134
1 “Company Owned GLA” represents gross leasable area that is owned by the Company. “Total GLA” includes Company Owned GLA, plus square footage attributable to non-owned outlot structures on land that is owned by
the Company and ground leased to tenants, plus non-owned anchor space.2 “Projected Company Owned GLA Under Development” represents gross leaseable area under development that is projected to be owned by the Company. “Projected Total GLA” includes Projected Company Owned GLA,
plus projected square footage attributable to non-owned outlot structures on land that is owned by the Company and ground leased to tenants, plus non-owned anchor space that is existing or under construction.3 Annualized base rent represents the monthly contractual rent for September 2005 for each applicable tenant multiplied by 12.
p. 28 Kite Realty Group Supplemental Financial and Operating Statistics – 9/30/05
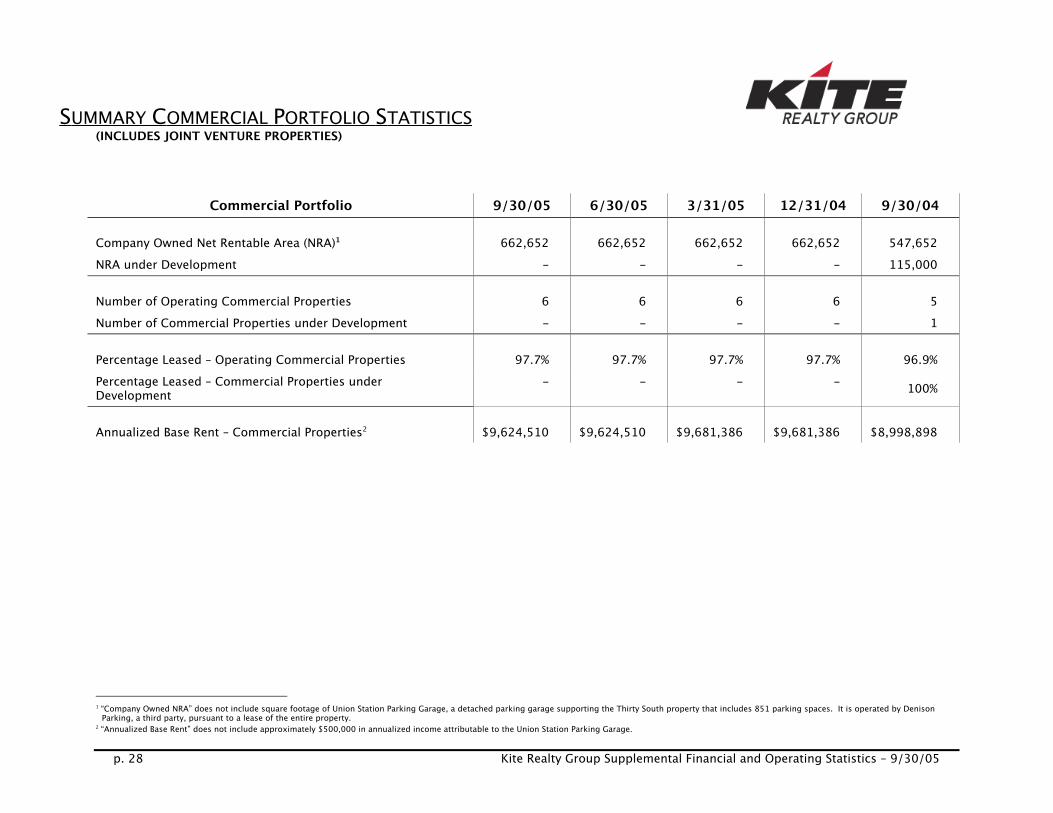
S UMMARY C OMMERCIAL P ORTFOLIO S TATISTICS (INCLUDES JOINT VENTURE PROPERTIES)
Commercial Portfolio 9/30/05 6/30/05 3/31/05 12/31/04 9/30/04
Company Owned Net Rentable Area (NRA)1 662,652 662,652 662,652 662,652 547,652NRA under Development - - - - 115,000
Number of Operating Commercial Properties 6 6 6 6 5Number of Commercial Properties under Development - - - - 1
Percentage Leased – Operating Commercial Properties 97.7% 97.7% 97.7% 97.7% 96.9%Percentage Leased – Commercial Properties underDevelopment
- - - - 100%
Annualized Base Rent – Commercial Properties2 $9,624,510 $9,624,510 $9,681,386 $9,681,386 $8,998,898
1 “Company Owned NRA” does not include square footage of Union Station Parking Garage, a detached parking garage supporting the Thirty South property that includes 851 parking spaces. It is operated by Denison
Parking, a third party, pursuant to a lease of the entire property.2 “Annualized Base Rent” does not include approximately $500,000 in annualized income attributable to the Union Station Parking Garage.

p. 29 Kite Realty Group Supplemental Financial and Operating Statistics – 9/30/05
D EVELOPMENT P IPELINE AS OF SEPTEMBER 30, 2005
2005 Deliveries MSAType ofProperty
OpeningDate1
ProjectedOwned GLA2
ProjectedTotal GLA3
Percent of OwnedGLA Pre-Leased/
Committed4
TotalEstimated
ProjectCost5
Cost Incurredas of Sept. 30,
20055 Major Tenants and Non-owned AnchorsFloridaEagle Creek, Phase II46 Naples, FL Retail Q1 2005 0 165,000 100.0% $9,080 $8,847IndianaTraders Point II Indianapolis, IN Retail Q2 2005 46,600 50,200 46.0% 10,650 8,125 Dick’s Sporting Goods, Marsh, Starbucks
Supermarkets, Bed Bath & Beyond,Kerasotes Theatres, Michaels, Old Navy
Greyhound Commons 6 Indianapolis, IN Retail Q1 2005 0 201,325 n/a 4,397 3,731 Lowe’s (non-owned)
Red Bank Commons Evansville, IN Retail Q1 2005 34,500 246,500 77.7% 6,400 5,923Wal-Mart (non-owned); Home Depot (non-owned)
Geist Pavilion Indianapolis, IN Retail Q1 2005 64,300 64,300 69.4% 11,971 8,487 Marsh Village Market, Party TreeOregon Cornelius Gateway Build To Suit For Sale 9 Portland, OR Retail Q4 2005 36,100 36,100 41.0% 9,200 4,473 Walgreen’sTotal 181,500 763,425 78.7% $51,698 $39,586
2006-2007 Deliveries MSAType ofProperty
OpeningDate1
ProjectedOwned GLA2
ProjectedTotal GLA3
Percent of OwnedGLA Pre-Leased/
Committed4
TotalEstimated
Project Cost5
CostIncurred asof Sept. 30,
20055 Major Tenants and Non-owned Anchors
FloridaTarpon Springs Plaza Naples, FL Retail Q4 2006 95,000 286,800 35.0% $21,500 $10,083 Target (non-owned)Estero Town Commons 4,8,9,10 Naples, FL Retail Q3 2006 25,600 183,600 85.1% 20,000 11,163IndianaBeacon Hill Shopping Center 8,9 Crown Point, IN Retail Q3 2006 56,000 161,000 0.0% 17,000 9,077 Strack & VanTil’s (non-owned)Zionsville Place 8 Indianapolis, IN Retail Q2 2006 37,400 42,400 0.0% 8,000 1,747IllinoisNaperville Marketplace 11 Chicago, IL Retail Q2 2006 175,000 175,000 68.7% 30,500 20,955 Food Expressions by MarshWashington
Sandifur Plaza Build to Suit for Sale8,9 Tri-Cities, WA Retail Q4 2006 27,400 27,400 54.0% 6,400 1,847 Walgreen’sGateway Shopping Center Phase I 7,8,9 Seattle, WA Retail Q1 2007 30,200 133,200 100.0% 8,500 4,792 Kohl’s (non-owned)Total 446,600 1,009,400 57.6% $111,900 $59,664
1 Opening Date is defined as the first date a tenant is open for business or a ground lease or similar payment is made.2 Projected Owned GLA represents gross leasable area that we project will be owned by us. It excludes square footage that we project will be attributable to non-owned outlot structures on land that is owned by us and that we expect to ground lease to tenants. It also excludes
non-owned anchor space.3 Projected Total GLA includes Projected Owned GLA, projected square footage attributable to non-owned outlot structures on land that is owned by us, and non-owned anchor space that is currently existing or under construction.4 Excludes outlots owned by us and ground leased to tenants. Includes leases under negotiation for approximately 124,000 square feet for which we have signed non-binding letters of intent plus two agreements to enter into ground leases with anchor tenants at our Eagle
Creek, Phase II and Estero Town Commons properties. We currently have 22 outlots at the properties in our development pipeline, including three which are currently pre-leased.5 Dollars in thousands.6 All of the land at Eagle Creek, Phase II and Greyhound Commons is intended to be ground leased to tenants. We have entered into an agreement to enter into a ground lease for the entire Eagle Creek, Phase II property with a big box retailer. The tenant is obligated to pay and is paying a portion of its rent until the ground lease is executed. Greyhound Commons consists of four outlots, two of which were ground leased as of September 30, 2005.7 A second phase is anticipated for Gateway Shopping Center and is projected to include 45,000 square feet of small shops, two outlots, and a 93,000 square foot shadow anchor.8 Opening date and/or Total Estimated Project Cost is based on preliminary site plan.9 We own the following development properties through joint ventures: Cornelius Gateway (80%); Sandifur Plaza (Walgreens 80%; small shops 95%); Beacon Hill (preferred return, then 50%); Gateway Shopping Center (preferred return, then 50% until internal rate of return
threshold is reached and then 25%); Estero Town Commons (preferred return, then 40%).10 We have entered into an agreement to enter into ground lease at Estero Town Commons with a big box retailer, which intends to build a 135,000 square foot anchor store.11 A 70,000 square foot Marsh Supermarket opened in August, 2005 and is being marketed for sale.

p. 30 Kite Realty Group Supplemental Financial and Operating Statistics – 9/30/05
G EOGRAPHIC D IVERSIFICATION – O PERATING P ORTFOLIO1 AS OF SEPTEMBER 30, 2005
Number ofOperatingProperties
OwnedGLA/NRA2
Percent ofOwned
GLA/NRA
TotalNumber of
LeasesAnnualizedBase Rent3
Percent ofAnnualizedBase Rent
AnnualizedBase Rent per
Leased SF
Indiana 19 2,189,784 45.3% 215 $23,757,956 43.7% $11.65• Retail – Mall 1 579,189 12.0% 45 $2,412,584 4.4% $4.92
• Retail 12 947,943 19.6% 146 $11,720,862 21.6% $13.00
• Commercial 6 662,652 13.7% 24 $9,624,510 17.7% $14.87
Texas 7 987,218 20.3% 83 $11,771,008 21.6% $12.01Florida 7 828,246 17.1% 97 $8,271,089 15.2% $10.17Illinois 2 231,861 4.8% 35 $2,986,831 5.5% $14.03New Jersey 1 114,928 2.4% 16 $1,737,695 3.2% $16.01Georgia 2 142,707 3.0% 28 $1,604,552 3.0% $11.34Washington 3 102,146 2.1% 26 $1,736,207 3.2% $17.17Ohio 1 231,730 4.8% 6 $2,209,767 4.1% $9.54Oregon 1 9,845 0.2% 7 $267,756 0.5% $27.20Total 43 4,838,465 100.0% 513 $54,342,861 100.0% $11.72
1 Excludes tenants at development properties which are Build to Suits for sale.2 Owned GLA/NRA represents gross leasable area or net leasable area owned by the Company. It does not include 20 parcels or outlots owned by the Company and ground leased to tenants, which contain 20 non-owned
structures totaling approximately 140,980 square feet. It also excludes the square footage of Union Station Parking Garage.3 Annualized Base Rent Revenue excludes $1,982,680 in annualized ground lease revenue attributable to parcels and outlots owned by the Company and ground leased to tenants. It also excludes approximately $500,000 in 2005 annualized minimum rent attributable to Union Station Parking Garage as well as the leases on properties classified as development properties.

p. 31 Kite Realty Group Supplemental Financial and Operating Statistics – 9/30/05
O PERATING R ETAIL P ROPERTIES – T ABLE I AS OF SEPTEMBER 30, 2005
Property 1 State MSAYear
Built/RenovatedYear Added
to Operating Portfolio
Acquired,Redeveloped, or
DevelopedTotalGLA2
OwnedGLA2
Percentage of Owned GLALeased3
International Speedway Square FL Daytona 1999 1999 Developed 233,901 220,901 98.9%King's Lake Square FL Naples 1986/2005 2003 Acquired 85,497 85,497 96.2%Wal-Mart Plaza 4 FL Gainesville 1970 2004 Acquired 177,826 177,826 100.0%Waterford Lakes FL Orlando 1997 2004 Acquired 77,948 77,948 100.0%Shops at Eagle Creek FL Naples 1998 2003 Acquired 75,944 75,944 89.4%Circuit City Plaza FL Ft. Lauderdale 2004 2004 Developed 435,884 45,884 97.0%Indian River Square FL Vero Beach 1997/2004 2005 Acquired 379,246 144,246 100.0%Centre at Panola GA Atlanta 2001 2004 Acquired 73,079 73,079 100.0%Publix at Acworth GA Atlanta 1996 2004 Acquired 69,628 69,628 98.3%Silver Glen Crossing IL Chicago 2002 2004 Acquired 138,315 132,766 89.8%Fox Lake Crossing IL Chicago 2002 2005 Acquired 99,095 99,095 94.4%Glendale Mall IN Indianapolis 1958/2000 1999 Redeveloped 724,026 579,189 84.6%Cool Creek Commons IN Indianapolis 2005 2005 Developed 133,177 120,648 95.0%Boulevard Crossing IN Kokomo 2004 2004 Developed 214,696 112,696 96.0%Traders Point IN Indianapolis 2005 2005 Developed 328,278 252,501 95.7%Hamilton Crossing IN Indianapolis 1999 2004 Acquired 87,424 82,424 100.0%Fishers Station 5 IN Indianapolis 1989/2005 2004 Acquired 114,457 114,457 83.3%Whitehall Pike IN Bloomington 1999 1999 Developed 128,997 128,997 100.0%The Centre 6 IN Indianapolis 1986 1986 Developed 80,689 80,689 94.2%The Corner Shops IN Indianapolis 1984/2003 1984 Developed 42,545 42,545 97.1%Stoney Creek Commons IN Indianapolis 2000 2000 Developed 149,809 0 *Weston Park Phase I IN Indianapolis 2005 2005 Developed 12,200 0 *Martinsville Shops IN Martinsville 2005 2005 Developed 10,986 10,986 100.0%50 South Morton IN Indianapolis 1999 1999 Developed 2,000 2,000 100.0%Ridge Plaza NJ Oak Ridge 2002 2003 Acquired 114,928 114,928 94.4%Eastgate Pavilion OH Cincinnati 1995 2004 Acquired 231,730 231,730 100.0%Shops at Otty 7 OR Portland 2004 2004 Developed 154,845 9,845 100.0%Plaza at Cedar Hill TX Dallas 2000 2004 Acquired 299,783 299,783 100.0%Sunland Towne Centre TX El Paso 1996 2004 Acquired 312,571 307,595 98.9%Galleria Plaza 8 TX Dallas 2002 2004 Acquired 44,306 44,306 100.0%Cedar Hill Village TX Dallas 2002 2004 Acquired 139,092 44,262 100.0%Preston Commons TX Dallas 2002 2002 Developed 142,564 27,564 85.6%Burlington Coat 9 TX San Antonio 1992/2000 2000 Redeveloped 107,400 107,400 100.0%Plaza Volente TX Austin 2004 2005 Acquired 160,308 156,308 100.0%50th & 12th WA Seattle 2004 2004 Developed 14,500 14,500 100.0%176th & Meridian WA Seattle 2004 2004 Developed 14,560 14,560 100.0%Four Corner Square WA Seattle 1985 2004 Acquired 73,086 73,086 98.6%
TOTAL 5,685,320 4,175,813 95.6%(*) Property consists of three outlots, two of which were leased as of September 30, 2005.
1 All properties are wholly-owned, except as indicated. Unless otherwise noted, each property is owned in fee simple by us.2 Owned GLA represents gross leasable area that is owned by us. Total GLA includes Owned GLA, square footage attributable to non-owned anchor space and non-owned structures on ground leases.3 Percentage of Owned GLA Leased reflects Owned GLA/NRA leased as of 9/30/05 except for Stoney Creek Commons and Weston Park Phase I (see * )4 We acquired a 99.9% interest in this property through a joint venture with a third party that manages the property. At the current time, we receive 85% of the cash flow from the property, which percentage may decrease under certain circumstances.5 This property is divided into two parcels: a grocery store and small shops. We own a 25% interest in the small shops in a joint venture and a 100% interest in the grocery store. The joint venture partner is entitled to an annual preferred payment of $96,000. All remaining cash flow isdistributed to us.6 We own a 60% interest in this property through a joint venture with the third party that manages the property.7 We do not own the land at this property. We have leased the land pursuant to two ground leases that expire in 2017. We have six five-year options to renew this lease.8 We do not own the land at this property. We lease the land pursuant to a ground lease that expires in 2027. We have five five-year renewal options.9 We do not own the land at this property. We have leased the land pursuant to a ground lease that expires in 2012. We have six five-year renewal options and a right of first refusal to purchase the land.
p. 32 Kite Realty Group Supplemental Financial and Operating Statistics – 9/30/05
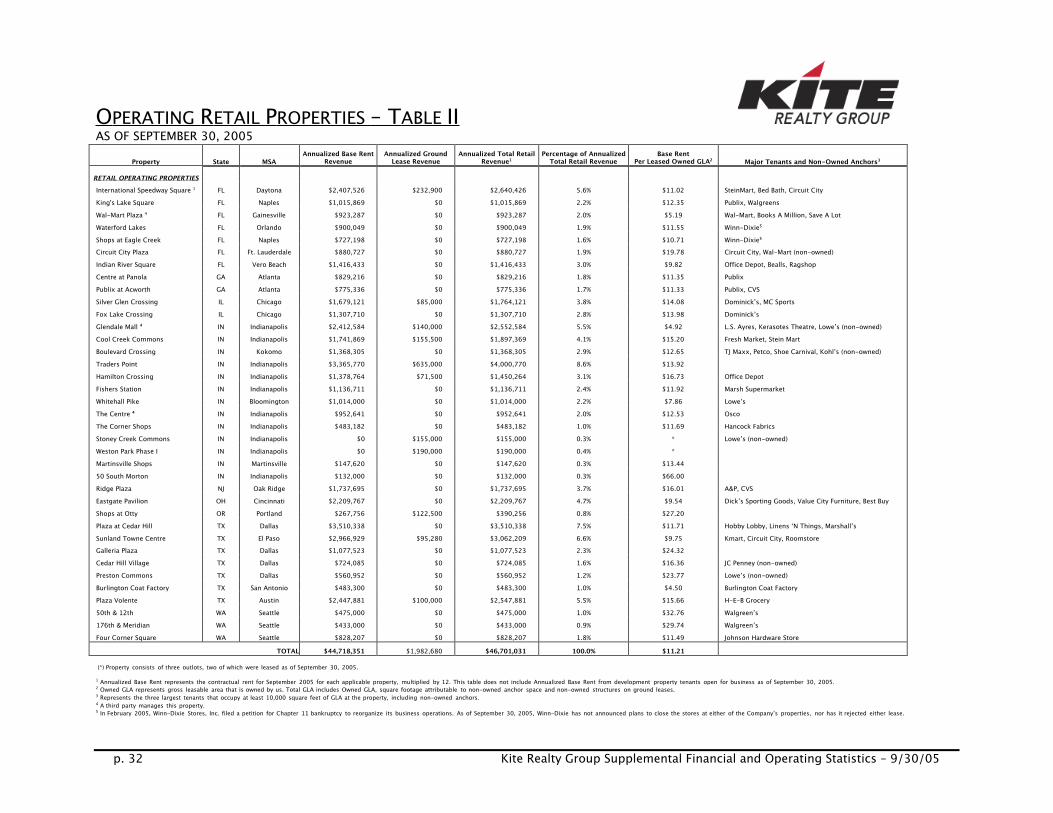
O PERATING R ETAIL P ROPERTIES – T ABLE II AS OF SEPTEMBER 30, 2005
Property State MSAAnnualized Base Rent
RevenueAnnualized Ground
Lease RevenueAnnualized Total Retail
Revenue1Percentage of Annualized
Total Retail RevenueBase Rent
Per Leased Owned GLA2 Major Tenants and Non-Owned Anchors3
RETAIL OPERATING PROPERTIESInternational Speedway Square 1 FL Daytona $2,407,526 $232,900 $2,640,426 5.6% $11.02 SteinMart, Bed Bath, Circuit CityKing's Lake Square FL Naples $1,015,869 $0 $1,015,869 2.2% $12.35 Publix, WalgreensWal-Mart Plaza 4 FL Gainesville $923,287 $0 $923,287 2.0% $5.19 Wal-Mart, Books A Million, Save A LotWaterford Lakes FL Orlando $900,049 $0 $900,049 1.9% $11.55 Winn-Dixie5
Shops at Eagle Creek FL Naples $727,198 $0 $727,198 1.6% $10.71 Winn-Dixie5
Circuit City Plaza FL Ft. Lauderdale $880,727 $0 $880,727 1.9% $19.78 Circuit City, Wal-Mart (non-owned)Indian River Square FL Vero Beach $1,416,433 $0 $1,416,433 3.0% $9.82 Office Depot, Bealls, RagshopCentre at Panola GA Atlanta $829,216 $0 $829,216 1.8% $11.35 PublixPublix at Acworth GA Atlanta $775,336 $0 $775,336 1.7% $11.33 Publix, CVSSilver Glen Crossing IL Chicago $1,679,121 $85,000 $1,764,121 3.8% $14.08 Dominick’s, MC SportsFox Lake Crossing IL Chicago $1,307,710 $0 $1,307,710 2.8% $13.98 Dominick’sGlendale Mall 4 IN Indianapolis $2,412,584 $140,000 $2,552,584 5.5% $4.92 L.S. Ayres, Kerasotes Theatre, Lowe’s (non-owned)Cool Creek Commons IN Indianapolis $1,741,869 $155,500 $1,897,369 4.1% $15.20 Fresh Market, Stein MartBoulevard Crossing IN Kokomo $1,368,305 $0 $1,368,305 2.9% $12.65 TJ Maxx, Petco, Shoe Carnival, Kohl’s (non-owned)Traders Point IN Indianapolis $3,365,770 $635,000 $4,000,770 8.6% $13.92Hamilton Crossing IN Indianapolis $1,378,764 $71,500 $1,450,264 3.1% $16.73 Office DepotFishers Station IN Indianapolis $1,136,711 $0 $1,136,711 2.4% $11.92 Marsh SupermarketWhitehall Pike IN Bloomington $1,014,000 $0 $1,014,000 2.2% $7.86 Lowe’sThe Centre 4 IN Indianapolis $952,641 $0 $952,641 2.0% $12.53 OscoThe Corner Shops IN Indianapolis $483,182 $0 $483,182 1.0% $11.69 Hancock FabricsStoney Creek Commons IN Indianapolis $0 $155,000 $155,000 0.3% * Lowe’s (non-owned)Weston Park Phase I IN Indianapolis $0 $190,000 $190,000 0.4% *Martinsville Shops IN Martinsville $147,620 $0 $147,620 0.3% $13.4450 South Morton IN Indianapolis $132,000 $0 $132,000 0.3% $66.00Ridge Plaza NJ Oak Ridge $1,737,695 $0 $1,737,695 3.7% $16.01 A&P, CVSEastgate Pavilion OH Cincinnati $2,209,767 $0 $2,209,767 4.7% $9.54 Dick’s Sporting Goods, Value City Furniture, Best BuyShops at Otty OR Portland $267,756 $122,500 $390,256 0.8% $27.20Plaza at Cedar Hill TX Dallas $3,510,338 $0 $3,510,338 7.5% $11.71 Hobby Lobby, Linens ‘N Things, Marshall’sSunland Towne Centre TX El Paso $2,966,929 $95,280 $3,062,209 6.6% $9.75 Kmart, Circuit City, RoomstoreGalleria Plaza TX Dallas $1,077,523 $0 $1,077,523 2.3% $24.32Cedar Hill Village TX Dallas $724,085 $0 $724,085 1.6% $16.36 JC Penney (non-owned)Preston Commons TX Dallas $560,952 $0 $560,952 1.2% $23.77 Lowe’s (non-owned)Burlington Coat Factory TX San Antonio $483,300 $0 $483,300 1.0% $4.50 Burlington Coat FactoryPlaza Volente TX Austin $2,447,881 $100,000 $2,547,881 5.5% $15.66 H-E-B Grocery50th & 12th WA Seattle $475,000 $0 $475,000 1.0% $32.76 Walgreen’s176th & Meridian WA Seattle $433,000 $0 $433,000 0.9% $29.74 Walgreen’sFour Corner Square WA Seattle $828,207 $0 $828,207 1.8% $11.49 Johnson Hardware Store
TOTAL $44,718,351 $1,982,680 $46,701,031 100.0% $11.21
(*) Property consists of three outlots, two of which were leased as of September 30, 2005.1 Annualized Base Rent represents the contractual rent for September 2005 for each applicable property, multiplied by 12. This table does not include Annualized Base Rent from development property tenants open for business as of September 30, 2005.2 Owned GLA represents gross leasable area that is owned by us. Total GLA includes Owned GLA, square footage attributable to non-owned anchor space and non-owned structures on ground leases.3 Represents the three largest tenants that occupy at least 10,000 square feet of GLA at the property, including non-owned anchors.4 A third party manages this property.5 In February 2005, Winn-Dixie Stores, Inc. filed a petition for Chapter 11 bankruptcy to reorganize its business operations. As of September 30, 2005, Winn-Dixie has not announced plans to close the stores at either of the Company’s properties, nor has it rejected either lease.

p. 33 Kite Realty Group Supplemental Financial and Operating Statistics – 9/30/05
O PERATING C OMMERCIAL P ROPERTIES AS OF SEPTEMBER 30, 2005
Property MSAYear Built/Renovated
Acquired,Redeveloped,or Developed Owned NRA
Percentage ofOwned NRA
LeasedAnnualizedBase Rent1
Percentage ofAnnualizedCommercialBase Rent
Base Rent PerLeased Sq. Ft. Major Tenants
IndianaThirty South Indianapolis 1905/2002 Redeveloped 298,346 94.8% $4,930,221 51.2% $17.43 Eli Lilly, City Securities, Kite Realty GroupMid America Clinical Labs Indianapolis 1995/2002 Redeveloped 100,000 100.0% 1,721,000 17.9% 17.21 Mid-America Clinical LaboratoriesPEN Products Indianapolis 2003 Developed 85,875 100.0% 813,236 8.5% 9.47 Indiana Department of AdministrationSpring Mill Medical2 Indianapolis 1998/2002 Redeveloped 63,431 100.0% 1,466,603 15.2% 23.12 University Medical Diagnostic Associates;
Indiana University Healthcare AssociatesUnion Station Parking Garage3 Indianapolis 1986 Acquired N/A N/A N/A N/A N/A Denison ParkingIndiana State Motor Pool Indianapolis 2004 Developed 115,000 100.0% 693,450 7.2% 6.03 Indiana Dept. of AdministrationTotal 662,652 97.7% $9,624,510 100.0% $14.87
1 Annualized base rent represents the monthly contractual rent for September 2005 for each applicable property, multiplied by 12.2 We own a 50% interest in this property through a joint venture with one of the tenants at this property.3 2005 annualized base rent is approximately $500,000.

p. 34 Kite Realty Group Supplemental Financial and Operating Statistics – 9/30/05
R ETAIL O PERATING P ORTFOLIO – T ENANT B REAKDOWN1 AS OF SEPTEMBER 30, 2005
Owned Gross Leasable Area Occupancy Annualized Base Rent1Annualized Base Rent per Occupied Square
Foot
Property State Anchors Shops Total Anchors Shops Total Anchors ShopsGroundLeases Total Anchors Shops Total
ISS FL 200,401 20,500 220,901 100.0% 88.2% 98.9% $2,074,376 $333,150 $232,900 $2,640,426 $10.35 $18.43 $11.02King's Lake Square FL 49,805 35,692 85,497 100.0% 91.0% 96.3% $361,793 $654,076 $0 $1,015,869 $7.26 $20.14 $12.35Wal-Mart Plaza FL 138,323 39,503 177,826 100.0% 100.0% 100.0% $538,544 $384,743 $0 $923,287 $3.89 $9.74 $5.19Waterford Lakes FL 51,703 26,245 77,948 100.0% 100.0% 100.0% $408,452 $491,597 $0 $900,049 $7.90 $18.73 $11.55Shops at Eagle Creek FL 51,703 24,241 75,944 100.0% 66.7% 89.4% $397,814 $329,384 $0 $727,198 $7.69 $20.37 $10.71Circuit City Plaza FL 33,014 12,870 45,884 100.0% 89.5% 97.1% $594,252 $286,475 $0 $880,727 $18.00 $24.88 $19.78Indian River Square FL 116,342 27,904 144,246 100.0% 100.0% 100.0% $942,078 $474,355 $0 $1,416,433 $8.10 $17.00 $9.82Centre at Panola GA 51,674 21,405 73,079 100.0% 100.0% 100.0% $413,388 $415,828 $0 $829,216 $8.00 $19.43 $11.35Acworth GA 37,888 31,740 69,628 100.0% 96.2% 98.3% $337,203 $438,133 $0 $775,336 $8.90 $14.35 $11.33Silver Glen Crossing IL 78,675 54,091 132,766 100.0% 75.1% 89.8% $812,916 $866,204 $85,000 $1,764,121 $10.33 $21.34 $14.08Fox Lake Crossing IL 65,977 33,118 99,095 100.0% 83.2% 94.4% $742,241 $565,469 $0 $1,307,710 $11.25 $20.51 $13.98Glendale Mall IN 437,702 141,487 579,189 91.2% 64.0% 84.6% $1,358,251 $1,054,333 $140,000 $2,552,584 $3.40 $11.64 $4.92Cool Creek Commons IN 53,600 67,048 120,648 100.0% 91.0% 95.0% $419,600 $1,322,269 $155,500 $1,897,369 $7.83 $21.67 $15.20Boulevard Crossing IN 74,440 38,256 112,696 100.0% 88.2% 96.0% $827,460 $540,845 $0 $1,368,305 $11.12 $16.04 $12.65Traders Point IN 211,664 40,837 252,501 100.0% 73.6% 95.7% $2,645,267 $720,504 $635,000 $4,000,770 $12.50 $23.96 $13.92Hamilton Crossing IN 30,722 51,702 82,424 100.0% 100.0% 100.0% $345,623 $1,033,141 $71,500 $1,450,264 $11.25 $19.98 $16.73Fishers Station IN 57,000 57,457 114,457 100.0% 66.8% 83.3% $575,000 $561,711 $0 $1,136,711 $10.09 $14.64 $11.92Whitehall Pike IN 128,997 0 128,997 100.0% 100.0% $1,014,000 $0 $0 $1,014,000 $7.86 $7.86The Centre IN 18,720 61,969 80,689 100.0% 92.5% 94.2% $170,352 $782,289 $0 $952,641 $9.10 $13.65 $12.53The Corner Shops IN 12,200 30,345 42,545 100.0% 96.0% 97.1% $65,636 $417,546 $0 $483,182 $5.38 $14.34 $11.69Stoney Creek Commons IN $0 $0 $155,000 $155,000Weston Park Phase I IN $0 $0 $190,000 $190,000Martinsville Shops IN 0 10,986 10,986 100.0% 100.0% $0 $147,620 $0 $147,620 $13.44 $13.4450 South Morton IN 0 2,000 2,000 100.0% 100.0% $0 $132,000 $0 $132,000 $66.00 $66.00Ridge Plaza NJ 69,612 45,316 114,928 100.0% 85.9% 94.4% $986,556 $751,139 $0 $1,737,695 $14.17 $19.31 $16.01Eastgate Pavilion OH 231,730 0 231,730 100.0% 100.0% $2,209,767 $0 $0 $2,209,767 $9.54 $9.54Shops at Otty OR 0 9,845 9,845 100.0% 100.0% $0 $267,756 $122,500 $390,256 $27.20 $27.20Plaza at Cedar Hill TX 227,106 72,677 299,783 100.0% 100.0% 100.0% $2,157,576 $1,352,762 $0 $3,510,338 $9.50 $18.61 $11.71Sunland Towne Centre TX 277,220 30,375 307,595 100.0% 89.2% 98.9% $2,506,502 $460,427 $95,280 $3,062,209 $9.04 $16.98 $9.75Galleria Plaza TX 31,396 12,910 44,306 100.0% 100.0% 100.0% $722,108 $355,415 $0 $1,077,523 $27.53 $24.32Cedar Hill Village TX 32,231 12,031 44,262 100.0% 100.0% 100.0% $483,465 $240,620 $0 $724,085 $20.00 $16.36Preston Commons TX 0 27,564 27,564 85.6% 85.6% $0 $560,952 $0 $560,952 $23.77 $23.77Burlington Coat Factory TX 107,400 0 107,400 100.0% 100.0% $483,300 $0 $0 $483,300 $4.50 $4.50Plaza Volente TX 105,000 51,308 156,308 100.0% 100.0% 100.0% $1,155,000 $1,292,881 $100,000 $2,547,881 $11.00 $25.20 $15.6650th & 12th WA 14,500 0 14,500 100.0% 100.0% $475,000 $0 $0 $475,000 $32.76 $32.76176th & Meridian WA 14,560 0 14,560 100.0% 100.0% $433,000 $0 $0 $433,000 $29.74 $29.74Four Corner Square WA 20,512 52,574 73,086 100.0% 98.1% 98.6% $126,672 $701,535 $0 $828,207 $6.18 $13.60 $11.49
Total 3,031,817 1,143,996 4,175,813 98.7% 87.1% 95.6% $26,783,192 $17,935,159 $1,982,680 $46,701,031 $8.95 $17.99 $11.21
1 This table does not include annualized base rent from development property tenants open for business as of September 30, 2005.

p. 35 Kite Realty Group Supplemental Financial and Operating Statistics – 9/30/05
2005 A CQUISITIONS OF O PERATING P ROPERTIES
Name of OperatingProperty MSA
DateAcquired
AcquisitionCost
Assumed/RelatedDebt Total GLA Owned GLA
Major Tenantsand Non-Owned Anchors
Fox Lake Crossing Chicago, Illinois 02/07/05 15,500,0001 12,300,0002 99,095 99,095 Dominick’s
Indian River Square Vero Beach, FL 5/16/05 16,500,000 16,500,0003 379,246 144,246Office Depot, Bealls DepartmentStore, The Ragshop
Plaza Volente Austin, TX 5/16/05 35,900,000 35,900,0004 160,308 156,308 H-E-B Grocery
1 Excludes tax-increment financing (TIF) receivable of $1.5 million.2 Represents fixed rate debt assumed at an interest rate of 5.16%.3 The Company financed this acquisition with $13.3 million of new 10-year fixed-rate debt at an interest rate of 5.42% and borrowing under its revolving credit facility of $3.2 million.4 The Company financed this acquisition with $28.7 million of new 10-year fixed-rate debt at an interest rate of 5.42% and borrowing under its revolving credit facility of $7.2 million.