s? '° ,.,««»j »: :««»„'??„. fS2 - NASA · INTRODUCTION As part of the NASA Highly...
25
NASA Technical Memorandum 86042 Copy_^_ of 25 Time and Fuel Flight Profiles for an F-15 Airplane With a Highly Integrated Digital Electronic Control System Edward A. Haering, Jr., and Frank W. Burcham, Jr. n '° n » T »: :««»"„'??„., —^-m*, HIGHLY IKTEGaiIED 0 BI6T T fT 1 |,i 1 """ "IH t '«•>«=, s? STEg ,.,««»j P E "c ci fS2 s /« c F c 4 °o N r oL «C1 01C G3/OS 0 ""o3o aS June 1984 IWVSA National Aeronautics and Space Administration https://ntrs.nasa.gov/search.jsp?R=19860014116 2018-07-09T03:02:27+00:00Z
Transcript of s? '° ,.,««»j »: :««»„'??„. fS2 - NASA · INTRODUCTION As part of the NASA Highly...

NASA Technical Memorandum 86042 Copy_^_ of 25
Time and Fuel FlightProfiles for an F-15 Airplane With aHighly Integrated Digital ElectronicControl System
Edward A. Haering, Jr., and Frank W. Burcham, Jr.
n'°n»T»: :««»"„'??„., —^-m*,H I G H L Y IKTEGaiIED0BI6TTfT1|,i1""" "IH t'«•>«=, s?STEg ,.,««»j PE"ccifS2s/«c
Fc4°oNroL
«C1 01C G3/OS 0""o3oaS
June 1984
IWVSANational Aeronautics andSpace Administration
https://ntrs.nasa.gov/search.jsp?R=19860014116 2018-07-09T03:02:27+00:00Z
NASA Technical Memorandum 86042
Minimum Time and Fuel FlightProfiles for an F-15 Airplane With aHighly Integrated Digital ElectronicControl SystemEdward A. Haering, Jr., and Frank W. Burcham, Jr.Ames Research Center, Dryden Flight Research Facility, Edwards, California 93523
1984
NASANational Aeronautics andSpace AdministrationAmes Research CenterDryden Flight Research FacilityEdwards, California 93523

INTRODUCTION
As part of the NASA Highly Integrated Digital Electronic Control (HIDEOprogram, the performance improvements due to the integration of the propulsion andflight control systems on an F-15 airplane are being evaluated. Results of thepreviously conducted Integrated Research AirCraft Technology (INTERACT) program(ref. 1) has shown the benefits of integration of the propulsion and flight controlsystems. Two of the control modes investigated in the INTERACT studies were optimumflight path trajectories and adaptive engine stall margin. These modes have beenincorporated in the HIDEC program. The adaptive engine stall margin mode, or uptrim,allows engine stall margin to be traded for increased thrust. However, duringunusual manuevers or transients, the full stall margin (no uptrim) is required. Theoptimum flight path modes allow the airplane to be more efficiently flown from oneflight condition to another. For this report, the optimum trajectories for minimumtime and minimum fuel are determined, and the effects of the the adaptive stallmargin (uptrim) are evaluated. Comparisons are made to a pilot's estimate of theoptimum flight paths. The data used in this study is limited to standard dayconditions at maximum thrust for the clean configuration of the F-15.
SYMBOLS AND ABBREVIATIONS
Units are given in the International System of Units (SI) and parentheticallyin U.S. Customary Units. Most of the calculations were made in Customary Units andconverted to SI Units.
Alpha angle of attack, deg
CD drag coefficient
CL lift coefficient
DEEC digital electronic engine control
EMD engine model derivative
Es specific energy, m/kg (ft/lb)
INTERACT Integrated research aircraft technology
M Mach number
H altitude, m (ft)
HIDEC highly integrated digital electronic control
_ Ps specific excess power, m/sec (ft/sec)
PsOWDT Ps divided by fuel flow, m/kg (ft/lb)
PTINF free stream total pressure, kN/m2 (lb/in2)
PT2 engine inlet total pressure, kN/m2 (lb/in2)

DESCRIPTION OF AIRPLANE
The simulation used for this optimization and comparison study was of an F-15supersonic fighter powered by two F100 Engine Model Derivative (EMD) engines. TheF-15 is an all-weather air superiority fighter with excellent transonicmaneuverability and Mach number capability to 2.5. A three-view drawing of the F-15is shown in figure 1. The takeoff gross weight for this study was 173-5 kN(39,000 Ib).
Aerodynamics
Aerodynamic characteristics of the airplane were represented in terms of liftand drag coefficients and angle of attack as a function of Mach number. These datawere obtained from F-15 flight tests (ref. 2). Figure 2 shows the drag coefficient,CD, as a function of Mach number and lift coefficient, CL. The angle of attack,Alpha, is shown in figure 3 as a function of CL and M.
Inlet
The inlet characteristics, in terms of total pressure recovery, PT2/PTINF, ofthe F-15, were determined for the maximum power airflow values of the F100 EMDengine over the Mach number range as shown in figure 4. These values were used asinputs to the EMD engine thrust deck.
Engine
The engines used in this evaluation were the F100 EMD engines, shown infigure 5. These engines were built by Pratt And Whitney Aircraft and have a companydesignation of PW 1128. The engine is a low bypass after-burning turbofan which isan upgraded version of the F100-PW-100 engine which powers the production F-15airplanes. Figure 5 shows the features of the F100 EMD engine and the differ-ences from the F100-PW-100 engine. It has a sea-level-static thrust rating ofapproximately 122.33 kN (27,500 Ib). The F100 EMD engine is equipped with a digitalelectronic engine control (DEEC). Because of its ability to accept airplane inputs,the DEEC makes it practical to vary the engine stall margin as a function ofappropriate airplane inputs. For this study, the uptrim capability determined fromthe INTERACT study (ref. 1) was used.
Thrust and Fuel Flow
The values of thrust and fuel flow for the F100 EMD were generated through theuse of the Pratt and Whitney FIDO EMD status deck, PWA CCD 1194.2 (ref. 3). Figures6 and 7 show the thrust and fuel flow data respectively as a function of Mach numberand altitude. These data were generated for standard day conditions only. Typicalhorsepower extraction (48,470 W (65 hp)) and customer bleed (0.32 kg/sec(0.7 lb/sec)) values were assumed, and the inlet recovery of figure 4 was used.
Uptrim
Figure 8 shows the engine uptrim that may be expected for an engine with anadaptive stall margin capability, as determined from the INTERACT studies. Theuptrim factors as a function of Mach number and altitude are applied to thrust and

fuel flow for the maximum afterburning power setting. This produces a thrustincrease without any change in specific fuel consumption.
OPTIMIZATION TECHNIQUE
The optimization technique of Rutowski (ref. 4) has been used in this study todetermine minimum time and minimum fuel consumed trajectories.
To generate the minimum time profile, the specific energy and specific excesspower must be known. For this study, specific energy, Es, is defined as the sum ofthe potential and kinetic energy per unit weight, and is a function only of altitudeand velocity and is independent of airplane configuration. Specific excess power,Ps, is defined as the time derivative of Es, that is, dEs/dt. Ps is a function ofthe airplane thrust and drag, and thus must be determined for each flight conditionand power setting. The Ps contours and the lines of constant specific energy aresuperimposed upon each other and the points of tangency define the minimum time pathfor a given configuration, as indicated schematically in figure 9. The minimum fuelprofile requires the same type of manipulation, but the two variables are Es andPsOWDT, specific excess power divided by fuel flow, or energy gain per kilogram(pound) of fuel burned. A minimum fuel profile is shown schematically in figure 10.
The flight paths were optimized for the F100 EMD without and with uptrim. Oncethe optimum flight path for each engine control mode was determined, the correspond-ing differences between the two modes were compared.
TRAJECTORY PROGRAM
A computer program was used to generate time histories of airplane trajectoriesand provide calculated values of velocity, range, fuel consumed, Ps, PsOWDT andnumerous other parameters. The three dimensional trajectory analysis program uses apoint mass representation of the airplane and integrates the equations of motionwhile following a given flight profile.
The program was used for two different purposes. The first purpose is togenerate the data for the Ps and PsOWDT contours by computing level accelerations atvarious altitudes. The second purpose is to evaluate the optimum flight pathsgenerated by the Rutowski technique. The trajectories were input to the program asMach number—altitude flight profiles.
PROCEDURE
The data for the Ps and PsOWDT contours was obtained by computing levelaccelerations at altitude increments of 1,524 m (5,000 ft) from sea level to16,764 m (55,000 ft) with the three dimensional trajectory program. Beginningweight for each acceleration was 173.5 kN (39tOOO Ib) and weight decreased as fuelwas burned.

All the optimum flight path profiles started at Mach 0.15 and 1,524 m(5000 ft). In some cases, simplifications to optimum profiles were made tofacilitate implementation in the trajectory program. The ending conditions wereMach 2.0 at 13,716 m (45,000 ft). All of the trajectories started with a levelacceleration to an optimum climbing Mach number. The flight paths were input to thetrajectory program in short straight line segments as determined by the Ps andPsOWDT contours.
The optimum flight profiles were compared to a pilot's estimated optimumprofile, which was calculated without uptrim. The pilot's estimate was based uponthe information in the F-15 flight manual (ref. 5) and from previous flightexperience in the F-15.
RESULTS AND DISCUSSION
Minimum Time Profiles
Figure 11 shows the Ps contours for the F-15 with the F100 EMD engines withoutuptrim, for 1 g flight. Maximum Ps values occur at low altitudes around Mach 0.9.At higher altitudes and at supersonic speeds, Ps values are lower. The minimum timeto climb path is also shown. It consists of a level acceleration at 1,524 m(5000 ft) to Mach 0.98, a climb with a slight acceleration to 8,077 m (26,500 ft),an acceleration with a slight climb to Mach 2.0, and a constant Mach climb to13,716 m (45,000 ft). The final constant Mach climb is used in place of the optimalflight path which would include an acceleration to a slightly higher Mach numberfollowed by a climbing deceleration along a constant energy line.
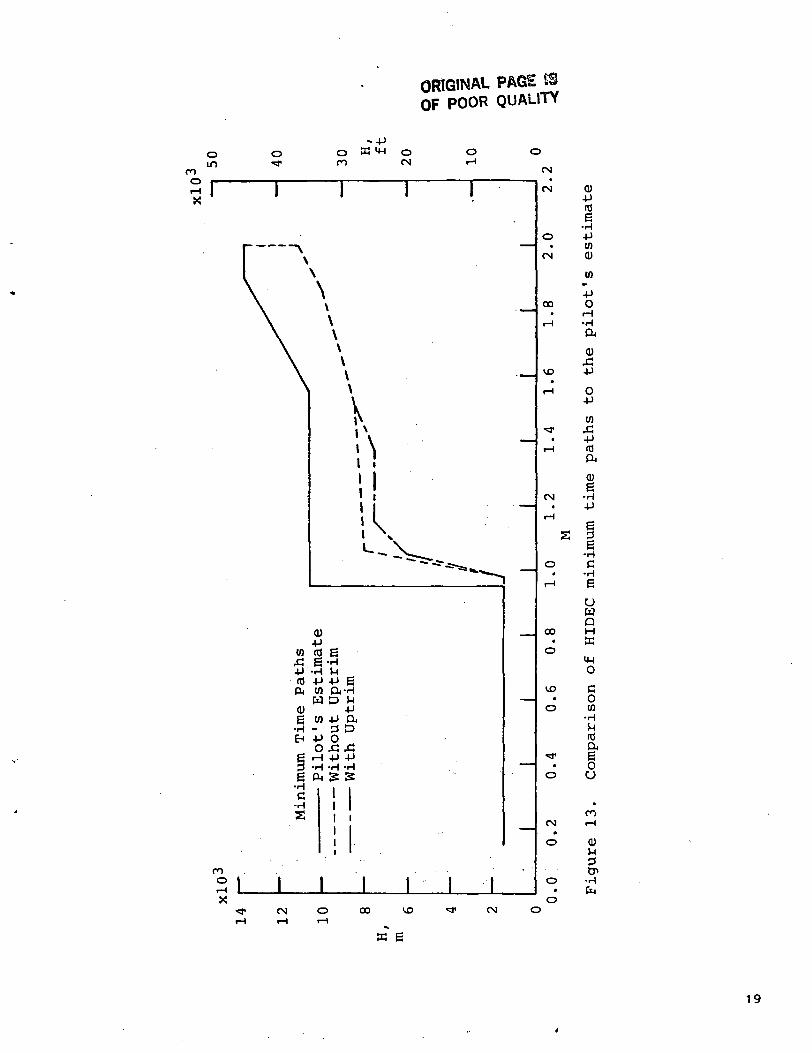
The Ps contours for the F-15 with uptrim are shown in figure 12. The Ps valuesfor a given Mach number and altitude are greater than those of Figure 11 withoutuptrim, although the shape of the two sets of contours are similar. The profile forminimum time is also shown, and is similar to the optimum profile without uptrim.
The two minimum time profiles are compared in figure 13. Also shown is thepilot's estimate of the minimum time profile, based on information in the F-15flight manual. The figure shows that for transonic and higher Mach numbers, theoptimum profiles are flown at lower altitudes than the pilot's estimate.
The times required to reach Mach 2.0, at an altitude of 13,716 m (45,000 ft)are compared in Table 1. The pilot's estimate took 2.97 min, while the optimumprofile without uptrim took 2.54 min, or 15 percent less. The optimum profile withuptrim took 2.28 rain, or 23 percent less than the pilot's estimate. The profilewith uptrim is 10 percent faster than the profile without uptrim. The optimum timeprofiles used more fuel than the pilot's estimate.
Minimum Fuel Profiles
The contours of PsOWDT for the F-15 without uptrim are shown in figure 14.Maximum values of PsOWDT lie in the Mach 0.8 to 1.0 range. The minimum fuel to climbflight path without uptrim is also shown. It consists of a level acceleration at1,524 m (5,000 ft), followed by a constant Mach climb at Mach 0.98 to an altitude of13,716 m (45,000 ft). The remainder of the profile is an acceleration withaltitudes slightly lower than 13,716 m (45,000 ft).

Figure 15 shows the PsOWDT contours with uptrim and the corresponding minimumfuel path. The contours and the profile for mimimum fuel are very similar to thosewithout uptrim (fig. 14).
The two minimum fuel profiles and the pilot's estimate are shown in figure 16.The pilot's estimate of the minimum fuel profile was derived from the pilot's manualand the pilot's previous experience. In this case, the pilot's estimate was veryclose to the optimum profiles.
Results of the three profiles are compared in Table 2. The pilot's estimatetook 1,755 kg (3,870 Ib) of fuel, while the minimum fuel profile without uptrim took1t735 kg (3,826 Ib), a savings of 1 percent. The time required was 15 percent lesseven though the fuel saving was small. The minimum fuel profile with uptrim took1|659 kg (3,658 Ib) of fuel, a saving of 5 percent compared to the pilot's estimate,and the time required was 20 percent less. The profile with uptrim used 4 percentless fuel than the profile without uptrim. In this case, the very good pilot'sestimate minimized the benefit of the optimization technique in fuel savings, butthe optimization did show reduced times.
CONCLUSIONS
A computer study was performed on an F-15 fighter with two Pratt and WhitneyF100 EMD engines installed. This study was conducted to determine optimum time andfuel trajectories for the F100 EMD engines without and with uptrim. Thesetrajectories were then compared. The following conclusions were reached:
1. Ps and PsOWDT contours with uptrim are similar in shape and greater in valuethan the corresponding contours without uptrim.
2. The minimum time trajectory without uptrim was 15 percent faster and used 8percent more fuel than the pilot's estimate for minimum time.
3. The minimum time trajectory with uptrim was 23 percent faster and used 5 percentmore fuel than the pilot's estimate for minimum time.
4. The minimum fuel trajectory without uptrim used 1 percent less fuel and was 15percent faster than the pilot's estimate for minimum fuel.
5. The uptrimmed minimum fuel trajectory used 5 percent less fuel and was 20percent faster than the pilot's estimate for minimum fuel.
6. For transonic speeds and above, all optimum trajectories are lower in altitudethan the pilot's estimate.
Ames Research CenterDryden Flight Research FacilityNational Aeronautics and Space AdministrationEdwards, California 93523, April 3, 1984

REFERENCES
1. Burchara, Frank W., Jr., and Stewart, James F.: The Development Process forIntegrated Propulsion-Flight Controls. NASA CP-2162, 1980.
2. Zaloga, Thomas: F-15A Performance Air Force Development Test and Evaluation(AFDT & E). AFFTC-TR-77-7, July 1977.
3. F100 EMDP Prototype Engine Flight Demonstration Performance Model, User'sManual for Deck CCD 1194.2. Pratt and Whitney Aircraft Report FR-16212,Mar. 31. 1983-
M. Porter, Capt. Milton B. Jr.: RUTOP—Rutowski Optimization Computer Program.AFFTC-TR-68-14, Jan. 1969.
5. F-15 Flight Manual, USAF TO-1F-15A-1, Nov. 1978.

TABLE 1. - TIME AND FUEL FOR MINIMUM TIME PATHS
Minimum time paths
Pilot's estimateWithout uptrimWith uptrim
Time
Min.
2.972.542.28
Percentdifference
-15-23
Fuel
kg (Ib)
1789 (3944)1949 (4297)1881 (4146)
Percentdifference
+8+5
TABLE 2. - TIME AND FUEL FOR MINIMUM FUEL PATHS
Minimum fuel paths
Pilot's estimateWithout uptrimWith uptrim
Time
Min.
4.153.543.32
Percentdifference
-15-20
Fuel
kg (Ib)
1755 (3870)1735 (3826)1659 (3658)
Percentdifference
-1-5

ORIGINAL PAGE 8SOF POOR QUALITY
19.43(63.75)
Figure 1. Three-view drawing of F-15 airplane.Dimensions in meters (ft).

ORIGINAL PAGE 13'OF POOR QUALITY
UwQ
mi-H
I
4J
MO4-1
JU
•o10
0nJ
S S
IH(N O
O•H•POc
CO•
O
n•
o
CO(N (N
•
O
OCN
(N
O
O•
OvoiH
•O
(NiH
•
O
COo O
o
oo
(0
CO(TJ
QU
CM
(1)
QU

ORIGINAL PAGE SiOF POOR QUALITY
U
10

ORIGINAL PAGE 19OF POOR QUALITY
CM
•
(N
O•
(N
00
CO
s0)
T)C(0
-Ptn
Qswoo
S-lOM-l
0)in
0)>oo0)
(Ui-l3CO(0
(0-PoEH
-P(U
OO Cf\
COCO CO
OCO
(N*
O
o•
U3O
0)S-l3
CNfa
12M
11

ORIGINAL PAGE ISOF POOR QUALITY
Iwa)x:
c0)0)S-P0)
(0Q)OC
(1)M-lm ••H Q)t) C
-HCT> CPC C
•H Q)£O OJ5 Oin rH
I(D SC O<
•H IU>OC o0) iH
S Q)W X!
-Poo -d.H C
in
a)s-iCr«
-H
12

4-1CO
ORIGINAL PAGE @OF POOR QUALITY
m oro
inCM
oCM
.CEH
oi-HX
vo•
CM
CM
CM
CM
O
CM
00•
iH
VO
CM
00•
O
vot
o
Oin
oCM
OVD
OCO
CN•
O
o•
o o
UwQH
inrHI
fe
(U
c•H
CO0)c
-rHc^ca)
woo
0).C-P
J-lO
M-l
0)
8
g-HX(0e
CO
4JCO
EH
Q)
•
vo
0)
en-H
CO3i-l.C
13

OF POOR QUALITY
0) O -P3 <-l (0Pn H-i in
X!
o oro r-~ vco
oin
Oro
o(N
in
(N
**•
tN
(N•
CN
o*
CN
CO•
tH
VD
CN
CD•
o
CN oom CN
oCN
VD CN 00
CN•
O
o
o o
rH & 0)Q) O -P3 .H (C
CM M-t MCP
uwaMECin
Q)
-P
c
U)0)C
•HCPcQ)
oo
Q)JC4J
J-lO
Q)
8a
E-HX(0e
(0
rj4J(0
Q)3fa
(0•PO
r~
(U
3
-Hfa
14

ORIGINAL PAGE 19OF POOR QUALiTY
I I I
^
CM
(N
(N
O
fN
00
oo*o
VD•
O
(N•
O
o•
o
Q)c•HtJ>C0)
Qswoo
0)£14J
o(N (0' S 4-1
rH-PC
O (1)
g
Ul
(0
•Hi-l-P
oo
Q)
OOO
VDO
ino
no
CNo
oo
g n-H Oi-l 4-1-P O
15

H
ORIGINAL PAGE ISOF POOR QUALITY
Minimum Time Path
\ \
H
M
Figure 9. Minimum time path on plotof Ps and constant energy
Constant PsOWDT
Minimum Fuel Path\\\
\ \\
\
M
Figure 10. Minimum fuel path on plot ofPsOWDT and constant energy
16

ORIGINALOF POOR QUALITY
—.00000000• 4 - I O O O O O O O O
a
17

-P14-1
ORIGINAL PAGE E2OF POOR QUALITY
•^oooooooooooo•Poooooooooooo
fi OD<.OQOO(X?>0 U
X co vo
18
ORIGINAL PAGE 8SOF POOR QUALITY
0 0
ro
Si 1*
1 *1 \
1 \\
\\\\\\
>
O 3
1
\\
\
\\\
\\
V>1
\11
11I
3 4-1 O O C(N tH
1 1
~^
—
^11
11
k--^ \^
~"~ ""^^r^ j"*"*"" ^^«« ~~^ i
0)4-1
(0 (1x: E4J -r
5 eH M
(0 -P -P g04 W ft-H
W D H0) -pg W -P ft•H - 3 Dtn -P Oo ,c x:g 1--t -p -p3 -H -H -Hg p
•HC-Hs
ro
21 1X
4 !2 S
1
1 i
Ii
| |
—
—
I I 1
3
CM•
CN Q)
(0g
•rH
0 -P10
CN OJ
CO
^oo O• rH
iH -Hft
(1)
VO -P
rH 0-P
10„ *-*
-PrH (0
0)
CN -H-P
S |g"^
0 C•H
<-H g
UWQ
00 HK
oMHO
VD CO
O W•HM(0ft
^ g0
o O
•
ror rH
0 <\)^*4d^0 -H
* PT
I
o
K g
19

ORIGINAL PAGE T9OF POOR QUALITY
- -Pre y-i
4J-P (0s cuoA rH-P <U
in g«H 3
1 gfa -HcT3 -H
2 e0) T3
—i • O
Q CPSW rH
OO
T)
-P (C'O
M CO (dIH -P
COen
O 0)-P 5C OO ao
EH §Q E!2 -HO Xen n5
Q)M
fa
CO
K g
20

SC
a-Hn s:-P -PPu (03 exX! rH-P QJ•H 3
LDiHI
CM
•d•Hc
•H
OJ TJs cO (0ex
W .H
O -O ^~trH (0pL| 13
0) T3
-P (0
-1 CH
o mw
en
O QJ•P Sc oo auEH 39 eS -HO XCO («
0)
O O V D ' ^ ' C N O O O V D ' ^ ' C N
K 6
21

ORIGINAL PAGE 19OF POOR QUALITY
ffi M-l
CO
Oin
on
X
I
"Lr1
<4r£
CO T
X! 44-1 C(0 PO-i
C, 1 _
Q) 4d c
•r
g Pg•HC•HS
n51 1 1X
"^^^
I)ja g5 -HH MJ -I-1 £Q CX-rJ D &
404-1 ^
J 0 "3 x; xH 4-> 4-H -H -r^ IS 3
|
-
3
4JXJ
4HJH•
I I I !
*•""•
^™
^_
iH
00•
0
VD•
O
•=ri
o
CN
O
O
0
(N•
(N
O
CN
00
CN
x:4-1 Q)-H 4->
W -Hf, -P4-> w(0 Q)a
0)tH -Q) -P3 O
g 0)-H J3C -P
•Hg O
-PuW g
o-P
C 3o oW £
•H -PM -H(0 5CXe-oO CU (0
(US-l2Cn
-HCM
00 CN
S3 g
22

1. Report No.
NASA TM-86042
2. Government Accession No. 3. Recipient's Catalog No.
4. Title and Subtitle
Minimum Time and Fuel Flight Profiles for an F-15 Airplane Witha Highly Integrated Digital Electronic Control (HIDBC) System
5. Report Date
June 1984
6. Performing Organization Code
7. Author(s)
Edward A. Haering, Jr., and Frank W. Burcham, Jr.
8. Performing Organization Report No.
H-1242
10. Work Unit No.9. Performing Organization Name and Address
NASA Ames Research CenterDryden Flight Research FacilityP.O. Box 273Edwards, California 93523
11. Contract or Grant No.
12. Sponsoring Agency Name and Address
National Aeronautics and Space AdministrationWashington, D.C. 20546
13. Type of Report and Period Covered
Technical Memorandum
14. Sponsoring Agency Code
RTOP 533-02-21
15. Supplementary Notes
16. Abstract
A simulation study was conducted to optimize minimum time and fuel con-sumption paths for an F-15 airplane powered by two FIDO Engine Model Deri-vative (EMO) engines. The benefits of using variable stall margin (uptriro)to increase performance were also determined. This study supports the NASAHighly Integrated Digital Electronic Control (HIDBC) program. The basis forthis comparison was minimum time and fuel used to reach Mach 2 at 13,716 n>(45,000 ft) from the initial conditions of Mach 0.15 at 1524 m (5000 ft).Results were also compared to a pilot's estimated minimum time and fuel tra-jectory determined from the F-15 flight manual and previous experience. Theminimum time trajectory took 15 percent less time than the pilot's estimatefor the standard EMD engines, while the minimum fuel trajectory used 1 per-cent less fuel than the pilot's estimate for the minimum fuel trajectory.The F-15 airplane with EMD engines and uptrim, was 23 percent faster than thepilot's estimate. The minimum fuel used was 5 percent less than the estimate.
17. Key Words (Suggested by Author(s))
Optimum trajectoriesF-15 airplaneHIDECF100 EMD engine
18. Distribution Statement
19. Security Classif. (ol this report)
Unclassified