
s igma - Para Entender Direito - Para Entender...
44
sigma No 2/2012 Natural catastrophes and man-made disasters in 2011: historic losses surface from record earthquakes and floods 1 Executive summary 2 Overview of catastrophes in 2011 12 Submerged hot spots 17 Tables for reporting year 2011 36 Tables showing the major losses 1970–2011 38 Terms and selection criteria
Transcript of s igma - Para Entender Direito - Para Entender...

sigmaNo 2/2012
Natural catastrophes and man-made disasters in 2011:historic losses surface from record earthquakes and floods
1 Executive summary
2 Overview of catastrophes in 2011
12 Submerged hot spots
17 Tables for reporting year 2011
36 Tables showing the major losses 1970–2011
38 Terms and selection criteria

Published by:Swiss Reinsurance Company LtdEconomic Research & ConsultingP.O. Box 8022 ZurichSwitzerland
Telephone +41 43 285 2551Fax +41 43 282 0075E-mail: [email protected]
New York Office:55 East 52nd Street41st FloorNew York, NY 10055
Telephone +1 212 317 5400Fax +1 212 317 5455
Hong Kong Office:18 Harbour Road, WanchaiCentral Plaza, 61st FloorHong Kong, SAR
Telephone + 852 25 82 5703Fax + 852 25 11 6603
Authors:Lucia BevereTelephone +41 43 285 9279
Rudolf EnzTelephone +41 43 285 2239
Jens Mehlhorn(“Submerged hot spots” chapter)Telephone +41 43 285 4304
Toru Tamura(“Integrating tsunami risk in catastrophe modelling” box)Telephone +81 3 3272 4689
Editor:Jessica Villat CórdovaTelephone +41 43 285 5189
Managing editor:Dr Kurt Karl, Head of Economic Research & Consulting, is responsible for the sigma series.
The editorial deadline for this study was 16 February 2012.
sigma is available in English (original language), German, French, Spanish, Chinese and Japanese.
sigma is available on Swiss Re’s website: www.swissre.com/sigma
The internet version may contain slightly updated information.
Translations:CLS Communication
Graphic design and production:Swiss Re Logistics / Media Production
© 2012Swiss Reinsurance Company LtdAll rights reserved.
The entire content of this sigma edition is subject to copyright with all rights reserved. The information may be used for private or internal purposes, provided that any copyright or other proprietary notices are not removed. Electronic reuse of the data published in sigma is prohibited.
Reproduction in whole or in part or use for any public purpose is permitted only with the prior written approval of Swiss Re Economic Research & Consulting and if the source reference “Swiss Re, sigma No 2/2012” is indicated. Courtesy copies are appreciated.
Although all the information used in this study was taken from reliable sources, Swiss Reinsurance Company does not accept any responsibility for the accuracy or com-prehensiveness of the information given. The information provided is for informational purposes only and in no way constitutes Swiss Re’s position. In no event shall Swiss Re be liable for any loss or damage arising in connection with the use of this information.
Order no: 270_0212_en
1Swiss Re, sigma No 2/2012
Catastrophes claimed approximately 35 000 victims and cost insurers approximately USD 116bn in 2011
Natural catastrophes and man-made disasters claimed about 35 000 lives and resulted in economic losses of over USD 370bn in 2011. The cost to insurers was approximately USD 116bn; insured losses were the second highest on record since sigma began
collecting natural catastrophe data in 1970.
In 2011, 325 catastrophic events occurred, 175 of which were natural catastrophes and 150 were man-made disasters.
Of the approximately 35 000 people who perished in catastrophic events in 2011, over 19 000 lives were lost in the major earthquake that struck northeastern Japan in March. Tropical Storm Washi in the Philippines, and floods in Brazil and Thailand also claimed the lives of more than 3 000 people combined.
In terms of economic losses, natural catastrophes and man-made disasters cost society over USD 370bn in 2011, the highest amount ever recorded, versus USD 226bn in 2010. The historic earthquake in Japan alone caused at least USD 210bn in damage. As a result, Asia was the hardest hit region, with economic losses of over USD 260bn.
Natural catastrophes cost the global insurance industry roughly USD 110bn in 2011, while man-made disasters triggered additional claims of about USD 6bn. By way of comparison, insured losses overall amounted to USD 48bn in 2010. Most of the losses arose from the earthquakes in Japan and New Zealand, followed by the flood in Thailand, and from a record-breaking tornado season in the US. Hurricane losses remained moderate in the US, keeping overall insured losses below the 2005 figure. Insured losses were highest in Asia, where they exceeded USD 49bn.
The over USD 254bn gap between the total economic loss and the insured loss in 2011 suggests that a lack of insurance cover continues to leave many individuals, companies, and governments financially vulnerable to catastrophic events. The upward trend in total economic losses from natural catastrophes and man-made disasters over the past two decades, and the highest ever catastrophe-related economic losses recorded in 2011, indicate the increasing importance of maintaining adequate coverage.
A special chapter on flooding in this edition of sigma reveals that flood loss potential can be just as high as that of earthquakes and storms. Owing to Thailand’s growing role in the global manufacturing supply chain, the flood there triggered an estimated USD 12bn in insured claims, the highest freshwater flood loss ever recorded,1 mainly for damage to commercial properties and business interruption. A combination of factors – large affected areas, high concentration of property values, high insurance penetration, and insufficient pre-disaster risk preparedness – multiplied the loss.
The event in Thailand is a painful reminder that, given the high risk of flooding in many countries, other parts of the globe could be prone to similarly high losses. On the one hand, businesses, governments, and societies at large should increasingly consider more stringent natural catastrophe and man-made disaster risk prevention and mitigation measures, especially in emerging countries of growing significance to the interconnected global economy. On the other hand, the insurance industry would do well to further examine the implications of global supply-chains for a more holistic risk assessment going forward.
1 In this sigma ranking, only losses from events where floods are the primary peril are counted. Losses from secondary perils, such as tsunamis following earthquakes, or floods due to storms, are counted with the respective primary peril.
Catastrophes claimed approximately 35 000 lives in 2011. Insured losses more than doubled since 2010 to USD 116bn.
Over 300 catastrophic events were recorded in 2011.
More lives were lost in the Japan earthquake than in any other event in 2011.
Catastrophes cost society over USD 370bn in 2011.
Insured losses were USD 116bn overall. Natural catastrophes cost insurers close to USD 110bn and man-made disasters accounted for the remaining USD 6bn.
A USD 254bn gap between insured and non-insured economic losses points to a widespread lack of insurance.
The flood in Thailand triggered an unprecedented USD 12bn in insured losses.
Other parts of the globe could be exposed to similar potential losses. More extensive risk mitigation measures and a better analysis of manufacturing supply-chains are needed going forward.
Executive summary

Swiss Re, sigma No 2/20122
Overview of catastrophes in 2011
More than 300 catastrophic events occurred in 2011
The number of catastrophic events rose slightly in 2011. Out of the 325 catastrophic events that occurred in 2011, 175 were natural catastrophes, while the remaining 150 events were man-made disasters (see Figure 1). In 2011, for the second conse-cutive year, the number of man-made disasters was lower than the number of natural catastrophes. Since 2005, man-made disasters have been declining.
An event is included in the sigma statistics if insured claims, total economic losses, or the number of casualties exceed a certain threshold (refer to the event selection criteria for 2011 in the margin). Each year, the claims threshold is adjusted for inflation. Thresholds with respect to casualties – ie the number of lives lost or missing, or the number of people severely injured or made homeless due to an event – make it possible to tabulate catastrophic events in regions where insurance penetration is low.
0
50
100
150
200
250
300
20
10
20
05
20
00
19
95
19
90
19
85
19
80
19
75
19
70
Man-made disasters Natural catastrophes
0
50
100
150
200
250
300
201020052000199519901985198019751970
Source: Swiss Re Economic Research & Consulting
Event selection criteria, 2011 Threshold in USDmInsured losses (claims): Maritime disasters 18.0
Aviation 35.9 Other losses 44.6or Total economic losses: 89.2or Casualties: Lost or missing lives 20 Injured 50 Homeless 2 000
Figure 1Number of events 1970–2011

3Swiss Re, sigma No 2/2012
Approximately 35 000 people around the world were victims of catastrophes
2011 ranks as the 16th highest year in terms of victims since 1970, when sigma began collecting catastrophe data. Almost 35 000 people lost their lives due to natural catas-trophes and man-made disasters in 2011. While overall this is more than double the lives lost in 2009, it is considerably less than in 2010, the year that the Haiti earthquake claimed 220 000 lives. The deadliest event in 2011 was yet another earthquake: the Japan seism and tsunami in March claimed more than 19 000 lives. However, thanks to Japan’s remarkable achievements in stringent building code enforcement and risk preparedness, fewer lives were lost in Japan’s combined earthquake and tsunami compared to the significantly lower magnitude earthquake only event in Haiti.
Globally, in 2011, around 29 000 people were victims of natural catastrophes, while approximately 6 000 people were victims of man-made disasters (see Figure 2). After Japan, Tropical Storm Washi in the Philippines and flooding in Thailand and Brazil claimed a further 3 164 lives. The October earthquake in Turkey also accounted for 644 victims. The global tally does not yet include the full consequences of the famine due to severe drought in the Horn of Africa. Although its human and economic impact has yet to be fully assessed, the famine is believed to be the largest human catastrophe of the year.
Approximately 6 000 people were victims of man-made disasters, slightly fewer than in 2010.
The man-made disasters that resulted in the most victims in 2011 were the events in Egypt at the beginning of the year. Included in the figures of this sigma are the anti-government demonstrations that took place in Egypt, where approximately 846 lives were lost. Because they are classified as civil war or war-like events2, however, this sigma does not include the overall human tally of many of the rest of the 2011 events known as “Arab Spring” that led to the loss of many more lives.
Other man-made disasters that resulted in a high number of victims in 2011 include the sinking of an overcrowded ferry off the coast of Tanzania (220 victims), and of boats carrying illegal immigrants or refugees. Maritime and aviation disasters accounted for approximately 2 000 and 500 victims, respectively. Terrorism attacks, including the Norway twin terrorist attacks in July, led to the loss of about 500 more lives.
Man-made disasters Natural catastrophes
1 000 000
100 000
10 000
1 000
19
70
19
75
19
80
19
85
19
90
19
95
20
00
20
05
20
10
12
34 5 6
1 1970: Bangladesh storm, Peru earthquake 2 1976: Tangshan earthquake, China 3 1991: Cyclone Gorky, Bangladesh 4 2004: Indian Ocean earthquake
and tsunami 5 2008: Cyclone Nargis, Myanmar
6 2010: Haiti earthquake
Note: The scale is logarithmic – the number of victims increases tenfold per band.
Source: Swiss Re Economic Research & Consulting
2 See Term and selection criteria on page 38.
The Japan earthquake and tsunami accounted for most of the almost 35 000 lives lost globally due to natural catastrophes and man-made disasters in 2011.
Natural catastrophes claimed the greatest number of lives, and the count is still increasing as the tally of victims from the famine in Africa rolls in.
Man-made disasters claimed approximately 6 000 victims in 2011.
The Arab Spring caused a high loss of lives.
Maritime and aviation disasters accounted for approximately 2 000 and 500 victims, respectively.
Figure 2Number of victims 1970–2011

Swiss Re, sigma No 2/20124
Total economic losses estimated at USD 370bn
Natural catastrophes and man-made disasters cost society over USD 370bn in 2011. These are the highest catastrophe-related economic losses ever recorded in history. Most of the losses were due to the devastating earthquake and ensuing tsunami that struck northeastern Japan in March. Japan’s earthquake was the largest measured – in terms of magnitude – to have ever hit the country and the fourth-strongest ever worldwide. Total direct economic losses incurred by the event are estimated at USD 210bn. The February seism in New Zealand caused an estimated USD 15bn in further damages, adding to global earthquake-related economic losses, which have soared to over USD 230bn, the highest ever recorded in history. The year 2011 saw not only the most damaging earthquake in history, but also, in Thailand, some of the worst flooding in decades. The flood caused massive damage to the country’s manufacturing base and severely interrupted international supply chains.
Man-made disasters are estimated to have caused almost USD 8bn in damages. Accidents on drilling platforms, other oil and gas facilities, and to a power station in Cyprus were among the most damaging man-made disasters of 2011.
Economic lossRegion in USD m as a % of GDPNorth America 63 460 0.38%Latin America & Caribbean 5 558 0.10%Europe 8 712 0.04%Africa 1 560 0.08%Asia 260 149 2.09%Oceania 27 814 1.80%Seas/Space 3 633 –World total 370 887 0.31%
Source: Swiss Re Economic Research & Consulting
At USD 370bn, primarily due to earthquake events, 2011 reported the highest ever economic losses in history.
Economic losses for man-made disasters in 2011 reached almost USD 8bn.
Table1 2011 economic losses by region and as a % of GDP
Overview of catastrophes in 2011

5Swiss Re, sigma No 2/2012
USD 116bn in insured losses make 2011 the second most expensive year ever
Of the USD 370bn in total damages caused by catastrophic events in 2011, almost one-third, or USD 116bn (see Figure 3), was covered by insurance. This makes 2011 the second most expensive year for the insurance industry according to the sigma records, second only to 2005, when Hurricanes Katrina, Wilma, and Rita alone caused claims of over USD 100bn. Even so, given the extremely high economic losses to be borne and the low insurance penetration rate in earthquake-prone places like Japan, much of the weight of 2011’s economic losses will be shouldered by individuals, private companies, or state institutions.
At approximately USD 110bn, natural catastrophe losses accounted for most of the insured losses. Earthquake-insured losses, which make up USD 49bn of total natural
catastrophe losses, make 2011 the most expensive calendar year in the earthquake category. Weather-related losses were also heavy, due to the massive flooding in
Thailand in the second half of the year − the most expensive flooding on sigma records1 − and to record-breaking tornado events in the US. However, moderate hurricane losses kept weather-related losses, and therefore the overall cost of disasters, lower than in 2005. Man-made disasters amounted to approximately USD 6bn of insured losses.
0
20
40
60
80
100000
1202
01
0
20
05
20
00
19
95
19
90
19
85
19
80
19
75
19
70
0
20000
40000
60000
80000
100000
120000
201020052000199519901985198019751970
in USD billion, at 2011 prices
Earthquake/tsunami Man-made disasters Weather-related catastrophes
1
2
34
5
6
7
8
9
1 1992: Hurricane Andrew2 1994: Northridge EQ3 1999: Winter storm Lothar4 2001: Attack on WTC5 2004: Hurricanes Ivan, Charley, Frances
6 2005: Hurricanes Katrina, Rita, Wilma7 2008: Hurricanes Ike, Gustav8 2010: EQs Chile, New Zealand9 2011: EQs Japan, New Zealand
1 1992: Hurricane Andrew2 1994: Northridge earthquake3 1999: Winter Storm Lothar4 2001: 9/11 attacks5 2004: Hurricanes Ivan, Charley, Frances6 2005: Hurricanes Katrina, Rita, Wilma7 2008: Hurricanes Ike, Gustav8 2010: Chile, New Zealand earthquakes9 2011: Japan, New Zealand earthquakes,
Thailand flood
Source: Swiss Re Economic Research & Consulting
At least fifteen disasters triggered insured losses of USD 1bn or more each in 2011 (see Table 5). As in 2010, earthquake events topped the charts again in 2011. With
insurance losses of USD 35bn, the Japan earthquake was the most expensive event, followed by the New Zealand earthquake, which generated over USD 12bn in insured losses. These two events alone in 2011 marked the highest ever recorded earthquake losses in history for a single year. The flood in Thailand tied with the earthquake in New Zealand as the 2nd highest loss of the year. In addition, the flood in Thailand prompted the insurance industry’s highest ever recorded flood loss.
Of the additional man-made insured losses of about USD 6bn in 2011, the biggest were the January fire at an oil sand plant in Alberta, Canada, which houses the largest sand oil reserve in the world, the damage to a floating vessel in the North Sea in February and the July explosion of the Vasilikos Power Station in Cyprus, which caused a massive power shortage on the island. Aviation disaster claims were considerably lower than in 2010, but a series of satellite losses and launch failures cost another USD 0.6bn in claims. Although the total damage from space disasters was higher, many of the projects were government-related and uninsured.
Insured losses from catastrophic events amounted to about USD 116bn, making 2011 the second most expensive year in history for the insurance industry.
Natural catastrophes losses amounted to USD 110bn. Primarily earthquake, but also weather-related losses, caused costs to soar in 2011.
Figure 3Insured catastrophe losses 1970–2011
At least 15 events triggered losses in excess of USD 1bn; the earthquake in Japan was the most expensive at USD 35bn.
Insured losses due to man-made disasters amounted to about USD 6bn.

Swiss Re, sigma No 2/20126
Overview of catastrophes in 2011
Regional overview
As a consequence of the historical earthquake in Japan and the unprecedented flood in Thailand, both insured and economic losses were highest in Asia, where they
respectively reached an estimated USD 49bn and USD 260bn.
Insured loss Total lossRegion Number Victims in % in USD m in % in USD mNorth America 50 768 2.2% 39 756 34.3% 63 460Latin America & Caribbean 36 1 880 5.4% 631 0.5% 5 558Europe 34 1 158 3.3% 4 340 3.7% 8 712Africa 51 2 894 8.3% 323 0.3% 1 560Asia 104 26 189 75.4% 49 249 42.5% 260 149Oceania 10 233 0.7% 19 106 16.5% 27 814Seas/Space 40 1 607 4.6% 2 409 2.1% 3 633World total 325 34 729 100.0% 115 814 100.0% 370 887
Source: Swiss Re Economic Research & Consulting
Asia Asia was the hardest hit region in 2011, in terms of impact on human lives, total
economic losses, and insured losses. Within Asia, the Japan earthquake led to the highest number of victims and the highest financial losses. The aggregate total cost of the event is currently estimated at USD 210bn and is likely to increase once damage to nuclear facilities, and the costs of business interruption and population relocation are fully accounted for. Due to the sheer scale of the event, Japan also tallied the highest insured losses despite low insurance penetration, particularly for commercial properties.3 Accordingly, although substantial, insured claims were only a fraction of the total cost of the event.
Asia also suffered significant weather-related losses. In Thailand, intense rainfall triggered the worst flood in fifty years, causing the loss of 813 lives. More than 4 million homes, businesses and industrial facilities were flooded, resulting in massive damage and disruption to daily lives and manufacturing operations. Thailand is an important link in the global manufacturing industry supply chain and one of the world’s largest producers of hard drives. Consequently, the flood affected a number of international companies that either had local operations or were highly dependent on Thailand as a manufacturing link for their operations, triggering unprecedented insured claims from business interruption. Currently estimated at USD 12bn in insured losses, the Thailand flood is the most expensive flood event on sigma records. Most of the loss will be borne by the international re/insurance markets.
Further major flood events in Pakistan and China in summer and autumn led to the loss of approximately 900 lives and to economic damages of over USD 9bn.
In September 2011, Japan was struck again, this time by Typhoon Roke, which claimed 13 lives and triggered additional claims of USD 1.2bn. Typhoon Muifa, which also hit the Philippines and China, had already added a further USD 850m in economic losses, mainly in China. Late in the year, the deadliest event following the Japanese seism oc-curred: 1 449 people either lost their lives or went missing and over 400 000 people lost their homes to heavy rains and massive flooding as a result of the severe Tropical Storm Washi that hit the Philippines. The full extent of the storm damage has yet to be assessed.
3 See “Lessons from recent major earthquakes”, Swiss Re Economic Research & Consulting, January 2012.
Insured and economic losses were highest in Asia and North America, respectively.
Table 2Catastrophes in 2011, by region
Asia (losses in USDm) Victims 26 189
Total losses 260 149Insured losses 49 249
Of all the regions, Asia suffered the great-est loss of human life.
Unprecedented in its scale and nature, the flood in Thailand was the second most expensive event in Asia in 2011, and the most expensive flood event on sigma records.
Pakistan and China were also hit by deadly and damaging floods.
Tropical Storm Washi was the second deadliest event in the region after the Japan earthquake.

7Swiss Re, sigma No 2/2012
The new wave: integrating tsunami risk in catastrophe modelling
On 11 March 2011, a magnitude 9.0 earthquake struck northeastern Japan, followed by a devastating tsunami. Remarkably, the bulk of economic losses were caused by the effects of the tsunami rather than by ground shaking. The tsunami affected a 2 000 kilometre stretch of the Pacific Coast, and reached more than 5 kilometres inland. It is estimated that almost 535 square kilometres of land were inundated with a wave that reached a height of up to more than 40 metres.
The Japan example serves as a reminder that secondary loss elements, such as tsunamis, can be a crucial loss driver in an earthquake event. Despite the lingering
memory of the colossal tsunami damage caused by the Sumatra earthquake in 2004, tsunami risk had so far been a largely underestimated peril in the insurance industry. To measure a natural hazard, the insurance industry usually uses models that simulate huge numbers of probable catastrophe events, such as earthquakes. Even though
tsunami models are widely used in scientific and engineering communities, they have until now never been explicitly integrated by the insurance industry in its earthquake models.
In response to this shortcoming in current catastrophe modelling, Swiss Re began refining its model to measure tsunami probability. In 2011, a team of Swiss Re experts was able to simulate tsunami wave propagation in the open ocean and measure the resulting inundation once tsunami waves hit the coast. Offshore tsunamis were calculated using different combinations of pre-computed model runs. Meanwhile, for onshore tsunami inundation, the energy conserved between an offshore tsunami and the frictional energy lost during inundation was taken into account. Using this method-ology, the impact of the 11 March event in Japan could be very closely replicated.
One output from Swiss Re’s tsunami model is a hazard map showing the offshore tsunami height that can be expected once in one thousand years. Combined with
Swiss Re’s original earthquake model, tsunami-induced damage is integrated with damages from ground shaking and fire following an earthquake. The resulting output correctly reconfirms that significant tsunami risk exists on the northeastern coast of
Japan where the latest disaster occurred. It also warns of significant tsunami risk along the southwestern coast of Japan, linked with gigantic earthquakes along the Tokai,
Tonankai, and Nankai troughs.
Swiss Re’s tsunami model is expected to contribute significantly to the industry’s understanding and assessment of earthquake risks. Swiss Re’s natural catastrophe experts and underwriters are currently working to extend the Swiss Re model globally to forecast tsunami risk in Chile, Peru, New Zealand, Indonesia, and other tsunami-prone areas.
Source: Swiss Re Cat Perils
Figure 4: Japan tsunami hazard map over a 1 000-year period

Swiss Re, sigma No 2/20128
Overview of catastrophes in 2011
North America North America was the second most affected region in 2011, both in terms of insured
losses (approximately USD 40bn) and economic losses (over USD 63bn). Losses were primarily caused by harsh spring weather and by Hurricane Irene.
For the second consecutive year, the US suffered large non-hurricane losses. Two massive tornado events hit several Southern and Midwestern states in April and May,
triggering more than USD 14bn in insured losses and costing more than 500 lives. The two tornadoes events, respectively, are the 10th and 11th most expensive US natural
catastrophes on sigma records. By comparison, the two most expensive US weather events in 2010 triggered only about USD 5bn in insured claims. In 2011, nine natural disasters in the US triggered insured claims of USD 1bn or more, compared to only three such natural disasters in 2010. The spring tornado outbreaks were also among the deadliest ever recorded.
Hurricane Irene was the first hurricane to make landfall in the US since Hurricane Ike in 2008. As the thirteenth most expensive US natural catastrophe on sigma records,
Hurricane Irene caused damage in the Caribbean, and then weakened as it moved up along the East Coast, triggering an estimated USD 5.3bn in insured losses, mainly in the US, but also minor ones in Canada. The hurricane season produced 19 named storms, seven of which became hurricanes, and three of which classified as major.
Hurricane losses were higher than in 2010, but moderate compared to the last decade.
2011 also saw a massive rise in the levels of the Mississippi and Missouri rivers in spring and summer. The damage from the resulting flooding was contained thanks to a sophisticated water level management system that prevented the flooding of major
cities by diverting the water to farmland. However, the diversion brought high agricultural losses. A rare MW 5.8 earthquake that hit Virginia on 23 August was the
most powerful ever recorded in the state. Thankfully, the seism caused only minor damage.
In May, wildfires ravaged parts of the town of Slave Lake, Canada, triggering insured claims of USD 0.7bn. The wildfires led to the second most expensive insured
catastrophe loss in Canadian history, after the ice storm that hit Quebec and Ontario in 1998.4 Flooding of the Assiniboine River from snowmelt and heavy rains also caused damage to farmland in the Canadian Prairies.
4 The 1998 ice storm cost the industry USD 1.7bn (at 2011 prices).
North America (losses in USDm) Victims 768 Total losses 63 460 Insured losses 39 756
The US suffered a deadly and costly tornado season.
It also had its first hurricane landfall since 2008, causing USD 5.3bn in insured losses.
Sophisticated risk management helped contain flood-related insured property losses.
In terms of insured losses, the Slave Lake wildfires were the second most expensive disaster in Canadian history.
9Swiss Re, sigma No 2/2012
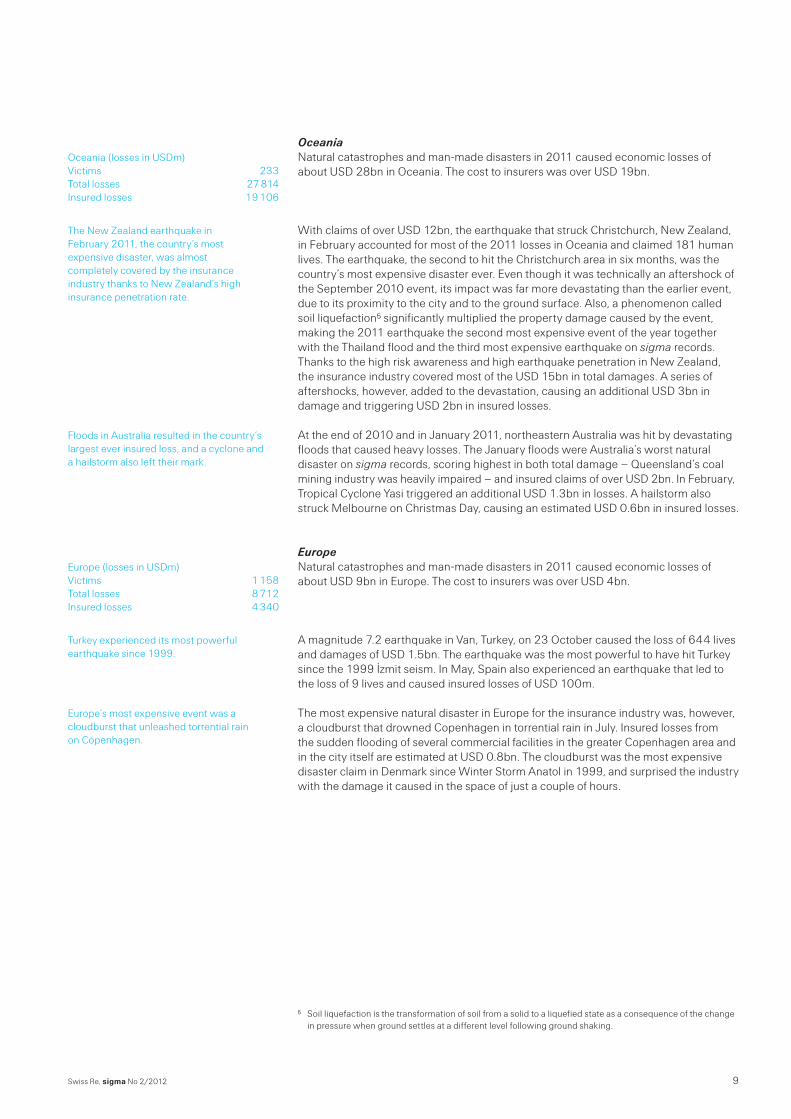
Oceania Natural catastrophes and man-made disasters in 2011 caused economic losses of
about USD 28bn in Oceania. The cost to insurers was over USD 19bn.
With claims of over USD 12bn, the earthquake that struck Christchurch, New Zealand, in February accounted for most of the 2011 losses in Oceania and claimed 181 human lives. The earthquake, the second to hit the Christchurch area in six months, was the country’s most expensive disaster ever. Even though it was technically an aftershock of the September 2010 event, its impact was far more devastating than the earlier event, due to its proximity to the city and to the ground surface. Also, a phenomenon called soil liquefaction5 significantly multiplied the property damage caused by the event, making the 2011 earthquake the second most expensive event of the year together with the Thailand flood and the third most expensive earthquake on sigma records. Thanks to the high risk awareness and high earthquake penetration in New Zealand, the insurance industry covered most of the USD 15bn in total damages. A series of aftershocks, however, added to the devastation, causing an additional USD 3bn in damage and triggering USD 2bn in insured losses.
At the end of 2010 and in January 2011, northeastern Australia was hit by devastating floods that caused heavy losses. The January floods were Australia’s worst natural
disaster on sigma records, scoring highest in both total damage – Queensland’s coal mining industry was heavily impaired – and insured claims of over USD 2bn. In February, Tropical Cyclone Yasi triggered an additional USD 1.3bn in losses. A hailstorm also struck Melbourne on Christmas Day, causing an estimated USD 0.6bn in insured losses.
Europe Natural catastrophes and man-made disasters in 2011 caused economic losses of
about USD 9bn in Europe. The cost to insurers was over USD 4bn.
A magnitude 7.2 earthquake in Van, Turkey, on 23 October caused the loss of 644 lives and damages of USD 1.5bn. The earthquake was the most powerful to have hit Turkey since the 1999 İzmit seism. In May, Spain also experienced an earthquake that led to the loss of 9 lives and caused insured losses of USD 100m.
The most expensive natural disaster in Europe for the insurance industry was, however, a cloudburst that drowned Copenhagen in torrential rain in July. Insured losses from the sudden flooding of several commercial facilities in the greater Copenhagen area and in the city itself are estimated at USD 0.8bn. The cloudburst was the most expensive disaster claim in Denmark since Winter Storm Anatol in 1999, and surprised the industry with the damage it caused in the space of just a couple of hours.
5 Soil liquefaction is the transformation of soil from a solid to a liquefied state as a consequence of the change in pressure when ground settles at a different level following ground shaking.
Oceania (losses in USDm) Victims 233 Total losses 27 814 Insured losses 19 106
The New Zealand earthquake in February 2011, the country’s most expensive disaster, was almost completely covered by the insurance industry thanks to New Zealand’s high insurance penetration rate.
Floods in Australia resulted in the country’s largest ever insured loss, and a cyclone and a hailstorm also left their mark.
Europe (losses in USDm) Victims 1 158 Total losses 8 712 Insured losses 4 340
Turkey experienced its most powerful earthquake since 1999.
Europe’s most expensive event was a cloudburst that unleashed torrential rain on Copenhagen.

Swiss Re, sigma No 2/201210
Overview of catastrophes in 2011
Winter storms caused additional damage to various countries in Northern Europe. Winter Storms Joachim and Dagmar resulted in insured losses of close to USD 0.7bn in
Germany, Scandinavia, France, and Switzerland. Windstorm Friedhelm battered the UK with hurricane-force winds, destroying vehicles, damaging offshore facilities, blocking roads, and leading to USD 0.4bn in estimated losses. Hurricane Katia developed over the Cape Verde Islands and made landfall in Scotland, giving rise to USD 0.2bn in
damage. Meanwhile, a slow-moving extra-tropical area of low pressure (named “Rolf”) caused torrential rains and widespread flooding in southern France and northern Italy, claiming the lives of eleven people and leading to insured losses of USD 0.6bn. Rolf was the first low pressure system over the Mediterranean to be categorised as a
tropical storm.
Summer riots in London and the twin terrorist attacks in the Oslo city centre and at a youth camp claimed 82 victims, most of them teenagers. These events highlight
increasing societal risks, and the Norway case also underlines the vulnerability of countries that are traditionally perceived as being exposed to low terrorism risk.
Latin America and the Caribbean At the beginning of the year, heavy rainfall caused landslides and flooding in Brazil.
These flood events led to approximately half of the 1 880 lives lost in Latin America and the Caribbean due to natural catastrophes in 2011. The economic losses from the Brazil floods are estimated at less than USD 1.0bn. Further flooding in Colombia claimed the lives of over 300 people, and caused over USD 2bn in damage.
Aside from flooding, Latin America was also impacted by hurricane-force winds. Hurricane Irene, Tropical Depression 12-E, Tropical Storm Arlene, and Hurricane Jova
all caused damage in the Caribbean, Mexico, and Central America. Approximately 150 people perished and economic losses totalled USD 0.6bn. Combined insured loss-
es were low, at USD 0.1bn.
In addition, a cold wave hit northern Mexico at the beginning of the year, causing the loss of over 600 000 hectares of corn crops and triggering insured claims of at least USD 0.3bn – though the total financial losses are believed to be much higher. Sinaloa, the affected area, is one of Mexico’s principal production areas of white corn, the
variety of maize used to make tortillas, Mexico’s staple food.
The man-made disaster with the highest number of victims (52) was an arson attack in a casino in Mexico.
The UK was impacted by hurricane-force winds, and winter storms caused damage in Northern Europe, while low pressure sys-tem “Rolf” in the Mediterranean brought tropical storm conditions.
Riots and terrorist attacks in the UK and Norway highlighted new emerging risks.
Latin America and the Caribbean (losses in USDm) Victims 1 880 Total losses 5 558 Insured losses 631
Floods and hurricanes were the main natural catastrophes that hit Latin America in 2011.
A cold wave in Mexico caused high insured acricultural losses.
An arson attack gave rise to the most victims.

11Swiss Re, sigma No 2/2012
Africa The number of victims due to natural catastrophes and man-made disasters in Africa
in 2011 was approximately 2 900.6
Anti-government demonstrations at the beginning of the year in Egypt caused the most victims. Bomb explosions in Nigeria, Somalia, and Egypt caused the further loss of over 220 lives.
Most of Africa’s financial losses came from the floods in Algeria in October, with an estimated USD 0.8bn in economic losses. Floods in South Africa and Mozambique
caused a further USD 0.4bn in damage. Most of the insured losses were due to an explosion at a power station and an aviation accident in Cairo.
The tally for the region does not yet include the full consequences of the worst drought in sixty years in the Horn of Africa. Following consecutive seasons of poor rainfall, the drought caused the loss of cattle and vast expanses of farmland, resulting in a severe food shortage and the displacement of millions of people. A state of famine was
declared by the United Nations in six provinces of Somalia, triggering massive international aid operations. In the second half of 2011, improved rainfall led to better
pasture conditions and a fuller harvest, reducing the dependency of the affected population on humanitarian assistance. On 3 February 2012, the United Nations was
finally able to declare an end to the state of famine. However, a full assessment of the loss of farmland, and especially the loss of lives, has yet to be carried out.
6 This sigma report does not include the overall humanitarian casualties of the 2011 Arab Spring events.
Africa (losses in USDm) Victims 2 894Total losses 1 560Insured losses 323
Floods in Algeria, South Africa, and Mozambique were the most damaging events in terms of economic losses.
The famine that hit the Horn of Africa is believed to be the biggest human catastrophe of 2011.

Swiss Re, sigma No 2/201212
What surfaced from the 2011 flood in Thailand?
Thailand is a country prone to flooding. Northern and Central Thailand have a monsoon rainfall regime that is characterized by high total rainfall with dry winters and wet
summer months. Yearly precipitation amounts to about 1 200 millimetres, falling mostly from May to October with a peak in August and September. During the peak
season, rivers typically carry high water levels, and when flooding happens, it is usually contained in the North of the country. However, in extreme rainfall conditions, flooding can spread down Thailand’s central water artery, the Chao Phraya River, into the central plains that are home to the country’s capital city, Bangkok. More than 40 percent of the Thai population lives in the downstream area of the Chao Phraya River basin, and the area is also home to most of Thailand’s manufacturing industry.
Causes of the flooding In 2011, the Asian monsoon season had an early start, with record-high rainfall already
in March and April. By May, the early onset of heavy rain had saturated soils to the maximum and filled reservoirs to their brims. Rivers in the Chao Phraya basin began rising to high levels. High precipitation rates then continued throughout the entire rainy
season. By the end of October, Central and Northern Thailand had respectively received 300 and 500 millimetres more rainfall than normal. The Chao Phraya River and its
tributaries swelled until they finally burst, inundating an area of about 30 000 km2 and affecting 61 of Thailand’s 77 provinces. As Figure 5 shows, the flooded area was
roughly equivalent to the size of Switzerland. The 2011 rainfall rates are the highest on record in over 50 years.
Source: Swiss Re Cat Perils, ©GfK GeoMarketing Map Edition World
Thailand is a flood-prone country, but any flooding that occurs is normally contained in the North.
The 2011 monsoon season brought the highest rainfall rates to Thailand in over 50 years, causing major flooding in the central plains that are home to Bangkok and much of Thailand’s industry.
Figure 5: The extent of the Thailand flood (in blue)
Submerged hot spots

13Swiss Re, sigma No 2/2012
La Niña may have played a big role in the Thailand flood. El Niño and La Niña are ocean-atmosphere phenomena in the Pacific Region. While El Niño brings drought in South East Asia, La Niña typically brings a period of high precipitation. Around
December 2010 and January 2011, a strong La Niña manifested itself and persisted until May 2011, causing an early onset of monsoon rainfall in South East Asia. La Niña also impacted the trajectory of tropical cyclones, bringing tropical depressions to the Thai peninsula and causing further rainfall. On average, only one tropical depression
per year is observed in Thailand, but between April and September 2011, no fewer than five remnants of tropical cyclones affected the country.
The human impact and risk mitigation measures The historic rainfall and consequent flooding in Thailand led to the loss of hundreds of
lives, left thousands of people homeless, and impacted the livelihood of many more people. Water inundated and wrecked vast expanses of farmland, damaged
World Heritage sites, and forced factories to close for an extended period of time.
Since the floodwater rose slowly, people had time to take some action. Stored items and other moveable goods were moved in time to higher floors, helping to prevent some damage. However, flood insurance penetration for residential homes and small commercial businesses in Thailand is very low, at only about 1%. With overall total
damage resulting from the event estimated at USD 30bn, the greatest share of the loss was uninsured.
In the late 1980s and early 1990s, many large dams in Thailand were built in response to chronic drought. The idea was to store the monsoon rainfall in reservoirs for use in the following year until the next monsoon season. Thus, the main priority for water
resources management was to efficiently plan and operate the reservoirs to meet irrigation schedules. Since the purpose of the dams was primarily to store water for
the dry season, and experienced a general decline in monsoon rainfall, when the 2011 monsoon rains came, the water in the dams was not released. Instead, it was retained for irrigation purposes, exacerbating the unexpected flooding to come. Eventually,
storage capacity was exceeded and large amounts of water had to be released in order to ensure dam and population safety.
Flood damage to large commercial properties In the last decade, many international companies have invested heavily in Thailand, setting up branch offices or building up assembly and manufacturing plants there.
After the Japan earthquake in March, several Japanese companies shifted their production to Thailand, increasing their exposure to the Thailand flood. The majority of international operations in Thailand are located in the Chao Phraya River Basin, in
industrial estates close to the river.
Although these international industrial estates had structural defences to protect themselves against inundation, they were only designed for protection against average
flood conditions. The structures therefore provided inadequate defence against the high water levels in 2011. The estates house car manufacturers, high tech manufacturing, and electronics, which are all especially vulnerable to water damage.
A strong La Niña may have played a big role in the early onset of the monsoon season and the heavy rainfall.
The flooding led to the loss of lives, population displacement, and damage to Heritage sites and the economy.
Insurance penetration for residential and small commercial properties in Thailand is very low.
The water in Thailand’s dams is normally retained for irrigation purposes, so it was not released immediately when the strength of the monsoon rains took the country by surprise.
Many international companies have subsidiaries or manufacturing plants in Thailand’s Chao Phraya River Basin.
These industrial estates were not built to withstand the degree of flooding that occurred in 2011.

Swiss Re, sigma No 2/201214
Loss expectations, washed away The size of the insured loss caused by the extensive flooding in Thailand was
unprecedented. At USD 12bn, it is the highest insured loss in the history of global fresh water floods (see Table 3).1
Insured loss, Insured loss Insured loss USD m, as a % of country’s as a % of country’s Insured loss Total loss Date Country at 2011 prices property premiums non-life premiums as % of GDP as % of GDPJuly–Nov 2011 Thailand 12 000 1 846% 203.5% 3.4% 8.6%Aug 2002 Germany & Czech Republic 2 886 20% 3.0% 0.1% 0.5%Jun 2007 United Kingdom 2 697 12% 2.2% 0.1% 0.1%Aug 2005 Switzerland 2 444 76% 11.7% 0.6% 0.9%Jan 2011 Australia 2 255 24% 5.9% 0.2% 0.4%Jul–Aug 1997 Poland & Czech Republic 2 241 213% 42.3% 0.7% 2.3%Jul 2007 United Kingdom 2 158 9% 1.7% 0.1% 0.1%Dec 2010 Australia 2 114 27% 5.9% 0.2% 0.4%Apr 1973 United States 1 873 5% 0.6% 0.03% 0.1%Jun–Aug 1993 United States 1 600 3% 0.3% 0.02% 0.2%
Notes: 2011 premiums are estimated. Australia’s premiums are for 12 months ending in June. Property premiums for Thailand include industrial All-risk premiums. Sources: Swiss Re Economic Research & Consulting, Oxford Economics
One reason for the extraordinary losses is that flood insurance has a very high penetration for large commercial properties in Thailand. Flood risk was covered under
industrial all-risk insurance policies. However, the premium volume of all-risk insurance in Thailand was only USD 370m in 2011, resulting in a huge loss ratio of over 3 200%.7
The Thailand flood is a textbook example of how a natural catastrophe event can cause extreme property loss accumulations. All the factors needed to turn a natural event into a catastrophic insured loss event were present. These factors include a large affected area, high intensities, long duration, high concentration of property values, high
insurance penetration, high vulnerability of insured goods, and insufficient protection and preparedness. The event was widespread and inundated large areas far beyond main rivers. It lasted from July to November, and many locations were continuously flooded for over two months. Also water depth exceeded three metres in many
locations, affecting properties up to the second floor. The average damage degree of affected properties was 50% or more of their insured value, in comparison to an
average 15% for other flood-affected regions around the globe.
The Thailand flood loss is extraordinary in many ways. First, it is more than three times the size of any other insured loss of its kind in history. Also, the ratios of the insured loss to country property premiums, non-life premiums, and GDP are larger multiples than for all other recorded flood events up until now. The Thailand flood event cost more than fifteen times the country’s property premiums and about twice its total non-life
premiums. It is by far the largest insured loss from a flood in terms of percentage of a country’s GDP.
7 If we include also fire premiums, the loss ratio drops to 1 846% as shown in Table 3.
The 2011 Thailand flooding produced the highest insured loss ever for fresh water flooding, at USD 12bn.
Table 3The top ten largest insured fresh water flood losses
One reason for the extraordinary losses is that flood risk was included in all-risk insurance policies.
The Thailand flood is a textbook example of how a natural catastrophe can lead to catastrophic insured losses.
The insured loss from the Thailand flood is extraordinary, totalling almost 3% of Thailand’s GDP.
Submerged hot spots

15Swiss Re, sigma No 2/2012
What can the insurance industry learn from the Thailand flooding? The Thailand event has painfully demonstrated that insured losses from floods can be
as high as those from earthquakes or tropical cyclones. Given that floods can happen in almost every country, there may be more hidden flood loss potential than the industry realises. However, hot spots with a large hidden flood loss potential can be proactively determined using detailed flood risk information8 and global economic data (see Box on flood loss “hot spots” in emerging markets).
In addition, recent events have highlighted the importance of supply chains when calculating the industry’s risk exposure. Companies’ direct investment in foreign countries is increasing, and with it the exposure to foreign local catastrophe risks. Small
and mid-sized countries such as Thailand are growing in importance in the global supply-chain. The flooding has highlighted the insurance industry’s need for a fuller understanding of its exposure to supply chain risk, via more detailed information from
clients and aggregation risk management with appropriate limits and premiums.
8 In 2011 Swiss Re began developing global river flood hazard zones, based on its patented flood hazard assessment methodology. The detailed flood hazard zones provide consistent global coverage and will be released in spring 2012 in the Swiss Re CatNet® information system. The tool will enable underwriters and risk managers to more accurately assess flood risks on a global level.
Swiss Re is identifying flooding hotspots because the Thailand example shows that insured losses for a flood can be just as high as for an earthquake or tropical cyclone.
The insurance industry should watch the growing significance of global supply-chain information to improve risk assessment.

Swiss Re, sigma No 2/201216
Flood loss “hot spots” in emerging markets
The size of the Thailand flood loss came as a shock to the insurance industry. Although Thailand had been known for being prone to flooding, less known was the large amount of exposure that had built up in Thailand in recent years, most of which originated from foreign companies that had diverted their manufacturing operations there.
Following the Thailand flood event, Swiss Re undertook a global study to identify other emerging markets comparable to Thailand, namely those with high flood risk and
recent strong economic growth. The aim was to identify hidden “hot spots” (latent large flood loss potential). In the study, emerging markets were ranked based on a combina-tion of factors, such as real GDP growth, foreign direct investment as a share of GDP, and flood risk indices per country.
The study revealed that other emerging markets in the world present even greater flood exposure than Thailand. China tops the ranking, followed by the remaining BRIC
countries9, owing to their exceptional economic development of the last few years and the corresponding growth of exposed values combined with flood risk.
Thailand, the country with the highest ever insured flood losses so far, ranks seventh. Vietnam, currently in tenth place, may move up as it is expected to be the destination of Japanese companies relocating their operations from Thailand. Surprisingly,
Kazakhstan and Azerbaijan are among the top ten. Both experienced recent high economic growth and increasing foreign investment, particularly in the oil and gas sectors. If economic growth continues, they will confirm their high ranking and large
flood loss potential.
Top10Top 20Top 30lower ranksnot considered
Source: Swiss Re Cat Perils, ©GfK GeoMarketing Map Edition World
9 The BRIC countries include Brazil, Russia, India, and China.
Figure 6: Emerging market “hot spot” rankings
Submerged hotspots

17Swiss Re, sigma No 2/2012
Table 4List of major losses in 2011 according to loss category
Insured loss10 Number in % Victims11 in % (in USD m) in %Natural catastrophes 175 53.8% 29 026 83.6% 110 021 95.0%Floods 65 5 093 16 262 Storms 76 3 301 41 152 Earthquakes 15 20 264 49 194 Droughts, bush fires, heat waves 9 8 2 432 Cold, frost 8 360 350 Hail 2 630 Man-made disasters 150 46.2% 5 703 16.4% 5 794 5.0%Major fires, explosions 25 7.7% 390 1.1% 2 463 2.1%Industry, warehouses 9 30 933 Oil, gas 8 96 1 490 Department stores 1 40 Other buildings 3 163 Other fires, explosions 4 101 Aviation disasters 21 6.5% 463 1.3% 710 0.6%Crashes 11 463 26 Explosions, fires 1 1 Damage on ground 2 108 Space 8 576 Maritime disasters 39 12.0% 1 986 5.7% 1 833 1.6%Freighters 2 22 67 Passenger ships 29 1 873 Tankers 1 125 Drilling platforms 6 53 1 641 Other maritime accidents 1 38 Rail disasters (incl. cableways) 9 2.8% 272 0.8% 0.0% Mining accidents 8 2.5% 185 0.5% 377 0.3% Collapse of buildings/bridges 3 0.9% 103 0.3% 0.0% Miscellaneous 45 13.8% 2 304 6.6% 411 0.4%Social unrest 14 1 495 411 Terrorism 16 492 Other miscellaneous losses 15 317 Total 325 100.0% 34 729 100.0% 115 814 100.0%
Source: Swiss Re Economic Research & Consulting
10 Property and business interruption, excluding liability and life insurance losses11 Dead or missing
Tables for reporting year 2011

Swiss Re, sigma No 2/201218
Table 5The 20 most costly insurance losses in 2011
Insured loss12 (in USD m) Victims13 Date (start) Event Country 35 000 19 184 11.03.2011 Earthquake (MW 9.0) triggers tsunami; aftershocks Japan 12 000 813 27.07.2011 Flood caused by heavy monsoon rains Thailand 12 000 181 22.02.2011 Earthquake (MW 6.3), aftershocks New Zealand 7 300 354 22.04.2011 Severe storms, tornadoes United States (Alabama, et al) 7 050 155 20.05.2011 Severe storms, tornadoes United States (Missouri, et al) 5 300 55 22.08.2011 Hurricane Irene, torrential rainfall, extensive flooding United States, et al 2 255 22 09.01.2011 Floods caused by heavy rains Australia 2 000 1 13.06.2011 Earthquakes ( MW 5.2 and MW 6.0) New Zealand 2 000 9 03.04.2011 Thunderstorms with winds up to 210 km/h, hail, tornadoes United States 1 510 — 08.04.2011 Thunderstorms with winds up to 275 km/h, tornadoes, hail United States 1 400 46 14.04.2011 Storms with winds up to 260 km/h, >240 tornadoes United States 1 364 1 02.02.2011 Tropical Cyclone Yasi, winds up to 240 km/h Australia 1 300 3 16.06.2011 Storms with winds up to 113 km/h, floods, hail, tornadoes United States 1 213 13 20.09.2011 Typhoon Roke Japan 1 018 36 31.01.2011 Groundhog Day Blizzard winter storm, heavy snowfall United States ns14 — 06.01.2011 Fire at oil sand plant Canada ns14 — 04.02.2011 FPSO Gryphon Alpha vessel damaged during storm North Sea, United Kingdom 980 2 10.07.2011 Storms with winds up to 130 km/h, floods, tornadoes, hail United States 950 — 18.08.2011 Storms with winds up to 148 km/h, tornadoes, hails, floods United States 830 — 19.04.2011 Thunderstorms, hail, >100 tornadoes United States
Source: Swiss Re Economic Research & Consulting
Table 6The 20 worst catastrophes in terms of victims 2011
Insured loss15 Victims16 (in USD m) Date (start) Event Country 19 184 35 000 11.03.2011 Earthquake (MW 9.0) triggers tsunami; aftershocks Japan 1 449 – 16.12.2011 Tropical Storm Washi Philippines 902 50 11.01.2011 Floods, mudslides caused by heavy rains Brazil 846 ns14 25.01.2011 Anti-government demonstrations Egypt 813 12 000 27.07.2011 Flood caused by heavy monsoon rains Thailand 644 90 23.10.2011 Earthquake ( MW 7.2); over 400 aftershocks Turkey 456 – 01.08.2011 Floods caused by heavy rains Pakistan 354 7 300 22.04.2011 Severe storms, tornadoes United States 350 – 03.06.2011 Floods causes by heavy monsoonal rains, landslides China 320 – 13.08.2011 Floods caused by heavy rains Cambodia, Vietnam 233 – 15.02.2011 Anti-government demonstrations Libyan Arab Jamahiriya 220 – 10.09.2011 Overcrowded ferry sinks Indian Ocean, Tanzania 219 – 03.01.2011 Civil commotion Tunisia 203 – 17.12.2011 Overcrowded boat carrying illegal immigrants capsizes Indian Ocean, Indonesia 187 — 05.07.2011 Boat carrying illegal immigrants sinks after catching fire Red Sea, Sudan 181 12 000 22.02.2011 Earthquake ( MW 6.3), aftershock ( MW 5.6) New Zealand 178 41 01.04.2011 Floods caused by heavy rains Colombia 155 7 050 20.05.2011 Severe storms, tornadoes United States (Missouri, et al) 155 – 30.06.2011 Floods caused by heavy monsoon rains, landslides Nepal 151 – 19.10.2011 Tropical storm 02B Myanmar (Burma)
Source: Swiss Re Economic Research & Consulting
12 Property and business interruption, excluding liability and life insurance losses; US natural catastrophe figures: with the permission of Property Claim Services (PCS)/incl. NFIP losses (see page 38, “Terms and selection criteria”).
13 Dead and missing14 ns: not shown15 Property and business interruption, excluding liability and life insurance losses16 Dead and missing
Tables for reporting year 2011

19Swiss Re, sigma No 2/2012
Table 7Chronological list of all natural catastrophes 2011Note: Loss ranges for natural catastrophes in the US in this table are defined by Property Claim Services (PCS).
Canadian natural catastrophe losses are given with the permission of Property Claim Services (PCS Canada)
Floods
Date
Country Place
Event
No. of victims/amount of damage in original currency and (USD)
1.1.–6.1. Brazil Sao Paulo, Minas Gerais, Rio de Janeiro
Floods caused by heavy rains 35 dead 13 000 homeless
1.1.–18.1. Sri Lanka Batticaloa, Polonnaruwa, Monaragala, Nuwara Eliya, Anuradhapura, Badulla, Kegalle, Kandy, Ampara, Trincomalee, Matale, Ratnapura, Vavuniya,
Floods caused by heavy rains; 5 594 houses destroyed, 22 483 houses damaged
43 dead, 4 missing 51 injured 1 060 273 homeless USD 200m total damage
1.1.–31.1. South Africa, Mozambique Floods caused by heavy rains; damage to houses, cropland and infrastructure
131 dead 31 000 homeless ZAR 30m (USD 4m) insured loss ZAR 3.55bn (USD 440m) total damage
1.1.–31.1. Philippines Southern Luzon, Visayas, Mindanao
Floods caused by heavy rains, landslides; 1 116 houses destroyed, 4 613 houses damaged, damage to infrastructures and agriculture
75 dead, 22 missing 13 injured 109 995 homeless PHP 2.06bn (USD 47m) total damage
1.1.–1.2. Lesotho Botha Bothe, Mokhotlong, Leribe, Mohale’s Hoek, Berea, Quthing
Floods caused by heavy rains; 672 houses destroyed, 4 708 livestock killed
26 dead 5 000 homeless
9.1.–17.1. Australia Queensland, Victoria, New South Wales
Floods caused by heavy rains 22 dead AUD 2.2bn (USD 2.26bn) insured loss AUD 6bn (USD 6.15bn) total damage
11.1.–16.1. Brazil Rio de Janeiro
Floods, mudslides caused by heavy rains; widespread damage to houses and infrastructure
902 dead USD 50m insured loss <USD 1.0bn total damage
18.1.–20.1. Indonesia Legon Kulon, Pamanukan, Sukasari, Pusakanegara, Pusaka Jaya
Floods caused by heavy rains 2 000 homeless
27.1.–30.1. Saudi ArabiaJeddah
Floods caused by heavy rains 10 dead<USD 100m insured loss <USD 300m total loss
29.1.–31.1. Malaysia Johor
Floods caused by heavy rains; power outages, travel disruption
5 dead 24 000 homeless
31.1.–7.2. Philippines Visayas, Mindanao
Floods caused by heavy rains, tornado, landslides; 708 houses, bridges destroyed, 1 890 houses damaged
22 dead, 1 missing 164 injured 3 323 homeless PHP 539m (USD 12m) total damage
3.2.–14.2. Sri Lanka Trincomalee, Matale, Anuradhapura, Polonnaruwa, Badulla, Nuwara Eliya, Kandy, Ampara, Puttalam, Kegalle, Mannar, Monaragala, Kalutara, Batticaloa, Mullaitivu
Floods caused by heavy rains; 4 246 houses destroyed, 22 515 damaged
18 dead, 3 missing 24 injured 100 000 homeless USD 60m total damage
3.2. – 17.2. Afghanistan Herat
Flash floods 25 dead 65 injured
14.2.–11.4. Bolivia Chuquisaca, Cochabamba, La Paz, Oruro, Beni, Tarija, Potosí, Pando, Santa Cruz
Floods caused by heavy rains, landslides 56 dead 4 821 homeless USD 20m total damage
26.2. Bolivia La Paz
Landslides caused by heavy rains; 400 houses destroyed
4 000 homeless

Swiss Re, sigma No 2/201220
Date
Country Place
Event
No. of victims/amount of damage in original currency and (USD)
1.3.–12.3. Namibia Caprivi, Kavango, Ohangwena, Omusati, Oshana, Oshikoto, Kunene
Floods caused by heavy rains 108 dead 23 275 homeless NAD 100m (USD 12m) total damage
10.3.–12.4. Indonesia Tangse (Aceh)
Floods caused by heavy rains 21 dead
12.3.–18.3. Brazil Santa Catarina, Parana
Floods caused by heavy rains 10 dead 25 000 homeless
17.3.–19.3. Philippines Mindanao, Visayas
Floods caused by heavy rains, tornadoes, landslides; 111 houses destroyed, 102 houses damaged
16 dead 1 injured 27 165 homeless PHP 2m (USD 0.04m) total damage
17.3.–31.3. Indonesia Papua
Floods caused by heavy rains, Paniai Lake overflows; 5 000 houses destroyed, damage to agriculture
13 dead 3 000 homeless
23.3.–16.4. Thailand Surat Thani, Krabi, Nakhon Si Thammarat, Phatthalung, Chumphon, Trang, Phangnga, Satun, Songkhla, Narathiwat
Floods caused by heavy rains; 16 664 houses destroyed, 6 013 roads, 694 temples and schools damaged, damage to agriculture and fish industry
64 dead 63 196 homeless THB 10bn (USD 317m) total damage
1.4.–31.7. Colombia Floods caused by heavy rains; 4 510 houses destroyed, 179 786 houses damaged
159 dead, 19 missing 158 injured COP 80bn (USD 41m) insured loss COP 2 000bn (USD 1.03bn) total damage
9.4.–15.4. Kazakhstan Chingirlausky, Taskalinsky, Zelenovsky, Terektinsky, Uralsk
Floods caused by heavy rains and melting snow; 1 254 houses, 300 kilometres of roads, farmland destroyed; 1 396 houses, dams, bridges, utility lines damaged, 1 314 livestock killed
2 dead 6 013 homeless KZT 10bn (USD 67m) total damage
14.4.–31.5. Canada Manitoba
Assiniboine River floods; extensive damage to farmland
5 dead CAD 160m (USD 157m) insured loss CAD 815m (USD 800m) total damage
25.4.–15.6. United States ND, SD, IL, IN, MO, KY, AR, TN, MS, LA
Mississippi Valley floods caused by heavy snowmelt and rains; widespread damage to agriculture, properties
7 dead USD 3bn total damage
25.4.–26.4 BrazilRio Grande do Sul
Floods caused by heavy rains, landslides 1 deadUSD 200m total damage
1.5.–3.5. Brazil Pernambuco
Floods caused by heavy rains, landslides 2 dead 13 000 homeless
1.5.–8.5. Afghanistan Baghlan
Floods caused by heavy rains; 1 940 houses destroyed
37 dead 45 injured
9.5. China Luojiang (Guangxi Zhuang)
Landslide at a quarry caused by heavy rains 22 dead
15.5.–30.6. United States Missouri River Basin (MT, ND, SD, NE, IA, MO)
Missouri River Basin floods caused by heavy snowmelt and rains; Missouri and Souris rivers overflow, multiple levees breached, over 84 000 hectares of farmland flooded
5 dead 11 000 homeless USD 2bn total damage
23.5.–30.5. Russia Krasnodarskiy, Adygeya
Floods caused by heavy rains; 102 houses destroyed, 2 112 houses damaged
9 000 homeless RUB 671m (USD 21m) total damage
1.6.–10.6. Haiti Port-au-Prince
Floods caused by heavy rains, landslides 34 dead 6 injured
1.6.–16.6. Philippines Bukidnon, Compostela Valley, Davao del Norte, Davao del Sur, Maguindanao, Lanao del Sur, North Cotabato, Sultan Kudarat, South Cotabato
Floods caused by heavy rains, six rivers overflow; damage to houses, infrastructure, agriculture
12 dead 2 injured 12 875 homeless PHP 429m (USD 10m) total damage
3.6.–17.7. China Anhui, Zhejiang, Jiangxi, Hubei, Hunan, Sichuan, Chongqing, Guizhou
Floods causes by heavy monsoonal rains, landslides 350 dead 550 000 homeless USD 195m insured loss USD 6.4bn total damage
Tables for reporting year 2011

21Swiss Re, sigma No 2/2012
Date
Country Place
Event
No. of victims/amount of damage in original currency and (USD)
15.6.–16.7. India Uttar Pradesh, Uttarakhand
Floods caused by heavy monsoonal rains 50 dead USD 20m total damage
21.6.–22.6. Nigeria Kano
Floods caused by heavy rains; 100 houses destroyed 24 dead 150 injured 100 homeless
28.6.–1.7. Philippines Davao del Norte, Davao del Sur
Floods caused by heavy rains, landslide; 142 houses destroyed, 268 damaged, 2 450 hectares of farmland flooded
30 dead, 1 missing PHP 944m (USD 22m) total damage
29.6.–31.10. Lao People’s Democratic Republic, Xiengkhuang, Vientiane
Floods caused by heavy monsoon rains; 140 000 houses destroyed, over 60 000 hectares of rice cropland flooded
30 dead 400 000 homeless LAK 1 400bn (USD 175m) total damage
30.6.–22.7. Nepal Floods caused by heavy monsoon rains, landslides 113 dead, 42 missing 56 injured
23.7.–28.7. Brazil Rio Grande do Sul
Floods caused by heavy rains, landslides 3 dead 3 000 homeless
7.7.–8.9. Bangladesh Cox’s Bazar, Satkhira, Jessore
Floods caused by heavy rains; 20 000 houses destroyed
10 dead 250 000 homeless
15.7.–17.7. Brazil Pernambuco, Paraiba
Floods caused by heavy rains, landslides 15 dead 13 000 homeless
27.7.–20.11. Thailand Flood caused by heavy monsoon rains 813 dead USD 12bn insured loss USD 30bn total damage
1.8.–30.9. Pakistan Sindh, Southern Pakistan
Floods caused by heavy rains; over 500 000 houses destroyed, 2 711 393 hectares of land flooded
456 dead 756 injured USD 2.5bn total damage
4.8.–31.8. India West Bengal
Floods caused by heavy rains, several rivers burst their banks; damage to houses and cropland
100 dead INR 12.7bn (USD 239m) total damage
5.8. United States Charlotte (North Carolina)
Flash floods caused by torrential rains 1 dead, 1 missing USD 86m insured loss
8.8.–31.8. Uganda Bulambuli
Massive landslides caused by incessant heavy rains; damage to houses and cropland
27 dead 33 injured
13.8.–13.10. Cambodia, Vietnam Floods caused by heavy rains, Mekong River overflows; over 250 000 houses destroyed, severe damage to transport infrastructure and fisheries
320 dead 19 injured USD 300m total damaged
23.8.–7.9. Mexico Cuautitlan
Floods caused by heavy rains, Cuautitlan River bursts its banks
74 dead 40 000 homeless
26.8.–29.8. Nigeria Ibadan
Floods caused by heavy rains; hundreds of livestock perish, damage to houses and contamination of water sources
120 dead
1.9.–22.9. China Shaanxi, Sichuan
Floods caused by heavy rains, landslides; damage to houses and damage to 1 000 000 hectares of farmland
90 dead, 22 missing 1 000 000 homeless CNY 2.6bn (USD 413m) total damage
1.9.–30.11. Colombia Sucreña Mojón
Floods caused by heavy rains, landslides; 695 houses destroyed, 79 616 houses damaged
114 dead, 21 missing 104 injured COP 2 500bn (USD 1.29bn) total damage
5.9.–19.9. India Orissa
Floods caused by heavy rains; over 100 000 houses destroyed
39 dead USD 430m total damage
6.9.–9.9. Brazil Santa Catarina
Floods caused by heavy rains, several rivers overflow 3 dead 18 000 homeless
23.9.–3.10. India Orissa, Bihar, Uttar Pradesh
Floods caused by heavy rains; 50 000 houses destroyed, over 200 000 hectares of cropland destroyed
51 dead INR 28bn (USD 527m) total damage
25.9.–4.11. Vietnam An Giang, Dong Thap, Long An, Can Tho, Vinh Long, Hau Giang, Kein Giang
Floods caused by heavy rains; 359 houses destroyed, 2 076 houses damaged
73 dead

Swiss Re, sigma No 2/201222
Date
Country Place
Event
No. of victims/amount of damage in original currency and (USD)
30.9.–1.10. Algeria El Bayadh
Floods caused by heavy rains; hundreds of houses damaged, 5 bridges collapse
13 dead 50 injured EUR 600m (USD 779m) total damage
15.10.–26.10. Ireland Dublin
Floods caused by heavy rains; damage to private and commercial buildings
2 dead EUR 127m (USD 165m) insured loss EUR 250m (USD 325m) total damage
25.10.–26.10. Italy Liguria, Toscana
Floods caused by heavy rains; damage to houses and infrastructure
10 dead EUR 11m (USD 14m) insured loss EUR 420 (USD 545m) total damage
4.11.–7.11. France, Italy Var (France), Genoa (Italy)
Extratropical low pressure system “Rolf” causes heavy rains and widespread flooding; damage to houses and infrastructure
11 dead, 1 missing EUR 500m (USD 649m) insured loss EUR 1.2bn (USD 1.56bn) total damage
5.11. Colombia Manizales
Massive mudslide due to heavy rains 48 dead
5.12. Tanzania Kilimanjaro, Mbeya
Floods caused by heavy rains, landslides 9 dead 6 776 homeless
5.12.–16.5. Colombia Tolima, Bogota
Floods caused by heavy rains, landslides; damage to houses and cropland
21 dead
6.12.–8.12. Venezuela Miranda, Zulia, Merida, Tachira, Caracas
Floods caused by heavy rains; 1 096 houses destroyed, damage to transport and infrastructure
8 dead 2 000 homeless USD 16m total damage
20.12.–23.12. Tanzania Dar es Salaam
Floods caused by heavy rains; damage to houses and infrastructure
20 dead 200 injured 10 000 homeless
Storms
Date
Country Place
Event
No. of victims/amount of damage in original currency and (USD)
31.1.–3.2. United States CT, IL, IN, MA, NY, OH, PA, RI, TX
Groundhog Day Blizzard winter storm, heavy snowfall, freezing rain; damage to private, industrial and commercial buildings, damage to power plants, 20 000 flights cancelled
36 dead USD 1–3bn insured loss USD 2bn total damage
2.2.–6.2. United States AZ, CO, NM, OK, TX
Winter storm, freezing and icy conditions; damage to property and agriculture, travel disruption
3 dead 5 injured USD 300–600m insured loss USD 600m total damage
2.2.–7.2. Australia Queensland (Cassowary Coast Shire, Innisfail, Silkwood, Mission Beach, Cardwell, Tully, Townsville, Ingham, Cairns)
Tropical Cyclone Yasi, winds up to 240 km/h 1 dead 7 300 homeless AUD 1.33bn (USD 1.36bn) insured loss AUD 2bn (USD 2.05bn) total damage
4.2.–6.2. Australia Victoria (Melbourne)
Storms, heavy rains, floods 4 injured AUD 415m (USD 425m) insured loss
14.2.–16.2. Madagascar, Mozambique Maroantsetra, Mananara North, Mandritsaras
Tropical Cyclone Bingiza, 12 683 houses, 222 public buildings damaged
14 dead, 8 missing 64 injured 12 994 homeless
24.2.–25.2. United StatesMD, PA, TN, VA
Thunderstorm with winds up to 97 km/h, hail, floods, tornadoes
USD 100–300m insured loss
27.2.–28.2. United States IL, IN, MO, OH, TN
Winter storm, flooding, hail, tornadoes 1 dead USD 100–300m insured loss
1.3. Italy Trieste
Winter storm with winds up to 170 km/h 90 injured
5.3.–7.3. Canada Quebec, Ontario
Winter weather, heavy rainfall CAD 50m (USD 49m) insured loss
8.3.–11.3. United States CT, LA, MD, NJ, NY, PA, VA
Storm, flooding, hail, tornadoes, wind 1 dead 2 injured USD 100–300m insured loss
Tables for reporting year 2011

23Swiss Re, sigma No 2/2012
Date
Country Place
Event
No. of victims/amount of damage in original currency and (USD)
26.3.–28.3. United States AL, GA
Winter storm, hail, tornadoes USD 100–300m insured loss
29.3.–31.3. United States FL, LA
Storms with winds up to 145 km/h, flooding, hail, tornadoes
USD 100–300m insured loss
3.4.–5.4. United States GA, IA, IL, KS, KY, MO, NC, SC, TN, WI
Thunderstorms with winds up to 210 km/h, hail, multiple tornadoes
9 dead USD 1–3bn insured loss USD 3.5bn total damage
4.4.–5.4. Bangladesh Jamalpur, Thakurgaon, Sherpur, Mymensingh, Gaibandha, Joypurhat, Bogra
Storms, tornadoes, flooding; damage to houses and cropland, and power outages
13 dead 100 injured
8.4.–11.4. United States AL, IA, KS, NC, OK, SC, TN, TX, WI
Thunderstorms with winds up to 275 km/h, multiple tornadoes, heavy rains, large hailstones; damage to properties and public infrastructure
36 injured USD 1–3bn insured loss USD 2.25bn total damage
14.4.–16.4. United States AL, AR, GA, MS, NC, OK, PA, SC, TX, VA
Storms with winds up to 260 km/h, >240 tornadoes, hail, floods
46 dead 43 injured USD 1–3bn insured loss >USD 2bn total damage
17.4.–18.4. China Guangzhou, Foshan, Dongguan, Zhaoqing (Guangdong)
Hailstorms, winds up to 164 km/h, heavy rains; over 45 houses destroyed, over 1 000 hectares of farmland damaged
18 dead 150 injured CNY 96m (USD 15m) total damage
19.4.–21.4. United States AR, IL, IN, KY, MO, OH, TN, TX
Thunderstorms, hail, >100 tornadoes 2 deadUSD 600m–1bn insured loss USD 1.2bn total damage
22.4. Philippines Compostela
Landslide due to heavy rains; mine flooded 14 dead, 8 missing 14 injured 560 homeless
22.4.–28.4. United States AL, AR, GA, IL, KY, LA, MS, MO, OH, OK, TN, TX, VA
Major weather outbreak, storms with winds up to 340 km/h, >350 tornadoes
354 dead 2 200 injured USD 6–10bn insured loss USD 11bn total damage
25.4.–5.5. Rwanda Kigali
Heavy storms caused widespread flooding 14 dead 3 588 homeless
27.4.–28.4. Canada Ontario, Quebec
Storms with winds up to 100 km/h; property damage and power cuts
1 dead 6 injured CAD 210m (USD 206m) insured loss
8.5.–9.5. Philippines Luzon, Visayas
Tropical Storm Aere with winds up to 83 km/h, heavy rains, landslides, floods; 63 houses destroyed, 9 357 houses damaged; damage to infrastructure and farmland
35 dead, 2 missing 11 injured 141 910 homeless PHP 1.37bn (USD 31m) total damage
10.5.–13.5. United States MN, NC, SC
Strong winds, hail, tornadoes USD 100–300m insured loss
20.5.–22.5. India Uttar Pradesh, Shahjahanpur, Lakhimpur-Kheri, Budaun, Ambedka, Bareilly
Thunderstorm with winds up to 70 km/h, heavy rains
42 dead 50 injured
20.5.–27.5. United States AR, GA, IL, IN, IA KS, KY, MI, MN, MO, NE, NY, NC, OH, OK, PA, TN, TX, VA, WI
Major tornado outbreak, storms with winds up to 405 km/h, widespread damage in Joplin and other areas
155 dead 1 150 injured USD 6–10bn insured loss USD 9bn total damage
25.5.–29.5. Philippines, Japan Philippines (Luzon), Japan (Okinawan islands, Kagoshima, Naze)
Typhoon Songda with winds up to 240 km/h, landslide, floods; damage to houses, 9 fishing boats capsize
4 dead 58 injured 1 151 homeless PHP 130m (USD 3m) total damage
29.5.–1.6. United States IL, MA, MI, MN, ND
Storms with winds up to 260 km/h, tornadoes, hail, floods
3 dead 200 injured USD 300–600m insured loss
1.6.–2.6. United States KS
Storm with winds up to 113 km/h, floods, hail, tornadoes
USD 25–100m insured loss USD 80m total damage
4.6.–11.6. China, Philippines Guandong
Tropical Storm Sarika; damage to houses and farmland 26 dead, 6 missing USD 255m total damage

Swiss Re, sigma No 2/201224
Date
Country Place
Event
No. of victims/amount of damage in original currency and (USD)
8.6.–11.6. United States IL, IA, KS, WI
Storms with winds up to 97 km/h, tornadoes, hail, floods
USD 100–300m insured lossUSD 300m total damage
14.6.–15.6. United States OK
Thunderstorm with winds up to 113 km/h, hail, tornadoes
USD 100-300m insured loss
16.6.–22.6. United States GA, IL, IN, KS, MI, MO, NE, NC, OH, OK, SC, TN, TX, WI
Storms with winds up to 113 km/h, floods, hail, tornadoes
3 dead USD 1–3bn insured loss USD 1.4bn total damage
19.6.–24.6. Vietnam, Philippines, China Tropical Storm Haima 24 dead, 1 missing USD 50m total damage
27.6.–28.6. China, Philippines, South Korea Liaoning, Zhejiang, Shangon (China)
Tropical Storm Meari with winds up to 135 km/h 17 dead, 12 missing 4 injured USD 44m total damage
28.6. Uganda Kiryandongo
Lightning strikes a school amid heavy storm 23 dead 47 injured
30.6. Mexico Cabo Rojo
Tropical Storm Arlene, heavy rains, floods, landslides 22 dead USD 70m total damage
1.7.–4.7. United States IL, MN, WI
Strong winds, hail, flooding, tornadoes 2 dead USD 600m–1bn insured loss
2.7.–3.7. Denmark Copenhagen
Cloudburst, floods DKK 4.7bn (USD 821m) insured loss DKK 6bn (USD 1.05bn) total damage
10.7.–14.7. United States CO, IL, IA, MI, MN, OH, WY
Storms with winds up to 130 km/h, floods, tornadoes, hail
2 dead USD 600m–1bn insured loss USD 1.1bn total damage
18.7.–19.7. Canada Alberta, Manitoba, Saskatchewan
Thunderstorms, heavy winds, hail CAD 185m (USD 182m) insured loss
22.7.–24.7. United States IL
Storm with winds up to 140 km/h, hail, floods; damage to houses, roads, disruption to air travel
USD 100–300m insured loss USD 200m total damage
26.7.–28.7. South Korea Seoul
Cloudburst, flooding 59 deadKRW 60bn (USD 52m) insured loss
27.7.–31.7. Philippines, China, Vietnam Typhoon Nock-Ten with winds up to 95 km/h 75 dead, 9 missing 53 injured 14 814 homeless USD 121m total damage
29.7.–1.8. United States MN, NY, ND, OH, WI
Storm with winds up to 160 km/h, hail, heavy rains; damage to residential, commercial buildings, farmland and infrastructure, power cuts
USD 100-300m insured loss USD 300m total damage
1.8.–9.8. China, North Korea, South Korea, Philippines, Japan
Typhoon Muifa with winds up to 260 km/h, flooding; damage to houses, ports and fishing vessels
22 dead, 3 missing 42 injured 1 000 000 homeless >USD 25m insured loss USD 850m total damage
3.8. Sudan El Geneina (West Darfur)
Two buildings collapse due to heavy rainstorms 20 dead 30 injured
18.8. Belgium Hasselt
Storms with gusty winds, hail; damage to buildings, stage at outdoor music festival collapses
5 dead 71 injured EUR 76m (USD 99m) total damage
18.8.–19.8. United States IA, KS, MO, NE, SD
Storms with winds up to 148 km/h, tornadoes, hails, floods
USD 600m-1bn insured loss USD 1.2bn total damage
21.8. Canada Goderich (Ontario)
Storm, F3 tornado; damage to salt mine and processing plant
1 dead 37 injured CAD 135m (USD 133m) insured loss
22.8.–28.8. United States, Canada, Bahamas, Dominican Republic CT, DE, DC, ME, MD, MA, NH, NJ, NY, NC, PA, RI, VT, VA
Hurricane Irene, torrential rainfall, extensive flooding; over 7 million homes and businesses lose power during the storm
55 dead USD 5.3bn insured loss USD 8bn total damage
Tables for reporting year 2011

25Swiss Re, sigma No 2/2012
Date
Country Place
Event
No. of victims/amount of damage in original currency and (USD)
26.8.–31.8. Philippines, China, Taiwan Typhoon Nanmadol with winds up to 230 km/h; damage to houses, transportation and farmland
35 dead, 8 missing 37 injured USD 250m total damage
1.9.–3.9. United States MI, WI
Storms with winds up to 113 km/h, hail, floods USD 25–100m insured loss
2.9.–3.9. Japan Shikoku Island
Tropical Storm Talas with winds up to 90 km/h 68 dead JPY 36.2bn (USD 470m) insured loss JPY 66bn (USD 858m) total damage
3.9.–8.9. United States AL, DC, GA, LA, MD, MS NY, PA, TN, VA
Tropical Storm Lee with winds up to 75 km/h 21 dead USD 600m–1bn insured loss USD 1bn total damage
12.9.–13.9. United Kingdom Britain, Scotland, Wales, Ireland
Hurricane Katia with winds up to 113 km/h; damage to buildings
1 dead GBP 100m (USD 155m) insured loss
20.9.–22.9. Japan Shizuoka
Typhoon Roke with winds up to 215 km/h; damage to houses and infrastructure
13 dead 308 injured JPY 93.3bn (USD 1.21bn) insured loss JPY 140bn (USD 1.82bn) total damage
26.9.–4.10. Philippines, China, Vietnam Typhoon Nesat with winds up to 150 km/h; over 10 000 houses destroyed, damage to transport facilities and farmland
94 dead, 20 missing 91 injured 254 412 homeless <USD 50m insured loss >USD 360m total damage
30.9.–6.10. Philippines, China, Vietnam Typhoon Nalgae with winds up to 195 km/h 18 dead, 7 missing 12 injured 143 702 homeless PHP 115m (USD 3m) total damage
2.10. South Africa Ficksburg, Duduza
Severe weather, tornadoes; 1 000 houses damaged 1 dead 285 injured
11.10.–13.10. Mexico Jalisco, Colima, Nayarit
Hurricane Jova with winds up to 160 km/h, heavy rains and flooding; damage to residential and commercial properties
5 dead MXN 700m (USD 50m) insured loss
11.10.–21.10. Nicaragua, El Salvador, Honduras, Mexico, Costa Rica, Guatemala
Tropical Depression 12-E; heavy rains, floods
115 dead USD 445m total damage
19.10.–21.10. Myanmar (Burma) Magway, Mandalay, Sagaing
Tropical Storm 02B, heavy rainfall and flooding; 2 500 houses destroyed
151 dead 35 734 homeless
28.10.–31.10. United States CT, MA, NH, NJ, NY, PA
Winter storm with winds up to 85 km/h, heavy snowfall
29 dead USD 600m–1bn insured loss
2.11.–3.11. Oman Salalah
Tropical Storm Keila with winds up to 119 km/h 14 dead 200 injured
9.11. Argentina Puerto Madryn Chubut
Landslide damages electrical equipment of hydroelectric plant; production capacity reduced
USD 50m insured loss
24.11.–25.11. Norway, Faroe Islands Nordland, Nord-Trøndelag
Winter storm Berit; damage to properties and temporary closure of three oil drilling platforms
NOK 285m (USD 48m) insured loss
24.11.–27.11. Sri Lanka Thunderstorms, flooding, landslides; over 7 000 houses damaged
22 dead 41 injured
27.11. Canada Calgary
Storm with winds up to 149 km/h; damage to private and commercial buildings, minor travel disruption
CAD 200m (USD 196m) insured loss
30.11.–2.12. United States CA, NM, UT
Strong winds, thunderstorms; power outages and travel disruption
7 dead USD 100–300m insured loss USD 225m total damage
8.12.–10.12. United Kingdom, North Sea Glasgow, Campbeltown, Falkirk, Stirling, Dalry, Ardrossan, Aberdeen (Scotland)
Windstorm Friedhelm with winds up to 266 km/h; damage to vehicles and widespread road blockages, heavy damage to FPSO (floating production storage and offloading) in North Sea
USD 420m insured loss
15.12.–17.12. France, Germany, Switzerland Winter Storm Joachim with winds in excess of 170 km/h; power outages and travel disruption, cargo vessel runs aground in Brittany, train derails in Switzerland
EUR 300m (USD 389m) insured loss

Swiss Re, sigma No 2/201226
Date
Country Place
Event
No. of victims/amount of damage in original currency and (USD)
16.12.–18.12. Philippines Northern Mindanao, Mimaropa, Bicol
Tropical Storm Washi; 13 337 houses destroyed, damage to livestock, farmland, and fisheries
1 268 dead, 181 missing 6 071 injured 431 235 homeless PHP 1.71bn (USD 40m) total damage
25.12.–27.12. Norway, Finland, Sweden, Estonia, Bavaria, Saxony, Saxony-Anhalt
Windstorm Dagmar with winds up to 223 km/h; damage to buildings and forestry
USD 365m insured loss USD 555m total damage
29.12.–30.12. India Cuddalore (Tamil Nadu)
Tropical Cyclone Thane with winds up to 125 km/h; 200 000 houses damaged
47 dead
31.12. South Africa KwaZulu-Natal
Severe weather, gusty winds, flooding; over 700 houses destroyed
5 dead 50 injured ZAR 79m (USD 10m) total damage
Earthquakes
Date
Country Place
Event
No. of victims/amount of damage in original currency and (USD)
1.2. China Dehong (Yunnan )
Earthquake (MW 4.8); 1 house destroyed, 670 houses damaged
64 500 homeless
22.2. New Zealand Christchurch
Earthquake (MW 6.3), aftershocks 181 dead 1 500 injured USD 12bn insured loss USD 15bn total damage
10.3. China Yingjiang (Yunnan)
Earthquake (MW 5.4), aftershocks; 3 618 houses destroyed; 11 356 houses, 1 hotel, and 1 supermarket damaged
26 dead 250 injured CNY 1.84bn (USD 292m) total damage
11.3. Japan North East
Earthquake (MW 9.0) triggers tsunami, aftershocks, 200 landslides; 128 538 buildings destroyed; 790 719 buildings, 3 559 roads, 77 bridges, 45 dikes, and 29 railways damaged; damage to nuclear facilities, Fukushima nuclear plant decommissioned
15 845 dead, 3 339 missing 5 893 injured 400 000 homeless USD 35bn insured loss USD 210bn total damage
24.3. Myanmar (Burma) Chiang Rai, Shan, Tachileik, Tarlay
Earthquake (MW 6.8), aftershocks; 318 houses destroyed, 702 houses, schools, 1 hospital, 31 religious buildings, road infrastructure, and water facilities damaged
74 dead 125 injured 3 152 homeless MMK 24m (USD 4m) total damage
11.5. Spain Lorca, Murcia
Earthquakes (MW 4.5 and 5.1) 9 dead 293 injured USD 100m insured loss USD 150m total damage
19.5. Turkey Simav Kutahya
Earthquake (MW 5.8), aftershocks 3 dead 121 injured 10 000 homeless TRY 8m (USD 4m) insured loss TRY 460m (USD 244m) total damage
13.6. New Zealand Christchurch
Earthquakes (MW 5.2 and MW 6.0); damage to property
1 dead 46 injured USD 2bn insured loss USD 3bn total damage
11.7.–15.7. Indonesia Sulawesi Island
Mount Lokon erupts 6 000 homeless
20.7. Uzbekistan, Kyrgyzstan Ferghana valley
Earthquake (MW 6.1), aftershocks; damage to houses and roads
14 dead 90 injured USD 10m total damage
Tables for reporting year 2011

27Swiss Re, sigma No 2/2012
Date
Country Place
Event
No. of victims/amount of damage in original currency and (USD)
18.9. India, Nepal, China Gangtok (Sikkim)
Earthquake (MW 6.9), aftershocks: over 100 000 houses damaged
At least 88 dead 154 injured 30 000 homeless USD 20m total damage
23.10. Turkey Van, Ercis
Earthquake (MW 7.2), over 400 aftershocks; 2 900 destroyed, 66 350 houses damaged
644 dead 2 500 injured 22 000 homeless USD 90m insured loss USD 1.5bn total damage
28.10. Peru Ica
Earthquake (MW 6.9); 134 houses destroyed
103 injured
1.11. China Xinjiang Uygur
Earthquake (MW 5.4); 63 600 houses damaged
3 800 homeless CNY 358m (USD 57m) total damage
9.11. Turkey Van
Earthquake (MW 5.6), aftershocks; 25 houses destroyed
40 dead 30 injured
Droughts, bush fires, heat waves
Date
Country Place
Event
No. of victims/amount of damage in original currency and (USD)
1.1.–30.5. China Hebei, Shanxi, Jiangsu, Anhui, Shandong, Henan, Shaanxi, Gansu
Prolonged drought, severe water shortages; 7 million hectares of farmland damaged
CNY 14.9bn (USD 2.37bn) total damage
1.1.–30.6. United States Texas
Prolonged drought conditions Over USD 5bn total damage< USD 1bn insured loss
1.1.–31.12. Somalia, Ethiopia, Kenya Prolonged and severe drought; poor harvest and loss of livestock trigger population displacement, state of famine declared for six regions in Somalia
Human and economic impact under assessment
1.1.–1.8. Afghanistan Balkh, Samangan, Takhar, Saripul, Herat, Badghis, Faryab, Jowzjan, Baghlan, Kunduz, Badakshan, Bamiyan, Daikundi, Ghor
Drought caused by limited snowfall and rainfall; damage to farmland, food shortage
USD 142m total damage
9.4.–30.4. United States Texas
Wildfires triggered by prolonged drought conditions; 250 buildings, 650 000 hectares of farmland destroyed
2 dead 5 injured USD 183m total damage
14.5.–17.5. Canada Slave Lake, Alberta
Wildfires triggered by prolonged dry conditions and strong winds; 400 houses destroyed
7 000 homeless CAD 700m (USD 687m) insured loss
29.5.–23.6. United States AZ, NM, TX, FL
Wildfires triggered by drought conditions and strong winds; 231 000 hectares of farmland destroyed
2 dead USD 200m total damage
4.9.–9.9. United States TX
Wildfires triggered by high temperatures and strong winds; over 180 wildfires outbreaks, over 1 600 houses destroyed
4 dead USD 300–600m insured loss USD 1bn total damage
23.11.–24.11. Australia Margaret River
Margaret River bushfires; 40 houses damaged AUD 53m (USD 54m) insured loss

Swiss Re, sigma No 2/201228
Tables for reporting year 2011
Cold, frost
Date
Country Place
Event
No. of victims/amount of damage in original currency and (USD)
1.1.–18.1. India Allahabad, Pratapgarh, Jaunpur, Barabanki (Uttar Pradesh), Solan, Sundernagar, Bhuntar, Shimla (Himachal Pradesh), Leh, Qazigund (Jammu & Kashmir), Bihar
Cold wave with –23° Celsius temperatures 80 dead
1.1.–19.1. Nepal Kapilvastu, Parbat, Bhojpur, Khotang, Dhank-uta, Sankhuwasabha. Terai
Heavy snow, cold temperatures; farmland destroyed, travel disruption
42 dead NPR 10m total damage
1.1.–24.1. China Guizhou, Sichuan, Yunnan, Anhui, Hunan, Hubei, Guangxi Zhuang
Snow storms, icy rains, prolonged cold wave; water shortage, power cuts, major transport disruption
2 dead 472 injured 233 000 homeless CNY 1.77bn (USD 281m) total damage
2.1.–28.1. Poland Warsaw, Bialystok
Extreme cold weather with -20° Celsius temperatures; travel disruption due to excessive frost
30 dead
7.1.–20.2. Bangladesh Barguna, Gaibandha, Isbwa, Lalmonirhat, Rajshahi
Cold wave with temperatures of 4.5° Celsius; damage to agriculture
50 dead
23.1.–10.2. Mexico Sinaloa
Cold temperatures, over 600 000 hectares of cropland lost
3 dead USD 350m insured lossUSD 1bn total damage
10.2.–14.2. Afghanistan Daykundi
Heavy snowfall, avalanches 21 dead 5 injured
16.12.–31.12. India Uttar Pradesh, Punjab, Haryana
Cold wave with temperatures below 0° Celcius, heavy snow; damage to cropland and travel disruption
132 dead
Hail
Date
Country Place
Event
No. of victims/amount of damage in original currency and (USD)
8.8. Paraguay Itapúa
Hailstorm; damage to houses and farmland 2 000 homeless
25.12. Australia Melbourne
Hailstorm; damage to property AUD 615m (USD 630m) insured loss

29Swiss Re, sigma No 2/2012
Table 8Chronological list of all man-made disasters 2011
Major fires, explosions
Date
Country Place
Event
No. of victims/amount of damage in original currency and (USD)
5.1. Netherlands Moerdijk
Chemical plant destroyed during fire EUR 71m (USD 93m) total damage
6.1. Canada Alberta
Fire at oil sand plant 5 injured
8.1. United States Louisiana
Fire at petrochemical plant
7.2.–8.2. Philippines Barangay Central (Quezon City)
Fire in shanty town spreads to residential compound; 600 houses destroyed
11 injured 20 000 homeless PHP 20m total damage
8.2. United States Mont Belvieu (Texas)
Explosion at gas plant 1 dead
9.2. Italy Caldiero (Verona)
Fire at food plant 2 injured
10.2. South Africa Mpumalanga
Explosion and fire at power station during turbine test
14.2.–15.2. Philippines Sinagtala Bahay Toro, Quezon City
Fire in shanty town 1 dead 10 000 homeless PHP 10m total damage
25.2. Germany Dinslaken
Fire in tube factory
12.4. Canada Alberta
Fire in fertilizer plant
14.4. Mexico Jalisco
Fire in department store USD 107m total damage
20.4. Philippines Makati City, Manila
Fire in shanty town 8 000 homeless
12.6. South Africa Springs
Fire in care centre 22 dead 27 injured
11.7. Cyprus Zygi
Explosion at Vasilikos Power Station, ignited by fire of nearby naval base; nearby buildings destroyed or damaged, massive power cuts
13 dead 62 injured
21.8. Germany Schwerte
Fire at iron and steel plant
25.8. Mexico Monterrey
Arson attack at casino, fire erupts 52 dead
12.9. Kenya Nairobi
Leaky pipeline explosion ignites fire in shanty town 76 dead 116 injured
28.9. Singapore Bukom
Explosion in oil refinery
6.10. Canada Saskatchewan
Explosion in refinery releases diesel and hydrogen gas 10 injured
25.10. Libyan Arab Jamahiriya Sirte
Sparks from nearby generator ignite explosion at fuel tank
100 dead 50 injured
15.11. Russia Stavropol
Explosion in petrochemical plant 9 injured
9.12. India Calcutta
Fire in hospital 89 dead
17.12. China Shanghai
Explosion in manufacturing plant 61 injured

Swiss Re, sigma No 2/201230
Tables for reporting year 2011
Date
Country Place
Event
No. of victims/amount of damage in original currency and (USD)
23.12. Colombia Dosquebradas
Gas pipeline explosion; 22 houses destroyed 19 dead 100 injured
29.12. Myanmar (Burma) Rangoon
Fire at medical warehouse due to faulty electrical wiring; nearby warehouses damaged
17 dead 80 injured
Aviation disasters
Date
Country Place
Event
No. of victims/amount of damage in original currency and (USD)
9.1. Iran Orumiyeh
Iran Air Boeing 727 crashes in emergency landing 77 dead, 1 missing 26 injured
4.3. Space, United States Glory Satellite vehicle launch failure USD 424m total damage4.4. Congo, Democratic Republic
of (DRC) Kinshasa-N’Djili Airport
Canadair CL-600-2B19 Jet CRJ-100ER crashes in rainy weather
32 dead
3.5. Space, Luxembourg Antennas on New Dawn Satellite fail to deploy in orbit
USD 250m total damage
7.5. Indonesia Kaimana Gulf, 800m off Kaimana Airport
Merpati Nusantara Airlines Xian MA60 crashes into the sea
25 dead
18.5. Argentina Prahuaniyeu
Sol Airlines Saab 340A crashes while on approach 22 dead
21.5. Space, Canada Deployment failure of solar array on Telstar 14R satellite USD 251m total damage21.6. Russia
PetrozavodskRusAir Tupolev 134A-3 crashes on highway while on approach
47 dead 9 injured
8.7. Congo, Democratic Republic of (DRC) Kisangani
Hewa Bora Airways Boeing 727-030 (WL) crashes on landing
77 dead
26.7. Morocco Guelmim
Royal Moroccan Air Force C-130 Hercules crashes on landing in bad weather
80 dead
29.7. Egypt Cairo
Egypt Air Boeing 777-266ER catches fire shortly before take-off
30.7. Guyana Georgetown
Caribbean Airlines Boeing 737-8BK (WL) overruns the runaway after landing
17.8. Space, Kazakhstan Loss of Express AM-4 satellite shortly after launching18.8. Space, China Shi Jian 11-04 launch vehicle failure USD 150m total damage24.8. Space Progress M-012M ISS supply mission launch
vehicle failureUSD 150m total damage
2.9. Chile Isla Robinsón Crusoe, Juan Fernández archipelago
Chilean Air Force CASA C-212 Aviocar crashes on landing
21 dead
7.9. Russia Yaroslavl
Yakovlev RA-42434 aircraft crashes while taking off 44 dead
16.9. United States Reno, Nevada
P-51 Mustang aircraft crashes at air show 9 dead 70 injured
13.10. Papua New Guinea Madang
De Havilland Canada DHC-8-102 crashes on approach 28 dead
9.11. Space Phobos Grunt Mars probe fails to reach designated orbit
RUB 5bn (USD 156m) total damage
23.12.–23.11. Space Meridian 5 Russian military satellite launch vehicle failure
USD 150m total damage

31Swiss Re, sigma No 2/2012
Maritime disasters
Date
Country Place
Event
No. of victims/amount of damage in original currency and (USD)
2.1. Indian Ocean, Red Sea, Gulf of Aden, Yemen Strait of Bab-el-Mandeb
Boat carrying illegal immigrants capsizes 28 dead
3.1. Indian Ocean, Gulf of Aden, Yemen Lahij province
Boat carrying illegal immigrants capsizes 40 dead
16.1. Mediterranean Sea, Greece Corfu
Boat carrying illegal immigrants sinks in bad weather 22 dead 11 injured
28.1. Indian Ocean, Indonesia Merak (Java)
Fire on overcrowded ferry ignited by a vehicle explosion 27 dead 200 injured
4.2. North Sea, United Kingdom Aberdeen
FPSO Gryphon Alpha vessel damaged during storm; damage to riser and subsea systems
2 injured
10.2. Norwegian Sea, Norway Gas leakage at exploration rig20.2. Indian Ocean,
Gulf of Aden, Yemen Shabwa
Boat carrying refugees capsizes 57 dead 1 injured
2.3. Zambia Lake Mweru (Luapula)
Fishing boat capsizes in stormy weather 38 dead
15.3. Mediterranean Sea, Italy Lampedusa
Boat carrying illegal immigrants capsizes 35 dead
16.3. Pacific Ocean Tristan Da Cunha
Grounding of bulk carrier
22.3. Indian Ocean, Gulf of Aden, Yemen Shabwa
Boat carrying illegal immigrants capsizes 49 dead
23.3. Gulf of Mexico, United States Walker Ridge
Loss of deepwater riser connecting floating production, storage, and offloading (FPSO) vessel to well
31.3. Mediterranean Sea, Tunisia Kerkennah Islands
Boat carrying illegal immigrants capsizes 27 dead
2.4. Venezuela Mariscal Sucre
Drilling vessel struck by a tugboat
6.4. Mediterranean Sea, Italy Lampedusa
Boat carrying illegal immigrants capsizes in bad weather
150 dead
12.4. Gulf of Mexico, Mexico Bay of Campeche
Semi-submersible accommodation oil platform Jupiter sinks
14.4. Indian Ocean, Arabian Sea, Gulf of Aden, Yemen
Overcrowded fishing boat carrying illegal immigrants sinks
21 dead, 14 missing
24.4. Congo, Democratic Republic of (DRC) Sud-Kivu (Minova)
Boat capsizes on Lake Kivu in rough weather 30 dead
29.4. Egypt Beni Suef
Ferry carrying bus capsizes on Nile River 22 dead
2.5. Congo, Democratic Republic of (DRC) Kasai-Occidental
Overloaded boat capsizes on Kasai River at least 100 dead
6.5. Mediterranean Sea, Spain Almeria
Boat carrying illegal immigrants capsizes 22 dead
8.5. Togo Lake Togo
Passenger boats capsize in stormy weather on Lake Togo
36 dead
31.5. Mediterranean Sea, Tunisia Kerkennah Islands
Boat carrying illegal immigrants capsizes 123 dead
6.6. Philippine Sea, Indonesia South Kalimantan (Borneo Island)
Overcrowded passengers ship sinks in strong winds 28 dead
5.7. Indian Ocean, Red Sea, Sudan Sawaken
Boat carrying illegal immigrants sinks after catching fire 187 dead

Swiss Re, sigma No 2/201232
Tables for reporting year 2011
Date
Country Place
Event
No. of victims/amount of damage in original currency and (USD)
11.7. Russia Tatarstan
Overcrowded cruise ship sinks on Volga River 130 dead 2 injured
29.7. Mediterranean Sea, Egypt Alexandria
Boat carrying illegal immigrants sinks 30 dead
1.8. Mediterranean Sea, Italy Lampedusa
25 immigrants are asphyxiated from crowding on boat fleeing Libya
25 dead
9.8. Indian Ocean, Comoros Ngazidja Island (Comoros )
Overcrowded passenger boat capsizes 54 dead, 67 missing
16.8. Nepal Siraha
Overcrowded boat capsizes in rain-swollen Kamal River 3 dead, 20 missing
10.9. Indian Ocean, Tanzania Pemba, Zanzibar
Overcrowded ferry sinks 192 dead, 28 missing
22.9. Indian Ocean, Indonesia Nusa Penida
Passenger boat capsizes in rough waters 25 dead
5.10.–14.10. South Pacific Ocean, New Zealand Tauranga
Grounding of container vessel MV Rena triggers oil spill
21.10. South Pacific Ocean, Hong Kong Cheung Chau
Ferry crashes into a mooring pillar 76 injured
26.11. Mediterranean Sea, Italy Brindisi
Boat carrying illegal immigrants capsizes 3 dead, 30 missing
17.12. Indian Ocean, Indonesia Prigi, East Java
Overcrowded boat carrying illegal immigrants capsizes 16 dead, 187 missing
19.12. Russia Sakhalin Island, Sea of Okhotsk
Drilling platform capsizes in rough weather 16 dead, 37 missing
25.12. Caribbean Sea, Cuba Punta de Maisi
Overcrowded boat carrying immigrants capsizes 45 dead
25.12.–25.11. North Pacific Ocean, Philippine Sea, Philippines Luzon Island
Ship carrying nickel sinks due to liquefaction of the cargo
22 missing
Rail disasters including cableways
Date
Country Place
Event
No. of victims/amount of damage in original currency and (USD)
16.2. Argentina San Miguel (Buenos Aires province)
Two trains collide at level crossing 4 dead 70 injured
8.4. South Africa Pretoria
Collision between two trains 1 dead 200 injured
19.5. South Africa Johannesburg
Collision between two trains 857 injured
7.7. India Kanshiramnagar (Uttar Pradesh)
Train hits bus at railway crossing 35 dead 39 injured
10.7. India Fatehpur (Uttar Pradesh)
Kalka Mail passenger train derails 68 dead 100 injured INR 100m (USD 2m) total damage
23.7. China Wenzhou (Zhejiang)
High-speed train crashes into a stalled train 140 dead 191 injured
28.8. Brazil Rio de Janeiro
City tram derails 5 dead 57 injured
13.9. India Chennai
Two trains collide 10 dead 52 injured
13.9. Argentina Buenos Aires
Train collides with bus at level-crossing and hits a second train
9 dead 212 injured

33Swiss Re, sigma No 2/2012
Mining accidents
Date
Country Place
Event
No. of victims/amount of damage in original currency and (USD)
5.1. Australia Oakbridge
Fire at coal mine USD 445m total damage
27.1. Colombia Sardinata
Explosion at coal mine due to methane gas build-up 21 dead 6 injured
20.3. Pakistan Quetta
Gas explosions at coal mine 43 dead
10.4. Australia Laverton
Gold mine wall partially collapses following blast
11.7.–17.11. China Shandong
Miners trapped in iron mine due to flood 21 dead
29.7. Ukraine Luhansk
Explosion at coal mine 28 dead 2 injured
29.10. China Hengshan (Hunan)
Gas explosion at coal mine 29 dead
10.11. China Qujing (Yunnan)
Explosion at illegal coal mine 20 dead, 23 missing
Collapse of building/bridges
Date
Country Place
Event
No. of victims/amount of damage in original currency and (USD)
22.10. India Rangeet Khola River (Darjeeling)
Overcrowded bridge collapses during public gathering 32 dead 132 injured
29.10. India Kameng River (Arunachal Pradesh)
Suspension footbridge collapses while people are crossing it
30 dead
26.11. Indonesia Kalimantan (Borneo)
720 metre-long suspension bridge over Mahakam river collapses
11 dead, 30 missing 39 injured
Miscellaneous
Date
Country Place
Event
No. of victims/amount of damage in original currency and (USD)
1.1. Egypt Alexandria
Bomb explodes in a church 21 dead
3.1.–16.1. Tunisia Thala, Kasserine, Regueb
Civil commotion 219 dead 700 injured
14.1. India Pullumedu (Kerala)
Stampede at Sabarimala Temple 100 dead
24.1. Russia Moscow
Bomb explosion at Domodedovo International Airport 35 dead 180 injured
25.1.–12.2. Egypt Cairo, Suez, Alexandria
Anti-government demonstrations 846 dead 6 400 injured
26.1. India Kalapet
Poisonous chlorine leak at chemical plant 300 injured
10.2. Pakistan Mardan
Suicide bombing at army recruitment centre 20 dead 20 injured
15.2.–21.2. Libyan Arab Jamahiriya Benghazi
Anti-government demonstrations 233 dead
16.2. Tanzania Dar es Salaam
Explosion at military ammunition depot; 188 houses damaged
27 dead 500 injured 1 000 homeless

Swiss Re, sigma No 2/201234
Tables for reporting year 2011
Date
Country Place
Event
No. of victims/amount of damage in original currency and (USD)
21.2. Mali Bamako
Stampede at Modibo Keita Stadium after religious ceremony
36 dead
28.2. Kenya Mukuru Fuata Nyayo
Fire in shanty town 1 dead 8 969 homeless
28.2. Brazil Minas Gerais, Bandeira do Sul
Power cable falls into Carnival float 17 dead 55 injured
18.3. Yemen Sanaa
Anti-government demonstrations 41 dead
11.4. Belarus Minsk
Explosions at Oktyabrskaya subway station 11 dead 126 injured
14.4.–15.4. Uganda Kampala
Anti-government demonstrations 3 dead 67 injured
28.4.–29.4. Uganda Kampala
Anti-government demonstrations 7 dead 327 injured
18.5. Madagascar Tsiroanomandidy
Stampede at concert 21 dead
25.5. Egypt Disuk
Poisonous chlorine leak from a cistern in shop 850 injured
11.6.–14.6. Sudan Lakes
Clashes between clans over cattle 71 dead
13.6.–15.6. Pakistan Karachi
Clashes between opposition political parties 20 dead
15.6. Canada Vancouver
Riots following 2011 Vancouver Stanley Cup final 150 injured CAD 5m (USD 5m) total damage
26.6. Nigeria Maiduguri
Bomb explosion at beer garden 25 dead
28.6.–29.6. Egypt Cairo
Anti-government demonstrations 1 000 injured
3.7. Italy Chiomonte
Demonstrations against high-speed rail 200 injured
10.7. India Rangiya (Assam)
Bomb explosion causes train to derail; 200 metres of rail track destroyed
100 injured
13.7. India Mumbai
Triple bomb explosions in Mumbai 31 dead 137 injured
18.7. China Hotan (Xinjiang)
Clashes between ethnic factions 20 dead
22.7. Norway Oslo, Utoya
Twin terror attacks in Oslo city centre and at youth camp
77 dead 96 injured
6.8.–9.8. United Kingdom London, Birmingham, Enfield, Manchester
Riots following shooting of man by police; looting and damage to private and commercial properties due to fires
5 dead 111 injured
19.8. Pakistan Ghundi (Khyber region)
Bomb explosions in a mosque 40 dead 85 injured
26.8. Nigeria Abuja
Suicide bomb explosion at United Nations compound 25 dead 80 injured
7.9. India Delhi
Bomb explosion at Delhi High Court 13 dead 76 injured
15.9. Pakistan Lower Dir
Bomb explosion at funeral 20 dead
22.9. Russia Makhachkala (Dagestan)
Triple bomb explosions in city centre 6 dead 60 injured
4.10. Somalia Mogadishu
Suicide bomb explosion near government compound 70 dead 50 injured
15.10. Mexico Tamaulipas
Clashes between rival gangs in a penitentiary 20 dead 12 injured
29.10. Nigeria Zamfara
Lead poisoning from illegal gold mine 2 000 injured
1.11. China Guizhou
Explosives explode while parked at petrol station
9 dead 219 injured

35Swiss Re, sigma No 2/2012
Date
Country Place
Event
No. of victims/amount of damage in original currency and (USD)
4.11. Nigeria Damaturu
Series of bomb explosions and gun attacks 63 dead
8.11. India Haridwar
Stampede at religious festival 20 dead 50 injured
13.12. Belgium Liège
Gunman opens fire in Christmas market in city centre 6 dead 125 injured
16.12.–20.12. Egypt Cairo
Mass protests against Government during elections 14 dead 300 injured
17.12. Kazakhstan Zhanaozen, Shetpe
Violent clashes between police and oil workers following dismissal; 41 buildings damaged
16 dead 108 injured KZT 1.9bn (USD 13m) total damage
20.12.–31.12. India Rajasthan
Hospital patients die for lack of care following doctors’ strike
60 dead
25.12. Nigeria Abuja
Bomb explosion in a catholic church during Christmas mass
35 dead 52 injured

Swiss Re, sigma No 2/201236
Tables showing the major losses 1970–2011
Table 9The 40 most costly insurance losses (1970–2011)
Insured loss17 (in USD m, indexed to 2011) Victims18 Date (start) Event Country 74 686 1 836 25.08.2005 Hurricane Katrina; floods, dams burst, US, Gulf of Mexico, Bahamas, damage to oil rigs North Atlantic 35 000 19 184 11.03.2011 Earthquake (MW 9.0) triggers tsunami; aftershocks Japan 25 641 43 23.08.1992 Hurricane Andrew; floods US, Bahamas 23 848 2 982 11.09.2001 9/11 attacks US 21 239 61 17.01.1994 Northridge earthquake (M 6.6) US 21 141 136 06.09.2008 Hurricane Ike; floods, offshore damage US, Caribbean: Gulf of Mexico, et al 15 350 124 02.09.2004 Hurricane Ivan; damage to oil rigs US, Caribbean; Barbados, et al 14 468 35 19.10.2005 Hurricane Wilma; floods US, Mexico, Jamaica, Haiti, et al 12 000 813 27.07.2011 Flood caused by heavy monsoon rains Thailand12 000 181 22.02.2011 Earthquake (MW 6.3), aftershock (MW 5.6) New Zealand 11 625 34 20.09.2005 Hurricane Rita; floods, damage to oil rigs US, Gulf of Mexico, Cuba 9 583 24 11.08.2004 Hurricane Charley; floods US, Cuba, Jamaica, et al 9 322 51 27.09.1991 Typhoon Mireille/No 19 Japan 8 292 71 15.09.1989 Hurricane Hugo US, Puerto Rico, et al 8 248 562 27.02.2010 Earthquake (MW 8.8) triggers tsunami Chile 8 036 95 25.01.1990 Winter Storm Daria France, UK, Belgium,, et al 7 830 110 25.12.1999 Winter Storm Lothar Switzerland, UK, France, et al 7 300 354 22.04.2011 Severe storms, tornadoes United States (Alabama, et al) 7 050 155 20.05.2011 Severe storms, tornadoes United States (Missouri, et al) 6 609 54 18.01.2007 Winter Storm Kyrill; floods Germany, UK, Netherlands,, et al 6 135 22 15.10.1987 Storm and floods in Europe France, UK, Netherlands, et al 6 127 38 26.08.2004 Hurricane Frances US, Bahamas 5 491 64 25.02.1990 Winter Storm Vivian Europe 5 454 26 22.09.1999 Typhoon Bart/No 18 Japan 5 300 55 22.08.2011 Hurricane Irene, extensive flooding United States, et al 5 155 – 04.09.2010 Earthquake (MW 7.0), over 300 aftershocks New Zealand 4 870 600 20.09.1998 Hurricane Georges; floods US, Caribbean 4 577 41 05.06.2001 Tropical Storm Allison; floods US 4 527 3 034 13.09.2004 Hurricane Jeanne; floods, landslides US, Caribbean: Haiti, et al 4 268 45 06.09.2004 Typhoon Songda/No 18 Japan, South Korea 3 918 45 02.05.2003 Thunderstorms, tornadoes, hail US 3 810 70 10.09.1999 Hurricane Floyd; floods US, Bahamas, Columbia 3 697 59 01.10.1995 Hurricane Opal; floods US, Mexico, Gulf of Mexico 3 648 6 425 17.01.1995 Great Hanshin earthquake (M 7.2) in Kobe Japan 3 418 25 24.01.2009 Winter Storm Klaus, wind up to 170 km/h France, Spain 3 240 45 27.12.1999 Winter Storm Martin Spain, France, Switzerland 3 055 246 10.03.1993 Blizzard, tornadoes, floods US, Canada, Mexico, Cuba 2 886 38 06.08.2002 Severe floods UK, Spain, Germany, Austria, et al 2 840 64 27.02.2010 Winter Storm Xynthia, winds up to 160 km/h France, Germany, Belgium, et al ns19 167 06.07.1988 Explosion on platform Piper Alpha UK
17 Property and business interruption, excluding liability and life insurance losses; US natural catastrophe figures: with the permission of Property Claim Services (PCS)/incl. NFIP losses (see page 38 “Terms and selection criteria”)
18 Dead and missing19 ns: not shown

37Swiss Re, sigma No 2/2012
Table 10The 40 worst catastrophes in terms of victims (1970–2011)
Insured loss20 (in USD m, Victims21 indexed to 2011) Date (start) Event Country 300 000 – 14.11.1970 Storm and flood catastrophe Bangladesh, Bay of Bengal 255 000 – 28.07.1976 Earthquake (M 7.5) China 222 570 103 12.01.2010 Earthquake (MW 7.0) Haiti 220 000 2 381 26.12.2004 Earthquake (MW 9), tsunami in Indian Ocean Indonesia, Thailand, et al 138 300 – 02.05.2008 Tropical Cyclone Nargis; Irrawaddy Delta floods Myanmar (Burma), Bay of Bengal 138 000 3 29.04.1991 Tropical Cyclone Gorky Bangladesh 87 449 383 12.05.2008 Earthquake (MW 7.9) in Sichuan, aftershocks China 73 300 – 08.10.2005 Earthquake (MW 7.6); aftershocks, landslides Pakistan, India, Afghanistan 66 000 – 31.05.1970 Earthquake (M 7.7); rock slides Peru 55 630 15.06.2010 Heat wave in Russia Russia 40 000 198 21.06.1990 Earthquake (M 7.7); landslides Iran 35 000 1 542 01.06.2003 Heat wave and drought in Europe France, Italy, Germany, et al 26 271 – 26.12.2003 Earthquake (M 6.5) destroys 85% of Bam Iran 25 000 – 07.12.1988 Earthquake (M 6.9) Armenia, ex-USSR 25 000 – 16.09.1978 Earthquake (M 7.7) in Tabas Iran 23 000 – 13.11.1985 Volcanic eruption on Nevado del Ruiz Colombia 22 084 296 04.02.1976 Earthquake (M 7.5) Guatemala 19 737 127 26.01.2001 Earthquake (MW 7.6) in Gujarat India, Pakistan, Nepal, et al 19 184 35 000 11.03.2011 Earthquake (MW 9.0) triggers tsunami Japan 19 118 1 350 17.08.1999 Earthquake (ML 7) in Izmit Turkey 15 000 – 11.08.1979 Macchu Dam bursts in Morvi India 15 000 – 01.09.1978 Floods following monsoon rains in the north India, Bangladesh 15 000 135 29.10.1999 Cyclone 05B devastates Orissa State India, Bangladesh 11 069 – 25.05.1985 Tropical cyclone in Bay of Bengal Bangladesh 10 800 – 31.10.1971 Floods in Bay of Bengal and Orissa State India 10 000 297 12.12.1999 Floods, mudflows, and landslides Venezuela, Colombia 10 000 – 20.11.1977 Tropical cyclone in Andrah Pradesh India, Bay of Bengal 9 500 673 19.09.1985 Earthquake (M 8.1) Mexico 9 475 – 30.09.1993 Earthquake (M 6.4) in Maharashtra India 9 000 690 22.10.1998 Hurricane Mitch in Central America Honduras, Nicaragua, et al 6 425 3 648 17.01.1995 Great Hanshin earthquake (M 7.2) in Kobe Japan 6 304 – 05.11.1991 Typhoons Thelma and Uring Philippines 6 000 – 02.12.1984 Accident in chemical plant in Bhopal India 6 000 – 01.06.1976 Heat wave, drought France 5 749 45 27.05.2006 Earthquake (ML 6.3); Bantul almost destroyed Indonesia 5 422 – 26.06.1976 Earthquake (M 7.1) Papua New Guinea, Indonesia, et al 5 374 – 10.04.1972 Earthquake (M 6.9) in Fars Iran 5 300 – 28.12.1974 Earthquake (M 6.3) Pakistan 5 000 – 30.06.1976 Earthquake in West Irian Indonesia 5 000 1 326 05.03.1987 Earthquake; oil pipeline damaged Ecuador
20 Property and business interruption, excluding liability and life insurance losses21 Dead and missing

Swiss Re, sigma No 2/201238
Terms and selection criteria
Natural catastrophes The term “natural catastrophe” refers to an event caused by natural forces. Such an
event generally results in a large number of individual losses involving many insurance policies. The scale of the losses resulting from a catastrophe depends not only on the severity of the natural forces concerned, but also on man-made factors, such as build-ing design or the efficiency of disaster control in the afflicted region. In this sigma study, natural catastrophes are subdivided into the following categories: floods, storms, earth-quakes, droughts/forest fires/heat waves, cold waves/frost, hail, tsunamis, and other natural catastrophes.
Man-made disasters This study categorises major events associated with human activities as “man-made” or
“technical” disasters. Generally, a large object in a very limited space is affected, which is covered by a small number of insurance policies. War, civil war, and war-like events are excluded. sigma subdivides man-made disasters into the following categories: ma-jor fires and explosions, aviation and space disasters, shipping disasters, rail disasters, mining accidents, collapse of buildings/bridges, and miscellaneous (including terror-ism). In Tables 7 and 8 (pages 19–35), all major natural catastrophes and man-made disasters and the associated losses are listed chronologically.
Total losses For the purposes of the present sigma study, total losses are all the financial losses di-
rectly attributable to a major event, ie damage to buildings, infrastructure, vehicles etc. The term also includes losses due to business interruption as a direct consequence of the property damage. Insured losses are gross of any reinsurance, be it provided by commercial or government schemes. A figure identified as “total damage” or “economic loss” includes all damage, insured and uninsured. Total loss figures do not include indirect financial losses – ie loss of earnings by suppliers due to disabled businesses, estimated shortfalls in gross domestic product, and non-economic losses, such as loss of reputation or impaired quality of life.
Generally, total (or economic) losses are estimated and communicated in very different ways. As a result, they are not directly comparable and should be seen only as an indi-cation of the general order of magnitude.
Insured losses “Losses” refer to all insured losses except liability. Leaving aside liability losses, on one
hand, allows a relatively swift assessment of the insurance year; on the other hand, however, it tends to understate the cost of man-made disasters. Life insurance losses are also not included.
NFIP flood damage in the US The sigma catastrophe database also includes flood damage covered by the National
Flood Insurance Program (NFIP) in the US, provided that it fulfils the sigma selection criteria.
A natural catastrophe is caused by natural forces.
A man-made or technical disaster is triggered by human activities.
Losses due to property damage and business interruption that are directly attributable to major events are included in this study.
The amount of the total losses is a general indication only.
The term “losses” refer to insured losses, but do not include liability.
NFIP flood damage in the US is included.

39Swiss Re, sigma No 2/2012
Selection criteria sigma has been publishing tables listing major losses since 1970. Thresholds with re-
spect to casualties – the number of dead, missing, severely injured, and homeless – also make it possible to tabulate events in regions where the insurance penetration is below average.
For the 2011 reporting year, the lower loss thresholds were set as follows: Insured losses: Maritime disasters USD 18.0m Aviation USD 35.9m Other losses USD 44.6m
or Total losses: USD 89.2m
or Casualties: Dead or missing 20 Injured 50 Homeless 2 000
Adjustment for inflation, changes to published data, information sigma converts all losses for the occurrence year not given in USD into USD using the
end-of-year exchange rate. To adjust for inflation, these USD values are extrapolated using the US consumer price index to give current (2011) values.
This can be illustrated by examining the insured property losses arising from the floods which occurred in the UK between 29 October and 10 November 2000:
Insured loss at 2000 prices: USD 1 045.7m Insured loss at 2011 prices: USD 1 365.6m
Alternatively, were one to adjust the losses in the original currency (GBP) for inflation and then convert them to USD using the current exchange rate, one would end up with an insured loss at 2011 prices of USD 1 398m, 2% more than with the standard sigma method. The reason for the difference is that the value of the GBP rose by 4% against the USD in the period 2000–2011, ie more than the difference in inflation between the US (30.6%) and the UK (28.5%) over the same period.
Floods UK29 October –10 November 2000
Exchange rate US inflation GBP m USD/GBP USD m USD m
Original loss 700 1.494 1 045.7 1 045.7 Level of consumer price index 2000 93.1 172.2Level of consumer price index 2011 119.6 224.9Inflation factor 1.285 1.306 Adjusted for inflation to 2011 899.8 1.554 1 398.4 1 365.6Comparison 102% 100%
Source: Swiss Re Economic Research & Consulting
Thresholds for insured losses and casualties in 2011
Losses are determined using year-end exchange rates and are then adjusted for inflation.
Figure 7Alternative methods of adjusting for inflation, by comparison

Swiss Re, sigma No 2/201240
Terms and selection criteria
If changes to the loss amounts of previously published events become known, sigma takes these into account in its database. However, these changes only become evident when an event appears in the table of the 40 most costly insured losses or the 40 dis-asters with the most fatalities since 1970 (See Tables 9 and 10 on pages 36-37).
In the chronological lists of all man-made disasters, the insured losses are not shown for data protection reasons. However, the total of these insured losses is included in the list of major losses in 2011 according to loss category. sigma does not provide further in-formation on individual insured losses or about updates made to published data.
Sources Information is collected from newspapers, direct insurance and reinsurance periodicals,
specialist publications (in printed or electronic form) and reports from insurers and rein-surers.22 In no event shall Swiss Re be liable for any loss or damage arising in connection with the use of this information (see the copyright information on page 2).
Exchange rates used,23 national currencies per USDCountry Currency Exchange rate, end 2011Australia AUD 0.9754Brazil BRL 1.8653Canada CAD 1.0183China CNY 6.294Colombia COP 1938.5Denmark DKK 5.7254Europe EUR 0.7703United Kingdom GPB 0.6435India INR 53.105Japan JPY 76.94South Korea KRW 1152Kazakhstan KZT 148.485Laos LAK 8002.5Myanmar MMK 6.51Mexico MXN 13.9554Namibia NAD 8.076Norway NOK 5.9680Nepal NPR 85.39Philippines PHP 43.855Russia RUB 32.123Thailand THB 31.55Turkey TRY 1.8887US USD 1South Africa ZAR 8.0734
Source: Swiss Re, sigma catastrophe database
22 Natural catastrophes in the US: those sigma figures which are based exclusively on estimates of Property Claim Services (PCS), a unit of the Insurance Services Office, Inc (ISO), are given for each individual event in ranges defined by PCS. The estimates are the property of ISO and may not be printed or used for any pur-pose, including use as a component in any financial instruments, without the express consent of ISO.
23 The losses for 2011 were converted to USD using these exchange rates. No losses in any other currencies were reported.
Changes to loss amounts of previously published events are updated in the sigma database.
Information on individual events is not available.
Newspapers, direct insurance and reinsurance periodicals, specialist publications and other reports are used to compile this study.
Table 11Exchange rates used when converting total damage and/or insured losses

Recent sigma publications
2012 No 1 Understanding profitability in life insurance No 2 Natural catastrophes and man-made disasters in 2011: historic losses surface from record eartquakes and floods
2011 No 1 Natural catastrophes and man-made disasters in 2010: a year of devastating and costly events No 2 World insurance in 2010 No 3 State involvement in insurance markets No 4 Product innovation in non-life insurance markets: where little “i” meets big “I” No 5 Insurance in emerging markets: growth drivers and profitability
2010 No 1 Natural catastrophes and man-made disasters in 2009: catastrophes claim fewer victims, insured losses fall
No 2 World insurance in 2009: premiums dipped, but industry capital improved No 3 Regulatory issues in insurance No 4 The impact of inflation on insurers No 5 Insurance investment in a challenging global environment No 6 Microinsurance – risk protection for 4 billion people
2009 No 1 Scenario analysis in insurance No 2 Natural catastrophes and man-made disasters in 2008:
North America and Asia suffer heavy losses No 3 World insurance in 2008: life premiums fall in the industrialised countries – strong
growth in the emerging economies No 4 The role of indices in transferring insurance risks to the capital markets No 5 Commercial liability: a challenge for businesses and their insurers
2008 No 1 Natural catastrophes and man-made disasters in 2007: high losses in Europe No 2 Non-life claims reserving: improving on a strategic challenge No 3 World insurance in 2007: emerging markets leading the way No 4 Innovative ways of financing retirement No 5 Insurance in the emerging markets: overview and prospects for Islamic insurance
2007 No 1 Insurance in emerging markets: sound development; greenfield for agricultural insurance No 2 Natural catastrophes and man-made disasters in 2006: low insured losses No 3 Annuities: a private solution to longevity risk No 4 World insurance in 2006: premiums came back to “life” No 5 Bancassurance: emerging trends, opportunities and challenges No 6 To your health: diagnosing the state of healthcare and the global private
medical insurance industry
2006 No 1 Getting together: globals take the lead in life insurance M & A No 2 Natural catastrophes and man-made disasters 2005:
high earthquake casualties, new dimension in windstorm losses No 3 Measuring underwriting profitability of the non-life insurance industry No 4 Solvency II: an integrated risk approach for European insurers No 5 World insurance in 2005: moderate premium growth, attractive profitability No 6 Credit and surety: solidifying commitments No 7 Securitization – new opportunities for insurers and investors

Swiss Reinsurance Company LtdEconomic Research & ConsultingMythenquai 50/60P.O. Box8022 ZurichSwitzerland
Telephone +41 43 285 2551Fax +41 43 282 [email protected]


