
S-72.124 PRODUCT DEVELOPMENT OF TELECOMMUNICATION SYSTEMS Course Overview. Elements of Product...
56
S-72.124 PRODUCT DEVELOPMENT OF TELECOMMUNICATION SYSTEMS Course Overview. Elements of Product Development Process. Tools for Generating and Cultivating Ideas.
-
Upload
aubrey-cole -
Category
Documents
-
view
215 -
download
1
Transcript of S-72.124 PRODUCT DEVELOPMENT OF TELECOMMUNICATION SYSTEMS Course Overview. Elements of Product...

S-72.124 PRODUCT DEVELOPMENT OF TELECOMMUNICATION SYSTEMS
Course Overview. Elements of Product Development Process. Tools for Generating and Cultivating Ideas.

2 Helsinki University of Technology,Communications Laboratory, Timo O. Korhonen
16.3. 10-12 Prof. Timo O. Korhonen, Helsinki University of Technology, Communications Laboratory: Course Overview. Elements of product development process. Tools for gathering and mapping ideas, extraction of useful information
16.3. 12-14 Research Scientist Merja Ranta-aho, Helsinki University of Technology, Communications Laboratory: Usability and Acceptability: Design for Successful Telecommunication Products

3 Helsinki University of Technology,Communications Laboratory, Timo O. Korhonen
23.3. 10-12 Prof. Antti Ainamo, Helsinki School of Economics: Operational and Strategic Management
23.3 12-14 Prof. Erkko Autio, Institute of Strategy and International Business, Helsinki University of Technology: Establishment and Development of High-Tech Enterprises
30.3 10-12 Presentations of Human Factors in Telecommunications Group, Communications Laboratory, Helsinki University of Technology: User-Centered Product Concept Design Methods
30.3. 12-14 Innovation Advocate Panu Kuosmanen, Otaniemi International Innovation Centre, Helsinki University of Technology: Patenting, Innovations, and Copyright
4 Helsinki University of Technology,Communications Laboratory, Timo O. Korhonen
6.4 10-12 Prof. Karlos Artto, International Project Business, Helsinki University of Technology: Systematic Project Management: Aspects on Uncertainty and on Assigning Responsibilities.
6.4. 12-14 Director Jari Jokinen, Nokia Mobile Phones: Quality Assurance in Product Development Process. Nokia quality principles, Quality management elements.
13.4. 12-14 Prof. Veijo Ilmavirta: Otaniemi International Innovation Centre: Mission and Innovation Services
14.4 14-16, S2 Research Scientist Peter Kelly, Institute of Strategy and International Business, Helsinki University of Technology: Financing New High-Tech Enterprises

5 Helsinki University of Technology,Communications Laboratory, Timo O. Korhonen
27.4. 10-12 Research Scientist Arto Rajala, Helsinki School of Economics: High - Tech Marketing
27.4. 12-14 Prof. Paul Lillrank: Laboratory of Industrial Management, Helsinki University of Technology: Quality Leadership for Knowledge Systems. The evolution of quality management.
4.5 Introduction to course Workshop

6 Helsinki University of Technology,Communications Laboratory, Timo O. Korhonen
Example*: Developing Communicator
*S-72.124 in Spring ‘99
London is a basic model with all the essential properties. It has large target markets including both young adults as well as basic business users. It comes with a compact London BridgeTM display that enables small size and high usability.
– Compact High Color Display– Hi-Fi Wide Stereo FM radio– VOD enabled– Wireless Phones by BlueToothTM
Technology– PictureTelTM Phone– Speech Control

7 Helsinki University of Technology,Communications Laboratory, Timo O. Korhonen
Monaco is the new fashionable communication tool designed especially for Ladies. It carries a comfortable pearled shell outlook with changeable fashion styled colors ensuring fitting for every evening out-and-go. This model comes with fully equipped with
– Speech control– Touch sensitive display– Ultra ergonomic usability– PictureTelTM Technology

8 Helsinki University of Technology,Communications Laboratory, Timo O. Korhonen
Florida is the state-of-the-art model for the elderly people. You are ensured to be monitored while being at home or office and help can be immediately sent when required. This model incorporates a mass of functionality to enable life long enjoyment:
– Health monitoring: Pulse, blood pressure, blood glucose– Velocity and acceleration sensors to detect possible fall-outs– Voice recognition
9 Helsinki University of Technology,Communications Laboratory, Timo O. Korhonen
Implant. This is model is scheduled to be marketed early 2010. It consists of distributed components implanted near to the target sensory organs. The communicator enables real-time, 3D interactions with one or several persons in virtual reality.
– Earphone is connected directly to ear-nerve or transmitted via NMR technology
– Tooth or brain implanted microphone– Visual cortex or contact lens display

10 Helsinki University of Technology,Communications Laboratory, Timo O. Korhonen
Another example, S-72.124 in Fall’99:

11 Helsinki University of Technology,Communications Laboratory, Timo O. Korhonen
Topics today
Technical product development and innovation process
Decision making and analysis tools that are used to cultivate innovation processes:
– SWOT- and PMI- analysis
– Brainstorming
– Force Field Analysis
– Decision Tree
– Critical Path Analysis
Information skills
– Mind Mapping
– Efficient extraction of information

12 Helsinki University of Technology,Communications Laboratory, Timo O. Korhonen
How to select the cultivation method? An analysis tool is applicable when there is enough information
for its usage! Some methods are primarily targeted for mapping the current
status (SWOT), other for decision making (PMI) and some are general purpose tools to assist project management (Critical Path Analysis).
Methods work well when they are used simultaneously in-series or in-parallel, as for instance SWOT+brainstorming
Successful product development requires that one should have sufficient information about – customer requirements– competitors’ product launches– markets in general– latest technology
Also vision of future trends is important!
CustomersCustomers
MarketsMarkets TechnologyTechnology
CompetitorsCompetitors
Future visionsFuture visions

13 Helsinki University of Technology,Communications Laboratory, Timo O. Korhonen
Technical product development process Theoretical functionality?
What about in practice?
Sub-unit functionality?
Functionality of the whole process?
Firstdemo
Practical proto
Mass production proto
Mass product

14 Helsinki University of Technology,Communications Laboratory, Timo O. Korhonen
SWOT analysis SWOT is applicable for sorting unorganized knowledge bases
and analyzing current status Successful SWOT yields structured mapping of the problem at
hand For instance in product analysis
– identify strength and weaknesses of the product– search through possibilities and threats (for instance for
product launch) Realization: List all the relevant properties and sort them into
SWOT boxes!
Strength WeaknessWeakness
OpportunityOpportunity ThreatsThreats

15 Helsinki University of Technology,Communications Laboratory, Timo O. Korhonen
The SWOT questions: Strengths and Weaknesses
Strengths:– What are the advantages? – What is well-done?
Consider this from different point-of-views: As Competitors, Customers, Technology
Weaknesses:– What could be improved? – What is done badly?– What should be avoided?
Does other interest groups perceive weaknesses that you see? Could this give you a competitive edge? It is best to be realistic now, and face any unpleasant truths as soon as possible.

16 Helsinki University of Technology,Communications Laboratory, Timo O. Korhonen
The SWOT questions: Opportunities
Opportunities (directed more outwards from the product than the strengths):– Where are the good chances facing the product? – What are the interesting trends?
Useful opportunities can come from things like: – Changes in technology and markets on both in broad and
narrow scale– Changes in government policy related to your field – Changes in social patterns, population profiles, lifestyle
changes, etc.

17 Helsinki University of Technology,Communications Laboratory, Timo O. Korhonen
The SWOT questions: Threats
Threats: (directed more outside than the weaknesses) What obstacles are to be faced? What competitors are doing? Are the required specifications for tasks, products or services
changing? Is changing technology threatening the product or process?
How? Is there some general ‘climate change’ going on? Does you your process have bad debt or cash-flow problems?

18 Helsinki University of Technology,Communications Laboratory, Timo O. Korhonen
The SWOT analysis; a case study:WAP-based knowledge base system
Strength Expandable, flexible, easy to use, dynamic, easy to personalize,
bypassing of telephone exchange
Strength Expandable, flexible, easy to use, dynamic, easy to personalize,
bypassing of telephone exchange
WeaknessNeed for WAP terminal
managing, search routines, requires
dedication
WeaknessNeed for WAP terminal
managing, search routines, requires
dedication
OpportunityYields tailored services for individuals and enterprises,
no more paper catalogs!, more effective graphics, utilization
of location information
OpportunityYields tailored services for individuals and enterprises,
no more paper catalogs!, more effective graphics, utilization
of location information
ThreatsNo popularity,
one applies terminal specificcatalogs, competitive
techniques may hit markets
ThreatsNo popularity,
one applies terminal specificcatalogs, competitive
techniques may hit markets

19 Helsinki University of Technology,Communications Laboratory, Timo O. Korhonen
Brainstorming* Objective: Bring about creative solutions (even for unidentified!)
problems Take solution candidates one after another until very unusual
solutions are also generated For a start take a word or words, from “a dictionary at hand” to
feed the process and apply associations
Generated ideas without critics! Thus
– many potential solution candidates are generated
– whole problem dilemma may change!
For concluding the session
– analyze results for instance by SWOT, PMI and/or Mind Mapping
– Condensed (classified) ideas can be used to support new sessions or they can be used to support conventional solutions
*Edward de Bono, Serious Creativity, HarperBusiness, New York, US, 1992

20 Helsinki University of Technology,Communications Laboratory, Timo O. Korhonen
Brainstorming - Leader and Group tasks
Session leader (The leader must be selected!):– definition of the start-up point– gives limits to the problem– gives limits to discussions (These limits must be very broad)– minute amount of critics– encouraging and enthusiastic– follows (the fixed) session time table!– Takes care that ‘idea jamming’ is only temporary!
Session participants:– have diverged orientations related to the problem at hand– their background is as different as possible

21 Helsinki University of Technology,Communications Laboratory, Timo O. Korhonen
Individual vs. Group Brainstorming
Individual BS– many ideas– tendency to jam into fixed trails– easy to find unresolved questions
Group BS– ideas develop themselves into more deep form– ideas develop more efficiently– there might be less ideas (group follows what you say!)
One may mix individual and group barnstorming: For instance one might first BS of his own and then have a meeting based on each individual BS sessions.

22 Helsinki University of Technology,Communications Laboratory, Timo O. Korhonen

23 Helsinki University of Technology,Communications Laboratory, Timo O. Korhonen
PMI ('Plus/Minus/Interesting')
A simple method for decision making When you are facing a difficult decision, simply draw up a table
headed up 'Plus', 'Minus', and 'Interesting'. – In the column underneath the 'Plus' heading, write down all
the positive points of taking the action. – Underneath the 'Minus' heading write down all the negative
effects. – In the 'Interesting' column write down the extended
implications of taking the action, whether positive or negative.

24 Helsinki University of Technology,Communications Laboratory, Timo O. Korhonen
Scoring your PMI table
You may be able to make a decision just from the table you have drawn up
Alternatively, consider each of the points you have written down and assign a positive or negative score to each appropriately
The scores you assign can be entirely subjective. Once you have done this, add up the score
A strongly positive score indicated that an action should be taken, a strongly negative score that it should be avoided

25 Helsinki University of Technology,Communications Laboratory, Timo O. Korhonen
A PMI Example

26 Helsinki University of Technology,Communications Laboratory, Timo O. Korhonen
Force Field Analysis
Objective: To create an unified description of the factors forming the problem. This is used to alter the process state to the wanted direction!
FFA is a weighted PMI method Benefits
– Describes all the relevant forces– Allows to plan
• contra strategies for negative forces• supporting strategies for positive forces
The FFA method: Identify, Sort and Grade the different forces and illustrate the problem by a diagram including the forces!
The first result of this method describes the current state Alteration of forces can change the current state to the
objective state!

27 Helsinki University of Technology,Communications Laboratory, Timo O. Korhonen
Force Field Analysis: Example

28 Helsinki University of Technology,Communications Laboratory, Timo O. Korhonen
Decision Trees
Usage: To analyze especially strictly economical and numerical decisions
Applicable when a lot of complicated information is associated to the decision making process
The analysis results in a system model that gives arguments to– make a justified ’best decision’– consider decision alternatives– understand effects of the decisions already undertaken– understand risks involved

29 Helsinki University of Technology,Communications Laboratory, Timo O. Korhonen
How to Draw a Decision Tree
Start with the decision that needs to be made In the tree squares represent decisions, circles represent
uncertainty or random factors. Therefore indicate the start with the square. Completed solution are indicated by just a line
From the starting box draw out lines towards the right for each possible solution, and write that solution along the line
At the end of each solution line, consider the results. If the result of taking that decision is uncertain, draw a small circle
If the result is another decision that needs to be made, draw another square. Write the decision or factor to be considered

30 Helsinki University of Technology,Communications Laboratory, Timo O. Korhonen
Consolidate=yhdistääReap=korjata

31 Helsinki University of Technology,Communications Laboratory, Timo O. Korhonen
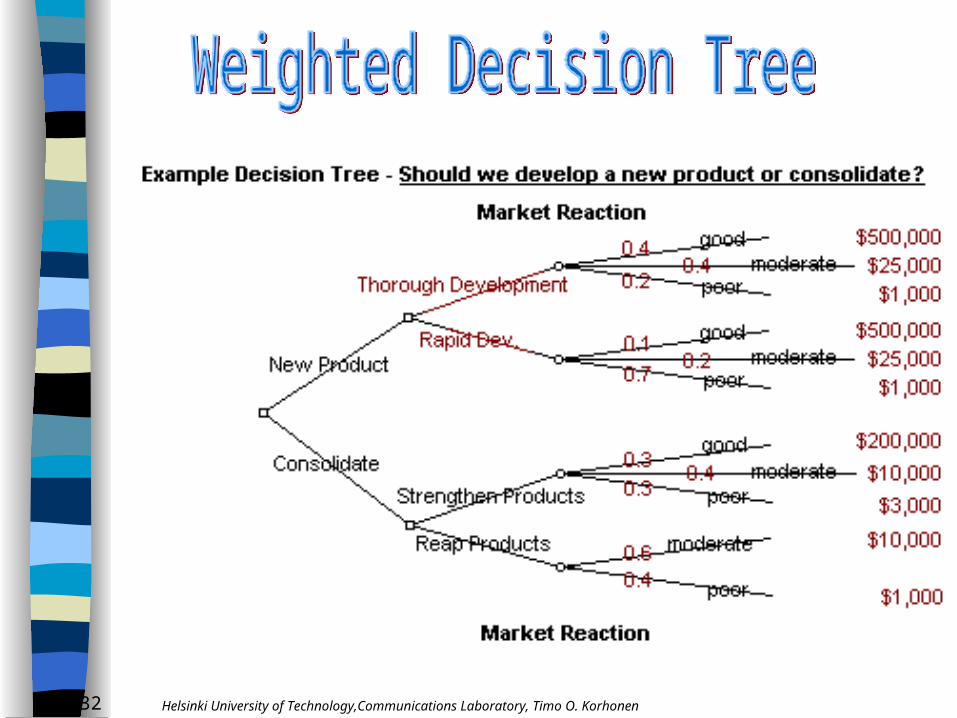
Weight the Tree!
Now you are ready to evaluate the decision tree. This is where you can calculate the decision that has the greatest worth to you.
Start by assigning a cash or numeric value to each possible outcome - how much you think it would be worth to you. You should neglect the costs at this time.
Next look at each circle (representing an uncertainty point) and estimate the probability of each outcome.
If you use percentages, the total must come to 100% at each circle. If you use fractions, these must add up to 1. If you have data on past events you may be able to make rigorous estimates of the probabilities.Otherwise write down your best guess.
If you do not have statistical info apply civilized guesses!
32 Helsinki University of Technology,Communications Laboratory, Timo O. Korhonen

33 Helsinki University of Technology,Communications Laboratory, Timo O. Korhonen
Considering the Tree: Net outcome of the alternate choices
Review of what has happed so far:– Net outcome of the potential solution are determined – branching alternative probabilities are evaluated
Next determine the true net outcome order of potential alternatives
Start from the right edge of the tree and indicate the true outcome of the each solution path as demonstrate on the next slide
The end result is an evaluation of the true net outcome associate to the each alternative

34 Helsinki University of Technology,Communications Laboratory, Timo O. Korhonen

35 Helsinki University of Technology,Communications Laboratory, Timo O. Korhonen
Cash Outcome from the Potential Solutions

36 Helsinki University of Technology,Communications Laboratory, Timo O. Korhonen
Profit without expenses
Maximum profit while taking this path
Resulting total profit
Final Decision Tree with Costs

37 Helsinki University of Technology,Communications Laboratory, Timo O. Korhonen
Decision Trees Summarized
Decision trees provide an effective method for decision making because they:
clearly lay out the problem so that all choices can be viewed, discussed and challenged
provide a framework to quantify the outcome and the associated probability
help us to make the best decisions on the basis of our existing information (or the best guesses)
Successful application requires some statistical knowledge or sense (That is required for justified decisions anyhow .)

38 Helsinki University of Technology,Communications Laboratory, Timo O. Korhonen
Critical Path Analysis
A method for project analysis and management that points out the critical phases of the project.
Enables to define – minimum time span to complete the project– prioritization of tasks
Therefore it allows to focus on central project activities that require concentration of usable resources and activities.
Forms foundation for project scheduling and monitoring
39 Helsinki University of Technology,Communications Laboratory, Timo O. Korhonen
Series- and Parallel Activities
Analysis is based on identification of interdependent and independent project activities: For instance one can not put up the walls in a house before laying down the bases! However, much of the gardening planning can be done before the house is build up.
Series activities are interdependent: they must be processed in a certain order
Parallel activities can be processes relatively independently Series and parallel activities might be temporal, e.g. they are
defined for a certain project phase only.

40 Helsinki University of Technology,Communications Laboratory, Timo O. Korhonen
Critical Path Analysis: Listing the Project Phases
1. Give tittles for all the phases 2. Indicate for the each phase
– earliest possible starting time – estimated duration– estimate if the phase is of the serial type or the parallel type
Indicate interdependencies Try to make as complete listing as possible to reduce later
editing (=Get the required facts!)

41 Helsinki University of Technology,Communications Laboratory, Timo O. Korhonen
Cus
tom
writ
ten
com
pute
r in
stal
latio
n

42 Helsinki University of Technology,Communications Laboratory, Timo O. Korhonen

43 Helsinki University of Technology,Communications Laboratory, Timo O. Korhonen
How to Estimate the Time Taken to Achieve Project Goals
Time evaluation is difficult for new tasks Typically time is underestimated due to
– Influence of the unexpected changes– Unscheduled high priority work is forgotten– Accidents and emergencies– Meetings– Break downs in equipment– Quality control rejections
If the accuracy of time estimates is critical, you may find it effective to develop a systematic approach to including these factors.
Typically realistic time estimation is done based on past experience.

44 Helsinki University of Technology,Communications Laboratory, Timo O. Korhonen
Plot the Tasks on a Graph Paper
Head up graph paper with the days or weeks through to task completion
Start on the earliest start dates, and mark on the duration
Show the tasks as arrows, and the ends of tasks with dots
Above the task arrows, mark the time taken to complete the task. Do not worry about task scheduling yet - all we are doing is setting up the first draft of the analysis
Once you have plotted the tasks, plot in lines to show dependencies

45 Helsinki University of Technology,Communications Laboratory, Timo O. Korhonen

46 Helsinki University of Technology,Communications Laboratory, Timo O. Korhonen
Scheduling Activities
Take the draft analysis, and use it to schedule the actions in the plan, in such a way that sequential actions are carried out in the required sequence.
Parallel actions should be scheduled so that they do not interfere with sequential actions on the critical path, if possible.
While scheduling, bear in mind the resources you have available, and allow some slack time in the schedule for hold-ups, over-runs, failures in delivery, etc.

47 Helsinki University of Technology,Communications Laboratory, Timo O. Korhonen
Presenting the Analysis by Gantt Charts
Here time is marked out in columns across the chart, with individual tasks represented as arrows terminating at dots. The length and positions of the arrows show the start date and duration of the tasks
You may prefer to show tasks in pure Gantt format, as solid bars rather than arrows terminating in dots. Similarly you may prefer not to show the linkages between related tasks - this is a matter of personal taste and personal convention
The Critical Path is the longest sequence of dependent activities that lead to the completion of the plan. Any delay of a stage in the critical path will delay completion of the whole plan unless future sequential activities are speeded up

48 Helsinki University of Technology,Communications Laboratory, Timo O. Korhonen
A Gantt Chart

49 Helsinki University of Technology,Communications Laboratory, Timo O. Korhonen
Summarizing Critical Path Analysis
Critical Path Analysis is an efficient project planning tool that indicates– Project tasks – Parallel tasks – Serial tasks– Project time table – Required resources – Internal timing – The most important, interdependent tasks – Can be used to analyze risks when the critical path is
identified and secured

50 Helsinki University of Technology,Communications Laboratory, Timo O. Korhonen
Information skills*
How it is possible to extract information(1) from the raw data(2) efficiently? Two simple methods– Appreciation - The ’So what?’ - techniques – Mind Maps
Information skill include also concepts like– How to read efficiently - and extract what you need to know– Summarizing information– Speed reading - reading generally as fast as possible
(1) Information: Knowledge required to accomplish certain, bounded task, (2)Raw date: as an article in the Web or in a newspaper
*See G. Dryden, J. Vos: The Learning Revolution

51 Helsinki University of Technology,Communications Laboratory, Timo O. Korhonen
Appreciation: So what?
A technique for extracting the maximum amount of information from a simple fact.
Ask the question 'So what?' - i.e. What are the implications of that fact? Keep on asking that question until all possible inferences have been drawn.
Appreciation is a technique used by military planners, so we will take a military example
Fact: It rained heavily last night So What? The ground will be wet So What? It will turn into mud quickly

52 Helsinki University of Technology,Communications Laboratory, Timo O. Korhonen
Appreciation: So what? (cont.)
So What? If many troops and vehicles pass over the same ground,
movement will be progressively slower and more difficult as the ground gets muddier and more difficult.
So What? Where possible stick to coated roads or expect movement to be
slower than normal.
While it would be possible to reach this conclusion without the use of a formal technique, appreciation provided a framework within which inferences can be extracted quickly and effectively.

53 Helsinki University of Technology,Communications Laboratory, Timo O. Korhonen
Mind Mapping
Mind Mapping is a technique organizing information in its natural associative way, that is multidimensional.
Procedure: – List the main topic, subtopics and facts. Search short
expressions for them all.– Identify the main connections between themes– Set the main theme in the middle of the paper and arrange the
sub-themes to surround the main theme– Connect the themes– Use colors to separate different idea groups– Indicate interdependencies as the cause and consequence by
arrows– Use symbols and figures and even sub-maps to give to total
picture

54 Helsinki University of Technology,Communications Laboratory, Timo O. Korhonen
A Mind Mapping of Time Management

55 Helsinki University of Technology,Communications Laboratory, Timo O. Korhonen
Mind Mapping Summarized– A mindmap is an associate structure. Therefore its topology
contains a lot of information. – Mindmap allows to identify the essential features and links of
the problem at glance. – Mindmaps can be an extremely compact way to present
information. – A problem of mind mapping is that the chart may up to be so
messy that it can even hide the main themes. Therefore mindmap can, and should be cultivated after it is formed by pruning less important branches.
– Mindmaps can be created by a computer program or by using simple detachable notes in a blackboard.

56 Helsinki University of Technology,Communications Laboratory, Timo O. Korhonen
In Conclusion...
We discussed the following ”mind- and process mapping” techniques:
– SWOT and PMI analysis
– Brainstorming
– Force Field Analysis
– Decision Tree
– Critical Path Analysis
In addition we had a look on mind mapping and information extraction skills
The best way to learn these methods is to try them!